chapter 4 methodological choice and identification of … · chapter 4: methodological choice and...
TRANSCRIPT

Chapter 4: Methodological Choice and Identification of Key Categories
2006 IPCC Guidelines for National Greenhouse Gas Inventories 4.1
C H A P T E R 4
METHODOLOGICAL CHOICE AND IDENTIFICATION OF KEY CATEGORIES

Volume 1: General Guidance and Reporting
4.2 2006 IPCC Guidelines for National Greenhouse Gas Inventories
Authors
Anke Herold (Germany), Suvi Monni (Finland)
Erda Lin (China), and C. P. (Mick) Meyer (Australia)
Contributing Authors
Ketil Flugsrud (Norway)

Chapter 4: Methodological Choice and Identification of Key Categories
2006 IPCC Guidelines for National Greenhouse Gas Inventories 4.3
Contents
4 Methodological Choice and Identification of Key Categories
4.1 Introduction ......................................................................................................................................... 4.5 4.1.1 Definition .................................................................................................................................... 4.5 4.1.2 Purpose of the key category analysis ........................................................................................... 4.5 4.1.3 General approach to identify key categories ............................................................................... 4.6
4.2 General rules for identification of key categories ............................................................................... 4.7 4.3 Methodological approaches to identify key categories ..................................................................... 4.12
4.3.1 Approach 1 to identify key categories ....................................................................................... 4.13 4.3.2 Approach 2 to identify key categories ....................................................................................... 4.17 4.3.3 Qualitative criteria to identify key categories ............................................................................ 4.19
4.4 Reporting and Documentation ........................................................................................................... 4.19 4.5 Examples of key category analysis .................................................................................................... 4.20
References ........................................................................................................................................................ 4.30
Equations
Equation 4.1 Level Assessment (Approach 1) ........................................................................................ 4.14 Equation 4.2 Trend Assessment (Approach 1) ....................................................................................... 4.15 Equation 4.3 Trend Assessment with zero base year emissions ............................................................. 4.16 Equation 4.4 Level Assessment (Approach 2) ........................................................................................ 4.18 Equation 4.5 Trend Assessment (Approach 2) ....................................................................................... 4.18
Figures
Figure 4.1 Decision Tree to choose a Good Practice method ............................................................... 4.6 Figure 4.2 Decision Tree to identify key categories ........................................................................... 4.13
Volume 1: General Guidance and Reporting
4.4 2006 IPCC Guidelines for National Greenhouse Gas Inventories
Tables
Table 4.1 Suggested aggregation level of analysis for Approach 1 ..................................................... 4.8 Table 4.2 Spreadsheet for the Approach 1 analysis – Level Assessment .......................................... 4.14 Table 4.3 Spreadsheet for the Approach 1 analysis – Trend Assessment .......................................... 4.16 Table 4.4 Summary of key category analysis .................................................................................... 4.20 Table 4.5 Example of Approach 1 Level Assessment for the Finnish GHG inventory for 2003 ...... 4.20 Table 4.6 Example of Approach 1 Trend Assessment for the Finnish GHG inventory for 2003 ...... 4.23 Table 4.7 Example of Approach 1 Level Assessment
for the Finnish GHG inventory for 2003 using a subset .................................................... 4.25 Table 4.8 Example of Approach 1 Trend Assessment
for the Finnish GHG inventory for 2003 using a subset .................................................... 4.26 Table 4.9 Example of Approach 2 Level Assessment for the Finnish GHG inventory for 2003 ...... 4.27 Table 4.10 Example of Approach 2 Trend Assessment for the Finnish GHG inventory for 2003 ...... 4.28 Table 4.11 Summary of key category analysis for Finland ................................................................. 4.29

Chapter 4: Methodological Choice and Identification of Key Categories
2006 IPCC Guidelines for National Greenhouse Gas Inventories 4.5
4 METHODOLOGICAL CHOICE AND IDENTIFICATION OF KEY CATEGORIES
4.1 INTRODUCTION This chapter addresses how to identify key categories1 in a national inventory. Methodological choice for individual source and sink categories is important in managing overall inventory uncertainty. Generally, inventory uncertainty is lower when emissions and removals are estimated using the most rigorous methods provided for each category or subcategory in the sectoral volumes of these Guidelines. However, these methods generally require more extensive resources for data collection, so it may not be feasible to use more rigorous method for every category of emissions and removals. It is therefore good practice to identify those categories that have the greatest contribution to overall inventory uncertainty in order to make the most efficient use of available resources. By identifying these key categories in the national inventory, inventory compilers can prioritise their efforts and improve their overall estimates. It is good practice for each country to identify its national key categories in a systematic and objective manner as presented in this chapter. Consequently, it is good practice to use results of key category analysis as a basis for methodological choice. Such a process will lead to improved inventory quality, as well as greater confidence in the estimates that are developed.
4.1.1 Definition A key category is one that is prioritised within the national inventory system because its estimate has a significant influence on a country’s total inventory of greenhouse gases in terms of the absolute level, the trend, or the uncertainty in emissions and removals. Whenever the term key category is used, it includes both source and sink categories.
4.1.2 Purpose of the key category analysis As far as possible, key categories should receive special consideration in terms of three important inventory aspects.
Firstly, identification of key categories in national inventories enables limited resources available for preparing inventories to be prioritised. It is good practice to focus the available resources for the improvement in data and methods onto categories identified as key.
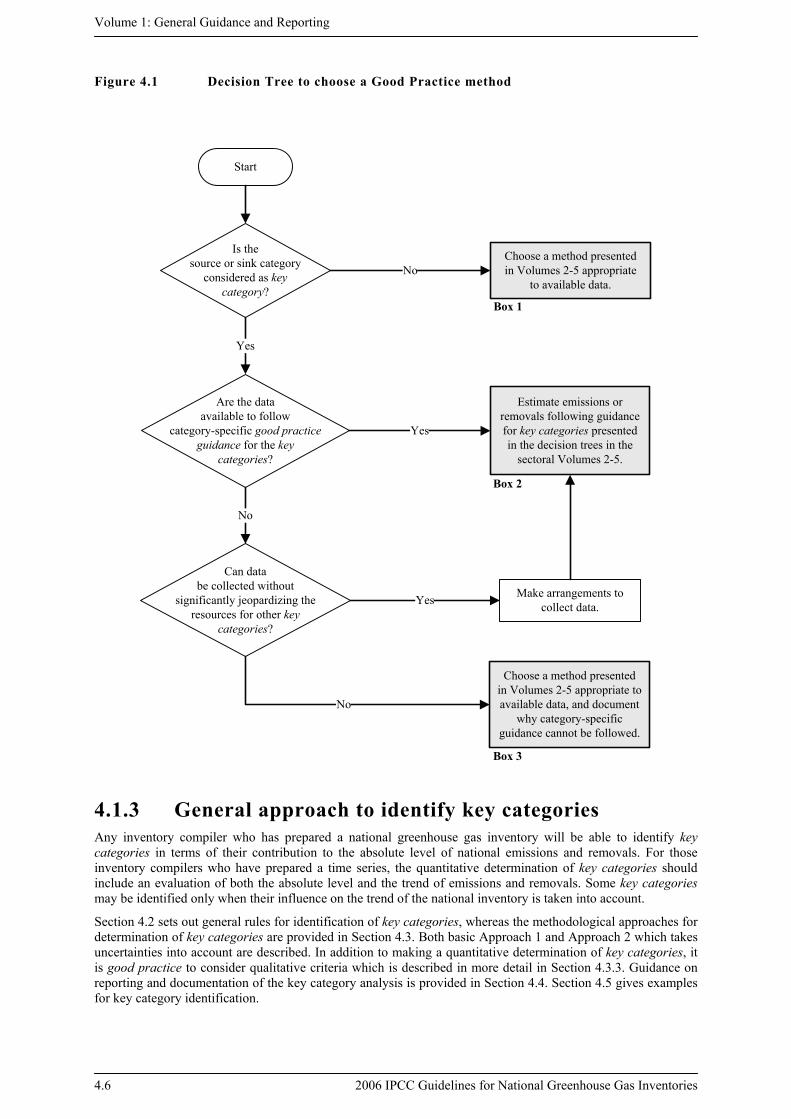
Secondly, in general, more detailed higher tier methods should be selected for key categories. Inventory compilers should use the category-specific methods presented in sectoral decision trees in Volumes 2-5 (see Figure 4.1). For most sources/sinks, higher tier (Tier 2 and 3) methods are suggested for key categories, although this is not always the case. For guidance on the specific application of this principle to key categories, it is good practice to refer to the decision trees and sector-specific guidance for the respective category and additional good practice guidance in chapters in sectoral volumes. In some cases, inventory compilers may be unable to adopt a higher tier method due to lack of resources. This may mean that they are unable to collect the required data for a higher tier or are unable to determine country specific emission factors and other data needed for Tier 2 and 3 methods. In these cases, although this is not accommodated in the category-specific decision trees, a Tier 1 approach can be used, and this possibility is identified in Figure 4.1. It should in these cases be clearly documented why the methodological choice was not in line with the sectoral decision tree. Any key categories where the good practice method cannot be used should have priority for future improvements.
Thirdly, it is good practice to give additional attention to key categories with respect to quality assurance and quality control (QA/QC) as described in Chapter 6, Quality Assurance/Quality Control and Verification, and in the sectoral volumes.
1 In Good Practice Guidance for National Greenhouse Gas Inventories (GPG2000, IPCC, 2000), the concept was named
‘key source categories’ and dealt with the inventory excluding the LULUCF Sector.
Volume 1: General Guidance and Reporting
4.6 2006 IPCC Guidelines for National Greenhouse Gas Inventories
Start
Can databe collected without
significantly jeopardizing theresources for other key
categories?
Is thesource or sink category
considered as keycategory?
Are the dataavailable to follow
category-specific good practice guidance for the key
categories?
Make arrangements to collect data.
Estimate emissions orremovals following guidance for key categories presentedin the decision trees in the
sectoral Volumes 2-5.
Choose a method presentedin Volumes 2-5 appropriate toavailable data, and document
why category-specificguidance cannot be followed.
Choose a method presentedin Volumes 2-5 appropriate
to available data.
Yes
Yes
Yes
No
No
Box 1
Box 2
Box 3
No
Figure 4.1 Decision Tree to choose a Good Practice method
4.1.3 General approach to identify key categories Any inventory compiler who has prepared a national greenhouse gas inventory will be able to identify key categories in terms of their contribution to the absolute level of national emissions and removals. For those inventory compilers who have prepared a time series, the quantitative determination of key categories should include an evaluation of both the absolute level and the trend of emissions and removals. Some key categories may be identified only when their influence on the trend of the national inventory is taken into account.
Section 4.2 sets out general rules for identification of key categories, whereas the methodological approaches for determination of key categories are provided in Section 4.3. Both basic Approach 1 and Approach 2 which takes uncertainties into account are described. In addition to making a quantitative determination of key categories, it is good practice to consider qualitative criteria which is described in more detail in Section 4.3.3. Guidance on reporting and documentation of the key category analysis is provided in Section 4.4. Section 4.5 gives examples for key category identification.
Chapter 4: Methodological Choice and Identification of Key Categories
2006 IPCC Guidelines for National Greenhouse Gas Inventories 4.7
4.2 GENERAL RULES FOR IDENTIFICATION OF KEY CATEGORIES
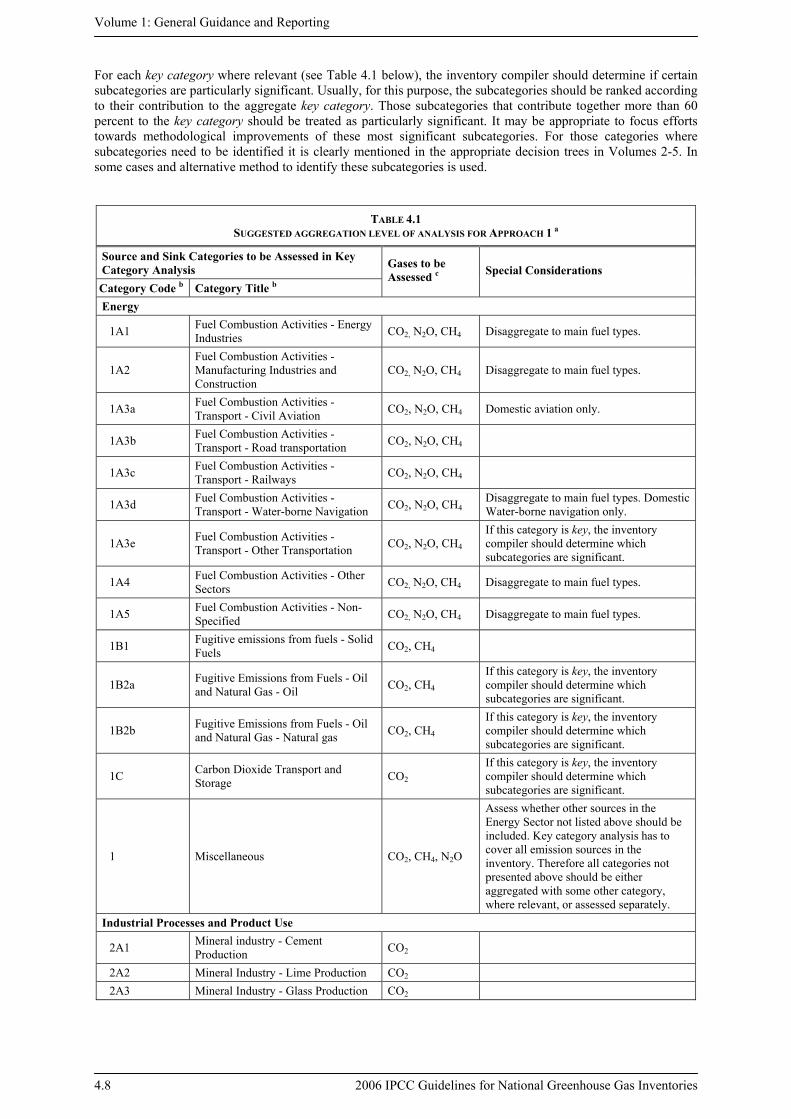
The results of the key category identification will be most useful if the analysis is done at the appropriate disaggregation level of categories. Table 4.1, Suggested aggregation level of analysis for Approach 1, lists the source and sink categories that are recommended and identifies special considerations related to the disaggregation of the analysis, where relevant. For example, the combustion of fossil fuels is a large emission source category that can be broken down into subcategories of 1st, 2nd or 3rd order, and even to the level of individual plants or boilers. Countries may adapt the recommended level of analysis in Table 4.1 to their national circumstances. In particular countries using Approach 2 will probably choose the same level of aggregation that was used for the uncertainty analysis. In some cases, disaggregation to very low levels should be avoided since it may split an important aggregated category into many small subcategories that are no longer key. The following guidance describes good practice in determining the appropriate level of disaggregation of categories to identify key categories:
• The analysis should be performed at the level of IPCC categories or subcategories at which the IPCC methods and decision trees are generally provided in the sectoral volumes.
• Each greenhouse gas emitted from each category should be considered separately, unless there are specific methodological reasons for treating gases collectively. For example, carbon dioxide (CO2), methane (CH4) and nitrous oxide (N2O) are emitted from road transportation. The key category analysis for this source should be performed for each of these gases separately because the methods, emission factors and related uncertainties differ for each gas. In contrast, a collective analysis of all chemical species of hydrofluorocarbons (HFCs) is appropriate for the category ‘Product Uses as Substitutes for Ozone Depleting Substances’.
• If data are available, the analysis should be performed for emissions and removals separately within a given category. For example, the land use categories and the pool estimates can include emissions and removals that may cancel or almost cancel at the aggregated level for the categories presented in Table 4.1. In cases where emissions and removals cancel out and where methods do not allow to estimate emissions and removals separately, the inventory compiler should include further disaggregated subcategories in the key category analysis (e.g., including two different areas, one area where carbon stock decreases occur and another area where carbon stock increases take place), in particular when the data for reported subcategories clearly show significant carbon stock changes at more disaggregate level. Similar considerations may apply in the Energy and IPPU (Industrial Processes and Product Use) Sectors, for example, in a situation where CO2 is being captured for storage.
• Table 4.1 shows the recommended level of analysis.2 Countries may choose to perform the quantitative analysis at a more disaggregated level than suggested in this table. In this case, possible cross-correlations between categories and/or subcategories should be taken into account when performing the key category analysis. When using Approach 2, the assumptions about such correlations should be the same when assessing uncertainties and identifying key categories (see Chapter 3, Uncertainties).
• The categories and gases included in Table 4.1 are those for which estimation methods are provided in the sectoral volumes. If countries develop estimates for new categories or gases for which GWPs become available, these should be added to the analysis under Miscellaneous for the appropriate sector. It is not possible to include gases for which no GWP is available since the analysis is performed using CO2-equivalent emissions3.
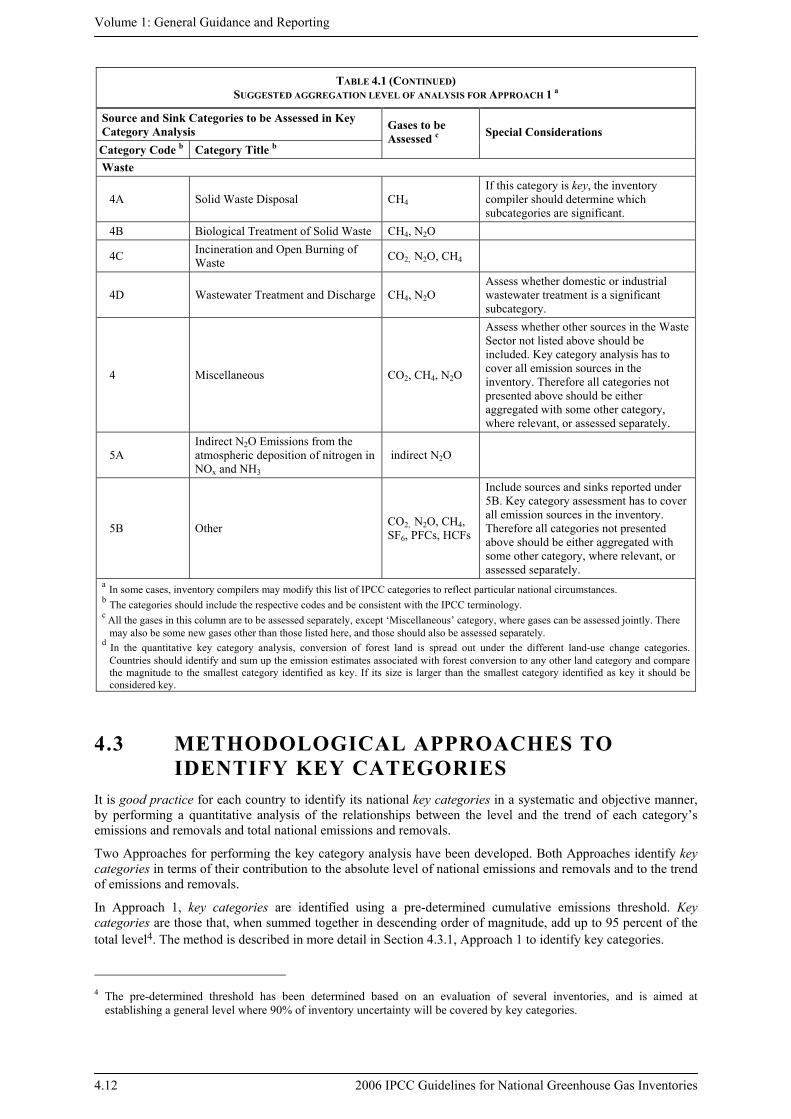
• Indirect N2O emissions from deposition of NOx and other nitrogen compounds from categories other than AFOLU (Agriculture, Forestry and Other Land Use) Sector’s are included in the key category analysis in category 5A, Indirect N2O emissions from the atmospheric deposition of nitrogen in NOx and NH3. However, the 2006 Guidelines do not provide decision trees or methodological guidance for estimating emissions from NOx and NH3, and therefore identification of indirect N2O as key does not have an effect on the methodological choice.
2 Most correlations between categories can be avoided by using the aggregation level of this table. Some correlations remain,
e.g., in fuel use between stationary combustion and transportation and for HFCs. In practice, the effect of correlations for key category analysis should be taken into account in the disaggregation level used for the Approach 2 assessment (for more advice on correlations in uncertainty analysis, see Chapter 3.)
3 The methodology is also applicable for other weighting scheme, but for the derivation of threshold for Approach 1 and 2 and for the examples in Section 4.5 CO2-equivalent values were calculated using the global warming potentials (GWP) over a 100 year horizon of the different greenhouse gases, provided by the IPCC in its Second Assessment Report.
Volume 1: General Guidance and Reporting
4.8 2006 IPCC Guidelines for National Greenhouse Gas Inventories
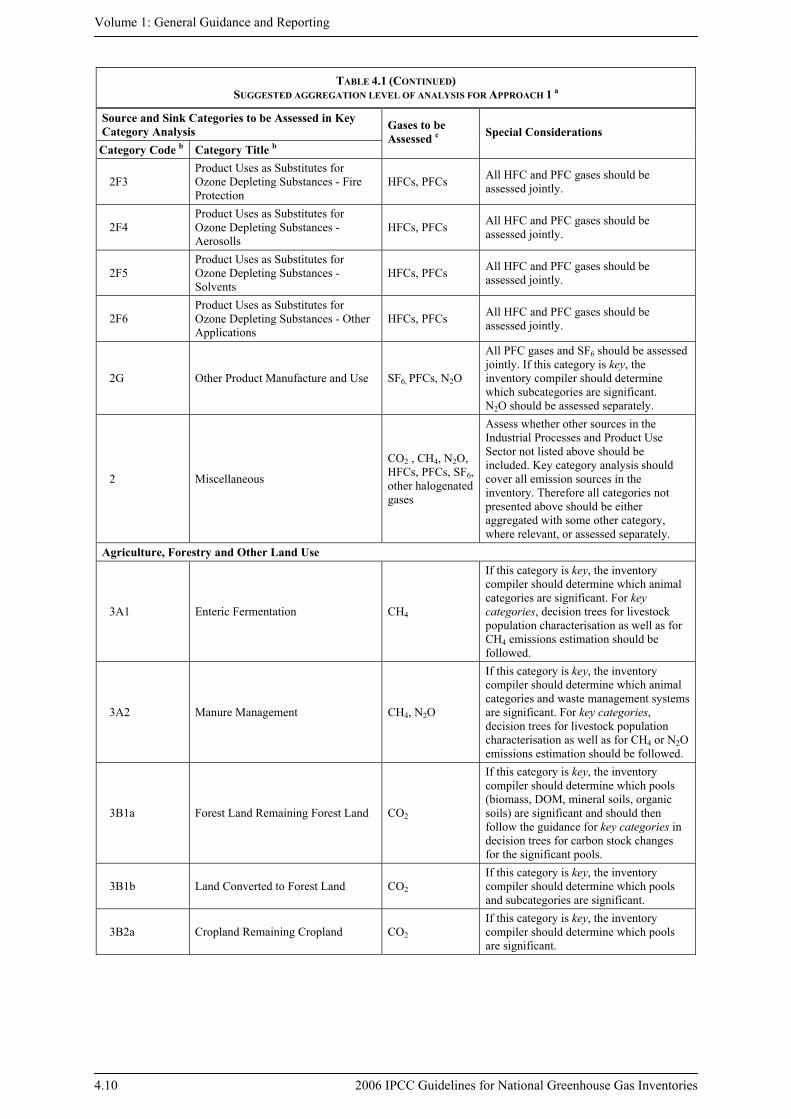
For each key category where relevant (see Table 4.1 below), the inventory compiler should determine if certain subcategories are particularly significant. Usually, for this purpose, the subcategories should be ranked according to their contribution to the aggregate key category. Those subcategories that contribute together more than 60 percent to the key category should be treated as particularly significant. It may be appropriate to focus efforts towards methodological improvements of these most significant subcategories. For those categories where subcategories need to be identified it is clearly mentioned in the appropriate decision trees in Volumes 2-5. In some cases and alternative method to identify these subcategories is used.
TABLE 4.1 SUGGESTED AGGREGATION LEVEL OF ANALYSIS FOR APPROACH 1 a
Source and Sink Categories to be Assessed in Key Category Analysis
Category Code b Category Title b
Gases to be Assessed c Special Considerations
Energy
1A1 Fuel Combustion Activities - Energy Industries CO2, N2O, CH4 Disaggregate to main fuel types.
1A2 Fuel Combustion Activities - Manufacturing Industries and Construction
CO2, N2O, CH4 Disaggregate to main fuel types.
1A3a Fuel Combustion Activities - Transport - Civil Aviation CO2, N2O, CH4 Domestic aviation only.
1A3b Fuel Combustion Activities - Transport - Road transportation CO2, N2O, CH4
1A3c Fuel Combustion Activities - Transport - Railways CO2, N2O, CH4
1A3d Fuel Combustion Activities - Transport - Water-borne Navigation CO2, N2O, CH4
Disaggregate to main fuel types. Domestic Water-borne navigation only.
1A3e Fuel Combustion Activities - Transport - Other Transportation CO2, N2O, CH4
If this category is key, the inventory compiler should determine which subcategories are significant.
1A4 Fuel Combustion Activities - Other Sectors CO2, N2O, CH4 Disaggregate to main fuel types.
1A5 Fuel Combustion Activities - Non-Specified CO2, N2O, CH4 Disaggregate to main fuel types.
1B1 Fugitive emissions from fuels - Solid Fuels CO2, CH4
1B2a Fugitive Emissions from Fuels - Oil and Natural Gas - Oil CO2, CH4
If this category is key, the inventory compiler should determine which subcategories are significant.
1B2b Fugitive Emissions from Fuels - Oil and Natural Gas - Natural gas CO2, CH4
If this category is key, the inventory compiler should determine which subcategories are significant.
1C Carbon Dioxide Transport and Storage CO2
If this category is key, the inventory compiler should determine which subcategories are significant.
1 Miscellaneous CO2, CH4, N2O
Assess whether other sources in the Energy Sector not listed above should be included. Key category analysis has to cover all emission sources in the inventory. Therefore all categories not presented above should be either aggregated with some other category, where relevant, or assessed separately.
Industrial Processes and Product Use
2A1 Mineral industry - Cement Production CO2
2A2 Mineral Industry - Lime Production CO2 2A3 Mineral Industry - Glass Production CO2

Chapter 4: Methodological Choice and Identification of Key Categories
2006 IPCC Guidelines for National Greenhouse Gas Inventories 4.9
TABLE 4.1 (CONTINUED) SUGGESTED AGGREGATION LEVEL OF ANALYSIS FOR APPROACH 1 a
Source and Sink Categories to be Assessed in Key Category Analysis Category Code b Category Title b
Gases to be Assessed c Special Considerations
2A4 Mineral Industry - Other Process Uses of Carbonates CO2
If this category is key, the inventory compiler should determine which subcategories are significant.
2B1 Chemical Industry - Ammonia Production CO2
2B2 Chemical industry - Nitric Acid Production N2O
2B3 Chemical industry - Adipic Acid Production N2O
2B4 Chemical industry - Caprolactam, Glyoxal and Glyoxylic Acid Production
N2O
If this category is key, the inventory compiler should determine which subcategories (caprolactam, glyoxal and glyoxylic acid) are significant.
2B5 Chemical industry - Carbide Production CO2, CH4,
2B6 Chemical industry - Titanium Dioxide Production CO2
2B7 Chemical Industry - Soda Ash Production CO2
2B8 Chemical Industry - Petrochemical and Carbon Black Production CO2, CH4
If this category is key, the inventory compiler should determine which subcategories are significant.
2B9 Chemical Industry - Fluorochemical Production
HFCs, PFCs, SF6, and other halogenated gases
All gases should be assessed jointly. If this category is key, the inventory compiler should determine which subcategories/gases (e.g., HFC-23 from HCFC-22 production) are significant.
2C1 Metal Industry - Iron and Steel Production CO2, CH4
2C2 Metal Industry - Ferroalloys Production CO2, CH4
2C3 Metal Industry - Aluminium Production PFCs, CO2
PFCs should be assessed jointly. CO2 should be assessed separately.
2C4 Metal Industry - Magnesium Production
CO2, SF6, PFCs, HFCs, other halogenated gases
Methods for HFCs, PFCs and other halogenated gases are only provided at Tier 3 level. If they are not included in the inventory it is good practice to use qualitative considerations. (See Section 4.3.3.)
2C5 Metal Industry - Lead Production CO2 2C6 Metal Industry - Zinc Production CO2
2D Non-Energy Products from Fuels and Solvent Use CO2
If this category is key, the inventory compiler should determine which subcategories are significant.
2E Electronics Industry SF6, PFCs, HCFs, other halogenated gases
All gases should be assessed jointly. If this category is key, the inventory compiler should determine which subcategories are significant.
2F1 Product Uses as Substitutes for Ozone Depleting Substances - Refrigeration and Air Conditioning
HFCs, PFCs All HFC and PFC gases should be assessed jointly.
2F2 Product Uses as Substitutes for Ozone Depleting Substances - Foam Blowing Agents
HFCs All HFC gases should be assessed jointly.
Volume 1: General Guidance and Reporting
4.10 2006 IPCC Guidelines for National Greenhouse Gas Inventories
TABLE 4.1 (CONTINUED) SUGGESTED AGGREGATION LEVEL OF ANALYSIS FOR APPROACH 1 a
Source and Sink Categories to be Assessed in Key Category Analysis Category Code b Category Title b
Gases to be Assessed c Special Considerations
2F3 Product Uses as Substitutes for Ozone Depleting Substances - Fire Protection
HFCs, PFCs All HFC and PFC gases should be assessed jointly.
2F4 Product Uses as Substitutes for Ozone Depleting Substances - Aerosolls
HFCs, PFCs All HFC and PFC gases should be assessed jointly.
2F5 Product Uses as Substitutes for Ozone Depleting Substances - Solvents
HFCs, PFCs All HFC and PFC gases should be assessed jointly.
2F6 Product Uses as Substitutes for Ozone Depleting Substances - Other Applications
HFCs, PFCs All HFC and PFC gases should be assessed jointly.
2G Other Product Manufacture and Use SF6, PFCs, N2O
All PFC gases and SF6 should be assessed jointly. If this category is key, the inventory compiler should determine which subcategories are significant. N2O should be assessed separately.
2 Miscellaneous
CO2 , CH4, N2O, HFCs, PFCs, SF6, other halogenated gases
Assess whether other sources in the Industrial Processes and Product Use Sector not listed above should be included. Key category analysis should cover all emission sources in the inventory. Therefore all categories not presented above should be either aggregated with some other category, where relevant, or assessed separately.
Agriculture, Forestry and Other Land Use
3A1 Enteric Fermentation CH4
If this category is key, the inventory compiler should determine which animal categories are significant. For key categories, decision trees for livestock population characterisation as well as for CH4 emissions estimation should be followed.
3A2 Manure Management CH4, N2O
If this category is key, the inventory compiler should determine which animal categories and waste management systems are significant. For key categories, decision trees for livestock population characterisation as well as for CH4 or N2O emissions estimation should be followed.
3B1a Forest Land Remaining Forest Land CO2
If this category is key, the inventory compiler should determine which pools (biomass, DOM, mineral soils, organic soils) are significant and should then follow the guidance for key categories in decision trees for carbon stock changes for the significant pools.
3B1b Land Converted to Forest Land CO2 If this category is key, the inventory compiler should determine which pools and subcategories are significant.
3B2a Cropland Remaining Cropland CO2 If this category is key, the inventory compiler should determine which pools are significant.

Chapter 4: Methodological Choice and Identification of Key Categories
2006 IPCC Guidelines for National Greenhouse Gas Inventories 4.11
TABLE 4.1 (CONTINUED) SUGGESTED AGGREGATION LEVEL OF ANALYSIS FOR APPROACH 1 a
Source and Sink Categories to be Assessed in Key Category Analysis Category Code b Category Title b
Gases to be Assessed c Special Considerations
3B2b Land Converted to Cropland CO2
Assess the impact of forest land converted to cropland in a separate category. d If this category is key, the inventory compiler should determine which pools and subcategories are significant
3B3a Grassland Remaining Grassland CO2 If this category is key, the inventory compiler should determine which pools are significant.
3B3b Land Converted to Grassland CO2
Assess the impact of forest land converted to grassland in a separate category. d If this category is key, the inventory compiler should determine which pools and subcategories are significant.
3B4ai Peatlands Remaining Peatlands CO2, N2O 3B4aii Flooded land remaining Flooded land CO2
3B4b Land Converted to Wetlands CO2
Assess the impact of forest land converted to wetland in a separate category (see below). d If this category is key, the inventory compiler should determine which pools and subcategories are significant.
3B5a Settlements Remaining Settlements CO2 If this category is key, the inventory compiler should determine which pools are significant.
3B5b Land Converted to Settlements CO2
Assess the impact of forest land converted to settlements in a separate category. d If this category is key, the inventory compiler should determine which pools and subcategories are significant.
3C1 Biomass Burning CH4, N2O 3C2 Liming CO2 3C3 Urea Application CO2
3C4 Direct N2O Emissions from Managed soils N2O
If this category is key, the inventory compiler should determine which subcategories are significant.
3C5 Indirect N2O Emissions from Managed soils indirect N2O
If this category is key, the inventory compiler should determine which subcategories are significant.
3C6 Indirect N2O Emissions from Manure Management indirect N2O
3C7 Rice Cultivations CH4 3D1 Harvested Wood Products CO2 Use of key category analysis is optional.
3 Miscellaneous CO2, CH4, N2O
Assess whether other sources or sinks in the AFOLU Sector not listed above should be included. Key category analysis has to cover all emission sources and sinks in the inventory. Therefore all categories not presented above should be either aggregated with some other category, where relevant, or assessed separately.
Volume 1: General Guidance and Reporting
4.12 2006 IPCC Guidelines for National Greenhouse Gas Inventories
TABLE 4.1 (CONTINUED) SUGGESTED AGGREGATION LEVEL OF ANALYSIS FOR APPROACH 1 a
Source and Sink Categories to be Assessed in Key Category Analysis Category Code b Category Title b
Gases to be Assessed c Special Considerations
Waste
4A Solid Waste Disposal CH4 If this category is key, the inventory compiler should determine which subcategories are significant.
4B Biological Treatment of Solid Waste CH4, N2O
4C Incineration and Open Burning of Waste CO2, N2O, CH4
4D Wastewater Treatment and Discharge CH4, N2O Assess whether domestic or industrial wastewater treatment is a significant subcategory.
4 Miscellaneous CO2, CH4, N2O
Assess whether other sources in the Waste Sector not listed above should be included. Key category analysis has to cover all emission sources in the inventory. Therefore all categories not presented above should be either aggregated with some other category, where relevant, or assessed separately.
5A Indirect N2O Emissions from the atmospheric deposition of nitrogen in NOx and NH3
indirect N2O
5B Other CO2, N2O, CH4, SF6, PFCs, HCFs
Include sources and sinks reported under 5B. Key category assessment has to cover all emission sources in the inventory. Therefore all categories not presented above should be either aggregated with some other category, where relevant, or assessed separately.
a In some cases, inventory compilers may modify this list of IPCC categories to reflect particular national circumstances. b The categories should include the respective codes and be consistent with the IPCC terminology. c All the gases in this column are to be assessed separately, except ‘Miscellaneous’ category, where gases can be assessed jointly. There
may also be some new gases other than those listed here, and those should also be assessed separately. d In the quantitative key category analysis, conversion of forest land is spread out under the different land-use change categories.
Countries should identify and sum up the emission estimates associated with forest conversion to any other land category and compare the magnitude to the smallest category identified as key. If its size is larger than the smallest category identified as key it should be considered key.
4.3 METHODOLOGICAL APPROACHES TO IDENTIFY KEY CATEGORIES
It is good practice for each country to identify its national key categories in a systematic and objective manner, by performing a quantitative analysis of the relationships between the level and the trend of each category’s emissions and removals and total national emissions and removals.
Two Approaches for performing the key category analysis have been developed. Both Approaches identify key categories in terms of their contribution to the absolute level of national emissions and removals and to the trend of emissions and removals.
In Approach 1, key categories are identified using a pre-determined cumulative emissions threshold. Key categories are those that, when summed together in descending order of magnitude, add up to 95 percent of the total level4. The method is described in more detail in Section 4.3.1, Approach 1 to identify key categories.
4 The pre-determined threshold has been determined based on an evaluation of several inventories, and is aimed at
establishing a general level where 90% of inventory uncertainty will be covered by key categories.
Chapter 4: Methodological Choice and Identification of Key Categories
2006 IPCC Guidelines for National Greenhouse Gas Inventories 4.13
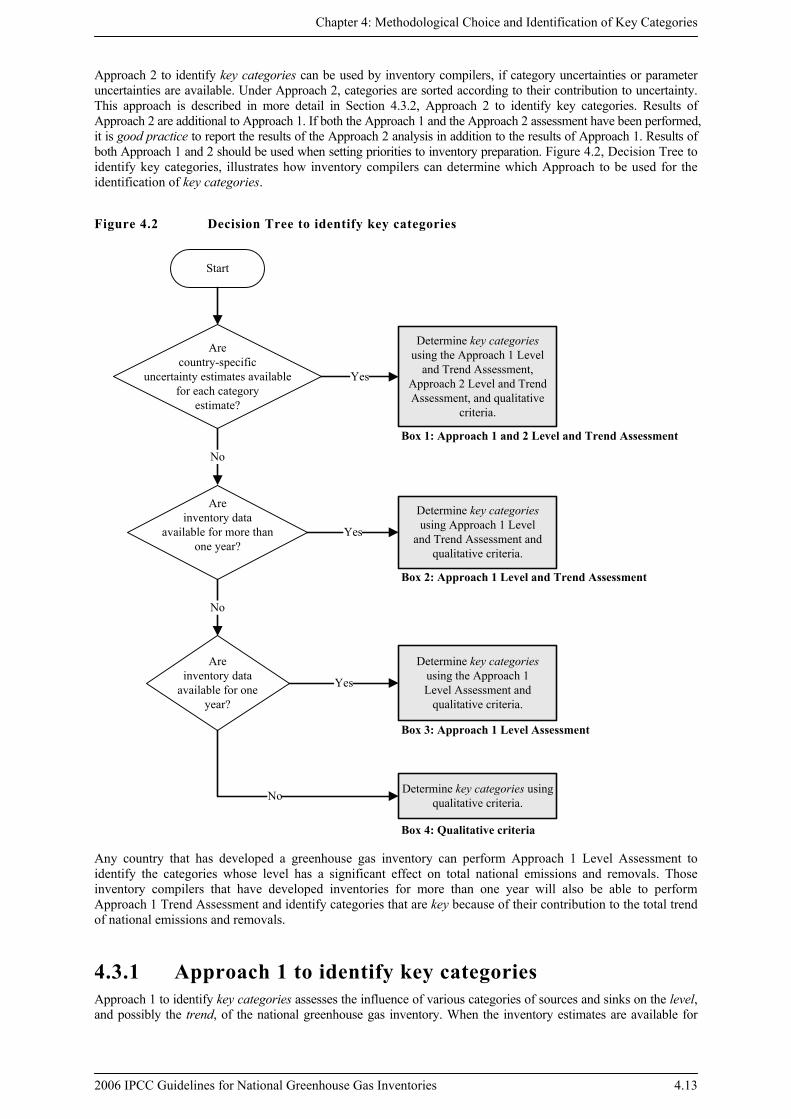
Approach 2 to identify key categories can be used by inventory compilers, if category uncertainties or parameter uncertainties are available. Under Approach 2, categories are sorted according to their contribution to uncertainty. This approach is described in more detail in Section 4.3.2, Approach 2 to identify key categories. Results of Approach 2 are additional to Approach 1. If both the Approach 1 and the Approach 2 assessment have been performed, it is good practice to report the results of the Approach 2 analysis in addition to the results of Approach 1. Results of both Approach 1 and 2 should be used when setting priorities to inventory preparation. Figure 4.2, Decision Tree to identify key categories, illustrates how inventory compilers can determine which Approach to be used for the identification of key categories.
Figure 4.2 Decision Tree to identify key categories
Any country that has developed a greenhouse gas inventory can perform Approach 1 Level Assessment to identify the categories whose level has a significant effect on total national emissions and removals. Those inventory compilers that have developed inventories for more than one year will also be able to perform Approach 1 Trend Assessment and identify categories that are key because of their contribution to the total trend of national emissions and removals.
4.3.1 Approach 1 to identify key categories Approach 1 to identify key categories assesses the influence of various categories of sources and sinks on the level, and possibly the trend, of the national greenhouse gas inventory. When the inventory estimates are available for
Start
Determine key categoriesusing the Approach 1 Level
and Trend Assessment,Approach 2 Level and TrendAssessment, and qualitative
criteria.
Determine key categoriesusing Approach 1 Level
and Trend Assessment andqualitative criteria.
Determine key categoriesusing the Approach 1Level Assessment and
qualitative criteria.
Determine key categories using qualitative criteria.
Are country-specific
uncertainty estimates availablefor each category
estimate?
Areinventory data
available for more thanone year?
Areinventory data
available for oneyear?
No
Yes
Yes
Yes
No
No
Box 1: Approach 1 and 2 Level and Trend Assessment
Box 2: Approach 1 Level and Trend Assessment
Box 3: Approach 1 Level Assessment
Box 4: Qualitative criteria
Volume 1: General Guidance and Reporting
4.14 2006 IPCC Guidelines for National Greenhouse Gas Inventories
∑y
ty,E
several years, it is good practice to assess the contribution of each category to both the level and trend of the national inventory. If only a single year’s inventory is available, a level assessment should be performed.
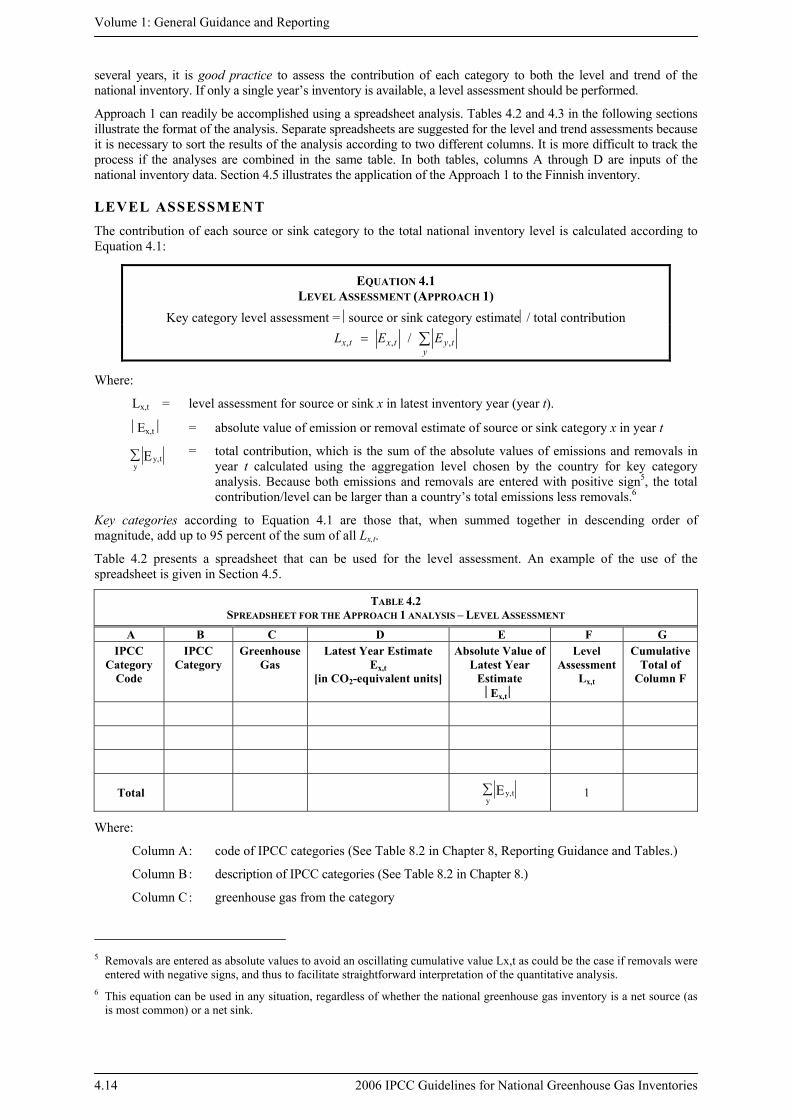
Approach 1 can readily be accomplished using a spreadsheet analysis. Tables 4.2 and 4.3 in the following sections illustrate the format of the analysis. Separate spreadsheets are suggested for the level and trend assessments because it is necessary to sort the results of the analysis according to two different columns. It is more difficult to track the process if the analyses are combined in the same table. In both tables, columns A through D are inputs of the national inventory data. Section 4.5 illustrates the application of the Approach 1 to the Finnish inventory.
LEVEL ASSESSMENT The contribution of each source or sink category to the total national inventory level is calculated according to Equation 4.1:
EQUATION 4.1 LEVEL ASSESSMENT (APPROACH 1)
Key category level assessment = ⎢source or sink category estimate⎪/ total contribution
∑=y
tytxtx EEL ,,, /
Where:
Lx,t = level assessment for source or sink x in latest inventory year (year t).
⎢Ex,t ⎢ = absolute value of emission or removal estimate of source or sink category x in year t
= total contribution, which is the sum of the absolute values of emissions and removals in year t calculated using the aggregation level chosen by the country for key category analysis. Because both emissions and removals are entered with positive sign5, the total contribution/level can be larger than a country’s total emissions less removals.6
Key categories according to Equation 4.1 are those that, when summed together in descending order of magnitude, add up to 95 percent of the sum of all Lx,t.
Table 4.2 presents a spreadsheet that can be used for the level assessment. An example of the use of the spreadsheet is given in Section 4.5.
TABLE 4.2 SPREADSHEET FOR THE APPROACH 1 ANALYSIS – LEVEL ASSESSMENT
A B C D E F G IPCC
Category Code
IPCC Category
Greenhouse Gas
Latest Year Estimate Ex,t
[in CO2-equivalent units]
Absolute Value of Latest Year
Estimate ⎢Ex,t ⎢
Level Assessment
Lx,t
Cumulative Total of
Column F
Total ∑y
ty,E 1
Where:
Column A : code of IPCC categories (See Table 8.2 in Chapter 8, Reporting Guidance and Tables.)
Column B : description of IPCC categories (See Table 8.2 in Chapter 8.)
Column C : greenhouse gas from the category
5 Removals are entered as absolute values to avoid an oscillating cumulative value Lx,t as could be the case if removals were
entered with negative signs, and thus to facilitate straightforward interpretation of the quantitative analysis. 6 This equation can be used in any situation, regardless of whether the national greenhouse gas inventory is a net source (as
is most common) or a net sink.

Chapter 4: Methodological Choice and Identification of Key Categories
2006 IPCC Guidelines for National Greenhouse Gas Inventories 4.15
Column D : value of emission or removal estimate of category x in latest inventory year (year t) in CO2-equivalent units
Column E : absolute value of emission or removal estimate of category x in year t
Column F : level assessment following Equation 4.1
Column G : cumulative total of Column F
Inputs to Columns A-D will be available from the inventory. The total of Column D presents the net emissions and removals. In Column E, absolute values are taken from each value in Column D. The sum of all entries in Column E is entered in the total line of Column E (note that this total may not be the same as the total net emissions and removals). In Column F, the level assessment is computed according to Equation 4.1. Once the entries in Column F are computed, the categories in the table should be sorted in descending order of magnitude according to Column F. After this step, the cumulative total summed in Column F can be calculated into Column G. Key categories are those that, when summed together in descending order of magnitude, add up to 95 percent of the total in Column G. Where the method is applied correctly, the sum of entries in Column F must be 1. The rationale for the choice of the 95 percent threshold for the Approach 1 builds on Rypdal and Flugsrud (2001) and is also presented in GPG2000, Section 7.2.1.1 in Chapter 7.
It is also good practice to examine categories identified between threshold of 95 percent and 97 percent carefully with respect to the qualitative criteria (see Section 4.3.3).
The level assessment should be performed for the base year of the inventory and for the latest inventory year (year t). If estimates for the base year have changed or been recalculated, the base year analysis should be updated. Key category analysis can also be updated for other recalculated years. In many cases, however, it is sufficient to derive conclusions regarding methodological choice, resource prioritisation or QA/QC procedures without an updated key category analysis for the entire inventory time series. Any category that meets the threshold for the base year or the most recent year should be identified as key. However, the interpretation of the results of the key category analysis should take longer time series than the most recent year into account if key category analyses are available. Because some categories having emissions/removals that fluctuate from year to year may be identified as key categories in one year but not in the next year. Therefore, for categories between thresholds of 95 and 97 percent it is suggested to compare the most recent key category analysis with the assessments for three or more previous years. If a category has been key for all or most previous years according to the either level or trend assessments or both (the two assessments should be considered separately), they should be identified as key in the latest year estimate except in cases where a clear explanation can be provided why a category may no longer be key in any future years. These additional categories should be addressed in the reporting table for key categories by using a column for comments (see Table 4.4 and reporting table for key categories in Section 4.4 for more information). The qualitative criteria presented in Section 4.3.3 may also help to identify which categories with fluctuating emissions or removals should be considered as key categories.
TREND ASSESSMENT The purpose of the trend assessment is to identify categories that may not be large enough to be identified by the level assessment, but whose trend is significantly different from the trend of the overall inventory, and should therefore receive particular attention. The Trend Assessment can be calculated according to Equation 4.2 if more than one year of inventory data are available.
EQUATION 4.2 TREND ASSESSMENT (APPROACH 1)
( )
∑
∑∑
∑
⎟⎟⎠
⎞⎜⎜⎝
⎛−
−⎥⎥⎦
⎤
⎢⎢⎣
⎡ −•=
yy
yy
yty
x
xtx
yy
xtx
E
EE
EEE
E
ET
0,
0,,
0,
0,,
0,
0,,
Where:
Tx,t = trend assessment of source or sink category x in year t as compared to the base year (year 0)
⎢Ex,0⎢ = absolute value of emission or removal estimate of source or sink category x in year 0
Ex,t and Ex,0 = real values of estimates of source or sink category x in years t and 0, respectively
∑y
ty,E and ∑y
y,0E = total inventory estimates in years t and 0, respectively
Volume 1: General Guidance and Reporting
4.16 2006 IPCC Guidelines for National Greenhouse Gas Inventories
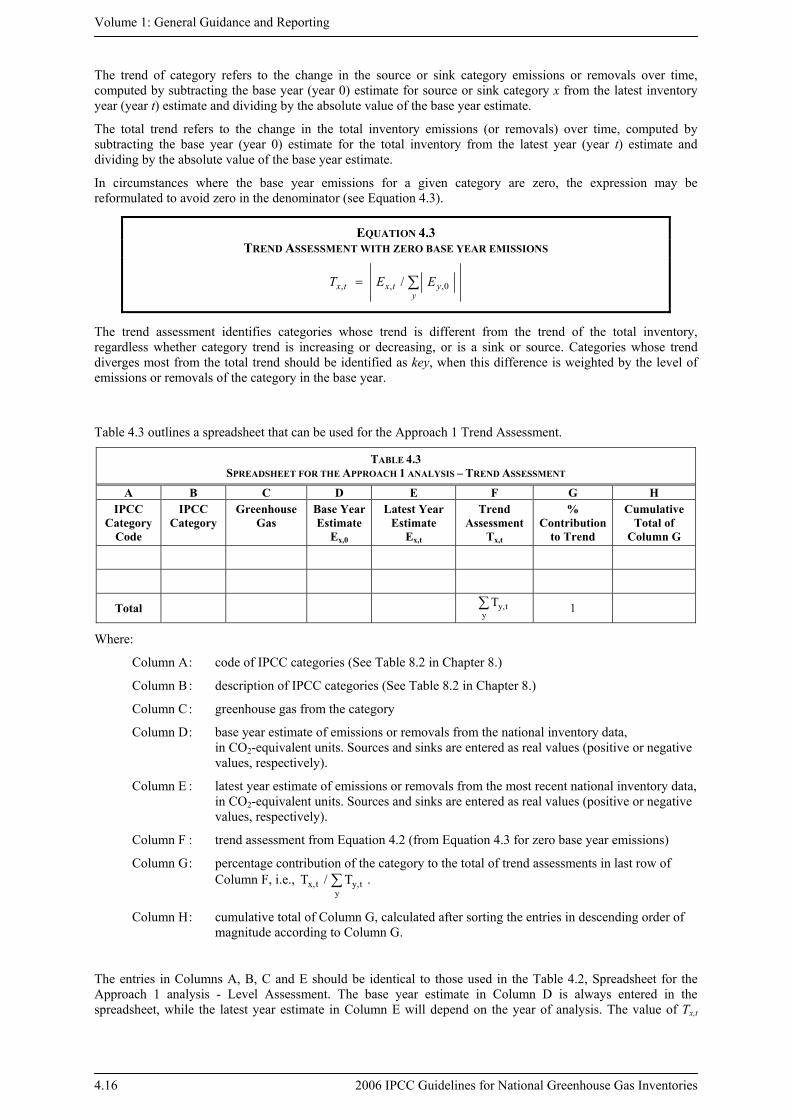
The trend of category refers to the change in the source or sink category emissions or removals over time, computed by subtracting the base year (year 0) estimate for source or sink category x from the latest inventory year (year t) estimate and dividing by the absolute value of the base year estimate.
The total trend refers to the change in the total inventory emissions (or removals) over time, computed by subtracting the base year (year 0) estimate for the total inventory from the latest year (year t) estimate and dividing by the absolute value of the base year estimate.
In circumstances where the base year emissions for a given category are zero, the expression may be reformulated to avoid zero in the denominator (see Equation 4.3).
EQUATION 4.3 TREND ASSESSMENT WITH ZERO BASE YEAR EMISSIONS
∑=y
ytxtx EET 0,,, /
The trend assessment identifies categories whose trend is different from the trend of the total inventory, regardless whether category trend is increasing or decreasing, or is a sink or source. Categories whose trend diverges most from the total trend should be identified as key, when this difference is weighted by the level of emissions or removals of the category in the base year.
Table 4.3 outlines a spreadsheet that can be used for the Approach 1 Trend Assessment.
TABLE 4.3 SPREADSHEET FOR THE APPROACH 1 ANALYSIS – TREND ASSESSMENT
A B C D E F G H IPCC
Category Code
IPCC Category
Greenhouse Gas
Base Year Estimate
Ex,0
Latest Year Estimate
Ex,t
Trend Assessment
Tx,t
% Contribution
to Trend
Cumulative Total of
Column G
Total ∑y
ty,T 1
Where:
Column A : code of IPCC categories (See Table 8.2 in Chapter 8.)
Column B : description of IPCC categories (See Table 8.2 in Chapter 8.)
Column C : greenhouse gas from the category
Column D : base year estimate of emissions or removals from the national inventory data, in CO2-equivalent units. Sources and sinks are entered as real values (positive or negative values, respectively).
Column E : latest year estimate of emissions or removals from the most recent national inventory data, in CO2-equivalent units. Sources and sinks are entered as real values (positive or negative values, respectively).
Column F : trend assessment from Equation 4.2 (from Equation 4.3 for zero base year emissions)
Column G : percentage contribution of the category to the total of trend assessments in last row of Column F, i.e., ∑
yty,tx, T/T .
Column H : cumulative total of Column G, calculated after sorting the entries in descending order of magnitude according to Column G.
The entries in Columns A, B, C and E should be identical to those used in the Table 4.2, Spreadsheet for the Approach 1 analysis - Level Assessment. The base year estimate in Column D is always entered in the spreadsheet, while the latest year estimate in Column E will depend on the year of analysis. The value of Tx,t

Chapter 4: Methodological Choice and Identification of Key Categories
2006 IPCC Guidelines for National Greenhouse Gas Inventories 4.17
(which is always positive) should be entered in Column F for each category of sources and sinks, following Equation 4.2, and the sum of all the entries entered in the total line of the table. The percentage contribution of each category to the total of Column F should be computed and entered in Column G. The categories (i.e., the rows of the table) should be sorted in descending order of magnitude, based on Column G. The cumulative total of Column G should then be computed in Column H. Key categories are those that, when summed together in descending order of magnitude, add up to more than 95 percent of the total of Column F. An example of Approach 1 analysis for the level and trend is given in Section 4.5.
The trend assessment treats increasing and decreasing trends similarly. However, for the prioritisation of resources, there may be specific circumstances where countries may not want to invest additional resources in the estimation of key categories with decreasing trends. Underlying reasons why a category showing strong decreasing trend could be key include activity decrease, mitigation measures leading to reduced emission factors or abatement measures (e.g., F-gases, chemical production) changing the production processes. In particular for a long-term decline of activities (not volatile economic trends) and when the category is not key from the level assessment, it is not always necessary to implement higher tier methods or to collect additional country-specific data if appropriate explanations can be provided why a category may not become more relevant again in the future. This could be the case e.g., for emissions from coal mining in some countries where considerable number of mines are closed or where certain production facilities are shut down. Regardless of the method chosen, countries should endeavour to use the same method for all years in a time series, and therefore it may be more appropriate to continue using a higher tier method if it had been used for previous years.
For other reasons of declining trends such as the introduction of abatement measures or other emission reduction measures, it is important to prioritise resources for the estimation of such categories that were identified as key in the trend assessment. Irrespective of the methodological choice, inventory compilers should clearly and precisely explain and document categories with strongly decreasing trends and should apply appropriate QA/QC procedures.
KEY CATEGORY ANALYSIS FOR A SUBSET OF INVENTORY ESTIMATES The IPCC Good Practice Guidance for Land Use, Land-Use Change and Forestry (GPG-LULUCF, IPCC, 2003) provided guidance on how to conduct a key category analysis using a stepwise approach, identifying first the key (source) categories for the inventory excluding LULUCF (Land Use, Land-Use Change and Forestry), and secondly repeating the key category analysis for the full inventory including the LULUCF categories to identify additional key categories. This two step approach is now integrated into one general approach. However, inventory compilers may still want to conduct a key category analysis using a subset of inventory estimates. For example inventory compilers may choose to include only emission sources in order to exclude the effects of removals from the level assessment or in order to exclude the influence of different trends for carbon fluxes from the other emission trends (see examples in Tables 4.7 and 4.8). It is good practice to document on what subsets the analysis was performed and the differences in results comparing with an integrated analysis.
4.3.2 Approach 2 to identify key categories The Approach 2 to identify key categories of sources and sinks is based on the results of the uncertainty analysis described in Chapter 3 Uncertainties, in this Volume. Inventory compilers are encouraged to use Approach 2 in addition to Approach 1 if possible, because it will provide additional insight into the reasons why particular categories are key and will assist in prioritising activities to improve inventory quality and reduce overall uncertainty. For example, the order of categories resulting from Approach 2 can provide useful information for prioritisation of improvement activities.
APPLICATION OF UNCERTAINTY ESTIMATES TO IDENTIFY KEY CATEGORIES The key category analysis may be enhanced by incorporating the national category uncertainty estimates developed in accordance with methods provided in Chapter 3. Uncertainty estimates based on the Approach 1 described in Chapter 3 are sufficient for this purpose, however, estimates based on the Approach 2 for Uncertainty Assessment should be used when available. The category uncertainties are incorporated by weighting the Approach 1 Level and Trend Assessment results according to the category percentage uncertainty. The key category equations are presented below.
Volume 1: General Guidance and Reporting
4.18 2006 IPCC Guidelines for National Greenhouse Gas Inventories
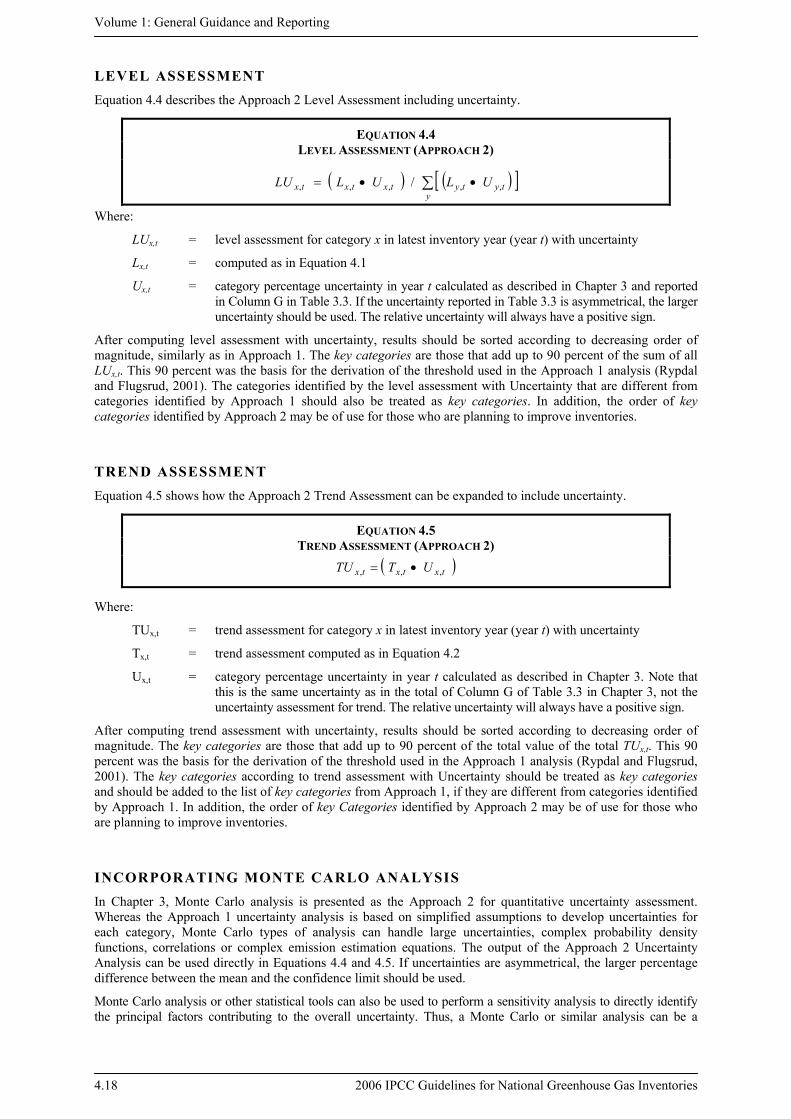
LEVEL ASSESSMENT Equation 4.4 describes the Approach 2 Level Assessment including uncertainty.
EQUATION 4.4 LEVEL ASSESSMENT (APPROACH 2)
( ) ( )[ ]∑ ••=y
tytytxtxtx ULULLU ,,,,, /
Where:
LUx,t = level assessment for category x in latest inventory year (year t) with uncertainty
Lx,t = computed as in Equation 4.1
Ux,t = category percentage uncertainty in year t calculated as described in Chapter 3 and reported in Column G in Table 3.3. If the uncertainty reported in Table 3.3 is asymmetrical, the larger uncertainty should be used. The relative uncertainty will always have a positive sign.
After computing level assessment with uncertainty, results should be sorted according to decreasing order of magnitude, similarly as in Approach 1. The key categories are those that add up to 90 percent of the sum of all LUx,t. This 90 percent was the basis for the derivation of the threshold used in the Approach 1 analysis (Rypdal and Flugsrud, 2001). The categories identified by the level assessment with Uncertainty that are different from categories identified by Approach 1 should also be treated as key categories. In addition, the order of key categories identified by Approach 2 may be of use for those who are planning to improve inventories.
TREND ASSESSMENT Equation 4.5 shows how the Approach 2 Trend Assessment can be expanded to include uncertainty.
EQUATION 4.5 TREND ASSESSMENT (APPROACH 2)
( )txtxtx UTTU ,,, •=
Where:
TUx,t = trend assessment for category x in latest inventory year (year t) with uncertainty
Tx,t = trend assessment computed as in Equation 4.2
Ux,t = category percentage uncertainty in year t calculated as described in Chapter 3. Note that this is the same uncertainty as in the total of Column G of Table 3.3 in Chapter 3, not the uncertainty assessment for trend. The relative uncertainty will always have a positive sign.
After computing trend assessment with uncertainty, results should be sorted according to decreasing order of magnitude. The key categories are those that add up to 90 percent of the total value of the total TUx,t. This 90 percent was the basis for the derivation of the threshold used in the Approach 1 analysis (Rypdal and Flugsrud, 2001). The key categories according to trend assessment with Uncertainty should be treated as key categories and should be added to the list of key categories from Approach 1, if they are different from categories identified by Approach 1. In addition, the order of key Categories identified by Approach 2 may be of use for those who are planning to improve inventories.
INCORPORATING MONTE CARLO ANALYSIS In Chapter 3, Monte Carlo analysis is presented as the Approach 2 for quantitative uncertainty assessment. Whereas the Approach 1 uncertainty analysis is based on simplified assumptions to develop uncertainties for each category, Monte Carlo types of analysis can handle large uncertainties, complex probability density functions, correlations or complex emission estimation equations. The output of the Approach 2 Uncertainty Analysis can be used directly in Equations 4.4 and 4.5. If uncertainties are asymmetrical, the larger percentage difference between the mean and the confidence limit should be used.
Monte Carlo analysis or other statistical tools can also be used to perform a sensitivity analysis to directly identify the principal factors contributing to the overall uncertainty. Thus, a Monte Carlo or similar analysis can be a
Chapter 4: Methodological Choice and Identification of Key Categories
2006 IPCC Guidelines for National Greenhouse Gas Inventories 4.19
valuable tool for a key category analysis. Inventory compilers are encouraged to use the method, for example, to analyze more disaggregated subcategories (by modelling correlations), emission factors and activity data separately (to identify key parameters rather than key categories). The use of these methods should be properly documented.
4.3.3 Qualitative criteria to identify key categories In some cases, the results of the Approach 1 or Approach 2 analysis of key categories may not identify all categories that should be prioritised in the inventory system. If quantitative key category analysis has not been carried out due to lack of completeness in the inventory, it is good practice to use qualitative criteria to identify key categories. The criteria below address specific circumstances that may not be readily reflected in the quantitative assessment. These criteria should be applied to categories not identified in the quantitative analysis, and if additional categories are identified they should be added to the list of key categories. It is particularly important to consider these criteria if the trend assessment has not been compiled. Although it is important to implement a trend assessment as part of good practice if data are available, early identification using qualitative criteria could be used until such assessment is available. Followings are the examples of points in qualitative criteria.
• Mitigation techniques and technologies: If emissions from a category have decreased or removals have increased through the use of climate change mitigation techniques, it is good practice to identify such categories as key. This will ensure that such categories are prioritised within the inventory and that better quality estimates are prepared to reflect the mitigation effects as closely as possible. It will also ensure that the methods used are transparent with respect to mitigation which is important for assessing inventory quality.
• Expected growth: The inventory compiler should assess which categories are likely to show increase of emissions or decrease of removals in the future. The inventory compiler may use expert judgement to make this determination. It is encouraged to identify such categories as key.
• No quantitative assessment of Uncertainties performed: Where Approach 2 including uncertainties in the key category analysis is not used, inventory compilers are still encouraged to identify categories that are assumed to contribute most to the overall uncertainty as key, because the largest reductions in overall inventory uncertainty can be achieved by improving estimates of categories having higher uncertainties. The qualitative consideration should take into account whether any methodological improvements could reduce uncertainties significantly. This could, for example, be applied to a small net flux results from the subtraction of large emissions and removals, which can imply a very high uncertainty.
• Completeness: Neither the Approach 1 nor the Approach 2 gives correct results if the inventory is not complete. The analysis can still be performed, but there may be key categories among those are not estimated. In these cases it is good practice to examine qualitatively potential key categories that are not yet estimated quantitatively by applying the qualitative considerations above. The inventory of a country with similar national circumstances can also often give good indications on potential key categories. Chapter 2, Approaches to Data Collection, gives suggestions for methods to approximate activity data that can be used to compile preliminary estimates of emissions/removals from a category. This preliminary analysis can be used to conclude whether a category potentially can be key and prioritise data collection of this category.
4.4 REPORTING AND DOCUMENTATION It is good practice to clearly document the results of the key category analysis in the inventory report. This information is essential for explaining the choice of method for each category. In addition, inventory compilers should list the criteria by which each category was identified as key (e.g., level, trend, or qualitative), and the method used to conduct the quantitative key category analysis (e.g., Approach 1 or Approach 2). Tables 4.2 and 4.3 should be used to record the results of the key category analysis. Table 4.4 should be used to present a summary of the key category analysis. The notation keys: L = key category according to level assessment; T = key category according to trend assessment; and Q = key category according to qualitative criteria; should be used to describe the assessment method used. The Approach used to identify the key category should be included as L1, L2, T1 or T2. In the column for comments, reasons for a qualitative assessment can be provided.

Volume 1: General Guidance and Reporting
4.20 2006 IPCC Guidelines for National Greenhouse Gas Inventories
TABLE 4.4 SUMMARY OF KEY CATEGORY ANALYSIS
Quantitative method used: Approach 1/Approach 1 and Approach 2 A B C D E
IPCC Category Code IPCC Category Greenhouse Gas Identification
criteria Comments
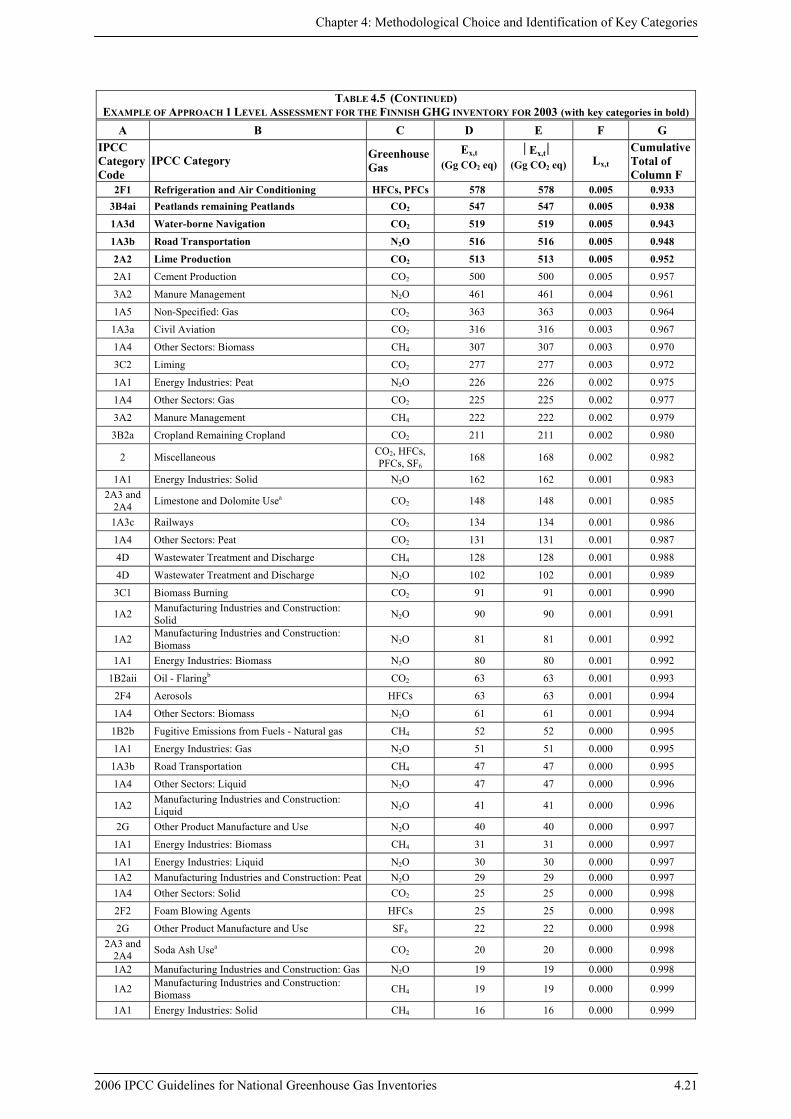
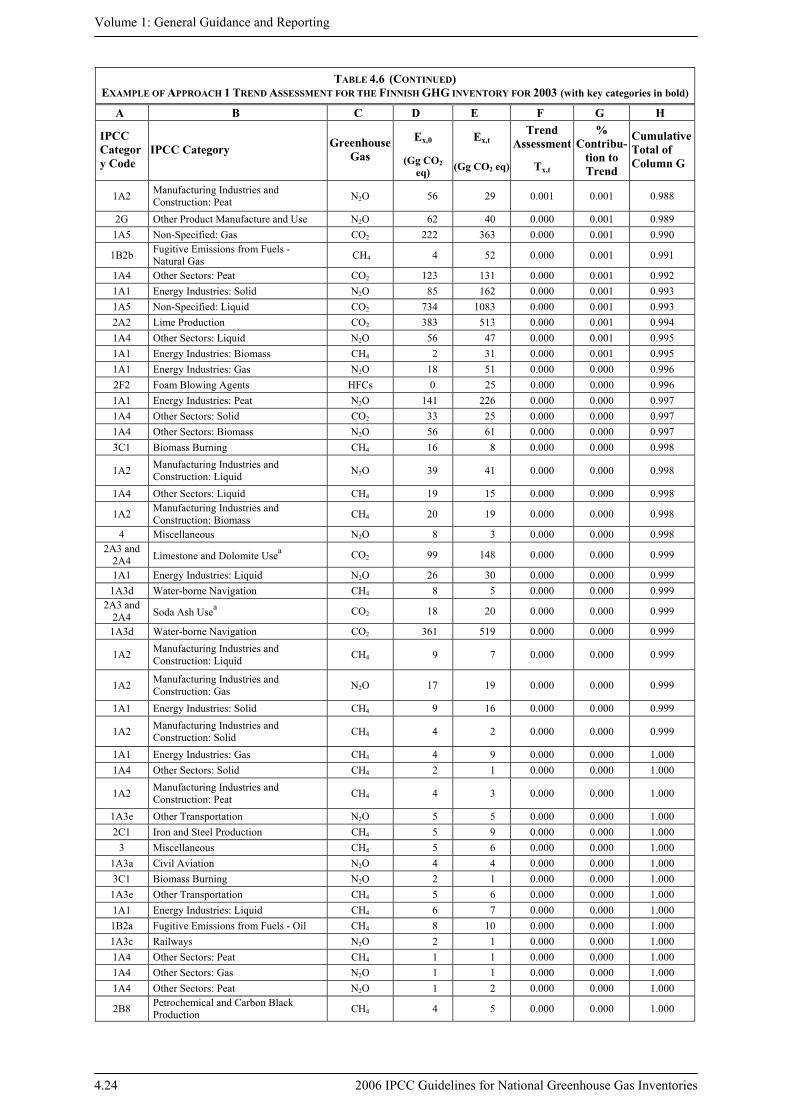
4.5 EXAMPLES OF KEY CATEGORY ANALYSIS The application of the Approach 1 and 2 to the Finnish greenhouse gas inventory for the reporting year 2003 is shown in Tables 4.5 to 4.11. Both the level and the trend assessment were conducted using estimates of emissions, removals and uncertainties from the national inventory of Finland (Statistics Finland, 2005). Although a qualitative assessment was not conducted in this example, it was not anticipated that additional categories would have been identified.
The results of the Approach 1 Level Assessment are shown in Table 4.5 with key categories in bold. The results of the Approach 1 Trend Assessment are shown in Table 4.6, with key categories in bold. Tables 4.7 and 4.8 present an Approach 1 Level and Trend key category analysis using a subset of emissions and removals. In this example, it was decided to include other categories (reported in Tables 4.5 and 4.6) than CO2 from category 3B (Land). The results of Approach 2 Level and Trend Assessments are provided in Tables 4.9 and 4.10. Table 4.11 finally summarises the results of the key category analysis.
TABLE 4.5 EXAMPLE OF APPROACH 1 LEVEL ASSESSMENT FOR THE FINNISH GHG INVENTORY FOR 2003 (with key categories in bold)
A B C D E F G
Ex,t ⎢Ex,t ⎢ IPCC Category Code
IPCC Category Greenhouse Gas (Gg CO2 eq) (Gg CO2 eq)
Lx,t Cumulative Total of Column F
3B1a Forest land remaining Forest land CO2 -21 354 21 354 0.193 0.193
1A1 Energy Industries: Solid CO2 17 311 17 311 0.157 0.350
1A3b Road Transportation CO2 11 447 11 447 0.104 0.454
1A1 Energy Industries: Peat CO2 9 047 9 047 0.082 0.536
1A1 Energy Industries: Gas CO2 6 580 6 580 0.060 0.595
1A4 Other Sectors: Liquid CO2 5 651 5 651 0.051 0.646
1A2 Manufacturing Industries and Construction: Solid CO2 5 416 5 416 0.049 0.695
1A2 Manufacturing Industries and Construction: Liquid CO2 4 736 4 736 0.043 0.738
1A1 Energy Industries: Liquid CO2 3 110 3 110 0.028 0.767
3B3a Grassland Remaining Grassland CO2 2 974 2 974 0.027 0.793
3C4 Direct N2O Emissions from managed soils N2O 2 619 2 619 0.024 0.817
4A Solid Waste Disposal CH4 2 497 2 497 0.023 0.840
1A2 Manufacturing Industries and Construction: Gas CO2 2 174 2 174 0.020 0.859
3A1 Enteric Fermentation CH4 1 537 1 537 0.014 0.873
1A2 Manufacturing Industries and Construction: Peat CO2 1 498 1 498 0.014 0.887
2B2 Nitric Acid Production N2O 1 396 1 396 0.013 0.900
1A5 Non-Specified: Liquid CO2 1 083 1 083 0.010 0.909
2D Non-Energy Products from Fuels and Solvent Use CO2 830 830 0.008 0.917
1A3e Other Transportation CO2 651 651 0.006 0.923
3C5 Indirect N2O Emissions from managed soils N2O 592 592 0.005 0.928
Chapter 4: Methodological Choice and Identification of Key Categories
2006 IPCC Guidelines for National Greenhouse Gas Inventories 4.21
TABLE 4.5 (CONTINUED) EXAMPLE OF APPROACH 1 LEVEL ASSESSMENT FOR THE FINNISH GHG INVENTORY FOR 2003 (with key categories in bold)
A B C D E F G Ex,t ⎢Ex,t ⎢ IPCC
Category Code
IPCC Category Greenhouse Gas (Gg CO2 eq) (Gg CO2 eq) Lx,t
Cumulative Total of Column F
2F1 Refrigeration and Air Conditioning HFCs, PFCs 578 578 0.005 0.933 3B4ai Peatlands remaining Peatlands CO2 547 547 0.005 0.938
1A3d Water-borne Navigation CO2 519 519 0.005 0.943
1A3b Road Transportation N2O 516 516 0.005 0.948
2A2 Lime Production CO2 513 513 0.005 0.952 2A1 Cement Production CO2 500 500 0.005 0.957
3A2 Manure Management N2O 461 461 0.004 0.961
1A5 Non-Specified: Gas CO2 363 363 0.003 0.964
1A3a Civil Aviation CO2 316 316 0.003 0.967
1A4 Other Sectors: Biomass CH4 307 307 0.003 0.970
3C2 Liming CO2 277 277 0.003 0.972
1A1 Energy Industries: Peat N2O 226 226 0.002 0.975
1A4 Other Sectors: Gas CO2 225 225 0.002 0.977
3A2 Manure Management CH4 222 222 0.002 0.979
3B2a Cropland Remaining Cropland CO2 211 211 0.002 0.980
2 Miscellaneous CO2, HFCs, PFCs, SF6
168 168 0.002 0.982
1A1 Energy Industries: Solid N2O 162 162 0.001 0.983 2A3 and
2A4 Limestone and Dolomite Usea CO2 148 148 0.001 0.985
1A3c Railways CO2 134 134 0.001 0.986
1A4 Other Sectors: Peat CO2 131 131 0.001 0.987
4D Wastewater Treatment and Discharge CH4 128 128 0.001 0.988
4D Wastewater Treatment and Discharge N2O 102 102 0.001 0.989
3C1 Biomass Burning CO2 91 91 0.001 0.990
1A2 Manufacturing Industries and Construction: Solid N2O 90 90 0.001 0.991
1A2 Manufacturing Industries and Construction: Biomass N2O 81 81 0.001 0.992
1A1 Energy Industries: Biomass N2O 80 80 0.001 0.992
1B2aii Oil - Flaringb CO2 63 63 0.001 0.993
2F4 Aerosols HFCs 63 63 0.001 0.994
1A4 Other Sectors: Biomass N2O 61 61 0.001 0.994
1B2b Fugitive Emissions from Fuels - Natural gas CH4 52 52 0.000 0.995
1A1 Energy Industries: Gas N2O 51 51 0.000 0.995
1A3b Road Transportation CH4 47 47 0.000 0.995
1A4 Other Sectors: Liquid N2O 47 47 0.000 0.996
1A2 Manufacturing Industries and Construction: Liquid N2O 41 41 0.000 0.996
2G Other Product Manufacture and Use N2O 40 40 0.000 0.997
1A1 Energy Industries: Biomass CH4 31 31 0.000 0.997
1A1 Energy Industries: Liquid N2O 30 30 0.000 0.997 1A2 Manufacturing Industries and Construction: Peat N2O 29 29 0.000 0.997 1A4 Other Sectors: Solid CO2 25 25 0.000 0.998
2F2 Foam Blowing Agents HFCs 25 25 0.000 0.998
2G Other Product Manufacture and Use SF6 22 22 0.000 0.998 2A3 and
2A4 Soda Ash Usea CO2 20 20 0.000 0.998
1A2 Manufacturing Industries and Construction: Gas N2O 19 19 0.000 0.998
1A2 Manufacturing Industries and Construction: Biomass CH4 19 19 0.000 0.999
1A1 Energy Industries: Solid CH4 16 16 0.000 0.999

Volume 1: General Guidance and Reporting
4.22 2006 IPCC Guidelines for National Greenhouse Gas Inventories
TABLE 4.5 (CONTINUED) EXAMPLE OF APPROACH 1 LEVEL ASSESSMENT FOR THE FINNISH GHG INVENTORY FOR 2003 (with key categories in bold)
A B C D E F G Ex,t ⎢Ex,t ⎢ IPCC
Category Code
IPCC Category Greenhouse Gas (Gg CO2 eq) (Gg CO2 eq) Lx,t
Cumulative Total of Column F
1A4 Other Sectors: Liquid CH4 15 15 0.000 0.999
1B2a Fugitive Emissions from Fuels – Oil CH4 10 10 0.000 0.999
2C1 Iron and Steel Production CH4 9 9 0.000 0.999
1A5 Non-Specified: Liquid N2O 9 9 0.000 0.999
1A1 Energy Industries: Gas CH4 9 9 0.000 0.999
3C1 Biomass Burning CH4 8 8 0.000 0.999
1A1 Energy Industries: Peat CH4 7 7 0.000 0.999
1A2 Manufacturing Industries and Construction: Liquid CH4 7 7 0.000 0.999
1A1 Energy Industries: Liquid CH4 7 7 0.000 0.999
1A3e Other Transportation CH4 6 6 0.000 1.000
1A2 Manufacturing Industries and Construction: Gas CH4 6 6 0.000 1.000
3 Miscellaneous CH4 6 6 0.000 1.000
2B8 Petrochemical and Carbon Black Production CH4 5 5 0.000 1.000
1A3e Other Transportation N2O 5 5 0.000 1.000
1A3d Water-Borne Navigation CH4 5 5 0.000 1.000
1A3a Civil Aviation N2O 4 4 0.000 1.000
1A3d Water-Borne Navigation N2O 4 4 0.000 1.000
4 Miscellaneous N2O 3 3 0.000 1.000
1A2 Manufacturing Industries and Construction: Peat CH4 3 3 0.000 1.000
1A2 Manufacturing Industries and Construction: Solid CH4 2 2 0.000 1.000
1A5 Non-Specified: Liquid CH4 2 2 0.000 1.000
1A5 Non-Specified: Gas N2O 2 2 0.000 1.000
1A4 Other Sectors: Peat N2O 2 2 0.000 1.000
1A4 Other Sectors: Gas N2O 1 1 0.000 1.000
1A4 Other Sectors: Peat CH4 1 1 0.000 1.000
1A3c Railways N2O 1 1 0.000 1.000
3C1 Biomass Burning N2O 1 1 0.000 1.000
1A4 Other Sectors: Solid CH4 1 1 0.000 1.000
1A5 Non-Specified: Gas CH4 0.4 0.4 0.000 1.000
1A4 Other Sectors: Solid N2O 0.3 0.3 0.000 1.000
1A3a Civil Aviation CH4 0.3 0.3 0.000 1.000
1A4 Other Sectors: Gas CH4 0.3 0.3 0.000 1.000
1A3c Railways CH4 0.2 0.2 0.000 1.000
Total 67 729 110 438 1 a Example was based on 2003 inventory of Finland, and therefore glass production could not be separated as recommended in these
Guidelines. This does not affect categories identified as key. b Example was based on 2003 inventory of Finland, and therefore flaring was separated from other fugitive emissions from oil (1B2a).
According to these Guidelines, all emissions under 1B2a should be treated together in key category analysis. This would not affect categories identified as key in this example.

Chapter 4: Methodological Choice and Identification of Key Categories
2006 IPCC Guidelines for National Greenhouse Gas Inventories 4.23
TABLE 4.6 EXAMPLE OF APPROACH 1 TREND ASSESSMENT FOR THE FINNISH GHG INVENTORY FOR 2003 (with key categories in bold)
A B C D E F G H
Ex,0 Ex,t Trend
Assessment IPCC Category Code
IPCC Category Greenhouse Gas
(Gg CO2 eq) (Gg CO2 eq) Tx,t
% Contribu-
tion to Trend
Cumulative Total of Column G
3B1a Forest Land remaining Forest Land CO2 -23 798 -21 354 0.078 0.147 0.147 1A1 Energy Industries: Solid CO2 9 279 17 311 0.042 0.079 0.227
1A3b Road Transportation CO2 10 800 11 447 0.040 0.076 0.302 1A4 Other Sectors: Liquid CO2 6 714 5 651 0.040 0.075 0.378
1A2 Manufacturing Industries and Construction: Solid CO2 6 410 5 416 0.038 0.072 0.450
3B3a Grassland Remaining Grassland CO2 -1 071 2 974 0.037 0.069 0.519 1A1 Energy Industries: Peat CO2 3 972 9 047 0.035 0.066 0.585 1A1 Energy Industries: Gas CO2 2 659 6 580 0.029 0.054 0.639 4A Solid Waste Disposal CH4 3 678 2 497 0.028 0.053 0.692
3C4 Direct N2O Emissions from managed soils N2O 3 513 2 619 0.024 0.046 0.738
1A2 Manufacturing Industries and Construction: Liquid CO2 4 861 4 736 0.022 0.042 0.780
3B2a Cropland Remaining Cropland CO2 1 277 211 0.017 0.031 0.811 3A1 Enteric Fermentation CH4 1 868 1 537 0.012 0.022 0.833 2B2 Nitric Acid Production N2O 1 595 1 396 0.009 0.017 0.849
1A2 Manufacturing Industries and Construction: Gas CO2 2 094 2 174 0.008 0.016 0.865
1A2 Manufacturing Industries and Construction: Peat CO2 1 561 1 498 0.007 0.014 0.879
2A1 Cement Production CO2 786 500 0.006 0.012 0.891 3C2 Liming CO2 618 277 0.006 0.012 0.903 1A1 Energy Industries: Liquid CO2 2 607 3 110 0.006 0.012 0.914
2F1 Refrigeration and Air Conditioning HFCs, PFCs 0 578 0.006 0.011 0.925
3C5 Indirect N2O Emissions from managed soils N2O 735 592 0.005 0.009 0.934
3A2 Manure Management N2O 623 461 0.004 0.008 0.942 1A3b Road Transportation N2O 160 516 0.003 0.006 0.948 1A3e Other Transportation CO2 644 651 0.003 0.005 0.953 3B4ai Peatlands Remaining Peatlands CO2 503 547 0.002 0.003 0.956 3C1 Biomass Burning CO2 180 91 0.002 0.003 0.959 1A3a Civil Aviation CO2 320 316 0.001 0.003 0.962 1A3c Railways CO2 191 134 0.001 0.003 0.965
1B2aii Flaringb CO2 123 63 0.001 0.002 0.967 2G Other Product Manufacture and Use SF6 87 22 0.001 0.002 0.969
1A4 Other Sectors: Biomass CH4 282 307 0.001 0.002 0.971 4D Wastewater Treatment and Discharge CH4 153 128 0.001 0.002 0.973 4D Wastewater Treatment and Discharge N2O 133 102 0.001 0.002 0.974
1A4 Other Sectors: Gas CO2 98 225 0.001 0.002 0.976 3A2 Manure Management CH4 215 222 0.001 0.002 0.977
2D Non-Energy Products from Fuels and Solvent Use CO2 640 830 0.001 0.002 0.979
1A3b Road Transportation CH4 90 47 0.001 0.002 0.981
1A2 Manufacturing Industries and Construction: Biomass N2O 111 81 0.001 0.002 0.982
2 Miscellaneous CO2, HFCs, PFCs, SF6
68 168 0.001 0.001 0.983
1A1 Energy Industries: Biomass N2O 10 80 0.001 0.001 0.985
1A2 Manufacturing Industries and Construction: Solid N2O 108 90 0.001 0.001 0.986
2F4 Aerosols HFCs 0 63 0.001 0.001 0.987
Volume 1: General Guidance and Reporting
4.24 2006 IPCC Guidelines for National Greenhouse Gas Inventories
TABLE 4.6 (CONTINUED) EXAMPLE OF APPROACH 1 TREND ASSESSMENT FOR THE FINNISH GHG INVENTORY FOR 2003 (with key categories in bold)
A B C D E F G H
Ex,0 Ex,t Trend
Assessment IPCC Category Code
IPCC Category Greenhouse Gas (Gg CO2
eq) (Gg CO2 eq) Tx,t
% Contribu-
tion to Trend
Cumulative Total of Column G
1A2 Manufacturing Industries and Construction: Peat N2O 56 29 0.001 0.001 0.988
2G Other Product Manufacture and Use N2O 62 40 0.000 0.001 0.989 1A5 Non-Specified: Gas CO2 222 363 0.000 0.001 0.990
1B2b Fugitive Emissions from Fuels - Natural Gas CH4 4 52 0.000 0.001 0.991
1A4 Other Sectors: Peat CO2 123 131 0.000 0.001 0.992 1A1 Energy Industries: Solid N2O 85 162 0.000 0.001 0.993 1A5 Non-Specified: Liquid CO2 734 1083 0.000 0.001 0.993 2A2 Lime Production CO2 383 513 0.000 0.001 0.994 1A4 Other Sectors: Liquid N2O 56 47 0.000 0.001 0.995 1A1 Energy Industries: Biomass CH4 2 31 0.000 0.001 0.995 1A1 Energy Industries: Gas N2O 18 51 0.000 0.000 0.996 2F2 Foam Blowing Agents HFCs 0 25 0.000 0.000 0.996 1A1 Energy Industries: Peat N2O 141 226 0.000 0.000 0.997 1A4 Other Sectors: Solid CO2 33 25 0.000 0.000 0.997 1A4 Other Sectors: Biomass N2O 56 61 0.000 0.000 0.997 3C1 Biomass Burning CH4 16 8 0.000 0.000 0.998
1A2 Manufacturing Industries and Construction: Liquid N2O 39 41 0.000 0.000 0.998
1A4 Other Sectors: Liquid CH4 19 15 0.000 0.000 0.998
1A2 Manufacturing Industries and Construction: Biomass CH4 20 19 0.000 0.000 0.998
4 Miscellaneous N2O 8 3 0.000 0.000 0.998 2A3 and
2A4 Limestone and Dolomite Usea CO2 99 148 0.000 0.000 0.999
1A1 Energy Industries: Liquid N2O 26 30 0.000 0.000 0.999 1A3d Water-borne Navigation CH4 8 5 0.000 0.000 0.999
2A3 and 2A4 Soda Ash Usea CO2 18 20 0.000 0.000 0.999
1A3d Water-borne Navigation CO2 361 519 0.000 0.000 0.999
1A2 Manufacturing Industries and Construction: Liquid CH4 9 7 0.000 0.000 0.999
1A2 Manufacturing Industries and Construction: Gas N2O 17 19 0.000 0.000 0.999
1A1 Energy Industries: Solid CH4 9 16 0.000 0.000 0.999
1A2 Manufacturing Industries and Construction: Solid CH4 4 2 0.000 0.000 0.999
1A1 Energy Industries: Gas CH4 4 9 0.000 0.000 1.000 1A4 Other Sectors: Solid CH4 2 1 0.000 0.000 1.000
1A2 Manufacturing Industries and Construction: Peat CH4 4 3 0.000 0.000 1.000
1A3e Other Transportation N2O 5 5 0.000 0.000 1.000 2C1 Iron and Steel Production CH4 5 9 0.000 0.000 1.000
3 Miscellaneous CH4 5 6 0.000 0.000 1.000 1A3a Civil Aviation N2O 4 4 0.000 0.000 1.000 3C1 Biomass Burning N2O 2 1 0.000 0.000 1.000 1A3e Other Transportation CH4 5 6 0.000 0.000 1.000 1A1 Energy Industries: Liquid CH4 6 7 0.000 0.000 1.000 1B2a Fugitive Emissions from Fuels - Oil CH4 8 10 0.000 0.000 1.000 1A3c Railways N2O 2 1 0.000 0.000 1.000 1A4 Other Sectors: Peat CH4 1 1 0.000 0.000 1.000 1A4 Other Sectors: Gas N2O 1 1 0.000 0.000 1.000 1A4 Other Sectors: Peat N2O 1 2 0.000 0.000 1.000
2B8 Petrochemical and Carbon Black Production CH4 4 5 0.000 0.000 1.000

Chapter 4: Methodological Choice and Identification of Key Categories
2006 IPCC Guidelines for National Greenhouse Gas Inventories 4.25
TABLE 4.6 (CONTINUED) EXAMPLE OF APPROACH 1 TREND ASSESSMENT FOR THE FINNISH GHG INVENTORY FOR 2003 (with key categories in bold)
A B C D E F G H
Ex,0 Ex,t Trend
Assessment IPCC Category Code
IPCC Category Greenhouse Gas (Gg CO2
eq) (Gg CO2 eq) Tx,t
% Contribu-
tion to Trend
Cumulative Total of Column G
1A2 Manufacturing Industries and Construction: Gas CH4 5 6 0.000 0.000 1.000
1A4 Other Sectors: Solid N2O 0.5 0.3 0.000 0.000 1.000 1A1 Energy Industries: Peat CH4 5 7 0.000 0.000 1.000 1A5 Non-Specified: Gas N2O 1 2 0.000 0.000 1.000 1A3a Civil Aviation CH4 0.4 0.3 0.000 0.000 1.000 1A3c Railways CH4 0.2 0.2 0.000 0.000 1.000 1A5 Non-Specified: Liquid N2O 6 9 0.000 0.000 1.000 1A4 Other Sectors: Gas CH4 0.1 0.3 0.000 0.000 1.000
1A3d Water-borne Navigation N2O 3 4 0.000 0.000 1.000 1A5 Non-Specified: Gas CH4 0.3 0.4 0.000 0.000 1.000 1A5 Non-Specified: Liquid CH4 2 2 0.000 0.000 1.000 Total 47 604 67 729 0.531 1
a Example was based on 2003 inventory of Finland, and therefore glass production could not be separated as recommended in these Guidelines. This does not affect categories identified as key.
b Example was based on 2003 inventory of Finland, and therefore flaring was separated from other fugitive emissions from oil (1B2a). According to these Guidelines, all emissions under 1B2a should be treated together in key category analysis. This would not affect categories identified as key in this example.
TABLE 4.7 EXAMPLE OF APPROACH 1 LEVEL ASSESSMENT FOR THE FINNISH GHG INVENTORY FOR 2003 USING A SUBSET
(CO2 from category 3B was excluded from the analysis). Only key categories are presented. A B C D E F G
Ex,t ⎢Ex,t ⎢ IPCC Category Code
IPCC Category Greenhouse Gas (Gg CO2 eq) (Gg CO2 eq)
Lx,t Cumulative Total of Column F
1A1 Energy Industries: Solid CO2 17 311 17 311 0.203 0.203
1A3b Road Transportation CO2 11 447 11 447 0.134 0.337
1A1 Energy Industries: Peat CO2 9 047 9 047 0.106 0.443
1A1 Energy Industries: Gas CO2 6 580 6 580 0.077 0.520
1A4 Other Sectors: Liquid CO2 5 651 5 651 0.066 0.586
1A2 Manufacturing Industries and Construction: Solid CO2 5 416 5 416 0.063 0.650
1A2 Manufacturing Industries and Construction: Liquid CO2 4 736 4 736 0.055 0.705
1A1 Energy Industries: Liquid CO2 3 110 3 110 0.036 0.742
3C4 Direct N2O Emissions from managed soils N2O 2 619 2 619 0.031 0.772
4A Solid Waste Disposal CH4 2 497 2 497 0.029 0.802
1A2 Manufacturing Industries and Construction: Gas CO2 2 174 2 174 0.025 0.827
3A1 Enteric Fermentation CH4 1 537 1 537 0.018 0.845
1A2 Manufacturing Industries and Construction: Peat CO2 1 498 1 498 0.018 0.863
2B2 Nitric Acid Production N2O 1 396 1 396 0.016 0.879
1A5 Non-Specified: Liquid CO2 1 083 1 083 0.013 0.892
2D Non-Energy Products from Fuels and Solvent Use CO2 830 830 0.010 0.901
1A3e Other Transportation CO2 651 651 0.008 0.909
3C5 Indirect N2O Emissions from Managed Soils N2O 592 592 0.007 0.916
2F1 Refrigeration and Air Conditioning HFCs, PFCs 578 578 0.007 0.923

Volume 1: General Guidance and Reporting
4.26 2006 IPCC Guidelines for National Greenhouse Gas Inventories
TABLE 4.7 (CONTINUED) EXAMPLE OF APPROACH 1 LEVEL ASSESSMENT FOR THE FINNISH GHG INVENTORY FOR 2003 USING A SUBSET
(CO2 from category 3B was excluded from the analysis). Only key categories are presented.
A B C D E F G
Ex,t ⎢Ex,t ⎢ IPCC Category Code
IPCC Category Greenhouse Gas (Gg CO2 eq) (Gg CO2 eq)
Lx,t Cumulative Total of Column F
1A3d Water-borne Navigation CO2 519 519 0.006 0.929
1A3b Road Transportation N2O 516 516 0.006 0.935
2A2 Lime Production CO2 513 513 0.006 0.941
2A1 Cement Production CO2 500 500 0.006 0.947
3A2 Manure Management N2O 461 461 0.005 0.952
...........................................................................................................................................................................................................................
Total 85 352 85 352 1
TABLE 4.8 EXAMPLE OF APPROACH 1 TREND ASSESSMENT FOR THE FINNISH GHG INVENTORY FOR 2003 USING A SUBSET (CO2 from
category 3B was excluded from the analysis). Only key categories are presented. A B C D E F G H
Ex,0 Ex,t Trend
assessment IPCC Category Code
IPCC Category Greenhouse Gas
(Gg CO2 eq) (Gg CO2 eq) Tx,t
% Contribu-
tion to Trend
Cumulative Total of Column G
1A1 Energy Industries: Solid CO2 9 279 17 311 0.086 0.194 0.194 1A1 Energy Industries: Peat CO2 3 972 9 047 0.060 0.135 0.329 1A1 Energy Industries: Gas CO2 2 659 6 580 0.048 0.107 0.436 1A4 Other Sectors: Liquid CO2 6 714 5 651 0.035 0.078 0.514
1A2 Manufacturing Industries and Construction: Solid CO2 6 410 5 416 0.033 0.074 0.588
4A Solid Waste Disposal CH4 3 678 2 497 0.028 0.062 0.650
3C4 Direct N2O Emissions from Managed Soils N2O 3 513 2 619 0.023 0.052 0.702
1A3b Road Transportation CO2 10 800 11 447 0.023 0.051 0.752
1A2 Manufacturing Industries and Construction: Liquid CO2 4 861 4 736 0.016 0.036 0.788
3A1 Enteric Fermentation CH4 1 868 1 537 0.010 0.023 0.811 2F1 Refrigeration and Air Conditioning HFCs, PFCs 0 578 0.008 0.018 0.830 2B2 Nitric Acid Production N2O 1 595 1 396 0.008 0.017 0.846 3C2 Liming CO2 618 277 0.007 0.015 0.861 2A1 Cement Production CO2 786 500 0.006 0.014 0.876
1A2 Manufacturing Industries and Construction: Peat CO2 1 561 1 498 0.005 0.012 0.888
1A2 Manufacturing Industries and Construction: Gas CO2 2 094 2 174 0.005 0.011 0.899
1A3b Road Transportation N2O 160 516 0.005 0.010 0.909
3C5 Indirect N2O Emissions from Managed Soils N2O 735 592 0.004 0.009 0.919
3A2 Manure Management N2O 623 461 0.004 0.009 0.928 1A5 Non-Specified: Liquid CO2 734 1 083 0.003 0.006 0.934 3C1 Biomass Burning CO2 180 91 0.002 0.004 0.938 1A3e Other Transportation CO2 644 651 0.002 0.004 0.942 1A4 Other Sectors: Gas CO2 98 225 0.001 0.003 0.946 1A3c Railways CO2 191 134 0.001 0.003 0.949 1A5 Non-Specified: Gas CO2 222 363 0.001 0.003 0.952
................... ........................................................................................................................................................................................................
Total 70 692 85 352 0.445 1

Chapter 4: Methodological Choice and Identification of Key Categories
2006 IPCC Guidelines for National Greenhouse Gas Inventories 4.27
TABLE 4.9 EXAMPLE OF APPROACH 2 LEVEL ASSESSMENT FOR THE FINNISH GHG INVENTORY FOR 2003
The aggregation level used is country-specific, and does not represent recommended aggregation level. Only key categories are presented.
A B C D E F G
Ex,t ⎢Ex,t⎢ IPCC Category Code
IPCC Category Greenhouse Gas (Gg CO2 eq) (Gg CO2 eq)
LUx,t Cumulative Total of Column F
3B1a Forest Land Remaining Forest Land: carbon stock change in biomass CO2 -21 354 21 354 0.23 0.23
3C4 Direct N2O Emissions from Managed Soils: Agricultural Soils N2O 2 608 2 608 0.18 0.41
3B3a Grassland Remaining Grassland: net carbon stock change in mineral soils CO2 2 907 2 907 0.09 0.50
3C5 Indirect N2O Emissions from Managed Soils N2O 592 592 0.06 0.56
1A3b Road Transportation: Cars with Catalytic Converters N2O 410 410 0.05 0.61
2B2 Nitric Acid Production N2O 1 396 1 396 0.04 0.66
3B2a Cropland Remaining Cropland: net carbon stock change in organic soils CO2 1 324 1 324 0.04 0.70
3B4ai Peatlands Remaining Peatlands CO2 547 547 0.04 0.73
3B2a Cropland Remaining Cropland: net carbon stock change in mineral soils CO2 -1 113 1 113 0.03 0.77
4A Solid Waste Disposal CH4 2 497 2 497 0.03 0.80
1A Fuel Combustion Activities: Liquid CO2 27 640 27 640 0.02 0.82
1A Fuel Combustion Activities: Solid CO2 22 753 22 753 0.02 0.85
1A Fuel Combustion Activities: Peat CO2 10 676 10 676 0.02 0.87
3A1 Enteric Fermentation CH4 1 537 1 537 0.01 0.88
1A4 Other Sectors: Biomass CH4 307 307 0.01 0.90
2D Non-Energy Products from Fuels and Solvent Use CO2 830 830 0.01 0.91

Volume 1: General Guidance and Reporting
4.28 2006 IPCC Guidelines for National Greenhouse Gas Inventories
TABLE 4.10 EXAMPLE OF APPROACH 2 TREND ASSESSMENT FOR THE FINNISH GHG INVENTORY FOR 2003
The aggregation level used is country-specific, and does not represent recommended aggregation level. Only key categories are presented.
A B C D E F G H
Ex,0 Ex,t
Trend Assessment
with Uncertainty
IPCC Category Code
IPCC Category Greenhouse Gas
(Gg CO2 eq) (Gg CO2 eq) TUx,t
% Contri-
bution to Trend
Cumulative Total of Column G
3C4 Direct N2O Emissions from Managed Soils: Agricultural Soils N2O 3 486 2 608 5.42 0.24 0.24
3B3a Grassland Remaining Grassland: net carbon stock change in mineral soils CO2 -1 181 2 907 3.62 0.16 0.40
3B1a Forest Land Remaining Forest Land: carbon stock change in biomass CO2 -23 798 -21 354 2.71 0.12 0.52
3C5 Indirect N2O Emissions from Managed Soils N2O 735 592 1.54 0.07 0.58
1A3b Road Transportation: Cars with Catalytic Converters N2O 32 410 1.45 0.06 0.65
3B2a Cropland Remaining Cropland: net carbon stock change in organic soils CO2 1 813 1 324 1.21 0.05 0.70
4A Solid Waste Disposal CH4 3 678 2 497 1.20 0.05 0.75
2B2 Nitric Acid Production N2O 1 595 1 396 0.89 0.04 0.79
3B2a Cropland Remaining Cropland: net carbon stock change in mineral soils CO2 -535 -1 113 0.82 0.04 0.83
3B4ai Peatlands Remaining Peatlands CO2 503 547 0.36 0.02 0.85
3A2 Manure Management N2O 623 461 0.36 0.02 0.86
3A1 Enteric Fermentation CH4 1 868 1 537 0.35 0.02 0.88
1A Fuel Combustion Activities: Liquid CO2 27 232 27 640 0.32 0.01 0.89
4D1 Domestic Wastewater Treatment and Discharge: densely populated areas N2O 84 66 0.20 0.01 0.90

Chapter 4: Methodological Choice and Identification of Key Categories
2006 IPCC Guidelines for National Greenhouse Gas Inventories 4.29
TABLE 4.11 SUMMARY OF KEY CATEGORY ANALYSIS FOR FINLAND Quantitative method used: Approach 1 and Approach 2
A B C D E
IPCC Category Code
IPCC Category Greenhouse gas
Identification criteria Commentsa
1A Fuel Combustion Activities: Liquid CO2 L2, T2 Aggr 1A Fuel Combustion Activities: Solid CO2 L2 Aggr 1A Fuel Combustion Activities: Peat CO2 L2 Aggr 1A1 Energy Industries: Solid CO2 L1, T1 1A1 Energy Industries: Peat CO2 L1, T1 1A1 Energy Industries: Gas CO2 L1, T1 1A1 Energy Industries: Liquid CO2 L1, T1 1A2 Manufacturing Industries and Construction: Solid CO2 L1, T1 1A2 Manufacturing Industries and Construction: Liquid CO2 L1, T1 1A2 Manufacturing Industries and Construction: Gas CO2 L1, T1 1A2 Manufacturing Industries and Construction: Peat CO2 L1, T1
1A3b Road Transportation CO2 L1, T1 1A3b Road Transportation N2O L1, T1 1A3b Road Transportation: Cars with Catalytic Converters N2O L2, T2 Aggr 1A3c Railways CO2 Tsub 1A3d Water-borne Navigation CO2 L1 1A3e Other transportation CO2 L1, T1 1A4 Other Sectors: Liquid CO2 L1, T1 1A4 Other Sectors: Gas CO2 Tsub 1A4 Other Sectors: Biomass CH4 L2 1A5 Non-Specified: Liquid CO2 L1 1A5 Non-Specified: Gas CO2 Tsub 2A1 Cement Production CO2 T1 2A2 Lime Production CO2 L1 2B2 Nitric Acid Production N2O L1, L2, T1, T2 2D Non-Energy Products from Fuels and Solvent Use CO2 L1, L2
2F1 Refrigeration and Air Conditioning HFCs, PFCs L1, T1 3A1 Enteric Fermentation CH4 L1, L2, T1, T2 3A2 Manure Management N2O T1, T2 3B1a Forest Land Remaining Forest Land CO2 L1, L2, T1, T2 3B2a Cropland Remaining Cropland CO2 L2, T1, T2 3B3a Grassland Remaining Grassland CO2 L1, T1
3B3a Grassland Remaining Grassland: net carbon stock change in mineral soils CO2 L2, T2 Aggr
3B4ai Peatlands Remaining Peatlands CO2 L1, L2, T2 3C2 Liming CO2 T1 3C4 Direct N2O Emissions from Managed Soils N2O L1, T1
3C4 Direct N2O Emissions from Managed Soils: Agricultural Soils N2O L2, T2 Aggr
3C5 Indirect N2O Emissions from Managed Soils N2O L1, L2, T1, T2 3C1 Biomass Burning CO2 Tsub 4A Solid Waste Disposal CH4 L1, L2, T1, T2
4D1 Domestic Waste Waster Treatment and Discharge: densely populated areas N2O T2 Aggr
a Tsub denotes a category that was only identified by trend assessment for a subset without category 3B. Level assessment of the subset did not identify additional categories when compared with Approach 1 analysis of the total inventory. Aggr denotes a category identified by Approach 2, where aggregation level has been different than in Approach 1.

Volume 1: General Guidance and Reporting
4.30 2006 IPCC Guidelines for National Greenhouse Gas Inventories
References IPCC (1997). Revised 1996 IPCC Guidelines for National Greenhouse Gas Inventories: Volumes 1, 2 and 3.
Houghton, J.T., Meira Filho, L.G., Lim, B., Tréanton, K., Mamaty, I., Bonduki, Y., Griggs, D.J. and Callander, B.A. (Eds), Intergovernmental Panel on Climate Change (IPCC), IPCC/OECD/IEA, Paris, France.
IPCC (2000). Good Practice Guidance and Uncertainty Management in National Greenhouse Gas Inventories. Penman, J., Kruger, D., Galbally, I., Hiraishi, T., Nyenzi, B., Emmanuel, S., Buendia, L., Hoppaus, R., Martinsen, T., Meijer, J., Miwa, K., and Tanabe, K. (Eds). Intergovernmental Panel on Climate Change (IPCC), IPCC/OECD/IEA/IGES, Hayama, Japan.
IPCC (2001). Climate Change 2001: The Scientific Basis. Contribution of Working Group I to the Third Assessment Report of the Intergovernmental Panel on Climate Change, Houghton, J.T., Ding, Y., Griggs, D.J., Noguer, M., van der Linden, P.J., Dai, X., Maskell, K. and Johnson, C.A. (eds.), Intergovernmental Panel on Climate Change (IPCC). Cambridge University Press, Cambridge, United Kingdom and New York, NY, USA, 881pp.
IPCC (2003). Good Practice Guidance for Land Use, land-Use Change and Forestry, Penman, J., Gytarsky, M., Hiraishi, T., Kruger, D., Pipatti, R., Buendia, L., Miwa, K., Ngara, T. and Tanabe, K., Wagner, F. (Eds), Intergovernmental Panel on Climate Change (IPCC), IPCC/IGES, Hayama, Japan.
Morgan, M.G., and Henrion, M. (1990). Uncertainty: A Guide to Dealing with Uncertainty in Quantitative Risk and Policy Analysis, Cambridge University Press, New York.
Rypdal, K., and Flugsrud, K. (2001). Sensititivity Analysis as a Tool for Systematic Reductions in GHG Inventory Uncertainties. Environmental Science and Policy. Vol 4 (2-3): pp. 117-135.
Statistics Finland. (2005). Greenhouse gas emissions in Finland 1990-2003. National Inventory Report to the UNFCCC, 27 May 2005.