chapter 3 worldwide patenting activity · ip5 statistics report 2013 chapter 3 - worldwide...
TRANSCRIPT
IP5 Statistics Report 2013 Chapter 3 - Worldwide patenting activity
26
Chapter 3 WORLDWIDE PATENTING ACTIVITY
Patent activity is recognized throughout the world as an indicator of innovation. This chapter examines worldwide patent activities in terms of patent applications and grants. The statistics mostly cover the five-year period from 2008 to 2012. The effects of the worldwide recession in 2009 are therefore still visible in this chapter. After a decrease in patent applications in 2009, generally attributed to the worldwide recession, the number of patent applications rebounded in 2010 and has grown further since. This suggests that the effects of the recession on the patenting activities have been limited. Detailed statistics on the usage of the PCT system appear in Chapter 5. Hereafter the counts of applications and filings are by the calendar year of filing and grants by the calendar year of grant. Statistics are derived primarily from the WIPO Statistics Database23, as collected from offices all over the world. Patent statistics are sometimes retrospectively updated, and where necessary and possible missing counts have been supplemented using other sources, but otherwise no estimated counts have been included to compensate for missing data. Considering that not all the offices report their filing statistics regularly enough, some of these data should be interpreted with care, especially when referring to countries outside the IP5 Blocs. It should be noted that the number of inventions that lead to patent applications is less than the total number of applications filed. This is because the first filing with respect to an invention is usually made in one office, and is then often followed by applications made to several other offices within one year, each such application claiming the priority of the earlier first filing. First filings can be seen as an indicator of innovation and inventive activity, while foreign filings are an indicator of an intention for international trade and of globalization. While demand for patent protection is considered principally by counting each national, regional or international application only once, alternative representations are also given in this chapter in terms of the demand for rights, after cumulating the number of designated countries over applications within regional procedures. In this chapter, applications are counted in terms of patent filings; first filings; patent applications entering a grant procedure; and demand for national patent rights. These counting methods are associated with separate sections within the chapter. "Patent filings" include direct national, direct regional, and international PCT applications; "First filings" include initial patent applications filed prior to any later subsequent filings to extend the protection to other countries; "Patent applications entering a grant procedures" include direct national, direct regional, national stage PCT, and regional stage PCT applications; "Demand for national patent rights" includes direct national, designated regional, national stage PCT, and designated regional stage PCT applications. The counts of patent grants in this chapter are based on extractions from the WIPO Statistics Database. They are counted in the year that the grants are issued or published. As with the applications, alternative presentations are also given in this chapter for grants in terms of the demands for rights, after cumulating the number of designated countries over applications within regional procedures.
23 See footnote 6, p.3.
IP5 Statistics Report 2013 Chapter 3 - Worldwide patenting activity
27
The last part of this chapter discusses inter-bloc patent activity in terms of application flows between blocs and in terms of patent families. A patent family is a group of patent filings that claim the priority of a single filing, including the original priority forming filing itself and any subsequent filings made throughout the world. The set of distinct priority forming filings (that indexes the set of patent families) in principle constitutes a better measure for first filings than aggregated domestic national filings. IP5 Patent families are a filtered subset of patent families for which there is evidence of patenting activity in all IP5 Blocs.
IP5 Statistics Report 2013 Chapter 3 - Worldwide patenting activity
28
GUIDE TO FIGURES IN CHAPTER 3 Due to the complexity of the patent system, different representations of the patent filing process are made to illustrate complementary parts of the process. The following scheme can guide the reader to graphs that correspond to the different representations. This aims also at describing the terminology used throughout the Chapter 3. Figs. 3.1, 3.2, 3.3, and 3.4 show the numbers of patent filings in terms of application
forms filled out. All of the following are counted only once: Direct national, direct regional filings (filed with the EPO, EAPO, ARIPO24), and PCT international filings.
Figs. 3.5, 3.6, and 3.12 show the numbers of requests for patents as patent applications
that entered a grant procedure. Direct applications to the offices are counted at the date of filing. PCT applications are counted at the moment they enter the national or regional phase. Direct national and direct regional filings are counted only once. PCT filings are replicated over the numbers of national/regional procedures that are started.
Figs. 3.7, 3.8, and 3.9 show the equivalent numbers of demands for national patent
rights. Direct national filings are counted only once. The counts for PCT applications entering national procedures are replicated over the number of countries where they enter this phase. The counts for direct regional filings and PCT regional phase filings are replicated over the number of countries designated in the applications at the time that they enter the regional procedure. This gives a representation in terms of national patenting.
Figs. 3.13, 3.14, 3.15 and Table 3 show the numbers of patent families that are generated
as the set of first filings, counted only once each, and also show the flows between blocs in terms of the first filings for which claims to priority rights were made with subsequent filings in other countries.
Regarding grants, Fig. 3.10 shows the numbers of granted patents. All grants are counted
only once (in an analogous way to Figs. 3.5, 3.6, and 3.12 for applications). Fig. 3.11 shows the numbers of validated national patent grant registrations. Direct
national grants are counted only once, but the counts for regional office grants are replicated over the numbers of countries for which the grant provides valid registrations. This gives a representation in terms of national patent rights (comparable to Figs. 3.7, 3.8, and 3.9 for applications).
24 The EAPO is the Eurasian Patent Office. The ARIPO is the African Regional Intellectual Property Office.
IP5 Statistics Report 2013 Chapter 3 - Worldwide patenting activity
29
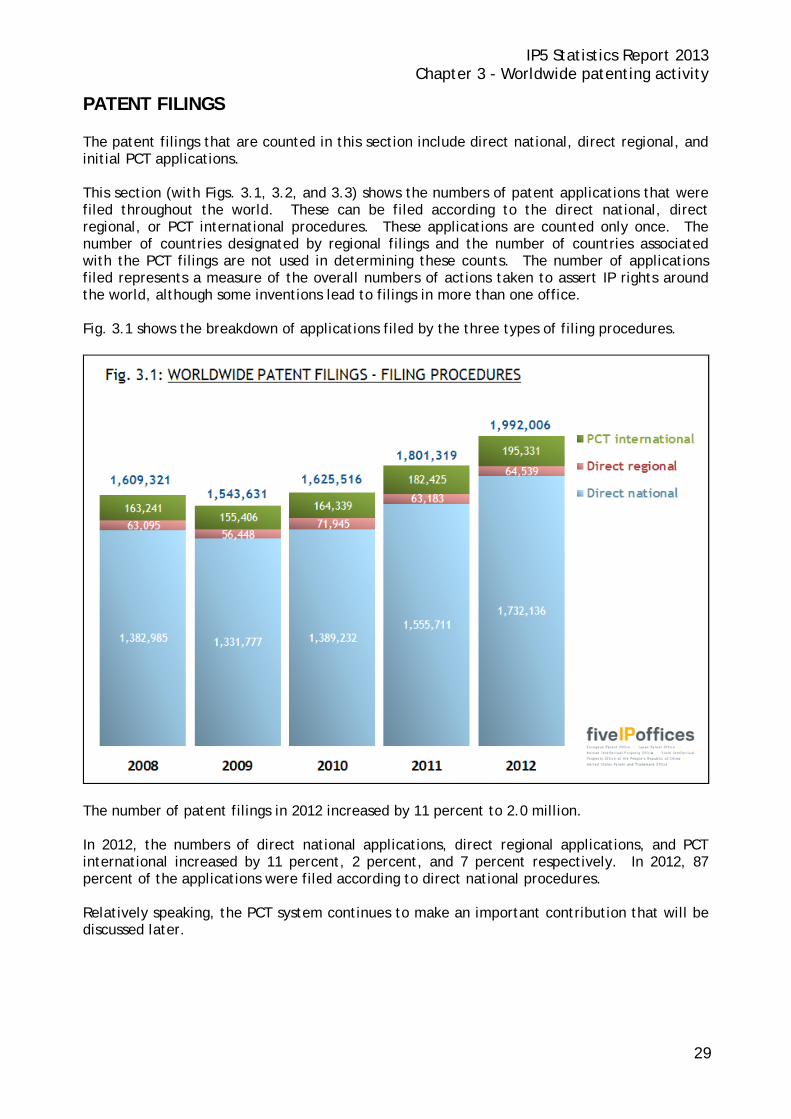
PATENT FILINGS The patent filings that are counted in this section include direct national, direct regional, and initial PCT applications. This section (with Figs. 3.1, 3.2, and 3.3) shows the numbers of patent applications that were filed throughout the world. These can be filed according to the direct national, direct regional, or PCT international procedures. These applications are counted only once. The number of countries designated by regional filings and the number of countries associated with the PCT filings are not used in determining these counts. The number of applications filed represents a measure of the overall numbers of actions taken to assert IP rights around the world, although some inventions lead to filings in more than one office. Fig. 3.1 shows the breakdown of applications filed by the three types of filing procedures.
The number of patent filings in 2012 increased by 11 percent to 2.0 million. In 2012, the numbers of direct national applications, direct regional applications, and PCT international increased by 11 percent, 2 percent, and 7 percent respectively. In 2012, 87 percent of the applications were filed according to direct national procedures. Relatively speaking, the PCT system continues to make an important contribution that will be discussed later.
IP5 Statistics Report 2013 Chapter 3 - Worldwide patenting activity
30
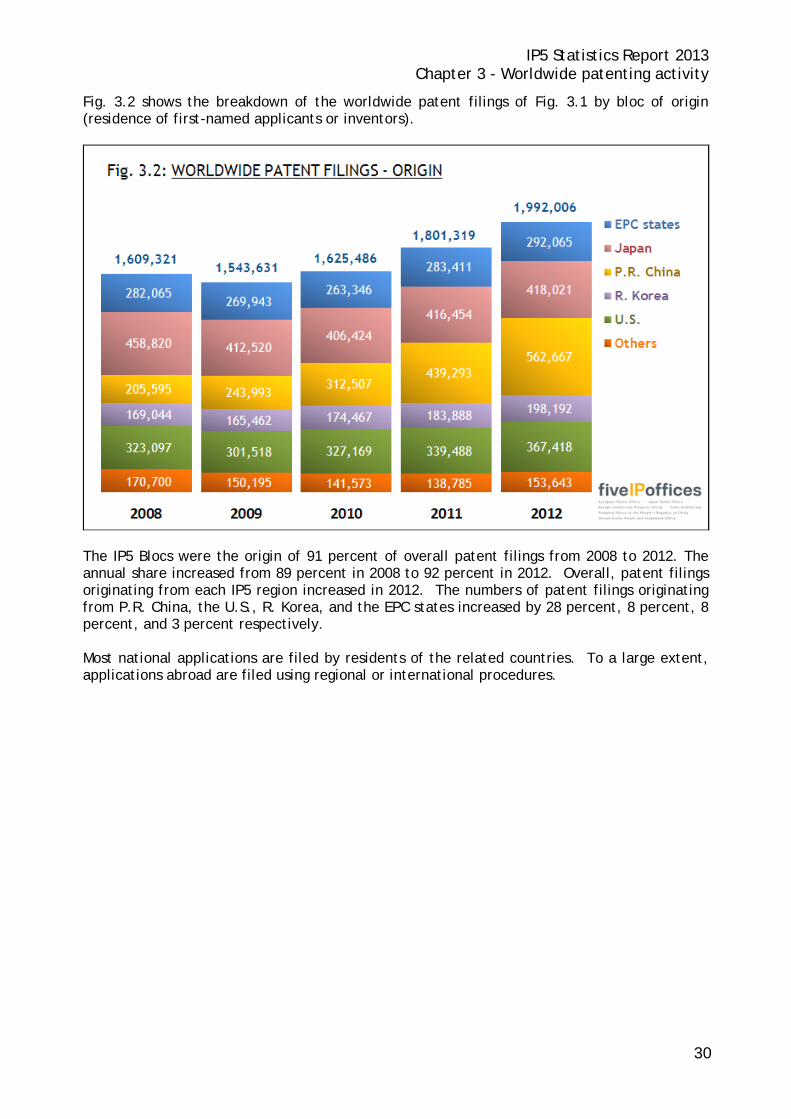
Fig. 3.2 shows the breakdown of the worldwide patent filings of Fig. 3.1 by bloc of origin (residence of first-named applicants or inventors).
The IP5 Blocs were the origin of 91 percent of overall patent filings from 2008 to 2012. The annual share increased from 89 percent in 2008 to 92 percent in 2012. Overall, patent filings originating from each IP5 region increased in 2012. The numbers of patent filings originating from P.R. China, the U.S., R. Korea, and the EPC states increased by 28 percent, 8 percent, 8 percent, and 3 percent respectively. Most national applications are filed by residents of the related countries. To a large extent, applications abroad are filed using regional or international procedures.
IP5 Statistics Report 2013 Chapter 3 - Worldwide patenting activity
31
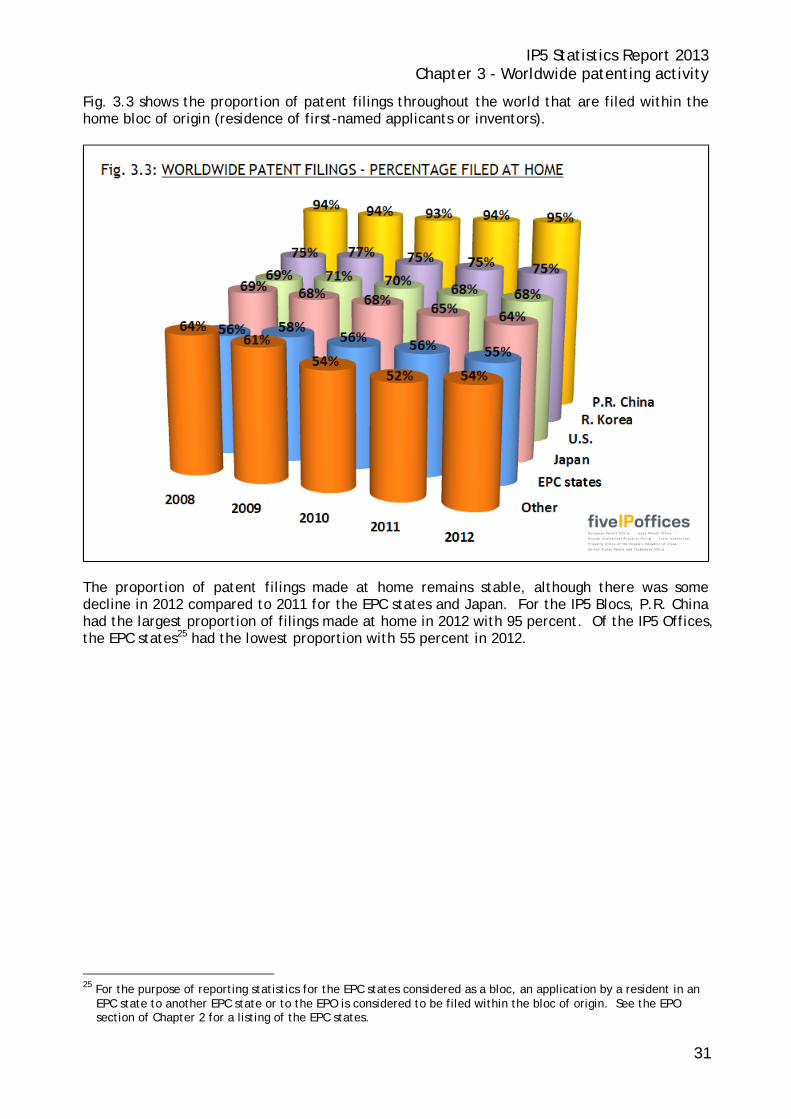
Fig. 3.3 shows the proportion of patent filings throughout the world that are filed within the home bloc of origin (residence of first-named applicants or inventors).
The proportion of patent filings made at home remains stable, although there was some decline in 2012 compared to 2011 for the EPC states and Japan. For the IP5 Blocs, P.R. China had the largest proportion of filings made at home in 2012 with 95 percent. Of the IP5 Offices, the EPC states25 had the lowest proportion with 55 percent in 2012.
25 For the purpose of reporting statistics for the EPC states considered as a bloc, an application by a resident in an
EPC state to another EPC state or to the EPO is considered to be filed within the bloc of origin. See the EPO section of Chapter 2 for a listing of the EPC states.
IP5 Statistics Report 2013 Chapter 3 - Worldwide patenting activity
32
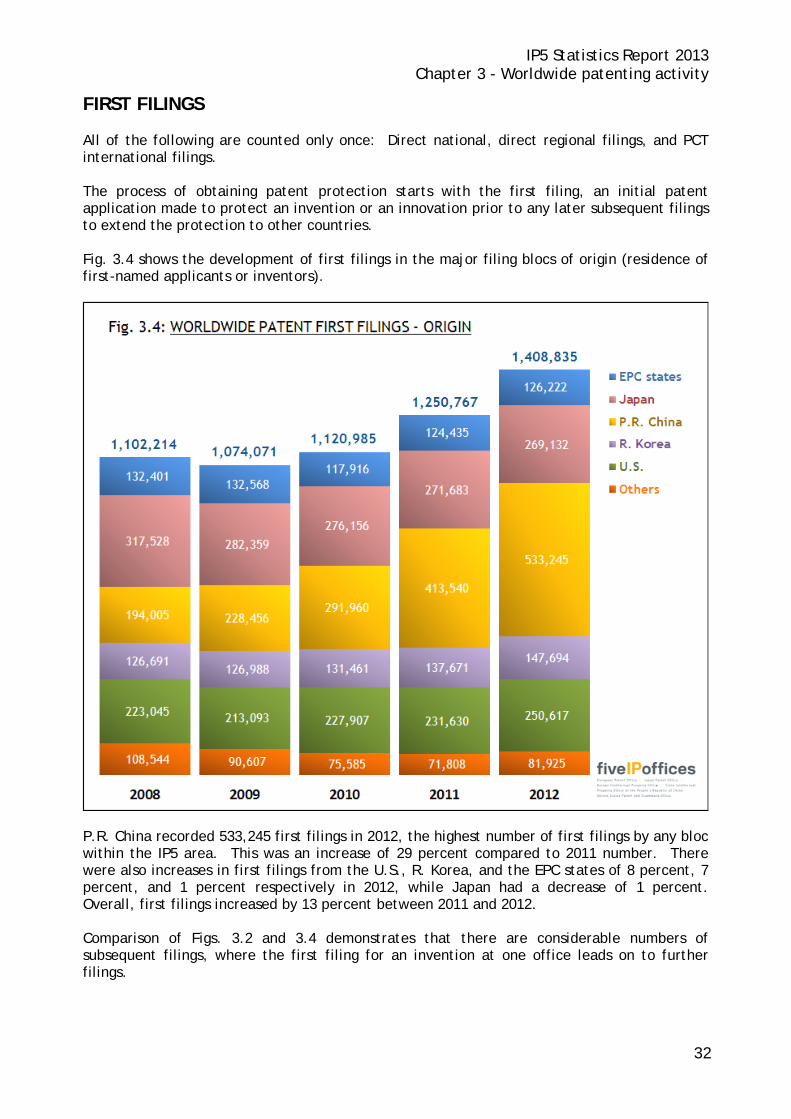
FIRST FILINGS All of the following are counted only once: Direct national, direct regional filings, and PCT international filings. The process of obtaining patent protection starts with the first filing, an initial patent application made to protect an invention or an innovation prior to any later subsequent filings to extend the protection to other countries. Fig. 3.4 shows the development of first filings in the major filing blocs of origin (residence of first-named applicants or inventors).
P.R. China recorded 533,245 first filings in 2012, the highest number of first filings by any bloc within the IP5 area. This was an increase of 29 percent compared to 2011 number. There were also increases in first filings from the U.S., R. Korea, and the EPC states of 8 percent, 7 percent, and 1 percent respectively in 2012, while Japan had a decrease of 1 percent. Overall, first filings increased by 13 percent between 2011 and 2012. Comparison of Figs. 3.2 and 3.4 demonstrates that there are considerable numbers of subsequent filings, where the first filing for an invention at one office leads on to further filings.
IP5 Statistics Report 2013 Chapter 3 - Worldwide patenting activity
33
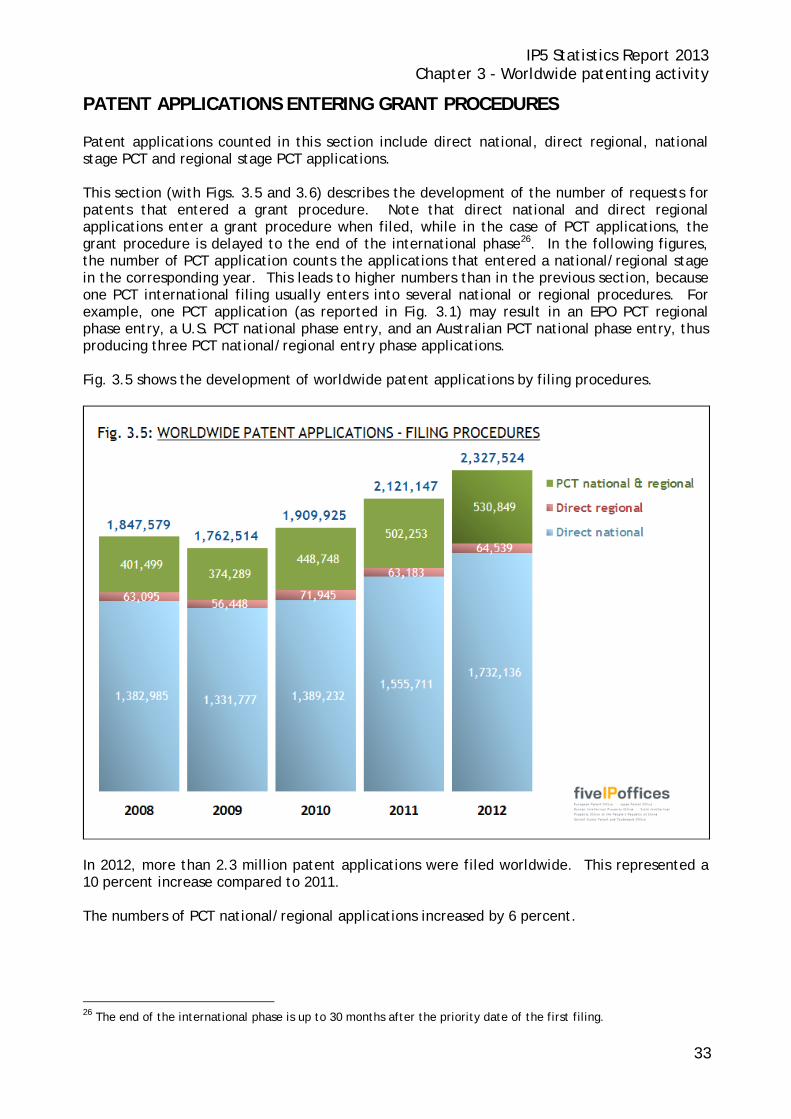
PATENT APPLICATIONS ENTERING GRANT PROCEDURES Patent applications counted in this section include direct national, direct regional, national stage PCT and regional stage PCT applications. This section (with Figs. 3.5 and 3.6) describes the development of the number of requests for patents that entered a grant procedure. Note that direct national and direct regional applications enter a grant procedure when filed, while in the case of PCT applications, the grant procedure is delayed to the end of the international phase26. In the following figures, the number of PCT application counts the applications that entered a national/regional stage in the corresponding year. This leads to higher numbers than in the previous section, because one PCT international filing usually enters into several national or regional procedures. For example, one PCT application (as reported in Fig. 3.1) may result in an EPO PCT regional phase entry, a U.S. PCT national phase entry, and an Australian PCT national phase entry, thus producing three PCT national/regional entry phase applications. Fig. 3.5 shows the development of worldwide patent applications by filing procedures.
In 2012, more than 2.3 million patent applications were filed worldwide. This represented a 10 percent increase compared to 2011. The numbers of PCT national/regional applications increased by 6 percent.
26 The end of the international phase is up to 30 months after the priority date of the first filing.
IP5 Statistics Report 2013 Chapter 3 - Worldwide patenting activity
34
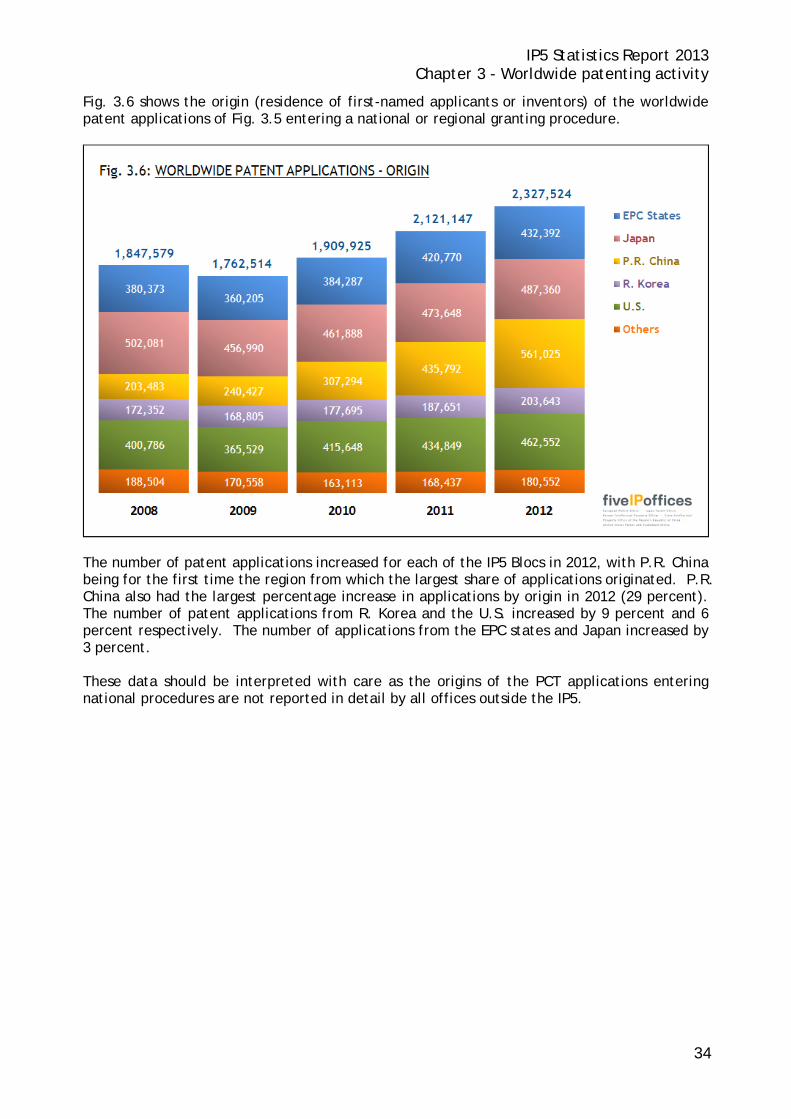
Fig. 3.6 shows the origin (residence of first-named applicants or inventors) of the worldwide patent applications of Fig. 3.5 entering a national or regional granting procedure.
The number of patent applications increased for each of the IP5 Blocs in 2012, with P.R. China being for the first time the region from which the largest share of applications originated. P.R. China also had the largest percentage increase in applications by origin in 2012 (29 percent). The number of patent applications from R. Korea and the U.S. increased by 9 percent and 6 percent respectively. The number of applications from the EPC states and Japan increased by 3 percent. These data should be interpreted with care as the origins of the PCT applications entering national procedures are not reported in detail by all offices outside the IP5.
IP5 Statistics Report 2013 Chapter 3 - Worldwide patenting activity
35
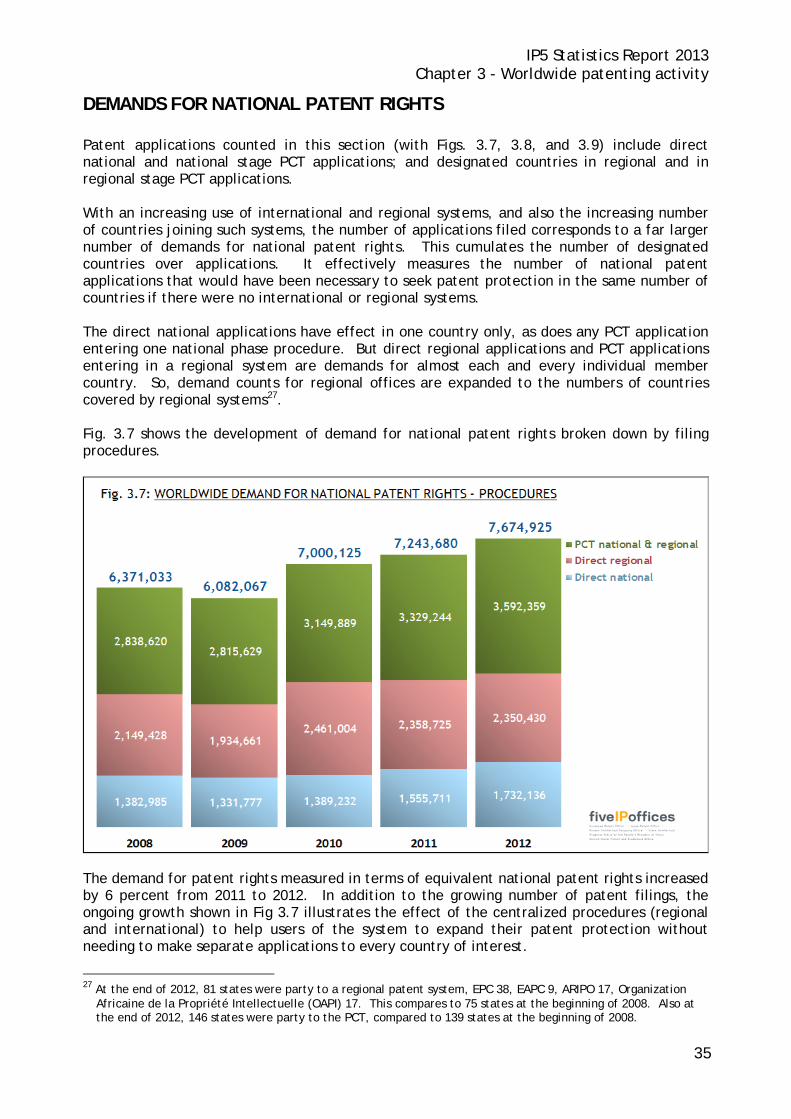
DEMANDS FOR NATIONAL PATENT RIGHTS Patent applications counted in this section (with Figs. 3.7, 3.8, and 3.9) include direct national and national stage PCT applications; and designated countries in regional and in regional stage PCT applications. With an increasing use of international and regional systems, and also the increasing number of countries joining such systems, the number of applications filed corresponds to a far larger number of demands for national patent rights. This cumulates the number of designated countries over applications. It effectively measures the number of national patent applications that would have been necessary to seek patent protection in the same number of countries if there were no international or regional systems. The direct national applications have effect in one country only, as does any PCT application entering one national phase procedure. But direct regional applications and PCT applications entering in a regional system are demands for almost each and every individual member country. So, demand counts for regional offices are expanded to the numbers of countries covered by regional systems27. Fig. 3.7 shows the development of demand for national patent rights broken down by filing procedures.
The demand for patent rights measured in terms of equivalent national patent rights increased by 6 percent from 2011 to 2012. In addition to the growing number of patent filings, the ongoing growth shown in Fig 3.7 illustrates the effect of the centralized procedures (regional and international) to help users of the system to expand their patent protection without needing to make separate applications to every country of interest.
27 At the end of 2012, 81 states were party to a regional patent system, EPC 38, EAPC 9, ARIPO 17, Organization
Africaine de la Propriété Intellectuelle (OAPI) 17. This compares to 75 states at the beginning of 2008. Also at the end of 2012, 146 states were party to the PCT, compared to 139 states at the beginning of 2008.
IP5 Statistics Report 2013 Chapter 3 - Worldwide patenting activity
36
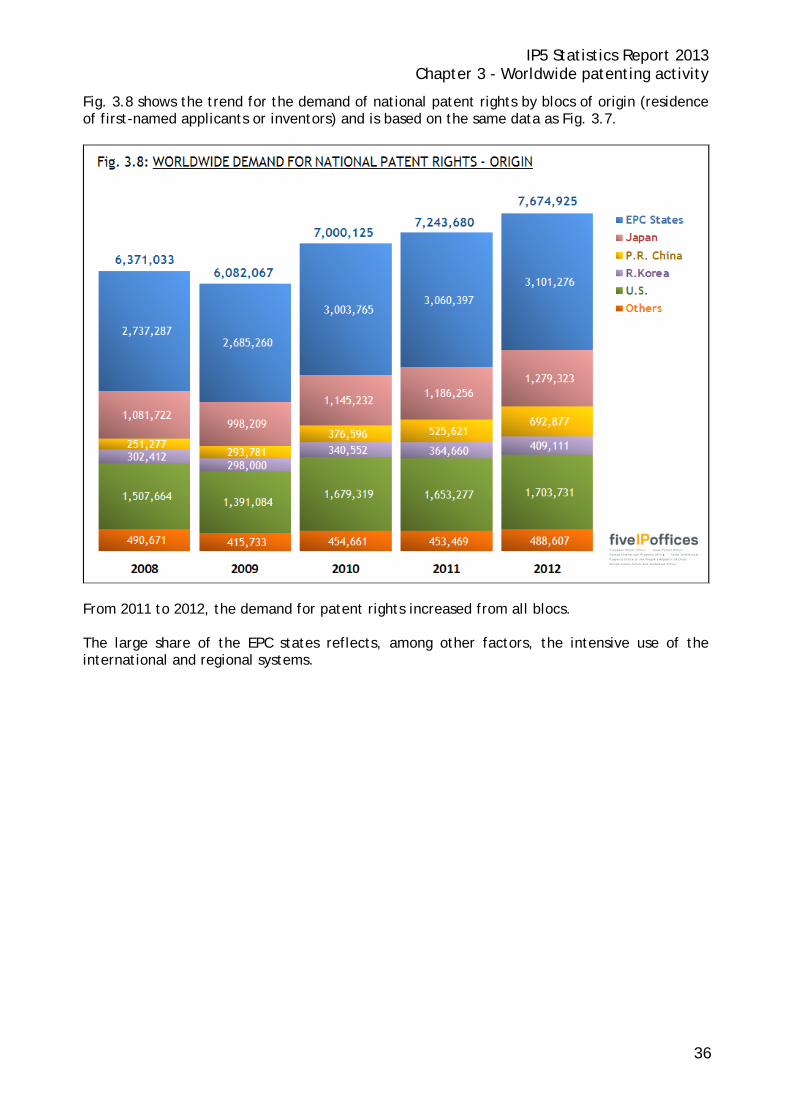
Fig. 3.8 shows the trend for the demand of national patent rights by blocs of origin (residence of first-named applicants or inventors) and is based on the same data as Fig. 3.7.
From 2011 to 2012, the demand for patent rights increased from all blocs. The large share of the EPC states reflects, among other factors, the intensive use of the international and regional systems.
IP5 Statistics Report 2013 Chapter 3 - Worldwide patenting activity
37
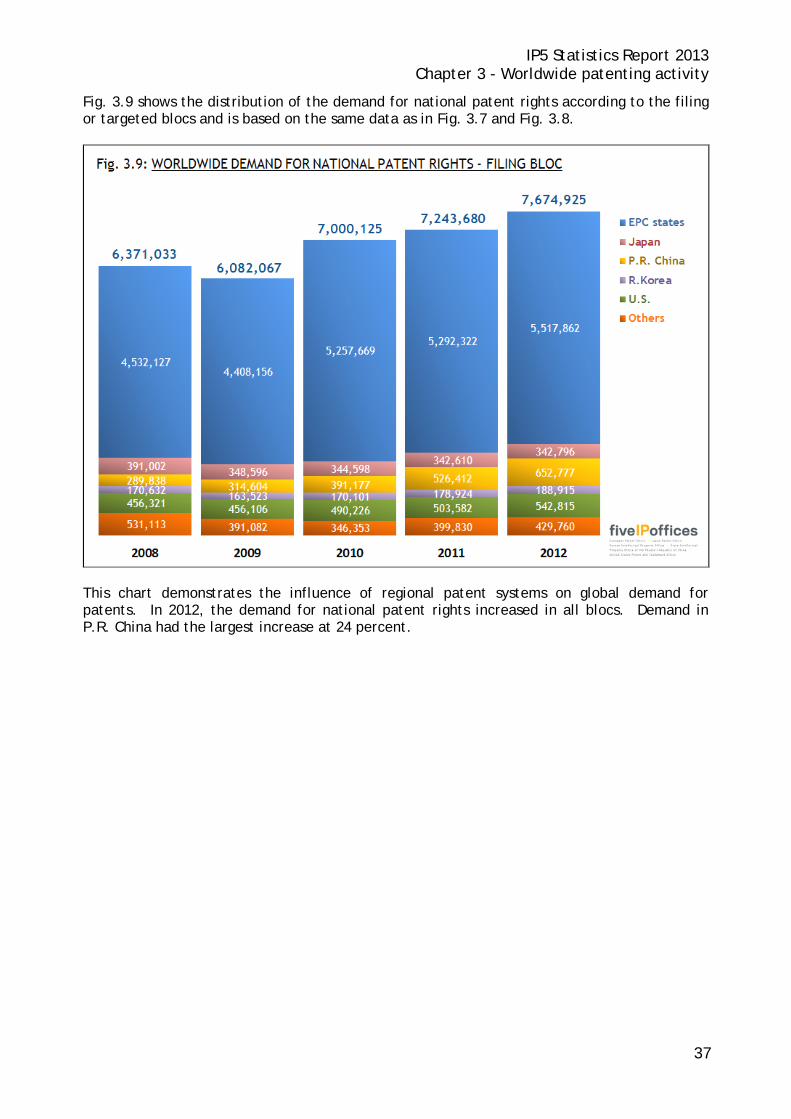
Fig. 3.9 shows the distribution of the demand for national patent rights according to the filing or targeted blocs and is based on the same data as in Fig. 3.7 and Fig. 3.8.
This chart demonstrates the influence of regional patent systems on global demand for patents. In 2012, the demand for national patent rights increased in all blocs. Demand in P.R. China had the largest increase at 24 percent.

IP5 Statistics Report 2013 Chapter 3 - Worldwide patenting activity
38
PATENT GRANTS The development of the use of patents is shown in this section in terms of grants. Fig. 3.10 displays the cumulative numbers of patents granted in each of the blocs.
The number of patent grants increased for each of the IP5 Blocs in 2012. The largest percentage increase by origin in 2012 came from P.R. China (26 percent). For R. Korea, Japan, the U.S., and the EPC states, there were also increases of 20 percent, 15 percent, 13 percent, and 4 percent respectively. The data for Others should only be compared between years with care. The changes from year to year may reflect different numbers of countries reporting their count of grants as well as changes in the numbers of grants. Patent grants are counted only once per office, although the same invention may lead to grants at several offices. However, each grant action by a regional office (e.g. the EPO) can lead to as many national patents as the number of member states that have been designated28. This has an effect only in the EPC states and Others, as shown in the following Fig. 3.11.
28 National patents can also be created in other states that have extension agreements with the EPC states.
IP5 Statistics Report 2013 Chapter 3 - Worldwide patenting activity
39
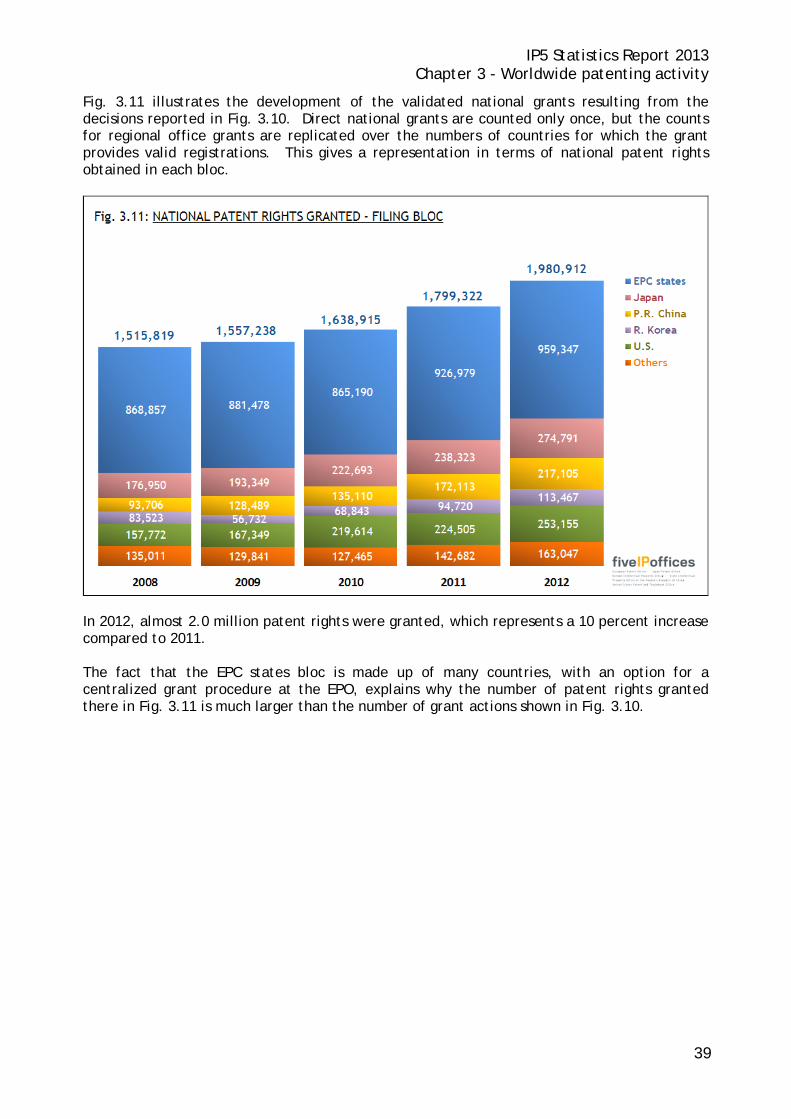
Fig. 3.11 illustrates the development of the validated national grants resulting from the decisions reported in Fig. 3.10. Direct national grants are counted only once, but the counts for regional office grants are replicated over the numbers of countries for which the grant provides valid registrations. This gives a representation in terms of national patent rights obtained in each bloc.
In 2012, almost 2.0 million patent rights were granted, which represents a 10 percent increase compared to 2011. The fact that the EPC states bloc is made up of many countries, with an option for a centralized grant procedure at the EPO, explains why the number of patent rights granted there in Fig. 3.11 is much larger than the number of grant actions shown in Fig. 3.10.
IP5 Statistics Report 2013 Chapter 3 - Worldwide patenting activity
40
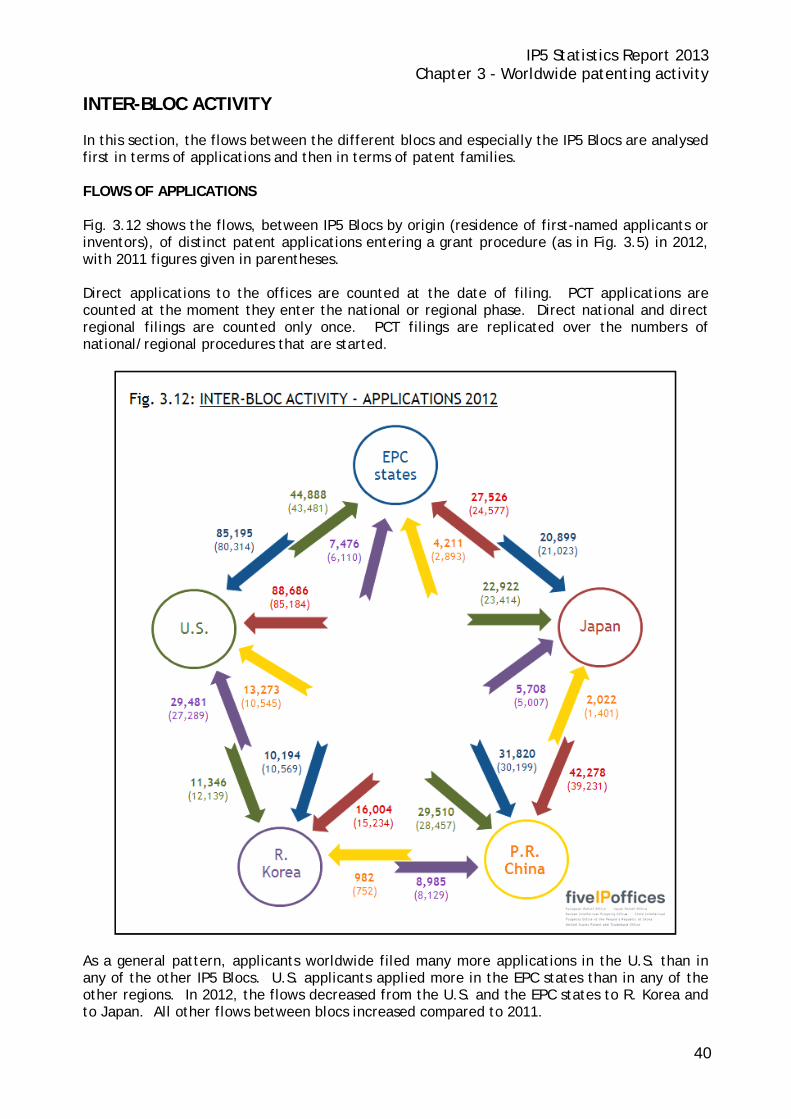
INTER-BLOC ACTIVITY In this section, the flows between the different blocs and especially the IP5 Blocs are analysed first in terms of applications and then in terms of patent families. FLOWS OF APPLICATIONS Fig. 3.12 shows the flows, between IP5 Blocs by origin (residence of first-named applicants or inventors), of distinct patent applications entering a grant procedure (as in Fig. 3.5) in 2012, with 2011 figures given in parentheses. Direct applications to the offices are counted at the date of filing. PCT applications are counted at the moment they enter the national or regional phase. Direct national and direct regional filings are counted only once. PCT filings are replicated over the numbers of national/regional procedures that are started.
As a general pattern, applicants worldwide filed many more applications in the U.S. than in any of the other IP5 Blocs. U.S. applicants applied more in the EPC states than in any of the other regions. In 2012, the flows decreased from the U.S. and the EPC states to R. Korea and to Japan. All other flows between blocs increased compared to 2011.
IP5 Statistics Report 2013 Chapter 3 - Worldwide patenting activity
41
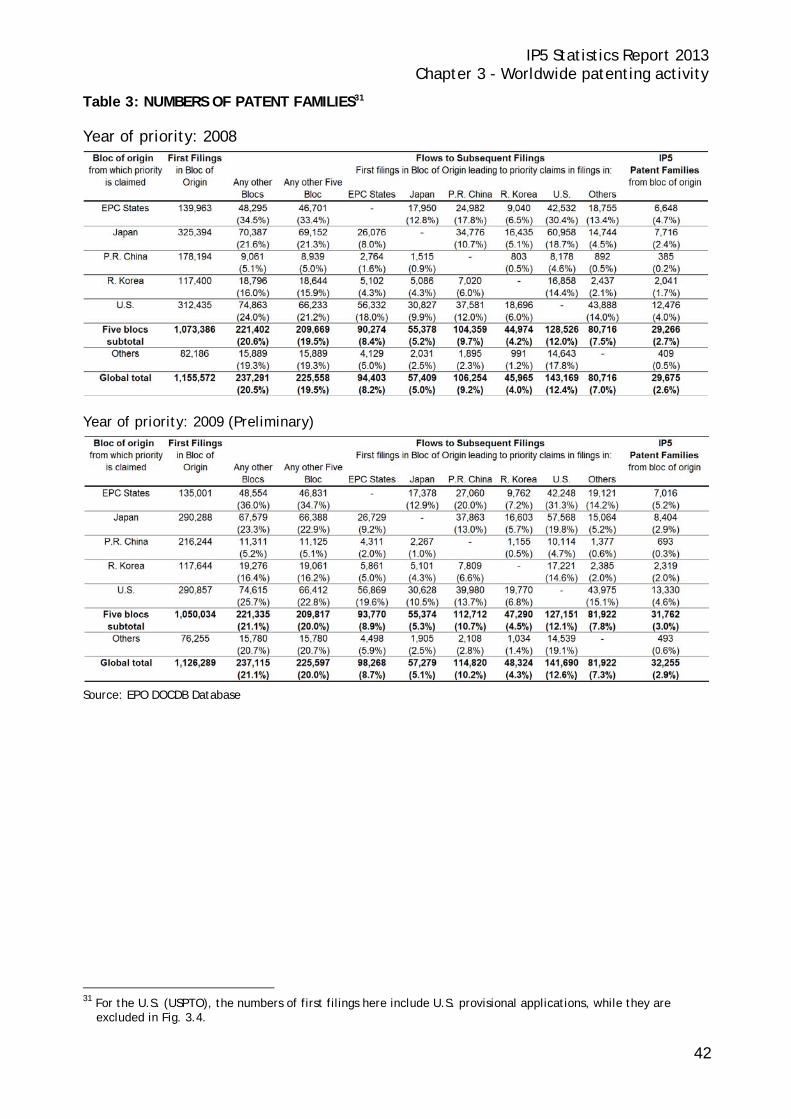
PATENT FAMILIES A patent family is a group of patent filings that claim the priority of a single first filing. The information in this section on the flows of patent families between blocs was obtained from the DOCument DataBase (DOCDB)29 of worldwide patent publications. The statistics are based on the references to priorities that were given in published applications and grants. Where no reference to a priority appears in an application, it is considered to be a first filing. Otherwise it is a subsequent filing. This differs to some extent from other statistics in this chapter that are based on counts of filed patent applications provided by individual Patent offices, where domestic applications are used as a proxy for first filings. Here, the number of applications that is counted is based on the bloc of the patent office for which priority was claimed, or the bloc of residence of the applicant where that patent office was not known. Due to the delay in publication (relative to the time of filing), patent families counts can only be reported with a degree of accuracy after several years have passed. It should be noted that the definition of a patent family changed slightly as from the 2012 edition, in that groups that consist entirely of utility model filings are now excluded30. The following Table 3 shows the numbers of first filings per bloc and details of flows of patent families between blocs for the priority years 2008 and 2009. Each percentage under a number translates this number into a proportion of the number of first filings made in the initial filing bloc where the priority filings were made.
29 DOCDB is the EPO master documentation database with worldwide coverage containing bibliographic data,
abstracts and citations (but no full text). 30 See Chapter 6 for a description and statistics on utility models.
IP5 Statistics Report 2013 Chapter 3 - Worldwide patenting activity
42
Table 3: NUMBERS OF PATENT FAMILIES31 Year of priority: 2008
Year of priority: 2009 (Preliminary)
Source: EPO DOCDB Database
31 For the U.S. (USPTO), the numbers of first filings here include U.S. provisional applications, while they are
excluded in Fig. 3.4.
IP5 Statistics Report 2013 Chapter 3 - Worldwide patenting activity
43
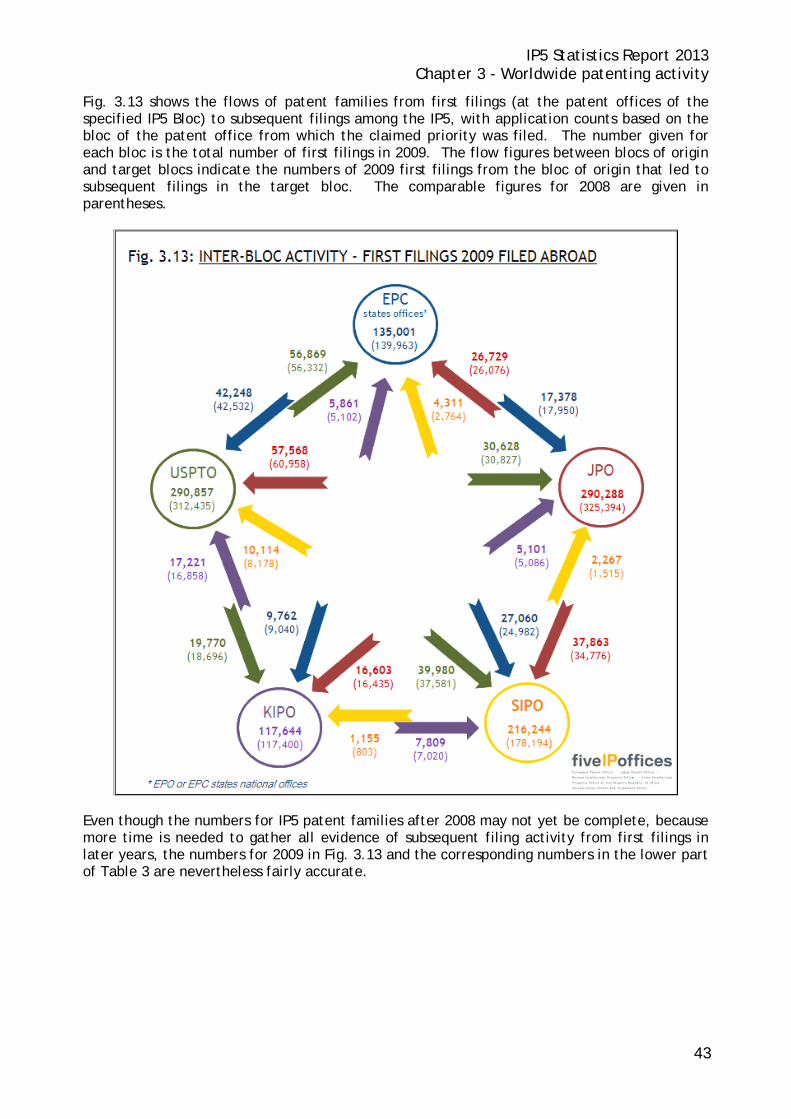
Fig. 3.13 shows the flows of patent families from first filings (at the patent offices of the specified IP5 Bloc) to subsequent filings among the IP5, with application counts based on the bloc of the patent office from which the claimed priority was filed. The number given for each bloc is the total number of first filings in 2009. The flow figures between blocs of origin and target blocs indicate the numbers of 2009 first filings from the bloc of origin that led to subsequent filings in the target bloc. The comparable figures for 2008 are given in parentheses.
Even though the numbers for IP5 patent families after 2008 may not yet be complete, because more time is needed to gather all evidence of subsequent filing activity from first filings in later years, the numbers for 2009 in Fig. 3.13 and the corresponding numbers in the lower part of Table 3 are nevertheless fairly accurate.
IP5 Statistics Report 2013 Chapter 3 - Worldwide patenting activity
44
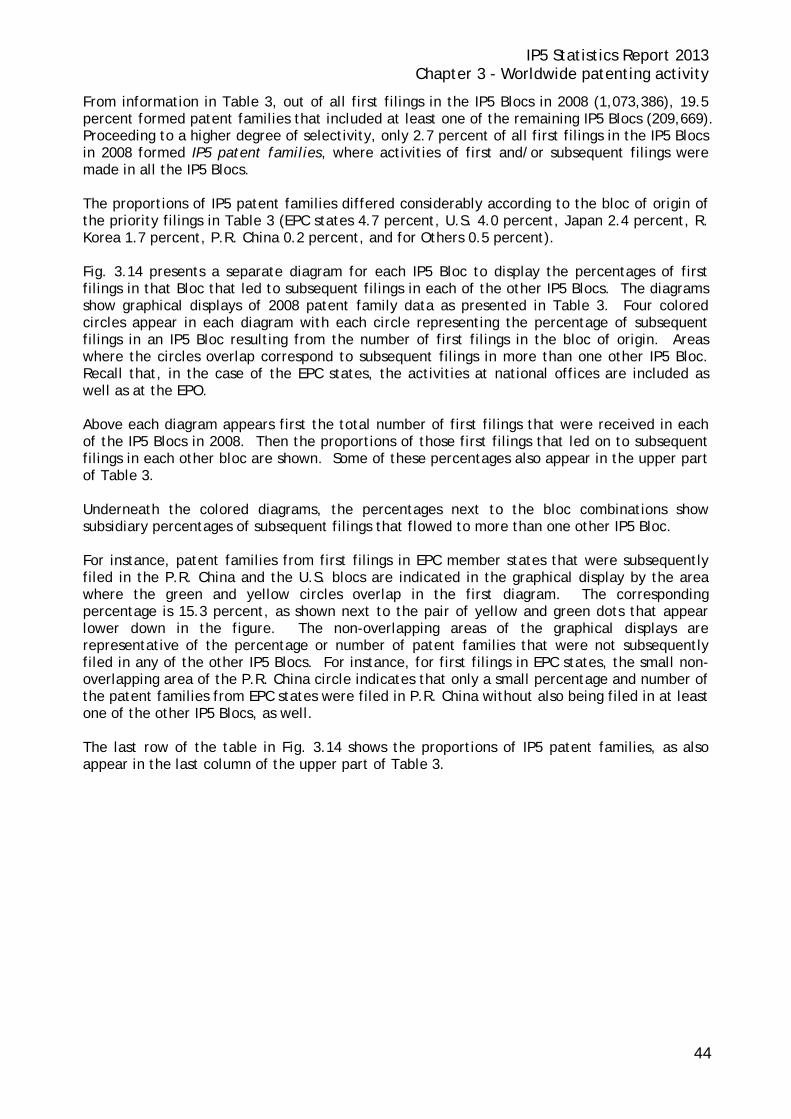
From information in Table 3, out of all first filings in the IP5 Blocs in 2008 (1,073,386), 19.5 percent formed patent families that included at least one of the remaining IP5 Blocs (209,669). Proceeding to a higher degree of selectivity, only 2.7 percent of all first filings in the IP5 Blocs in 2008 formed IP5 patent families, where activities of first and/or subsequent filings were made in all the IP5 Blocs. The proportions of IP5 patent families differed considerably according to the bloc of origin of the priority filings in Table 3 (EPC states 4.7 percent, U.S. 4.0 percent, Japan 2.4 percent, R. Korea 1.7 percent, P.R. China 0.2 percent, and for Others 0.5 percent). Fig. 3.14 presents a separate diagram for each IP5 Bloc to display the percentages of first filings in that Bloc that led to subsequent filings in each of the other IP5 Blocs. The diagrams show graphical displays of 2008 patent family data as presented in Table 3. Four colored circles appear in each diagram with each circle representing the percentage of subsequent filings in an IP5 Bloc resulting from the number of first filings in the bloc of origin. Areas where the circles overlap correspond to subsequent filings in more than one other IP5 Bloc. Recall that, in the case of the EPC states, the activities at national offices are included as well as at the EPO. Above each diagram appears first the total number of first filings that were received in each of the IP5 Blocs in 2008. Then the proportions of those first filings that led on to subsequent filings in each other bloc are shown. Some of these percentages also appear in the upper part of Table 3. Underneath the colored diagrams, the percentages next to the bloc combinations show subsidiary percentages of subsequent filings that flowed to more than one other IP5 Bloc. For instance, patent families from first filings in EPC member states that were subsequently filed in the P.R. China and the U.S. blocs are indicated in the graphical display by the area where the green and yellow circles overlap in the first diagram. The corresponding percentage is 15.3 percent, as shown next to the pair of yellow and green dots that appear lower down in the figure. The non-overlapping areas of the graphical displays are representative of the percentage or number of patent families that were not subsequently filed in any of the other IP5 Blocs. For instance, for first filings in EPC states, the small non-overlapping area of the P.R. China circle indicates that only a small percentage and number of the patent families from EPC states were filed in P.R. China without also being filed in at least one of the other IP5 Blocs, as well. The last row of the table in Fig. 3.14 shows the proportions of IP5 patent families, as also appear in the last column of the upper part of Table 3.
IP5 Statistics Report 2013 Chapter 3 - Worldwide patenting activity
45
IP5 Statistics Report 2013 Chapter 3 - Worldwide patenting activity
46
From Fig. 3.14 and Table 3, the 2008 data indicate that the U.S. market may be considered as the most important foreign market for the other IP5 Blocs since, for each of those blocs, subsequent applications in the U.S. represent the highest percentages among target blocs. The percentages of subsequent applications filed in the U.S. following 2008 first filings in the EPC member states, Japan, P.R. China, and R. Korea are 30.4 percent, 18.7 percent, 4.6 percent, and 14.4 percent respectively. The second most important market for the other IP5 Blocs is P.R. China. In general, first filings in the EPC member states tend to result in a higher percentage of subsequent filings elsewhere, as compared to the first filings in other IP5 Blocs as seen in Fig. 3.14 and the first data row of Table 3. Japan has the highest number of first filings (325,394 in 2008), although the percentages that led to subsequent filings in R. Korea and P.R. China are lower than for first filings in the U.S. This makes the sizes of the flows (numbers of patent families) from Japan to R. Korea and P.R. China comparable in size to the numbers from U.S., while the size of the flow to the EPC states is considerably lower. For the first filings in P.R. China, the percentage of subsequent applications filed in the U.S. (4.6 percent) is the largest. The percentage that was filed in both the EPC member states and Japan is about 0.5 percent. The percentage of subsequent applications that were filed in the EPC member states, Japan, and the U.S. is also about 0.5 percent, indicating that most of the subsequent applications filed in both the EPC states and Japan have also been filed in the U.S. Despite the low proportions of first filings in P.R. China that led to subsequent applications anywhere else, rapidly growing numbers of first filings have resulted in continued growth of the absolute numbers of patent families flowing out to other IP5 Blocs, as can be seen by comparing the 2008 and the preliminary 2009 data displayed in Table 3 (8,939 compared to 11,125 respectively). For the first filings in R. Korea, as with the other blocs, the percentage of subsequent applications filed in the U.S. (14.4 percent) is the largest, followed by P.R. China (6.0 percent). In addition, the percentage of subsequent applications filed in the EPC member states is 4.3 percent. This last percentage is close to the percentage of subsequent applications filed in both the EPC member states and the U.S. together (4.1 percent), indicating that most of the subsequent applications filed in the EPC member states have been also filed in the U.S. Among the first filings in the U.S., the percentage of subsequent applications filed in other blocs is the highest in the EPC member states (18.0 percent). The percentage of subsequent applications filed in P.R. China (12.0 percent) is the next highest, although Japan is not far behind at 9.9 percent.
IP5 Statistics Report 2013 Chapter 3 - Worldwide patenting activity
47
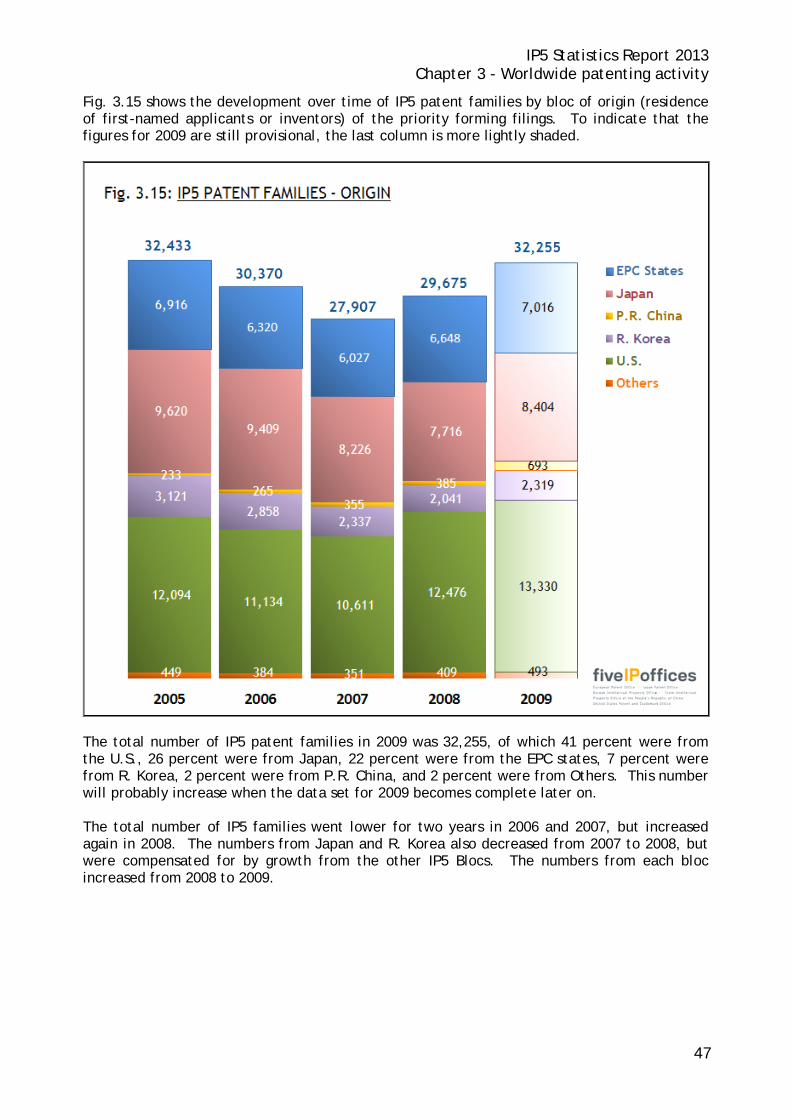
Fig. 3.15 shows the development over time of IP5 patent families by bloc of origin (residence of first-named applicants or inventors) of the priority forming filings. To indicate that the figures for 2009 are still provisional, the last column is more lightly shaded.
The total number of IP5 patent families in 2009 was 32,255, of which 41 percent were from the U.S., 26 percent were from Japan, 22 percent were from the EPC states, 7 percent were from R. Korea, 2 percent were from P.R. China, and 2 percent were from Others. This number will probably increase when the data set for 2009 becomes complete later on. The total number of IP5 families went lower for two years in 2006 and 2007, but increased again in 2008. The numbers from Japan and R. Korea also decreased from 2007 to 2008, but were compensated for by growth from the other IP5 Blocs. The numbers from each bloc increased from 2008 to 2009.