chapter 3 probingmolecularaggregation in bulky...
TRANSCRIPT

Chapter3 Probing Aggregation Properties
Chapter 3
Probing Molecular Aggregation in Bulky PPVs,OPVs and Their Blends
NllST 93

Chapter3 Probing Aggyegation Properties
3.1. Introduction
The photophysics of conjugated polymers especially PPVs, made them
promising candidates in the optoelectronic industry soon after the discovery of
light emitting phenomena. I-6 Although there are a lot of salutary characteristics
for PPVs like color-tuning ability/-13 solubility, good processabilityl4-20 etc.,
one of the cursed problems over many versatile features of them is its lower
luminescence quantum efficiency in the solid state. This is mainly due to the
very high tendency of conjugated polymer chains towards aromatic 'It-'It
interactions, which lead to the formation of weakly emissive aggregated species
predominantly in the solid state (in films).21-30 However, in some cases these
molecular aggregates enhances the cross linking and luminescent properties,
which found applications in coating and opto-electronic industry.31,32 Recently,
Bhongale et al. have reported the enhanced emission from the fluorescent
organic nanoparticles of 1,4-di-[(E)-2-phenyl-I-propenyl]benzene (PPB) which
were prepared by the re-precipitation method.31 The fluorescent intensity was
found to be enhanced as the size of the nanoparticles increases. This
enhancement in the fluorescent emission was explained due to the nearly planar
conformation of PPB and the formation of herringbone type aggregates. Very
recently, another group also shown gel formation in the well known MEH-PPV
by the addition of large amount of alkane solvents.32They describe the gelation
phenomena as a result of the interchain cross linking via the interaction
between neighboring alkoxy chains with the alkane solvents (see scheme 3.1).
Eventhough the molecular aggregates show many promising properties as
mentioned above, most of them are lower energy non-emissive species in
which the excitation energy of the highly luminescent excimers get trapped
during the radiative emission processes. Recent studies have shown that the
intra- and inter-chain interactions playa major role in the physical origin of
molecular aggregation phenomena?3-25 In most cases, it acts as luminescent
quenching sites, therefore, control of 'It-stack induced molecular aggregation in
the polymer chain is an important task in the development of highly emissive
NIIST 94

Chapter3 Probing Aggregation Properties
conjugated polymers and also making the ideal polymer luminescent
optoelectronic devices in reality.
IclllOW .. lolly III<M-cllaln MEH4'PV ....... k~.~ .... _..,/ -c.-.
'~;. .
J"__ .It.olly ald...._
(Small amount<30%)
Adding nonaneI
(e)
Addong nonaneI
(l<llge( amount>40%)
InDCB
Scheme 3.1. Schematic representation ofthe physical cross linking between
MEH-PPV and alkane (nonane) solution (adoptedfrom ref 32).
Several methods have been adopted to reduce the interchain interactions,
which involves the incorporation of cis-vinylene linkages in the polymer
backbone33-36
, polymer blends 37-4°and introduction of bulky anchoring groups
41-45 etc. (explained in chapter 1 and chapter 2 in detail). The control of
molecular aggregation through inter-chain separation via bulky anchoring
groups were found to be very attractive since one can easily control the
molecular aggregation through space without disturbing the electronic/device
properties of the parent polymer. Reports of PPVs based on the bulky
anchoring groups showed additional advantages that they also enhances the
glass transition temperature (Tg) of the PPV backbone which is an important
parameter for long operating lifetime of devices.46 However, it is surprising to
notice that most of the reports on bulky PPVs have focused on the structural
parameters and so far not much effort have been paid to trace the aggregation
behavior of these emerging bulky conjugated materials. This is partially due to
NIIST 95

Chapter3 Probing Aggregation Properties
the poor solubility of the efficient bulky-PPYs such as adamantane and
cholesteryl rings47-50 in common organic solvents which hampered the
application of spectroscopic techniques to study the aggregation properties in
solution. Therefore, it is very important to carry out systematic spectroscopic
studies to probe the origin of the molecular aggregates in bulky conducting
polymers, which will provide valuable information for the future development
of new highly luminescent materials.
The formation of molecular aggregates can be understood by the choice
of good/poor solvents, varying the solution concentration or temperature,
thermal annealing process etc.51-54By varying the external stimuli, the
photophysical properties of the polymer chains found to alter according to the
extended and coiled conformation the polymer chains adopt. 55 This will
usually result either in a red shifted peak or an additional peak in the absorption
spectra. It was widely noticed that chains in the well-stacked regions exhibits
red shifted spectra with low luminescent quantum yield while the chains in the
poorly packed region show bluer spectra with high quantum yield.22 As already
discussed in the second chapter, the introduction of TCD-units into the PPY
backbone reduces the molecular aggregation and enhances the solution and
solid state photoluminescence characteristics. This chapter mainly deals with
the investigation of the molecular aggregation properties of the soluble TCD
substituted bulky-PPYs in combination with the well-studied poly(2-methoxy
5-ethylhexyloxy)-1,4-phenylenevinylene (MEH-PPY). A random copolymer of
MEH-PPY with 60 % of symmetrically TCD substituted polymer was chosen
for the above purpose due to its high solubility, good molecular weight and
similar photophysical properties as that of its partially soluble bulky-TCD-PPY
homo-polymer (BTCD-PPY). Structurally identical two oligo
phenylenevinylenes (OPYs) bearing either (methoxy-ethylhexyloxy) (MEH) or
TeD units were also utilized as model compounds for the aggregation studies.
Absorption and photoluminescence (PL) spectroscopic techniques were
employed as tools to trace the aggregation properties of these materials in
NIIST 96

Chapter3 Probing Aggregation Properties
solvents such as toluene, tetrahydrofuran (THF), THF+methanol or THF+water
combinations as well as in the solid state. Further, the effect of bulky TCD
anchoring units on the luminescence properties of PPV backbone were also
investigated by making MEH-PPV and OPV binary blends. The composition of
the MEH-PPV and OPVs were varied from 0 to 100 %. Through selective PL
excitation, both the effect of oligomer-to-polymer energy transfer and
luminescent enhancement in MEH-PPV via inter-chain separation were
investigated. Time resolved fluorescence decay measurements were also
carried out to study the luminescent decay life time of bulky polymers,
oligomers and their binary blends.
3.2. Experimental Methods
3.2.1. Materials: 1,8-Tricyclodecanemethanol (TCD) was donated by Celanese
Chemicals & Co, Fluorescence standards Rhodamine-6G and Quinine sulfate
were purchased from Aldrich Chemicals and used without further purification.
A relatively low molecular weight of poly(2-methoxy-5-(2-ethylhexyloxy))
1,4-phenylenevinylene (MEH-PPV) (Mn = 20,300 and Mw= 70,100) was
prepared for the present study and the chemical structures of the polymers and
DPVs selected for the studies is given in scheme 3.2. Synthesis and structural
details were provided in chapter 2. The symmetrically TCD-substituted
copolymer of MEH-PPV, poly[(2-methoxy-5-(2-ethylhexyloxy))-I,4
phenylenevinylene-co-(2,5-bis( I ,8-tricyclodecanemethyleneoxy)-1 ,4
phenylenevinylene] (BTCD-60) (with 60 % TCD content, Mn = 9,300 and
Mw= 23,900) was also used. It possesses high molecular weight, good
solubility in common organic solvents and the bulky BTCD-60 has
photoluminescent properties similar to that of its bulky homopolymer.
3.2.2. General Procedures: For the photo physical studies, all the solvents
were purified according to the standard procedures prior to use. The samples
were completely dissolved by ultra sonication and the homogenous solutions
thus obtained were used for further studies. The absorption and emission
NllST 97

Chapter3 Probing Aggregation Properties
studies were done by a Perkin-Elmer Lambda 35 UV-Visible
spectrophotometer and Spex-Fluorolog DM3000F spectrofluorometer with a
double grating 0.22-m Spex 1680 monochromator and a 450-W Xe lamp as the
excitation source using the front-face mode. For the solid state spectra,
polymers thin films (10-100 J.lM) were casted from chloroform solution on
glass substrates. The quantum yields of the PPVs and OPVs were determined
using Rhodamine 60 in water (~=0.95) and quinine sulfate in 0.1 M H2S04 (~=
0.546) as standards, respectively. The solvent induced aggregation studies
were done using methanol (MeOH) and water as nonsolvents respectively for
PPVs and OPVs and by making different solvent/nonsolvent combinations. The
absorbance or optical density (O.D) of the solutions was maintained at 0.1 for
the photo physical studies. The stock solution was prepared by dissolving the
polymer or oligomer in tetrahydrofuran (THF) and various combinations of
tetrahydrofuran and methanol/water of the samples were prepared by
maintaining the absorbance ~ 0.1 at the absorption maxima. Temperature
dependant absorbance studies were done in THF/methanol or THF/water
mixture heating and cooling were done by the help of Perkin Elmer PTP-l
Peltier cooling system. The fluorescence lifetime was measured using an IBH
FlouroCube Time-correlated picosecond single photon counting system
(TCSPC). Solutions and films were excited with a pulsed diode laser 401nm
<100 ps pulse duration with a repetition rate of 1 MHz. The detection system
consists of a microchannel plate photomultiplier (5000U-09B, Hamamatsu)
with a 38.6 ps response time coupled to a monochromator (5000M) and TCSPC
electronics (DataStation Hub including Hub-NL, NanoLED controller and
preinstalled Fluorescence Measurement and Analysis Studio (FMAS)
software). The fluorescence lifetime values were determined by deconvoluting
the data with exponential decay using DAS6 decay analysis software. The
quality of the fit has been judged by the fitting parameters such as X2<1 as well
as the visual inspection of the residuals.
NIIST 98
Chapter3 Probing Aggregation Properties
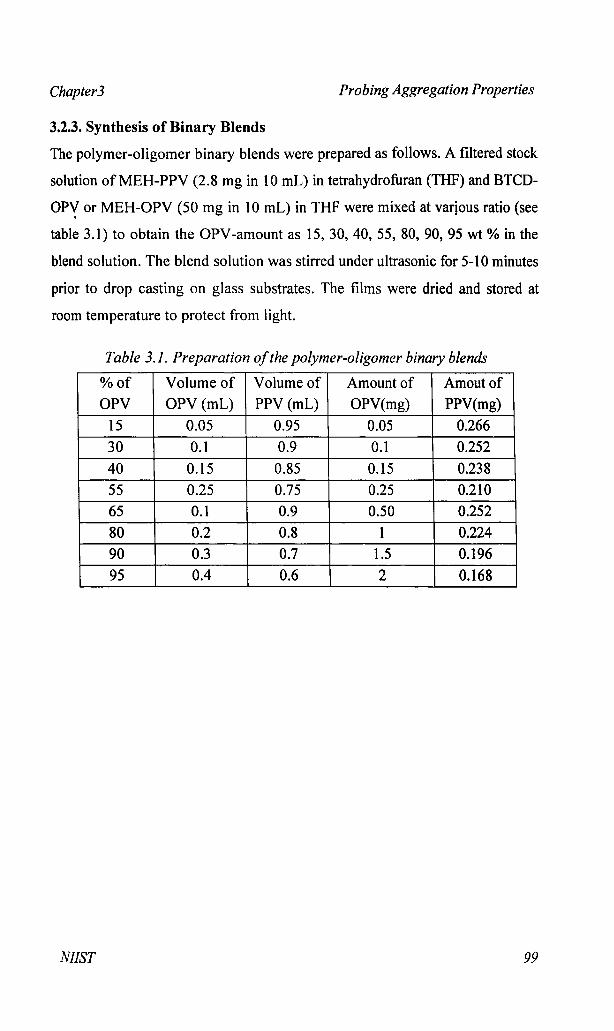
3.2.3. Synthesis of Binary Blends
The polymer-oligomer binary blends were prepared as follows. A filtered stock
solution ofMEH-PPV (2.8 mg in 10 mL) in tetrahydrofuran (THF) and BTCD
OP-Y or MEH-OPV (50 mg in 10 mL) in THF were mixed at varjous ratio (see
table 3.1) to obtain the OPV-amount as 15,30,40,55, 80,90,95 wt % in the
blend solution. The blend solution was stirred under ultrasonic for 5-10 minutes
prior to drop casting on glass substrates. The films were dried and stored at
room temperature to protect from light.
Table 3.1. Preparation ofthe polymer-oligomer binary blends
%of Volume of Volume of Amount of Amoutof
OPV OPV (mL) PPV (mL) OPV(mg) PPV(mg)
15 0.05 0.95 0.05 0.266
30 0.1 0.9 0.1 0.252
40 0.15 0.85 0.15 0.238
55 0.25 0.75 0.25 0.210
65 0.1 0.9 0.50 0.252
80 0.2 0.8 1 0.224
90 0.3 0.7 1.5 0.196
95 0.4 0.6 2 0.168
N1IST 99

Chapter3
3.3. Results and Discussion
Probing Aggregation Properties
The structures of the polymers and oligomers selected for the present
study were shown in scheme 3.2. Their detailed structural characterization and
thermal studies were given in chapter 2. In the present chapter, more effort has
been taken to understand and analyze the molecular aggregation properties of
these new classes of bulky 7t-conjugated materials.
MEH-PPV
MEH-OPV
Scheme 3.2. Structure ofthe polymers and oligomers.
3.3.1. Solvent Dependant Photophysical Properties
The photophysical properties (absorption and emission) of the polymers
were studied in solution as well as in the solid state (in film). The absorption
and emission spectra of the polymers were recorded in tetrahydrofuran (THF)
and toluene to study the influence of solvents on the polymer structure (see
figure 3.1). The absorption spectra of both polymers showed 6-7 nm red shift in
toluene compared to that in THF (see table 3.2). It is due to the fact that
aromatic hydrocarbon solvents solvate the PPV backbone in such a way to
adopt closer chain interactions via 7t-stacking which account for the req shift.22
,
NIlST 100

Chapter3 Probing Aggregation Properties
56The emission spectra of the polymers were recorded for 0.1 G.D (optical
density) solutions in THF and toluene. The emission spectra were almost
identical even though there is a slight difference in the absorption maxima for
the polymer solutions in THF and toluene.
5
4
- MEHPPV in THF- MEHPPV in Toluene- BTCD-60 in THF- BTCD-60 in Toluene
0.10
8 0.06§-e~ 0.04
..D-<
0.02
0.00 0350 400 450 500 550 600 650 700 750
Wavelength (run)
Figure 3.1. Absorption and emission spectra ofMEH-PPVand BTCD-60 in
solution.
The solution quantum yields were determined using Rhodamine 6G in
water as standard (<1>= 0.95) and the values were obtained in the range of 0.23
0.28 and 0.24-0.31 for MEH-PPV and BTCD-60, respectively (see table 3.2). It
can be clearly noticed that the emission quantum yield was less in toluene
compared to that of THF (see table 3.2). This may be due to the partial 7t
stacking of the polymer chains in toluene compared to that of THF, as noticed
in their absorbance spectra. Thin polymer films were caste on glass substrate
from polymer solution and the a.D. of the films were obtained as 0.1 by
adjusting the concentration of the polymer solution. The solid state absorbance
and emission spectra of films were shown in figure 3.2. The absorbance spectra
of MEH-PPV and BTCD-60 films prepared from toluene solution were almost
identical and red-shifted compared to that of those films obtained from THF
solution. It suggests that the films caste from aromatic hydrocarbon solvents
NIlST 101

Chapter3 Probing Aggregation Properties'
such as toluene posses more n-stacking compared to that of the films from
good solvent like THF. 22, 56
0.10 (a) MEHPPV (THF) 2.5(a') MEHPPV (TOL)
SO.08(b) BTCD-60 (THF)
2.0(b') BTCD-60 (TOL) ~
~ '"0'-" -<I) ><g 0.06 1.5 '-"ro .c
"€ .,...en
~ 0.04 1.0 ~<I)
,D :s~
0.02 0.5 ....:l~
0.00 0.0350 400 450 500 550 600 650 700 750
Wavelength (nm)
Figure 3.2. Absorption and emission spectra ofMEH-PPV and BTCD-60 in
film (caste from THF and Toluene solution) on glass substrate.
Among the films produced from THF solution, the absorption spectra of
BTCD-60 film is blue shifted by 15-20 nm compared to MEH-PPV films
(compare plots a and b in figure 3.2). It indicates that inter (or intra) chain
interactions (n-stacking) are relatively weak in BTCD-60 compared to MEH
PPV. It may be due to the strong steric hindrance induced by the TCD-bulky
unit. The solid state emission spectra of the polymers have shown an interesting
trend that the spectra of BTCD-60 showed almost 5-6 times enhancement in PL
intensity than that of MEH-PPV. The emission intensity of MEH-PPV films
were very low for both films caste from toluene and THF (see emission plots a
and a' in figure 3.2) compared to the BTCD-60 films. Among the two BTCD
60 films, the film obtained from THF solution showed twice the PL intensity
compared to that of films obtained toluene solution (see emission plots band b'
in figure 3.2). The comparison of absorbance and emission spectra of the films
of BTCD-60 revealed that the less n-aggregated film (plot-b) showed higher
luminescence intensity compared to that of more n-aggregated chains (plot b').
NJIST 102

Chapter3 Probing Aggregation Properties
Table 3.2. Photo physical, thermal and electrochemical properties ofthepolymers and oligomers
Sample In soln. (nmt In film (nmt
AAbs AEm ~FLb AAbs AEm PLlntensity(J
MEH-PPV(THF) 489 549 0.28 502 584 4.3xlO'MEH-PPV(Toluene) 495 553 0.23 504 589 2.5x10⁵
BTCD-60(THF) 486 550 0.31 490 585 2.7xlO11
BTCD-60 (Toluene) 493 554 0.25 497 585 1.2xl06
MEH-OPV 389 433- 0.53 394 525 ~=0.27e
475BTCD-OPV 386 432- 0.54 398 525 ~=0.64e
481(a) Excitation wave length used is 480 nm for the polymers and 380 nm for theoligomers.
(b) Determined using Rhodamine 6G as standard for the polymers (A.ex=480
nm) and Quinine sulfate as the standard for the oligomers (A.ex=380 nm), the
absorbance ofsolutions were maintained as 0.1 at the excitation wavelength.
(c) Excitation wavelength is 500 nm for polymers and 390nm for the model
compounds.(d) The emission intensity ofthe polymers at the emission maxima.
(e) Determinedfrom the diffuse reflectance measurements.
It evident that the molecular aggregation is a very strong phenomenon in
PPV chains for reduction in emission characteristics in both solutions as well as
in the films caste from their solution. The presence of TCD-bulky unit
significantly hinders the 7t-stacking of polymer backbone and enhances the
solution quantum yield and PL intensity almost 5-6 times in BTCD-60
compared to that of MEH-PPV. In order to trace the aggregated species at the
excited state, the excitation spectra of the polymers were recorded at two
different concentrations in THF (10-4 and 10-5 M- l). The concentration
dependent experiment was chosen since the polymer chains are closely packed
at higher concentration which resembles the chain arrangements in the film.52
The excitation spectra of MEH-PPV and BTCD-60 were collected at three
different emission wavelengths (Aem= 550, 590, 660 nm) and shown in figure
3.3.
NlIST 103

Chapter3 Probing Aggregation Properties
(a) MEH-PPV in THF
-2xIO"M"1-2xJQ4M·1
Em=550nm
(b) BTCD-60 in THF
-8xIO"M-1
-8xIO"M-1
.c'00
Em=590nm ~
i:J'"""
Em=550nm
250 300 350 400 450 500 550 600 250 300 350 400 450 500 550 600 650
Wavelength (run) Wavelength (run)Figure 3.3. Excitation spectra ofMEH-PPV and BTCD-60 in THF at different
concentrations.
At lower concentration, the excitation spectra of MEH-PPV showed
maxima at 470 run with a shoulder at 340 run at all three collected emission
wavelengths. At higher concentration, the intense peak was blue-shifted by 70
nm and centered at ~ 405 run corresponding to strong inter chain interaction
and 1t-stacking in concentrated solution. Additionally, the excitation spectra
was collected at higher emission wavelengths (collection at 590 and 660 nm) of
the concentrated solution of MEH-PPV showed a new peak at 545 nm which
was assigned to the aggregated polymer chains.57 Interestingly, the BTCD-60
showed almost identical excitation spectra irrespective of the concentration of
the solution and collected emission wavelengths. It confirmed that the MEH
PPV polymer chain undergo more n-stacking at higher concentration (similar to
film) which results in quenching of the luminescence properties. From chapter
2, we have also seen that the solid state luminescence quantum yield of the
model co~pounds (MEH-OPV and BTCD-OPV) determined using diffuse
reflectance technique according to the reported procedure 58-60 was obtained as
0.64 for BTCD-OPV which was two times higher than that of MEH-OPV
(~=O.27). It clearly demonstrates that the bulky TCD unit is very efficient
structme directing unit for highly luminescent n-conjugated materials. From
the above photo physical studies, it is evident that the bulky-TCD unit increases
the inter-chain distance in the polymer backbone leading to the reduction in the
NIIST 104

Chapted Probing Aggregation Properties
molecular aggregation for enhanced luminescence. In
poly(phenylenevinylene)s, the polymer chains have very strong affinity
towards n-stacking and the resultant n-aggregates in solution or solid state
strongly quenches the luminescent intensity.29, 30 In the present investigation,
we have noticed that the introduction of bulky units enhances the solution
quantum yield as well as the solid state PL intensity for both polymers as well
as oligomers. Therefore, tracing the n-stacking properties of conjugated
polymers, especially in the case of bulky systems, it is very important to
understand their luminescent properties. There are different methods to probe
the molecular aggregation in n-conjugated systems and among them solvent
and temperature dependant aggregation studies are very important.
3.3.2. Solvent Induced n-Aggregation Studies
Solvent induced self-organization in conjugated chains is an attractive
approach, since the isolation or aggregation of polymer chains can be easily
controlled by choosing the appropriate combination of good or non-solvent (or
bad solvent).36 In good solvent the polymer chains exist as isolated chains and
subsequent addition of bad solvent forces the polymer chains to undergo
collapsed stage which is similar to that of in the film (see figure 3.4).
III Good solnllt In Hnd 1I01\'fllt
Figure 3.4. Behavior a/polymer chains in good and bad solvents
The solvent induced aggregation studies of the oligomers (MEH-OPV
and BTCD-OPV) and polymers (BTCD-60 and MEH-PPV) will provide more
insight into the effect of n-aggregation on the luminescent properties. For the
NIlST 105

Chapter3 Probing Aggregation Properties
solvent induced aggregation studies, the photo physical properties of polymers
were studied in THF (good solvent) and methanol (poor solvent) solvent
mixture. For the molecular aggregation studies of the model compounds
THF+water was chosen as the solvent combination. The absorption and
emission spectra of MEH-PPV and BTCD-60 in THF/methanol mixture (from
0-100 % v/v) are shown in figure 3.5.
Figure 3.5. Absorption and emission spectra ofpolymers in THF/MeOH withvarying solvent combination at 30 ce. Color change from orange to red with
the addition ofmethanol into the polymer solution (from left to rightincreasing methanol content)
7
0.12 MEH-PPV MeOH MEH-PPV MeOH0% 0010
6
0.10
I::J 5
~ 0.08 "'0OJ 4 .,....u -?:S~ 0.06 .i::'.0
1000103 'iii
0 c1l 0.04 OJ
-ex:2 C
-l1 u..
0350 400 450 500 550 600 650 520 560 600 640 680 720
0.10 BTCD-60 BTCD-60 5
MeOH MeOH~ 0.08 r
0% 4.0-0
::J
I.,....
~-?:S
OJ 0.06 3 .i::'u 'iiic ctil OJ
-e 0.04 2 C0 !()()% 1000/0 -l(Jl
.0 u..-ex: 0.02
0350 400 450 500 550 600 650 520 560 600 640 680 720
NIlST 106

Chapter3 Probing Aggregation Properties
The addition of methanol into the polymer solutions in THF, drastically
affect both the absorption maxima as well as luminescent intensity. The color
of the polymer solution gradually changed from orange to red with the addition
of methanol and the transition point was noticed at 40-50 % of methanol in
THF (see figure 3.5). It can be clearly noticed that MEH-PPY was more
drastically affected by the MeOH addition compared to that of BTCD-60 «see
absorption and emission spectra in figure 3.5). The quantum yields for the
different solvent/non-solvent combinations were calculated using Rhodamine
60 in water as the standard. Since the MeOH addition reflects both on the
absorption maxima and quantum yield, these two parameters can be used to
trace the extent of molecular aggregation in polymer chains.
The plots of absorption maxima (Figure 3.6a) indicate the existence of
two types of species depending upon the amount of methanol in polymer
solution. The polymer chains are free and isolated below 30-40 % of methanol
whereas they are fully aggregated above 50-60 % of methanol. The extent of
absorption maxima shift (Y-axis) revealed that the MEH-PPY chains showed
strong aggregation with 25 nm red-shift compared to that of bulky BTCD-60
which showed only 16 nm red-shift. The quantum yield plots (Figure 3.6 b)
also support the existence of the aggregated chains and the values are lower for
MEH-PPY compared to that of BTCD-60 (above 50 % methanol
concentration). It reveals that polymer chains in MEH-PPY chains experience
more n-aggregation compared to that of the bulky PPY chains in BTCD-60.
The solvent induced aggregation studies of the model compounds
(DPYs) also reflect on the molecular aggregation in absorption and emission
properties (see figure 3.7). As expected, the extent of aggregation relatively
weak in model compounds compared to their polymer counterparts since long
range of n-stack is not possible in simple OPYs compared to that of high
molecular weight polymer chains. The shift in the absorption spectra is not very
significant; however, the emission properties are affected at high amount of
non-solvent addition (figure 3.7a).
NIIST 107

Chapter3 Probing Aggregation Properties
- 520~ (a) /-.-......... 515Cll ......-.-E'x 510Cll J ......--.- -.~ 505 ___ MEHPPV .--"'- 1Q)
--- BTCD60/./1 ~ ~uc 500Cll V).0 /. \0 N.... 495a
1=1=lrf-.-~ -rJ).04: 490
0.35
0.30 ......-. (b)Ir '.--.--.
0.25 "." \""0 0.20
.,.Qj .\.,>= 0.15E
~:::J
0.10 -.- MEHPPV ."- ___ BTCD60 .'.,cCll:::J 0.05 '. .-.a --.--.-.'.
0.00 --.0 20 40 60 80 100
% of MeOH in the solvent mixture
Figure 3.6. Plot ofabsorption maxima and quantum yield versus the
percentage ofMeOH in the THF/MeOH mixture.
The fluorescence quantum yields of the model compounds (figure 3.7b)
almost unaffected up to 80 % of water in THF. However, at higher water
content, a significant decrease in quantum yield can be noticed for MEH-OPV
compared to that of BTCD-OPV.
25(a)
H2O (b) e.....e 0.56
",,-.,,20 e .....e-e.....e"'" ......~.0 0% .-. 0.48..... .-.......~
j"0'-' 15 v0 0.40>='Vi
~ E~ 10,s-,-MEHOPV
0.32 .2I:
H ___ BTCDOPV ro~ • ;:3
\ 0.24 CI
o 0.16400 450 500 550 600 650 0 20 40 60 80 100
Wavelength (run) % of H20 in THF+ H
20
Figure 3. 7. (a) Emission spectra ofBTCD-OPV in THF/H20 with varyingsolvent combination at 30 ce. (b) Plot quantum yield versus the percentage of
H20 in the THF/ H20 mixture
NlIST J08

ChapterJ Probing Aggregation Properties
Based on the solvent induced aggregation studies it can be concluded
that bulky TCD-unit is very efficient anchoring groups for PPV backbone (also
for OPVs) in preventing the molecular aggregation for enhanced emission
properties.
3.3.3. Temperature Dependent x-Aggregation Studies
The aggregation of the polymer chains in solution are also sensitive to
the temperature which can also be used as another stimuli for tracing the
molecular aggregation properties.36 To study the influence of temperature on
the nature and reversibility of the molecular aggregation in PPV chains, the
polymers at the aggregated stage was subjected to temperature dependant
absorption studies. There are two ways one can design the temperature
dependent studies: (i) start from the non-aggregated stage at room temperature
and force the chains to undergo aggregation and isolation by cooling/heating at
sub-ambient region36 or (ii) start from the pre-aggregated stage at room
temperature and carryout the aggregation and isolation by heating/cooling at
elevated temperatures. We adapted the second method, because it is more
relevant to the practical purpose.
For the temperature dependent studies 40 % methanol in THF solvent
combination was selected because at this stage the polymers show a transition
from the isolated to the aggregated state (see Figure 3.8a). The polymer
solution (40 % methanol in THF) were taken in a screw capped cuvette and
subjected to absorption studies by heating or cooling the solution from 30 to 80
DC. The UV-visible spectra of BTCD-60 in the heating and cooling cycles are
shown in figure 8. As the solution temperature gradually increases, the
absorption spectra found to be blue shifted corresponding to the isolation of
polymer chains from the pre-aggregated state (see figure 8a). While cooling,
the absorbance spectra were red-shifted corresponding to the aggregation of
polymer chains (see figure 8b). This experiment was found completely
reversible for many more heating/cooling cycles (see figure 3.8c) which
confirmed the reversibility of molecular aggregation in PPV chains. Similar
NIIST 109
Chapted Probing Aggregation Properties
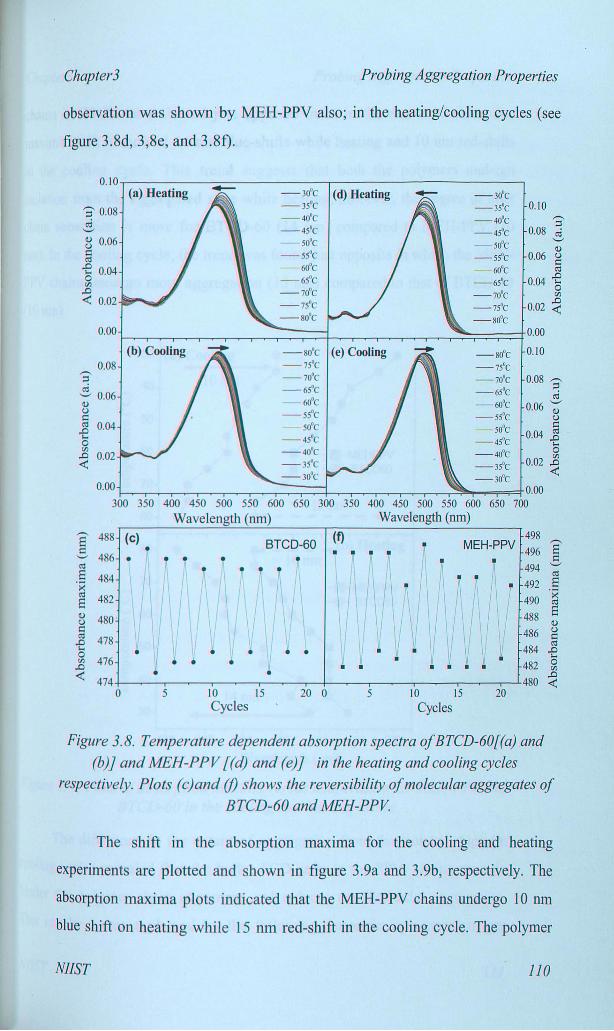
observation was shown by MEH-PPV also; in the heating/cooling cycles (see
figure 3.8d, 3,8e, and 3.8f).
0.10,---------::----------,-----------,(a) Heating
(b) Cooling
-30'e (d) Heating - -30'e-3s'e -3s'e 0.10-4o'e -4o'e ,-...
;:l-4s'e -4s'e 0.08 o:l
so'e -so'e '-'11)
-ss'e -ss'e 0.06 C)
6O'e 6O'eco:l
-6s'e -6s'e 0.04 ~-7o'e -7o'e en-7s'e -7s'e
..D0.02 -<
-so'e -so'e0.00
-so'e (e) Cooling - -so'e 0.10-7s'e -7s'e-7o'e -7o'e 0.08 S'-6s'e -6s'e ~6O'e 6O'e 0.06 ~-ss'e -ss'e C)
so'e so'e c-4s'e -4s'e
0.04 ]...-4o'e -40'e 0
-3s'e -3S'C 0.02 15-30'e -30'C -<
0.00400 450 500 550 600 650 300 350 400 450 500 550 600 650 700
Wavelength (nm) Wavelength (run)(f) 498 ,-...BTCD-60 • MEH-PPV §• • . ~ ~. . 496• • • • ,
494 '-'
I • I I I~ , ~ 1\ .o:l
492 a\ \ I I / / I 490
.;(o:l/ S
1/ \1 \/ 11 \/\/\/\/1/488
<I)
486 C)
V ~ \co:l
~ • ~ ~ v ~ ~ 484 ..DV
...482 0• • • • • • en
480..D-<
5 10 15 20 0 5 10 15 20Cycles Cycles
0.00
300 350
,-...488 (c)§ •
'-' 486 •o:l
S 484.;<o:l 482S<I)
480C)
co:l 478..D...0
476en..D-< 474
0
S'~ 0.06
<I)C)
co:l 0.04-€oen~ 0.02
0.08
S' 0.08~'-'
8 0.06co:l
..DCi 0.04en
..D-< 0.02--~
Figure 3.8. Temperature dependent absorption spectra ofBTCD-60[(a) and
(b)) and MEH-PPV [(d) and (eJ] in the heating and cooling cycles
respectively. Plots (c)and (f) shows the reversibility ofmolecular aggregates of
BTCD-60 and MEH-PPV
The shift in the absorption maxima for the cooling and heating
experiments are plotted and shown in figure 3.9a and 3.9b, respectively. The
absorption maxima plots indicated that the MEH-PPV chains undergo 10 run
blue shift on heating while 15 run red-shift in the cooling cycle. The polymer
NIIST 110

Chapter3 Probing Aggregation Properties
chains in BTCD-60 followed just opposite trend in the extent of absorption
maxima shift: it showed 14 nm blue-shifts while heating and 10 nrn red-shifts
in the cooling cycle. This trend suggests that both the polymers undergo
isolation from the aggregated state while heating, however, the degree of inter
chain separation is more for BTCD-60 (14 nm) compared to MEH-PPV (10
nm). In the cooling cycle, the trend was found just opposite in which the MEH
PPV chains undergo more aggregation (15 nm) compared to that of BTCD-60
(10 nm).
30 (a) Cooling • //• .1
40 10nm /.• •;-., / /U • •0 / /
~ 50 •/ --ll-MEHPPV
l-o /.a •~ 60
1
l1.l /.0..
/. /. ____ BTCD60S
70l1.l • /.E-< I• • 15 run/ 180 • .-------80 ." .. ___ ...(b) Heating
1 10run
70 ." ~\ -ll-MEHPPV•;-., 'eu • ____ BTCD60'G 60 I \• ".l1.l \l-o
.a .",~ 50 •l1.l 1 10.. .'-........ •s 40
1l1.l • •E-< 14nm
/ 1." ~30 .. ,.476 480 484 488 492 496 500
Wavelength (run)
Figure 3. 9. Plots ofabsorption maxima versus temperature for MEH-PPV andBTCD-60 in the cooling and heating cycles.
The difference in the extent of aggregation from the isolated stage (in
cooling cycle) revealed that the bulky TCD-units in the PPV- chains strongly
hinder the polymer chain alignment and reduces the molecular aggregation.
This can be better explained by the following cartoonic representation (see
NIIST 111

Chapter3 Probing Aggregation Properties
figure 3.10). On heating the polymer chains undergo a conformational change
from the pre-aggregated stage to more expanded form, which upon cooling will
again undergo coiling. However, the extent of coiling in the cooling process is
completely different for MEH-PPV and the bulky PPVs. MEH-PPV undergoes
more aggregated state (than it was first) (see figure 3.10, top), while in the case
of bulky PPV it is not regaining the initial aggregated stage (see figure 3.10,
bottom). This is because the bulky TCD-units do not allow the polymer chains
to come closer due to steric effects.
MEH·PPV
Bulky PPV
Figure 3.10. Representation oftemperature dependence ofpolymer chains
The results of temperature dependant studies are in accordance with the
solvent induced aggregation studies that the inter-chain separations in the bulky
systems reduce the molecular aggregation and enhanced the luminescent
properties.
3.3.4. Polymer -Oligomer Binary Blends
The effect of bulky units on the inter-chain separation of PPV backbone
was further studied by blending MEH-PPV polymer with MEH-OPV and
BTCD-OPV through solution blending techniques. The two series of the blends
were named as MEH-blend and BTCD-blend, depending upon the types of
OPV used in the blend preparation. The weight % of the oligomer was varied
NllST 112

Chapter3 Probing Aggregation Properties
as 15, 30, 40, 55, 65, 80, 90, and 95 % in the blend by varying the amount of
the components. The blend solution was caste on a glass substrate in such a
way to maintain the optical density of the resultant film ~O.l.
MEH-PPV
500 nm
OPV 390 nm
••••••••••••'----->Blending
-'!"""!""- .... EnergyTransfer
(Path 2) (Path 1)
MEH-PPV!OPV Binary Blend
EcoO'lM
OPV Polymer
Figure 3.11. Polymer-oligomer binary blend and possible selective e.l:citaJionprocesses in the blend.
Two types of selective photo-physical experiments can b am ut in
the polymer-oligomer binary blend, which is explained in figure .11 (i)
Selectively excite the oligomer and transfer the e citati n n
polymer, subsequently monitor the emission of the polym r
mechanism, path-I) or (ii) directly excite the polymer hain aD!
polymer emission (path-2). In the case of path-I, the
also show self-emission, if the energy transfer proc
of the energy transfer process in such binary blends i
energy levels of the molecules. The energy level of th l~'~telISJ
and the processes of path-l and 2 are shown in fi ur
emission spectra of the MEH- and BTCD-binary in
3.12.
~T n

ChapterJ Probing Aggregation Properties
0.15"(:-:a):-----------.--------------..0.15MEH Blend (b) BTCD Blend
;;'0.12 Abs(OPV)~'-'
80.09§~0.06
CI'l.0
-< 0.03
Abs(PPV) -MEHPPV-15%-30%-40%
55%-65%
80%-90%-95%-MEHOPV
-MEHPPV-15%-30%-40%-55%-65%
80%-90%-95%-BTCDOPV
0.12 S'~
'--'0.09 Q)
(,)
§0.06 "2
oCI'l
..00.03 <t:
Ern(PPV)
(f)-MEHPPV-15%-30%-40%
55%-65%
80%-90%-95%-MEHOPV
Em(PPV)
J-~~~2~~~~~=r==~~~~0Ern(PPV) -MEHPPV 9.0
-15%-30% """'-40%) 7.5 '00-55% ......---65% 6.0 ><
80% b-90% _-95% 4.5·~-BTCDOPV E
3.0 ,s
400 500 600 700 400 500 600 700Wavelength (nm) Wavelength (nm)
Figure 3.12. Absorption spectra ofMEH-blend (a) and BTeD-blend (b).
Emission spectra ofMEH-blendfor excitation wavelengths 390 nm (c) and 500
nm (e); Emission spectra ofBTeD-blendfor excitation wavelengths 390 nm (d)
and 500 nm (f).
The absorption maxima of the OPV and PPV chains appeared 390 and
500 nm, respectively. It is very clear from the plots that the optical densities of
the PPV part increase with the increase in the MER-PPV content in the blend.
The emission spectra for 390 nm excitation (corresponds to the absorption
maximum of the oligomer) are given in figure 3.12 (c and d) for MEH and
BTeD-blends, respectively. In both blends, the emission spectra showed two
peaks at 495 and 570 run corresponding to the self-emission and polymer chain
N11ST 114

Chapter3 Probing Aggregation Properties
emission followed by energy transfer process, respectively. Though the pure
MEH-PPV possess small absorption at 390 run (O.D. = 0.05, see figure 3.12a
and 1l2b), but failed to show any significant luminescence at 450-550 run for
excitation at 390 run, which suggested that the pure MEH-PPV chains are not
contributing to the emission characteristics of blends in this region. The
relative intensities of these emission peaks were highly influenced by the
compositions and types of the OPVs in the blend. The emission intensity of the
peaks at 495 and 570 run were plotted with respect to their composition and
shown in figure 3.13.
(a) DPV Luminescence at 495nm • A(390nm Excitation) ~ MEI-I-Blend • e/
e -.- BTCD-Blend /e- __/ e__e·
• .1/ /." I'". .-._.-.-(b) PPY Luminescence at 570nITI ~
(390nl11 Excitation) ,.-. /f ·---------------. I• e--- -e__ /e
1-. ---ME:.Bl'OO• -e- BTCD-Blend
~(c) PPY Luminescence at 570nm ..
(500= £><''''''00) I~MEH-Blend
-e- BTCD-B1end
e_____e"'"
L;·-~::~;·1-==== --
15~
'"3 12><'-'
.c 9.-[/.)~ 6(l)......s~ 3~
0
"'~20o.--.0 16
,£ 12[/.)
§ 8
oS 4~
~ 0
8
20 40 60 80% afOPV in the blend
100
Figure 3.13. ,Plot ofPL Intensity versus % ofOPV in the blendfor MEH-blend
and BTCD-blend at different excitation wavelengths.
NIIST 115

Chapter3 Probing Aggregation Properties
It is very clear from the plots in figure 3.13a that the MEH-blend did not
show self-luminescence up to 80 % of the MEH-OPV content, which indicates
the strong excitation energy transfer from the OPVs to MEH-PPV chains. On
the other hand, BTCD-OPV showed a self-emission even for 30% of its
presence in the BTCD-blend. Figure 3.13b represents the luminescence
intensities of the blend at 570 nm, followed by the energy transfer process from
oligomer to polymers for 390 nm excitation. The energy transfer to the polymer
chains lead to the luminescence of the MEH-PPV at 570 nm. The increase in
the PL-intensity of MEH-PPV chain was very high for BTCD-blend series
throughout the entire composition (see figure 3.13b); it suggests that the bulky
OPV molecule showed enhanced energy transfer process compared to that of
the normal OPV molecules. The emission spectra of the blends excited at 500
nm (with respect to the absorbance of MEH-PPV, path-2) are shown in figure
3.l2e and 3.12fand the PL intensity data are plotted in figure 3.l3c. For 500
nm excitation, the blends showed emission peak at 570 nm and the intensity of
this emission peak significantly increases with the amount of OPV in the blend
(see figure 3.13c) compared to that of pure MEH-PPV film. Since the OPV
molecules do not have any luminescence behavior for excitation at 500 nm, the
enhanced emission at 570 nm in the MEH-PPV chains is the result of the
reduction of molecular aggregation in the solid state. The larger PL intensities
of BTCD-blend at the entire composition indicate that the MEH-PPV polymer
chains are separated apart very effectively by the BTCD-OPV molecules in the
blend compared to the MEH-OPVs. The well separated polymer chains in the
blend experience less n-stack induced molecular aggregation. Therefore, it is
directly evident from the selective excitation studies of the blends that the
BTCD-units are an efficient bulky group for controlling the molecular
aggregation for enhanced luminescence properties.
3.3.5. Time Resolved Fluorescence Life-time Measurements
Time resolved fluorescence decay profiles of the polymers, oligomers
and polymer-oligomer blends were carried out in solution (THF) and in the
NIlST 116

Chapter3 Probing Aggregation Properties
film at room temperature and are given in figure 3.14. The decay dynamics
were carried out at an excitation wavelength of 401 nm and the decays were
monitored at respective emission maxima (see table 3.3 and Figure 3.14).
10'
• MEHblend30MEHblend90BTCDblend30
BTCDblend90 103
• I
Ii• \ • MEH-PPV-Soln• 8 0 MEH-PPV-Agg
t> MEH-PPV-Film 103
oo
'"(d)
(b)
• BTCD6D-Solno BTCD6D-Agg
BTCD6D-Film
I--.-"-f---.----r-~-,-~.--......-o\- 100
6 9 12 150 3 6 9 12 15Time (ns) Time (ns)
o MEH-OPV-Solno BTC[)'()PV-Soin
MEH-OPV-Film'i1 BTCD-OPV-Film
b.
·~
··
3
100, .,.-.-.......-....-,-~..--.-,.........~
10' (c)
10' (a)
Figure 3.14. Fluorescence lifetime decay curves ofOPVs, PPVs and
their blends in solution andfilm.
The OPVs in THF show a single exponential fit and they possess similar
decay life times, 1.86 ns (MEHOPV) and 1.89 ns (BTCDOPV) indicating that
they are having similar excimer species.22• 57 The decay profiles of the MEH
OPV and BTCDOPV in film were found to be similar to that in the solution.
MEH-PPV and BTCD-60 showed a single exponential decay in THF with life
time 0.56- 0.60 ns. The aggregated polymer solution (40 % methanol in THF)
showed bi- exponential decay with two life times in the range of 0.50-0.60 (98
NllST 117

Chapter3 Probing Aggregation Properties
%) and 0.81-1.04 (2 %) confirming the existence of two types of luminescent
species corresponding to the aggregated and isolated chains. The polymers in
film were also showed a bi-exponential decay and their lifetimes are given in
table 3.3. The observed fast decay in the aggregated solution and in the films
may be due to the increased extent of non-radiative processes and efficient
energy transfer to the aggregated species. The decay lifetime measurements of
the polymer-oligomer binary blends were also carried out in films and they
showed bi-exponential fit (Figure 3.14d). It was clear from the fitting results
that more than 90 % fraction of components undergoes fast decay and only less
than 10 % show delayed emission.
Table 3. 3. Fluorescent decay lifetime measurements ofthe oligomers,
polymers andpolymer-oligomer blends
Sample MediumQ
Amonitor 't'l(ost 't'2 (ost(om)b (99 %) (1 %)
MEH-OPV THF 470 1.86 -BTCD-OPV THF 470 1.89 -MEH-OPV Film 525 1.70 -BTCD-OPV Film 525 2.04 -MEH-PPV THF 555 0.56 .BTCD-60 THF 555 0.60 -
MEHPPV-Agg THF/CH30H 550 0.50 1.04
BTCD60-Agg THF/CH30H 550 0.61 0.81
MEH-PPV Film 585 0.46 0.62
BTCD-60 Film 585 0.35 0.56
MEHBlend-30 Film 585 0.52 1.17
MEHBlend-90 Film 585 0.34 0.81
BTCDBlend-30 Film 575 0.32 1.33
BTCDBlend-90 Film 575 0.36 1.69
BTCDBlend-30 Film 495 0.63 2.46
BTCDBlend-90 Film 495 0.51 2.35
(a) The optical density of the solutions and films were maintained at z 0.1 for
the lifetime measurements
(b) Emission wavelengths for which the decay was monitored (Aexc=401 nm).
(c) Lifetimes obtainedfrom the exponential decay fitting.
NIlST 118

Chapter3 Probing Agwegation Properties
In MEH-blend, as the percentage of OPV in the blend increases the
decay lifetime becomes fast because of the high rate of energy transfer process
from the oligomer to the polymer chain. This observation in the MEH-blend
demonstrated the complete energy transfer from the oligomer which results in
the increase in emission intensity of the polymer. However, the decay lifetime
of BTCD-blend shows no difference for the emission wavelength collected at
575 nm which corresponds to the polymer emission. But a small difference was
observed for the BTCD-blend films when collected at 495 nm which
correspond to the oligomer emission. It supports the observation for the
polymer-oligomer binary blends that in BTCD-blend two significant processes
occur (i) the self-luminescence of the oligomer and (ii) the emission of the
polymer chains as a result of the enhanced energy transfer.
It is evident that the bulky OPV sterically hinder the inter-chain
interactions preventing the molecular aggregation in the solid state. Therefore,
from the photophysical studies and decay lifetime measurements it can be
concluded that the bulky TCD- unit is an important anchoring group, which can
control the molecular aggregation by increasing the inter-chain distances in the
polymer chains as well as in the polymer-oligomer blend for the enhanced
luminescent properties.
NIIST 119

Chapter3 Probing Aggregation Properties
3.4. Conclusion
In this chapter, systematic spectroscopic studies was carried to probe the
origin of the molecular aggregates in bulky conducting polymers and
demonstrated the importance of the bulky TCD-anchoring group in controlling
the molecular aggregation for improved photo luminescent properties. The
absorption, excitation and emission studies of the polymers in solution and
solid state were carried out and they demonstrated the following facts: (i) Apart
from the solvent effects, the structural configuration of the polymeric backbone
plays an important role in enhancing the solid state luminescent intensity, (ii)
The solvent induced aggregation studies have proven that the addition of
methanol (poor solvent) into the polymer solutions in THF (good solvent),
drastically affect both the absorption maxima as well as luminescent intensity.
However, the comparative studies suggested that the MEH-PPV chains
experience more 1t-aggregation compared to that of the bulky PPV chains in
BTCD-60, (iii) Temperature dependant studies have demonstrated that MEH
PPV chains undergo more aggregation (15 nm) in the cooling cycle compared
to that of BTCD-60 (10 nm), (iv) The solvent and temperature dependant
studies were further confirmed with the studies done on the OPVs which
suggest that the bulky unit separates the interchain distance for the enhanced
luminescence properties, (v) Synthesis of polymer-oligomer binary blends
revealed that the bulky DPV (BTCD-DPV) increases the emission of the PPV
chain via both energy transfer and inter chain separation processes and, (vi)
Decay lifetime measurements of the binary blends further support the efficient
energy transfer from the DPY to the PPY backbone resulting in the enhanced
emission properties.
Therefore, from the present studies it is clearly evident that the bulky
substitution in the PPY or in the oligomer separates inter-chain or inter
molecular distance more efficiently leading to the improved photo-luminescent
properties which can be explored for the futuristic applications of opto
electronic devices.
N/IST 120

Chapter3
3.5. References
Probing Aggregation Properties
1. Akcelrud, L. Prog. Polym. Sci. 2003,28, 875.
2. Burroughes, J. H.; Bradley, D. D. C.; Brown, A. R.; Marks, R. N.; Mackay,
K.; Friend, R. H.; Burns, P. L.; Holmes, A. B. Nature 1990,347,539.
3. Friend, R. H.; Gymer, R. W.; Holmes, A. B.; Burrouges, 1 H.; Marks, R.
N.; Taliani, C.; Bradley, D. D. C.; dos Santos, D. A.; Gredas, 1 L.;
Longlund, M.; Salaneck, W. R. Nature 1999, 397, 121.
4. Sheats, J. R.; Antoniadis, H.; Hueschen, M.; Leonard, W.; Miller, 1; Moon,
R.; Roitman, D.; Stocking, A. Science 1996,273,884.
5. Kraft, A.; Grimsdale, A. C.; Holmes, A. B. Angew. Chem. Int. End. Engl.
1998,37,402.
6. Lidzey, D. G.; Bradley, D. D. C.; Alvarado, S. F.; Seidler, P. F. Nature
1997,386, 135.
7. Egbe, D. A. M.; Tillmann, H.; Rirckner, E. ; Klemm, E. Macromol. Chem.
Phys. 2001,202, 2712.
8. Samuel, I. D. W.; Rumbles, G.; Collison, C. 1; Moratti, S.C.; Holmes, A. B.
Chem. Phys. 1998,227, 75.
9. Zou, Y.; Hou, J.; Yang, C.; Li, Y. Macromolecules 2006, 39, 8889.
10.Fan, Q. L.; Lu, S.; Lai, Y. H.; Hou, X. Y.; Huang, W. Macromolecules
2003, 36, 6976.
I1.Ahn, T.; Song, S. Y.; Shim, H. K. Macromolecules 2000,33,6764.
12. Sun, H.; Mei, C.; Zhou, Q.; Liu, Z.; Ma, D.; Wang, L.; Jing, X.; Wang, F. J
Polym. Sci. Part A Polym. Chem. 2006,44,3469.
13. Ahn, T.; Ko, S. W.; Lee. J.; Shim, H. K. Macromolecules 2002, 35, 3495.
14.Patil, A. 0.; Heeger, A. J.; Wudl, F. Chem. Rev. 1988,88, 183.
15.Li, X. G.; Huang, M. R.; Duan, W.; Yang, Y. L. Chem. Rev. 2002, 102,
2925.
16. Anderson, M. R.; Mattes, B. R.; Reiss, H.; Kaner, R. B. Science 1991,252,
1412.
NIIST 121

Chapter3 Probing Agwegation Properties
17.Huang, M. R.; Li, X. G.; Yang, Y. L.; Wang, X. S.; Yan, D. J. Appl. Polym.
Sci. 2001, 81, 1838.
18.Li, X. G.; Wei, F.; Huang, M. R.; Xie, Y. B. J. Phys. Chem. B. 2007,111,
5829.
19.Lu, Q. F.; Huang, M. R.; Li, X. G. Chem. Eur. J. 2007,13,6009.
20. MacDiarmid, A. G. Angew. Chem. Int. Ed. 2001, 40, 2581.
21. Traiphol, R.; Charoenthai, N.; Srikhirin, T.; Kerdcharoen, T.; Osotchan, T.;
Maturos, T. Polymer 2007,48,813.
22.Hsu, J. H.; Fann, W.; Tsao, P. H.; Chuang, K. R.; Chen, S. A. 1. Phys.
Chem. A. 1999, 103,2375.
23.Jakubiak, R.; Collison, C. 1.; Wan, W. C.; Rothberg, L. 1.; Hsieh, B. R. J.
Phys. Chem. A. 1999,103,2394.
24. Chen, S. H.; Su, A. C.; Chou, H. L.; Peng K. Y.; Chen, S. A .
Macromolecules 2004, 37, 167.
25.Huang, W. Y.; Matsuoka, S.; Kwei, T. K.; Okamoto, Y. Macromolecules
2001, 34, 7166.
26. Setayesh, S.; Grimsdale, A. C.; WeB, T.; Enkelmann, V.; Mullen, K.;
Meghdadi, F.; List, E. J. W.; Leising, G. J. Am. Chem. Soc. 2001,123,
946.
27. Bunz, U. H. F. Chem. Rev. 2000,100, 1605.
28.Becker, H.; Spreitzer, H.; Kreuder, W.; Kluge, E.; Schenk, H.; Parker, I.;
Cao, Y. Adv. Mater. 2000, 12,42.
29. Shi, Y.; Liu, J.; Yang, Y. J. Appl. Phys. 2000,87,4254.
30.Nguyen, T. Q.; Doan, V.; Schwartz, B. 1. 1. Chem. Phys. 1999, 110,4068.
31.Bhongale, C. J.; Chang, C. W.; Lee, C. S.; Diau, E. W. G.; Hsu, C. S. J.
Phys. Chern. B 2005, 109, 13472.
32. Wang, P. S.; Lu, H. H.; Liu, C. Y.; Chen, S. A. Macromolecules 2008,41,
6500.
33.Padmanabhan, G. ; Ramakrishnan, S. J. Am. Chem. Soc. 2000,122,2244.
NIIST 122

Chapted Probing Agwegation Properties
34. Liao, L.; Pang, Y.; Ding, L.; Karasz, F. E.; Smith, P. R.; Meador, M. A. J
Polym. Sci. Part A Polym. Chem. 2004,42,5853.
35.(a) Liao, L.; Pang, Y.; Ding, L.; Karasz, F. E. Macromolecules 2002, 35,
3819. (b) Pang, Y.; Li, J.; Hu, B.; Karasz, F. E. Macromolecules 1999,32,
3946. (c) Liao, L.; Pang, Y.; Ding, L.; Karasz, F. E. Macromolecules, 2001,
34,6756. (d) Zheng, M.; Sarker, A. M.; Gurel, E. E.; Lahti, P. M.; Karaz, F.
E. Macromolecules 2000, 33, 7426.
36.(a) Chu, Q.; Pang, Y. Afacromolecules 2003, 36,4614. (b) Chu ,Q.; Pang,
Y. Macromolecules 2005,38,517.
37. Marchioni, F.; Chiechi, R.; Patil, S.; Wudl, F.; Chen, Y.; Shinar, 1. Appl
Phys Lett. 2006, 89, 061101.
38. Lee, 1. I.; Kang, I. N.; Hwang, D. H.; Shim, H. K. Chem. Mater. 1996,8,
1925.
39. Peng, K. Y.; Chen, S. A.; Fann, W.S. J. Am. Chem. Soc. 2001, 123, 11388.
40.Alam, M. M.; Jenekhe, S. A. Macromol. Rapid Commun. 2006,27,2053.
41.(a) Chou, C. H.; Hsu, S. L.; Dinakaran, K.; Chiu, M. Y.; Wei, K. H.
Macromolecules 2005, 38, 745. (b) Xia, C.; Advincula, R. C.
Macromolecules 2001, 34, 5854.
42. (a) Yang, J. S.; Swager, T.M. J. Am. Chem. Soc. 1998, 120,5321. (b) Yang,
1. S.; Swager, T. M. J. Am. Chem. Soc. 1998, 120, 11864.
43. Wang, H.; Song, N.; Li, H.; Li, Y.; Li, X. Synth. Met. 2005, 151, 279.
44. Tang, R.; Chuai, Y.; Cheng, c.; Xi, F.; Zou, D. J. Polym. Sci. Part A Polym.
Chem.2005, 43,3126.
45. Bao, Z.; Amundson, K. R.; Lovinger, A. 1. Macromolecules 1998, 31, 8647.
46. Tokito, S.; Tanaka, H.; Noda, K.; Okada, A.; Taga, Y. Appl. Phys. Lett.
1997, 70, 1929.
47.Jeong, H. Y.; Lee, Y. K.; Talaie, A. ; Kim, K. M.; Kwon, Y. D.; Jang ,Yo
R.; Yoo, K. H.; Chao, D. J.; Jang, 1. Thin Solid Films 2002,417, 171.
MIST 123

Chapter3 Probing Aggregation Properties
48.Lee, Y. K.; Jeong, H. Y.; Kim, K. M.;. Kim, l C; Choi, H. Y.; Kwon, Y.
D.; Choo, D. J.; Jang, Y. R.; Yoo, K. H.; Jang, l; Talaie, A. Current Appl.
Phys. 2002, 2, 241.
49. Anderson, M. R. ; Yu, G.; Heeger, A. l Synth.. Met, 1997,85, 1275.
50. Wudl, F.; Hoger, S.; Zhang, C.; Pakbaz, K.; Heeger, A. l Polym. Prepr.
1993,34, 197.
51. Zhang, H.; Lu, X.; Li, Y.; Ai, X.; Zhang, X.; Yang, G. J. Photochem.
Photobiol. A 2002, 147, 15.
52. Ding, L.; Egbe, D. A. M.; Karasz, F. E. Macromolecules 2004,37,6124.
53. Kong, F.; Wu, X. L.; Huang, G. S.; Yuan, R. K.; Yang, C. Z.; Chu, P. K.;
Siu, G. G. Appl. Phys. A. 2006,84,203.
54. Chou, H. L.; Lin, K. F.; Fan, Y. L.; Wang, D. C. J. Polym. Sci. Part B
Polym. Phys. 2005, 43, 1705.
55. (a) Skotheim, T. A.; Elsenbaumer, R. L.; Reynolds, l R. Handbook of
conducting polymers, Second Edn. 1998, CRS Press. (b) Chang, R.; Hsu, J.
H.; Fann, W. S.; Yu, J.; Lin, S. H.; Lee, Y. Z.; Chen, S. A. Chem. Phys.
Lett.2000,317,153.
56. Traiphol, R.; Sanguansat, P.; Srikhirin, T.; Kerdcharoen, T.; Osotchan, T.
Macromolecules 2006, 39, 1165.
57. Fakis, M.; Anestopoulos, D.; Giannetas, V.; Persephonis, P. J. Phys. Chem.
B.2006,110,24897.
58. (a) Bril, A.; De Jager-Veenis, A. W. J. Electrochem. Soc. 1976, 123,396.
(b) eSilva, F. R. G.; Menezes, l F. S.; Rocha, G. B.; Alves, S.; Brito, H. F.;
Longo, R. L.; Malta, O. L. J. Alloy and Compounds 2000,303-304,364.
59.Biju, S.; AmbiliRaj, D. B.; Reddy, M. L. P.; Kariuki, B. M. Inorg. Chem.
2006, 45, 10651.
60.Fu, L.; Ferreira, R. A. S.; Silva, N. J. 0.; Fernandes, A. l; Ribeiro-Claro,
P.; Goncalves, 1. S.; Bermudez, V. Z.; Carlos, L. D. J. Mater. Chem. 2005,
15,3117.
N11ST 124