chapter 22 comparing two proportions two proportion confidence intervals · · 2017-07-27chapter...
TRANSCRIPT

22(1).notebook
1
February 15, 2012
Chapter 22 Comparing Two Proportions
Two Proportion Confidence Intervals
If we have two independent random samples, each having variation, we can compare the proportions and construct a confidence interval for the difference.
The variance of the sum or difference of two independent random variables is the sum of their variances.

22(1).notebook
2
February 15, 2012
Proportions observed in two independent random samples are independent, so we can put the two proportions in for X and Y and add their variances. The standard error is the square root of the sum of the variances.

22(1).notebook
3
February 15, 2012

22(1).notebook
4
February 15, 2012
A twoproportion zinterval
When conditions are met, we are ready to find the confidence interval for the difference of two proportions, p1 p2. The confidence interval is:
The critical value z* depends on the particular confidence level, C, that you specify.

22(1).notebook
5
February 15, 2012

22(1).notebook
6
February 15, 2012

22(1).notebook
7
February 15, 2012

22(1).notebook
8
February 15, 2012
8. Buy it again? A consumer magazine plans to poll car owners to see if they are happy enough with their vehicles that they would purchase the same model again. They'll randomly select 450 owners of Americanmade cars and 450 owners of Japanese models. Obviously, the actual opinions of the entire population couldn't be known, but suppose 76% of owners of American cars and 78% of owners of Japanese cars would purchase another.a. What sampling design is the magazine planning to use?
b. What difference would you expect their poll to show?
c. Of course, sampling error means the poll won't reflect the difference perfectly. What's the standard deviation for the difference in the proportions?

22(1).notebook
9
February 15, 2012
d. Sketch a sampling model for the difference in proportions that might appear in a poll like this.
e. Could the magazine be misled by the poll, concluding that owners of American cars are much happier with their vehicles than owners of Japanese cars? Explain.

22(1).notebook
10
February 15, 2012
9. Arthritis. The Centers for Disease control and Prevention reported a survey of randomly selected Americans age 65 and older, which found that 411 of 1012 men and 535 of 1062 women suffered from some form of arthritis.a. Are the assumptions and conditions necessary for inference satisfied? Explain.
22(1).notebook
11
February 15, 2012
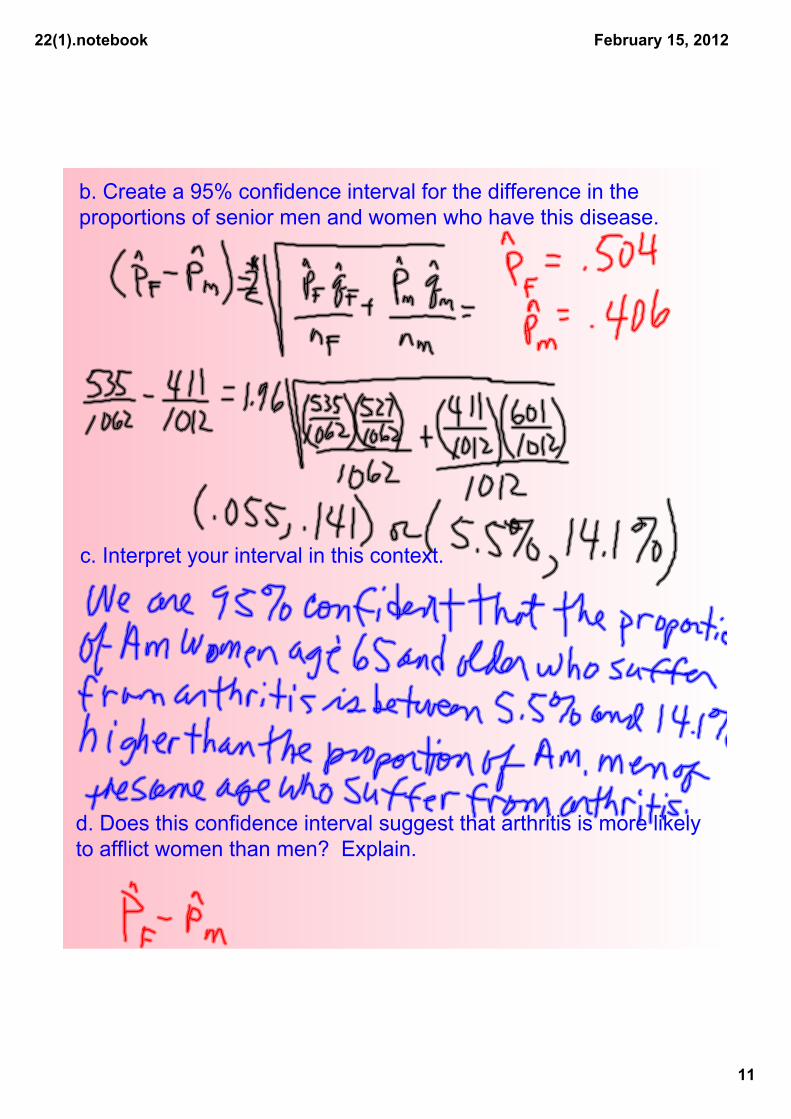
b. Create a 95% confidence interval for the difference in the proportions of senior men and women who have this disease.
c. Interpret your interval in this context.
d. Does this confidence interval suggest that arthritis is more likely to afflict women than men? Explain.

22(1).notebook
12
February 15, 2012
HW p. 521; 19,20,27 ANS

22(1).notebook
13
February 15, 2012