chapter 2 method development for determination of pesticides...
TRANSCRIPT

28
CHAPTER 2 METHOD DEVELOPMENT FOR
DETERMINATION OF PESTICIDES IN PALM
OIL MATRICES
Oil palm fruitlets

29
CHAPTER 2 METHOD DEVELOPMENT FOR
DETERMINATION OF PESTICDES IN PALM OIL
MATRICES
2.1 INTRODUCTION
Nowadays, one of the most economical and efficient pest control method in oil
palm plantations is the use of selective pesticide which kills or retards the growth of
certain plants, weeds and insects, without causing particular harm to other organisms. In
that sense, the use of insecticides in oil palm plantations is minimal compared to other
pesticides such as herbicides and fungicides. This is because insecticides are only
applied when there is an insect attack which numbers exceeds certain threshold level.
One of the important impacts of pesticide application for crop protection is on
food safety. Residues of the pesticide could persist for a long time in the crop and
finally in the food products. In the case of palm oil, although one of the steps in the
processing of the crude palm oil is to obtain refined bleached deodorized palm oil
(RBDPO) involves water washing, which removes most of the water soluble pesticides
such as herbicides, some of the insecticides used in oil palm plantations are lipid
soluble. These compounds are lipophilic, with high n-octanol-water partition
coefficients (Ko/w). Most of them are less soluble in water, suggesting the residues may
concentrate in the oil during the extraction from the fruit of oil palm.

30
Some of the lipophilic insecticides used in oil palm plantations are cypermethrin
and λ-cyhalothrin. They are both non-polar pesticides with high Ko/w values which mean
that they are not easily washed off by water during the processing steps. Consequently,
pesticide residues breakthrough could occur during the pressing of the oil out from the
fruits. Hence, pesticide residues in palm oil and palm kernel oil constitute an important
parameter of the quality of these edible oils. Monitoring the residue level of pesticides
in palm oil is one of the aims of developing methods. This is important to ensure that
palm oil is free from chemical residues, safe for human consumption and particularly
meet the pesticide residue regulatory requirements of importing countries [68].
The identification of pesticide residues in food with high fat content such as
vegetable oils is a difficult and challenging task since the inherent complexity of the
matrix could interfere in the determination and quantification of the target analytes.
Taken into account that some of the pesticides used are lipid soluble non-polar
compounds, they tend to concentrate and remain in the oil throughout the processing
steps. Furthermore, the matrix also stabilizes and protects the compounds of interest
from degradation or oxidation phenomena, thus making possible the persistence of these
compounds even at low concentration levels for long periods [69]. This urges the need
to develop more rigorous extraction and clean-up steps in order to minimize or if
possible, complete removal of the co-extraction of fatty materials from the sample.
It is well known that the main problem associated when dealing with these kinds
of matrices is that dirty extracts with even a small amount of fats may disrupt the
columns and harm the detectors, hence, upsetting the right analyte determination
through signal suppression. The presence of high concentration of fatty acids in the
samples may complicate the GC detection system of low pesticide concentrations. This

31
is due to the presence of high matrix peaks in the chromatograms that mask the analytes
of interest. Although it has been a practice for some laboratories to change the column
at intervals, it is very costly to change the detector. Consequently, further purification of
the extract is required before the analytes determination. This step is called a clean-up
step and aims at the isolation of the target analytes from potentially interfering co-
extractives as well as discarding the extraction solvent and preparing the target analytes
in an appropriate chemical form for its characterization and quantification [70].
Therefore, sample pre-treatment and extraction procedures are the key steps and
bottleneck where most of errors occur in this kind of analysis.
In principal, method development of pesticide residues involves the
development of strategies to isolate or extract the pesticide fraction from the whole fatty
matrix. This procedure comprises extractions of analytes from their bulk matrix into an
appropriate solvent, followed by removal of potentially interfering substances from the
solvent extracts to small volumes prior to analysis. This choice of sample pre-treatment
is related to the detection method since the more sensitive and specific detection method
is used, the less stages of sample treatment will be required [70]. For instance, the non-
selective detectors such as NPD, FID or ECD in gas chromatography (GC) or UV in
liquid chromatography (LC) require more rigorous and thorough sample pre-treatment
compared to more sensitive high-end mass spectrometric techniques such as tandem
mass spectrometry with triple quadrupole (QQQ) or quadrupole time-of-flight (Q-TOF)
instruments attached to GC or LC. Finally, it should be noted that it is desirable that the
chosen method involves low solvent consumption, to be environmentally friendly and
also safer to apply by the analyst [71].

32
The technique of choice for determination and quantification of pesticide
residues currently revolves around the use of chromatographic methods, especially gas
chromatography (GC), high-performance liquid chromatography (HPLC) and ultra-
high-performance liquid chromatography (UHPLC). These chromatographic methods
coupled to the development of various detectors such as flame ionization (FID),
nitrogen-phosphorus (NPD), flame photometric (FPD), electron capture (ECD), and
mass spectrometric (MS) for GC and ultraviolet (UV), diode array (DAD), fluorescence
(FD), and mass spectrometric (MS) for HPLC, have turned these methods into highly
successful analytical tools for pesticide residues analysis.
Recently, two reviews of analytical techniques for sample pre-treatment in fatty
vegetable matrices have been documented for various pesticide residues [70, 72]. The
reviews address the main sample treatment methodologies for pesticide residue analysis
in fatty vegetable matrices and numerous vegetable oils. From the reviews, olive and
olive oil represent the most frequently analysed samples for pesticide residues, followed
by soybean and soybean oil, avocado, sunflower oil, corn oil, and other vegetable oils.
What’s more, currently the most popular methods involve the use of one or the
combination of some of the following techniques for both the sample extraction and
clean-up steps: liquid-liquid partitioning, adsorption chromatography, gel permeation
chromatography (GPC), solid-phase extraction (SPE), and matrix solid-phase dispersion
(MSPD) [70]. Interestingly, according to the reviewers, more than 70 % of the methods
discussed were based on liquid partitioning with organic solvents followed by a clean-
up with either SPE or GPC.

33
Determination of halogenated pesticides such as pyrethroids is usually carried
out by gas chromatography with electron capture or mass spectrometry detection. Many
methods have been reported in the literature for the determination of pyrethroid residues
in fatty matrices employing various extraction and clean-up procedures using analytical
techniques such as gas chromatography with ECD, MS or tandem MS detection [73-84].
However, a further clean-up is generally required for the determination using electron
capture detection, because of excessive interferences in the chromatogram from matrix
components and the need to protect the chromatographic system from the losses of
efficiency and sensitivity resulting from the presence of traces of fatty materials. It has
been estimated that a fat residue of less than 0.25 mg/mL is required for ECD analysis
[85].
In the late 1990’s, two types of methodologies with different approaches (SPE
and GPC) were reported for pyrethroids in vegetable oils and butter fat [73, 74].
Ramesh et al. studied the efficiency of purification of pyrethroids by SPE using
graphitized carbon black (GCB) as the sorbent in vegetable oils (groundnut oil, soybean
oil, sunflower oil, olive oil) and butter fat [73]. The authors proposed a straightforward
approach in sample clean-up using SPE without a preliminary acetonitrile-hexane
partitioning. In this work, sample purification was achieved by direct introduction of the
oil samples to the SPE column packed with GCB. Analytes were eluted from the
column with acetonitrile, followed by concentration and reconstitution with acetone.
Finally, quantification was achieved by GC with electron capture detection. The method
was studied using seven highly persistent pyrethroid insecticides (cypermethrin,
deltamethrin, fenvalerate, cyfluthrin, allethrin, cyhalothrin, and permethrin) with the
recoveries in the range between 86% and 105%. An interesting point in their research is
that the addition of methyltrioctylammonium chloride (MTOAC) to the oil samples,

34
prior to sample extraction. The authors reported that MTOAC plays an important role in
the pre-concentration of pyrethroid molecules from oil/high fat content samples.
Nevertheless, the actual role of MTOAC in the separation technique has yet to be
established.
Based on gas permeation chromatography technique, Di Muccio et al. [74]
proposed a method for pyrethroid insecticides in soya oil using a combination of a solid-
matrix dispersion partition followed by high-performance size-exclusion
chromatography on a mini-column of 7.8 mm I.D. They reported 99.8% of fatty matrix
removal with acceptable quantification for 9 out of 14 pyrethroids tested. The
chromatograms obtained via GC-ECD for soya oil extract were quite nasty with several
interferences still remained, preventing quantification (fluvalinate, permethrin) and low
recoveries (λ-cyhalothrin, esfenvalerate, tralomethrin) for some pyrethroids. This is due
to insufficient sample pre-treatment which allowed co-extract of the contaminants and
hence masking the analyte signals. On the other hand, the recovery of cypermethrin was
72.6%.
Both of these methods (SPE and GPC) are the most commonly applied
analytical techniques for pyrethroid extraction in vegetable oils [73, 75, 76, 78- 80, 83,
84, 86]. These clean-up steps were usually combined with preliminary liquid-liquid
partition with either acetonitrile-hexane or acetonitrile alone. Both methods have their
advantages and disadvantages. SPE is vastly used in sample purification technique in
various matrices for different types of analytes, mainly for clean-up purposes after the
extraction steps of the methodology. Amongst the advantages of SPE over liquid
partitioning procedures are higher precision and throughput, lower solvent consumption,
and avoiding the formation of emulsions [70]. Additionally, SPE can be easily

35
incorporated into automated analytical procedures with relatively simple and
inexpensive equipment, which can lead to greater accuracy and precision and higher
laboratory throughput [87]. On the contrary, this method is time consuming and
laborious, since some SPE techniques involve many steps (sorbent conditioning, sample
addition, washing, and analyte elution) with some manual stages that need continual
analyst attention.
On the other hand, GPC is a technique equipped with polymeric porous
microspheres column which enables the separation of compounds according to their
molecular weights. Thus, base on this principle, low molecular weight pesticide fraction
is separated from the high molecular weight triglycerides fractions. According to
Gilbert-López et al. [70], clean-up using GPC after a preliminary liquid-liquid partition
with acetonitrile is currently one of the more regularly applied technique in routine
laboratories for the analysis of pesticide residues in vegetable oils by GC with different
detectors (ECD, NPD, MS). Nevertheless, direct extraction and clean-up of pesticides
from vegetable oils without preliminary liquid-liquid partition step is not uncommon.
The employment of GPC alone without initial partitioning step is highly not
recommended since it may cause adverse effects to the columns and chromatographic
systems. Therefore, liquid-liquid partitioning is the step to be considered when
developing method based on GPC techniques to achieve cleaner extracts. One of the
reasons why GPC technique is favoured compared to other techniques is because of its
high degree of automation using auto-sampler injection and on-line GPC-GC coupling.
This GPC-GC coupling concept is achieved by on-line transfer of pesticide-containing
fraction from the GPC fractionation step to the gas chromatograph using a loop-type
interface. In contrast, the major disadvantage of this technique is the partial overlapping
between the pesticide fraction and the components from the matrix since thorough

36
optimization of the GPC condition is needed and sometimes it is difficult to fully
separate the pesticide fraction from the matrix. Furthermore, GPC instrument is more
expensive with high maintenance cost, while the large amount of toxic solvents
consumed per analysis makes this technique not very environmental friendly.
Some authors chose GPC extraction and clean-up technique for pyrethroid
analysis in vegetable oil since it was automated and many samples could be analysed
per day [74, 78, 80, 84]. Others adopted the more economical and environmental
friendly SPE technique which required less solvent [73, 75, 76, 79, 83]. Barrek et al.
[84] described the development of a method for analyzing pesticide residues in olive oil
by GC-MS and HPLC-MS, using GPC technique. Twenty pesticides were separated and
analyzed by GC-MS, while the other 11 were analyzed by HPLC-MS in electrospray
ionization mode. In this work no liquid-liquid extraction was adopted prior to GPC
clean-up technique. Fortified oil sample was dissolved with tetrahydrofuran and
homogenized in an ultrasonic bath. Then, the fraction of the diluted oil sample was
injected into the GPC instrument equipped with two sets of column in series and eluted
in tetrahydrofuran (THF) at a flow rate of 1 mL min-1
. The recoveries achieved for
cypermethrin and λ-cyhalothrin from olive oil were 91.5% and 99.1% respectively.
Nevertheless, some of the pesticides (EPTC, fenthion, methidathion and acrinathrine)
studied gave low recoveries. In the case of acrinathrine, it has a larger steric volume
close to that of triglycerides, making its separation from the matrix difficult and
explaining its low recovery yield. This is the perfect case which revealed one of the
primary disadvantages of this technique.

37
García Sánchez et al. [80] reported a method for the multiresidue analysis of 26
pesticides in olive oil using a combination of liquid-liquid extraction (acetonitrile-
hexane) and gel-permeation chromatography clean-up. In this study, the efficiency of
the mobile phase for the GPC was studied. According to the authors, dichloromethane
was found to provide the most efficient mobile phase among the seven organic solvents
studied (n-hexane, cyclohexane, petroleum ether, dichloromethane, diethyl ether,
acetonitrile and methanol), with pesticide collection window between 14 and 23 min.
The recoveries obtained for all 26 pesticides were satisfactory and ranged between 84%
and 110% while the recoveries for λ-cyhalothrin and cypermethrin were 86-103% and
89-105% respectively. Additionally, the application of the optimized method to the real
olive oil samples revealed that only endosulfan sulphate was detected in the refined
olive oil, while diuron, terbuthylazine, endosulfan sulphate and diflufenican were all
detected in the virgin olive oil.
A similar extraction procedure was adopted by Ballesteros et al. [78] for the
determination of pesticide and polycyclic aromatic hydrocarbon residues in olive and
olive-pomace oils in a single injection by GC-MS2. Based on the earlier work of
Sánchez et al. [80], oil samples were previously extracted with an acetonitrile/n-hexane
mixture and cleaned up by GPC. The application of electronspray ionization and
chemical ionization allow pesticides and polyaromatic hydrocarbons (PAHs) to be
determined in a single analysis. Furthermore, using the optimized operating conditions,
pesticide and PAH residues would be present in the same fraction following clean-up
and gel permeation chromatography. All the recoveries exceeded 84% and mostly
around 90% for the analytes studied. The recoveries for λ-cyhalothrin and cypermethrin
were 86-108% and 94-109% respectively.

38
Besides GPC, SPE is one of the most popular techniques in sample pre-
treatment of pesticide residues in food matrices. Amvrazi et al. [79] evaluated a
comprehensive study on different extraction and clean-up procedures based on the
classical liquid partitioning and SPE technique for the multiresidue determination of 35
pesticides in olive oil by GC with nitrogen phosphorus detection (NPD) and electron
capture detection (ECD). In this study, three different liquid-liquid extraction
procedures based on (i) partition of pesticides between acetonitrile (ACN) and oil
solution in n-hexane, (ii) partition of pesticides between saturated ACN with n-hexane
and oil solution in n-hexane saturated with ACN, and (iii) partition of pesticides
between ACN and oil, were tested and evaluated for the optimization of the highest
pesticide recoveries with the lowest oil residue in the final extracts. Then, different
types of SPE sorbents (N-Alumina, Florisil, C18, Envi-Carb, Diol, CN, Ph, and NH2)
were tested for their efficiency in the clean-up steps. The authors proposed the liquid-
liquid extraction of the oil solution in n-hexane with acetonitrile followed by a SPE
clean-up of the extract using GCB for the organophosphorus and triazine compounds
gave the highest recoveries of all of the pesticides studied with less oil residues in the
sample, while for pyrethroids and organochlorine compounds, the acetonitrile extract
(from the GCB) was additionally cleaned through a Diol-SPE cartridge. The recoveries
for λ-cyhalothrin and cypermethrin were 86-91% and 105-108% respectively. The
developed method was then applied in the study of pesticide residues assessment in
different types of olive oil and preliminary exposure assessment of Greek consumers to
the pesticide residues detected [83].
Recent advances focus on the use of a combination of two or more commercially
available SPE sorbents for clean-up [88]. Recently, the use of primary secondary amine
(PSA) and graphitized carbon black (GCB) for the SPE clean-up of fatty acid matrix

39
components from food extracts in multiresidue pesticide analysis was evaluated [88,
89]. Shimelis et al. [88] underlined the use of dual layer SPE, a primary-secondary
amine in combination with graphitized carbon black for sample clean-up during
multiresidue pesticide screening of agricultural and food products. The retention of fatty
acids (palmitic acid, linoleic acid, oleic acid, and stearic acid) by the PSA sorbent was
quantified and the effect of the elution solvent on the retention of fatty acid on the SPE
cartridge was evaluated. According to the authors, the use of stronger elution solvents to
elute certain pesticides from GCB was shown to interfere with the capacity of PSA to
bind fatty acids. Since GCB has a strong affinity for planar molecules, this sorbent
usually applied in sample clean-up step to effectively removes pigments such as
chlorophyll, carotenoids, as well as sterols in foods especially vegetable oils. The
authors suggested that carbon may contribute to the retention of fatty acids by the dual
layer SPE when a mixture of acetonitrile:toluene (3:1) solvent is used, and therefore, be
beneficial to overall sample clean-up. Hence, practical applications of dual-layer
GCB/PSA cartridges with acetonitrile:toluene (3:1) elution solvent should be limited to
food samples with low levels of fatty acids since only the use of 100% acetonitrile as an
elution solvent maximizes PSA capacity for retention of fatty acids. The addition of
toluene can significantly weaken this binding ability. With a few exceptions, pesticide
recoveries were between 85% and 110% including cypermethrin, and sample-to-sample
differences of less than 5% were achieved, demonstrating the versatile suitability of the
dual-layer SPE to sample clean-up. λ-cyhalothrin was not the compound of interest in
this study.
An almost identical study was documented by He et al. [89] on the use of PSA
and GCB for the SPE clean-up of food extracts in pesticide residues analysis. They
investigated the influence of elution protocols on the capacity of PSA for removal of

40
fatty acids. In this study, the authors claimed that when PSA is combined with GCB to
remove pigments, the capacity of PSA for removal of fatty acids is dramatically reduced
and the degree of the decrease is highly dependent on the conditioning and elution
protocols. The use of toluene, hexane and /or acetone in the elution steps severely
reduces the capacity of PSA for removal of fatty acids. This finding was in the
accordance with what was reported by Shimelis et al. [88]. The difference between
these two literatures was the used of GCB/PSA sorbents, whether two cartridges in
serial [89] or in dual layer form [88]. He et al. also claimed that the applications of
GCB/PSA dual layer should be limited to non-fatty foods and/or food with a low
amount of fat, but if GCB has to be used for removal of colours and sterols, they
suggested that PSA cartridge should be used with carbon cartridge in serial.
Esteve-Turrillas et al. [76] proposed a method using combined solid-phase
extraction and tandem mass spectrometry detection for the determination of 11
pyrethroid insecticide residues in vegetable oils (olive oil, sunflower oil, corn oil, and
soybean oil). The authors tested several types of sorbents such as Florisil, alumina, C18,
and GCB in order to minimize fat residues. From the study, they suggested that the
combination of basic alumina and C18 solid-phase extraction clean-up with preliminary
acetonitrile:hexane liquid-liquid extraction gave the most effective clean-up which
provided an oil residue of 2.2 mg (0.04%,w/w), allowing the gas chromatographic
determination of pyrethroid insecticides without interference peaks. Furthermore, the
authors also recommended the use of the whole partition acetonitrile extract from the
liquid-liquid partitioning step as an SPE elution solvent, since this technique would
avoid the solvent change or evaporation step; reducing analysis time, solvent
consumption, and possible evaporation losses of analyte. Their results revealed that the

41
pyrethroid recoveries varied from 91% to 104% with the recoveries for λ-cyhalothrin
and cypermethrin were 92%-104% and 95%-104% respectively.
Most of the techniques discussed earlier involve the use of liquid-liquid
partitioning extraction using acetonitrile and hexane as solvents prior to cleanup with
either SPE or GPC. But recently, classic liquid-liquid partitioning extraction has been
replaced by a more cost-effective extraction technique, low-temperature precipitation.
Lentza-Rizos et al. [86] were the first to introduce the low-temperature extraction in
olive oil. This extraction technique was later applied to determine organophosphorus
pesticides in soybean oil, peanut oil, and sesame oil [90]. Afterward, modification was
made to the low-temperature technique by adding the extra clean-up steps via solid-
phase extraction (SPE) [75] and dispersive solid-phase extraction (d-SPE) [82]. The
clean-up steps were necessary in order to obtain cleaner sample extracts by removing of
excessive interferences in the chromatogram from matrix components for the
determination using electron capture detection.
In the earlier work by Lentza-Rizos et al. [86], they developed a simple,
extremely low-cost method using low-temperature lipid precipitation for the rapid
analysis of virgin olive oil for organophosphorus insecticides and triazine herbicides
commonly used in olive groves. The method gives a good clean-up for GC analysis with
nitrogen-phosphorus detection and the recoveries were between 77% and 104% with
RSD values of 7-16%. Later, the same extraction strategy was used in addition with
SPE clean-up step for the determination of endosulfan and pyrethroid (cypermethrin,
deltamethrin, fenvalerate, λ-cyhalothrin, and permethrin) insecticides in virgin olive oil
using gas chromatography with electron-capture detection [75]. In this study, two initial
extraction techniques were evaluated with both gave an extract in acetone equivalent to

42
1 g oil/mL. The first technique involved the classical partitioning of virgin olive oil
between hexane and acetonitrile phases, while the second technique involved the
partitioning of oil and acetonitrile followed by removal of the oil by precipitation at -
20ºC. Furthermore, they also studied the ability of different sorbent materials (Isolute
Florisil, Silica gel, alumina-N and Sep-Pak alumina-N) to remove traces of oil
remaining in extracts of olive oil after initial extraction step. According to the authors,
the low-temperature method was chosen as the method of choice since this method
proved to be considerably faster and more cost-effective. Although both methods gave
acceptable results in terms of recoveries, Sep-Pak alumina-N cartridge with the
acetonitrile solvent system provided a simple and satisfactory clean-up procedure. The
recoveries obtained varied from 71% to 91% while the recoveries for cypermethrin and
λ-cyhalothrin were 80% and 84% respectively. The authors claimed that the method
developed was simple, inexpensive, efficient, and particularly it consumed only small
amount of solvent.
Li et al. [90] proposed an almost similar method of extraction for the multi-
residue determination of 14 organophosphorus pesticides in soybean oil, peanut oil, and
sesame oil by gas chromatography with flame photometric detector (FPD). The finding
indicated that different matrix influenced the response and retention time of pesticides
studied, and matrix-matched calibration standards were recommended to be used in
order to counteract the matrix effect. The study showed that the analytical signals of 14
pesticides, retention time and peak shape of fenamiphos influenced by the matrix effect.
The recoveries obtained were in the range from 51.3% to 112.4% with RSDs less than
14.9%. The same authors proposed the same approach for the determination of 28
analytes from various types of pesticide in soybean oil by gas chromatography mass
spectrometry (GC-MS) [82]. Pesticides of low molecular mass were separated from the

43
fatty matrix which has a high molecular mass, by using low-temperature fat
precipitation, followed by a clean-up process based on dispersive solid-phase extraction
with primary secondary amine and C18 as sorbents, and magnesium sulphate for the
removal of residual water. The authors also compared the efficiency of extraction step
between liquid-liquid partitioning and low-temperature precipitation. In this study, the
two procedures gave similar recoveries but low-temperature extraction proved to be
much faster and easier. Additionally, this technique also avoids the use of hexane,
which is very expensive and toxic to humans [82]. Meanwhile, the use of dispersive-
SPE could effectively reduced time, expense, and hazardous waste. The recoveries of
most pesticides were acceptable with the recoveries for cypermethrin and λ-cyhalothrin
was 55-71% and 64-82% respectively.
Besides SPE and GPC based technique, other pesticide extraction technique that
has been applied for pyrethroid analysis in fatty matrices is matrix solid-phase
dispersion (MSPD). MSPD is an SPE based strategy in which a fine dispersion of the
matrix is mixed with a sorbent material (C18, alumina, Silica, etc.) with a mortar and a
pestle [70]. Some of its advantages compared to other techniques are possible
elimination of emulsion formation, solvent consumption is substantially reduced,
enhanced extraction efficiency of the analytes since the entire sample is exposed to the
extractants, and finally it can be used to extract analytes from both solid and liquid
samples. On the contrary, the main disadvantage of this extraction technique is the lack
of automation of the procedure. Ferrrer et al. [77] developed and evaluated a novel
analytical approach based on MSPD for the quantitative analysis of a selected group of
widely used pesticides which could be found at trace levels in olive oil and olives.
MSPD was used as a clean-up technique with a preliminary liquid-liquid extraction of
petroleum ether saturated with acetonitrile and acetonitrile saturated with petroleum

44
ether. Aminopropyl was used as sorbent material with a clean-up performed in the
elution step with Florisil, followed by mass spectrometric identification and
quantification of the selected pesticides using both GC-MS and LC-MS2. The recoveries
obtained in this research were between 85% and 115% with the recoveries for
cypermethrin were in the range between 103 and 126%.
Kodba et al. [81] proposed a new, single-step extraction and purification method
developed for the separation of 26 organochlorine pesticides, three pyrethroid pesticides
and six polychlorinated biphenyls (PCBs) from fatty foods of either animal or vegetable
origin. The method included homogenisation of extracted fat and diatomaceous earth.
Separation was achieved using a mini Pasteur pipette where MSPD technique was
carried out with only 5 mL of dimethylsulfoxide as an eluting solvent. A Pasteur pipette
was joined to a pre-packed slurry filled Florisil column, water deactivated to 15% where
a liquid-liquid extraction and adsorption chromatography successively took place. The
elution of the analytes was performed with n-hexane/diethyl ether. Excellent recoveries
were obtained for pyrethroid pesticides, mostly above 80% with recovery for
cypermethrin was 91% with RSD value of 9%. The authors claimed that the developed
method was more advantageous than the conventional extraction and purification
methods currently used for the sample preparation due to its greater sample throughput,
simplified sample preparation, and shorter sample preparation time.
Although many references are devoted to the development of analytical methods
to determine pesticide residues in vegetable oils especially olive oil, very few reports
documented the method for analyzing pesticide residues in palm oil [91-102]. Previous
studies of pesticides method development in palm oil matrices dealt with OC, OP,
paraquat, glyphosate, deltamethrin, glufosinate ammonium, and fluroxypyr. Currently,

45
cypermethrin and λ-cyhalothrin were not considered in the same matrices. Ainie et al.
[91, 97] evaluated the feasibility of the method developed by Imperial Chemical
Industry (ICI) in determining paraquat residue in palm oil and palm oil products using
ion exchange column chromatography and determination by spectrophotometer
measured at a wavelength of 396 nm. In this study, the method used for paraquat
analysis was an adaptation of the ICI United Kingdom method for oil containing crops
such as rapeseed, sunflower seed, olives and grain, vegetables, fruits and others. Two
different types of cationic exchange resins, Duolite and Amberlite, were studied for
paraquat recoveries from the oil matrix. From the study, the percentage recoveries
ranged from 50% to 83% using Duolite resin and greater than 90% when Amberlite
resin was used. The estimated limit of detection based on recovery data of this
experiment was 0.01 µg/g. According to the authors, the ICI method could be applied
for determination of paraquat residue in palm oil and palm oil products with Amberlite
resin that gave better recoveries compared to Duolite resin.
The same authors studied the application of gel permeation chromatography to
separate monocrotophos from RBD palm olein without preliminary liquid-liquid
extraction [93]. They reported a straightforward approach in GPC extraction technique
by direct introduction of the diluted oil into the GPC system. Fortified oil sample was
diluted with the elution solvent (cyclohexane:ethyl acetate [1:1]) and fraction of the
diluted oil sample was injected to the GPC instrument equipped with Bio-Beads SX-3.
Elution solvent was pumped through the column at a constant flow rate of 2.0 mL/min.
Determination of monocrotophos was done by gas chromatography with flame
photometric detector. The recoveries obtained in this research for monocrotophos
ranged between 74% and 102% with RSD of 3.5% - 13.5%. The limit of detection was
0.01 µg/mL. Their finding showed that the GPC approach without an extra Florisil or

46
Alumina column clean-up was suitable for the extraction of monocrotophos residue in
oil matrix. They also suggested that the developed method could be used as a multi-
residue clean-up technique for all organophosphorus pesticides in oil matrix. Other
studies by the same group of researchers dealt with glyphosate and deltamethrin
residues in palm oil matrix using cation exchange chromatography and GPC technique
respectively [98, 99].
Norizah [102] employed the QuEChERS technique for the determination of
glufosinate ammonium in palm oil matrix. This technique is also known as a dispersive
solid-phase extraction (d-SPE). It is one of the well known and popular techniques at
the moment employed in pesticide residues and other contaminants in food analysis. It
was first introduced in 2003 by Anastassiades et al. [103]. This technique is based on a
liquid partitioning of the oil sample with acetonitrile followed by a dispersive SPE
clean-up with mixture of different sorbents (C18, PSA, GCB, etc.). These steps
constitute a clean-up procedure that uses shaking, centrifugation, and dispersive SPE.
Amongst main advantages of this approach are its simplicity, cheap disposable reagents
and materials, small volume of organic solvent consumed, and high throughput. At the
moment, Norizah [102] was the first to apply this technique in palm oil matrix using
HPLC-MS2. In this study, the recoveries of glufosinate ammonium from fortified
samples were in the range of 77% to 109% with RSD values of less than 10%.
Additionally, the limit of detection of the method was 0.002 µg/g.
In another study, Yeoh et al. [100] proposed a method for the determination of
acephate, methamidophos, and monocrotophos in crude palm oil using low-temperature
precipitation and SPE clean-up. In this study, pesticide residues in crude palm oil were
extracted with acetonitrile, and a clean-up process was performed by cooling the entire

47
extract below 10 ºC, followed by a discolouring process using a carbon black SPE
cartridge. The extract was then analysed using gas chromatography coupled with a
pulsed flame photometry detector. In their early work to optimize the GC analysis, they
encountered the matrix effect, raised by the interaction between the active sites in the
GC system with the analytes of interest, causing the loss of analyte’s response and peak
tailing in the chromatogram. Although the use of matrix-matched standard proves to
reduce some of the effects caused by these active sites in other matrices, they opted not
to apply it in the analysis of palm oil samples since it could shorten the column life.
Hence, they used an analyte protectant instead, using d-xylose. The recoveries obtained
for all pesticides were acceptable in the range of 85-109% with RSD values less than
15%. The method was reported to be simple, fast, and cost effective with LOD of 0.01
µg/g.
Halimah et al. [92] worked with chlorpyrifos in refined palm olein using the
method adopted from Cloborn et al. [104] for determination of chlorpyrifos in milk and
body tissue of cattle. They investigated the suitability of the GC method for
determination of chlorpyrifos in oil samples using both ECD and FPD detectors. The
approach taken was liquid-liquid extraction using n-hexane and acetonitrile and clean-
up with self prepared silicic acid column chromatography. In the first experiment, the
FPD detector used gave the recoveries ranging from 89% to 100% with RSD values
from 3% to 11%. In the second experiment using ECD detector, the recoveries obtained
were greater than 97% with RSD values from 0.5% to 2%. As reported by the authors,
one of the advantages of using ECD is its ability to detect halogen atoms, in this case
chlorine. This enables the detection of both chlorpyrifos and its major metabolite (3, 5,
6-trichloro-2-pyridinol). As a detector, FPD only allows the detection of the phosphorus
atom. It won’t be able to detect the metabolite of chlorpyrifos since there is no

48
phosphorus atom in its metabolite. Hence, the GC methods using ECD and FPD
described in this study are sensitive enough for the determination of chlorpyrifos in
refined palm olein. Nevertheless, the GC with ECD detector is the preferred method
compared to FPD.
Later, the same authors proposed a comprehensive study on the optimization of
extraction and clean-up procedures for chlorpyrifos residue in RBD palm olein and
analyzed by gas chromatography with electron capture detector [94]. An improved
method for extraction and clean-up techniques of chlorpyrifos residue from oil matrix
was established after a series of trials. The authors optimized the clean-up and recovery
of the analyte by using commercial SPE cartridges packed with silica and eluents of
different composition and polarity. From the results obtained, optimization of all these
factors has resulted in greater than 90% recovery of chlorpyrifos from fortified oil
samples. According to the authors, the optimized polarity of the eluting solvent has
resulted in significant reduction of the eluent volume, without sacrificing the extraction
efficiency of chlorpyrifos residue. They also suggested that the proposed method to be
applicable for the analyses of chlorpyrifos residue in other vegetable oils.
Apart from organophosphorus pesticides (acephate, methamidophos,
monocrotophos, and chlorpyrifos), there are also literatures discussed on the
determination of organochlorine pesticide residues in palm oil and its products [95, 96].
Md. Pauzi et al. [95] studied and compared different types of extraction techniques, SPE
and sweep co-distillation (SCD), for the determination of 15 organochlorine pesticide
residues in refined palm oil by gas chromatography with electron capture detector. From
the study, it was found that the 15 OCPs tested were recovered well above 80% when
determined by both clean-up methods, except for endrin ketone with recoveries below

49
80%, which has gone through the SCD clean-up. According to the authors, the
conditioning step that consisted of two sub steps for SPE clean-up was vital in order to
avoid any extraneous peaks found in procedural blanks from commercial SPE cartridge.
These peaks have been attributed to phthalate plasticizers in the polypropylene housing
material of these cartridges. Apart from that, the slightly high mean recoveries were also
observed for p, p’-DDE (101.2%-105.6%) and p, p’-DDD (100.3%-15.9%) coupled
with a correspondingly low mean recovery of p, p’-DDT (84.6-89.4%) for SCD clean-
up. They suggested that this was due to the consistent minor breakdown of p, p’-DDT to
p, p’-DDE and p, p’-DDD in the hot distillation tubes. The authors also suspected that
degradation of structural properties might be responsible for these consistently low
recoveries of endrin ketone. In conclusion, they suggested that sweep co-distillation
clean-up were equivalent to SPE, except for endrin ketone compound.
Later, Halimah et al. [96] developed an optimum condition for the quantitative
recovery of organochlorine pesticide residues in palm oil using a commercial sweep co-
distillation apparatus. They studied the parameters affecting the efficiency of this
technique such as distillation fractionation tube temperature, nitrogen carrier flow,
sweep time, and eluting solvent mixture. They discovered that under the optimized
condition (245 ºC distillation temperature, 250 mL/min nitrogen flow rate, and 45 min
sweep time) and using a trap packed with sodium sulphate and partially deactivated
Florisil, the recoveries of 14 organochlorine pesticide residues at ppm and ppb levels in
fortified oil matrix were more than 80%, with RSDs ranged from 5.6% to 9.9%.
However, they were unable to get a good recovery for endrin ketone (below 80%).
These results were comparable with the previous research by Md. Pauzi et al. [95].

50
A recently published work dealt with the determination of the herbicide
fluroxypyr in CPO and CPKO by high performance liquid chromatography with diode
array detector [101]. In this study, herbicide residue was extracted from the palm oil
matrices by liquid-liquid extraction, followed by low-temperature precipitation to
separate the analyte from the bulk oil matrices. The extraction method used in this
experiment was a modification of the multi-residues method outlined by Gillespie et al.
[105]. The authors replaced commercial C18 SPE cartridges by low-temperature
precipitation clean-up in order to separate the analyte from matrix interferences. This
technique proved to be a cheaper approach compared to the SPE clean-up since no
special apparatus and glassware were needed for the low-temperature step. The recovery
of fluroxypyr obtained from CPO and CPKO were 78-111% and 91-107% respectively,
with a minimum detection limit of 0.05 µg/g for both CPO and CPKO. According to the
authors, when fluroxypyr was used for weed control in oil palm plantations, no residue
was detected in CPO and CPKO, irrespective of the sampling interval and the dosage
applied at the recommended or doubles the manufacturer’s recommended dosage.
2.2 OBJECTIVES
The purpose of this work was to develop a simple, cheap, and efficient method
of extraction and analysis of cypermethrin and λ-cyhalothrin residues in crude palm oil
(CPO) and crude palm kernel oil (CPKO) based on low-temperature extraction using
acetonitrile. Then, solid-phase extraction (SPE) and dispersive solid-phase extraction
(d-SPE) were tested as clean-up procedures to obtain the best overall recoveries for
cypermethrin and λ-cyhalothrin.

51
2.3 EXPERIMENTAL
2.3.1 REAGENTS AND MATERIALS
HPLC grade acetone and acetonitrile were obtained from Merck (Darmstadt,
Germany) while reagent grade anhydrous MgSO4 and NaCl were obtained from
Supelco Inc. (Bellefonte, PA, USA). Both pesticide standards of cypermethrin and λ-
cyhalothrin with the purity of >97%, were purchased from Dr. Ehrenstorfer (Augsburg,
Germany). For the dispersive-SPE method, bulk primary secondary amine (PSA, 100 g)
and Supelclean ENVI-Carb graphite carbon black (GCB, 50 g) were used as the
sorbents and they were both purchased from Supelco Inc. (Bellefonte, PA, USA).
SPE cartridges used for the clean-up experiments were graphitized carbon black
(Carbograph, 500 mg/6 mL) obtained from Alltech Inc. (Deerfield, IL, USA) and C18
(LiChrolut RP-18, 500 mg/6 mL) purchased from Merck KGaA (Darmstadt, Germany),
while primary secondary amine (PSA, 500 mg/2 mL), Florisil (500 mg/6 mL), and
Silica (500 mg/6 mL) were all supplied by International Sorbent Technology (Hengoed,
Mid-Glamorgan, UK).
2.3.2 APPARATUS AND GLASSWARE
Microliter pipettes, adjustable between 100 and 1000 µL, and pipette tips were
obtained from Eppendorf (Hamburg, Germany), while SPE vacuum manifold was from
Supelco Inc. (Bellefonte, PA, USA). Microvials (2 mL) for GC injection were
purchased from Agilent (Palo Alto, CA, USA) and vortex mix used in the sample
extraction and partition step, was obtained from Barnstead/Thermolyne Inc. (Dubuque,
IA, USA). Ten mL graduated vials used to collect the analytes eluted from the SPE
cartridges were obtained from Alltech Inc. (Deerfield, IL, USA). N-Evap nitrogen
evaporator for sample concentration was obtained from Organomation Associates Inc.

52
(South Berlin, MA, USA). Finally, screw cap test tubes with various sizes (50 mL and
15 mL) were purchased from Favorit. All glassware were cleaned thoroughly using
cleaning detergent and rinsed with tap water before drying in an oven at 60 ºC. Prior to
use, the glassware were again rinsed with acetone and dried in an oven to get rid of any
impurities that could not be removed by water.
2.3.3 INSTRUMENTATION
Sample extracts were analyzed on an Agilent Model 6890 series gas
chromatograph equipped with a 7683 auto-sampler, split/splitless injector, and an ECD
operated at 280 ºC (Agilent Technologies). The injection mode was splitless operated at
250 ºC and the injection volume was 2.0 µL. This is the most that could be injected
without overfilling the liner, since with these conditions the approximate vapour volume
is 794 µL. The inlet pressure was 15.56 psi while the purge flow was 20.0 mL/min with
purge time of 2 min. A DB-608 column (30 m x 0.25 mm i.d. x 0.25 µm film thickness,
Agilent Technologies) was used to separate the analytes. Nitrogen was used as a carrier
and makeup gas, with flow rate for the carrier gas and makeup gas were at 1.2 mL/min
and 60 mL/min respectively. The equilibration time for the oven was set at 1 min. The
initial temperature was 100 ºC, with an initial time of 1 min. The oven was heated to
250 ºC at 10 ºC/min, then to 280 ºC at 3 ºC/min, and finally held at 280 ºC for 15 min.
The post-run temperature was 280 ºC (held for 5 min) and the total runtime was 41 min.
Chemstation software was used for instrument control and data analysis. Calibration
curve was carried out using seven external standards at concentration of 0.01, 0.02,
0.05, 0.08, 0.10, 0.50, and 1.00 µg/mL.

53
2.3.4 PREPARATION OF STOCK STANDARD SOLUTIONS
Individual stock standard solutions of each pesticide were prepared in acetone at
concentration of 2000 µg/mL by dissolving 0.1 g of cypermethrin and λ-cyhalothrin in
50 mL acetone and stored refrigerated at -20 ºC in amber glass-stopped bottles in the
dark. Then, intermediate working standard solutions were prepared by dilution of the
stock solutions in acetone to give mixed pesticide standards of 100 µg/mL and 10
µg/mL. Finally, serial dilutions of the mixed working standard solutions were
performed to give seven calibration solutions (0.01, 0.02, 0.05, 0.08, 0.1, 0.5, 1 µg/mL)
in acetone. All the standard solutions were stored in scintillation vials at 4 ºC in the
refrigerator. Furthermore, the standard mixture solutions were prepared freshly
everyday in order to prevent any errors that can affect the results raised from the
possible degradation of the pesticides.
2.3.5 CPO AND CPKO SAMPLES FOR FORTIFICATION
In the method development and validation studies, the crude oil investigated
should be free from cypermethrin and λ-cyhalothrin residues. A blank crude palm oil
(CPO) that is used as a control was obtained from MPOB Labu refinery, while blank
crude palm kernel oil (CPKO) was obtained from Felda Pandamaran refinery. Samples
of CPO and CPKO were melted at 60 ºC in an oven and then homogenized by shaking
the samples. After homogenization, recoveries of cypermethrin and λ-cyhalothrin were
determined using oil samples at fortification levels of 0.05, 0.08, 0.1, 0.5, and 1.0 µg/g.
Each solution used to provide fortification was prepared by measuring an appropriate
amount of pyrethroid reference standard into a known quantity of acetone solution.
Then, an appropriate amount (1.0 mL) of the fortification solution was evenly pipetted
into a screw cap test tube containing 5.0 g of the oil sample. After homogenization for 5
54
minutes using vortex mixer, the fortified samples were allowed to stand for 30 minutes
prior to analysis.
2.3.6 REAL SAMPLES FOR MONITORING STUDY
A total number of 30 crude palm oil samples were used in the monitoring study.
The CPO samples were collected from different producers, refineries, and regions of
Malaysia, which obtained from Registration and Licensing Department, Wisma Sawit,
MPOB Kelana Jaya. Each sample was analysed for the pesticide residues using the
developed method in triplicate.
2.3.7 ANALYTICAL PROCEDURES
In the method development, two types of extraction techniques were tested for
the best overall extraction efficiency of the pyrethroid insecticides in CPO and CPKO.
The first technique was based on low-temperature precipitation of the oil matrices from
the acetonitrile layer, followed by solid-phase extraction clean-up using commercial
SPE cartridges. Initial tests were carried out to optimize the extraction and clean-up
procedure. In this study, extraction volume and freezing time were investigated and
optimized. Furthermore, 6 types of SPE sorbents (GCB, PSA, GCB/PSA, C18, Florisil,
and Silica) were tested in the clean-up step.
In the second approach, dispersive-SPE technique was studied as the clean-up
step after extraction by low-temperature precipitation with acetonitrile. The combination
of magnesium sulphate with PSA, and with both PSA and GCB were evaluated for their
clean-up efficiency of the samples.

55
2.3.7.1 SOLVENT EXTRACTION AND LOW-TEMPERATURE
PRECIPITATION
Samples of 5.0 g homogenous oil (CPO or CPKO) were transferred into 50-mL
screw cap test tubes. Each sample was fortified with a suitable volume of working
standard solution for the recovery experiment. The fortified samples were mixed well
using a vortex mixer and allowed to stand for 30 minutes for equilibration. Acetonitrile
(10, 15, and 20 mL) was added to the fortified samples in each tube and the mixtures
were shaken for 5 minutes using a vortex mixer. The oil precipitated to the bottom of
the test tubes, and the acetonitrile extract rose to the top. Each tube was kept either
horizontally or vertically in a freezer (-20 ºC) for 1, 2, or 24 hours for oil precipitation
before undergoing clean-up procedure.
2.3.7.1 (A) SOLID PHASE-EXTRACTION CLEAN-UP
SPE cartridges were first conditioned with 5 mL acetonitrile. An aliquot (equal
to 20% of the original volume) of the upper layer of the acetonitrile extract from the
low-temperature extraction step was transferred into the cartridge. The extract was
initially allowed to flow under gravity, and then a gentle pressure was applied to
achieve a flow of approximately one drop per second. Collection of the eluate was
begun at this point into a 10-mL graduated vial. The column was then eluted with an
additional acetonitrile and the volume collected was adjusted to 5 mL. Finally the eluate
was mixed and ready for GC analysis.

56
2.3.7.1 (B) DISPERSIVE SOLID-PHASE EXTRACTION CLEAN-UP
An aliquot (1 mL) of the upper layer of the acetonitrile extract from the low-
temperature extraction step was transferred to a dispersive-SPE tube containing one of
the following for testing: (1) 0.3 g of anhydrous MgSO4, (2) 0.3 g of anhydrous MgSO4
and 0.1 g of PSA, (3) 0.3 g of anhydrous MgSO4, 0.1 g of PSA and 0.025 g of GCB, (4)
0.3 g of anhydrous MgSO4, 0.2 g of PSA, and (5) 0.3 g of anhydrous MgSO4 and 0.3 g
of PSA. The tubes were then capped tightly, and shaken for 1 min before centrifuged at
3000 rpm for 1 minute. Finally, 0.5 mL aliquot of extract solution from each tube was
transferred to vials for GC analysis.
2.3.8 QUANTIFICATION AND METHOD VALIDATION
In order to construct the calibration curve, seven working standard solutions
(0.01, 0.02, 0.05, 0.08, 0.1, 0.5, 1 µg/mL) were analysed by GC-ECD for each
concentration level. The signal for each pesticide was measured for its peak area and an
individual calibration plot for cypermethrin and λ-cyhalothrin was constructed. The
linearity of the signals from the instrument was studied during the construction of the
calibration curve. The percent recovery was determined in six replicate experiments at 5
concentration levels (0.05, 0.08, 0.1, 0.5, and 1.0 µg/g) by comparing the analyte peak
area from the fortified samples with that of the standard calibration solutions. The
recovery was calculated using the following equation:
% recovery = Afortified / Astandard
where,
Afortified = peak area of fortified sample
Astandard = peak area of pyrethroid standard

57
The pyrethroid content (µg/g) in the sample for the monitoring study was calculated
using the following equation:
Pyrethroid concentration (µg/g) = Vextraction x Vfv x Asample x concentration of standard
Valiquot x W x Astandard (µg/mL)
where,
Vextraction = volume of extraction solution (mL)
Vfv = volume of final solution (mL)
Valiquot = volume of aliquot taken (mL)
W = sample weight (g)
Asample = peak area of sample solution
Astandard = peak area of standard solution
In this experiment, no internal standard was applied for quantification in the GC-
ECD method since GC auto-sampler was used during the injection of samples.
Repeatability of the chromatographic method for the electron capture detector was
determined by injection of 0.2 µg/mL standard solution and oil fortified at 0.2 µg/g.
Both the standard solution and fortified oil were injected ten times via an auto-sampler.
The accuracy and precision of the method were expressed in terms of recovery and RSD
respectively in six replicate measurements. The specificity of the proposed method was
assessed by analyzing blank oil samples, while the limit of detection (LOD) and limit of
quantification (LOQ) of the proposed method were determined by considering a value
of 3 and 10 times of the background noise obtained from blank samples.

58
2.4 RESULTS AND DISCUSSION
2.4.1 OPTIMIZATION AND SELECTION OF SAMPLES PRE-TREATMENT
In this thesis, both types of clean-up techniques were optimized and applied to
crude palm oil (CPO) and crude palm kernel oil (CPKO) in order to obtain the best
extraction and clean-up efficiency of cypermethrin and λ-cyhalothrin residues. Different
sorbents for SPE were studied for their clean-up efficiency to remove matrix
interferences in the extracts. While for the d-SPE technique, different combinations of
sorbent materials were tested. Cleanliness of the extracts presented in the
chromatograms and good recoveries were the main criteria for the method selection.
2.4.2 SOLVENT EXTRACTION AND LOW-TEMPERATURE
PRECIPITATION EXTRACTION
As mentioned earlier, the extraction method applied in this study was a
modification of the method for multiresidue analysis as outlined by Lentza-Rizos et al.
[75]. This basic procedure is based on a liquid partitioning of the oil with acetonitrile
without the involvement of hexane. In the extraction step, acetonitrile was chosen as the
extraction solvent since it is the only few solvents that immiscible with oil, including
methanol. To date, acetonitrile is probably the most extensively used solvent for the
sample extraction of pyrethroids in vegetable oils [73, 75-80, 82, 100].
In the initial tests, variations in the extraction techniques and parameters
previously mentioned (extraction volume, position of the test tube in the freezer,
decanting the liquid phase immediately after freezing, and freezing time) generally had
little effect on the mean recovery of both cypermethrin and λ-cyhalothrin. This showed
that the method was adequately robust to be successfully applied by inexperienced
technicians. Nonetheless, it is very important to optimize the extraction procedure in

59
order to save the time and solvent used. The effects on the recovery of (i) the
acetonitrile volume, (ii) decanting the liquid phase from the precipitated oil after low-
temperature precipitation, and (iii) the freezing time were studied. In the first step,
different volumes of acetonitrile were investigated in this work to optimize the
extraction procedure. Volume ratios of sample to solvent of 1:2, 1:3, and 1:4 were
employed, which gave 10, 15, and 20 mL of acetonitrile to each of 5 g oil sample. Then,
recoveries for each volume were calculated and evaluated to obtain the optimum
volume of acetonitrile needed.
In this study, fortified CPO samples (0.1 µg/g) were extracted in four replicates
by solvent extraction for 5 minutes with 10, 15, and 20 mL of acetonitrile, followed by
low-temperature precipitation at -20 °C for 24 hours. SPE (GCB/PSA) was applied as
the clean-up step. Table 2.1 shows the effect on the recovery of the acetonitrile volume.
Finally, the results obtained were analysed using analysis of variance (ANOVA) test to
check whether there is potential difference among the three extraction volumes tested.
This method uses a single test to determine whether there is or is not a difference among
the population means rather than pair-wise comparisons, as is done with the t-test [106].
In this single-factor ANOVA procedure for various ACN volumes, the null hypothesis
H0 was of the form
H0: µ10mL = µ15mL = µ20mL
µ10mL = mean recovery for 10 mL acetonitrile extraction
µ15mL = mean recovery for 15 mL acetonitrile extraction
µ20mL = mean recovery for 20 mL acetonitrile extraction
60
and the alternative hypothesis Ha was
Ha: at least two of the mean recoveries are different.
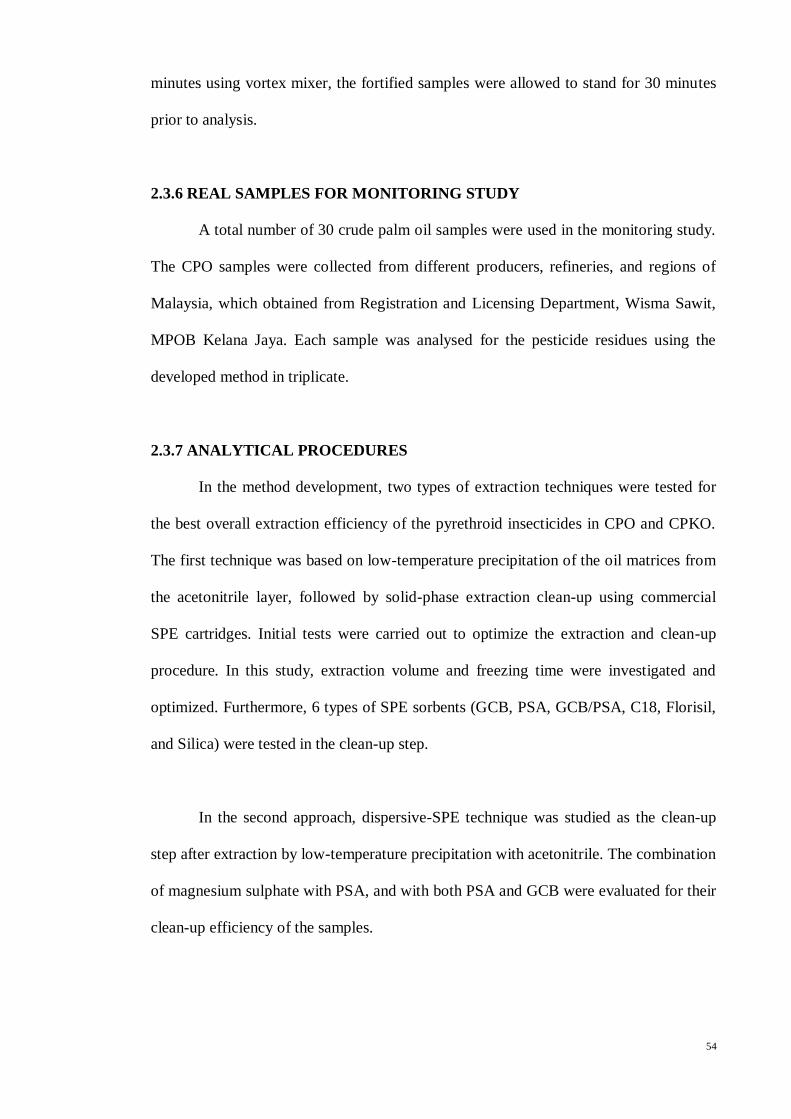
Table 2.1: Recoveries and relative standard deviation (RSD) of pyrethroids from CPO
obtained by low-temperature precipitation (24 hours, -20 °C) and SPE (GCB/PSA)
clean-up with various volume of acetonitrile (n=4)
Compound
0.1 µg/g
10 mL 15 mL 20 mL
Recovery
(%)
RSD
(%)
Recovery
(%)
RSD
(%)
Recovery
(%)
RSD
(%)
λ-cyhalothrin 92.49 1.62 89.98 4.68 94.63 3.34
cypermethrin 86.93 1.44 89.77 2.14 85.61 5.4
To complete the hypothesis test, the calculated F value was compared with the
critical value obtained from the F-value table (Appendix 2) at the 95% confidence level.
The results of ANOVA test were summarized in Table 2.2 and Table 2.3 for λ-
cyhalothrin and cypermethrin respectively. From the ANOVA tests, the calculated F
value was 2.17 for λ-cyhalothrin and 2.04 for cypermethrin. Since these values were
smaller than the critical F-value (4.26) at the 95% confidence level, the null hypothesis
H0 was accepted and concluded that there was no significant difference among the mean
recoveries for both insecticides and hence the three extraction volumes gave equivalent
results. Thus, increasing the volume of acetonitrile from 10 mL to 15 mL and finally to
20 mL gave no significant difference. In addition, all extraction volumes gave
satisfactory recoveries (70 - 120%), as shown in Table 2.1. Although the recoveries
were higher for 15 mL (cypermethrin) and 20 mL (λ-cyhalothrin), 10 mL of ACN was
selected since higher volume of extraction solvent would not only extracts the analyte of

61
interest, but would also bring along other impurities from oil matrix, and consequently
harm the ECD detector, not to mention the additional waste of the solvents discharged
to the environment.
In the meantime, 5 mL of ACN was not tested since other volumes lower than
10 mL was not always sufficient to allow acceptable removal of the required aliquot
from the mixtures without taking unwanted frozen material. So, the minimum volume of
the extraction solvent needed for the analyte extraction from the oil sample was opted to
be twice the sample weight (5 g), which is 10 mL.
Table 2.2: ANOVA test for various volume of ACN, n = 4 (λ-cyhalothrin)
SUMMARY
Acetonitrile
volume (mL) Count Sum Average Variance
10 mL 4 369.97 92.49 2.26
15 mL 4 359.90 89.98 17.77
20 mL 4 378.50 94.63 9.99
ANOVA
Source of
Variation
Sum of
Squares (SS)
Degrees of
Freedom
(df)
Mean
Square
(MS)
F
(calculated)
F
(critical)
Between Groups 43.34 2 21.67
2.17 4.26 Within Groups 90.06 9 10.01
Total 133.40 11

62
Table 2.3: ANOVA test for various volume of ACN, n=4 (cypermethrin)
SUMMARY
Groups Count Sum Average Variance
10 mL 4 347.73 86.93 1.56
15 mL 4 359.08 89.77 3.70
20 mL 4 342.44 85.61 21.35
ANOVA
Source of Variation Sum of
Squares (SS)
Degrees
of
Freedom
(df)
Mean
Square
(MS)
F
(calculated)
F
(critical)
Between Groups 36.14 2 18.07
2.04 4.26 Within Groups 79.84 9 8.87
Total 115.98 11
Secondly, the minimum time for which the sample needed to be left in the
freezer at -20 ºC for fat precipitation was studied. From the recovery table shown in
Table 2.4, all three freezing durations studied gave acceptable recoveries (70 – 120%)
for both λ-cyhalothrin and cypermethrin from fortified CPO samples (0.1 µg/g). In this
study, an hour was picked as the minimum freezing time whereas 24 hours was selected
as the maximum freezing time to freeze and finally precipitate the oil sample in the
mixture. The results obtained in this study showed that there was no significant
difference in both cypermethrin and λ-cyhalothrin recovery when the freezing time was
varied between 1, 2, and 24 hours as shown in Table 2.4. To confirm this assumption, a
statistical analysis was used. An ANOVA test applied to these data showed no
significant difference on the mean recoveries among the different freezing duration at
95% confidence level. Hence, null hypothesis H0 was accepted,

63
H0: µ1hr = µ2hrs = µ24hrs
µ1hr = mean recovery for 1 hour freezing time
µ2hrs = mean recovery for 2 hours freezing time
µ24hrs = mean recovery for 24 hours freezing time
while the alternative hypothesis Ha (at least two of the mean recoveries are different)
was rejected.
Table 2.4: Recoveries and relative standard deviation (RSD) of pyrethroids from CPO
obtained by low-temperature precipitation (10 mL ACN, 24 hours, -20 °C) and SPE
(GCB/PSA) clean-up with various freezing time (n=4)
Compound
0.1 µg/g
1 hr
2 hr
24 hr
Recovery
(%)
RSD
(%)
Recovery
(%)
RSD
(%)
Recovery
(%)
RSD
(%)
λ-cyhalothrin 95.39 3.59 96.68 1.04 95.32 2.61
cypermethrin 91.33 1.17 90.16 2.55 93.00 0.37
The results of ANOVA tests were summarized in Table 2.5 and Table 2.5 for λ-
cyhalothrin and cypermethrin respectively. For both pesticides, the calculated F value
was smaller than the F-critical value at 95% confidence level. Thus, increasing the time
in the freezer would not make any different when recoveries are concern and the
minimum time for satisfactory fat removal during low-temperature precipitation was
found to be 2 hours. Meanwhile, one hour was not sufficient to freeze the oil
completely, with small pieces of dispersed frozen oil still present in the acetonitrile
layer. In this case, it could hinder the possibility of removing sufficient extract without

64
also taking any solid frozen material. In the meantime, 24 hours was too time
consuming and not very efficient in method development.
Table 2.5: ANOVA test for various freezing time, n=4 (λ-cyhalothrin)
SUMMARY
Groups Count Sum Average Variance
1 hour 4 381.55 95.39 11.75
2 hours 4 386.73 96.68 1.01
24 hours 4 381.27 95.32 6.17
ANOVA
Source of Variation Sum of
Squares (SS)
Degrees of
Freedom
(df)
Mean
Square
(MS)
F
(calculated)
F
(critical)
Between Groups 4.73 2 2.363
0.37 4.26 Within Groups 56.81 9 6.313
Total 61.54 11

65
Table 2.6: ANOVA test for various freezing time, n=4 (cypermethrin)
SUMMARY
Groups Count Sum Average Variance
1 hour 4 365.32 91.33 1.14
2 hours 4 360.63 90.16 5.27
24 hours 4 372.00 93.00 0.12
ANOVA
Source of
Variation
Sum of
Squares (SS)
Degrees of
Freedom
(df)
Mean
Square
(MS)
F
(calculated)
F
(critical)
Between Groups 16.32 2 8.16 3.75 4.26
Within Groups 19.60 9 2.18
Total 35.92 11
The third preliminary study referred to the positioning of the test tubes in the
freezer. Initially, test tubes of sample mixtures were placed vertically in a separate
beaker during the freezing step, leaving the frozen oil precipitated on the bottom of test
tubes. However, it was then found that it was better and easier to remove an aliquot of
extract from the frozen oil if the test tubes were kept horizontally in the freezer. On the
removal from the freezer, the test tubes were instantaneously stood vertically, leaving
the frozen oil adhered to the test tube wall. Finally, the effect of decanting the liquid
phase after freezing step was investigated.

66
In this test, two techniques were tested; the first was decanting the liquid phase
immediately to a small beaker after the freezing step, while the second involved directly
pipetting aliquot from sample mixtures. Fortified CPO samples (0.1 µg/g) were
extracted with 10 mL of ACN and frozen for 2 hours for oil precipitation before clean-
up with GCB/PSA SPE cartridges. Table 2.7 exhibited the effects on recoveries of these
techniques where both of them gave acceptable recoveries (70-120%). A t-test analysis
of these data showed no significant difference between the mean recoveries at 95%
confidence level, indicating that whichever techniques used, it had no effects on the
recoveries. The critical value of t at the 95% confidence level for 6 degrees of freedom
was 2.45 obtained from t-value table (Appendix 1). Since this value was greater than the
calculated t-value for both λ-cyhalothrin (0.59) and cypermethrin (0.42), null hypothesis
H0 was accepted,
H0: µdec = µnotdec
µdec = mean recovery for decanted aliquot
µnotdec = mean recovery for not decanted aliquot
while the alternative hypothesis Ha (µdec ≠ µnotdec) was rejected and hence it can be
deducted that the way the aliquot was taken from the mixtures was not a factor that can
influence the recovery of pesticides from the oil.

67
Table 2.7: Effect on recoveries and relative standard deviation (RSD) of decanting the
liquid phase after freezing of pyrethroids from CPO (2 hours, -20 °C, 10 mL ACN), n=4
Compound
0.1 µg/g
Decanted In contact with solid
Recovery (%) RSD (%) Recovery (%) RSD (%)
λ-cyhalothrin 92.36 1.33 93.2 2.76
cypermethrin 98.03 1.09 98.28 0.56
From the statistical data analysis and on the basis of the preliminary tests
described above, the optimized solvent extraction and low-temperature precipitation
was as follows: a 5 g of oil was weighed out into a 50-mL screw cap test tube. Then, 10
mL of acetonitrile was added and the mixture was mixed and homogenized using a
vortex mixer for 5 minutes. After homogenization, the mixture was left to stand for a
while to allow phase separation between the oil and acetonitrile layer. Normally good
separation took about 1-2 min for CPO and a little bit quicker for CPKO. The test tube
was then transferred into the freezer and kept horizontally for a minimum of 2 hours for
oil precipitation. After 2 hours, the test tube was removed from the freezer slowly and
carefully, taking care not to disturb the precipitated solids. Then, it was kept vertically
leaving the frozen oil adhered to the test tube wall. The acetonitrile extract was
transferred immediately using a Pasteur pipette into a small beaker, leaving the frozen
oil in the test tube. It was left for a while before an aliquot of the extract underwent the
clean-up step. Two different clean-up methodologies were tested for co-extractives
elimination: (i) solid-phase extraction (SPE); and (ii) dispersive solid-phase extraction
(d-SPE).

68
2.4.3 SOLID-PHASE EXTRACTION CLEAN-UP
One highly important aspect in SPE is the selection of sorbent [107]. This would
depend on both the analyte and the matrices studied. In this work, initial tests were
made to evaluate the capacity of different sorbent materials to remove traces of oil and
other co-extractants remaining in oil extracts after an initial extraction step. Then, the
chromatograms were assessed for baseline noise and presence of interfering peaks. A
brief description and characteristics of these materials are shown in Table 2.8.
Table 2.8: Characteristics of SPE cartridges studied
SPE Cartridge Symbol in
Study Sorbent Material Retention Mechanism
Carbograph
Extract-Clean GCB
Graphitized non-Porous
carbon
Reversed phase or
adsorption
Isolute-PSA PSA
Polymerically bonded
Primary secondary
amine
Weak anion exchange
LiChrolut RP-
18 C18
Polymerically bonded
octadecyl silane Reversed phase
Isolute-Silica Silica Silica gel Adsorption
Isolute-Florisil Florisil Magnesium silicate Adsorption
The extract of the optimized solvent extraction and low-temperature
precipitation was subjected to clean-up procedures via different SPE cartridges based on
different sorbent materials in order to find the most efficient clean-up that would allow
the determination and quantification of both cypermethrin and λ-cyhalothrin by GC-
ECD. CPO samples which fortified at three different fortification levels (0.05, 0.08, and
0.2 µg/g) were extracted with the optimized acetonitrile extraction and low-temperature
precipitation described previously. Then, the extracts were cleaned using six SPE
cartridges according to the procedure discussed in section 2.3.7.1 (A). In this procedure,

69
the SPE sorbents acted as chemical filters and retained the matrix co-extractants while
allowing the insecticides to be eluted.
The mean recoveries (n = 3) of cypermethrin and λ-cyhalothrin determined by
GC-ECD are shown in Table 2.9. For cypermethrin, the recoveries ranged from 94.7%
to 97.8% for GCB/PSA, from 91.6% to 96.2% for GCB, from 86.0% to 93.4% for PSA,
from 84.1% to 95.7% for C-18, from 89.8% to 92.4% for Florisil, and from 90.7% to
93.7% for Silica. On the other hand, the recoveries for λ-cyhalothrin ranged from 90.3%
to 98.6% for GCB/PSA, from 91.0% to 95.6% for GCB, from 67.6% to 82.9% for PSA,
from 81.5% to 102.1% for C-18, from 63.6% to 71.8% for Florisil, and from 86.5% to
93.5% for Silica. Representative bar charts for the recoveries of both cypermethrin and
λ-cyhalothrin cleaned with various SPE cartridges were plotted and showed in Figure
2.1 and Figure 2.2, respectively. The results showed that all SPE sorbents studied gave
acceptable recovery values for cypermethrin, while for λ-cyhalothrin all sorbents except
for Florisil gave acceptable recoveries. The highest mean recovery for both insecticides
among the studied sorbents was exhibited by the combination of GCB/PSA. On the
other hand, the highest precision in term of RSD was shown by Florisil for
cypermethrin and GCB for λ-cyhalothrin.

70
Table 2.9: Recoveries of pyrethroids from CPO spiked at 3 concentration levels with various SPE sorbents clean-up
n = 3
Pesticides
Spiking
levels (μg/g)
GCB/PSA GCB PSA C-18 Florisil Silica
Recovery (%)
RSD (%)
Recovery (%)
RSD (%)
Recovery (%)
RSD (%)
Recovery (%)
RSD (%)
Recovery (%)
RSD (%)
Recovery (%)
RSD (%)
Cypermethrin
0.05 97.76 6.03 94.21 3.71 92.41 7.44 95.67 5.96 89.75 4.3 93.66 6.22
0.08 94.70 3.60 96.18 3.62 93.39 1.3 93.43 4.00 92.41 3.99 93.09 2.44
0.20 95.81 4.26 91.58 6.86 85.96 5.08 84.10 20.70 90.49 8.16 90.69 8.42
mean 96.09
93.99
90.59
91.07
90.88
92.48
RSD 1.61
2.46
4.46
6.74
1.51
1.70
λ-cyhalothrin
0.05 98.59 4.61 95.58 2.94 82.91 13.2 102.07 11.11 71.63 18.8 93.53 8.01
0.08 90.27 3.40 91.45 5.79 78.54 7.22 90.04 3.03 71.79 8.58 89.35 7.06
0.20 91.77 4.63 90.98 5.59 67.59 6.71 81.54 14.04 63.63 12.26 86.45 7.68
mean 93.54
92.67
76.35
91.22
69.02
89.78
RSD 4.74
2.73
10.34
11.31
6.76
3.96

71
Figure 2.1: Recoveries (n = 3) of cypermethrin from CPO analyzed by GC-ECD and
fortified at 0.05, 0.08, and 0.2 µg/g with various SPE sorbents clean-up
Figure 2.2: Recoveries (n = 3) of λ-cyhalothrin from CPO analyzed by GC-ECD and
fortified at 0.05, 0.08, and 0.2 µg/g with various SPE sorbents clean-up
75
80
85
90
95
100
GCB/PSA GCB PSA C-18 Florisil Silica
Re
cove
ry (%
)
SPE sorbents
0.05 μg/g
0.08 μg/g
0.20 μg/g
0
20
40
60
80
100
120
GCB/PSA GCB PSA C-18 Florisil Silica
Rec
ove
ry (%
)
SPE sorbents
0.05 μg/g
0.08 μg/g
0.20 μg/g

72
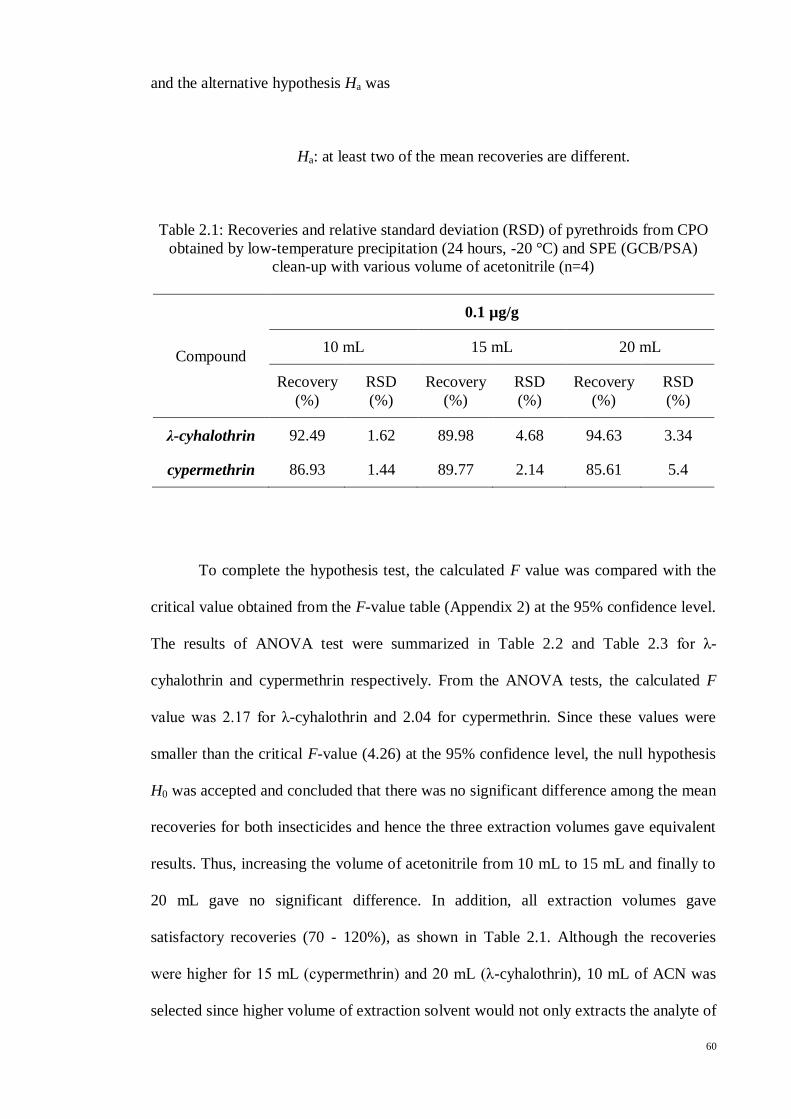
GC-ECD chromatograms for oil extracts fortified with 0.2 µg/g pesticides were
obtained after using each of the previously clean-up SPE sorbents in order to know the
peak outline and differences between the compared sorbents (Figure 2.3 A-F). In the
meantime, for easy comparison, Figure 2.4 showed the pyrethroid standards in acetone.
From the aforementioned chromatograms, we can see that high interference peaks were
eluted between 4 and 17 minutes, and several minor peaks were observed between 29
and 36 minutes, both of which were before and after the pyrethroid compounds
retention time respectively.
Silica and C-18 cartridges were not considered further in the clean-up method
development since their chromatograms showed the early (4-17 min) and late (29-31,
33, and 36 min) interference peaks. Consequently, there were three sorbents left for
consideration in the clean-up step in this work; GCB, PSA, and Florisil. The similar
effect of PSA and Florisil can be seen in the chromatograms, since both sorbents gave
cleaner early interference peaks in the range 4-17 min. While for the late interferences,
both sorbents significantly decreased the peaks in the range 29-31 min, but the peaks at
33 min and 36 min were still present. The only difference between these two sorbents
was the elimination of sharp peak at 9 min retention time by PSA, which Florisil was
unable to remove it, and as a consequence rejected from the method development. In the
case of GCB, the early eluted interferences were quite nasty from 4-17 min, but lower
interference peaks were observed at 33 min and 36 min. The main purpose of using
GCB was to remove the carotenoids in the oil as decolorizing effect, resulting in a clear
and colourless final solution of the sample as shown in Figure 2.5 (A) and Figure 2.5
(B). This is because GCB has a strong affinity towards planar molecules and thus
effectively removes pigments (carotenoids) as well as sterols that are commonly present
in foods [85]. Nevertheless, sometimes clear and colourless extracts are not necessarily

73
indicated that the extracts are cleaner than coloured counterparts in residue analysis,
because some nasty matrix components are clear and colourless in solution. On the
other hand, some benign components are strongly coloured even at low concentration,
such as chlorophyll. Summary of chromatograms profile obtained for SPE sorbents
comparison study is shown in Table 2.10.
Table 2.10: Summary of SPE sorbents comparison study
SPE sorbents GC-ECD chromatogram
4-17 min 29-31 min 33 min 36 min
GCB/PSA Cleaner Cleaner Cleaner Cleaner
GCB Dirtier Dirtier Cleaner Cleaner
PSA Cleaner Cleaner Dirtier Dirtier
C-18 Dirtier Dirtier Dirtier Dirtier
Florisil Cleaner Cleaner Dirtier Dirtier
Silica Dirtier Dirtier Dirtier Dirtier
Higher interference peaks Lower interference peaks
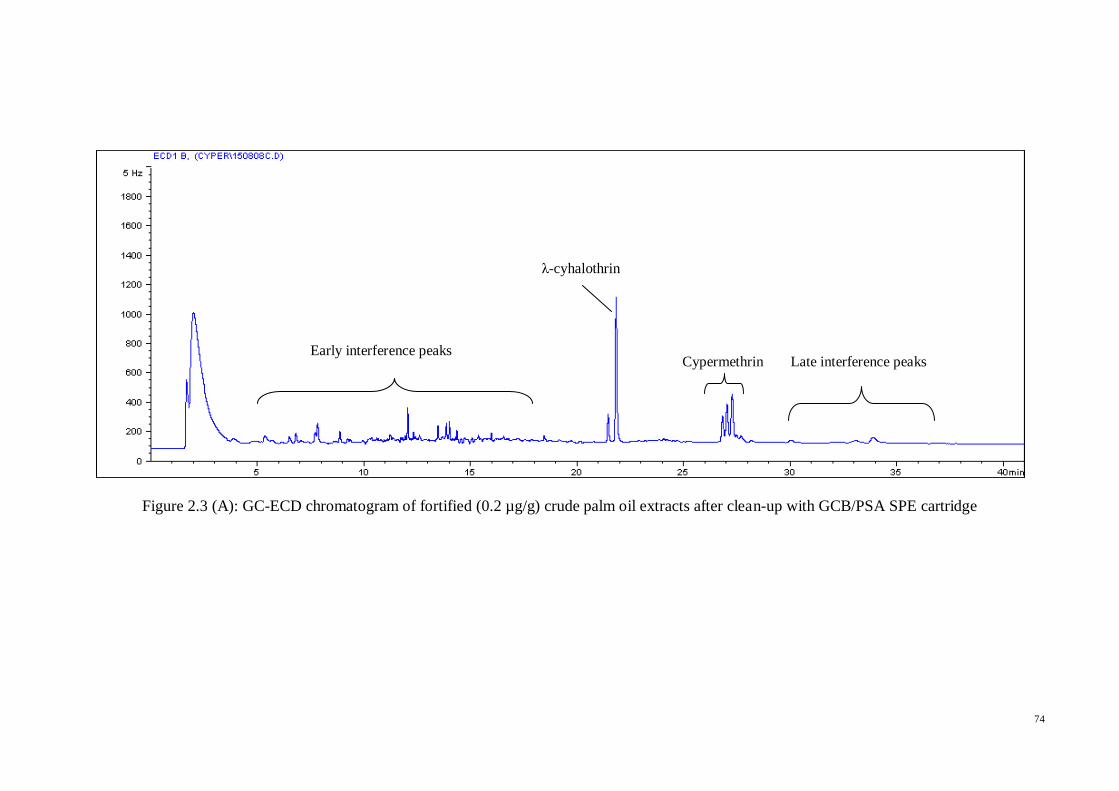
74
Figure 2.3 (A): GC-ECD chromatogram of fortified (0.2 µg/g) crude palm oil extracts after clean-up with GCB/PSA SPE cartridge
λ-cyhalothrin
Cypermethrin Early interference peaks
Late interference peaks

75
Figure 2.3 (B): GC-ECD chromatogram of fortified (0.2 µg/g) crude palm oil extracts after clean-up with GCB SPE cartridge
Early interference peaks
Late interference peaks
λ-cyhalothrin
Cypermethrin

76
Figure 2.3 (C): GC-ECD chromatogram of fortified (0.2 µg/g) crude palm oil extracts after clean-up with PSA SPE cartridge
Early interference peaks Late interference peaks
λ-cyhalothrin
Cypermethrin

77
Figure 2.3 (D): GC-ECD chromatogram of fortified (0.2 µg/g) crude palm oil extracts after clean-up with C-18 SPE cartridge
Early interference peaks
Late interference peaks
λ-cyhalothrin
Cypermethrin

78
Figure 2.3 (E): GC-ECD chromatogram of fortified (0.2 µg/g) crude palm oil extracts after clean-up with Florisil SPE cartridge
Early interference peaks
Late interference peaks
λ-cyhalothrin
Cypermethrin

79
Figure 2.3 (F): GC-ECD chromatogram of fortified (0.2 µg/g) crude palm oil extracts after clean-up with Silica SPE cartridge
Early interference peaks
Late interference peaks
λ-cyhalothrin
Cypermethrin

80
Figure 2.4: GC-ECD chromatograms of mixed pyrethroid standard solution in acetone
λ-cyhalothrin
Cypermethrin

81
Combination of sorbents was studied in this work to improve the clean-up
procedure since the use of single sorbent as discussed previously could not eliminate
completely the interference peaks present in the chromatograms. Thus, sorbent
combination was explored to overcome this problem and successively increase the
efficiency of the overall clean-up procedures. To do this, PSA was chosen instead of
other sorbents to combine with GCB for removal of interferences because PSA has a
much higher ion-exchange capacity for removal of fatty acids in foods and vegetables
[103, 108]. Although GCB removes most of the visible pigment in the extracts, it could
not eliminate the fatty acid matrix interferences present in the oil. In addition, according
to Anastassiades et al. [103], pigments give no visible peaks and this was in accordance
with the results obtained, since no correlation was observed between extracts colour and
cleanliness of the chromatogram, as depicted in Figure 2.3 and 2.5 respectively. Figure
2.3 (B) showed that GCB failed to remove interference peaks that crowded in the
chromatogram between 4 and 17 min although the final solution was clear as in Figure
2.5 (A), compared to Figure 2.5 (B) when Florisil, PSA and Silica were used as the
sorbents in the clean-up step.

82
Figure 2.5 (A): Final solution of GCB, GCB/PSA, and C-18 clean-up
Figure 2.5 (B): Final solution of Florisil, PSA, and Silica clean-up

83
Solid-phase extraction clean-up with a combination of GCB and PSA sorbents
improved the matrix interferences removal of the oil extract as shown in Figure 2.3 (A).
Marked improvements of the chromatogram were observed especially at 4-17, 29-31,
33, and 36 min retention time, where most of the peak interferences were significantly
decreased. We have discussed previously the work done by Shimelis et al. [88] and He
et al. [89] on which both studies agreed that practical applications of dual-layer
GCB/PSA cartridges should be limited to food samples with low levels of fatty acids
since only the use of 100 % acetonitrile as an elution solvent maximizes PSA capacity
for retention of fatty acids. At the same time, He et al. [89] also proposed that if GCB
has to be used for removal of colour and sterol, they suggested that PSA cartridge
should be used with carbon cartridge in serial (Figure 2.6), not in dual-layer (Figure 2.7)
as proposed by Shimelis et al. [88].
After taking both points into consideration, serial combination of SPE sorbents
was chosen since the only purpose of GCB was to remove the pigments in the oil
sample. Furthermore, in this situation, 100 % acetonitrile was used as an elution solvent.
The serial design of PSA and GCB cartridges was illustrated in Figure 2.6. Each sorbent
was conditioned separately with acetonitrile. Sorbents were not allowed to dry during
the conditioning step. Then, oil extract was loaded into GCB cartridge and concurrently
an adaptor was attached into the top of the PSA cartridge reservoir.
This type of SPE design would allow the filtration of matrix co-extractants
separately by GCB and PSA. The first cartridge will retain pigments and other
colourised matrices, while the second cartridge will retain the fatty acids composition of
the extracts. Other benefit of this serial design is that when compared to dual-layer
sorbents in one cartridge, analysts could use the cartridges separately for other specific

84
purposes, since the sorbents were packed in separate cartridge tubes. Hence, it avoids
the interaction between the sorbents. This would save costs and increase the flexibility
of the materials in the laboratory. From the baseline noise of the chromatogram, the
presence of interfering peaks and the recovery values, it was concluded that the most
effective clean-up procedure of those tested was the application of GCB/PSA SPE
cartridges in serial design, and acetonitrile as the conditioning and eluting solvent.
The clean-up efficiency of the optimized method was assessed by determining
the amount of oil co-extracted from the samples into the extract. This was done
gravimetrically after clean-up using GCB/PSA SPE cartridges. The optimized
acetonitrile extraction together with low-temperature precipitation and GCB/PSA SPE
clean-up was applied to blank CPO and CPKO samples without fortification. The vial of
the final solution was weighed before the addition of extract. Then, sample extract
obtained after the clean-up step was dried via N-evaporator to dryness to obtain the oil
residue. The oil residue together with the vial was re-weighed for oil residues
determination. From the results obtained, the amount of oil co-extracted for CPO and
CPKO samples after the clean-up procedure was 1.7 ± 0.6 mg/g (n=6) and 2.7 ± 1.2
mg/g (n=6), respectively. These values represented 0.2 and 0.3 % of the sample mass
and the results showed that the clean-up step was able to eliminate 99.75 % of the lipid
using this method, indicating sufficient for the chromatographic system to maintain its
separation efficiency for more than 100 sample injections.

85
Step 1 Step 2
Step 3 Step 4
Figure 2.6: A serial design of PSA and GCB cartridges for clean-up of palm oil samples
GCB
acetonitrile
PSA
Oil extract
Adaptor

86
Figure 2.7: Dual-layer design of PSA and GCB cartridges
2.4.4 DISPERSIVE SOLID-PHASE EXTRACTION CLEAN-UP
In 2003, Anastassiades et al. published an extraction technique that provided
high quality results with minimum number of steps and low solvent and glassware
consumption called QuEChERS [103]. The original procedure of this technique
involves two parts. The first part consists of extracting the homogenised sample by
hand-shake or Vortex with the same amount of acetonitrile in order to have a final
extract, concentrated enough without the need of a solvent evaporation step [109]. The
advantage of extracting with acetonitrile rather than acetone is that acetonitrile separates
more easily from water with the addition of a proper combination of salts (anhydrous
magnesium sulphate, MgSO4, and sodium chloride, NaCl) which provides a well
defined phase separation without dilution with hazardous non-polar organic solvents.
After centrifugation, which provides a perfect physical separation of phases, clean-up
and removal of residual water is performed simultaneously by using a rapid procedure
called dispersive solid-phase extraction (d-SPE), in which PSA sorbent and more
anhydrous MgSO4 are mixed with the sample extract.
GCB PSA

87
As mentioned earlier, dispersive SPE is based on the SPE methodology, but the
sorbent is directly added to the extract without conditioning and the clean-up is being
easily carried out by shaking and centrifugation, rather than passing it through an SPE
column. Initially, this method was designed for samples with more than 75 % moisture,
especially for vegetables and fruits. But lately, it has been modified in order to apply the
method to high fat samples including vegetable oils [82, 110]. To do this, freezing step
is introduced prior to d-SPE, to separate the acetonitrile layer from the oil matrix.
In this work, the extract of the optimized solvent extraction and low-temperature
precipitation was subjected to d-SPE clean-up step with various sorbent materials. The
sorbents (0.3 g anhydrous MgSO4 (d-SPE1), 0.3 g anhydrous MgSO4 + 0.1 g PSA (d-
SPE2), 0.3 g anhydrous MgSO4 + 0.1 g PSA + 0.025 g GCB (d-SPE3), 0.3 g anhydrous
MgSO4 + 0.2 g PSA (d-SPE4), and 0.3 g anhydrous MgSO4 + 0.3 g PSA (d-SPE5))
were compared in dispersive SPE study in order to find the best sorbent materials
available for the performance of the pesticide residues determination with higher
recoveries and lower matrix interferences. This was assessed from the chromatograms.
The summary of sorbent combination is shown in Table 2.11. In this study, anhydrous
MgSO4 was used to absorb micro quantities of water in the solvent, while the
applications of PSA and GCB were the same as previously discussed in section 2.4.3.

88
Table 2.11: Combination of sorbents used for d-SPE
Dispersive-SPE Sorbents (g)
MgSO4 PSA GCB
d-SPE1 0.3 0 0
d-SPE2 0.3 0.1 0
d-SPE3 0.3 0.1 0.025
d-SPE4 0.3 0.2 0
d-SPE5 0.3 0.3 0
The CPO sample fortified at 0.1 µg/g insecticides was extracted with the
optimized acetonitrile extraction and low-temperature precipitation described
previously, and the extracts were cleaned using d-SPE by the procedure discussed in
section 2.3.7.1 (B). The respective mean recoveries (n=3) of cypermethrin and λ-
cyhalothrin determined by GC-ECD are shown in Table 2.12 and ranged from 88.2 to
99.1 % for d-SPE1, 72.9 to 90.5 % for d-SPE2, 71.1 to 90.4 % for d-SPE3, 66.6 to 80.0
% for d-SPE4, and 61.7 to 72.8 % for d-SPE5. The recovery profiles of the d-SPE
sorbents were summarised in Figure 2.8. From the chart, it showed that increasing the
PSA sorbent content would result in proportional decreased of the recoveries of both
cypermethrin and λ-cyhalothrin.

89
The representative chromatograms of the different sorbents studied are shown in
Figure 2.9 (A-E). Although high recoveries were reported when only MgSO4 was used
as the sorbent, large impurity peaks were also observed at 3-10 min of the retention time
while some minor impurity peaks were present at 16 and 22 min of the retention time
(Figure 2.9 [A]). In the meantime, when combination of 0.3 g MgSO4 and 0.1 g PSA
were used as the sorbent, major impurity peaks obtained at 3-10 min and minor peaks
found at 16 min were both tremendously decreased, whereas peaks at 22 min were
removed completely (Figure 2.9 [B]). Preliminary studies showed that when 0.025 g of
GCB was included in the sorbent combination, GCB gave only little effect to the
cleanliness of the chromatograms and the recoveries of both cypermethrin and λ-
cyhalothrin as shown in Figure 2.9 (C). This explained why the almost identical
chromatograms obtained for d-SPE2 and d-SPE3 (Figure 2.9 B and Figure 2.9 C), while
their recovery values were also quite similar, but lower than d-SPE1 (Table 2.12). In the
following study, it showed that the increased of PSA content in the d-SPE to 0.2 g and
later 0.3 g with the absence of GCB, resulted in the drop of recoveries for both
pesticides (Table 2.12) with no improvement of the cleanliness of the chromatograms,
except for some minor peaks at 16 min of the retention time (Figure 2.9 D and Figure
2.9 E).

90
Table 2.12: Recoveries (0.1 µg/g) and relative standard deviation (RSD) of pyrethroids
in CPO samples with various d-SPE sorbents (d-SPE1, d-SPE2, d-SPE3, d-SPE4, and d-
SPE5)
Sorbent material Cypermethrin λ-cyhalothrin
Recovery (%) RSD (%) Recovery (%) RSD (%)
d-SPE1 99.09 2.31 88.15 1.65
d-SPE2 90.49 5.91 72.89 2.68
d-SPE3 90.41 4.29 71.09 3.77
d-SPE4 79.97 5.57 66.64 5.46
d-SPE5 72.77 3.34 61.68 4.63
n = 3
Figure 2.8: Recoveries (n = 3) of pyrethroids from CPO analyzed by GC-ECD and
fortified at 0.1 µg/g with various d-SPE sorbents used for clean-up
50
60
70
80
90
100
110
d-SPE1 d-SPE2 d-SPE3 d-SPE4 d-SPE5
% R
eco
very
d-SPE sorbent combination
Cypermethrin
λ-cyhalothrin

91
Figure 2.9 (A): GC-ECD chromatogram of fortified (0.1 µg/g) CPO extracts after clean-up with d-SPE1 (0.3 g MgSO4)
λ-cyhalothrin
cypermethrin
Major impurity peaks
Minor impurity peaks
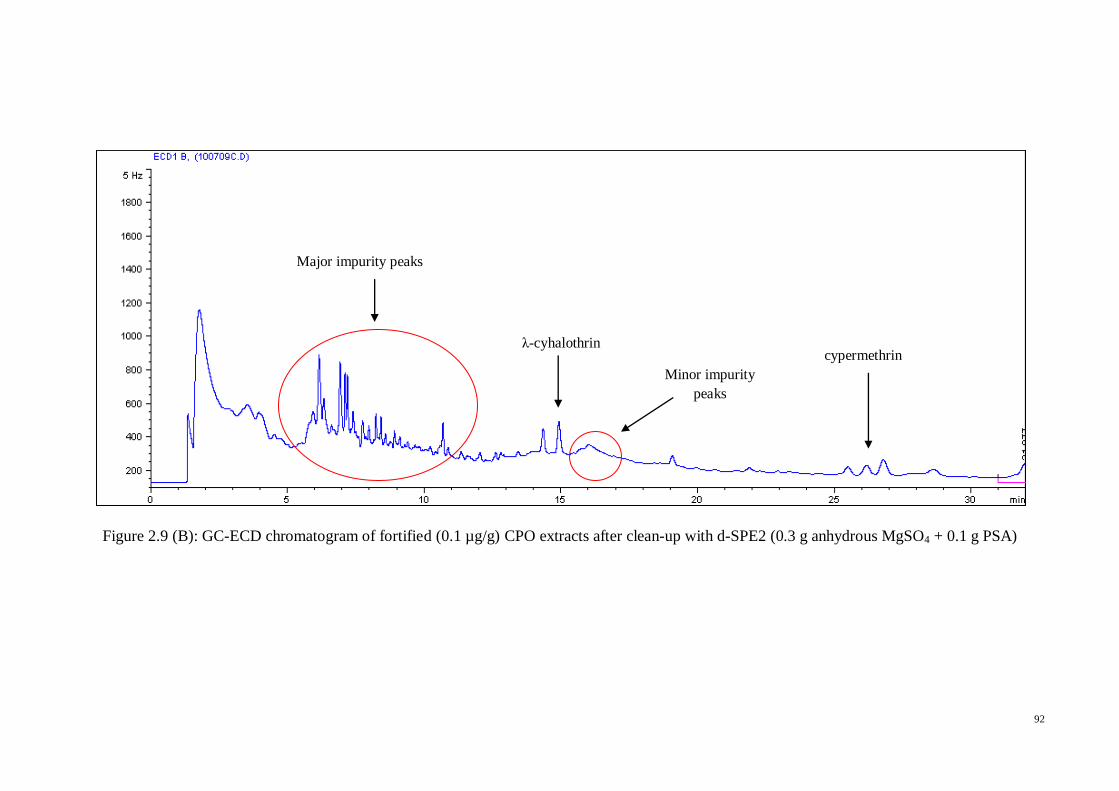
92
Figure 2.9 (B): GC-ECD chromatogram of fortified (0.1 µg/g) CPO extracts after clean-up with d-SPE2 (0.3 g anhydrous MgSO4 + 0.1 g PSA)
λ-cyhalothrin cypermethrin
Major impurity peaks
Minor impurity
peaks

93
Figure 2.9 (C): GC-ECD chromatogram of fortified (0.1 µg/g) CPO extracts after clean-up with d-SPE3 (0.3 g anhydrous MgSO4 + 0.1 g PSA + 0.025
g GCB)
λ-cyhalothrin cypermethrin
Major impurity peaks
Minor impurity
peaks

94
Figure 2.9 (D): GC-ECD chromatogram of fortified (0.1 µg/g) CPO extracts after clean-up with d-SPE4 (0.3 g anhydrous MgSO4 + 0.2 g PSA)
λ-cyhalothrin cypermethrin
Major impurity peaks

95
Figure 2.9 (E): GC-ECD chromatogram of fortified (0.1 µg/g) CPO extracts after clean-up with d-SPE5 (0.3 g anhydrous MgSO4 + 0.3 g PSA)
λ-cyhalothrin cypermethrin
Major impurity peaks

96
To further confirm the finding, another set of analysis was carried out where
anhydrous MgSO4 was kept constant at 0.3 g while PSA content was increased
gradually from 0 to 0.1 g. No GCB was considered in this test. Results as shown in
Table 2.13 revealed that the increased of PSA content would significantly decrease the
recovery values of both cypermethrin and λ-cyhalothrin. The effect of various PSA
contents in the decreasing profile of the recoveries is represented in the line chart in
Figure 2.10. The representative chromatograms are shown in Figure 2.11 (A-D). In this
test, the results obtained were the same as the previous study, indicating that PSA has
the ability to remove matrix co-extractants in the extracts. But in doing so, it will also
decrease the recoveries of the studied pesticides. Figure 2.11 showed that the
interference peaks (major and minor) at 3-10, 16, and 22 min of the retention time were
all decreased in magnitude when PSA was used in d-SPE. The degree of impurity peaks
reduction would depend on the quantity of PSA used. The higher the sorbent contents,
the cleaner the chromatograms, but the recoveries were lower, as shown in the line chart
(Figure 2.10).
Table 2.13: Recoveries (0.1 µg/g) of pyrethroids in CPO samples clean-up with 0.3 g
MgSO4 and various PSA sorbent contents
PSA content (µg/g) Recovery, % (RSD,%)
cypermethrin λ-cyhalothrin
0 86.68 (2.18) 80.56 (4.41)
0.025 85.42 (5.44) 80.26 (6.13)
0.05 80.43 (2.56) 79.23 (3.71)
0.1 79.79 (2.67) 74.56 (3.47)
n = 3

97
Figure 2.10: Recoveries (n = 3) of pyrethroids from CPO fortified at 0.1 μg/g and
analyzed by GC-ECD with different amount of PSA sorbent used for clean-up
From the preliminary study of the d-SPE clean-up, three points can be
highlighted as a summary for this clean-up technique. First, the use of PSA as sorbent in
d-SPE reduced the nasty interference peaks in the chromatograms and gave cleaner
extracts with less matrix co-extractants in the final solution. From the results, higher
PSA content gave cleaner chromatogram profile especially in the early elution peak
interferences. When PSA content reached 0.1 g, the effect of the sorbent reaches a
maximum, and further increased of PSA content would not give any big difference in
terms of chromatogram cleanliness.
70
72
74
76
78
80
82
84
86
88
90
0 0.025 0.05 0.1
% R
eco
very
d-SPE PSA content (g)
Cypermethrin
λ-cyhalothrin

98
Secondly, higher PSA content comes with a great reduction of recoveries for
both cypermethrin and λ-cyhalothrin. A proportional decreased of recovery was
observed when PSA content was increased from 0 to 0.1 g. This finding can be some
kind of hindrance for the application of d-SPE clean-up to palm oil matrices because it
is very important to obtain a clean final extracts and at the same time maintaining good
recoveries. Dirty extracts with even a small amount of fats may disrupt the columns and
harm the detectors and hence upset the right analyte determination through signal
suppression. Furthermore, the presence of high concentrations of fatty acids in the
samples can complicate the GC detection system of low pesticide concentrations. This
is due to the presence of high matrix peaks in the chromatograms that mask the analytes
of interest and finally decrease the detection limit of the method. Last but not least,
GCB gave no effect in the chromatogram. Its only purpose was to decolorize the
extracts from carotenoids. After taking all the findings into consideration, it was
concluded that d-SPE clean-up technique was not very efficient for cypermethrin and λ-
cyhalothrin in palm oil matrices and hence rejected from the method development.

99
Figure 2.11: GC-ECD chromatogram of fortified (0.1 µg/g) CPO extracts after clean-up with (A) 0.3 g anhydrous MgSO4; (B) 0.3 g anhydrous MgSO4
+ 0.025 g PSA; (C) 0.3 g anhydrous MgSO4 + 0.05 g PSA; (D) 0.3 g anhydrous MgSO4 + 0.1 g PS
A
C
D
B
cypermethrin λ-cyhalothrin
Major interference
peaks
Minor interference
peaks

100
2.4.5 METHOD VALIDATION
Method validation can be interpreted as being the process of defining an
analytical requirement, and confirming that the method under consideration has
performance capabilities consistent with what the application requires [111]. Method
validation is usually considered to be very closely tied to method development, although
it is often not possible to determine exactly where method development finishes and
validation begins. Many parameters of the method performance that are associated with
method validation are in fact usually evaluated, at least approximately, as part of
method development. Hence, it is implicit in the method validation process that the
studies to determine method performance parameters are carried out using equipment
that is within specification, working correctly, and adequately calibrated. Likewise the
operator carrying out the studies must be competent in the field of work under study and
have sufficient knowledge related to the work to be able to make appropriate decisions
from the observations made as the study progresses.
In this study, the method must be tested to assess for linearity,
selectivity/specificity, sensitivity, mean recovery (as measure of accuracy), and
precision. The optimized method conditions are as follows: a 5 g of oil (CPO, CPKO)
was weighed out into a 50-mL screw cap test tube. Then, 10 mL of acetonitrile was
added and the mixture was mixed and homogenized using a vortex mixer for 5 minutes.
After homogenization, the mixture was left to stand for a while to allow a phase
separation between the oil and acetonitrile layer. Normally a good separation took about
1-2 min for CPO and a little bit faster for CPKO. The test tube was then transferred into
the freezer and kept horizontally for a minimum of 2 hours for oil precipitation. After 2
hours, the test tube was removed from the freezer gently without disturbing the
precipitated solids. Then, it was stood vertically leaving the frozen oil adhered to the

101
test tube wall. The acetonitrile extract was transferred immediately using a Pasteur
pipette into a small beaker, leaving the frozen oil in the test tube. It was left for a while
before 2 mL of acetonitrile extract was loaded into pre-conditioned GCB cartridge and
concurrently an adaptor was attached at the top of the pre-conditioned PSA cartridge
reservoir. The extract was initially allowed to flow under gravity, and then a gentle
pressure was applied to achieve a flow of approximately one drop per second.
Collection of the eluate was started at this point into a 10-mL graduated vial. The
column was then eluted with 2 mL of acetonitrile and the volume collected was adjusted
to 5 mL. Eluate was then mixed and ready for GC analysis. The simplified method is
shown in Figure 2.12.
2.4.5.1 LINEARITY AND REPEATABILITY
For any quantitative method, it is necessary to determine the range of analyte
concentrations or property values over which the method may be applied [111]. Then,
calibration curve was constructed to obtain the linearity of the analytical method. A
calibration curve is the relationship between instrument response and known
concentration of the analyte [112]. A sufficient number of standards should be used to
adequately define the relationship between concentration and response. In this case,
seven working standard solutions (0.01, 0.02, 0.05, 0.08, 0.1, 0.5, 1 µg/mL) were
analysed by GC-ECD and the signal for each pesticide was measured for its peak area
and finally individual calibration plot for cypermethrin and λ-cyhalothrin were
constructed. Figure 2.13 and 2.14 display the calibration curves for λ-cyhalothrin and
cypermethrin. The figures show that both calibration curves were acceptable with
regression coefficients of 0.9988 and 0.9991 respectively for λ-cyhalothrin and
cypermethrin, indicating that the technique is quantitative for both pesticides.
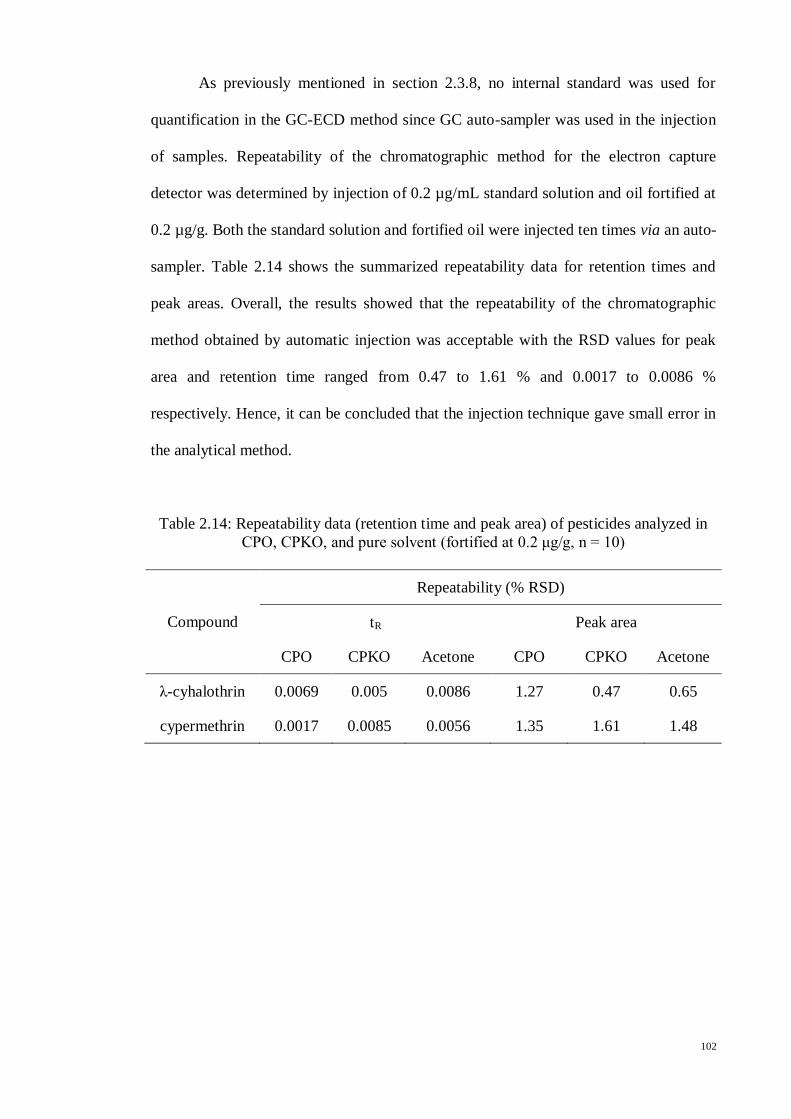
102
As previously mentioned in section 2.3.8, no internal standard was used for
quantification in the GC-ECD method since GC auto-sampler was used in the injection
of samples. Repeatability of the chromatographic method for the electron capture
detector was determined by injection of 0.2 µg/mL standard solution and oil fortified at
0.2 µg/g. Both the standard solution and fortified oil were injected ten times via an auto-
sampler. Table 2.14 shows the summarized repeatability data for retention times and
peak areas. Overall, the results showed that the repeatability of the chromatographic
method obtained by automatic injection was acceptable with the RSD values for peak
area and retention time ranged from 0.47 to 1.61 % and 0.0017 to 0.0086 %
respectively. Hence, it can be concluded that the injection technique gave small error in
the analytical method.
Table 2.14: Repeatability data (retention time and peak area) of pesticides analyzed in
CPO, CPKO, and pure solvent (fortified at 0.2 μg/g, n = 10)
Compound
Repeatability (% RSD)
tR Peak area
CPO CPKO Acetone CPO CPKO Acetone
λ-cyhalothrin 0.0069 0.005 0.0086 1.27 0.47 0.65
cypermethrin 0.0017 0.0085 0.0056 1.35 1.61 1.48

103
Oil matrices
(CPO or CPKO)
Melted oil matrices
(5 g)
Fortified sample
Homogenized fortified
sample
Homogenized sample
mixture
Frozen sample mixture
GCB/PSA SPE cartridges
(Both were pre-conditioned
with 5 mL of acetonitrile)
Eluted with 2 mL of
acetonitrile
Final sample extracts
(5 mL)
-Melted at 60 °C and weighed
-Fortified with pesticide standards
-Homogenized
-Extracted with 10 mL of acetonitrile (5 min)
-Frozen at -20 °C (2 hours)
-2 mL of acetonitrile aliquot
Figure 2.12: Flow chart of an optimized extraction and clean-up of pesticides using low-
temperature precipitation and SPE method

104
Figure 2.13: Calibration curve of λ-cyhalothrin (0.01 – 1 µg/mL)
Figure 2.14: Calibration curve of cypermethrin (0.01 – 1 µg/mL)

105
2.4.5.2 SELECTIVITY/SPECIFICITY
Selectivity is the ability of an analytical method to differentiate and quantify the
analyte in the presence of other components (impurities, degradants, and matrix
components) in the sample matrix under the stated conditions of the test [112]. In
method development, it is necessary to establish that the signal produced at the
measurement stage, or other measured property, which has been attributed to the
analyte, is only due to the analyte and not from the presence of something chemically or
physically similar or arising as a coincidence [111]. Whether or not other compounds
interfere with the measurement of the analyte will depend on the effectiveness of the
isolation stage (extraction/clean-up) and selectivity/specificity of the measurement stage
(gas chromatography). Selectivity and specificity are measures which assess the
reliability of measurements in the presence of interferences. In this case, it is far more
difficult to state that nothing interferes than pointing out the interferences, since there is
always the possibility of encountering some interference in the real samples in the real
world. For that reason, the analyst always plays an important role to decide at what
point it is reasonable to stop looking for interferences.
The selectivity of the analytical method in this work was determined by
comparing the chromatograms of a blank matrix solution with the fortified matrix
solution. Figure 2.15 and 2.16 show the pesticide standard solutions, blank oil samples,
and fortified oil samples by GC-ECD. In the blank samples of CPO and CPKO, few
interferences were present at the analytes retention times, 21.9 min for λ-cyhalothrin
and 27.5 min for cypermethrin. As a result, in the fortified samples, we can see that the
analytes of interest were well separated from the other components present in the oil
matrix and hence allowed the differentiation and quantification of the analytes. This
shows that the method developed could remove much of the interferences in oil

106
matrices and thus exhibited its selectivity. In the meantime, multiple peaks were
observed in the chromatograms for cypermethrin due to the separation of
diasteroisomers (Figure 2.15 and 2.16) [113]. Normally, there are four peaks for
cypermethrin (cypermethrin I, II, III, IV) when analyzed using HP-5 column, but only
three peaks were observed since cypermethrin II and IV could not be separated using
DB-608 column [113]. However, DB-608 column was preferred since it gave higher
total peak areas compared to HP-5 column. From the analytical point of view, the
problems of analyzing pyrethroid pesticides lie in difficult separation of enantiomers
and diasteroisomers [81]. In the case of a mixture of isomers, the analytical signal was
obtained by summing the peak areas of all three peaks.
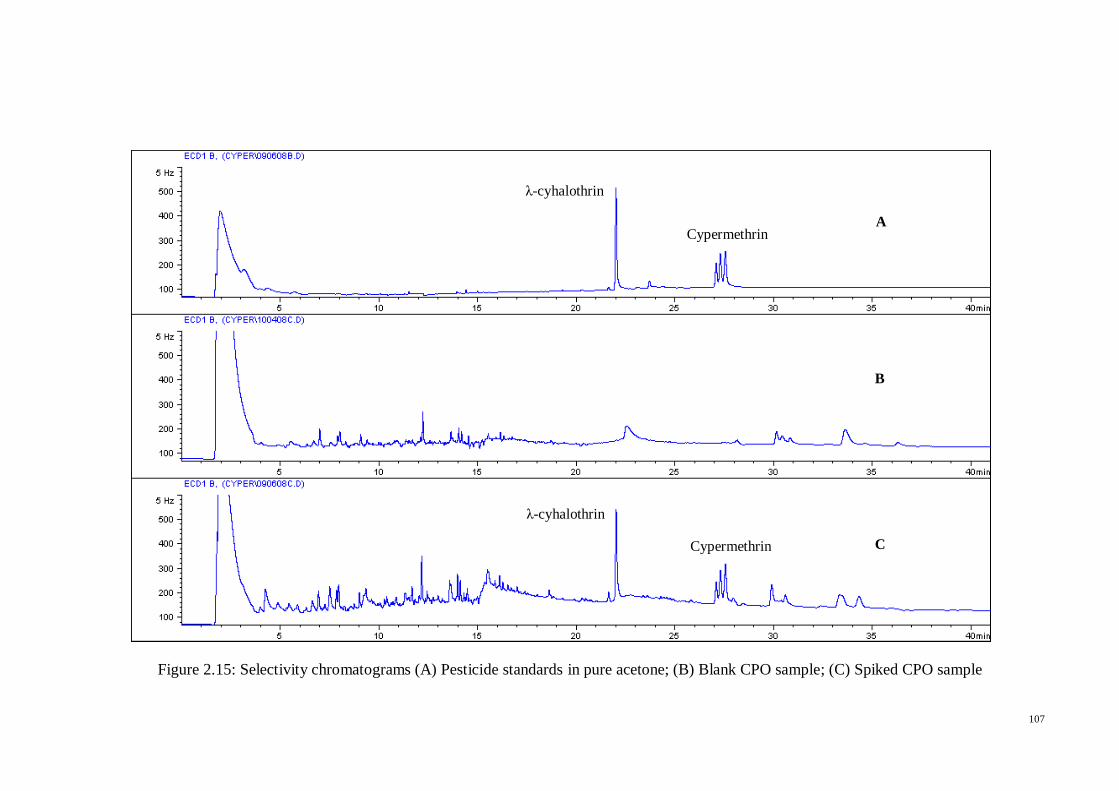
107
Figure 2.15: Selectivity chromatograms (A) Pesticide standards in pure acetone; (B) Blank CPO sample; (C) Spiked CPO sample
A
B
C
λ-cyhalothrin
Cypermethrin
λ-cyhalothrin
Cypermethrin

108
Figure 2.16: Selectivity chromatograms (A) Pesticide standards in pure acetone; (B) Blank CPKO sample; (C) Spiked CPKO sample
A
B
C
λ-cyhalothrin
Cypermethrin
λ-cyhalothrin
Cypermethrin

109
2.4.5.3 LIMIT OF DETECTION (LOD) AND LIMIT OF QUANTIFICATION
(LOQ)
In trace analysis, it is important to know the lowest concentration of the analyte
that can be confidently detected by the method [111]. The LOD is defined as the
concentration of analyte that results in a peak height three times the noise level when
injected into the chromatographic system. The LOD is the lowest concentration of the
analyte in a sample that can be detected but not necessarily quantifiable [114]. As for
LOQ, it is strictly the lowest concentration of analyte that can be determined with an
acceptable level of accuracy (70-120 %) and precision (< 20 %). It could be variously
defined but must be a value greater than the LOD.
In this study, blank oil samples were used to establish the detection and
quantification limits for each pesticide. The LOD values of the proposed method were
determined at a signal-to-noise ratio (S/N) of 3:1 for the individual pesticides in oils by
GC-ECD, whereas the LOQ values were obtained at an S/N of 10:1. Table 2.15 shows
the LOD and LOQ values obtained for each pesticide by GC-ECD. The values obtained
are lower than the national MRLs. In Malaysia, national MRLs are documented in the
Food Act 1983 (Act 281) and Regulations. In this Act, all the agrochemicals registered
for usage in the agricultural sector can be found under Regulation 41 of Schedule
Sixteenth [115]. Since the LOD and LOQ values obtained for the proposed method are
lower than the national MRLs for CPO (λ-cyhalothrin: 0.1 µg/g; cypermethrin: 0.5
µg/g), it can be concluded that the method is sensitive enough to quantify both
pesticides in CPO and CPKO samples.

110
Table 2.15: Limit of detection (LOD), Limit of quantification (LOQ), and Maximum
residue limits (MRLs)
Compound Pesticide level (µg/g)
CPO CPKO
λ-cyhalothrin
LOD 0.025 0.025
LOQ 0.075 0.075
MRL* 0.1 0.1
Cypermethrin
LOD 0.05 0.05
LOQ 0.15 0.15
MRL* 0.5 0.5
*Food Act 1983 (Act 281) and Regulations Schedule sixteenth [115]
2.4.5.4 RECOVERY AND PRECISION
It is not usually known how much of a particular analyte is present in a test
portion. Therefore, it is difficult to be certain how successful the method has been at
extracting it from the matrix. One way to determine the efficiency of extraction is to
spike test portions with the analyte at various concentrations, then extract the fortified
test portions and measure the analyte concentration. The inherent problem with this is
that the analyte introduced in such a way will probably not be held as strongly as that
which is naturally present in the test portion matrix and so the technique will give an
unrealistically high impression of the extraction efficiency [111]. However, having said
that, recovery study via fortification is the most common way of determining extraction
efficiency, and it is recognised worldwide as an acceptable way of doing so in pesticide
residues analysis. However, the drawback of the technique should be borne in mind.
Hence, recovery of the analyte need not be 100 %, but the values should be consistent,
precise and reproducible. Furthermore, it should be performed by comparing the

111
analytical results for extracted samples at least three concentrations (low, medium, and
high) with pesticide standards that represent 100 % recovery.
The precision of an analytical method describes the closeness of individual
measures of an analyte when the procedure is applied repeatedly to multiple aliquots of
a single homogenous of samples. The precision determined at each fortification level
should not exceed 20 % of the coefficient of variation (CV) [112]. In this study, oil
samples were fortified at five levels (0.05, 0.08, 0.1, 0.5, and 1.0 µg/g) and six
replicates were analyzed for each level. The method performance should meet the
acceptable criteria of 70-120 % mean recoveries and coefficient of variation of not more
than 20 % [116]. Table 2.16 shows the pesticide recovery results in CPO and CPKO.
Recoveries obtained for both pesticides ranged from 81-102 % for CPO and 84-105 %
for CPKO. The overall RSD values ranged from 1.3-3.4 % for CPO and 0.1-7.1 % for
CPKO. Since both the recovery and RSD values meet the method performance criteria,
this indicates the good precision and accuracy of the proposed method.
Table 2.16: Recoveries and relative standard deviation (RSD) of pyrethroids from CPO
and CPKO
Pesticides Spike level
(mg/kg)
CPO CPKO
Recovery
(%)
RSD
(%)
Recovery
(%)
RSD
(%)
λ-cyhalothrin
0.05 100.49 1.74 100.07 0.08
0.08 96.34 2.80 90.58 3.39
0.1 100.20 2.35 88.45 3.81
0.5 91.52 1.37 102.70 3.89
1 90.39 3.41 99.17 3.08
Cypermethin
0.05 98.98 3.46 93.00 7.06
0.08 100.38 2.10 84.20 2.37
0.1 102.47 2.72 88.82 5.37
0.5 80.99 3.02 113.50 2.98
1 98.90 2.03 105.05 0.67
n = 6

112
2.4.5.5 RUGGEDNESS/ROBUSTNESS
A measure of an effective analytical method is how well its performance stands
up to less than perfect implementation [111]. This is because, in any method, there will
be certain stages which, if not carried out sufficiently and carefully, will have a severe
effect on method performance and may even result in the method not working at all. In
this study, these stages were identified during the method development part in section
2.4.2. It involves making deliberate variations to the method, and investigating the
subsequent effect on method performance, namely precision and accuracy.
In the initial tests, variations in the extraction techniques and parameters
previously mentioned (extraction volume, position of the test tube in the freezer,
decanting the liquid phase immediately after freezing, and freezing time) generally had
little effect on the mean recovery of both cypermethrin and λ-cyhalothrin. This
argument was further backed up by the statistical analysis data. The outcomes showed
that when the aforementioned parameters varied, no significant difference was observed
among the various parameters studied. This indicated that the method was adequately
robust to be successfully applied by inexperienced analysts.
2.4.6 REAL SAMPLES MONITORING
The developed method was applied in the analyses of 30 commercial CPO
samples from various refineries throughout Malaysia. Each sample was analysed in
triplicate following the optimized procedure described previously. At the beginning of
each set of samples, analytical grade acetone, standard prepared in pure solvent, blank
sample, and fortified sample were analyzed to check whether the system is under the
correct conditions. These routine procedures were done in order to:

113
a) Check any possibility of contamination in the chromatograph that could cause
false positive.
b) Check the performance of the extraction and clean-up procedures (acceptable
recoveries at 70-120 %).
c) Check the response of the detector to avoid errors in quantification caused by
instrument fluctuation.
From the monitoring study, it was found that none of these CPO samples
contained cypermethrin and λ-cyhalothrin residues. This was expected since according
to Ainie et al. [68], no pesticide residues were detected in oil palm plantations so far
based on more than 100 samples of palm oil analysed. The results also confirmed that
the application of agrochemicals on oil palm in plantations, especially cypermethrin and
λ-cyhalothrin is according to the label instructions and the harvesting according to GAP.
2.5 CONCLUSION
Sample extraction and clean-up technique based on acetonitrile extraction, low-
temperature precipitation and solid-phase extraction was successfully developed to
determine cypermethrin and λ-cyhalothrin in crude palm oil and crude palm kernel oil.
This is the first time that this type of extraction and clean-up technique is used and
applied to cypermethrin and λ-cyhalothrin in palm oil matrices. In this study,
acetonitrile was chosen as the solvent of choice to extract the pesticides from the oil
matrix. Then, the whole mixture was frozen at -20 ºC to precipitate the bulky oil matrix
and separate it from the acetonitrile layer. Sample extract was then underwent the clean-
up step using SPE cartridges contained graphitized carbon black and primary secondary
amine sorbents.

114
During the optimization process, the effects of some experimental parameters
such as extraction volume, freezing time, and SPE sorbents were evaluated to obtain the
most efficient extraction and clean-up technique that give the best results. Furthermore,
variation in the positioning of the test tube in the freezer and decantation of the liquid
phase immediately after freezing gave no significant difference on the results obtained.
This indicated that the method was adequately robust to be successfully applied by
inexperienced technicians.
The optimized method also went through the validation studies where validation
parameters, namely linearity (calibration curve), selectivity/specificity, sensitivity
(LOD, LOQ), recovery (accuracy), and precision (relative standard deviation) were
applied. The recoveries obtained for both pesticides ranged from 81-102 % for CPO and
84-105 % for CPKO. The overall RSD values ranged from 1.3-3.4 % for CPO and 0.1-
7.1 % for CPKO. The developed method can be used to determine both pesticide
residues in CPO from local refineries throughout Malaysia since the LOD and LOQ
obtained are lower than the MRLs as specified in Food Act 1983 (Act 281) and
Regulations [115]. From the monitoring study, no pesticide residues were detected in
any of the 30 samples analysed. As a conclusion, the results demonstrated that the
proposed optimized method is specific, sensitive, accurate, and precise within the
established linearity range.