chapter 12 managing production operations. advanced organizer decision making planning organizing...
TRANSCRIPT
Chapter 12
Managing Production Operations

Advanced Organizer
Decision Making
Planning
Organizing
Leading
Controlling
Management Functions
Research
Design
Production
Quality
Marketing
Project Management
Managing Technology
Time Management
Ethics
Career
Personal Technology
Managing Engineering and Technology
Chapter Objectives
• Explain and be able to use the statistics of quality
• Describe the quality revolution• Recognize the methods of work measurement
What Is Quality?
• “The degree of excellence of a thing” (Webster’s Dictionary)
• “The totality of features and characteristics that satisfy needs” ( ASQC)
• Fitness for use

Definitions of Quality
Fitness for use, or customer satisfaction
• Quality of design
• Quality of conformance ( or Quality of production)

The Meaning of Quality
The Meaning of Quality
Producer’s Perspective Consumer’s Perspective
Fitness for Consumer Use
Quality of Design • Quality Char. • Price
Production Marketing Quality of Conformance •Conformance to Spec. • Cost
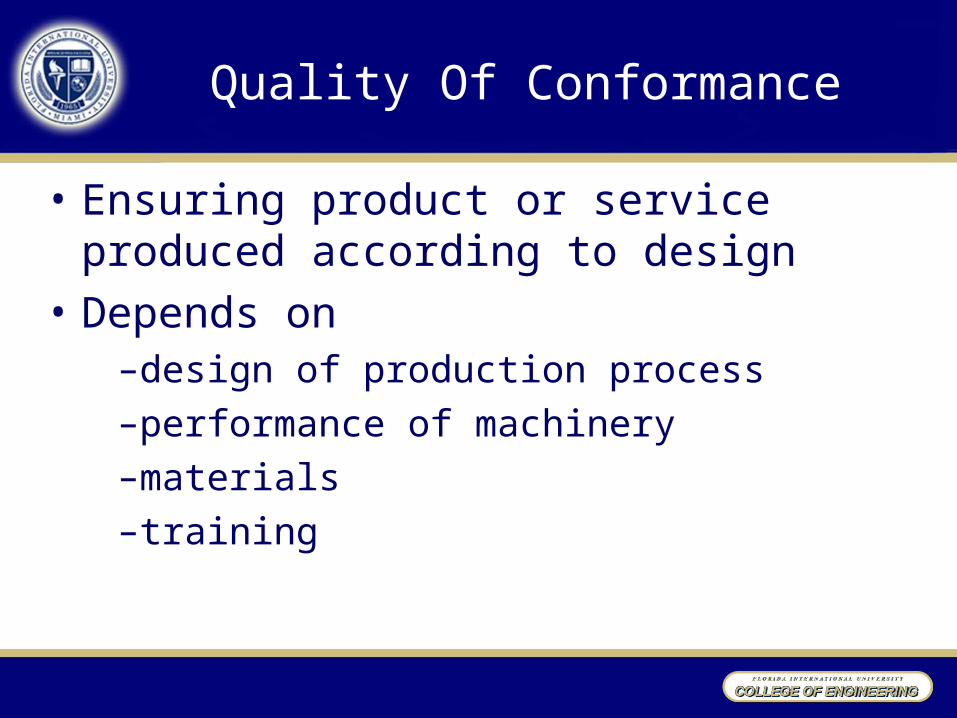
Quality Of Conformance
• Ensuring product or service produced according to design
• Depends on–design of production process–performance of machinery–materials–training
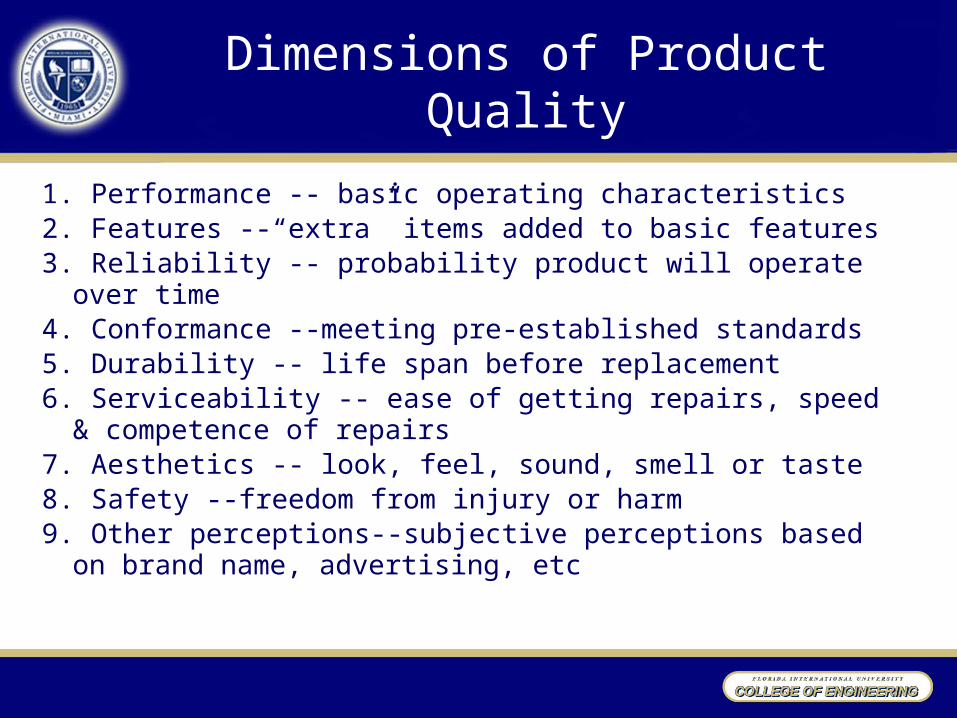
Dimensions of Product Quality
1. Performance -- basic operating characteristics2. Features --“extra” items added to basic features3. Reliability -- probability product will operate over time4. Conformance --meeting pre-established standards5. Durability -- life span before replacement6. Serviceability -- ease of getting repairs, speed &
competence of repairs7. Aesthetics -- look, feel, sound, smell or taste8. Safety --freedom from injury or harm9. Other perceptions--subjective perceptions based on brand
name, advertising, etc

Service Quality
1. Time & Timeliness -- customer waiting time, completed on time
2. Completeness -- customer gets all they asked for3. Courtesy -- treatment by employees4. Consistency -- same level of service for all customers 5. Accessibility & Convenience -- ease of obtaining service6. Accuracy -- performed right every time7. Responsiveness -- reactions to unusual situations
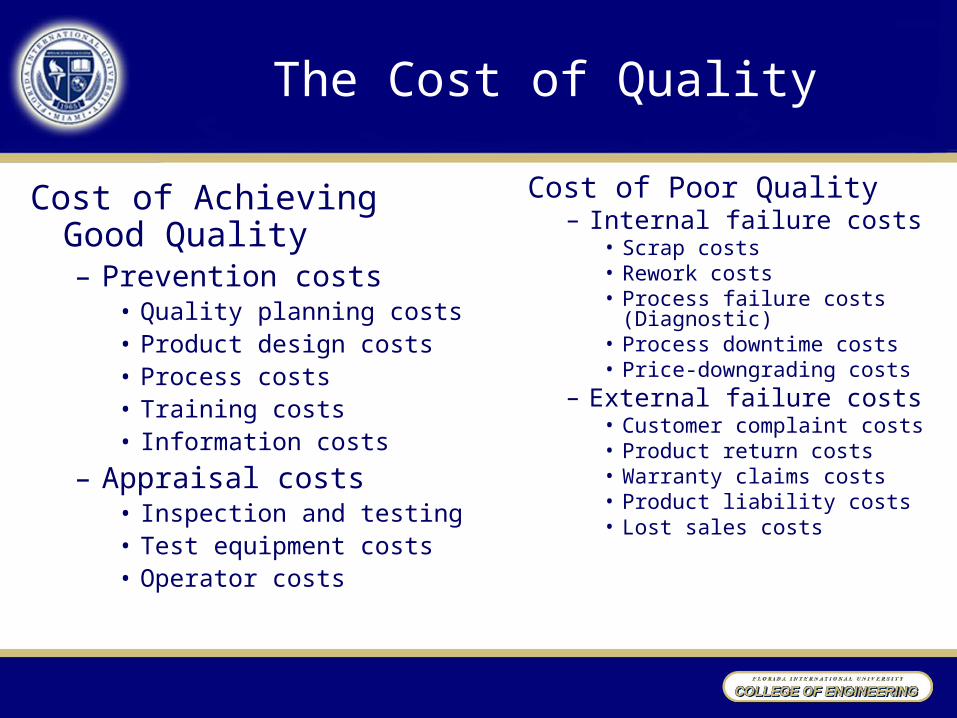
The Cost of Quality
Cost of Achieving Good Quality– Prevention costs
• Quality planning costs• Product design costs• Process costs• Training costs• Information costs
– Appraisal costs • Inspection and testing• Test equipment costs• Operator costs
Cost of Poor Quality– Internal failure costs
• Scrap costs• Rework costs• Process failure costs
(Diagnostic)• Process downtime costs• Price-downgrading costs
– External failure costs • Customer complaint costs• Product return costs• Warranty claims costs• Product liability costs• Lost sales costs
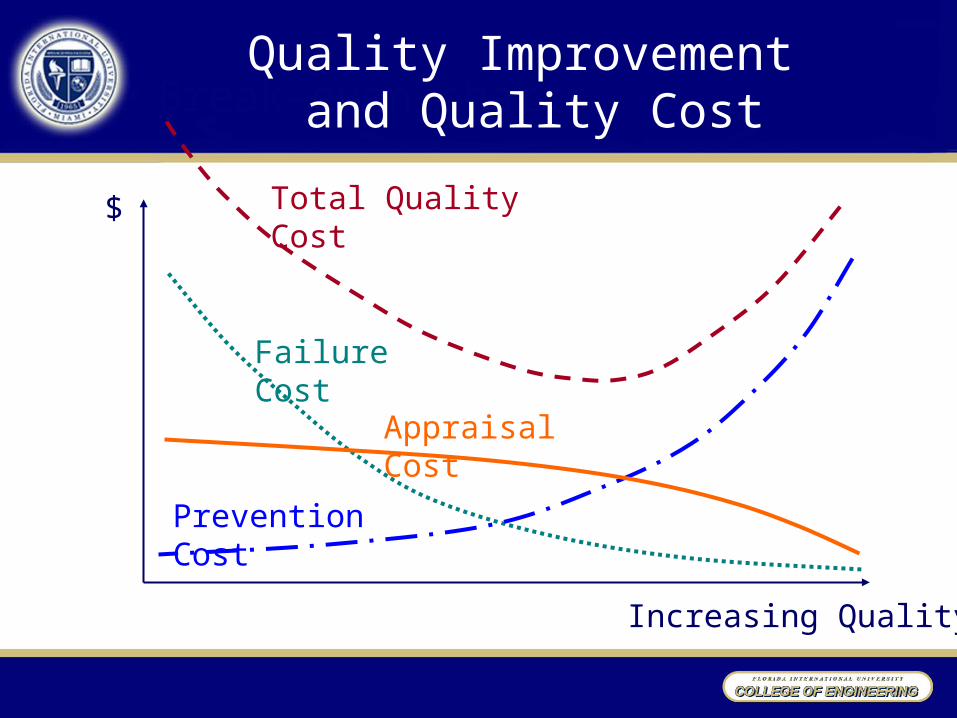
• Break-even charts
Increasing Quality
$
Failure Cost
Appraisal Cost
Total Quality Cost
Quality Improvement and Quality Cost
Prevention Cost

Quality Control Approaches
• Statistical process control (SPC)– Monitors production process to prevent poor quality
• Acceptance sampling–Inspects random sample of product to determine if a lot is acceptable


Statistical Process Control
• Take periodic samples from process
• Plot sample points on control chart
• Determine if process is within limits
• Prevent quality problems
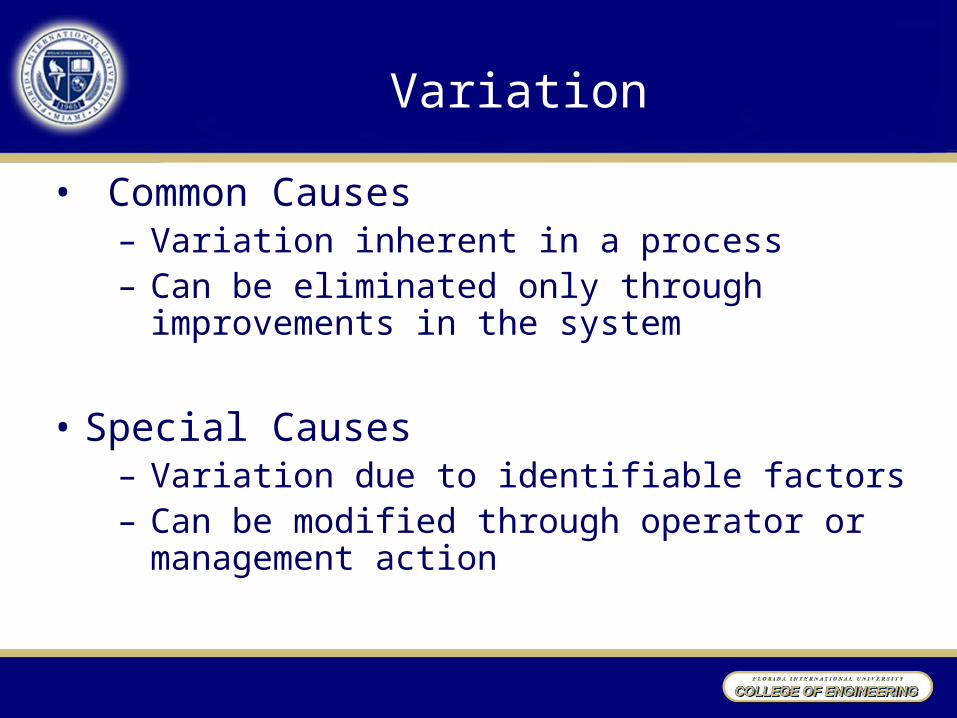
Variation
• Common Causes– Variation inherent in a process– Can be eliminated only through
improvements in the system
• Special Causes– Variation due to identifiable factors– Can be modified through operator or
management action

Probability Distribution
• Central tendency– Mean, Mode, Median
• Dispersion– Std. deviation, Variance
• Frequency function– Normal, Binomial, Poisson

Types Of Data
• Attribute data– Product characteristic evaluated with a
discrete choice• Good/bad, yes/no
• Variable data– Product characteristic that can be measured
• Length, size, weight, height, time, velocity

SPC Applied To Services
• Nature of defect is different in services
• Service defect is a failure to meet customer requirements
• Monitor times, customer satisfaction

Service Quality Examples
• Hospitals –Timeliness, responsiveness, accuracy
• Grocery Stores–Check-out time, stocking, cleanliness
• Airlines–Luggage handling, waiting times, courtesy
• Fast food restaurants–Waiting times, food quality, cleanliness

Control Charts
Commonly based on 3• Sample mean: x-bar-charts
• Sample range: R-charts
• Sample std. deviation: s-charts
• Fraction defective: p-charts
• Number of defects: c-charts
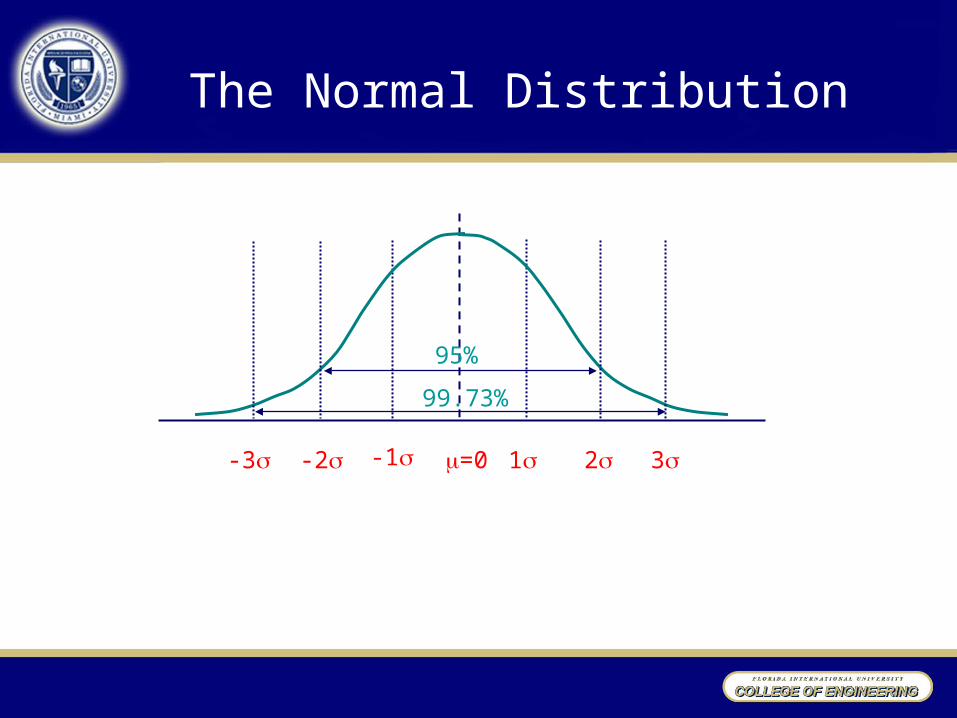
The Normal Distribution
=0 1 2 3
95%
99.73%
-1-2-3

Z Values in Control Charts
• Smaller Z values make more sensitive charts (Type I error)
• Z = 3.00 is standard
• Compromise between sensitivity and Type II errors

Process Control Chart
1 2 3 4 5 6 7 8 9 10
Sample number
Uppercontrollimit
CentralLine
Lowercontrollimit

Interpretation of Control Charts
No evidence of out-of-control, if
• No sample points outside limits
• Most points near process average
• About equal number of points above & below centerline
• Points appear randomly distributed
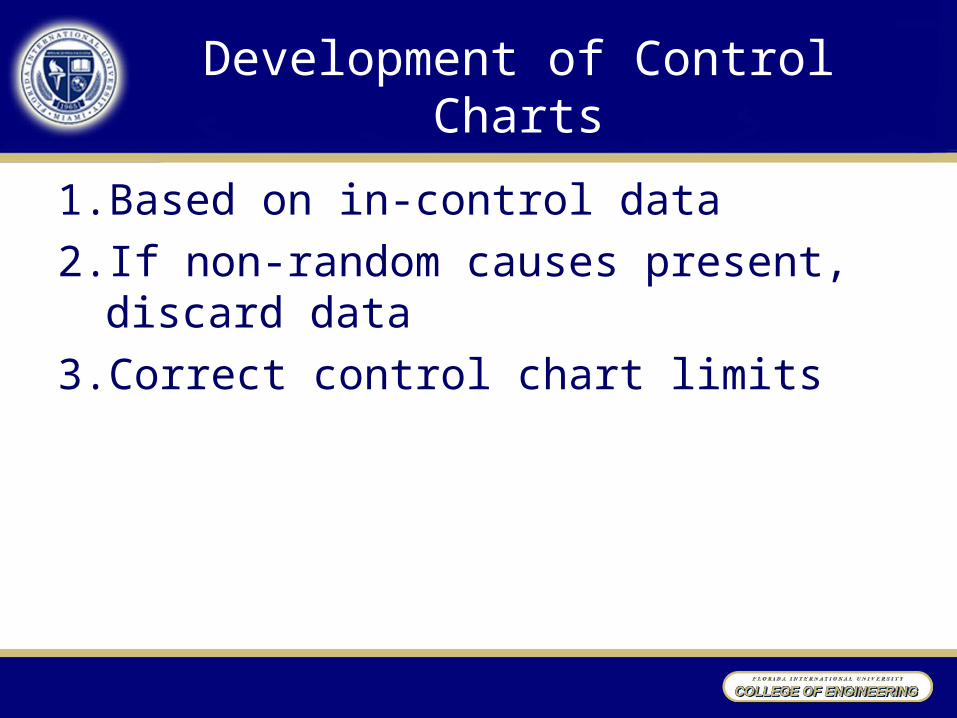
Development of Control Charts
1. Based on in-control data
2. If non-random causes present, discard data
3. Correct control chart limits

Control Charts For Attributes
• p Charts–Calculate percent defectives in sample
• c Charts–Count number of defects in item

p-Chart
n
)p1(pp
p
p
zpLCL
zpUCL
size sample=n
sample in defective % averagep
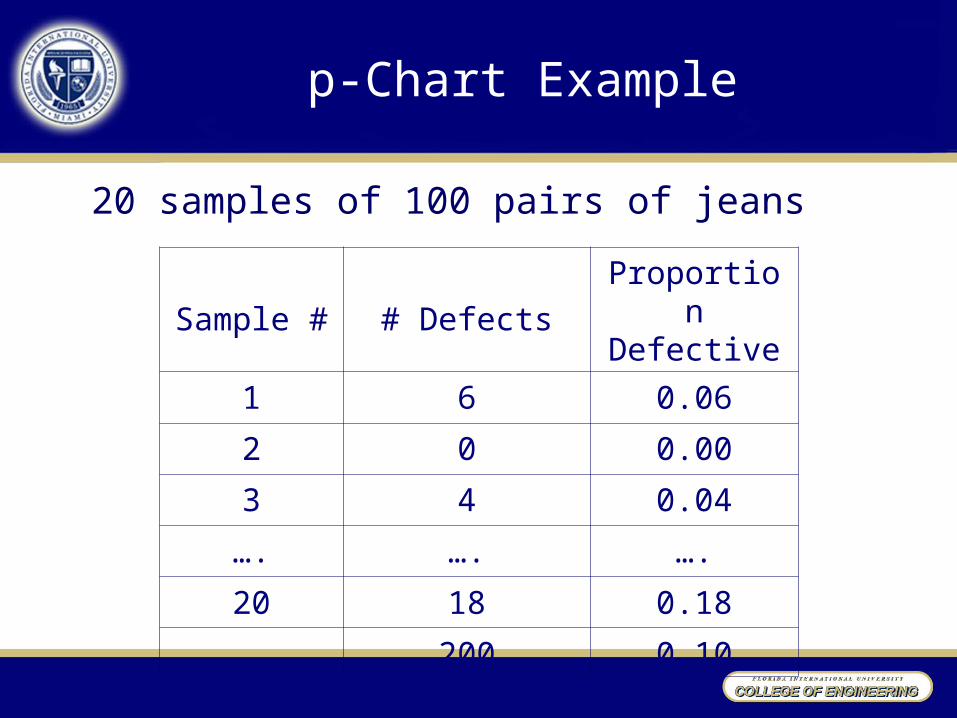
p-Chart Example
20 samples of 100 pairs of jeans
Sample # # Defects
Proportion Defective
1 6 0.06
2 0 0.00
3 4 0.04
…. …. ….
20 18 0.18
200 0.10

p-Chart Calculations
10.0
20(100)
200nsobservatio total
defectives totalp
190.0100
)10.01(10.0310.0
n
)p1(pzpUCL
010.0100
)10.01(10.0310.0
n
)p1(pzpLCL

Example p-Chart
Sample number
0.02
0.04
0.06
0.08
0.10
0.12
0.14
0.16
0.18
0.20
Pro
port
ion
defe
ctiv
e
002 4 6 8 10 12 14 16 18 200 2 4 6 8 10 12 14 16 18 200

c-Chart
cz+cUCL
c=deviation standard Samplec
samples #
defects #Totalcaverage Process
cz-cLCL

c-Chart Example
Count # of defects in 15 rolls of denim fabric
Sample # # Defects
1 12
2 8
3 16
…. …
15 15
Total 190

c-Chart Calculations
99.167.12367.12z-cLCL
35.2367.12367.12z+cUCL
67.1215
190c
c
c

Example c-Chart
0 2 4 6 8 10 12 14
Sample number
3
6
9
12
15
18
21
24
Num
ber
of d
efec
ts

Control Charts for Variables
• Mean chart (X-Bar Chart)– Monitors central tendency
• Dispersion chart – R-Chart– s-Chart– Monitors amount of variation

Range (R) Chart
RDUCL 4
samples of numberk
sample each of rangeRk
RR
RDLCL 3
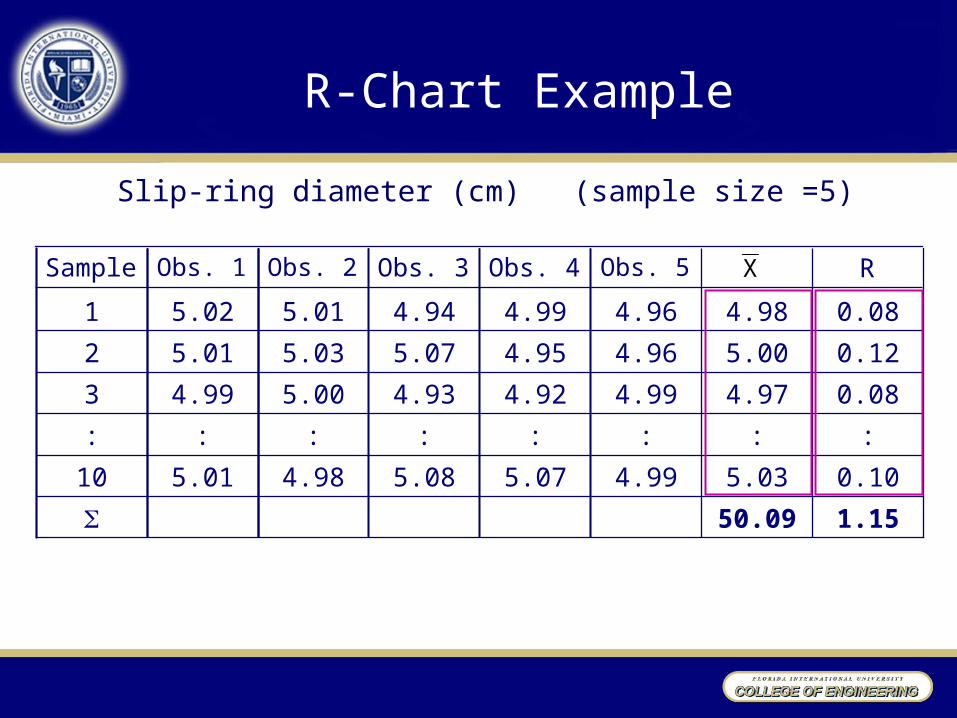
R-Chart Example
Slip-ring diameter (cm) (sample size =5)
0.105.034.995.075.084.985.0110
50.09
4.97
5.00
4.98
1.15
: :::::::
0.084.994.924.935.004.993
0.122
0.084.964.994.945.015.021
4.964.955.075.035.01
X RObs. 5Obs. 4Obs. 3Obs. 2Obs. 1Sample

3 Control Chart Factors
Sample size -chart R-chart
n A2 D3 D4
2 1.88 0 3.27
3 1.02 0 2.57
4 0.73 0 2.28
5 0.58 0 2.11
6 0.48 0 2.00
7 0.42 0.08 1.92
8 0.37 0.14 1.86
X

R-Chart Calculations
115.010
15.1
k
RR
0)115.0(0RDLCL
243.0)115.0(11.2RDUCL
3
4

Example R-Chart
1 2 3 4 5 6 7 8 9 10
Sample
0.00
0.05
0.10
0.15
0.20
0.25
0.30
Ran
ge

X-bar Chart Calculations
cm01.510
09.50
kx xxx k21
94.4115.58.001.5RAxLCL
08.5115.58.001.5RAxUCL
2
2
value range averageR
means sample of averagex

Example X-bar Chart
4.850
4.900
4.950
5.000
5.050
5.100
1 2 3 4 5 6 7 8 9 10
Sample
X-bar
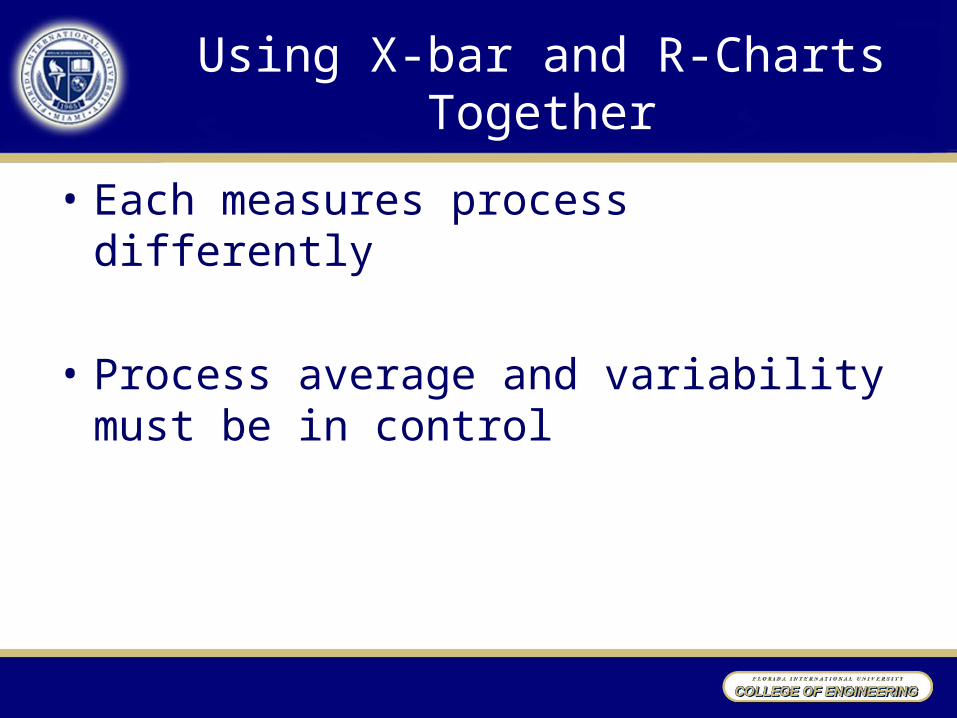
Using X-bar and R-Charts Together
• Each measures process differently
• Process average and variability must be in control

Indications of “Process out of Control”
• Sample data fall outside control limits
• Theory of runs– 2 out of 3 beyond the warning limits– 4 out of 5 beyond the 1 limits– 8 consecutive on one side
• Patterns
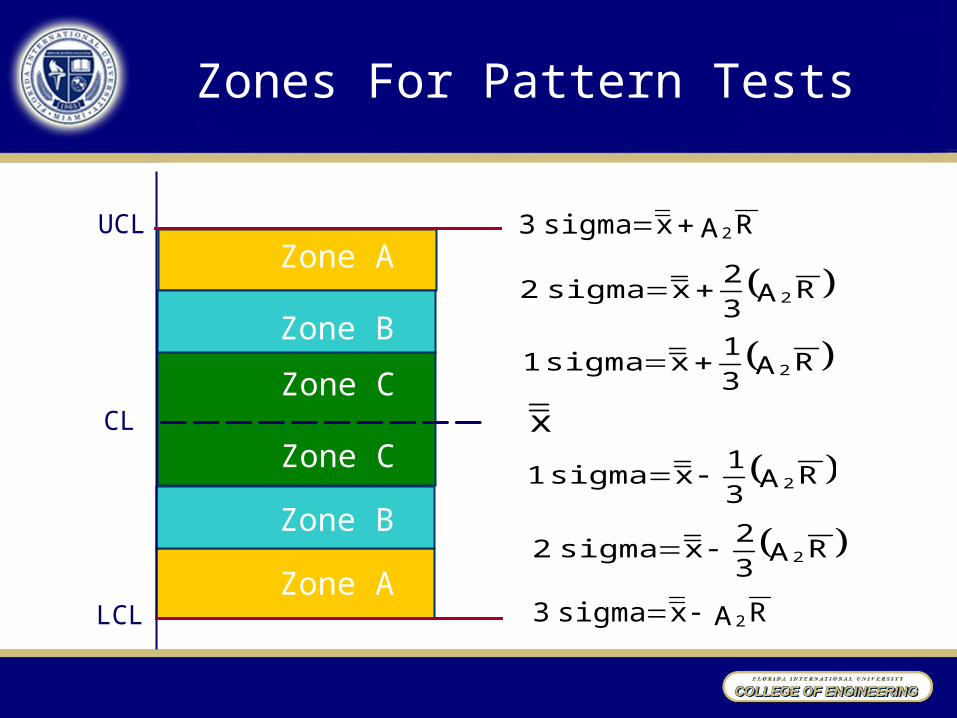
Zones For Pattern Tests
Zone C
Zone C
Zone A
Zone A
RA3
1xsigma1 2
x
RA3
1xsigma1 2
Zone B
Zone B
RA3
2xsigma2 2
RA3
2xsigma2 2
RAxsigma3 2
RAxsigma3 2
UCL
LCL
CL

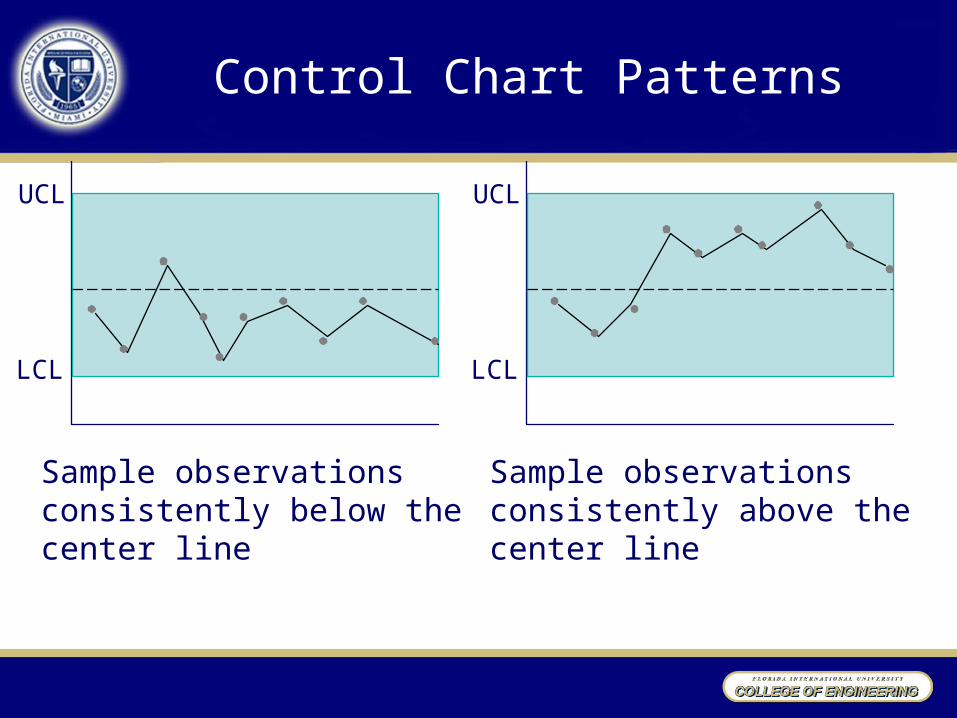
Control Chart Patterns
• 8 consecutive points on one side of the center line.
• 8 consecutive points up or down across zones.• 14 points alternating up or down.• 2 out of 3 consecutive points in zone A but still
inside the control limits.• 4 out of 5 consecutive points in zone A or B.
LCL
UCL UCL
LCL
Sample observationsconsistently below thecenter line
Sample observationsconsistently above thecenter line
Control Chart Patterns

Control Chart Patterns
LCL
UCL
LCL
UCL
Sample observationsconsistently increasing
Sample observationsconsistently decreasing

Inspection & Sampling
• 100% inspection– only with automated inspection
• Sampling inspection– Single sampling– Double sampling– Multiple sampling

Acceptance Sampling
• Accept/reject entire lot based on sample results
• Measures quality in percent defective
• Not consistent with TQM of Zero Defects
• Not suitable for JIT
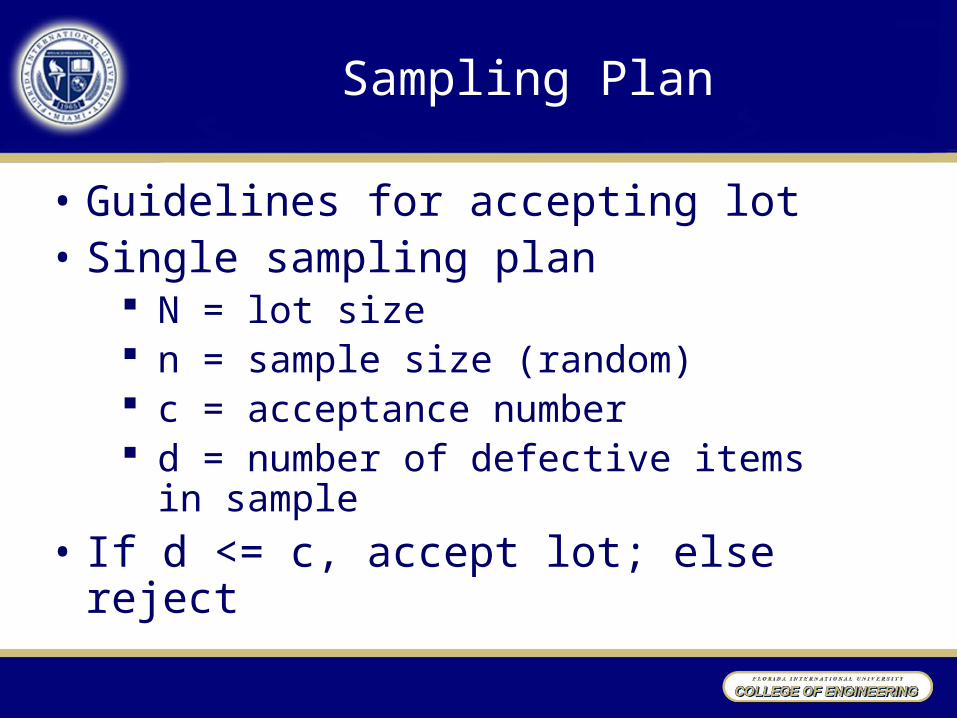
Sampling Plan
• Guidelines for accepting lot• Single sampling plan
N = lot size n = sample size (random) c = acceptance number d = number of defective items in sample
• If d <= c, accept lot; else reject

Producer’s & Consumer’s Risk
• TYPE I ERROR = Prob(reject good lot) or producer’s risk – 5% is common
• TYPE II ERROR = Prob(accept bad lot) or consumer’s risk– 10% is typical value

Quality Definitions in Acceptance Sampling
• Acceptance quality level (AQL)–Acceptable fraction defective in a lot
• Lot tolerance percent defective (LTPD)–Maximum fraction defective accepted in a lot

Operating Characteristic (OC) Curve
• Shows probability of lot acceptance
• Based on – sampling plan – quality level of lot
• Indicates discriminating power of plan

Operating Characteristic Curve
AQL LTPD
Probability of acceptance, Pa
= 0.10 {0.02 0.04 0.06 0.08 0.10 0.12 0.14 0.16 0.18 0.20
= 0.05 {
Proportion defective
OC curve for n and c0.60
0.40
0.20
0.80
1.00
0.00

Ideal OC Curve
AQL
Probability of acceptance, Pa
0.02 0.04 0.06 0.08 0.10 0.12 0.14 0.16 0.18 0.20Proportion defective
0.60
0.40
0.20
0.80
1.00
0.00

Average Outgoing Quality (AOQ)
• Expected number of defective items passed to customer
• Average outgoing quality limit (AOQL) is the maximum point on AOQ curve

AOQ Curve
AverageOutgoingQuality
(Incoming) Percent DefectiveAQL LTPD
AOQL
0.01 0.02 0.03 0.04 0.05 0.06 0.07 0.08 0.09 0.10
0.015
0.010
0.005
0.000
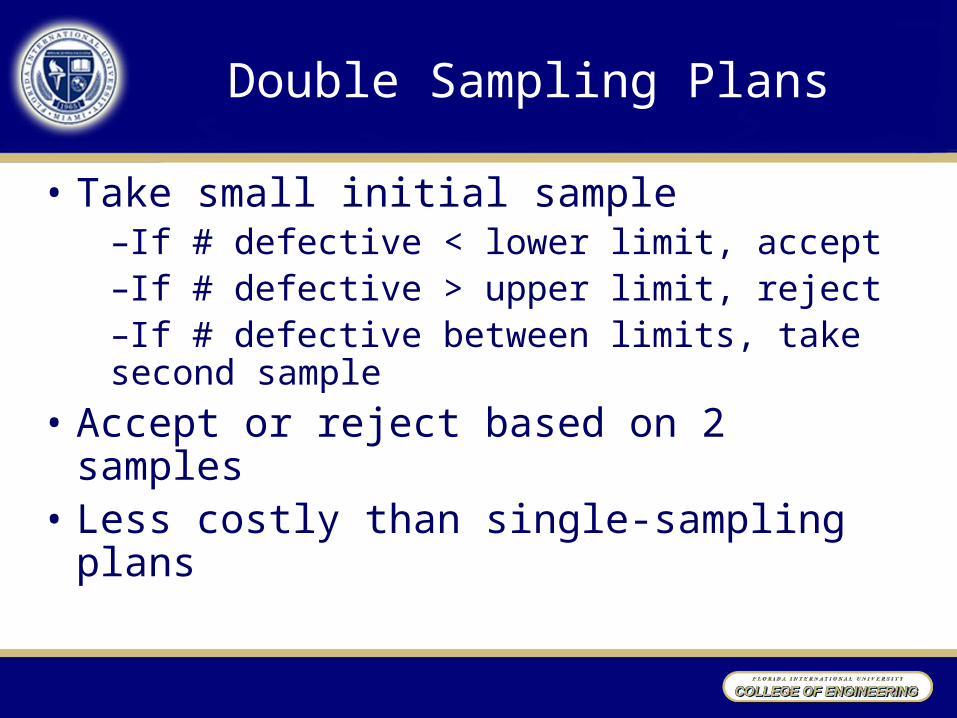
Double Sampling Plans
• Take small initial sample–If # defective < lower limit, accept–If # defective > upper limit, reject–If # defective between limits, take second sample
• Accept or reject based on 2 samples• Less costly than single-sampling plans

Multiple (Sequential) Sampling
• Uses smaller sample sizes
• Take initial sample–If # defective < lower limit, accept–If # defective > upper limit, reject–If # defective between limits, resample
• Continue sampling until accept or reject lot based on all sample data
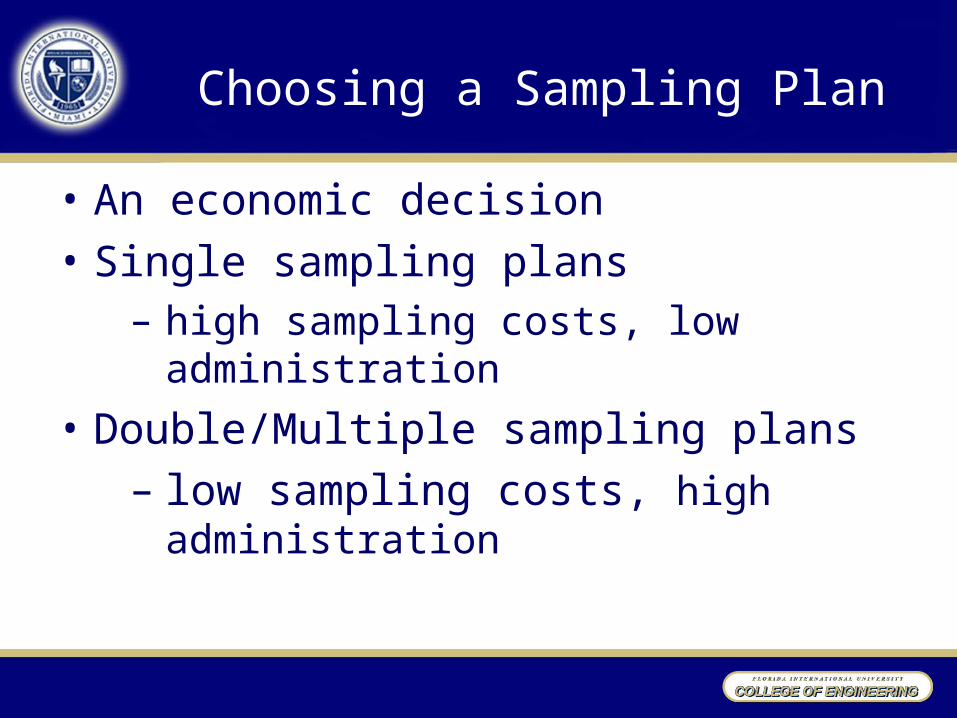
Choosing a Sampling Plan
• An economic decision
• Single sampling plans– high sampling costs, low administration
• Double/Multiple sampling plans– low sampling costs, high administration

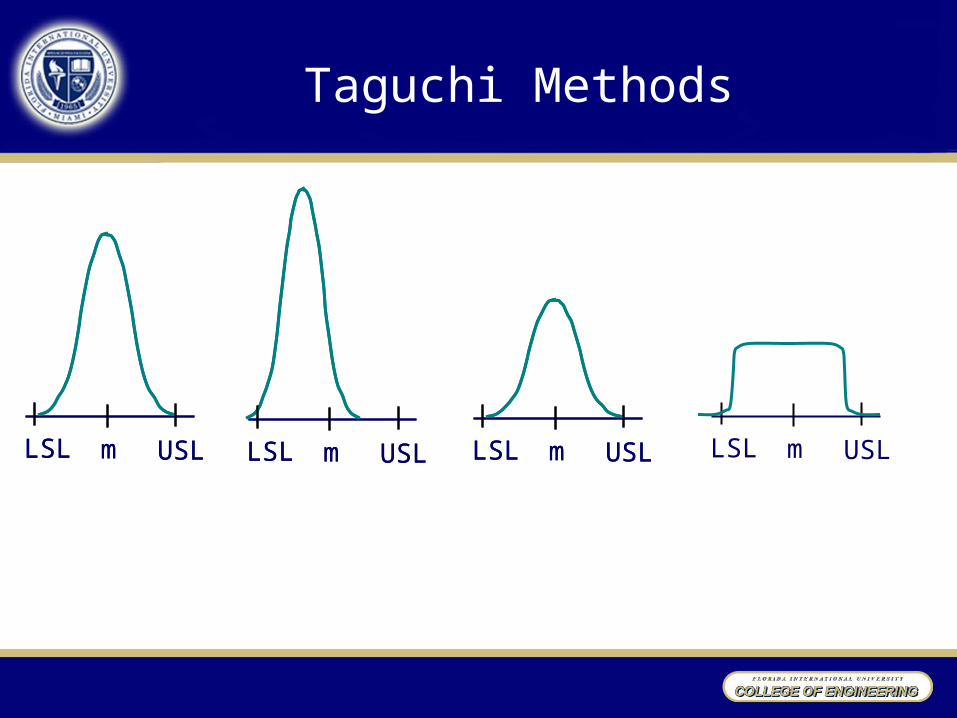
Taguchi Methods
LSL USLm LSL USLm LSL USLm LSL USLmLSL USLm LSL USLm LSL USLm

Taguchi Methods
• Deviation from ideal value => “loss of society”L = k (y – T)2
• Use ANOVA to identify the sources of variation
Loss
yT USLLSL
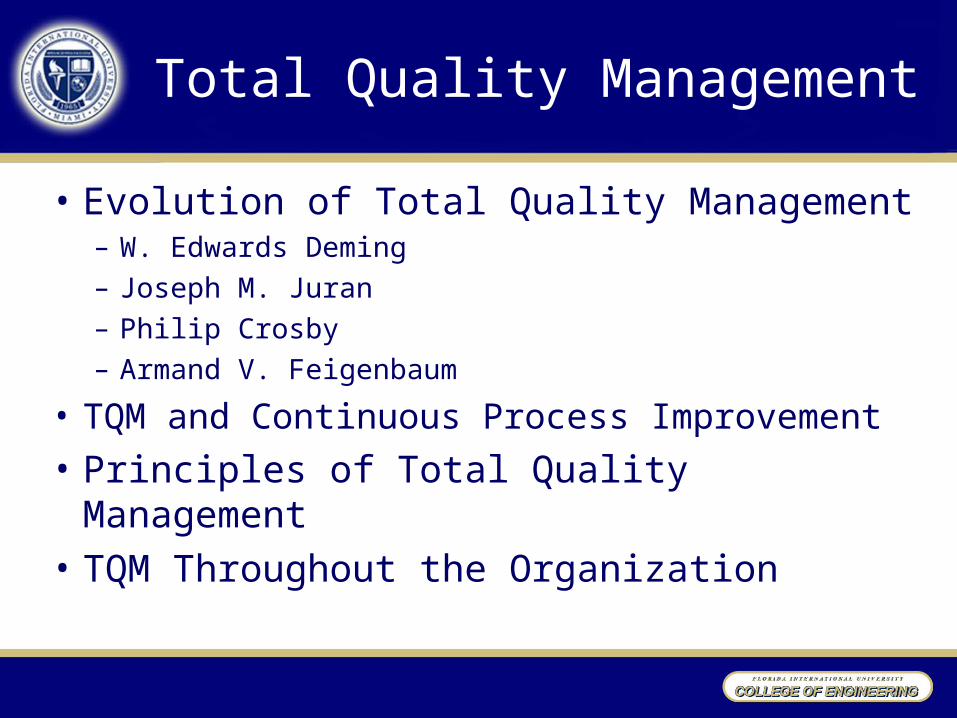
Total Quality Management
• Evolution of Total Quality Management– W. Edwards Deming– Joseph M. Juran– Philip Crosby – Armand V. Feigenbaum
• TQM and Continuous Process Improvement
• Principles of Total Quality Management• TQM Throughout the Organization
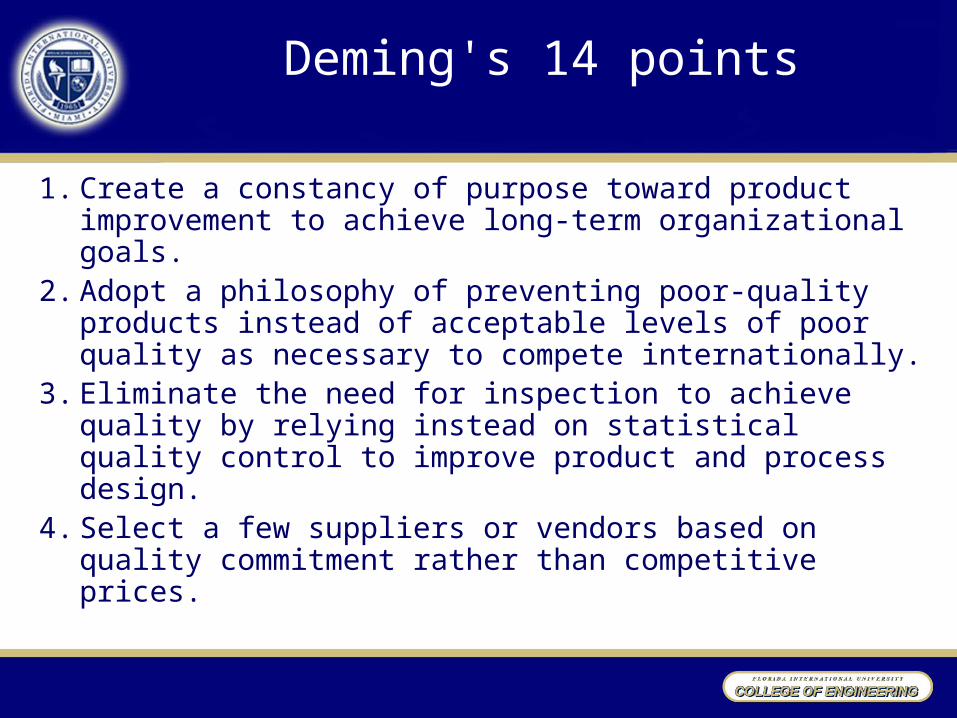
Deming's 14 points
1. Create a constancy of purpose toward product improvement to achieve long-term organizational goals.
2. Adopt a philosophy of preventing poor-quality products instead of acceptable levels of poor quality as necessary to compete internationally.
3. Eliminate the need for inspection to achieve quality by relying instead on statistical quality control to improve product and process design.
4. Select a few suppliers or vendors based on quality commitment rather than competitive prices.
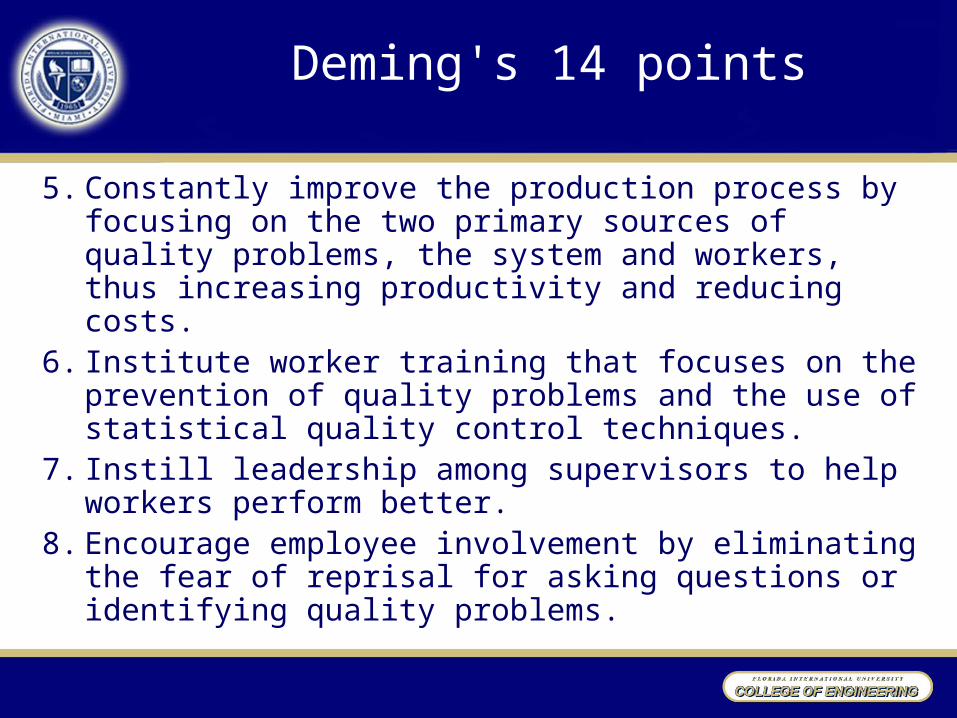
Deming's 14 points
5. Constantly improve the production process by focusing on the two primary sources of quality problems, the system and workers, thus increasing productivity and reducing costs.
6. Institute worker training that focuses on the prevention of quality problems and the use of statistical quality control techniques.
7. Instill leadership among supervisors to help workers perform better.
8. Encourage employee involvement by eliminating the fear of reprisal for asking questions or identifying quality problems.

Deming's 14 points
9. Eliminate barriers between departments, and promote cooperation and a team approach for working together.
10.Eliminate slogans and numerical targets that urge workers to achieve higher performance levels without first showing them how to do it.
11.Eliminate numerical quotas that employees attempt to meet at any cost without regard for quality.

Deming's 14 points
12. Enhance worker pride, artisanry and self-esteem by improving supervision and the production process so that workers can perform to their capabilities.
13. Institute vigorous education and training programs in methods of quality improvement throughout the organization, from top management down, so that continuous improvement can occur.
14. Develop a commitment from top management to implement the previous thirteen points.

Deming Wheel (PDCA Cycle)
1. PlanIdentify the problem & develop the plan for improvement
2. DoImplement the plan on a test basis
3. Check/StudyAssess the plan: Is it working?
4. ActInstitute the improvement: continue the cycle

Total Quality Management
1. Customer defined quality2. Top management leadership3. Quality as a strategic issue4. All employees responsible for quality5. Continuous improvement6. Shared problem solving7. Statistical quality control8. Training & education for all
employees
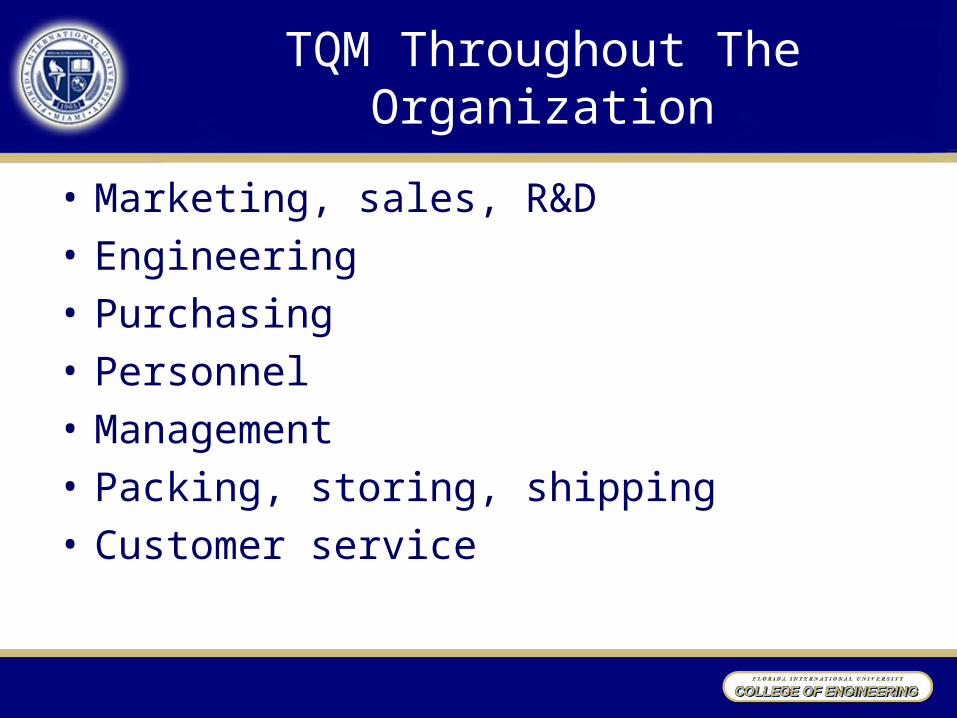
TQM Throughout The Organization
• Marketing, sales, R&D• Engineering• Purchasing• Personnel• Management• Packing, storing, shipping• Customer service
Strategic Implications Of TQM
• Quality is key to effective strategy• Clear strategic goal, vision, mission• High quality goals• Operational plans & policies• Feedback mechanism• Strong leadership
TQM In Service Companies
• Inputs similar to manufacturing• Processes & outputs are different• Services tend to be labor intensive• Quality measurement is harder• Timeliness is important measure• TQM principles apply to services


Quality And Productivity
• Productivity= Output produced per unit of resources= output / input
• Fewer defects increase output
• Quality improvement reduces inputs

Manufacturing Productivity
• Rapid spread of manuf. capabilities => intense competition on a global scale.
• Advanced manuf. Tech. => changes both products & processes
• Changes in traditional management & labor practices, organizational structures, & decision making criteria.

Work Measurement
• “Fair day’s work” concept– The amount of work that can be produced by a
qualified operator working at a normal pace and effectively using his/her time when the work is not restricted by process limitations.
• Time Standard– The time required for a qualified employee
working at a normal pace under capable supervision experiencing normal fatigue and delay to do a defined amount of work of specified quality when following the prescribed method.
– Estimating costs – Estimating equipment needs– Scheduling– Line Balancing– Capacity Analysis– Evaluating automation costs– Planning staffing level– Methods comparison– Pricing– Revealing production problems– Evaluating employees– Setting piece rates– Compliance with contractual requirements
Uses of Time Standards
Work Measurement
Informal Time Standards– Estimates and educated guesses– Historical Data– Time of one whole cycle– Work Sampling
• Observe an operation to determine frequencies of work components
• Measure actual output• Determine performance standard

Work Measurement
Engineered Time Standards– Basic Time-Study Method
• Define work cycle• Take time measurements• Apply rating & allowance
– Methods-time Measurement (MTM)
Work Measurement
Criticism:– Direct labor only– Productivity, not quality

Maintenance
Types of Maintenance• Corrective maintenance• Preventive maintenance• Predictive maintenance
– preventive maintenance that use sensitive instruments to predict trouble

Total Productive Maintenance (TPM)
1. Promotes the overall effectiveness and efficiency of equipment in the factory.
2. Establishes a complete preventive maintenance program for factory equipment based on life-cycle criteria.
3. ”Team" basis involving various departments to include engineering, production operations, and maintenance.
4. Involves every employee in the company, from the top management to the workers on the shop floor. Even equipment operators are responsible for maintenance of the equipment they operate.
5. Based on the promotion of preventive maintenance through "motivational management"
Human Resources Management
• Recruiting & employment• Equal Employment Opportunity• Industrial relations• Compensation• Education & training• Employee benefits
Safety Engineer
• Identify & analyze hazards• Recommend protective devices & warning
signs• Provide safety training• Interpret OSHA (Occupational Safety &
Health Act) codes• Involve in workers’ compensation
insurance activities
Purchasing Engineer
• Recognition of need• Description of requirement• Selection of possible source of supply• Determination of price & availability• Placement of the order• Follow-up and expediting of the order• Verification of the invoice• Processing of discrepancies & rejections• Closing of completed orders• Maintenance of records & files

Packaging Engineering
• Material & form• Specification• Machinery• Methods of unitizing secondary tertiary
packaging• Delivery system
Materials Management
• Purchasing• Inventory Control• Traffic & Transportation• Receiving
– Warehousing– Production control