chapter 10- introduction to government finance
TRANSCRIPT
1
Chapter 10
Introduction to Government Finance
2
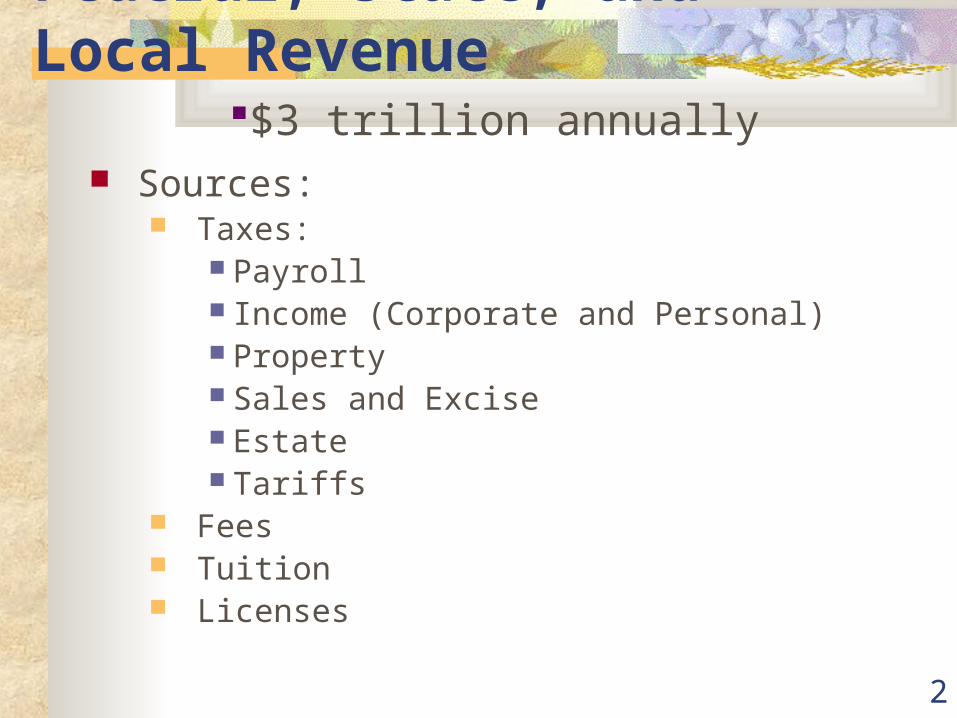
Federal, State, and Local Revenue
Sources: Taxes:
Payroll Income (Corporate and Personal) Property Sales and Excise Estate Tariffs
Fees Tuition Licenses
$3 trillion annually
3
Purpose and Consequences of
Government Finance
Political Equilibrium
Market Equilibrium and Its Efficiency
The Distribution of Income
4
Taxes
Taxes are compulsory payments to government
5
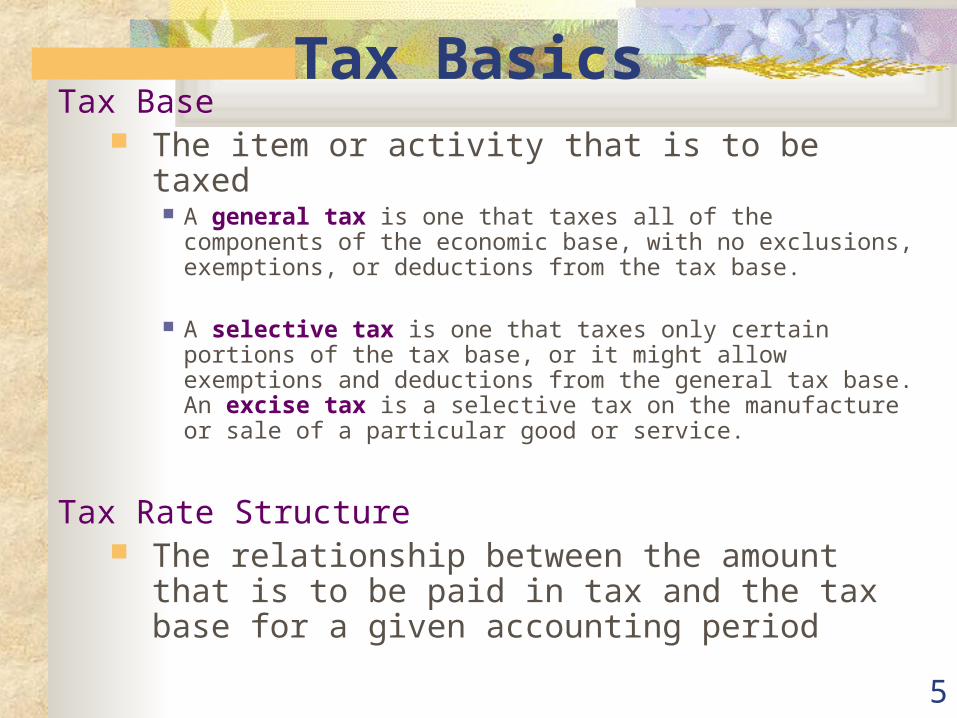
Tax Basics Tax Base
The item or activity that is to be taxed A general tax is one that taxes all of the components of the
economic base, with no exclusions, exemptions, or deductions from the tax base.
A selective tax is one that taxes only certain portions of the tax base, or it might allow exemptions and deductions from the general tax base. An excise tax is a selective tax on the manufacture or sale of a particular good or service.
Tax Rate Structure The relationship between the amount that is
to be paid in tax and the tax base for a given accounting period
6
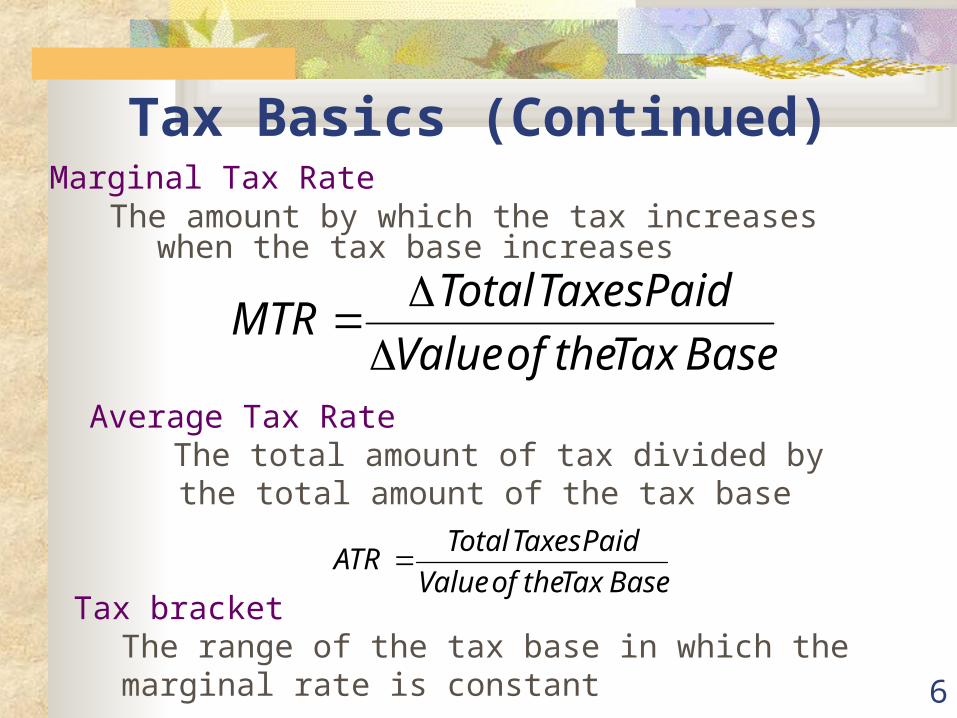
Tax Basics (Continued)Marginal Tax Rate
The amount by which the tax increases when the tax base increases
BaseTaxtheofValue
PaidTaxesTotalMTR
BaseTaxtheofValue
PaidTaxesTotalATR
Average Tax RateThe total amount of tax divided by the total amount of the tax base
Tax bracketThe range of the tax base in which the marginal rate is constant
7
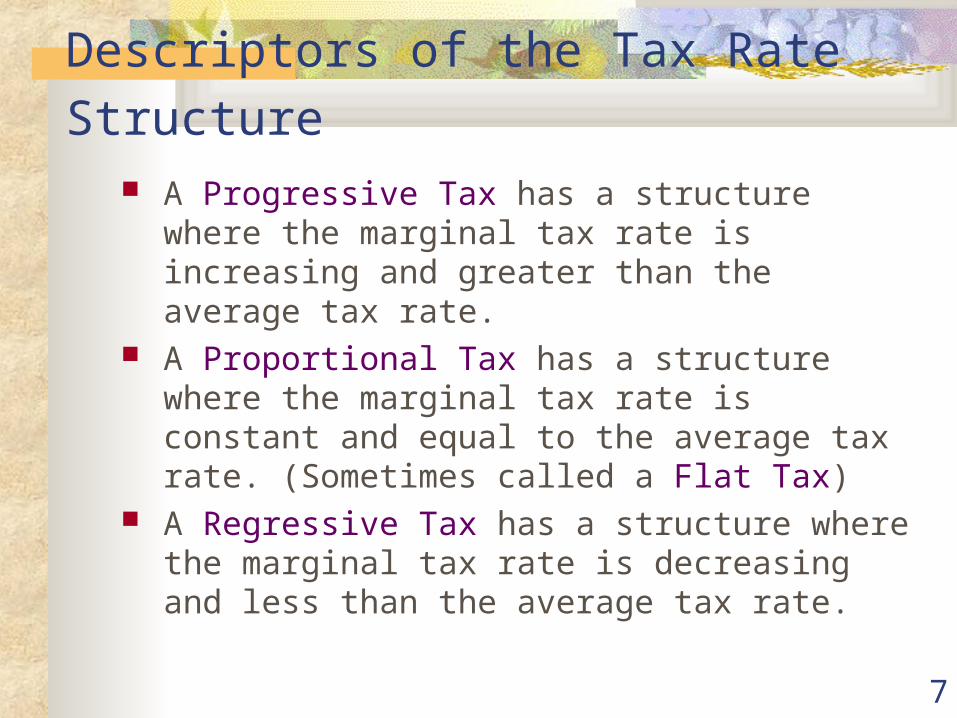
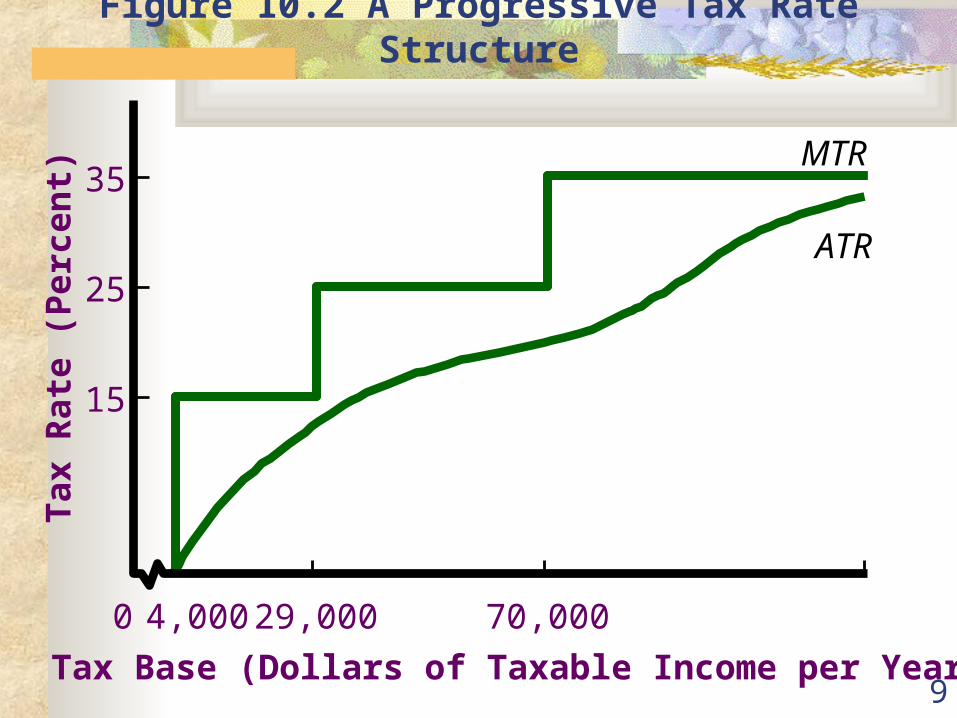
Descriptors of the Tax Rate Structure A Progressive Tax has a structure where the
marginal tax rate is increasing and greater than the average tax rate.
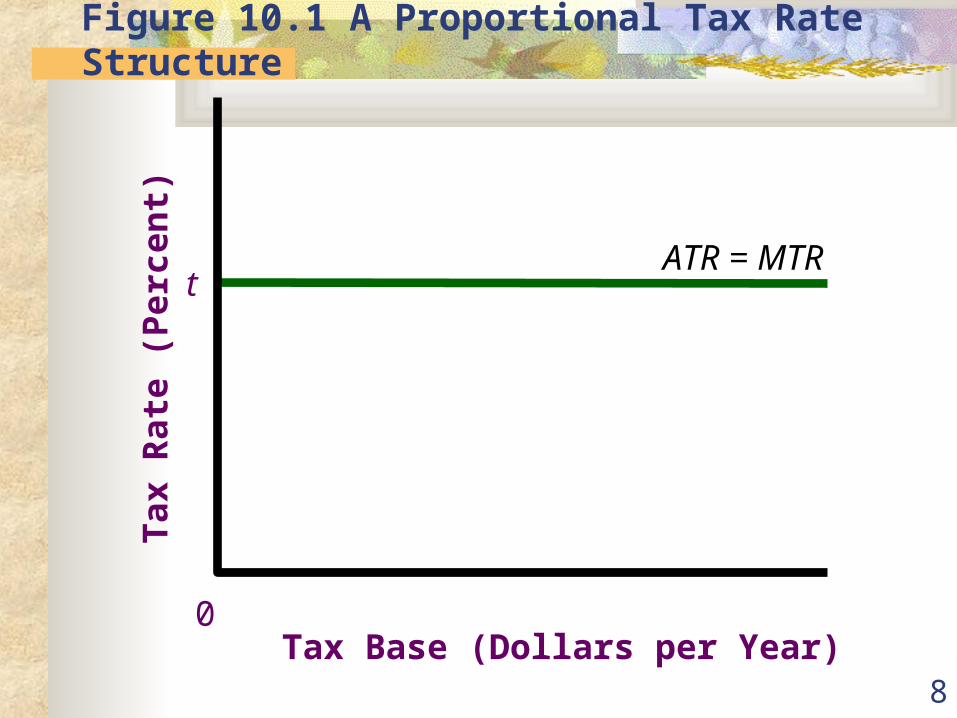
A Proportional Tax has a structure where the marginal tax rate is constant and equal to the average tax rate. (Sometimes called a Flat Tax)
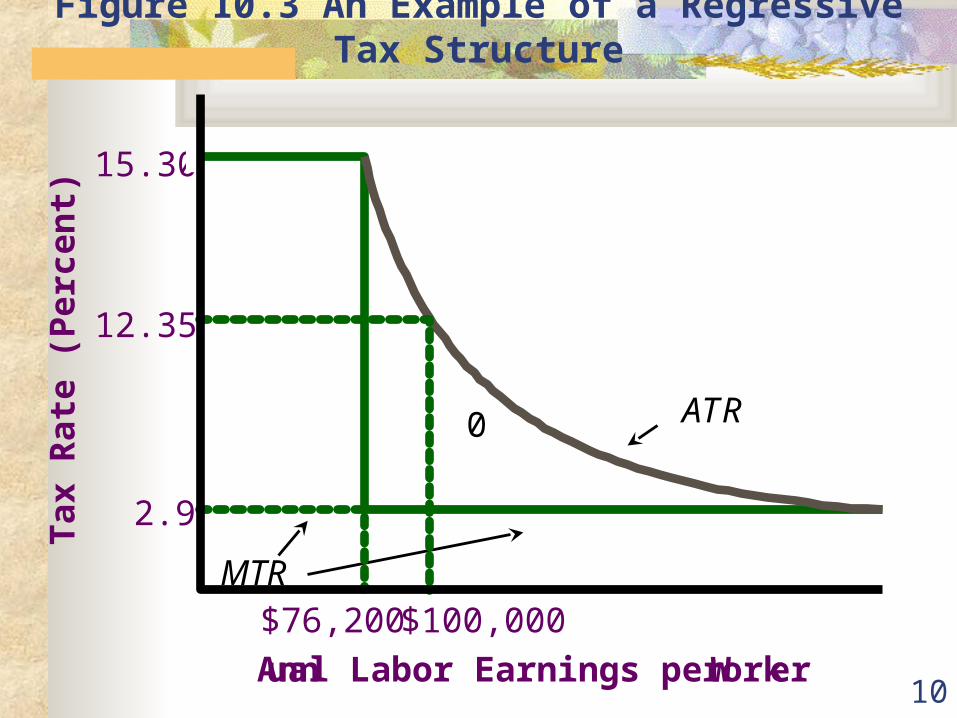
A Regressive Tax has a structure where the marginal tax rate is decreasing and less than the average tax rate.
8
Figure 10.1 A Proportional Tax Rate Structure
Ta
x R
ate
(P
erc
en
t)
Tax Base (Dollars per Year) 0
t ATR = MTR
9
Figure 10.2 A Progressive Tax Rate StructureT
ax
Ra
te (
Pe
rce
nt)
Tax Base (Dollars of Taxable Income per Year)
0
35
25
15
MTR
ATR
4,000 29,000 70,000
10
Figure 10.3 An Example of a Regressive Tax StructureT
ax
Ra
te (
Pe
rce
nt)
Annual Labor Earnings per Worker
0
15.30
12.35
2.9
$100,000 MTR
ATR
$76,200
11
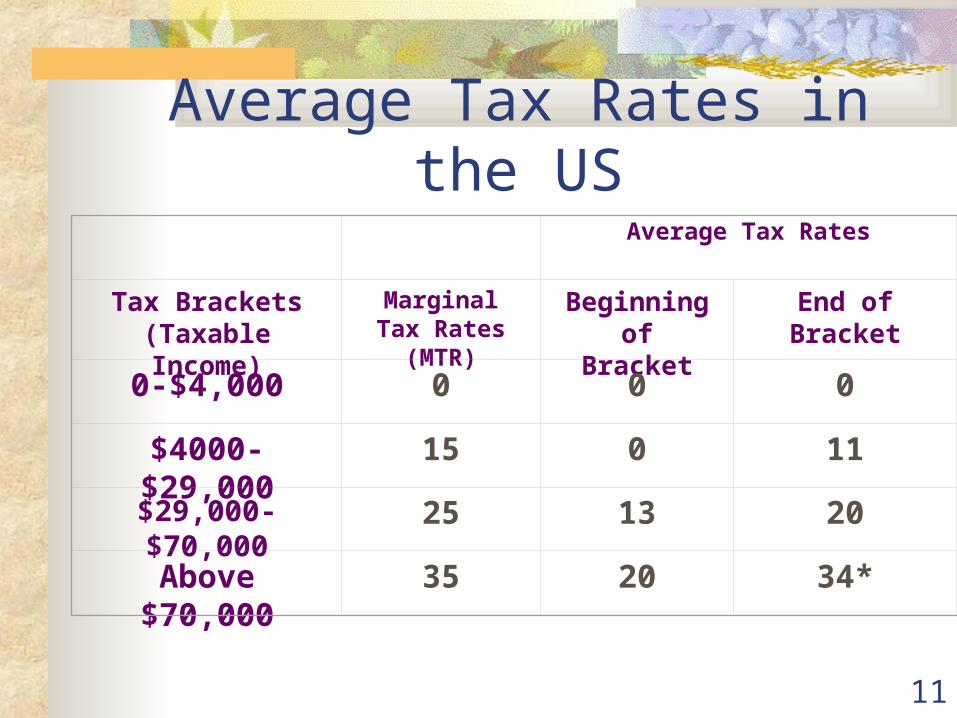
Average Tax Rates
Tax Brackets(Taxable Income)
Marginal Tax Rates (MTR)
Beginning of Bracket
End of Bracket
0-$4,000 0 0 0
$4000-$29,000 15 0 11
$29,000-$70,000 25 13 20
Above $70,000 35 20 34*
Average Tax Rates in the US

12
Average Tax Rates Throughout the World
13
How Should the Burden of Government
Be Financed? Benefit Principle
Those who benefit the most from a particular program should pay the most for that program (Lindahl Tax principle at work).
Ability-to-Pay Principle Those who have the greatest ability to
pay should be required to pay the most.
14
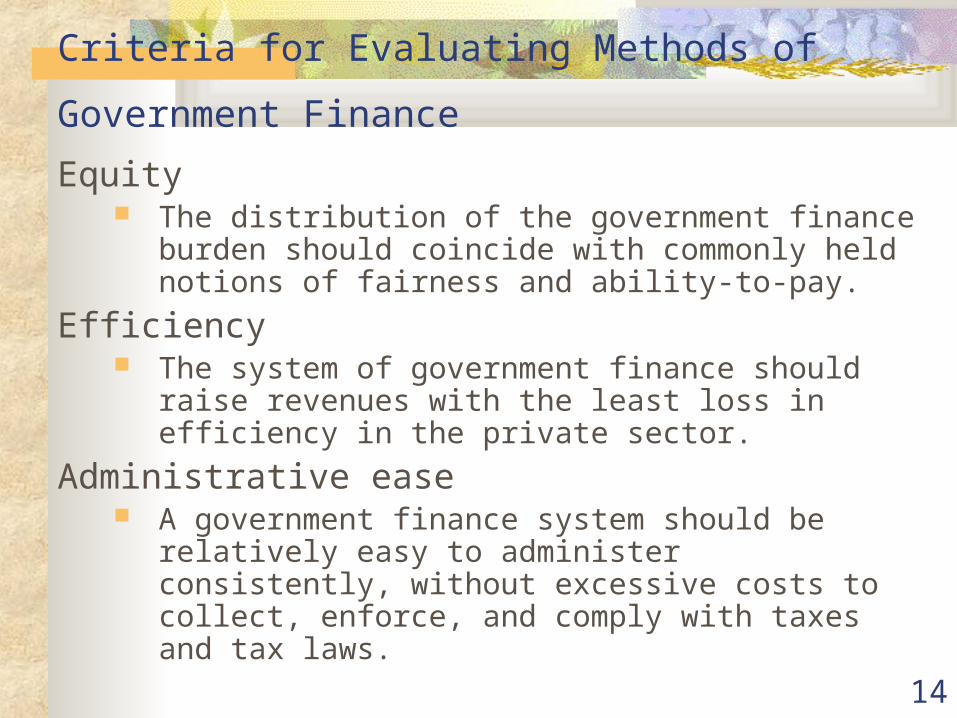
Criteria for Evaluating Methods of Government Finance Equity
The distribution of the government finance burden should coincide with commonly held notions of fairness and ability-to-pay.
Efficiency The system of government finance should raise
revenues with the least loss in efficiency in the private sector.
Administrative ease A government finance system should be relatively
easy to administer consistently, without excessive costs to collect, enforce, and comply with taxes and tax laws.
15
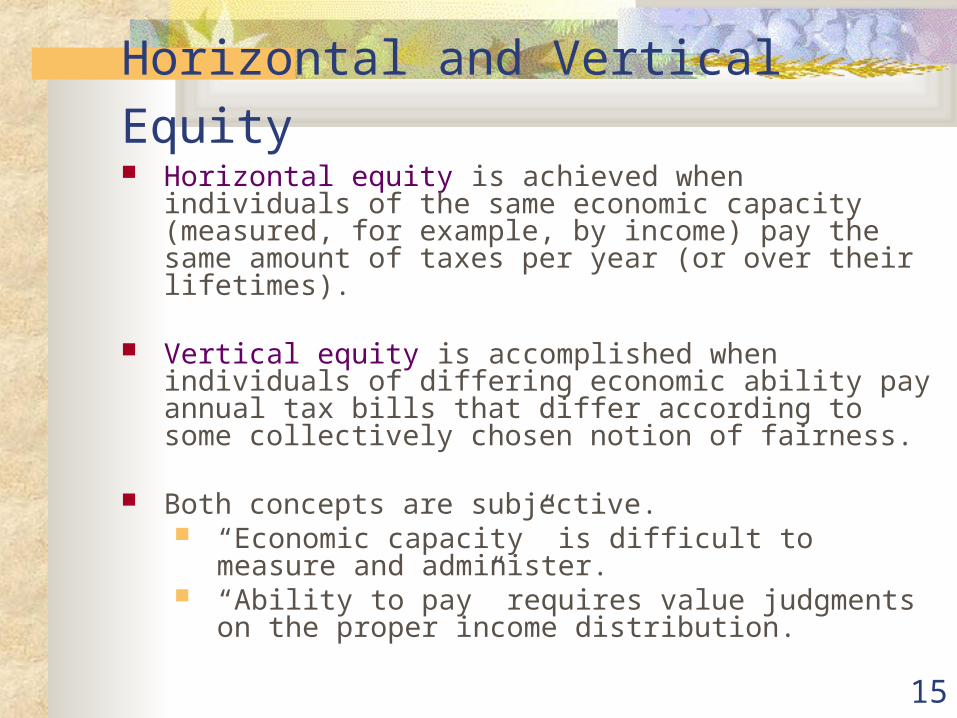
Horizontal and Vertical Equity Horizontal equity is achieved when individuals of the
same economic capacity (measured, for example, by income) pay the same amount of taxes per year (or over their lifetimes).
Vertical equity is accomplished when individuals of differing economic ability pay annual tax bills that differ according to some collectively chosen notion of fairness.
Both concepts are subjective. “Economic capacity” is difficult to measure and
administer. “Ability to pay” requires value judgments on the
proper income distribution.
16
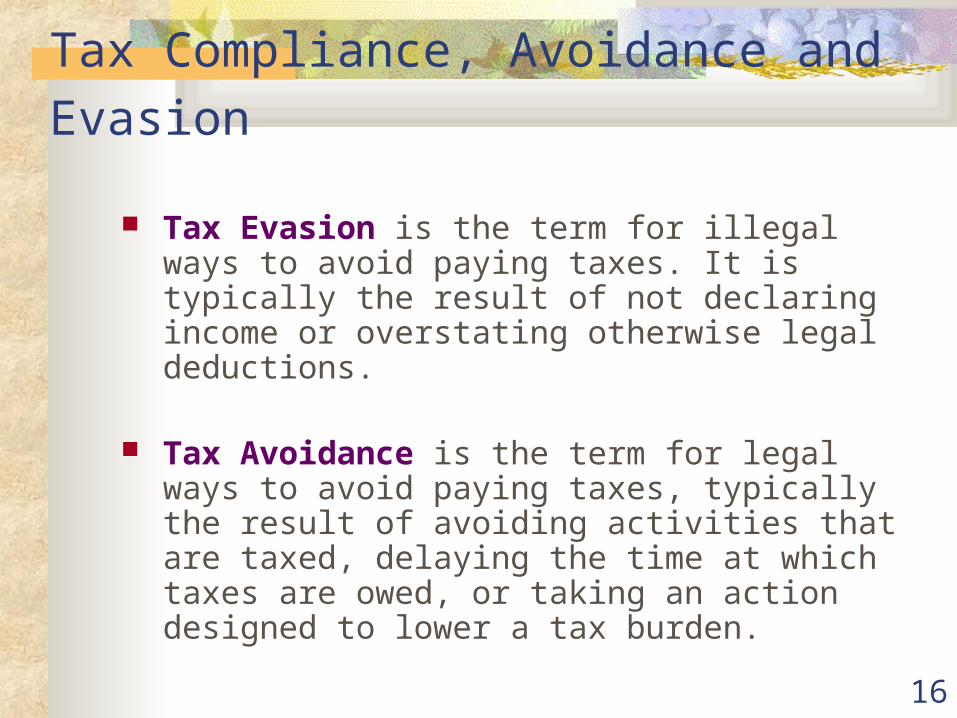
Tax Compliance, Avoidance and Evasion
Tax Evasion is the term for illegal ways to avoid paying taxes. It is typically the result of not declaring income or overstating otherwise legal deductions.
Tax Avoidance is the term for legal ways to avoid paying taxes, typically the result of avoiding activities that are taxed, delaying the time at which taxes are owed, or taking an action designed to lower a tax burden.
17
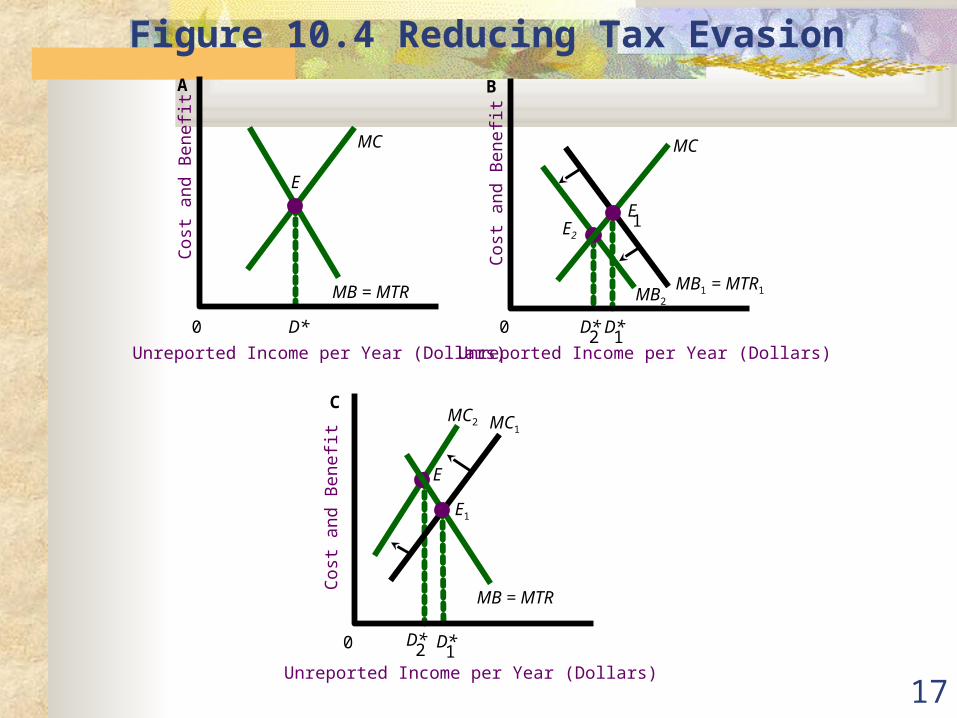
Figure 10.4 Reducing Tax Evasion
D*
A
MC
MB = MTR
Cos
t and
Ben
efit
Unreported Income per Year (Dollars)
0
E
MB2
E2
D*
Cos
t and
Ben
efit
Unreported Income per Year (Dollars)
0 D* 1
B
MC
1 E
MB1 = MTR1
2
MC2
E
D*
C MC1
Cos
t and
Ben
efit
Unreported Income per Year (Dollars)
0
MB = MTR
E1
D* 1 2
18
Alternatives to Taxation
Debt Finance is the means of financing expenditures by issuing bonds.
Inflationary Finance is the means of financing expenditures through the printing of money.
19
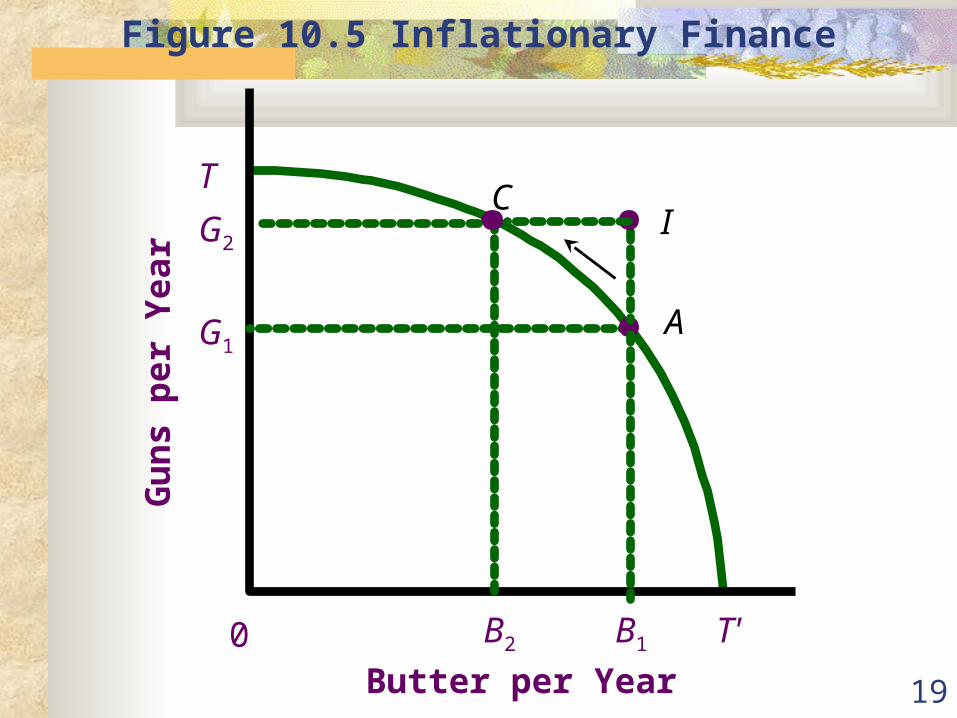
Figure 10.5 Inflationary Finance
T'
T G
un
s p
er
Ye
ar
Butter per Year 0 B2
G2 C
G1 A
B1
I
20
More alternatives to Taxation Donations
Money (but more usually time) is voluntarily given to government. Military service or work in the Peace Corps can be considered a donation when the compensation is less than the market value of the time.
User Charges Users of a government service can expect to pay for
that service. Examples include tuition, fees paid to enter state parks, greens fees at publicly owned golf courses.
Earmarked Taxes Taxes can be implemented to fund specific public
goods. Examples include gasoline taxes and tolls designed to fund road and bridge repair.
21
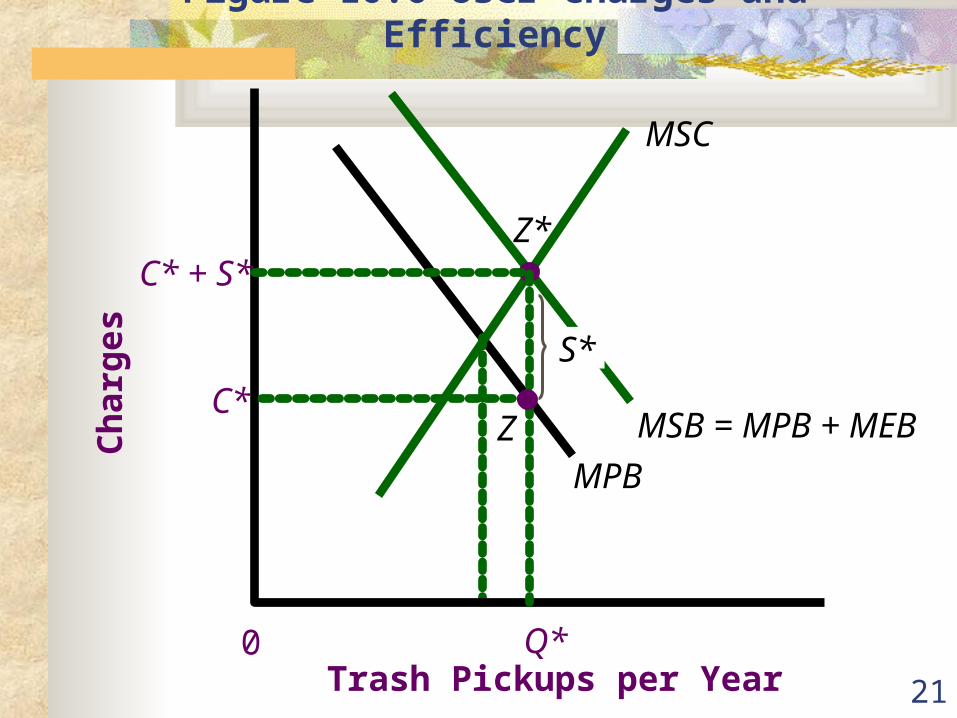
Figure 10.6 User Charges and Efficiency
MSB = MPB + MEB
MPB
MSC C
ha
rge
s
Trash Pickups per Year 0
C*
C* + S* Z*
Q*
S*
Z
22
User Charges and the Transportation Infrastructure
Economists argue that voters demand better roads and airports in part because the price to use them (usually zero) is less than the true marginal cost (which should include congestion costs.)
23
User Charges and Efficiency Roads and Bridges wear out when too much
weight is concentrated on too few axles.
Tolls motivate the wrong behavior in that they tax per axle rather than on pounds per axle.
Estimates suggest that taxing pounds per axle and using the revenue to create stronger roads would pay for itself more than eight-fold.
24
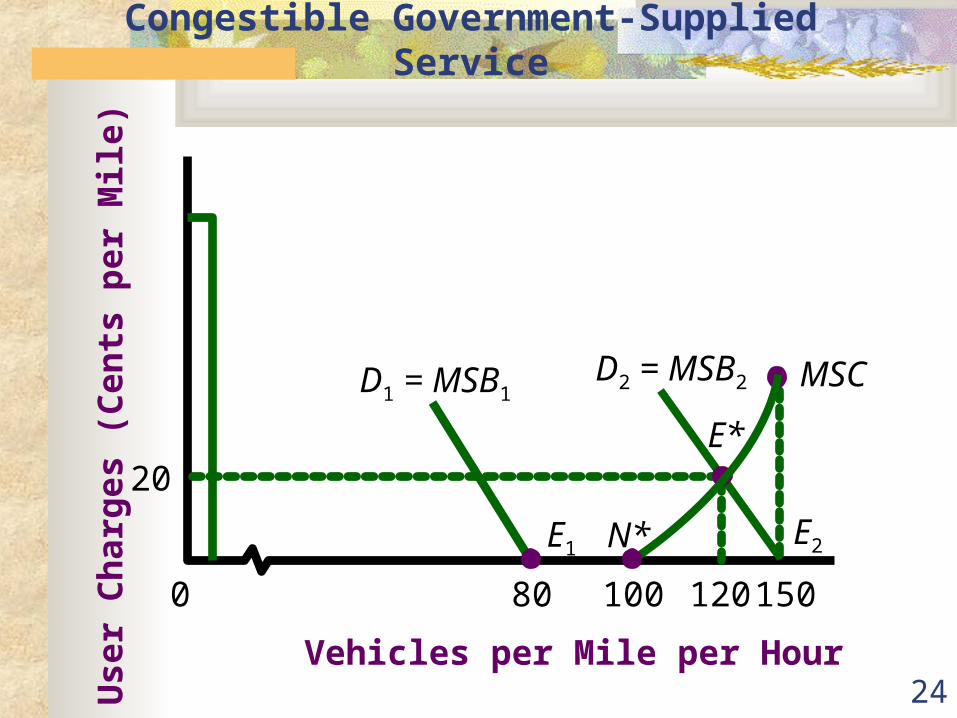
Figure 10.7 User Charges for a Congestible Government-Supplied Service
0
Us
er
Ch
arg
es
(C
en
ts p
er
Mile
)
Vehicles per Mile per Hour
E1
D1 = MSB1
80
E2
150
20
D2 = MSB2
120
E*
MSC
100
N*
25
Government Enterprise Local Utilities
Lotteries
26
State Lotteries 38 states run or participate in lotteries.
State Lotteries account for more than 3% of state revenues.
People of varying incomes spend approximately the same amount on lotteries, which suggests that the lottery system is a regressive means of creating government revenue.
Lotteries pay out a smaller portion of revenue to winners than other forms of gaming (horse racing, casinos, etc.).