changes in the matric potential of soil water with time after disturbance of soil by moulding
TRANSCRIPT
Soil & Tillage Research, 16 (1990) 35-50 35 Elsevier Science Publishers B.V., Amsterdam - - Printed in The Netherlands
Changes in the Matric Potential of Soil Water with Time after Disturbance of Soil by Moulding
A.R. DEXTER
Department of Soil Science, Waite Agricultural Research Institute, University of Adelaide, Glen Osmond, South Australia, 5064 (Australia)
(Accepted for publication 21 April 1989 )
ABSTRACT
Dexter, A.R., 1990. Changes in the matric potential of soil water with time after disturbance of soil by moulding. Soil Tillage Res., 16: 35-50.
Moulding of moist soil samples destroys most of any pre-existing structure and results in a spatial homogenization of the distribution of three component phases: mineral particles, water and air. Such an arrangement is not entirely stable and, if such a disturbed system is allowed to rest, structural rearrangements occur so as to minimize the free energy of the system.
Samples of six soils from Australia, The Netherlands and the U.S.A. were moulded at a range of water contents and kept at constant water content in sealed plastic cylinders. Matric water potential was measured with tensiometers, which required only a small water exchange to give an equilibrium reading.
Structural rearrangements in these soil samples produced more-negative values of water poten- tial with time over the 30-day period after moulding. Some of the soils exhibited two distinct stages of change of water potential with time. There was no clear correlation between the observed behaviour and soil composition. However, the temperature dependence of the tensiometer read- ings was proportional to the clay content of the soil samples.
INTRODUCTION
When soil is disturbed by moulding (or shearing) it usually becomes weaker. This has been explained in terms of the breaking of the bonds between the individual mineral particles of the soil as they are moved relative to each other in the shearing process. Also, during shearing, there is a tendency for the clay particles to become oriented parallel to each other in a face-to-face type of arrangement.
When such a disturbed soil is allowed to stand at constant water content, some of the strength which has been lost is regained. This phenomenon is known variously as "strength regain", "curing" or "age-hardening". When the process is reversible and all of the lost strength is regained, then the term "thixotropy" may be appropriate.
0167-1987/90/$03.50 © 1990 Elsevier Science Publishers B.V.
36 A.R. DEXTER
Age-hardening is thought to occur by two main mechanisms (Dexter et al., 1988). The first, which has been called Mechanism A, is the true thixotropic effect and involves the rearrangement of the soil (mainly the clay) particles into new positions of minimum free energy. This could involve displacements of individual particles relative to each other and/or re-orientation of particles from predominantly face-to-face mutual orientations to edge-to-face or edge- to-edge mutual orientations. The second mechanism, which will be called Mechanism B, involves the re-formation or strengthening of cementing bonds at the new points of contact or near-contact between pairs of mineral particles. These two mechanisms need not be mutually exclusive, although it is hard to imagine the formation of cementing bonds between particles which are in the process of moving or re-orienting relative to each other.
These two mechanisms have different implications and consequences. Mechanism A will necessarily result in changes in the pore size distribution of the soil, which will be reflected in changes in the water potential of samples stored at constant water content after disturbance. Such changes have been observed with soil samples from Australia (Utomo and Dexter, 1981 ), the U.K. (Molope et al., 1985) and the U.S.A. (Schweikle et al., 1974). In all of these cases, the water potential decreased (i.e., became more negative) with time after disturbance. With Mechanism B acting alone, changes in water potential with time would not be expected. Mechanism B has been inferred as the prin- cipal mechanism responsible for age-hardening of three soils from the Pacific Northwest of the U.S.A. (Kemper and Rosenau, 1984; Kemper et al., 1987).
In an attempt to distinguish between the two mechanisms, Dexter et al. (1988) studied the age-hardening behaviour of several soils which had been subjected to different levels of uniaxial compactive stress. The idea was that increasing levels of compaction would increase the number of initial particle- to-particle contacts in the soil. It was argued that if the dominant mechanism was of Type A, then the absolute strength increase of the samples with time would be independent of compaction pressure. On the other hand, if the dom- inant mechanism was of Type B, then the relative strength increase (strength at some time, t, divided by the initial strength at the time of moulding) would be independent of compaction pressure.
Experimental results were consistent with the idea that several soils from Germany and Israel were following Mechanism A over ageing times from 0 to 45 days, whereas the same three soils from the U.S.A. referred to above fol- lowed Mechanism B from 0 to 6 days and for water contents up to the lower plastic limit.
This paper presents the results of ageing experiments on three Australian soils, one Dutch soil and one soil from the U.S.A. One of the Australian, and the Dutch and U.S.A. soils have been examined previously in other experi- ments. The object of the present experiments was to investigate changes in water potential with time for soils which had been freshly moulded at a range
CHANGES IN MATRIC POTENTIAL AFTER MOULDING 3 7
of initial water contents. This was to examine changes in pore-size distribu- tions which would provide evidence for particle rearrangements.
M A T E R I A L S A N D M E T H O D S
Soils
Soil samples were collected from the field as follows. Urrbrae A and B hori- zon samples were collected from the 0-100- and 300-350-mm depth layers, respectively, from Field Wl0 at the Waite Agricultural Research Institute. The sample of Wiesenboden was from the 200-250-mm layer of Profile A1024 de- scribed by Stace et al. (1968). This is a Pellustert (Soil Survey Staff, 1975). The Mintaro soil was from the 0-100-mm layer from the Mortlock Experiment Station (33°55'S, 138°43'E). Both the Urrbrae and Mintaro soils are Red- Brown Earths and are Rhodoxeralfs (Oades et al., 1981 ).
The Dutch soil was collected from the arable (0-200-ram) layer of land par- cel H91 in the East Flevoland Polder. This soil was reclaimed from the IJssel- meer in about 1957. This soil is the same as soil No. 3 in Dexter et al. (1984a,b) and Dexter (1985).
The Portneuf soil was from the 0-200-mm layer at the Snake River Conser- vation Research Center near Twin Falls, Idaho, U.S.A. This is the same Port- neuf soil as was used by Kemper and Rosenau (1984), Kemper et al. (1987), Dexter et al. (1988) and Bullock et al. (1988). It is classified as a Xerollic Calciorthid {Soil Survey Staff, 1975).
Particle sizes were determined after removal of carbonates, oxidation of or- ganic matter, dialysis, pH adjustment, dispersion by sodium hexametaphos- phate and ultrasonics. Organic carbon was determined by the Walkley and Black method, inorganic carbon by the pressure calcimeter method and total carbon by the amount of CO2 released on combustion. The total carbon method was checked with standard samples. Although there was quite good agreement between the sum of the organic and inorganic carbon contents and the total carbon measurements, the total carbon was assumed to be the most accurate of the measurements and so the organic and inorganic carbon contents were scaled proportionately to give the correct totals.
The liquid limit was determined by the fall-cone method (Campbell, 1975) and the plastic limit by the rolling of threads of soil (British Standards, 1975 ). The specific surface areas were determined by nitrogen adsorption using a one- point B.E.T. method using a thermal conductivity gas analyser. This appara- tus was checked using standard samples of bone char, Kent clay and Fuller's earth, and gave results to within 5% of the standard values.
Some chemical and electrochemical properties of the soils were determined as follows. Exchangeable bases were determined by leaching the samples with ammonium acetate solution and analysing the leachate with an atomic ab-
38 A.R.DEXTER
sorption spectrometer. Cation exchange capacity (CEC) was determined by leaching with ammonium acetate solution and then with acidified sodium chlo- ride solution. The ammonia released on steam distillation was determined by titration and the CEC was calculated. Electrical conductivities and pH were determined after shaking 1: 5 soil: water suspensions and leaving them to settle for 1 h.
Tensiometers
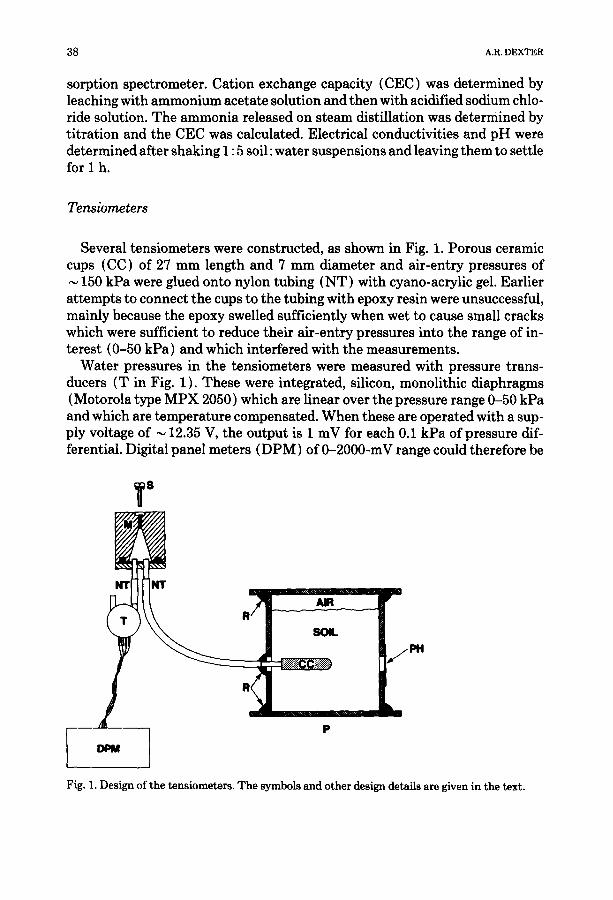
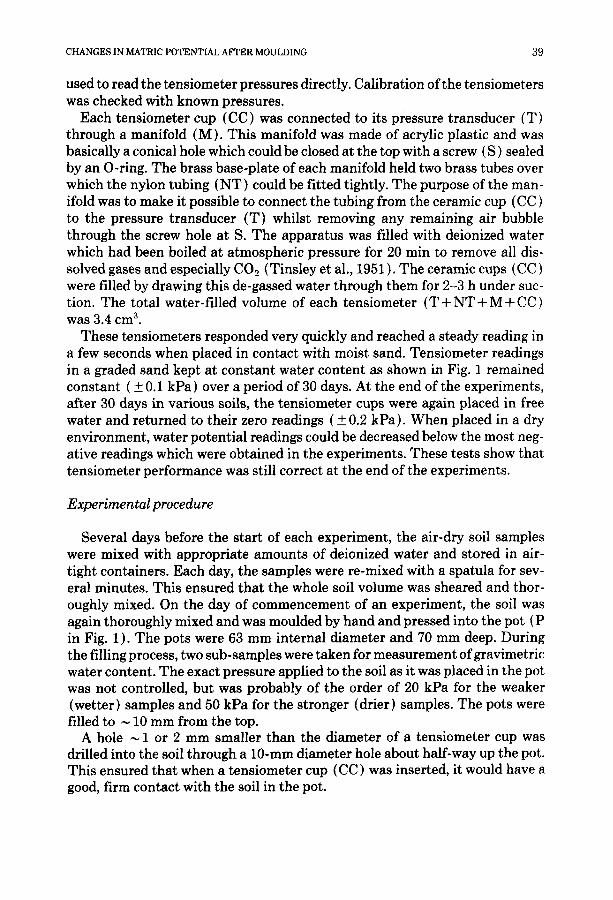
Several tensiometers were constructed, as shown in Fig. 1. Porous ceramic cups (CC) of 27 mm length and 7 ram diameter and air-entry pressures of ~ 150 kPa were glued onto nylon tubing (NT) with cyano-acrylic gel. Earlier at tempts to connect the cups to the tubing with epoxy resin were unsuccessful, mainly because the epoxy swelled sufficiently when wet to cause small cracks which were sufficient to reduce their air-entry pressures into the range of in- terest (0-50 kPa) and which interfered with the measurements.
Water pressures in the tensiometers were measured with pressure trans- ducers (T in Fig. 1). These were integrated, silicon, monolithic diaphragms (Motorola type MPX 2050) which are linear over the pressure range 0-50 kPa and which are temperature compensated. When these are operated with a sup- ply voltage of ~ 12.35 V, the output is I mV for each 0.1 kPa of pressure dif- ferential. Digital panel meters (DPM) of 0-2000-mV range could therefore be
$
Fig. 1. Design of the tensiometers. The symbols and other design details are given in the text.
CHANGES IN MATRIC POTENTIAL AFTER MOULDING 39
used to read the tensiometer pressures directly. Calibration of the tensiometers was checked with known pressures.
Each tensiometer cup (CC) was connected to its pressure transducer (T) through a manifold (M). This manifold was made of acrylic plastic and was basically a conical hole which could be closed at the top with a screw (S) sealed by an O-ring. The brass base-plate of each manifold held two brass tubes over which the nylon tubing (NT) could be fitted tightly. The purpose of the man- ifold was to make it possible to connect the tubing from the ceramic cup (CC) to the pressure transducer (T) whilst removing any remaining air bubble through the screw hole at S. The apparatus was filled with deionized water which had been boiled at atmospheric pressure for 20 min to remove all dis- solved gases and especially C02 (Tinsley et al., 1951 ). The ceramic cups (CC) were filled by drawing this de-gassed water through them for 2-3 h under suc- tion. The total water-filled volume of each tensiometer (T + NT + M + CC ) was 3.4 cm 3.
These tensiometers responded very quickly and reached a steady reading in a few seconds when placed in contact with moist sand. Tensiometer readings in a graded sand kept at constant water content as shown in Fig. 1 remained constant ( + 0.1 kPa) over a period of 30 days. At the end of the experiments, after 30 days in various soils, the tensiometer cups were again placed in free water and returned to their zero readings (+ 0.2 kPa). When placed in a dry environment, water potential readings could be decreased below the most neg- ative readings which were obtained in the experiments. These tests show that tensiometer performance was still correct at the end of the experiments.
Experimental procedure
Several days before the start of each experiment, the air-dry soil samples were mixed with appropriate amounts of deionized water and stored in air- tight containers. Each day, the samples were re-mixed with a spatula for sev- eral minutes. This ensured that the whole soil volume was sheared and thor- oughly mixed. On the day of commencement of an experiment, the soil was again thoroughly mixed and was moulded by hand and pressed into the pot (P in Fig. 1). The pots were 63 mm internal diameter and 70 mm deep. During the filling process, two sub-samples were taken for measurement of gravimetric water content. The exact pressure applied to the soil as it was placed in the pot was not controlled, but was probably of the order of 20 kPa for the weaker (wetter) samples and 50 kPa for the stronger (drier) samples. The pots were filled to ~ 10 mm from the top.
A hole ~ 1 or 2 mm smaller than the diameter of a tensiometer cup was drilled into the soil through a 10-mm diameter hole about half-way up the pot. This ensured that when a tensiometer cup ( CC ) was inserted, it would have a good, firm contact with the soil in the pot.
40 A.R. DEXTER
The hole around the nylon tube (NT) was sealed with silicone rubber (R). A plastic top was fixed to the pot in the same way to make an air-tight seal. Contact with the atmosphere was maintained through a pin-hole (PH) in a strip of PVC tape over a second hole of 10 mm diameter. This was to supply atmospheric pressure to the soil sample since it was already connected to the other side of the pressure transducer (T). If this was not done, the equipment would have been sensitive to changes in atmospheric pressure.
Tensiometer readings were taken every hour or two during the first day and then at around 09.00 h daily for periods of 30 days for each soil and water content. At the end of each 30-day experiment the apparatus was opened, the gravimetric water content of the soil sample was determined in duplicate and the tensiometer response was tested.
RESULTS AND DISCUSSION
The experimental soils are characterized by their compositions, Atterberg limits and specific areas, which are given in Table 1, and by their exchangeable
TABLE I
Composition and some physical properties of the experimental soils
Soil Particle size distribution Carbon (%, w/w) CaCOa Atterberg Specific (%,w/w) (%, limits (gg-') surface
w/w) area <2#m 2-50/tin >50/~m Inorganic Organic PL LL (hakg -I)
Urrbrae A 18.5 51.0 30.5 0 1.51 0 0.216 0.292 1.3 Urrbrae B 46.0 35.5 18.5 0 0.48 0 0.197 0.428 4.9 Wiesenboden 66.8 15.8 17,4 0 1.41 0 0,383 0.810 13.5 Mintaro 20.0 54.0 26.0 0 1.63 0 0.215 0,301 1.4 Dutch No, 3 18.9 66.3 14.8 1.28 1.43 10.7 0.254 0.348 1.5 Portneuf 28.3 52.5 19,2 0.15 0.98 1.3 0.216 0.315 3.3
T A B L E 2
S o m e c h e m i c a l p r o p e ~ i e s o f t h e e x p e H m e n t a l s o i l s
Soil Exchangeable bases (me kg -1 ) pH EC (mS m -I)
K Na Ca Mg CEC
Urrbrae A 7.2 2.5 44 0.6 117 5.6 7.3 Urrbrae B 11.1 3.4 92 23 162 6.2 7.6 Wiesenboden 20.0 5.6 282 97 498 7,7 11.0 Mintaro 9.8 3.4 80 13 183 5.1 35,4 Dutch No. 3 2.8 3.8 304 1.9 176 8,1 60,0 Por tneuf 10.1 5.1 313 33 181 8.9 14.7
CHANGES IN MATRIC POTENTIAL AFTER MOULDING 41
bases, pH and soluble salt content (as expressed by electrical conductivity, EC) which are given in Table 2. These two tables illustrate the wide range of properties of the experimental soils. The EC values show that none of the soils was saline.
The apparatus shown in Fig. 1 and described in the text performed very well throughout the experiments. The average drying rate of the soil samples, pre- sumably through exchange through the pin-hole (PH), and through the dif- fusion of water through the nylon tubing (NT) and the silicone rubber (R), was only 2.75 × 10 -4 g g-1 day-1. Drying of the samples accounted for 5-20% and typically for 10% of the observed changes in water potential, ~,.
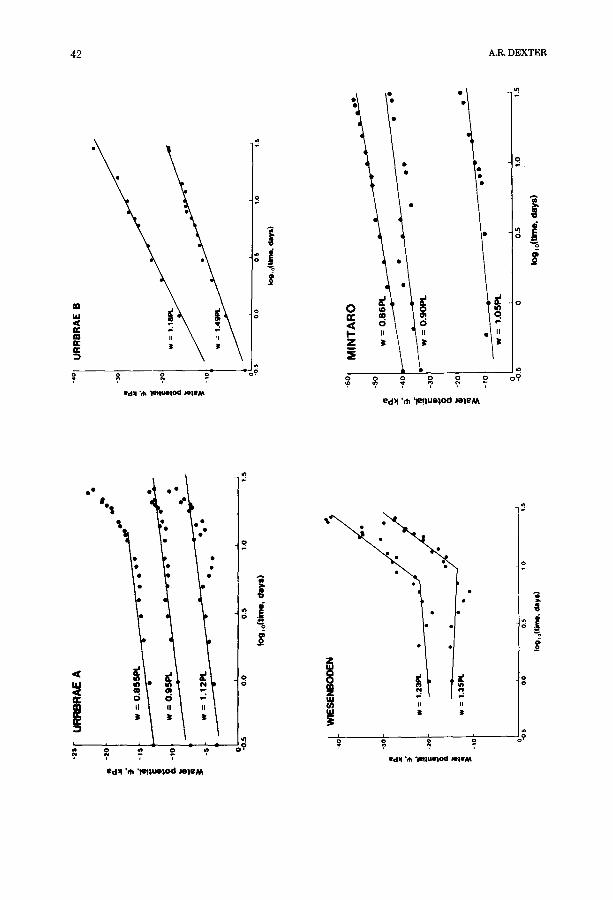
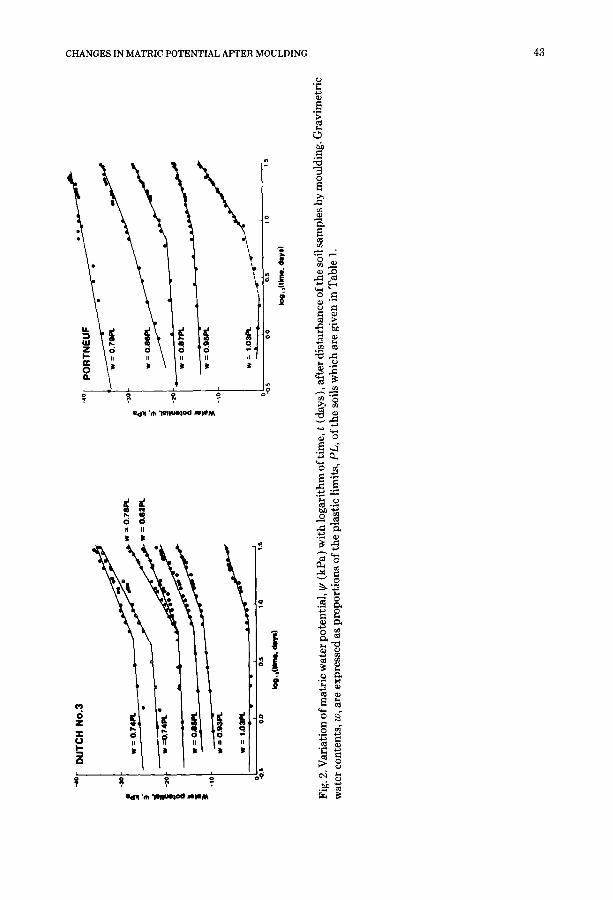
The tensiometer results are shown in Fig. 2, where gravimetric water con- tents, w, at the time of remoulding are expressed as proportions of the plastic limits, PL, of the soils. In almost all cases, there was a trend of decreasing (increasing negative) water potentials with time after disturbance by mould- ing. In Fig. 2, the water potentials, ~,, are plotted against the logarithm of time, t, and this gives linear plots over all or parts of the time period shown (0.3-30 days). In many cases, readings were taken in the period 0.04-0.3 days and these gave results which were consistent with the linear plots shown. At the conclu- sion of several of the experiments, the soil samples were remoulded. This caused the water potentials to increase again and to return to close to their original values. This illustrates the reversibility of the changes observed.
For the Urrbrae B and Mintaro soils, the ~, versus log t relationships were essentially linear over the whole experimental period. For the Urrbrae B soil, some deviations from linearity were caused by temperature fluctuations in the laboratory (which was not air conditioned). The Mintaro soil at w=O.86PL was measured in a constant temperature room (20°C) and exhibits much smaller fluctuations of readings than the other cases. The results were fitted to the relationship
~'=a+b -p-£ + c l o g t (1)
Coefficients of eqn. (1) for the various soils are given in Table 3. The linear relationship between ~ and w implicit in eqn. (1) illustrates that the water characteristic curves were approximately linear for these moulded soils over the ranges of water contents used.
For the Urrbrae A soil, the rate of decrease in ~ with log t appears to accel- erate at times longer than ~ 12 days. In this case, eqn. ( 1 ) was fitted only to the data for times up to 12 days. The increase in slope at ~ 12 days was gradual with no well-defined inflection point.
The Wiesenboden, Dutch and Portneuf soils all showed a very distinctive type of behaviour with two straight-line portions to the ~] versus log t graphs. The intersection of the straight line segments occurred at an inflection time,
-2S
-20
° i -1
5
-tO -0
..5
_30 I
d ! -Io
UR
RB
RA
E A
...."
ee
w
= 1.
12PL
~~
~1
[~
~~
g
~
olo
o15
1'.0
115
Io9,
o(tl
me
, day
s)
WES
ENBO
OEN
• "i
w =
1.23
PL
• •
• •
w =
1.3S
RL
•
olo
oI~
,!o
Iog,
o(tim
e, d
ays)
-4o
URRB
RAE B
-30
i -2
0 -°o 5
o'o
o's
1'o
,'5
log,
o(tm
m,
days
)
-60
-50
-40
¢:
-30
@
-10 -0
.5
MIN
TA
RO
w =
0.86P
t. _
~ •
•*
.
w = 1.0
5PL
log ,o(
time, d
ays)
-4O
-30
.+ I "1
0 +o+
0~,
"
DU
TC
H N
O.3
w
= 0.
9~L
w =
1.0
3PL
.
o'.,
,~o
~ k
~,o
(~
<ms)
-30
-2o
i i
-lo
PO
RT
NE
UF
w:o;
w =
0.9
5Pt.
j
w =
1.0
3PL
k)9,
oltln
w, d
ays)
Fig
. 2. V
aria
tion
of m
atri
c w
ater
pot
enti
al, ~
(kP
a) w
ith
loga
rith
m o
f tim
e, t
(day
s), a
fter
dis
turb
ance
of t
he s
oil s
ampl
es b
y m
ould
ing.
Gra
vim
etri
c w
ater
con
tent
s, w
, are
exp
ress
ed a
s pr
opor
tion
s of
the
plas
tic
lim
its,
PL
, of t
he s
oils
wh
ich
are
giv
en in
Tab
le 1
.
t~
*e
t~
C~
0 Z
0
4 4 A.R. DEXTER
T A B L E 3
V a l u e s o f t h e c o e f f i c i e n t s o f e q n . ( 1 ) f o r t h e e x p e r i m e n t a l s o i l s f o r t h e d i f f e r e n t s t a g e s o f t h e
e x p e r i m e n t s
S o i l S t a g e ti ( d a y s ) * a b c
U r r b r a e A - - 4 5 3 7 . 4 - 2 . 67
U r r b r a e B - - 5 2 . 0 3 0 . 8 - 10 .6
W i e s e n b o d e n 1 8 .5 - 7 0 . 4 41 .3 - 0 . 3 8
2 - - 1 1 0 . 5 9 6 . 9 - 3 4 . 1
M i n t a r o - - 2 2 9 2 1 4 . 5 - 7 . 54
D u t c h N o . 3 1 6 .6 - 76 .1 7 2 . 8 - 1 .17
2 - - 6 5 . 5 6 9 . 7 - 11 .2
P o r t n e u f 1 6 .9 - 1 4 1 . 8 1 3 6 . 2 - 3 . 4 0
2 - - 1 0 8 . 0 9 9 . 8 - 9 . 4 0
* M e a n t i m e a t w h i c h S t a g e 1 e n d s a n d S t a g e 2 b e g i n s .
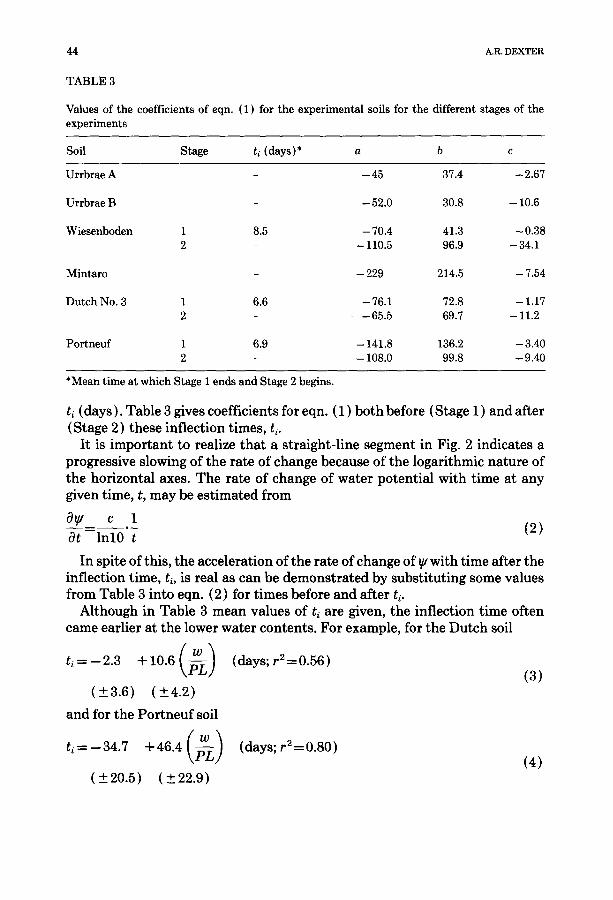
ti (days). Table 3 gives coefficients for eqn. (1) both before (Stage 1 ) and after (Stage 2) these inflection times, ti.
It is important to realize that a straight-line segment in Fig. 2 indicates a progressive slowing of the rate of change because of the logarithmic nature of the horizontal axes. The rate of change of water potential with time at any given time, t, may be estimated from
0~ c 1 0t - l n l 0 t (2)
In spite of this, the acceleration of the rate of change of ~ with time after the inflection time, ti, is real as can be demonstrated by substituting some values from Table 3 into eqn. (2) for times before and after ti.
Although in Table 3 mean values of ti are given, the inflection time often came earlier at the lower water contents. For example, for the Dutch soil (w) t ~ = - 2 . 3 +10.6 ~ (days;r2=0.56)
(3) ( ___ 3.6) (+_4.2)
and for the Portneuf soil
t i=--34.7 + 4 6 . 4 ( £ ) (days;r2=0.80) (4)
{+20.5) (+.22.9)
CHANGES IN MATRIC POTENTIAL AFTER MOULDING 45
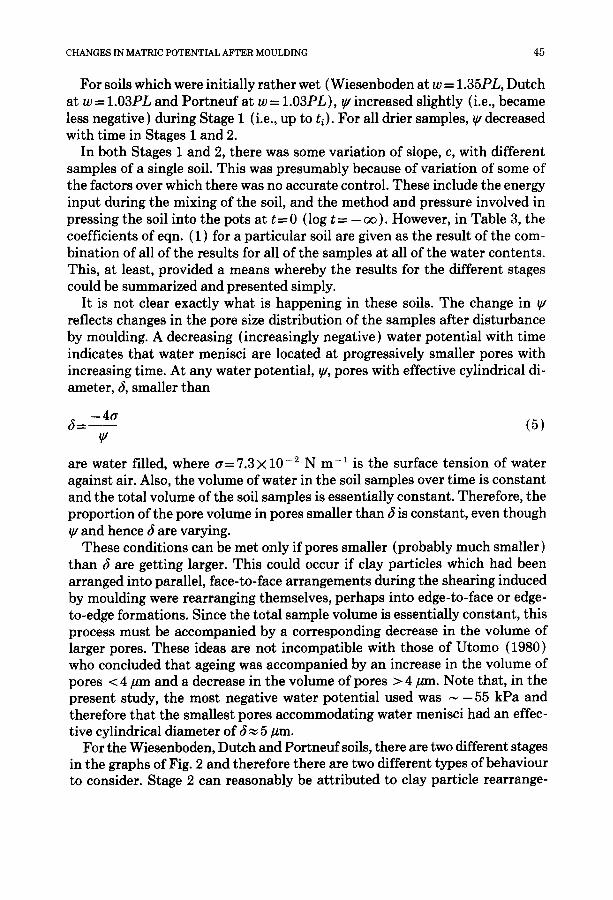
For soils which were initially rather wet (Wiesenboden at w = 1.35PL, Dutch at w = 1.03PL and Portneuf at w = 1.03PL), ¥ increased slightly (i.e., became less negative) during Stage 1 (i.e., up to ti). For all drier samples, ~ decreased with time in Stages 1 and 2.
In both Stages 1 and 2, there was some variation of slope, c, with different samples of a single soil. This was presumably because of variation of some of the factors over which there was no accurate control. These include the energy input during the mixing of the soil, and the method and pressure involved in pressing the soil into the pots at t=O (log t= -oo) . However, in Table 3, the coefficients of eqn. (1) for a particular soil are given as the result of the com- bination of all of the results for all of the samples at all of the water contents. This, at least, provided a means whereby the results for the different stages could be summarized and presented simply.
It is not clear exactly what is happening in these soils. The change in reflects changes in the pore size distribution of the samples after disturbance by moulding. A decreasing (increasingly negative) water potential with time indicates that water menisci are located at progressively smaller pores with increasing time. At any water potential, ~,, pores with effective cylindrical di- ameter, ~, smaller than
- 4 a ,~_ (5)
are water filled, where a=7 .3X10 -2 N m -1 is the surface tension of water against air. Also, the volume of water in the soil samples over time is constant and the total volume of the soil samples is essentially constant. Therefore, the proportion of the pore volume in pores smaller than 5 is constant, even though
and hence 5 are varying. These conditions can be met only if pores smaller (probably much smaller)
than $ are getting larger. This could occur if clay particles which had been arranged into parallel, face-to-face arrangements during the shearing induced by moulding were rearranging themselves, perhaps into edge-to-face or edge- to-edge formations. Since the total sample volume is essentially constant, this process must be accompanied by a corresponding decrease in the volume of larger pores. These ideas are not incompatible with those of Utomo (1980) who concluded that ageing was accompanied by an increase in the volume of pores < 4/zm and a decrease in the volume of pores > 4/~m. Note that, in the present study, the most negative water potential used was ~ - 55 kPa and therefore that the smallest pores accommodating water menisci had an effec- tive cylindrical diameter of 5 z 5 ~m.
For the Wiesenboden, Dutch and Portneuf soils, there are two different stages in the graphs of Fig. 2 and therefore there are two different types of behaviour to consider. Stage 2 can reasonably be attributed to clay particle rearrange-
46 A.R. DEXTER
ments as described above. For Stage 1, at least two possibilities exist. Firstly, it is possible that during Stage 1 there is some factor preventing or hindering clay particle rearrangement which suddenly becomes inactive at time ti. Sec- ondly, it is possible that there is some other process occurring up to time ti concurrently with clay particle rearrangements. For example, clay particle rearrangements may increase pore volume in pores < 4 #m. This other, hy- pothesized process could involve the coagulation of clay particles into clusters, the pores between which would be < ~ and > 4 #m. Thus the volume of pores between 4 #m and ei could be reduced at the same time as the mean size of these pores becomes larger or remains constant. The water menisci would then be in pores between clusters which continue to grow up to time ti.
It is now possible to re-examine the age-hardening results in the light of the new findings. Age-hardening by Mechanism A (Dexter et al., 1988), where new particle-to-particle bonds are formed by particle rearrangements, is entirely compatible with the new data. Particle rearrangements are certainly respon- sible for the observed changes in water potential. Also contributing to any strength increase would be increases in effective stress. This arises because the decreasing matric potential in the soil water acts equivalently to an externally applied pressure which increases soil shear strength (Greacen, 1960).
Age-hardening by Mechanism B was defined as the strengthening of inter- particle bonds by the diffusion of cementing agents towards points of particle- to-particle contact. Such a process would not involve particle rearrangements and therefore would not be expected to cause changes in ~. The significant strength increases (by a factor of ~ 1.8 at w=PL) observed for the Portneuf soil by Dexter et al. (1988) occurred within a period of 6 days, which is less than the time to the inflection point, t~. Certainly, the changes in ~/up to ti are only relatively small and so the observed strength increases are not due to increases in effective stress. For times > t~, significant changes in ~ were ob- served. However, it seems unlikely that soil particles will suddenly start to rearrange at some time t~ if the strengths of the inter-particle bonds have in- creased significantly in the time between moulding and t~. It seems more likely that, as described previously, there are two types of particle rearrangement occurring at times < ti and that the effects of these on ~ largely offset each other. The strength increases observed by Dexter et al. (1988) would be more sensitive to the clay particle rearrangements than to the hypothesized cluster- ing phenomenon, thus accounting for the strength increases at times < t~. This proposed mechanism does not preclude the possibility of cementation being the dominant mechanism of age-hardening at lower water contents and/or at longer times, as described by Kemper and Rosenau (1984) and Kemper et al. (1987).
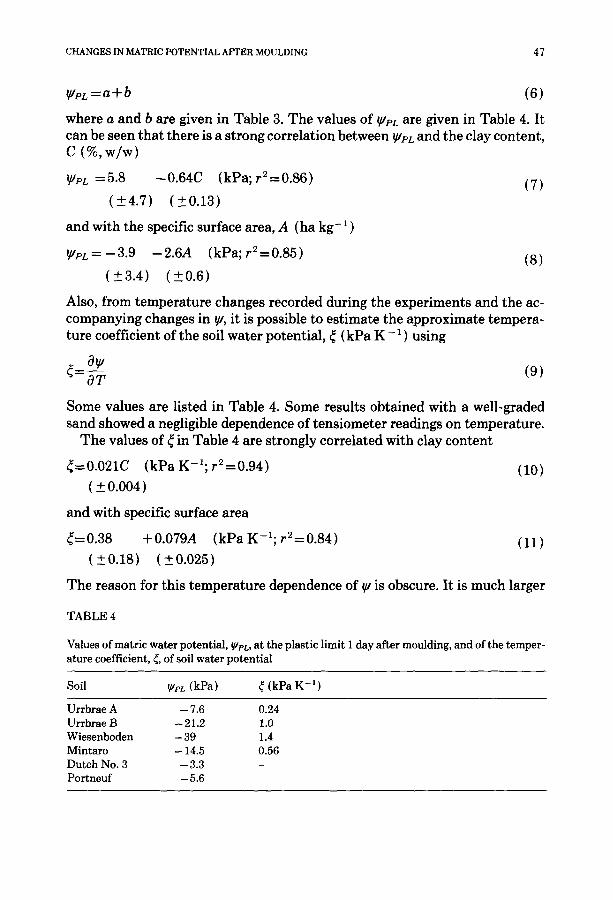
Two other interesting pieces of information were obtained from these ex- periments. Firstly, it was possible to obtain the matric water potential, ~PL (kPa), at the plastic limit. As a standard, this was calculated for t= 1 day after sample moulding and is equal to
CHANGES IN MATEIC POTENTIAL AFTER MOULDING 47
~/pL = a + b (6)
where a and b are given in Table 3. The values of ~UpL are given in Table 4. It can be seen that there is a strong correlation between ~¢PL and the clay content, C (%, w/w)
~PL =5.8 -0.64C (kPa; r2=0.86) (7)
(+4.7) (+0.13)
and with the specific surface area, A (ha kg -1 )
~UpL=--3.9 --2.6A (kPa; r2=0.85) (8)
{+3.4) (+0.6)
Also, from temperature changes recorded during the experiments and the ac- companying changes in ~,, it is possible to estimate the approximate tempera- ture coefficient of the soil water potential, ~ (kPa K - 1 ) using
0~ ~ = ~ (9)
Some values are listed in Table 4. Some results obtained with a well-graded sand showed a negligible dependence of tensiometer readings on temperature.
The values of ~ in Table 4 are strongly correlated with clay content
~=0.021C (kPa K- l ; r2=0.94) (10)
( _+ 0.004)
and with specific surface area
~=0.38 +0.079A ( k P a K - l ; r 2 = 0 . 8 4 ) (11)
(+0.18) (+_0.025)
The reason for this temperature dependence of ~ is obscure. It is much larger
TABLE 4
Values of matr ic water potential , ~l/eL , at the plastic l imit 1 day after moulding, and of the temper- ature coefficient, ~, of soil water potent ia l
Soil ~UeL (kPa) ~ (kPa K -1)
Urrbrae A - 7.6 0.24 Urrbrae B - 21.2 1.0 Wiesenboden - 39 1.4 Min ta ro - 14.5 0.56 Dutch No. 3 - 3 . 3 - Po r tneu f - 5.6 -
48 A.R. DEXTER
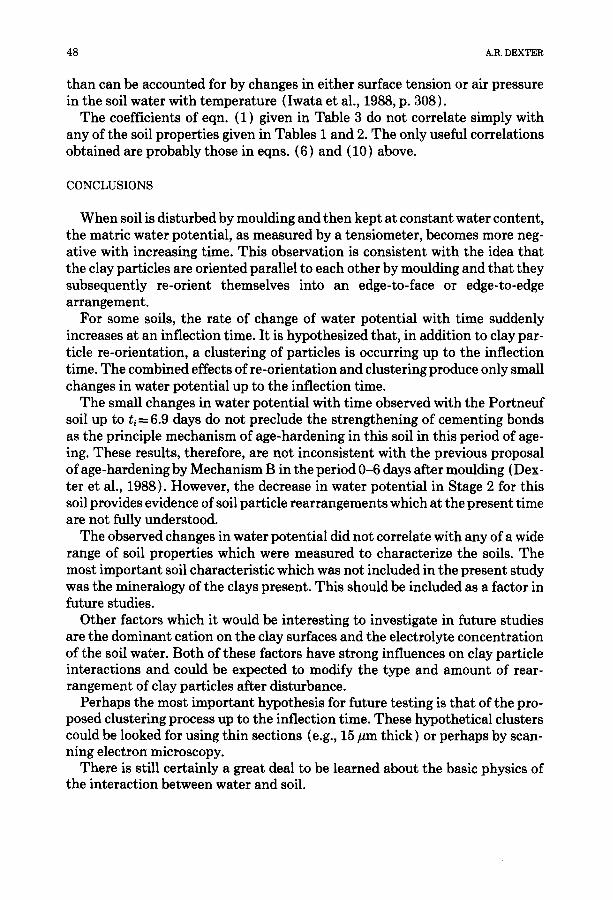
than can be accounted for by changes in either surface tension or air pressure in the soil water with temperature (Iwata et al., 1988, p. 308).
The coefficients of eqn. (1) given in Table 3 do not correlate simply with any of the soil properties given in Tables 1 and 2. The only useful correlations obtained are probably those in eqns. (6) and (10) above.
CONCLUSIONS
When soil is disturbed by moulding and then kept at constant water content, the matric water potential, as measured by a tensiometer, becomes more neg- ative with increasing time. This observation is consistent with the idea that the clay particles are oriented parallel to each other by moulding and that they subsequently re-orient themselves into an edge-to-face or edge-to-edge arrangement.
For some soils, the rate of change of water potential with time suddenly increases at an inflection time. It is hypothesized that, in addition to clay par- ticle re-orientation, a clustering of particles is occurring up to the inflection time. The combined effects of re-orientation and clustering produce only small changes in water potential up to the inflection time.
The small changes in water potential with time observed with the Portneuf soil up to ti = 6.9 days do not preclude the strengthening of cementing bonds as the principle mechanism of age-hardening in this soil in this period of age- ing. These results, therefore, are not inconsistent with the previous proposal of age-hardening by Mechanism B in the period 0-6 days after moulding (Dex- ter et al., 1988). However, the decrease in water potential in Stage 2 for this soil provides evidence of soil particle rearrangements which at the present time are not fully understood.
The observed changes in water potential did not correlate with any of a wide range of soil properties which were measured to characterize the soils. The most important soil characteristic which was not included in the present study was the mineralogy of the clays present. This should be included as a factor in future studies.
Other factors which it would be interesting to investigate in future studies are the dominant cation on the clay surfaces and the electrolyte concentration of the soil water. Both of these factors have strong influences on clay particle interactions and could be expected to modify the type and amount of rear- rangement of clay particles after disturbance.
Perhaps the most important hypothesis for future testing is that of the pro- posed clustering process up to the inflection time. These hypothetical clusters could be looked for using thin sections (e.g., 15/zm thick) or perhaps by scan- ning electron microscopy.
There is still certainly a great deal to be learned about the basic physics of the interaction between water and soil.
CHANGES IN MATRIC POTENTIAL AFTER MOULDING 49
ACKNOWLEDGEMENTS
The author would like to thank Professor H. Kuipers and his staff at the Tillage Laboratory of the Agricultural University, Wageningen, The Nether- lands, for their help in collecting the Dutch soil. Similar thanks go to Dr. W.D. Kemper and his staff at the Snake River Conservation Research Center, Kim- berly, Idaho, U.S.A., for their help in collecting the Portneuf soil. Peter Brown at the Waite Institute built the tensiometers and drew the figures.
REFERENCES
British Standards, 1975. Methods of testing soils for civil engineering purposes. BS 1377, 1975, British Standards Institution, London, 143 pp.
Bullock, M.S., Kemper, W.D. and Nelson, S.D., 1988. Soil cohesion as affected by freezing, water content, time and tillage. Soil Sci. Soc. Am. J., 52: 770-776.
Campbell, D.J., 1975. Liquid limit determination of arable top soils using a drop-cone penetro- meter. J. Soil Sci., 26: 234-240.
Dexter, A.R., 1985. Shapes of soil aggregates from tilled layers of some Dutch and Australian Soils. Geoderma, 35: 91-107.
Dexter, A.R., Kroesbergen, B. and Kuipers, H., 1984a. Some mechanical properties of aggregates of top soils from the IJsselmeer polders. 1. Undisturbed soil aggregates Neth. J. Agric. Sci., 32: 205-214.
Dexter, A.R., Kroesbergen, B. and Kuipers, H., 1984b. Some mechanical properties of aggregates of top soils from the IJsselmeer polders. 2. Remoulded soil aggregates and the effects of wetting and drying cycles. Neth. J. Agric. Sci., 32: 215-227.
Dexter, A.R., Horn, R. and Kemper, W.D., 1988. Two mechanisms for age-hardening of soil. J. Soil Sci., 39: 163-175.
Greacen, E.L., 1960. Water content and soil strength. J. Soil Sci., 11: 313-333. Iwata, S., Tabuchi, T. and Warkentin, B.P., 1988. Soil-Water Interactions. Marcel Dekker, New
York, 380 pp. Kemper, W.D. and Rosenau, R.C., 1984. Soil cohesion as affected by time and water content. Soil
Sci. Soc. Am. J., 48: 1001-1006. Kemper, W.D., Rosenau, R.C. and Dexter, A.R., 1987. Cohesion development in disrupted soils
as affected by clay and organic matter content and temperature. Soil Sci. Soc. Am. J., 51: 860- 867.
Molope, M.B., Grieve, I.C. and Page, E.R., 1985. Thixotropic changes in the stability of moulded soil aggregates. Soil Sci. Soc. Am. J., 49: 979-983.
Oades, J.M., Lewis, D.G. and Norrish, K., 1981. Red-Brown Earths of Australia. Waite Agricul- tural Research Institute and CSIRO Division of Soils, Adelaide, South Australia, 168 pp.
Schweikle, V., Blake G.R. and Arya, L.M., 1974. Matric suction and stability changes in sheared soil. Transactions of the 10th International Congress of Soil Science, Moscow, 1: 87-93.
Soil Survey Staff, 1975. Soil Taxonomy - A Basic System of Soil Classification for Making and Interpreting Soil Surveys. Agric. Handbook No. 436, SCS, U.S.D.A., 754 pp.
Stace, H.C.T., Hubble, G.D., Brewer, R., Northcote, K.H., Sleeman, J.R., Mulcahy, M.J. and Hallsworth, E.G., 1968. A Handbook of Australian Soils. Rellim, Glenside, South Australia, 435 pp.
Tinsley, J., Taylor, T.G. and Moore, J.H., 1951. The determination of carbon dioxide derived from carbonates in agricultural and biological materials. Analyst, 76:300-310.

50 A.R. DEXTER
Utomo, W.H., 1980. The effects of wetting and drying on soil physical properties. Ph.D. thesis, University of Adelaide, (unpublished), 251 pp.
Utomo, W.H. and Dexter, A.R., 1981. Age-hardening of agricultural top soils. J. Soil Sci., 32: 335- 350.