changes in preparedness and earthquake risk perception ... · pdf filelessons from the...
TRANSCRIPT

Lessons from the Christchurch earthquakes 1
Changes in preparedness and earthquake risk perception:
Lessons from the 2010 and 2011 Canterbury earthquakes
John McClure [1], David Johnston [2],
Liv Henrich [3]
1, 3 Victoria University of Wellington
2. Massey University / GNS(Science), Joint Centre for Disaster Research
Report for EQC
GNS Science, Victoria University of Wellington
Acknowledgments: We thank Charlotte Gutenbrunner, Tess McClure, Peter Ranger,
and Justin Velluppillai for assistance in collecting the data and Sana Oshika for
entering data and assistance with the analyses. This research was funded by an EQC
grant to John McClure and David Johnston.
Correspondence should be addressed to: John McClure, School of Psychology,
Victoria University of Wellington, P. O. Box 600, Wellington, New Zealand. Email
may be addressed to: [email protected]

Lessons from the Christchurch earthquakes 2
Abstract
This research examined changes in preparedness and judgments of the risk of
earthquakes after the 2010-2011 Canterbury earthquakes in three cities: Christchurch
(Canterbury), Wellington and Palmerston North. Christchurch citizens had direct
experience of the earthquakes, and Wellington and Palmerston North citizens were
chosen because their citizens were likely to have contrasting earthquake expectations.
Many citizens in Wellington have long expected an earthquake; however, this is less
likely in Palmerston North, where citizens are comparable to Christchurch citizens
before the 2010-2011 Canterbury earthquakes. Participants judged the likelihood of
an earthquake before and after the Canterbury earthquakes for their own city, for the
rest of New Zealand, and with participants in Wellington and Palmerston North, for
Canterbury. Participants reported their preparations before and after the earthquakes
and their reasons for this. Christchurch participants also reported damage suffered in
the earthquake. In all three samples, expectations of an earthquake in Canterbury
were low before the Canterbury earthquakes and rose significantly after that
earthquake. Palmerston North expectancies of an earthquake in their own city rose
after the earthquake, whereas Wellingtonians’ expectancies of a local earthquake were
high before the Canterbury earthquakes and did not rise after the earthquakes.
Preparations increased after the earthquakes, particularly in Christchurch. The most
frequent preparations were getting basic needs and equipment, but the greatest
increase after the earthquake was in actions to mitigate damage. These findings
clarify the effects of earthquakes and prior expectancies on preparedness and risk
judgments about earthquakes inside and outside the directly affected region.
Lessons from the Christchurch earthquakes 3
Changes in preparedness and earthquake risk perception:
Lessons from the Canterbury earthquakes
For people to prepare for natural disasters such as earthquakes, they need to
recognize the risk that the hazard poses to them. Thus it is important to understand
what factors influence citizens’ judgments of risk from these hazards. One factor is
people’s experience of those hazards, either directly or at a distance. When a natural
disaster occurs, does it affect the risk judgments of those who live in the disaster
region differently to people who live outside the region and who are vulnerable to the
same types of disaster?
Research has shown that judgments of the probability of negative events such
as disasters are subject to a range of factors, including optimistic biases in people’s
judgments about different sorts of events, and people’s personal experience of these
events.
Optimistic bias
Research on risk perception has shown that people often make biased
appraisals about their own risk relative to others. Specifically, at least in Western
cultures, many people display an optimistic bias where they view themselves as less
likely to be harmed by future risks than other citizens (e.g., Weinstein, 1980). This
unrealistic optimism can lead people to underestimate the likelihood that they will
experience a negative event, such as an illness or a car accident.
Several studies have demonstrated that this optimistic bias can influence
judgments in relation to natural disasters. Jackson (1981) found that the majority of
respondents in cities that were prone to earthquakes believed they would not
experience an earthquake, or that if they did, they would not suffer personal harm.
Mileti and Darlington (1995) found that whereas 80% of respondents in an earthquake

Lessons from the Christchurch earthquakes 4
risk zone believed an earthquake would occur where they lived in the next five years,
most judged that they would not suffer injuries or loss to their property. A similar
optimism has been found in relation to hurricanes (Sattler, Kaiser, & Hittner, 2000),
and volcanic eruptions (Johnston, Bebbington, Lai, Houghton, & Paton, 1999).
Spittal, McClure, Siegert and Walkey (2005) asked New Zealand citizens about their
own prospects in an earthquake and the prospects of an acquaintance and an ‘average
other’ person. Participants judged the likelihood of both personal harm and property
damage across the three target persons. Consistent with previous research,
respondents judged themselves to be less likely to suffer harm than an acquaintance.
Interestingly, on the damage to property measure, they rated themselves more likely
to experience damage than either an acquaintance or an ‘average other’, which
suggests that financial loss is less susceptible to optimistic bias. Overall, however,
these findings show that people tend to discount the likelihood that they will be
personally harmed by natural disasters.
This optimistic bias may be compounded or attenuated by citizens’ beliefs
about the levels of risk that particular hazards pose in different regions. For example,
in New Zealand, prior to the recent Canterbury earthquakes, citizens’ estimates of the
probability of an earthquake in Canterbury were likely to have been lower than for
Wellington (Becker, 2010), which is widely known to be vulnerable to earthquakes
due to its proximity to several major faults. However, earthquakes had happened in
Canterbury previously during the relatively recent period of European settlement
since the 1860s. Thus the ‘objective’ risk of an earthquake in Canterbury was serious,
as has been borne out by recent events in 2010 and 2011 - two large earthquakes
occurring in the region that caused huge damage and loss followed by a number of
major aftershocks. Similarly, before the Kobe earthquake, the estimated probability

Lessons from the Christchurch earthquakes 5
of an earthquake in the Kobe region was significantly lower than for Tokyo
(Nakashima & Chusilp, 2003). Yet it was Kobe that experienced the earthquake and
its damaging consequences.
A key problem in citizens’ risk judgment is that people in regions that are
deemed by seismologists to have a lower risk than other regions appear to think that
they are not at risk at all – it appears that they think that the hazard will necessarily
strike the higher risk region first. This pattern may be analogous to people’s tendency
to edit low frequency events as having zero probability (Slovic, Fischhoff, &
Lichtenstein, 1982; Stone, Yates, & Parker, 1994). This inferential leap has been
shown to be an inaccurate extrapolation from the risk probabilities in both Kobe and
Christchurch, as well as many other examples. This line of reasoning can have
disastrous consequences, because people living in cities deemed to be a lower risk
may think they do not need to prepare.
The effect of experiencing a disaster
Personal experience of a natural disaster can reduce optimistic bias. Burger
and Palmer (1992) showed that with students who experienced the 1989 Loma Prieta
earthquake, optimistic bias about negative events was absent directly after the
earthquake, but returned three months later. Following the 1994 Northridge
earthquake, Helweg-Larsen (1999) similarly found a lack of optimistic bias in
respondents; however, unlike Burger and Palmer’s sample, optimistic bias in regard to
earthquakes did not return five months later, when the respondents were surveyed
again. This suggests that there was a longer reduction in optimistic bias as a result of
the earthquake experience. This difference from Burger and Palmer’s findings may
reflect the fact that Burger and Palmer’s items did not focus specifically on optimism
about earthquakes.
Lessons from the Christchurch earthquakes 6
Although experience of an earthquake does increase many citizens’ judgments
of risk, the outcome of a person’s experience is also an important factor. Mileti and
O’Brien (1992) found that in comparison with those who suffered loss, people who
suffered no personal losses or injuries were more optimistic about the possible
consequences of a future earthquake and were less likely to take warnings of
aftershocks seriously. Mileti and O’Brien claimed that these participants showed a
‘normalization bias’, in that when they experienced no negative impacts from the first
event, they thought they would not be affected by subsequent impacts.
The present research
These previous studies show that personal experience of an earthquake affects
citizens’ perceptions of earthquake risk in a region that has been struck by an
earthquake. However, these studies include no comparisons of judgments of
earthquake likelihoods for people who have experienced an earthquake with others
outside the region. Thus there is a gap in research on the effects of personal
experience on risk judgments for those inside and outside the affected area. Yet some
effects are likely to occur. For example, the Chernobyl disaster changed American
citizens’ perceptions of risks of nuclear energy (Reve, 2011), and the recent Japanese
nuclear disaster triggered by a tsunami had similar effects on German citizens and the
German Government’s policy on nuclear power plants (Spiegel online, 2011).
The present research programme addresses this issue. The first study was
performed following the earthquake in September 2010 in Darfield, Canterbury, near
Christchurch city, New Zealand (magnitude 7.1 on the Richter scale) (McClure,
Wills, Johnston, & Recker, 2011). This study compared the judgments of citizens in
Christchurch, the largest urban area affected by the earthquake, with citizens in two
other New Zealand cities: Wellington and Palmerston North. These two latter cities
Lessons from the Christchurch earthquakes 7
are relatively distant from the earthquake and their citizens did not experience the
earthquake first hand. Many citizens in Wellington have long expected an earthquake,
due to civil defence warnings and commentaries in the mass media that focus on
Wellington (e.g., Aftershock, 2008). However, this is not the case in Palmerston
North. The Palmerston North sample was chosen because it is comparable to
Christchurch before the Canterbury earthquakes, where most citizens did not expect
an earthquake (Becker, 2010), but where seismologists knew that there was a
possibility that there could be a major earthquake.
Participants judged their recall of earthquake likelihoods prior to the 2010
Darfield earthquake and following the same earthquake in regard to their own city, the
rest of New Zealand, and with Wellington and Palmerston North participants, for
Canterbury. In all three cities, expectancies of another earthquake in Canterbury were
higher following the Darfield earthquake than before the event; however, post-
earthquake expectancies were higher for Christchurch citizens than the other two
groups. Expectancies of the probability of a local earthquake rose in Palmerston North
but not in Wellington, where earthquake expectancies were already high.
Expectancies of the probability of a local earthquake in another part of New Zealand
also rose.
The study also showed that Wellington and Palmerston North participants who
knew people in Christchurch judged the future earthquake risk in Canterbury higher
than those who did not; this issue has little previous research. In contrast with
previous findings, (e.g., Mileti and O’Brien, 1992), Christchurch participants who
suffered damage in the earthquake did not judge the future likelihood of another
earthquake in Canterbury as higher than those who did not.
Lessons from the Christchurch earthquakes 8
The recent study was an extension of McClure et al.’s (2011) study and
examined similar issues in relation to risk perceptions. However, it was carried out
after the February 20l1 Canterbury earthquake which was shallower and closer to
Christchurch than the Darfield earthquake, and was much therefore more damaging
than the Darfield earthquake. In addition, many questions that used qualitative
response formats in McClure et al.’s study were replaced by quantitative response
formats, based on the responses to the earlier study. The study examined changes in
earthquake expectancies following the February earthquake, in relation to a range of
relevant variables.
Method
Participants
The participants completing the questionnaire were 294 residents from three
cities in New Zealand: Christchurch, Wellington and Palmerston North. For the
Christchurch sample, to gain a sample of the general population, participants were
recruited at a popular market in Riccarton, central Christchurch on a Sunday. This
sample consisted of 104 participants (gender: male = 34, female = 46, not stated =
24), with a median age of over 50 years, and a mean of 0.74 children per household.
The Wellington sample consisted of 91 participants (male = 31, female = 43,
not stated = 17), whose median age was 21-30, with a mean of 0.92 children per
household. Data was collected at the food market in downtown Wellington, and at
lunchtimes in a popular urban park over three days. For the Palmerston North sample,
101 participants were recruited at an outdoor market (male = 28, female = 57, not
stated = 16), with a median age of under 20 years, and a mean of 1.28 children per
household. In all three cities, participation was voluntary and anonymous, and a
chocolate bar was offered in appreciation of their participation.

Lessons from the Christchurch earthquakes 9
Materials/Procedure
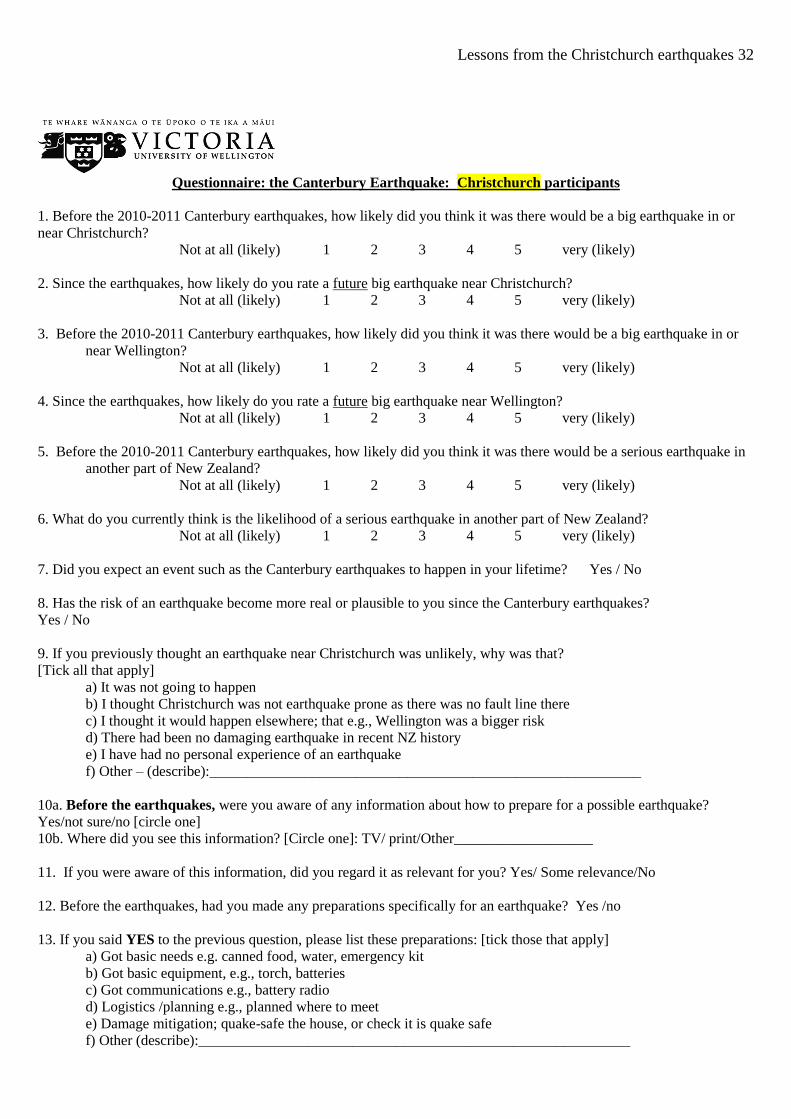
The questionnaires measured the perceived likelihood of an earthquake using
measures based on McClure et al.’s (2011) study (See Appendix 1). The questionnaire
included six items assessing earthquake likelihood, two of which asked how likely it
was that a big earthquake would occur in or near Christchurch before and after the
Canterbury earthquakes. Two items elicited the perceived likelihood of an earthquake
occurring in Wellington (for Wellington and Christchurch participants) or Palmerston
North (for Palmerston North participants), before and after the earthquakes. Two
items assessed the likelihood of an earthquake happening in another part of New
Zealand. Responses were given on a 5 point Likert Scale, with endpoints labelled
‘Not at all likely’ and ‘Very likely’.
Related questions asked: ‘Did you expect an event such as the Canterbury
earthquakes to happen in your lifetime?’ Response options: ‘Yes/No’; and ‘Has the
risk of an earthquake become more real or plausible to you since the Canterbury
earthquakes?’ Response options: ‘Yes/No’ and ‘If you previously thought an
earthquake near Christchurch was unlikely, why was that?’ with five causal
attributions for their beliefs based on the open-ended responses found by McClure et
al. (2011).
All versions of the questionnaire asked ‘Before the earthquakes, were you
aware of any information about how to prepare for a possible earthquake?’ Response
options: Yes, not sure, no. Where did you see this information (TV/Print/other); ‘If
you were aware of this information, and did you regard it as relevant to you?’
Response options: Yes, some relevance, no.
Questions relating to preparation asked: ‘Before the earthquakes, had you
made any preparations specifically for an earthquake?’ Response options: Yes /no; ‘If

Lessons from the Christchurch earthquakes 10
you said YES to the previous question, please list these preparations’: followed by
five types of preparation, and ‘If you did make any preparations for an earthquake,
what is the main reason’? followed by five reasons [See Appendix 1]. Parallel
questions were asked if people did not prepare. A similar set of questions was asked
in regard to preparations since the earthquakes and their plans to prepare in the future.
In addition to these items, the Christchurch survey asked: ‘Did you incur a lot
of damage in the earthquake?’ (Yes/no) and ‘If there is one thing you wished you’d
done before the earthquake, what is it? Followed by five options (Circle one). The
Wellington and Palmerston North questionnaires asked: ‘Did you know anyone close
to you who lives in Christchurch?’ Response options: Yes/No.
A question asked if there were any other comments that participants would
like to make, followed by optional questions about demographic information: gender,
age, number of dependent children in the household, and their suburb. The
questionnaires were administered seven months after the damaging February 2011
earthquake; this was three months after the most recent major aftershock in June
2011.

Lessons from the Christchurch earthquakes 11
Results
Judged likelihood of an earthquake before and after the earthquake
Figure 1. The perceived likelihood of an earthquake occurring in or near Christchurch
before and after the Canterbury Earthquakes. (1= not at all likely, 5 = very likely)
Figure 1 shows the data for expectancy of an earthquake in occurring in or
near Christchurch. These data were analysed with a 3 (Participant City: Christchurch,
Wellington, Palmerston North) x 2 (Time: before, after the earthquake) mixed design
analysis. This showed a main effect for Time, F(1, 293) = 732.88, p<.001, η2 = .71,
in that participants’ expectancies of an earthquake near Christchurch were higher after
the Canterbury earthquakes (M = 3.92) than before the earthquakes (M = 1.81).
1
1.5
2
2.5
3
3.5
4
4.5
5
Christchurch Wellington Palmerston North
Lik
elih
oo
d
City
Before
After

Lessons from the Christchurch earthquakes 12
There was no interaction between City and Time, and no main effect for city,
indicating that the effects were the same across the three cities.
Figure 2. The perceived likelihood of an earthquake in Wellington and Palmerston
North before and after the Canterbury Earthquakes for participants in the three cities
(1= not at all likely, 5 = very likely)
Figure 2 shows the data for expectancy of an earthquake in the Wellington and
Palmerston North. These data were analysed by a 3 (Participant City: Christchurch,
Wellington, Palmerston North) x 2 (Time: before, after the earthquake) mixed design
analysis. An earthquake in these cities was judged more likely after the Canterbury
earthquakes (M = 3.68) than before (M = 3.16), as shown by a main effect for Time,
F(1, 291) = 71.37, p<.001, η2 = .19, and was judged more likely in Wellington (M =
1
1.5
2
2.5
3
3.5
4
4.5
5
Wellington Palmerston North
Lik
elih
oo
d
City
Before
After

Lessons from the Christchurch earthquakes 13
3.81) than Palmerston North (M = 2.59), as shown by a main effect for City, F(2,
291) = 75.16, p<.001, η2 = .25. These main effects were qualified by an interaction
between City and Time, F(2, 291) = 7.81, p<.001, η2 = .05, indicating that that the
increase in the perceived likelihood of an earthquake was greater in Palmerston North
than in Wellington.
Figure 3. The perceived likelihood of an earthquake in another part of New Zealand
before and after the Canterbury Earthquakes for participants in the three cities (1= not
at all likely, 5 = very likely)
Figure 3 shows the data for expectancy of an earthquake in another part of
New Zealand. These data were analysed with a 3 (Participant City: Christchurch,
Wellington, Palmerston North) x 2 (Time: before, after the earthquake) mixed design
analysis. This earthquake expectancy was higher after the Canterbury earthquakes
1
1.5
2
2.5
3
3.5
4
4.5
5
Christchurch Wellington Palmerston North
Lik
elih
oo
d
City
Before
After
Lessons from the Christchurch earthquakes 14
than before, as shown by a main effect for Time, F(1, 291) = 61.52, p<.001, η2 = .17.
There was no main effect for City, and no interaction between City and Time.
Lifetime Expectancy and reality of risk
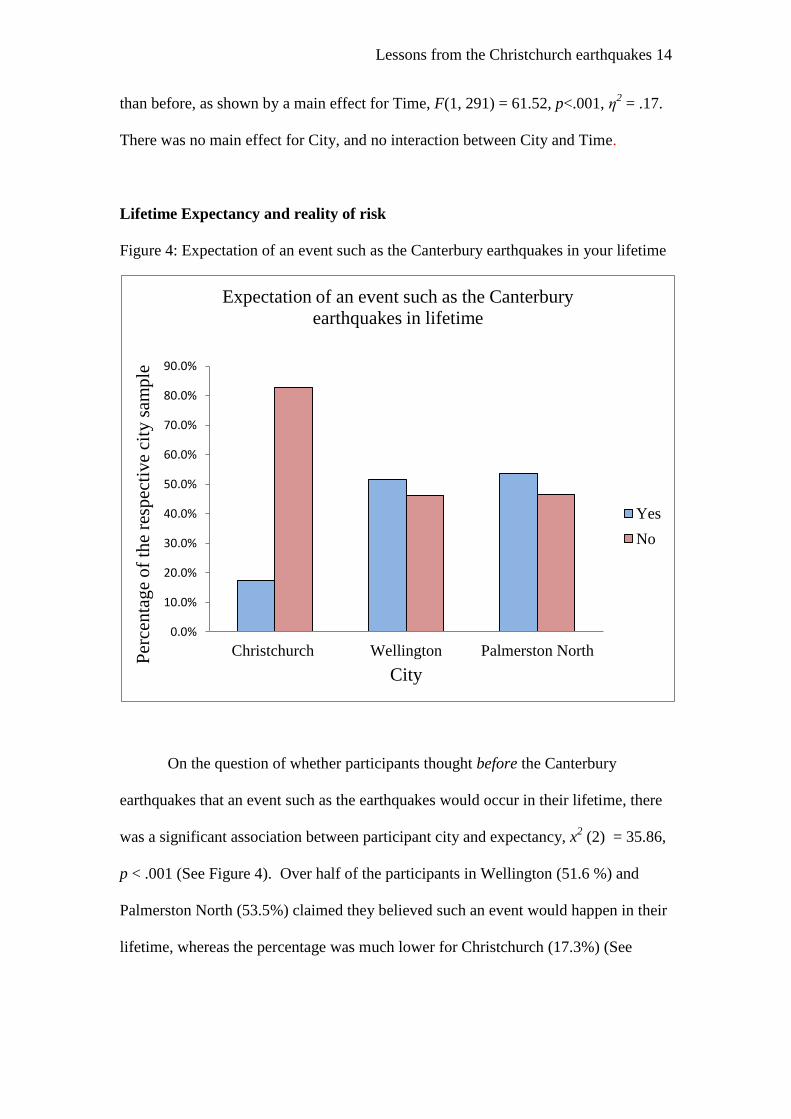
Figure 4: Expectation of an event such as the Canterbury earthquakes in your lifetime
On the question of whether participants thought before the Canterbury
earthquakes that an event such as the earthquakes would occur in their lifetime, there
was a significant association between participant city and expectancy, x2 (2) = 35.86,
p < .001 (See Figure 4). Over half of the participants in Wellington (51.6 %) and
Palmerston North (53.5%) claimed they believed such an event would happen in their
lifetime, whereas the percentage was much lower for Christchurch (17.3%) (See
0.0%
10.0%
20.0%
30.0%
40.0%
50.0%
60.0%
70.0%
80.0%
90.0%
Christchurch Wellington Palmerston NorthPer
cen
tag
e o
f th
e re
spec
tive
city
sam
ple
City
Expectation of an event such as the Canterbury
earthquakes in lifetime
Yes
No
Lessons from the Christchurch earthquakes 15
Figure 4). This association shows that the City variable has a moderate relationship
with lifetime expectancy of a disaster (V = .349).
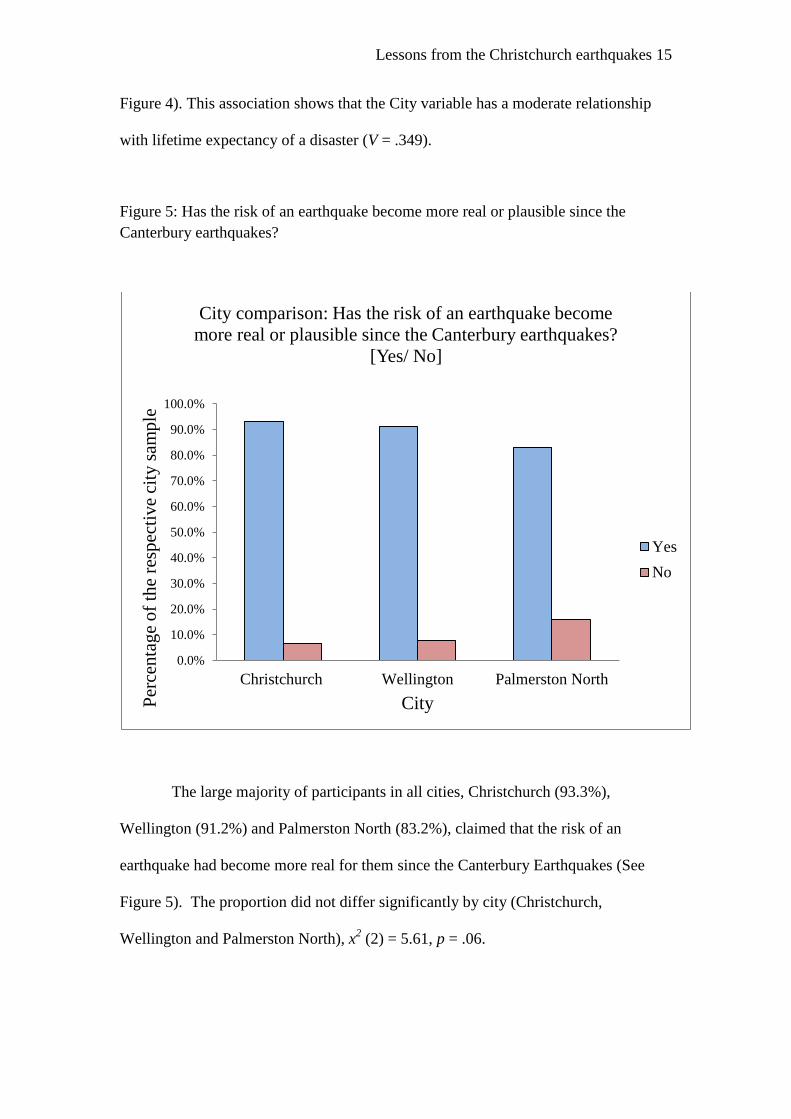
Figure 5: Has the risk of an earthquake become more real or plausible since the
Canterbury earthquakes?
The large majority of participants in all cities, Christchurch (93.3%),
Wellington (91.2%) and Palmerston North (83.2%), claimed that the risk of an
earthquake had become more real for them since the Canterbury Earthquakes (See
Figure 5). The proportion did not differ significantly by city (Christchurch,
Wellington and Palmerston North), x2 (2) = 5.61, p = .06.
0.0%
10.0%
20.0%
30.0%
40.0%
50.0%
60.0%
70.0%
80.0%
90.0%
100.0%
Christchurch Wellington Palmerston North
Per
cen
tag
e o
f th
e re
spec
tive
city
sam
ple
City
City comparison: Has the risk of an earthquake become
more real or plausible since the Canterbury earthquakes?
[Yes/ No]
Yes
No

Lessons from the Christchurch earthquakes 16
Attributions for risk judgments about an earthquake near Christchurch
Figure 6: Participants’ attributions for why they previously thought an earthquake
near Christchurch was unlikely
The most frequent attributions for believing an earthquake was not going to
happen near Christchurch were that people thought it would happen elsewhere and
that Christchurch was not prone to an earthquake. Less frequent reasons were that
they had no personal experience of an earthquake, there had been no damaging
earthquake in New Zealand recently, and they believed an earthquake wasn’t going to
happen.
Earthquake Information: Awareness and judged relevance prior to Earthquake
With regard to whether participants were aware of information about
earthquakes before the Canterbury earthquakes, there was a difference in whether
participants in the three cities were aware of information about earthquakes, before
the Canterbury earthquakes, x2 (4) = 16.9 p < .01 (V= .172). The percentage of
participants aware of this information was lower in Christchurch (69.7%) than
0.0%
10.0%
20.0%
30.0%
40.0%
50.0%
60.0%
70.0%
It wasn'tgoing tohappen
ChCh notprone
Thought itwould
happenelsewhere
No damagingEQ in NZrecently
No personalexperience of
EQ
Other
If you previously thought an earthquake near Christchurch was unlikely , why was that?
Lessons from the Christchurch earthquakes 17
Wellington (86.7%) and Palmerston North (75.3%). There was, however, no
difference between participants in Wellington (40.9%) Palmerston North (38%) and
Christchurch (37.9%) who saw the information as relevant, x2 (4) = 3.87, p = .42.
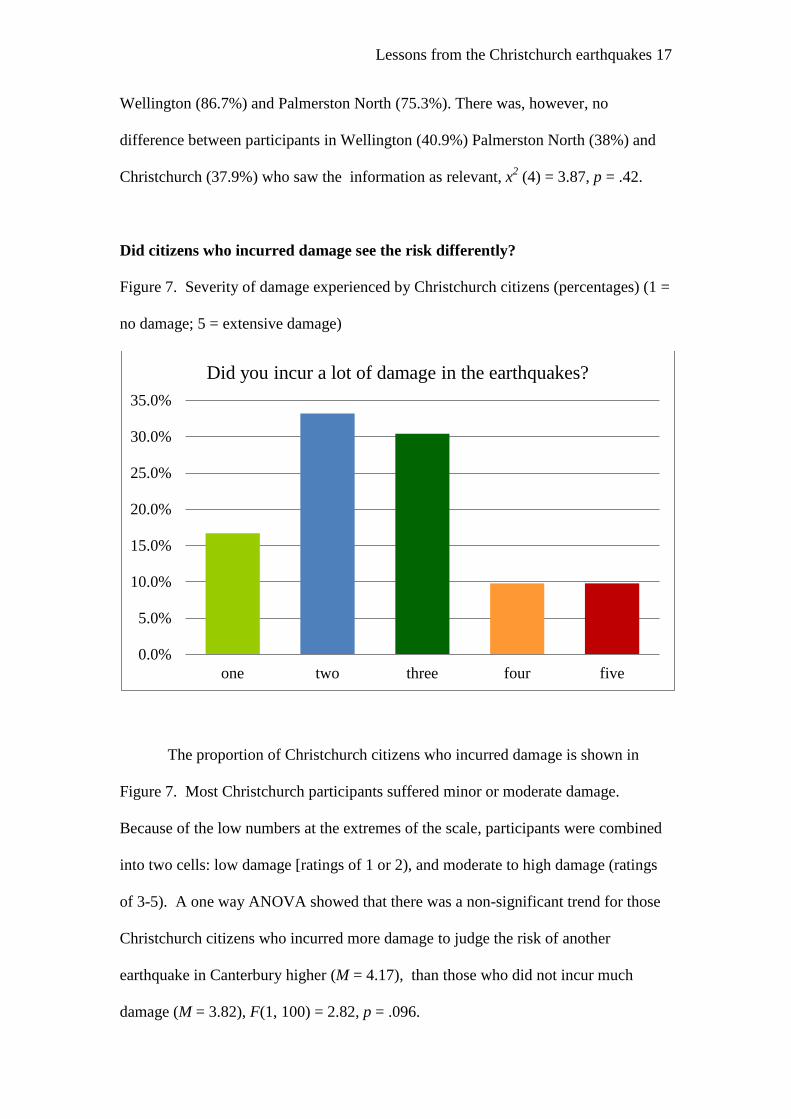
Did citizens who incurred damage see the risk differently?
Figure 7. Severity of damage experienced by Christchurch citizens (percentages) (1 =
no damage; 5 = extensive damage)
The proportion of Christchurch citizens who incurred damage is shown in
Figure 7. Most Christchurch participants suffered minor or moderate damage.
Because of the low numbers at the extremes of the scale, participants were combined
into two cells: low damage [ratings of 1 or 2), and moderate to high damage (ratings
of 3-5). A one way ANOVA showed that there was a non-significant trend for those
Christchurch citizens who incurred more damage to judge the risk of another
earthquake in Canterbury higher (M = 4.17), than those who did not incur much
damage (M = 3.82), F(1, 100) = 2.82, p = .096.
0.0%
5.0%
10.0%
15.0%
20.0%
25.0%
30.0%
35.0%
one two three four five
Did you incur a lot of damage in the earthquakes?
Lessons from the Christchurch earthquakes 18
The effect of knowing persons in Christchurch
The proportion of participants who knew someone close in Christchurch was
74.7% in Wellington and 58% in Palmerston North. A chi square test found a
significant difference in these proportions in Wellington and Palmerston North, x2 (1)
= 5.94, p<.05. (V= .176). A one way ANOVA showed that those in Wellington and
Palmerston North who knew people close to them in Christchurch saw the risk of
another earthquake in Canterbury as no higher (M = 3.90) than those who did not (M
= 3.89), F(1, 174) = 0.01, ns. However, interestingly, they did see the risk of another
earthquake in their own city as higher (M = 3.62) than those who did not know
anybody in Christchurch (M = 3.24), F(1, 189) = 5.95, p < .02 η2 = .03. In addition,
Wellington and Palmerston North participants who knew people who incurred
damage in the earthquakes judged the risk of a future earthquake in their own city
higher (M = 3.72) than those who did not know anyone who incurred damage (M =
3.37), F(1, 174) = 5.32, p<.05, η2 = .03.
Preparation
Approximately 80% of Christchurch citizens reported preparing since the
earthquakes (Figure 8), whereas approximately 50% of Wellington and Palmerston
North citizens reported preparing since the earthquakes. A chi square test showed that
there was a significant difference between the levels of post- earthquake preparation
in the different cities, x2 (2) = 24.29, p < .05, showing that the proportion preparing
since the earthquake rose significantly more in Christchurch than in Wellington and
Palmerston North.
Further tests found specific differences in preparation in the three cities before
and after the earthquake. Before the earthquakes, significantly more citizens reported

Lessons from the Christchurch earthquakes 19
preparing in Wellington (42.5%) than in Christchurch (22.5%), x2 (2) = 9.26, p < .05,
(V= .221); whereas after the earthquakes, more Christchurch citizens (79%) reported
preparing than Wellingtonians (52.8%), x2 (2)= 14.54, p < .05, (V= .277). Before the
earthquakes, there was no difference in the proportion of citizens who reported
preparing in Palmerston North (32.6%) in Christchurch (22.5%), whereas after the
earthquakes, more people reported preparing in Christchurch (79%) than in
Palmerston North (46.2%). x2 (2) = 22.24, p< .05, (V=. 339).
Figure 8. Level of preparation in each city before and after the earthquakes
Christchurch citizens who reported preparing since the earthquakes (M = 4.06)
saw the risk of a future earthquake in Christchurch as no higher than those who did
not report preparing (M = 3.76), F(1, 98) = 1.29, ns. Similarly, citizens in Wellington
and Palmerston North who reported preparing since the earthquakes (M = 3.60) did
0.0%
10.0%
20.0%
30.0%
40.0%
50.0%
60.0%
70.0%
80.0%
90.0%
Christchurch Wellington Palmerston
North
Per
cen
tag
e o
f th
e re
spec
tive
city
sam
ple
City
Preparation before EQ
Preparation after EQ
Lessons from the Christchurch earthquakes 20
not see the risk of a future earthquake in their own city as any higher than those who
did not report preparing (M = 3.43), F(1, 180) = 1.02, ns.
Which preparations had people made or not made – and why?
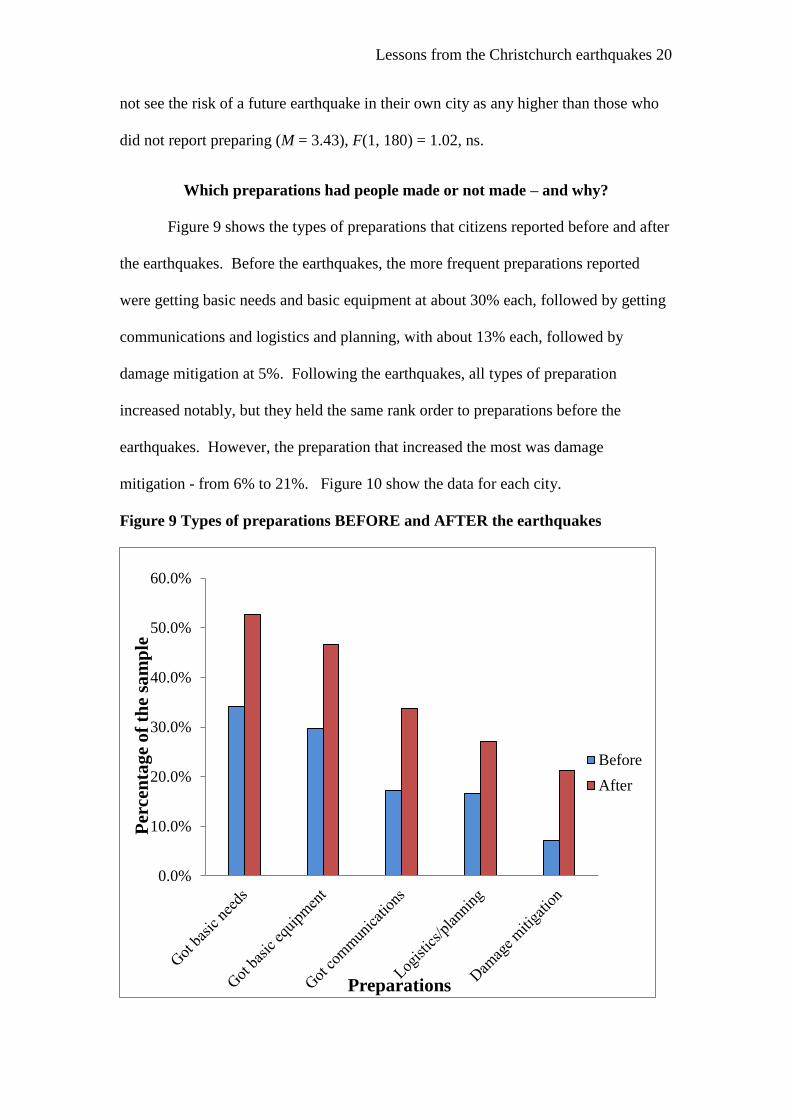
Figure 9 shows the types of preparations that citizens reported before and after
the earthquakes. Before the earthquakes, the more frequent preparations reported
were getting basic needs and basic equipment at about 30% each, followed by getting
communications and logistics and planning, with about 13% each, followed by
damage mitigation at 5%. Following the earthquakes, all types of preparation
increased notably, but they held the same rank order to preparations before the
earthquakes. However, the preparation that increased the most was damage
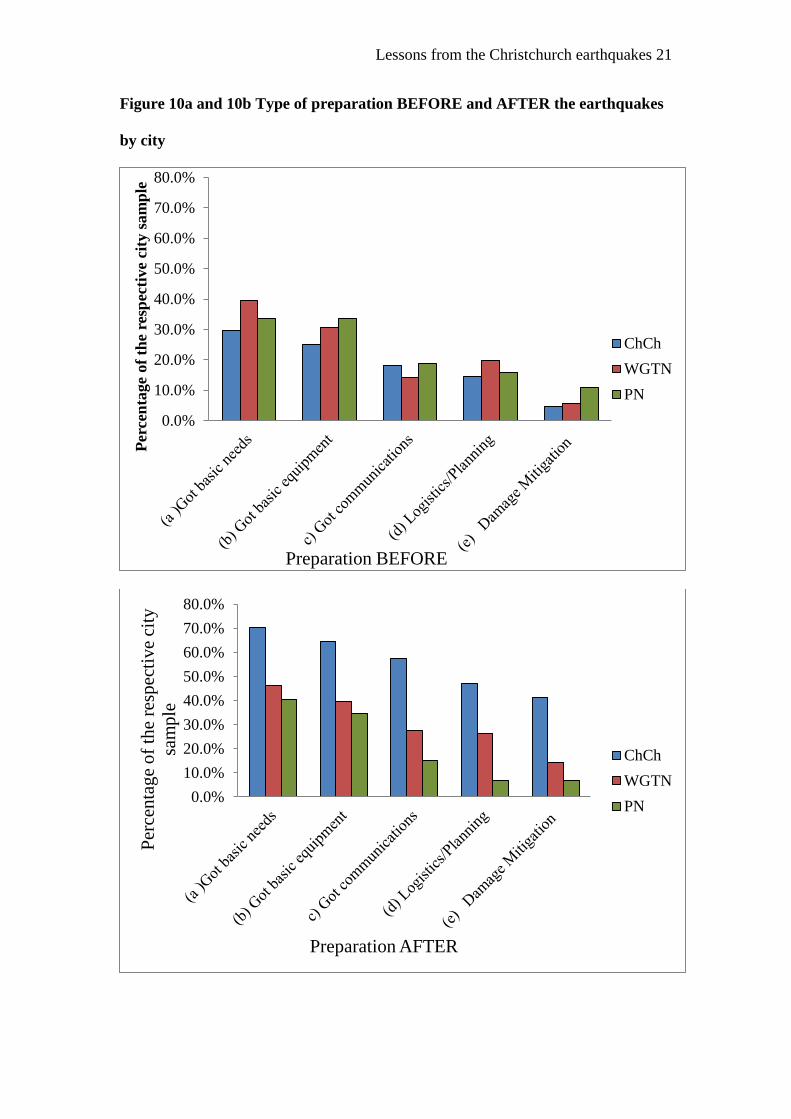
mitigation - from 6% to 21%. Figure 10 show the data for each city.
Figure 9 Types of preparations BEFORE and AFTER the earthquakes
0.0%
10.0%
20.0%
30.0%
40.0%
50.0%
60.0%
Per
cen
tag
e o
f th
e sa
mp
le
Preparations
Before
After
Lessons from the Christchurch earthquakes 21
Figure 10a and 10b Type of preparation BEFORE and AFTER the earthquakes
by city
0.0%
10.0%
20.0%
30.0%
40.0%
50.0%
60.0%
70.0%
80.0%
Per
cen
tage
of
the
resp
ecti
ve
city
sam
ple
Preparation BEFORE
ChCh
WGTN
PN
0.0%
10.0%
20.0%
30.0%
40.0%
50.0%
60.0%
70.0%
80.0%
Per
cen
tag
e o
f th
e re
spec
tive
city
sam
ple
Preparation AFTER
ChCh
WGTN
PN

Lessons from the Christchurch earthquakes 22
Figure 11. Reasons [Attributions] for preparing before the earthquakes
Figure 12. Reasons [Attributions] for NOT preparing before the earthquakes
0.0%
5.0%
10.0%
15.0%
20.0%
25.0%
30.0%
35.0%
40.0%
My
personality
Just in case
of
emergency
I thought an
EQ might
happen
Past
experience
of an EQ
Advice from
media
Other
If you did make any preparations for an earthquake,
what is the main reason?
0.0%
5.0%
10.0%
15.0%
20.0%
25.0%
30.0%
35.0%
40.0%
My
personality
I didn't
think about
it
I thought
an EQ
wouldn't
happen
No past
experience
of an EQ
Didn't take
advice
from
media
seriously
Other
If you did not make any preparations for an
earthquake, what is the main reason you didn't?
Lessons from the Christchurch earthquakes 23
Figures 11 and 12 show the reasons (attributions) participants gave for
preparing or not preparing before the earthquakes. The most cited reason for
preparing was ‘just in case of an emergency’, followed by advice from the media. The
most cited reason for NOT preparing was ‘I thought an earthquake wouldn’t happen,
followed by ‘I didn’t think about it’.
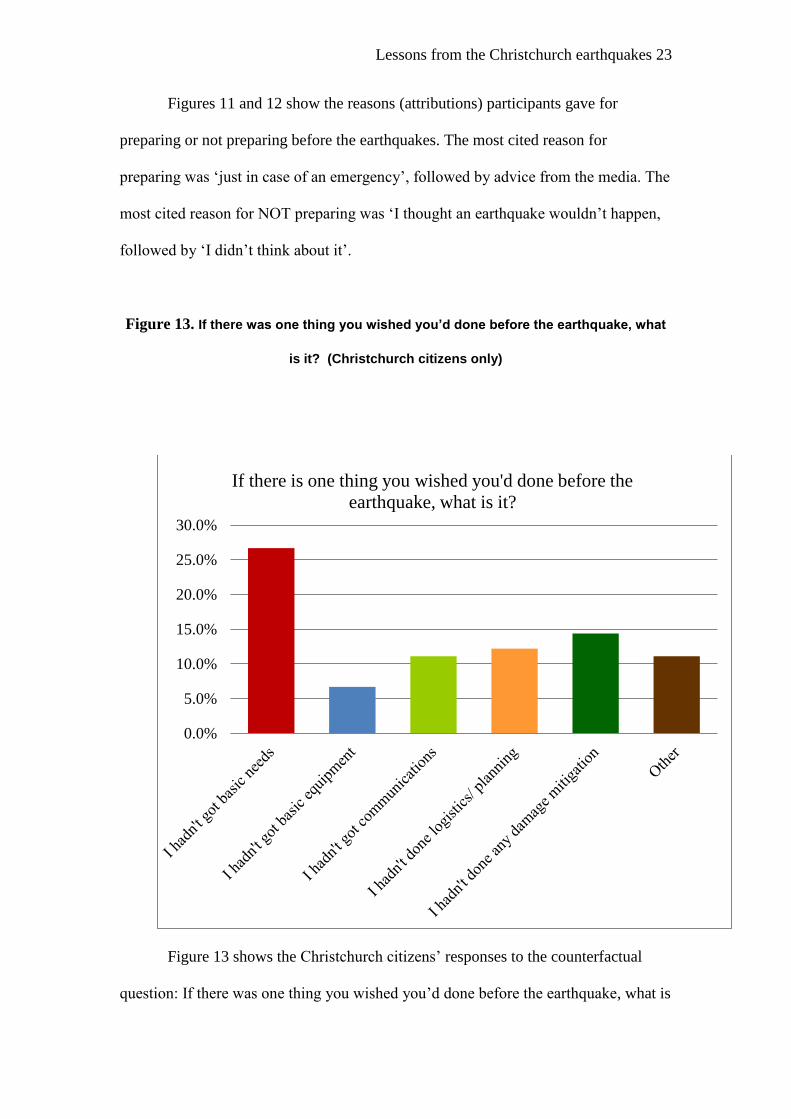
Figure 13. If there was one thing you wished you’d done before the earthquake, what
is it? (Christchurch citizens only)
Figure 13 shows the Christchurch citizens’ responses to the counterfactual
question: If there was one thing you wished you’d done before the earthquake, what is
0.0%
5.0%
10.0%
15.0%
20.0%
25.0%
30.0%
If there is one thing you wished you'd done before the
earthquake, what is it?

Lessons from the Christchurch earthquakes 24
it? As in the preparedness questions, getting basic needs is selected the most, but in
contrast with those questions, the second highest item they regretted was not taking
any damage mitigation actions. Getting basic equipment fell from second on the
preparation scale to bottom ranking on this scale.
Discussion
Changes in the perceived likelihood of an earthquake
There are several interesting findings in changes in perceived earthquake
likelihood after the Canterbury earthquakes inside and outside the affected region. As
expected, the perceived likelihood of an earthquake in Canterbury was low before the
earthquake and rose significantly after the earthquake. This increase in the perceived
likelihood of an earthquake in Canterbury was the same for participants in the
affected city (Christchurch) as in the other cities.
In judgments of the likelihood of a future earthquake in Wellington and
Palmerston North, there were interesting differences across the two cities. Whereas
participants rate the likelihood of an earthquake in both cities higher after the
Canterbury earthquakes, the increase is higher for Palmerston North than Wellington,
where an earthquake was perceived almost as likely before the Canterbury
earthquakes as after. However, the baseline level of judged earthquake likelihood for
Wellingtonians was high before the earthquake. This result suggests that risk
judgments not only reflect people’s experience of an earthquake but also media
communications about earthquake risk. Wellingtonians have been told frequently by
both civic agencies and the news media that an earthquake is likely in their city, but
this is not the case for citizens of either Palmerston North or Christchurch (Ronan,
Johnston, & Paton, 2001; Becker 2010). The findings suggest the importance of civic

Lessons from the Christchurch earthquakes 25
agencies communicating risk not only to citizens in cities thought to be at highest risk
but also citizens in cities thought to have a lower (but still significant) probability of
an earthquake. As in the case of this Canterbury event and the Kobe earthquake,
earthquakes do not always happen in the zone that is seen as the most vulnerable.
The analyses on whether participants expected an earthquake in another part of
New Zealand show that for citizens in all three cities, this expectancy increased after
the Canterbury earthquakes. A key message for citizens from this earthquake is that
earthquakes happen not only in known vulnerable cities like Wellington; they may
happen elsewhere - in New Zealand and other countries such as Japan (Kobe) and
USA (Eastern Washington). This recognition of the risk may not be sufficient on its
own to motivate citizens to undertake preparedness activities, but it is a likely
prerequisite of voluntary preparation.
Other findings showed that Christchurch participants who suffered damage in
the earthquake saw the probability of another earthquake in the region as no higher
than those who suffered no damage, a finding that contrasts with that of Mileti and
O’Brien (2002). This result may reflect a ceiling effect, as most Christchurch
participants saw another earthquake in their region as likely. Interestingly, citizens
living outside Christchurch who had acquaintances in Christchurch who suffered
damage judged the likelihood of another earthquake in their own region higher than
those who had no acquaintances there. This is a novel finding. The finding that
citizens who prepared saw the risk of another earthquake as no higher than those who
did not prepare is consistent with past research (e.g., Spittal, McClure, Walkey, &
Siegert, 2008), and is a reminder that recognition of the risk is necessary but not
sufficient on its own to get people to prepare. Voluntary actions are based on other
factors such as the perception that preparation will make a difference.
Lessons from the Christchurch earthquakes 26
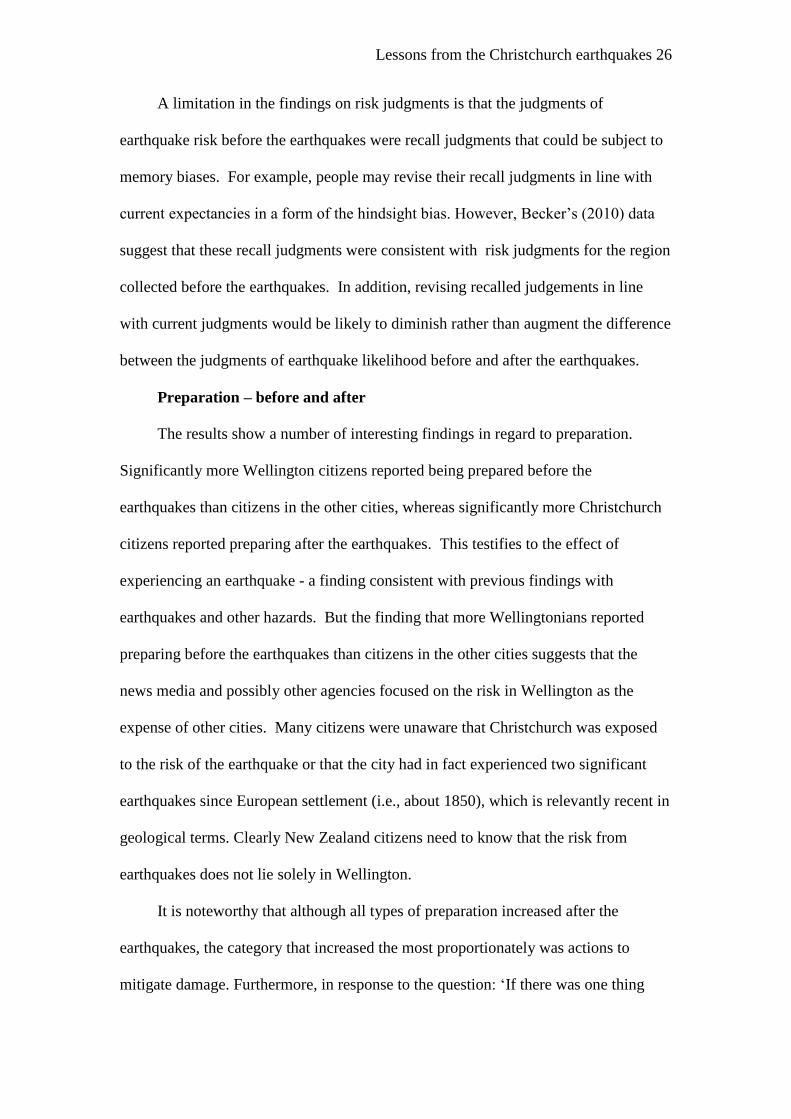
A limitation in the findings on risk judgments is that the judgments of
earthquake risk before the earthquakes were recall judgments that could be subject to
memory biases. For example, people may revise their recall judgments in line with
current expectancies in a form of the hindsight bias. However, Becker’s (2010) data
suggest that these recall judgments were consistent with risk judgments for the region
collected before the earthquakes. In addition, revising recalled judgements in line
with current judgments would be likely to diminish rather than augment the difference
between the judgments of earthquake likelihood before and after the earthquakes.
Preparation – before and after
The results show a number of interesting findings in regard to preparation.
Significantly more Wellington citizens reported being prepared before the
earthquakes than citizens in the other cities, whereas significantly more Christchurch
citizens reported preparing after the earthquakes. This testifies to the effect of
experiencing an earthquake - a finding consistent with previous findings with
earthquakes and other hazards. But the finding that more Wellingtonians reported
preparing before the earthquakes than citizens in the other cities suggests that the
news media and possibly other agencies focused on the risk in Wellington as the
expense of other cities. Many citizens were unaware that Christchurch was exposed
to the risk of the earthquake or that the city had in fact experienced two significant
earthquakes since European settlement (i.e., about 1850), which is relevantly recent in
geological terms. Clearly New Zealand citizens need to know that the risk from
earthquakes does not lie solely in Wellington.
It is noteworthy that although all types of preparation increased after the
earthquakes, the category that increased the most proportionately was actions to
mitigate damage. Furthermore, in response to the question: ‘If there was one thing

Lessons from the Christchurch earthquakes 27
you wished you’d done before the earthquake, what is it?’, Christchurch citizens
cited getting basic needs first and not having taken actions to mitigate damage as
second highest. As noted by Spittal et al. (2008), preparedness can be grouped in to
two main categories: survival actions and actions to mitigate damage. Civic
programmes attempting to enhance preparedness tend to focus on the former but not
the latter. This is an issue that needs to be addressed, as the Christchurch citizens
found out to their regret.
The reasons (attributions) that citizens gave for preparing are also informative.
Of those who did prepare, few said they expected an earthquake to happen, the most
frequent reason being that they did so just in case of an emergency. Of those who did
not prepare, the most cited reasons were that they never thought an earthquake would
happen, they didn’t think about it, and their personality. So there little difference
between those who did and did not prepare in terms of believing an earthquake would
happen. The main difference is that those who prepared recognised the possibility of
an emergency whereas those who did not prepare didn’t take these precautions and
didn’t think about it.
Changing people’s beliefs and actions regarding earthquake risk
Previous research has shown that communications about damage from
earthquakes can reduce people’s fatalism about earthquakes and enhance their belief
in the value of preparations (e.g., Cowan, McClure, & Wilson, 2002; McClure,
Sutton, & Sibley, 2007; Spittal, Siegert, McClure, & Walkey, 2002). For example,
the way messages about the hazard are framed influences people's attributions about
the cause of damage (McClure & Hilton, 1998; McClure, White, & Sibley, 2009), and
these attributions in turn affect people’s perception that the causes can be prevented.
Lessons from the Christchurch earthquakes 28
Unrealistic optimism in the form of underestimating the likelihood of negative
events can be countered by messages that communicate that people in similar
circumstances have taken steps to prepare for a hazard (Weinstein 1980). In addition
to this general principle, one key implication of the present findings is the need to get
people to understand that even if they are objectively at a lower risk than people in
other cities in terms of earthquake probabilities, they should not use this comparison
as a basis for their risk judgments. Instead, they should base their actions on the actual
level of risk in their own region, even if that risk is lower in probabilistic terms than
other regions, as was the case in Christchurch. Even when the probabilities are
relatively low, the consequences when a major earthquake does occur can be
devastating. In addition, experts’ judged probabilities of earthquakes are based on
known faults and do not take account of faults that remain undiscovered. So citizens
should take account of whether they are in broad proximity to an earthquake region
and not only whether there is a known local fault. Programmes to educate and
motivate citizens should take these aspects of the hazard into account.
The findings on preparedness show not only that Christchurch citizens were
underprepared but that Christchurch citizens most regretted that they hadn’t got
resources for their basic needs and hadn’t taken action to mitigate damage. Many
schemes to enhance preparedness focus on the former and not the latter, and this bias
needs to be corrected.
Efforts to get citizens to prepare for earthquakes will be most effective if they
use effective message backed up by incentives including community participation in
risk management, insurance policies with excess levels that correspond to the risk,
and robust legislation on building standards and land prone to liquefaction.
Lessons from the Christchurch earthquakes 29
References
Aftershock. (2008). TV3 programme, New Zealand, 8 October 2008.
Becker, J. S. (2010). Understanding disaster preparedness and resilience in
Canterbury: Results of interviews, focus groups and a questionnaire survey. GNS
Science report 2010/50.
Burger, J. M., & Palmer, M. L. (1992). Changes in and generalization of
unrealistic optimism following experiences with stressful events: Reactions to the
1989 California earthquake. Personality and Social Psychology Bulletin, 18, 29-43.
Cowan, J., McClure, J., & Wilson, M. (2002). What a difference a year makes:
How immediate and anniversary media reports influence judgments about earthquake.
Asian Journal of Social Psychology, 5, 169-185.
Helweg-Larsen, M. (1999). (The lack of) optimistic bias in response to the
Northridge earthquake: The role of personal experience. Basic and Applied Social
Psychology, 21, 119-129.
Jackson, E. L. (1981). Response to earthquake hazard: The West Coast of
North America. Environment and Behavior, 13, 387-416.
Johnston, D.M., Bebbington, M.S., Lai, C.-D. , Houghton, B.F., & Paton, D.
1999. Volcanic hazard perceptions: Comparative shifts in knowledge and risk.
Disaster Prevention and Management, 8, 118-126.
McClure, J., & Hilton, D. (1998). Are goals or preconditions better
explanations: it depends on the question. European Journal of Social Psychology, 28,
897–911.
McClure, J., Wills, C., Johnston, D., & Recker, C. (2011). How the 2010
Canterbury (Darfield) earthquake affected earthquake risk perception: Comparing
Lessons from the Christchurch earthquakes 30
citizens inside and outside the earthquake region. Australasian Journal of Disaster
and Trauma Studies, 2011-2: 3-10.
McClure, J., Sutton, R M., & Sibley, C. G. (2007). Listening to reporters or
engineers: How different messages about building design affect earthquake fatalism.
Journal of Applied Social Psychology, 37, 1956-1973.
McClure, J., White, J., & Sibley, C. G. (2009). Framing effects on preparation
intentions: Distinguishing actions and outcomes. Disaster Prevention and
Management, 18, 187-199.
Mileti, D. S., & Darlington, J. D. (1995). Societal response to revised
earthquake probabilities in the San Francisco Bay area. International Journal of Mass
Emergencies and Disasters, 13, 119-145.
Mileti, D. S., & O’Brien, P. W. (1992). Warnings during disaster: Normalizing
communicated risk. Social Problems, 39, 40-57.
Nakashima, M., Chusilp, P. 2003. A partial view of Japanese post-Kobe seismic
design and construction practices. Earthquake Engineering and Engineering
Seismology. 3, 3–13.
Reve, (2011). Nuclear’s Health Risks on Chernobyl Anniversary.
http://www.evwind.es/noticias.php?id_not=11411.
Ronan, K. R., Johnston D.M., Paton, D. (2001) Communities’ understanding of
earthquake risk in the Hawke’s Bay and Manawatu-Wanganui regions, New Zealand.
New Zealand Society for Earthquake Engineering Conference , Paper No. 1.03.01.
Sattler, D. N., Kaiser, C. F., & Hittner, J. B. (2000). Disaster preparedness:
Relationships among prior experience, personal characteristics, and distress. Journal
of Applied Social Psychology, 30, 1396-1420.

Lessons from the Christchurch earthquakes 31
Slovic, P. Fischhoff, B., & Lichtenstein, S. (1982). Facts versus fears:
Understanding perceived risk. In D. Kahneman, P. Slovic, & A. Tversky (Eds.)
Judgment under uncertainty: Heuristic and biases. Cambridge: Cambridge
University Press.
Spiegel online, (2011). Nuclear Phase-out Could Spell Disaster for German
Energy Giants. http://www.spiegel.de/international/business/0,1518,766095,00.html.
Spittal, M. J., McClure, J., Siegert, R. J., & Walkey F. H. (2005). Optimistic
bias in relation to preparedness for earthquakes. Australasian Journal of Disaster and
Trauma Studies, 2005-1, 1-10.
Spittal, M., McClure, J., Walkey, F., & Siegert, R. (2008). Psychological
predictors of earthquake preparation. Environment and Behavior, 40, 798-817.
Spittal, M. J., Siegert, R. J., McClure, J., & Walkey, F. H. (2002). The Spheres
of Control scale: The identification of a clear replicable factor structure. Personality
and Individual Differences, 32, 121-131.
Stone, E. R., Yates, J. F., & Parker, A. M. (1994). Risk communication:
Absolute versus relative expressions of low-probability risks. Organizational
Behavior and Human Decision Processes, 60, 387-403.
Weinstein, N. D. (1980). Unrealistic optimism about future life events.
Journal of Personality and Social Psychology, 39, 806-820.
Lessons from the Christchurch earthquakes 32
Questionnaire: the Canterbury Earthquake: Christchurch participants
1. Before the 2010-2011 Canterbury earthquakes, how likely did you think it was there would be a big earthquake in or
near Christchurch?
Not at all (likely) 1 2 3 4 5 very (likely)
2. Since the earthquakes, how likely do you rate a future big earthquake near Christchurch?
Not at all (likely) 1 2 3 4 5 very (likely)
3. Before the 2010-2011 Canterbury earthquakes, how likely did you think it was there would be a big earthquake in or
near Wellington?
Not at all (likely) 1 2 3 4 5 very (likely)
4. Since the earthquakes, how likely do you rate a future big earthquake near Wellington?
Not at all (likely) 1 2 3 4 5 very (likely)
5. Before the 2010-2011 Canterbury earthquakes, how likely did you think it was there would be a serious earthquake in
another part of New Zealand?
Not at all (likely) 1 2 3 4 5 very (likely)
6. What do you currently think is the likelihood of a serious earthquake in another part of New Zealand?
Not at all (likely) 1 2 3 4 5 very (likely)
7. Did you expect an event such as the Canterbury earthquakes to happen in your lifetime? Yes / No
8. Has the risk of an earthquake become more real or plausible to you since the Canterbury earthquakes?
Yes / No
9. If you previously thought an earthquake near Christchurch was unlikely, why was that?
[Tick all that apply]
a) It was not going to happen
b) I thought Christchurch was not earthquake prone as there was no fault line there
c) I thought it would happen elsewhere; that e.g., Wellington was a bigger risk
d) There had been no damaging earthquake in recent NZ history
e) I have had no personal experience of an earthquake
f) Other – (describe):___________________________________________________________
10a. Before the earthquakes, were you aware of any information about how to prepare for a possible earthquake?
Yes/not sure/no [circle one]
10b. Where did you see this information? [Circle one]: TV/ print/Other___________________
11. If you were aware of this information, did you regard it as relevant for you? Yes/ Some relevance/No
12. Before the earthquakes, had you made any preparations specifically for an earthquake? Yes /no
13. If you said YES to the previous question, please list these preparations: [tick those that apply]
a) Got basic needs e.g. canned food, water, emergency kit
b) Got basic equipment, e.g., torch, batteries
c) Got communications e.g., battery radio
d) Logistics /planning e.g., planned where to meet
e) Damage mitigation; quake-safe the house, or check it is quake safe
f) Other (describe):___________________________________________________________

Lessons from the Christchurch earthquakes 33
14. If you did make any preparations for an earthquake, what is the main reason? [Tick those that apply]
a) My personality e.g. I’m a sensible person
b) Just in case of an emergency
c) I thought an earthquake might happen;
d) Past experience of an earthquake
e) Advice from the media; education
f) Other – (describe):___________________________________________________________
15. If you did not prepare before the Canterbury earthquakes, what is the main reason you didn’t?
a) My personality e.g. I’m complacent, lazy, or unorganised and didn’t get around to it
b) I didn't think about it
c) I thought an earthquake wouldn’t happen; that it was not a serious risk
d) I had no past experience of an earthquake
e) I did not take advice from the media seriously
f) Other – (describe):___________________________________________________________
16. Since the earthquakes, have you made any preparations specifically for an earthquake? Yes /no
17. If you said YES to the previous question, please list these preparations: [tick those that apply]
a) Got basic needs e.g. canned food, water, emergency kit
b) Got basic equipment, e.g., torch, batteries
c) Got communications e.g., battery radio
d) Logistics /planning e.g., planned where to meet
e) Damage mitigation; quake-safe the house, or check it is quake safe
f) Other – (describe):___________________________________________________________
18. In the next month or so, do you intend to: [Yes/ Possibly / no]
a) Check your level of preparedness for earthquakes? ____ ____ ____
b) Increase your level of preparedness for earthquakes? ____ ____ ____
c) Become involved with a local group to discuss how to ____ ____ ____
reduce earthquake damage or losses?
d) Seek information on earthquake risk? ____ ____ ____
e) Seek information on things to do to prepare? ____ ____ ____
f) Get your house checked for its earthquake safety? ____ ____ ____
19. Did you incur a lot of damage in the earthquakes?
No damage 1 2 3 4 5 Extensive damage
20. If there is one thing you wished you’d done before the earthquake, what is it? (Circle one)
a) I hadn’t got basic needs e.g. canned food, water, emergency kit
b) I hadn’t got basic equipment, e.g., torch, batteries
c) I hadn’t got communications e.g., battery radio
d) I hadn’t done logistics /planning e.g., planned where to meet
e) I hadn’t done any damage mitigation e.g., quake-safe the house, or check it is quake safe
f) Other (describe):___________________________________________________________
21. Any other comments you would like to make [about earthquakes or the Canterbury earthquakes]
_______________________________________________________________________________
______________________________________________________________________________
Demographics (optional): Male/Female Age: under 20 21-30 31-40 41-50 over 50
No. of dependent children in your household___________; Suburb ____________________________
THANK YOU VERY MUCH – WE REALLY APPRECIATE YOUR TIME
Lessons from the Christchurch earthquakes 34
Questionnaire: the Canterbury Earthquake: Wellington participants
1. Before the 2010-2011 Canterbury earthquakes, how likely did you think it was there would be a big
earthquake in or near Christchurch?
Not at all (likely) 1 2 3 4 5 very (likely)
2. Since the earthquakes, how likely do you rate a future big earthquake near Christchurch?
Not at all (likely) 1 2 3 4 5 very (likely)
3. Before the 2010-2011 Canterbury earthquakes, how likely did you think it was there would be a big
earthquake in or near Wellington?
Not at all (likely) 1 2 3 4 5 very (likely)
4. Since the earthquakes, how likely do you rate a future big earthquake near Wellington?
Not at all (likely) 1 2 3 4 5 very (likely)
5. Before the 2010-2011 Canterbury earthquakes, how likely did you think it was there would be a serious
earthquake in another part of New Zealand?
Not at all (likely) 1 2 3 4 5 very (likely)
6. What do you currently think is the likelihood of a serious earthquake in another part of New Zealand?
Not at all (likely) 1 2 3 4 5 very (likely)
7. Did you expect an event such as the Canterbury earthquakes to happen in your lifetime? Yes / No
8. Has the risk of an earthquake become more real or plausible to you since the Canterbury earthquakes?
Yes / No
9. If you previously thought an earthquake near Christchurch was unlikely, why was that? [Tick all that apply]
a) It was not going to happen
b) I thought Christchurch was not earthquake prone as there was no fault line there
c) I thought it would happen elsewhere; that e.g., Wellington was a bigger risk
d) There had been no damaging earthquake in recent NZ history
e) I have had no personal experience of an earthquake
f) Other – (describe):___________________________________________________________
10a. Before the earthquakes, were you aware of any information about how to prepare for a possible
earthquake? Yes/not sure/no [circle one]
10b. where did you see this information? [Circle one]: TV/ print/ Other___________________
11. If you were aware of this information, did you regard it as relevant for you? Yes/ Some relevance/No
12. Before the earthquakes, had you made any preparations specifically for an earthquake? Yes /no
13. If you said YES to the previous question, please list these preparations: [tick those that apply]
a) Got basic needs e.g. canned food, water, emergency kit
b) Got basic equipment, e.g., torch, batteries
c) Got communications e.g., battery radio
d) Logistics /planning e.g., planned where to meet
e) Damage mitigation; quake-safe the house, or check it is quake safe
f) Other (describe):___________________________________________________________

Lessons from the Christchurch earthquakes 35
14. If you did make any preparations for an earthquake, what is the main reason? [Tick those that apply]
a) My personality e.g. I’m a sensible person
b) Just in case of an emergency
c) I thought an earthquake might happen;
d) Past experience of an earthquake
e) Advice from the media; education
f) Other – (describe):___________________________________________________________
15. If you did not prepare before the Canterbury earthquakes, what is the main reason you didn’t?
a) My personality e.g. I’m complacent, lazy, or unorganised and didn’t get around to it
b) I didn't think about it
c) I thought an earthquake wouldn’t happen; that it was not a serious risk
d) I had no past experience of an earthquake
e) I did not take advice from the media seriously
f) Other – (describe):___________________________________________________________
16. Since the earthquakes, have you made any preparations specifically for an earthquake? Yes /no
17. If you said YES to the previous question, please list these preparations: [tick those that apply]
a) Got basic needs e.g. canned food, water, emergency kit
b) Got basic equipment, e.g., torch, batteries
c) Got communications e.g., battery radio
d) Logistics /planning e.g., planned where to meet
e) Damage mitigation; quake-safe the house, or check it is quake safe
f) Other – (describe):___________________________________________________________
18. In the next month or so, do you intend to: [Yes/ Possibly / no]
a) Check your level of preparedness for earthquakes? ____ ____ ____
b) Increase your level of preparedness for earthquakes? ____ ____ ____
c) Become involved with a local group to discuss how to ____ ____ ____
reduce earthquake damage or losses?
d) Seek information on earthquake risk? ____ ____ ____
e) Seek information on things to do to prepare? ____ ____ ____
f) Get your house checked for its earthquake safety? ____ ____ ____
19. Did you know anyone close to you who lives in Christchurch? Yes/no
20. Did you know anyone who incurred a lot of damage in the earthquakes? Yes/no
21. Any other comments you would like to make [about earthquakes or the Canterbury earthquakes]
_______________________________________________________________________________
______________________________________________________________________________
Demographics (optional): Male/Female Age: under 20 21-30 31-40 41-50 over 50
No. of dependent children in your household___________; Suburb ____________________________
THANK YOU VERY MUCH – WE REALLY APPRECIATE YOUR TIME

Lessons from the Christchurch earthquakes 36
Questionnaire: the Canterbury Earthquake: Palmerston North participants
1. Before the 2010-2011 Canterbury earthquakes, how likely did you think it was there would be a big earthquake in or
near Christchurch?
Not at all (likely) 1 2 3 4 5 very (likely)
2. Since the earthquakes, how likely do you rate a future big earthquake near Christchurch?
Not at all (likely) 1 2 3 4 5 very (likely)
3. Before the 2010-2011 Canterbury earthquakes, how likely did you think it was there would be a big earthquake in or
near Palmerston North?
Not at all (likely) 1 2 3 4 5 very (likely)
4. Since the earthquakes, how likely do you rate a future big earthquake near Palmerston North?
Not at all (likely) 1 2 3 4 5 very (likely)
5. Before the 2010-2011 Canterbury earthquakes, how likely did you think it was there would be a serious earthquake in
another part of New Zealand?
Not at all (likely) 1 2 3 4 5 very (likely)
6. What do you currently think is the likelihood of a serious earthquake in another part of New Zealand?
Not at all (likely) 1 2 3 4 5 very (likely)
7. Did you expect an event such as the Canterbury earthquakes to happen in your lifetime? Yes / No
8. Has the risk of an earthquake become more real or plausible to you since the Canterbury earthquakes?
Yes / No
9. If you previously thought an earthquake near Christchurch was unlikely, why was that?
[Tick all that apply]
a) It was not going to happen
b) I thought Christchurch was not earthquake prone as there was no fault line there
c) I thought it would happen elsewhere; that e.g., Wellington was a bigger risk
d) There had been no damaging earthquake in recent NZ history
e) I have had no personal experience of an earthquake
f) Other – (describe):___________________________________________________________
10a. Before the earthquakes, were you aware of any information about how to prepare for a possible earthquake?
Yes/not sure/no [circle one]
10b. Where did you see this information? [Circle one]: TV/ print/ Other___________________
11. If you were aware of this information, did you regard it as relevant for you? Yes/ Some relevance/No
12. Before the earthquakes, had you made any preparations specifically for an earthquake? Yes /no
13. If you said YES to the previous question, please list these preparations: [tick those that apply]
a) Got basic needs e.g. canned food, water, emergency kit
b) Got basic equipment, e.g., torch, batteries
c) Got communications e.g., battery radio
d) Logistics /planning e.g., planned where to meet
e) Damage mitigation; quake-safe the house, or check it is quake safe
f) Other (describe):___________________________________________________________

Lessons from the Christchurch earthquakes 37
14. If you did make any preparations for an earthquake, what is the main reason? [Tick those that apply]
a) My personality e.g. I’m a sensible person
b) Just in case of an emergency
c) I thought an earthquake might happen;
d) Past experience of an earthquake
e) Advice from the media; education
f) Other – (describe):___________________________________________________________
15. If you did not prepare before the Canterbury earthquakes, what is the main reason you didn’t?
a) My personality e.g. I’m complacent, lazy, or unorganised and didn’t get around to it
b) I didn't think about it
c) I thought an earthquake wouldn’t happen; that it was not a serious risk
d) I had no past experience of an earthquake
e) I did not take advice from the media seriously
f) Other – (describe):___________________________________________________________
16. Since the earthquakes, have you made any preparations specifically for an earthquake? Yes /no
17. If you said YES to the previous question, please list these preparations: [tick those that apply]
a) Got basic needs e.g. canned food, water, emergency kit
b) Got basic equipment, e.g., torch, batteries
c) Got communications e.g., battery radio
d) Logistics /planning e.g., planned where to meet
e) Damage mitigation; quake-safe the house, or check it is quake safe
f) Other – (describe):___________________________________________________________
18. In the next month or so, do you intend to: [Yes/ Possibly / no]
a) Check your level of preparedness for earthquakes? ____ ____ ____
b) Increase your level of preparedness for earthquakes? ____ ____ ____
c) Become involved with a local group to discuss how to ____ ____ ____
reduce earthquake damage or losses?
d) Seek information on earthquake risk? ____ ____ ____
e) Seek information on things to do to prepare? ____ ____ ____
f) Get your house checked for its earthquake safety? ____ ____ ____
19. Did you know anyone close to you who lives in Christchurch? Yes/no
20. Did you know anyone who incurred a lot of damage in the earthquakes? Yes/no
21. Any other comments you would like to make [about earthquakes or the Canterbury earthquakes]
_______________________________________________________________________________
______________________________________________________________________________
Demographics (optional): Male/Female Age: under 20 21-30 31-40 41-50 over 50
No. of dependent children in your household___________; Suburb ____________________________
THANK YOU VERY MUCH – WE REALLY APPRECIATE YOUR TIME
Lessons from the Christchurch earthquakes 38
Appendix A Information Sheet:
Dr John McClure
Professor
Email: [email protected]
What is the purpose of this research?
This research will allow us to understand why many people choose not to undertake different types of preparedness
for earthquakes.
Who is conducting the research?
I am a researcher in the School of Psychology at Victoria University of Wellington. This research is funded by
Victoria University and GNS Science and has been approved by the University ethics committee.
What is involved if you agree to participate?
If you agree to participate in this study you will complete a short questionnaire where you indicate your views about
earthquakes whether you have taken different earthquake and reasons for why you have done so or not done so. (e.g.
because it’s not a top priority)”. We anticipate that the survey will take you no more than 5-10 minutes to complete.
During the research, you are free to withdraw at any point before your survey has been completed.
Privacy and Confidentiality
This survey is completely anonymous. Please do not put your name on it anywhere. Completing the survey indicates
your consent to participate in the research
We will keep your survey for at least five years after publication.
In accordance with the requirements of some scientific journals and organizations, the data from your coded survey
may be shared with other competent researchers.
A copy of the coded data will remain in the custody of Dr John McClure.
What happens to the information that you provide?
The data you provide may be used for one or more of the following purposes:
The overall findings will be reported to the Earthquake Commission and later they may be submitted for
publication in a scientific journal, or presented at scientific conferences.
We will post a summary of the results to you as soon as they are available.
Thank you for considering participation in this research.
John McClure
Lessons from the Christchurch earthquakes 39
Information Sheet
Dear Participant Thank you for participating in this study, which is looking at people’s perception of the risk of earthquakes since the Christchurch earthquake, and their explanations for why they have or have not undertaken different types of preparedness for earthquakes Specifically, in this research we asked questions about your perceptions of the risk of earthquakes in Canterbury and elsewhere in New Zealand before and after the Canterbury earthquakes. We asked you if you had performed preparedness actions and to give your reasons for not performing these actions, where this was the case. This research is important to clarify people’s perception of the risk from earthquakes and their explanations for why they haven’t performed actions that are important for their safety and survival during and after an earthquake. The results from this research and related studies can be used by civic agencies to understand people’s motives for preparing or not preparing for earthquakes and help them get more prepared. Thank you again for participating in this research. John McClure Professor of Psychology Email: [email protected]
THANK YOU VERY MUCH – WE REALLY APPRECIATE YOUR TIME

Lessons from the Christchurch earthquakes 40
Information for Riccarton Market, Christchurch
The Christchurch earthquake questionnaire invites citizens’ perceptions about the risk from earthquakes in
Christchurch. This research is being funded by the EQC (Earthquake Commission) because they want to know
whether citizens’ perceptions of earthquake risk have changed since the Canterbury earthquakes and whether
those risk perceptions relate to people preparing for earthquakes. The questionnaire is being run in
Christchurch, Wellington, and Palmerston North. The questionnaire was previously run at the Riccarton
Market in November 2010, after the first major earthquake in September 2010. The Questionnaire asks people
to give their estimate of the risk of an earthquake in Christchurch and elsewhere in NZ before and after the
earthquakes and to note any actions they have taken to prepare before and after the earthquake.
The Questionnaire is designed by Professor John McClure of Victoria a University of Wellington and Dr David
Johnston of GNS Science, both of whom are recognised researchers on earthquake preparedness and who are
doing research for the Earthquake Commission to assist New Zealanders to in relation to earthquakes. The
Questionnaire has been approved by the ethics committee of Victoria University of Wellington.
As on the previous occasion where we ran this Questionnaire, it is totally voluntary – people passing the stall
are invited to fill in the 5 minute Questionnaire if they are interested. People who fill in the questionnaire are
given a chocolate bar for their time. Those who fill in the Questionnaire can request a summary of the results if
they are interested. On the previous occasion we found that Christchurch citizens much appreciated the
opportunity to express their views and talk about the earthquakes. They also liked the chocolate!