changes in dna methylation pattern at two seedling stages in water saving and drought-resistant rice...
TRANSCRIPT
Rice Science, 2014, 21(5): 262−270 Copyright © 2014, China National Rice Research Institute Published by Elsevier BV. All rights reserved DOI: 10.1016/S1672-6308(13)60194-8
Changes in DNA Methylation Pattern at Two Seedling Stages in
Water Saving and Drought-Resistant Rice Variety after Drought
Stress Domestication
ZHENG Xiao-guo1, 2, #
, CHEN Liang1, #
, LOU Qiao-jun1, XIA Hui
1, LI Ming-shou
1, LUO Li-jun
1, 2
(1Shanghai Agrobiological Gene Center, Shanghai 201106, China; 2 College of Plant Sciences & Technology, Huazhong Agricultural
University, Wuhan 430070, China; #These authors contribute equally to this paper)
Abstract: Recent studies revealed that DNA methylation plays an important role in plant growth and
development. In this study, a water-saving and drought-resistant rice variety Huhan 3 was subjected to
drought stress from tillering to grain-filling stages in six successive growth cycles. The variations in DNA
methylation pattern between the original generation (G0) and the sixth generation (G6) were analyzed by
using methylation sensitive amplification polymorphism method. The results revealed that the methylated
loci accounted for 34.3% to 34.8% of the total loci. Among these methylated loci, 83.1% to 84.8% were
full- and hyper-methylated and 15.2% to 16.9% were hemi-methylated. The DNA methylation level
decreased from the three-leaf to four-leaf stages in Huhan 3. Differentially methylated loci (DML) between
generations or/and between different developmental stages accounted for 4.0% of the total loci, most of
which were only related to plant development (57.9%). Compared to G0, the DNA methylation pattern of
G6 changed after drought domestication, at the three-leaf stage, de-methylation accounting for 59.1%,
while at the four-leaf stage, re-methylation for 47.9%. Genome-wide alternations of DNA methylation
were observed between the two seedling stages, and DML mainly occurred on the gene’s promoter and
exon region. The genes related to DML involved in a wide range of functional biology and participated in
many important biological processes.
Key words: drought stress; water-saving and drought-resistant rice; DNA methylation; seedling stage;
methylation sensitive amplification polymorphism
DNA methylation, the addition of a methyl group to
the position 5′ of a cytosine base (5mC), is a
conserved epigenetic marker which widely exists in
varieties of organisms. In mammals, DNA methylation
occurs almost exclusively in the symmetric CG
context and is estimated occurring at 70%–80% of CG
dinucleotides throughout the genome. In plants, DNA
methylation commonly occurs at cytosine bases in all
sequence contexts: the symmetric CG and CHG
contexts (in which H = A, T or C) and the asymmetric
CHH contexts (Bird, 2002; Jackson et al, 2002; Goll
and Bestor, 2005; Henderson and Jacobsen, 2007).
DNA methylation in all the three contexts are
established by domains rearranged methyltransferase
2 (DRM2), but maintained by three different DNA
methyltransferases. For example, CG methylation is
maintained by DNA methyltransferase 1 (MET1, also
known as DMT1), CHG methylation is maintained by
chromomethylase 3 (CMT3, a plant-specific DNA
methyltransferases), and CHH methylation is
maintained by DRM2 (Law and Jacobsen, 2010).
DNA methylation is associated with many important
biological processes, including heterochromatin formation,
defense against transposon proliferation, genomic
imprinting, regulation of endogenous gene expression,
silencing of transgenes and so on (Paszkowski and
Whitham, 2001; Bender, 2004; Zhang et al, 2006; Li
et al, 2008; Tsukahara et al, 2009).
DNA methylation plays an important role in plant
growth and development, and abnormal DNA
methylation may cause morphological variations.
Recent studies in plants revealed that DNA methylation
participates in the regulation of plant height, floral
symmetry, flowering time, disease resistance, and the
response to environmental stress (Cubas et al, 1999; Received: 8 February 2014; Accepted: 15 April 2014
Corresponding author: LUO Li-jun ([email protected])

ZHENG Xiao-guo, et al. Changes in DNA Methylation Pattern in Drought-Resistant Rice Variety 263
Santos et al, 2002; Steimer et al, 2004; Manning et al,
2006; Boyko and Kovalchuk, 2008). In rice, a
spontaneous mutant Epi-d1 was identified (Miura et al,
2009). It is often chimeric, producing both dwarf and
normal tillers on a single plant, and Epi-d1 plants
show a wide variation of dwarf and normal features,
from completely dwarf to completely normal. The
phenotype is mitotically and meiotically inheritable
and related to the metastable epigenetic silencing of
the DWARF1 (D1) gene. D1 gene silencing is
correlated with repressive DNA methylation marks in
the D1 promoter region (Miura et al, 2009). Another
epi-mutant identified in rice is epi-df, which is a
gain-of-function epi-allele of FIE1, and the allele
causes a dwarf stature and various floral defects that
are inherited in a dominant fashion and caused by
ectopically expressed FIE1 which is hypomethylated
in the 5′ region in epi-df (Zhang et al, 2012). Sha et al
(2005) reported that a rice cultivar, Wase Aikoku 3,
becomes resistant to the blight pathogen Xanthomonas
oryzae pv. oryzae at the adult stage. Analysis of the
DNA methylation patterns revealed that overall levels
of methylation are higher in adult plants than in
seedlings, and differentially methylated sites between
adult plants and seedlings account for 2.3% of the
total identified sites. Hyper- or hypo-methylation at
specific loci may involve in disease-resistance in adult
rice plants (Sha et al, 2005). In addition, abiotic stress,
such as drought, salinity and heavy metal, and biotic
stress, such as pathogen infection, can induce DNA
methylation variations in plants (Aina et al, 2004;
Chinnusamy et al, 2008; Pan et al, 2009; Tan, 2010;
Verhoeven et al, 2010; Wang et al, 2011; Dowen et al,
2012; Karan et al, 2012; Ou et al, 2012). Furthermore,
a considerable proportion of these variations can be
faithfully inherited to progenies and significantly
enhance stress resistance of the progenies (Kou et al,
2011; Ou et al, 2012).
Plant methylation pattern varies among species,
genotypes or eco-types, and even individual plants
may show a unique methylation pattern at different
developmental stages or responding to environmental
changes (Cervera et al, 2002; Paun et al, 2010). Xiong
et al (1999) analyzed the DNA methylation patterns in
an elite hybrid rice variety, Shanyou 63, and its
parental lines, Zhenshan 97 and Minghui 63. The
results revealed that hybrid has different DNA
methylation pattern compared with its parental lines
(Xiong et al, 1999). Lu et al (2008) analyzed the
specific DNA methylation patterns in three different
maize tissues, tassel, bracteal leaf and ear leaf. The
results revealed that the three tissues have different
DNA methylation patterns and levels (Lu et al, 2008).
Sakthivel et al (2010) investigated the pattern and
level of cytosine methylation in the leaf tissue of an
elite Indian hybrid rice variety KRH2 and its parents
at three stages (15 day-old and 35 day-old seedlings,
flag leaf). They observed that the methylation levels
are high at the initial growth stages and decrease at the
later stage and that a considerable portion of cytosine
methylation variations are novel in hybrid. Furthermore,
demethylation occurs more predominantly during
early stages than hyper-methylation, and the frequency
of demethylation decreases in flag leaf while that of
hyper-methylation remarkably increases in the hybrid
(Sakthivel et al, 2010). Pan et al (2009) characterized
DNA methylation patterns in leaves and roots at
seedling and tillering stages under drought stress for
DK106 (drought-resistant introgression line) and IR64
(recurrent parent, drought sensitive line). The results
showed that about 20% cytosine of CCGG sequences
in rice genome is methylated, and the methylation
frequency is similar in coding and non-coding regions
on the genome (Pan et al, 2009). The pattern and level
of DNA methylation are temporal-spatial specific and
variety specific.
Water-saving and drought-resistant rice (WDR) is a
new type of modern rice, which is developed through
introgressing the water-saving and drought-resistance
from the traditional upland rice into the commercialized
paddy rice cultivars (Luo, 2010). In this study, a WDR
variety, Huhan 3, was subjected to drought stress from
tillering to grain-filling stages in six successive growth
cycles. The DNA methylation patterns of the original
generation (G0) and the sixth generation (G6) at three-
leaf stage (21 day-old) and four-leaf stage (28 day-old)
seedlings were assessed by using the methylation
sensitive amplification polymorphism (MSAP) method.
We aimed to study the impact of drought entrainment
on DNA methylation patterns of WDR variety, study
the DNA methylation variations between different
developmental stages, and investigate the features of
DNA methylation variations on gene level.
MATERIALS AND METHODS
Rice materials and drought treatments
A WDR variety, Huhan 3 (Oryza sativa L. ssp. japonica)
(bred by Shanghai Agrobiological Gene Center,
264 Rice Science, Vol. 21, No. 5, 2014
China), was used in the study (Luo, 2010). The seeds
from a single plant of Huhan 3 were designated as the
original generation (G0). Some of these seeds were
grown under natural environment. Then, drought stress
was imposed on plants from the tillering to grain-
filling stages until leaf rolling reaching the highest
level according to the grading standard (O’Toole and
Cruz, 1980), and the relative water content of leaves
was lower than 70%. Seeds from treated plants were
harvested, and the same procedure was performed for
the other five generations to obtain the G6 seeds.
To avoid the effects of exogenous environmental
factors and obtain more uniform phenotype, the seedlings
of both G0 and G6 were grown in a growth chamber
(CONVIRON CMP6050) after germination and
cultivated by hydroponic method. The temperature
was 21 °C to 29 °C, light [200 mmol/(m2∙s)] was set
from 7:00 am to 7:00 pm (12 h), and the relative
humidity was 75% to 80%. The seedlings were irrigated
with water during the first week and with Yoshida
nutrient solution from the second to the forth weeks.
Leaves from the three-leaf stage seedlings (21 day-old)
were collected as sample 1, and leaves from the
four-leaf stage seedlings (28 day-old) were collected
as sample 2. Each sample had four replicates and each
replicate contained 12 seedlings. Among the 12
seedlings, leaves from 8 seedlings with similar phenotype
were collected and mixed to extract genomic DNA
with a modified CTAB method (Attitalla, 2011).
MSAP analysis
The MSAP approach is developed from the standard
amplified fragment length polymorphism method
(Vos et al, 1995). Two isoschizomers with different
methylation sensitivity, Msp I and Hpa II, were used
as frequent cutters, and were combined with the same
rare cutter (EcoR I) in parallel batches, respectively.
With some modifications to increase the number of
amplified fragments and improve fingerprint
readability, the MSAP was performed following the
general steps described by Xiong et al (1999).
Pre-experiment with 16 primer-pairs showed that there
was no difference between four replicates. Then, the
genomic DNA of four replicates was evenly mixed for
the MSAP analysis.
The digestion and ligation reactions were separately
performed. In the digestion reaction, DNA samples
were separately digested with double enzyme
combinations, EcoR I/Msp I and EcoR I/Hpa II. The
reaction solution contained 250 ng genomic DNA, 2
μL of 10 × T4 DNA ligase buffer (Promega, Madison,
WI, USA), 10 U EcoR I, 10 U Msp I (or Hpa II) (New
England Biolabs, USA), and ddH2O with a final
volume of 20 μL, subsequently incubated at 37 °C for
2 h. Approximately 5 μL of digestion products were
checked with 0.5% agarose gels to confirm the DNA
template was completely digested. Then, 15 μL of
digestion products were mixed with 5 pmol EcoR I
adapter, 50 pmol Hpa II/Msp I adapter (Table 1), 1.5
U T4 ligase and 1.5 μL of 10 × T4 ligation buffer.
ddH2O was added to a final volume of 30 μL and the
solution was incubated at 16 °C for 8 to 16 h for
ligation reaction. Enzymes were afterwards denatured
at 65 °C for 10 min. Negative control samples were
included at all steps to prevent contamination. The
resultant products were diluted 20-fold and used as
templates in the following pre-amplification.
Pre-amplification was conducted in a 20 μL
reaction system containing 2 μL of 10 × PCR reaction
buffer (Tiangen, Beijing, China), 1 μL of dNTPs (2.5
mmol/L), 1.5 U Taq polymerase, 5 μL of diluted
product (as DNA template), 5 μmol/L pre-amplification
primers (EcoR I and Hpa II/Msp I, Table 1), and
ddH2O. The reaction was catalyzed for 29 cycles in a
thermocycler of 94 °C for 30 s, 56 °C for 30 s, and
72 °C for 1 min with a final extension at 72 °C for 10
min. A total of 20 μL volume for the selective
amplification contained 2 μL of 10 × PCR reaction
buffer, 1 μL of dNTPs (2.5 mmol/L), 1.5 U Taq
polymerase, 1 μL of pre-amplification product (as
Table 1. Sequences of adapter and primer used in methylation
sensitive amplification polymorphism (MASP) assay.
Adapter and
primer EcoR I Hpa II/Msp I
Adapter 1 5′-CTCGTAGACTGCG
TACC-3′
5′-GACGATGAGTCTA
GAA-3′
Adapter 2 5′-AATTGGTACGCAG
TCTAC-3′
5′-CGTTCTAGACTCA
TC-3′
Pre-amp primer 5′-GACTGCGTACCAA
T1TCA-3′ (E1)
5′-GATGAGTCTAGAA
CGGT-3′ (HM1)
Sel-amp primer E1 + TA (E01) HM1 + AA (HM31)
E1 + TG (E02) HM1 + AG (HM32)
E1 + TC (E03) HM1 + AC (HM33)
E1 + GA (E04) HM1 + AT (HM34)
E1 + GC (E05) HM1 + GA (HM35)
E1 + GT (E06) HM1 + GT (HM36)
E1 + CA (E07) HM1 + GG (HM37)
E1 + CG (E08) HM1 + GC (HM38)
E1 + CT (E09) HM1 + CA (HM39)
E1 + CC (E10) HM1 + CT (HM310)
E1 + TT (E11) HM1 + CG (HM311)
E1 + GG (E12) HM1 + CC (HM312)
E1 + AG (E13) HM1 + TA (HM313)
E1 + AC (E14) HM1 + TG (HM314)
E1 + AT (E15) HM1 + TC (HM315)
E1 + AA (E16) HM1 + TT (HM316)
ZHENG Xiao-guo, et al. Changes in DNA Methylation Pattern in Drought-Resistant Rice Variety 265
DNA template) and 1 μL of EcoR I selective
amplification primer (10 μmol/L), 1 μL of Hpa II/Msp I
selective amplification primer (10 μmol/L) and 13.5
μL of ddH2O. The selective amplification was
performed with a touchdown program of 94 °C for 30
s, 65 °C for 30 s and 72 °C for 1 min, decreasing the
annealing temperature by 0.7 °C per cycle during 12
cycles and then 24 cycles of 94 °C for 30 s, 56 °C for
30 s and 72 °C for 1 min with a final extension at
72 °C for 10 min. The primers used in selective
amplification are listed in Table 1. The final products
were separated using 6% polyacrylamide gels and
visualized via silver staining (Xu et al, 2002).
Band scoring and data analysis
The two isoschizomers (Msp I and Hpa II) recognize
the same sequence (5′-CCGG-3′) but differ in their
sensitivities to DNA methylation. The scoring of
differential methylation status on a specific site is
based on the presence (scored as 1) or absence (scored
as 0) of bands in the EcoR I/Msp I and EcoR I/Hpa II
lanes. Comparing the two profiles of these two lanes
allows for the assessment of the methylation status of
the restriction sites. In total, there are four types of
band combinations in the two lanes that represent four
types of DNA methylation statuses of the restriction
sites (5′-CCGG-3′) (Table 2). The sites that are free
from methylation are recognized by both isoschizomers
with the band type represented by type I (1, 1). The
full methylation sites (methylation at the internal C
residue of both strands, MeCpG) are only recognized
by Msp I with the band type represented by type II (1,
0). Moreover, plant-specific hemi-MeCpCpG sites
(methylation at the external C residue in one DNA
strand but not in its complement strand) are only
recognized by Hpa II with the band type represented
by type III (0, 1). Sites that are hyper-methylated at
both the internal and external Cs and those are fully
methylated at the external Cs on both strands are cut
by neither two enzymes, and the band type is
represented by type IV (0, 0).
The general DNA methylation level was analyzed
based on two strands of DNA and calculated by the
following formula: (II × 2 + III + IV × 2) / [(I + II +
III + IV) × 2] × 100%, in which II, III and IV were
methylated loci. Any variations in DNA methylation
between generations or treatments could be detected
by comparing the methylation status of the
corresponding samples.
RESULTS
Pattern and level of DNA methylation
The DNA methylation of a total of 4 744 CCGG loci
were assessed by using the 256 MSAP primer-pairs.
The data revealed that more than 65.2% of the total
identified loci were unmethylated, while methylated
loci accounted only for 34.3%–34.8% (Table 3).
Among these methylated loci, full- and hyper-
methylated loci accounted for 83.1%–84.8%, and
hemi-methylated loci accounted for 15.2%–16.9%.
DNA methylation level was 31.4%–32.1%.
Comparison of DNA methylation pattern between
the two developmental stages revealed that the
Table 2. Activity of enzymes and classification of methylation statuses in CpG islands.
Enzyme Free-methylated [I (1, 1)] Full-methylated [II (1, 0)] Hemi-methylated [III (0, 1)] Hyper-methylated [IV (0, 0)]
Sequence CCGG
GGCC
CCGG
GGCC
CCGG
GGCC
CCGGCCGG
GGCCGGCC
Msp I CCGG
GGCC
CCGG
GGCC
Non Non
Hpa II CCGG
GGCC
Non CCGG
GGCC
Non
Classification of methylation was signified in the brackets.
Table 3. DNA methylation patterns and levels of Huhan 3 in
different generations and developmental stages.
Index of methylation G0
G6
21 d 28 d 21 d 28 d
Type I 3 094 3 119 3 099 3 112
Type II 1 280 1 316 1 284 1 317
Type III 251 274 262 272
Type IV 119 35 99 43
Total amplified bands 4 744 4 744 4 744 4 744
DNA methylation level (%) 32.1 31.4 31.9 31.5
Methylated loci a 1 650 1 625 1 645 1 632
MSAP proportion (%) b 34.8 34.3 34.7 34.4
Full- and hyper-methylated loci c 1 399 1 351 1 383 1 360
Type II and IV proportion (%) 84.8 83.1 84.1 83.3
Hemi-methylated loci 251 274 262 272
Type III proportion (%) d 15.2 16.9 15.9 16.7 a Methylated loci = II + III + IV; b MSAP (%) = (II + III + IV) / (I
+ II + III + IV) × 100; c Full- and hyper-methylated loci = II + IV; d
Type III proportion (%) = III / (I + II + III + IV) × 100.
MSAP, Methylation sensitive amplification polymorphism.
266 Rice Science, Vol. 21, No. 5, 2014
proportion of methylated loci and the DNA
methylation level deceased from the three-leaf to
four-leaf stages in both G0 and G6. The proportion of
methylated loci declined by 0.5% and 0.3%, while the
DNA methylation level declined by 0.7% and 0.4%, in
G0 and G6, respectively (Table 3). It is suggested that
G0 had more variations of DNA methylation than G6
at the two developmental stages. Comparison of DNA
methylation pattern between the two generations
uncovered that G0 had a higher DNA methylation
level than G6 at the three-leaf stage. However, at the
four-leaf stage, the DNA methylation level of G0 was
lower than that of G6. Hence, it is likely that different
developmental stages, as well as different generations,
had different DNA methylation levels. The results
indicated that the DNA methylation pattern of G6
changed after growth under drought stress for six
successive generations, and G6 had less variation than
G0 at the two seedling stages.
Analysis of differentially methylated loci (DML)
One hundred and ninety loci, 4.0% of the total 4 744
identified, showed variations in DNA methylation
between different generations or/and between
different developmental stages. Among these 190 loci,
44 and 48 loci had variations in DNA methylation
between generations at three-leaf and four-leaf stages,
respectively. DNA methylation patterns of these loci
were different between G0 and G6, which implied that
the variations in these loci can be attributed to drought
stress domestication. In addition, 132 and 171 loci of
190 loci had variations in DNA methylation between
different developmental stages in G0 and G6,
respectively. DNA methylation patterns of these loci
were different between 21 d (three-leaf stage) and 28
d (four leaf- stage), which implied that the variations
in these loci were related to rice growth and
development (Table 4).
DNA methylation refers to de-methylation (types II
and IV changed to types I and III, and type III
changed to type I), re-methylation (type I changed to
types II, III and IV, and type III changed to types II
and IV) or interchange event (changes between types
II and IV) (Table 4). Compared to G0, G6 de-methylation
occurred more predominantly at three-leaf stage than
re-methylation while the frequency of de-methylation
decreased largely at the four-leaf stage with a
remarkable increase in re-methylation. At the three-
leaf stage, 26 de-methylated loci accounted for 59.1%
of the total 44 loci while re-methylated loci accounted
only for 29.5%. However, the proportion changed at
four-leaf stage, de-methylated loci accounted for
37.5% of the total 48 loci, less than re-methylated loci
(47.9%) (Table 4). In addition, both G0 and G6 had
more de-methylation events than re-methylation
events along with the development of rice plants,
while G0 had more de-methylation events (56.8%) and
less re-methylation events (13.6%) than G6 (48.0%
and 25.7%) (Table 4).
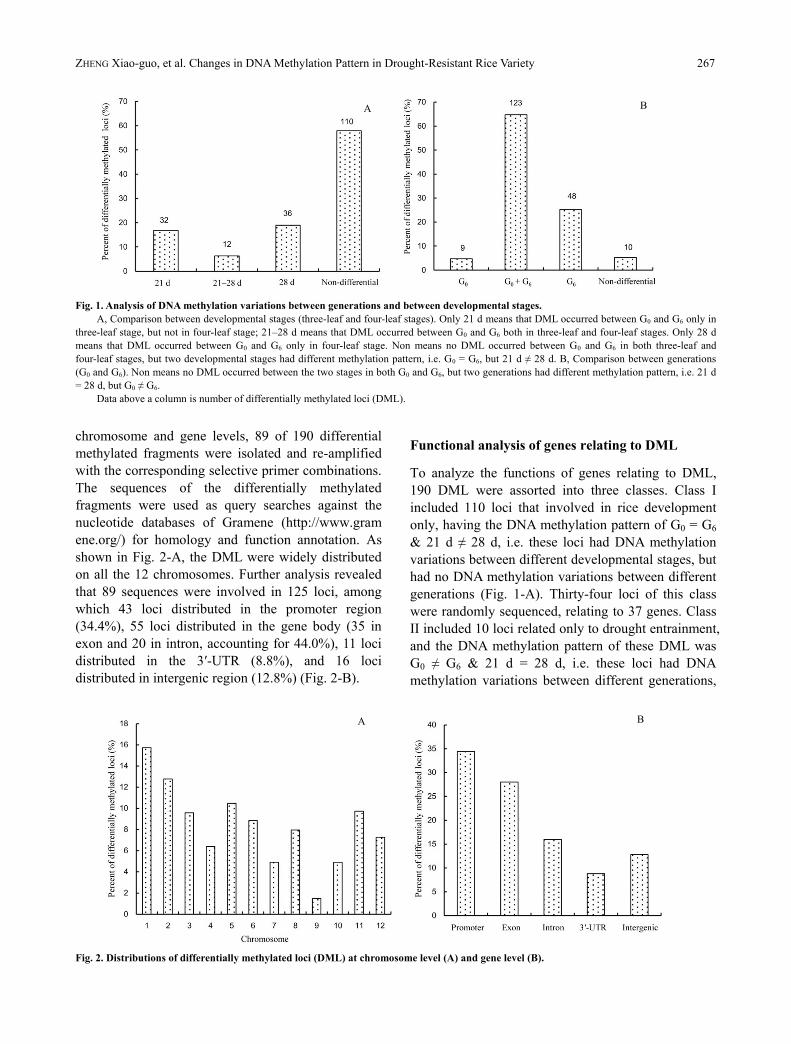
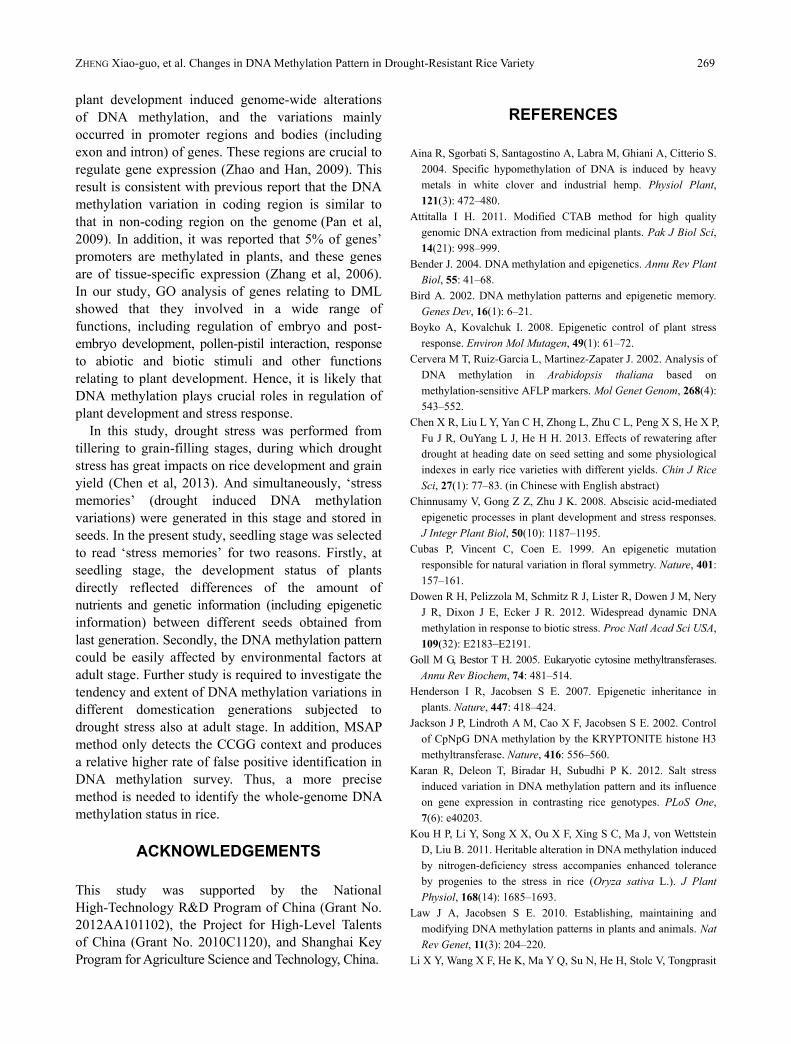
Further analysis of 190 DML revealed that most of
them (57.9%) related only to plant development,
showing no variations between generations (Fig. 1-A).
Their DNA methylation pattern was G0 = G6 and 21 d
≠ 28 d. Among the remained 80 DML (42.1%), whose
DNA methylation pattern was G0 ≠ G6, most occurred
only at the three-leaf stage (40.0%) or the four-leaf
stage (45.0%), and a small proportion occurred both at
the three-leaf and four-leaf stages (15.0%). In addition,
123 DML which had DNA methylation variations
between two developmental stages, occurred in both
G0 and G6. However, for the remained DML, more
occurred in G6 only than in G0 only (Fig. 1-B).
Distributions of DML at chromosome and gene
levels
To characterize the distributions of DML at
Table 4. Variations in DNA methylation between generations and
between developmental stages.
Patterns of variation
Developmental stage
Generation
Original band
type
New band
type 21 d 28 d G0 G6
I (1, 1) II (1, 0) 5 11 5 9
III (0, 1) 5 3 4 1
IV (0, 0) 2 4 9 23
II (1, 0) I (1, 1) 2 3 3 5
III (0, 1) 1 1 0 2
IV (0, 0) 2 7 2 7
III (0, 1) I (1, 1) 1 6 14 16
II (1, 0) 0 0 0 0
IV (0, 0) 1 5 0 11
IV (0, 0) I (1, 1) 15 3 25 25
II (1, 0) 3 0 37 38
III (0, 1) 7 5 33 34
Total band 44 48 132 171
Proportion (%) 23.2 25.3 69.5 90.0
Re-methylated band a 13 23 18 44
Proportion of re-methylation
events (%)
29.5 47.9 13.6 25.7
De-methylated band b 26 18 75 82
Proportion of de-methylation
events (%)
59.1 37.5 56.8 48.0
a Re-methylated bands = Band number of types II, III and IV
changed from type I + band number of types II and IV changed from
type III; b De-methylated bands = Band number of types I and III
changed from types II and IV + band number of type I changed from
type III.
ZHENG Xiao-guo, et al. Changes in DNA Methylation Pattern in Drought-Resistant Rice Variety 267
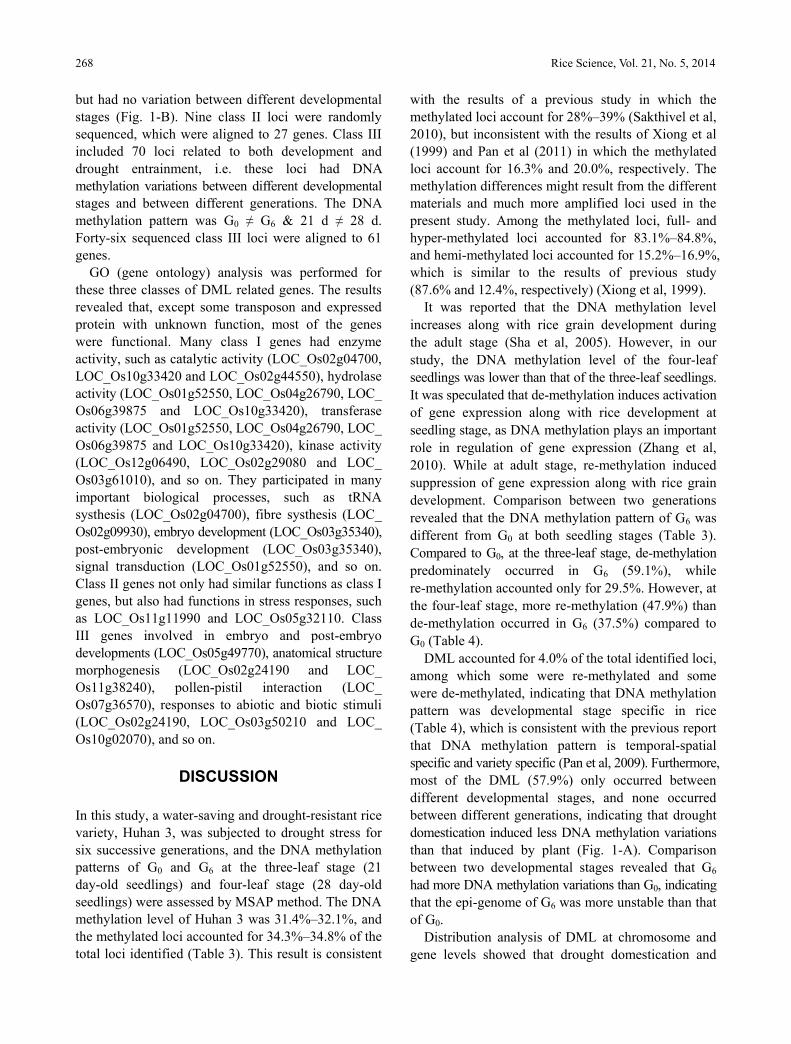
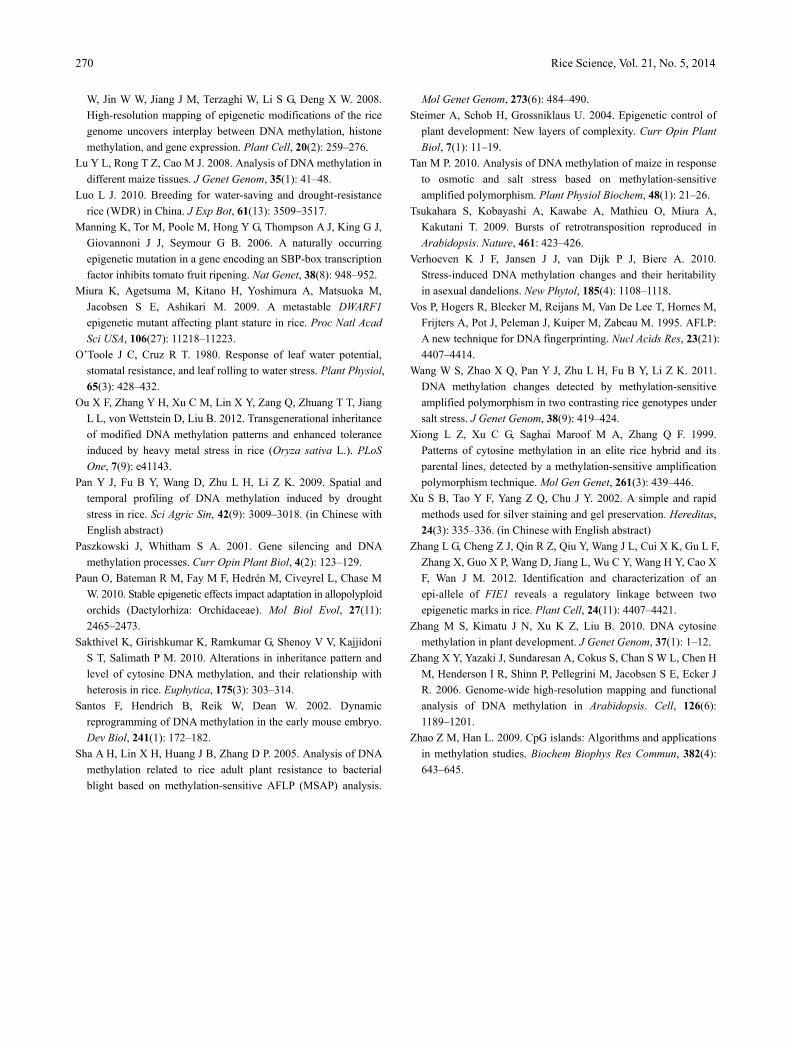
chromosome and gene levels, 89 of 190 differential
methylated fragments were isolated and re-amplified
with the corresponding selective primer combinations.
The sequences of the differentially methylated
fragments were used as query searches against the
nucleotide databases of Gramene (http://www.gram
ene.org/) for homology and function annotation. As
shown in Fig. 2-A, the DML were widely distributed
on all the 12 chromosomes. Further analysis revealed
that 89 sequences were involved in 125 loci, among
which 43 loci distributed in the promoter region
(34.4%), 55 loci distributed in the gene body (35 in
exon and 20 in intron, accounting for 44.0%), 11 loci
distributed in the 3′-UTR (8.8%), and 16 loci
distributed in intergenic region (12.8%) (Fig. 2-B).
Functional analysis of genes relating to DML
To analyze the functions of genes relating to DML,
190 DML were assorted into three classes. Class I
included 110 loci that involved in rice development
only, having the DNA methylation pattern of G0 = G6
& 21 d ≠ 28 d, i.e. these loci had DNA methylation
variations between different developmental stages, but
had no DNA methylation variations between different
generations (Fig. 1-A). Thirty-four loci of this class
were randomly sequenced, relating to 37 genes. Class
II included 10 loci related only to drought entrainment,
and the DNA methylation pattern of these DML was
G0 ≠ G6 & 21 d = 28 d, i.e. these loci had DNA
methylation variations between different generations,
Fig. 2. Distributions of differentially methylated loci (DML) at chromosome level (A) and gene level (B).
A B
Fig. 1. Analysis of DNA methylation variations between generations and between developmental stages.
A, Comparison between developmental stages (three-leaf and four-leaf stages). Only 21 d means that DML occurred between G0 and G6 only in
three-leaf stage, but not in four-leaf stage; 21–28 d means that DML occurred between G0 and G6 both in three-leaf and four-leaf stages. Only 28 d
means that DML occurred between G0 and G6 only in four-leaf stage. Non means no DML occurred between G0 and G6 in both three-leaf and
four-leaf stages, but two developmental stages had different methylation pattern, i.e. G0 = G6, but 21 d ≠ 28 d. B, Comparison between generations
(G0 and G6). Non means no DML occurred between the two stages in both G0 and G6, but two generations had different methylation pattern, i.e. 21 d
= 28 d, but G0 ≠ G6.
Data above a column is number of differentially methylated loci (DML).
A B
268 Rice Science, Vol. 21, No. 5, 2014
but had no variation between different developmental
stages (Fig. 1-B). Nine class II loci were randomly
sequenced, which were aligned to 27 genes. Class III
included 70 loci related to both development and
drought entrainment, i.e. these loci had DNA
methylation variations between different developmental
stages and between different generations. The DNA
methylation pattern was G0 ≠ G6 & 21 d ≠ 28 d.
Forty-six sequenced class III loci were aligned to 61
genes.
GO (gene ontology) analysis was performed for
these three classes of DML related genes. The results
revealed that, except some transposon and expressed
protein with unknown function, most of the genes
were functional. Many class I genes had enzyme
activity, such as catalytic activity (LOC_Os02g04700,
LOC_Os10g33420 and LOC_Os02g44550), hydrolase
activity (LOC_Os01g52550, LOC_Os04g26790, LOC_
Os06g39875 and LOC_Os10g33420), transferase
activity (LOC_Os01g52550, LOC_Os04g26790, LOC_
Os06g39875 and LOC_Os10g33420), kinase activity
(LOC_Os12g06490, LOC_Os02g29080 and LOC_
Os03g61010), and so on. They participated in many
important biological processes, such as tRNA
systhesis (LOC_Os02g04700), fibre systhesis (LOC_
Os02g09930), embryo development (LOC_Os03g35340),
post-embryonic development (LOC_Os03g35340),
signal transduction (LOC_Os01g52550), and so on.
Class II genes not only had similar functions as class I
genes, but also had functions in stress responses, such
as LOC_Os11g11990 and LOC_Os05g32110. Class
III genes involved in embryo and post-embryo
developments (LOC_Os05g49770), anatomical structure
morphogenesis (LOC_Os02g24190 and LOC_
Os11g38240), pollen-pistil interaction (LOC_
Os07g36570), responses to abiotic and biotic stimuli
(LOC_Os02g24190, LOC_Os03g50210 and LOC_
Os10g02070), and so on.
DISCUSSION
In this study, a water-saving and drought-resistant rice
variety, Huhan 3, was subjected to drought stress for
six successive generations, and the DNA methylation
patterns of G0 and G6 at the three-leaf stage (21
day-old seedlings) and four-leaf stage (28 day-old
seedlings) were assessed by MSAP method. The DNA
methylation level of Huhan 3 was 31.4%–32.1%, and
the methylated loci accounted for 34.3%–34.8% of the
total loci identified (Table 3). This result is consistent
with the results of a previous study in which the
methylated loci account for 28%–39% (Sakthivel et al,
2010), but inconsistent with the results of Xiong et al
(1999) and Pan et al (2011) in which the methylated
loci account for 16.3% and 20.0%, respectively. The
methylation differences might result from the different
materials and much more amplified loci used in the
present study. Among the methylated loci, full- and
hyper-methylated loci accounted for 83.1%–84.8%,
and hemi-methylated loci accounted for 15.2%–16.9%,
which is similar to the results of previous study
(87.6% and 12.4%, respectively) (Xiong et al, 1999).
It was reported that the DNA methylation level
increases along with rice grain development during
the adult stage (Sha et al, 2005). However, in our
study, the DNA methylation level of the four-leaf
seedlings was lower than that of the three-leaf seedlings.
It was speculated that de-methylation induces activation
of gene expression along with rice development at
seedling stage, as DNA methylation plays an important
role in regulation of gene expression (Zhang et al,
2010). While at adult stage, re-methylation induced
suppression of gene expression along with rice grain
development. Comparison between two generations
revealed that the DNA methylation pattern of G6 was
different from G0 at both seedling stages (Table 3).
Compared to G0, at the three-leaf stage, de-methylation
predominately occurred in G6 (59.1%), while
re-methylation accounted only for 29.5%. However, at
the four-leaf stage, more re-methylation (47.9%) than
de-methylation occurred in G6 (37.5%) compared to
G0 (Table 4).
DML accounted for 4.0% of the total identified loci,
among which some were re-methylated and some
were de-methylated, indicating that DNA methylation
pattern was developmental stage specific in rice
(Table 4), which is consistent with the previous report
that DNA methylation pattern is temporal-spatial
specific and variety specific (Pan et al, 2009). Furthermore,
most of the DML (57.9%) only occurred between
different developmental stages, and none occurred
between different generations, indicating that drought
domestication induced less DNA methylation variations
than that induced by plant (Fig. 1-A). Comparison
between two developmental stages revealed that G6
had more DNA methylation variations than G0, indicating
that the epi-genome of G6 was more unstable than that
of G0.
Distribution analysis of DML at chromosome and
gene levels showed that drought domestication and
ZHENG Xiao-guo, et al. Changes in DNA Methylation Pattern in Drought-Resistant Rice Variety 269
plant development induced genome-wide alterations
of DNA methylation, and the variations mainly
occurred in promoter regions and bodies (including
exon and intron) of genes. These regions are crucial to
regulate gene expression (Zhao and Han, 2009). This
result is consistent with previous report that the DNA
methylation variation in coding region is similar to
that in non-coding region on the genome (Pan et al,
2009). In addition, it was reported that 5% of genes’
promoters are methylated in plants, and these genes
are of tissue-specific expression (Zhang et al, 2006).
In our study, GO analysis of genes relating to DML
showed that they involved in a wide range of
functions, including regulation of embryo and post-
embryo development, pollen-pistil interaction, response
to abiotic and biotic stimuli and other functions
relating to plant development. Hence, it is likely that
DNA methylation plays crucial roles in regulation of
plant development and stress response.
In this study, drought stress was performed from
tillering to grain-filling stages, during which drought
stress has great impacts on rice development and grain
yield (Chen et al, 2013). And simultaneously, ‘stress
memories’ (drought induced DNA methylation
variations) were generated in this stage and stored in
seeds. In the present study, seedling stage was selected
to read ‘stress memories’ for two reasons. Firstly, at
seedling stage, the development status of plants
directly reflected differences of the amount of
nutrients and genetic information (including epigenetic
information) between different seeds obtained from
last generation. Secondly, the DNA methylation pattern
could be easily affected by environmental factors at
adult stage. Further study is required to investigate the
tendency and extent of DNA methylation variations in
different domestication generations subjected to
drought stress also at adult stage. In addition, MSAP
method only detects the CCGG context and produces
a relative higher rate of false positive identification in
DNA methylation survey. Thus, a more precise
method is needed to identify the whole-genome DNA
methylation status in rice.
ACKNOWLEDGEMENTS
This study was supported by the National
High-Technology R&D Program of China (Grant No.
2012AA101102), the Project for High-Level Talents
of China (Grant No. 2010C1120), and Shanghai Key
Program for Agriculture Science and Technology, China.
REFERENCES
Aina R, Sgorbati S, Santagostino A, Labra M, Ghiani A, Citterio S.
2004. Specific hypomethylation of DNA is induced by heavy
metals in white clover and industrial hemp. Physiol Plant,
121(3): 472–480.
Attitalla I H. 2011. Modified CTAB method for high quality
genomic DNA extraction from medicinal plants. Pak J Biol Sci,
14(21): 998–999.
Bender J. 2004. DNA methylation and epigenetics. Annu Rev Plant
Biol, 55: 41–68.
Bird A. 2002. DNA methylation patterns and epigenetic memory.
Genes Dev, 16(1): 6–21.
Boyko A, Kovalchuk I. 2008. Epigenetic control of plant stress
response. Environ Mol Mutagen, 49(1): 61–72.
Cervera M T, Ruiz-Garcia L, Martinez-Zapater J. 2002. Analysis of
DNA methylation in Arabidopsis thaliana based on
methylation-sensitive AFLP markers. Mol Genet Genom, 268(4):
543–552.
Chen X R, Liu L Y, Yan C H, Zhong L, Zhu C L, Peng X S, He X P,
Fu J R, OuYang L J, He H H. 2013. Effects of rewatering after
drought at heading date on seed setting and some physiological
indexes in early rice varieties with different yields. Chin J Rice
Sci, 27(1): 77–83. (in Chinese with English abstract)
Chinnusamy V, Gong Z Z, Zhu J K. 2008. Abscisic acid-mediated
epigenetic processes in plant development and stress responses.
J Integr Plant Biol, 50(10): 1187–1195.
Cubas P, Vincent C, Coen E. 1999. An epigenetic mutation
responsible for natural variation in floral symmetry. Nature, 401:
157–161.
Dowen R H, Pelizzola M, Schmitz R J, Lister R, Dowen J M, Nery
J R, Dixon J E, Ecker J R. 2012. Widespread dynamic DNA
methylation in response to biotic stress. Proc Natl Acad Sci USA,
109(32): E2183–E2191.
Goll M G, Bestor T H. 2005. Eukaryotic cytosine methyltransferases.
Annu Rev Biochem, 74: 481–514.
Henderson I R, Jacobsen S E. 2007. Epigenetic inheritance in
plants. Nature, 447: 418–424.
Jackson J P, Lindroth A M, Cao X F, Jacobsen S E. 2002. Control
of CpNpG DNA methylation by the KRYPTONITE histone H3
methyltransferase. Nature, 416: 556–560.
Karan R, Deleon T, Biradar H, Subudhi P K. 2012. Salt stress
induced variation in DNA methylation pattern and its influence
on gene expression in contrasting rice genotypes. PLoS One,
7(6): e40203.
Kou H P, Li Y, Song X X, Ou X F, Xing S C, Ma J, von Wettstein
D, Liu B. 2011. Heritable alteration in DNA methylation induced
by nitrogen-deficiency stress accompanies enhanced tolerance
by progenies to the stress in rice (Oryza sativa L.). J Plant
Physiol, 168(14): 1685–1693.
Law J A, Jacobsen S E. 2010. Establishing, maintaining and
modifying DNA methylation patterns in plants and animals. Nat
Rev Genet, 11(3): 204–220.
Li X Y, Wang X F, He K, Ma Y Q, Su N, He H, Stolc V, Tongprasit
270 Rice Science, Vol. 21, No. 5, 2014
W, Jin W W, Jiang J M, Terzaghi W, Li S G, Deng X W. 2008.
High-resolution mapping of epigenetic modifications of the rice
genome uncovers interplay between DNA methylation, histone
methylation, and gene expression. Plant Cell, 20(2): 259–276.
Lu Y L, Rong T Z, Cao M J. 2008. Analysis of DNA methylation in
different maize tissues. J Genet Genom, 35(1): 41–48.
Luo L J. 2010. Breeding for water-saving and drought-resistance
rice (WDR) in China. J Exp Bot, 61(13): 3509–3517.
Manning K, Tor M, Poole M, Hong Y G, Thompson A J, King G J,
Giovannoni J J, Seymour G B. 2006. A naturally occurring
epigenetic mutation in a gene encoding an SBP-box transcription
factor inhibits tomato fruit ripening. Nat Genet, 38(8): 948–952.
Miura K, Agetsuma M, Kitano H, Yoshimura A, Matsuoka M,
Jacobsen S E, Ashikari M. 2009. A metastable DWARF1
epigenetic mutant affecting plant stature in rice. Proc Natl Acad
Sci USA, 106(27): 11218–11223.
O’Toole J C, Cruz R T. 1980. Response of leaf water potential,
stomatal resistance, and leaf rolling to water stress. Plant Physiol,
65(3): 428–432.
Ou X F, Zhang Y H, Xu C M, Lin X Y, Zang Q, Zhuang T T, Jiang
L L, von Wettstein D, Liu B. 2012. Transgenerational inheritance
of modified DNA methylation patterns and enhanced tolerance
induced by heavy metal stress in rice (Oryza sativa L.). PLoS
One, 7(9): e41143.
Pan Y J, Fu B Y, Wang D, Zhu L H, Li Z K. 2009. Spatial and
temporal profiling of DNA methylation induced by drought
stress in rice. Sci Agric Sin, 42(9): 3009–3018. (in Chinese with
English abstract)
Paszkowski J, Whitham S A. 2001. Gene silencing and DNA
methylation processes. Curr Opin Plant Biol, 4(2): 123–129.
Paun O, Bateman R M, Fay M F, Hedrén M, Civeyrel L, Chase M
W. 2010. Stable epigenetic effects impact adaptation in allopolyploid
orchids (Dactylorhiza: Orchidaceae). Mol Biol Evol, 27(11):
2465–2473.
Sakthivel K, Girishkumar K, Ramkumar G, Shenoy V V, Kajjidoni
S T, Salimath P M. 2010. Alterations in inheritance pattern and
level of cytosine DNA methylation, and their relationship with
heterosis in rice. Euphytica, 175(3): 303–314.
Santos F, Hendrich B, Reik W, Dean W. 2002. Dynamic
reprogramming of DNA methylation in the early mouse embryo.
Dev Biol, 241(1): 172–182.
Sha A H, Lin X H, Huang J B, Zhang D P. 2005. Analysis of DNA
methylation related to rice adult plant resistance to bacterial
blight based on methylation-sensitive AFLP (MSAP) analysis.
Mol Genet Genom, 273(6): 484–490.
Steimer A, Schob H, Grossniklaus U. 2004. Epigenetic control of
plant development: New layers of complexity. Curr Opin Plant
Biol, 7(1): 11–19.
Tan M P. 2010. Analysis of DNA methylation of maize in response
to osmotic and salt stress based on methylation-sensitive
amplified polymorphism. Plant Physiol Biochem, 48(1): 21–26.
Tsukahara S, Kobayashi A, Kawabe A, Mathieu O, Miura A,
Kakutani T. 2009. Bursts of retrotransposition reproduced in
Arabidopsis. Nature, 461: 423–426.
Verhoeven K J F, Jansen J J, van Dijk P J, Biere A. 2010.
Stress-induced DNA methylation changes and their heritability
in asexual dandelions. New Phytol, 185(4): 1108–1118.
Vos P, Hogers R, Bleeker M, Reijans M, Van De Lee T, Hornes M,
Frijters A, Pot J, Peleman J, Kuiper M, Zabeau M. 1995. AFLP:
A new technique for DNA fingerprinting. Nucl Acids Res, 23(21):
4407–4414.
Wang W S, Zhao X Q, Pan Y J, Zhu L H, Fu B Y, Li Z K. 2011.
DNA methylation changes detected by methylation-sensitive
amplified polymorphism in two contrasting rice genotypes under
salt stress. J Genet Genom, 38(9): 419–424.
Xiong L Z, Xu C G, Saghai Maroof M A, Zhang Q F. 1999.
Patterns of cytosine methylation in an elite rice hybrid and its
parental lines, detected by a methylation-sensitive amplification
polymorphism technique. Mol Gen Genet, 261(3): 439–446.
Xu S B, Tao Y F, Yang Z Q, Chu J Y. 2002. A simple and rapid
methods used for silver staining and gel preservation. Hereditas,
24(3): 335–336. (in Chinese with English abstract)
Zhang L G, Cheng Z J, Qin R Z, Qiu Y, Wang J L, Cui X K, Gu L F,
Zhang X, Guo X P, Wang D, Jiang L, Wu C Y, Wang H Y, Cao X
F, Wan J M. 2012. Identification and characterization of an
epi-allele of FIE1 reveals a regulatory linkage between two
epigenetic marks in rice. Plant Cell, 24(11): 4407–4421.
Zhang M S, Kimatu J N, Xu K Z, Liu B. 2010. DNA cytosine
methylation in plant development. J Genet Genom, 37(1): 1–12.
Zhang X Y, Yazaki J, Sundaresan A, Cokus S, Chan S W L, Chen H
M, Henderson I R, Shinn P, Pellegrini M, Jacobsen S E, Ecker J
R. 2006. Genome-wide high-resolution mapping and functional
analysis of DNA methylation in Arabidopsis. Cell, 126(6):
1189–1201.
Zhao Z M, Han L. 2009. CpG islands: Algorithms and applications
in methylation studies. Biochem Biophys Res Commun, 382(4):
643–645.