chamkarmon market review vtrust appraisal english
DESCRIPTION
A recent increase of approved development projects, es-pecially residential and commercial complexes such as townhouses and condominiums, has pushed the prices of land throughout the Capital to rise markedly by 10% y-o-y, reaching US$2,000 to US$3,500 per sqm on sub-streets and US$4,000 to US$6,000 per sqm on major streets in the prime commercial district of Phnom Penh’s Chamkarmon. In the first half of 2015, about 20 condominium projects most of which are concentrated in Chamkarmon district were launched and kicked off the construction and offered off-plan sales to both local and international buyers.TRANSCRIPT
1
VTRUST Journal of Real Estate 26 October, 2015 Volume 1, Issue 3
VTRUST Appraisal Co., Ltd. | Tel: (+855)-23-220-098 / Email: [email protected]
Century 21 Mekong | Tel: (+855)23-966-577 / Email: [email protected]
Market Summary
A recent increase of approved development projects, es-pecially residential and commercial complexes such as townhouses and condominiums, has pushed the prices of land throughout the Capital to rise markedly by 10% y-o-y, reaching US$2,000 to US$3,500 per sqm on sub-streets and US$4,000 to US$6,000 per sqm on major streets in the prime commercial district of Phnom Penh’s Chamkarmon.
In the first half of 2015, about 20 condominium projects most of which are concentrated in Chamkarmon district were launched and kicked off the construction and offered off-plan sales to both local and international buyers.
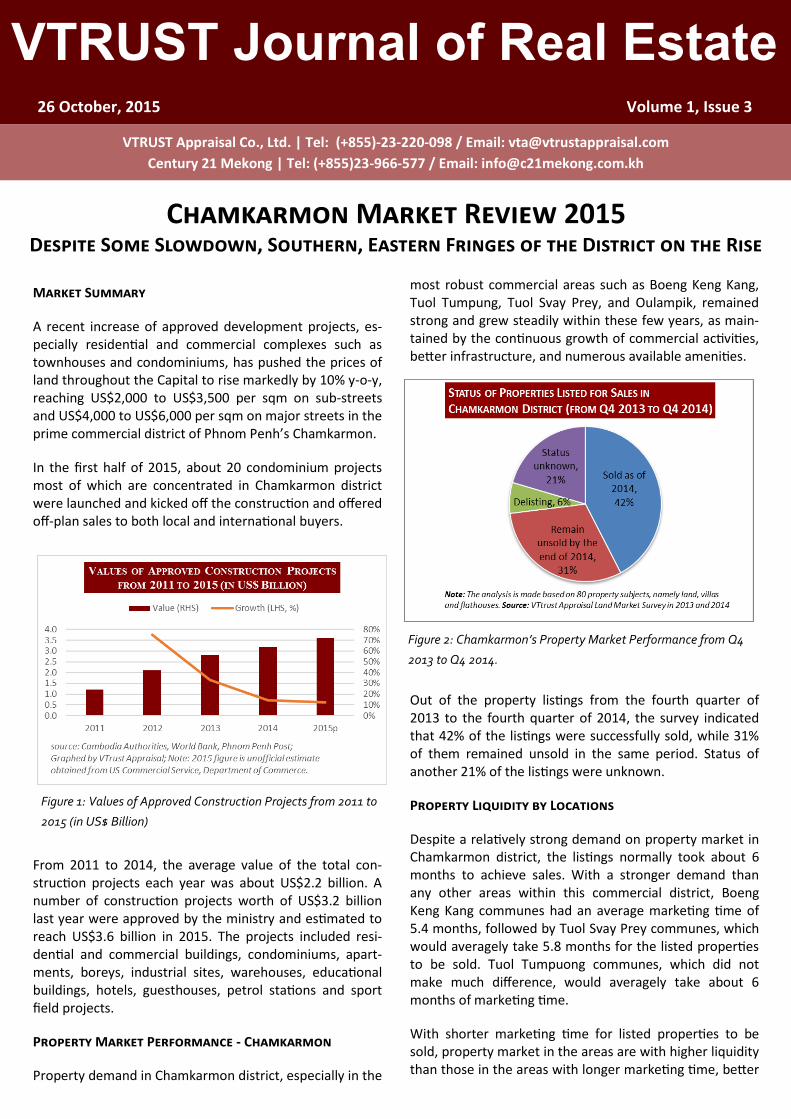
From 2011 to 2014, the average value of the total con-struction projects each year was about US$2.2 billion. A number of construction projects worth of US$3.2 billion last year were approved by the ministry and estimated to reach US$3.6 billion in 2015. The projects included resi-dential and commercial buildings, condominiums, apart-ments, boreys, industrial sites, warehouses, educational buildings, hotels, guesthouses, petrol stations and sport field projects.
Property Market Performance - Chamkarmon
Property demand in Chamkarmon district, especially in the
most robust commercial areas such as Boeng Keng Kang, Tuol Tumpung, Tuol Svay Prey, and Oulampik, remained strong and grew steadily within these few years, as main-tained by the continuous growth of commercial activities, better infrastructure, and numerous available amenities.
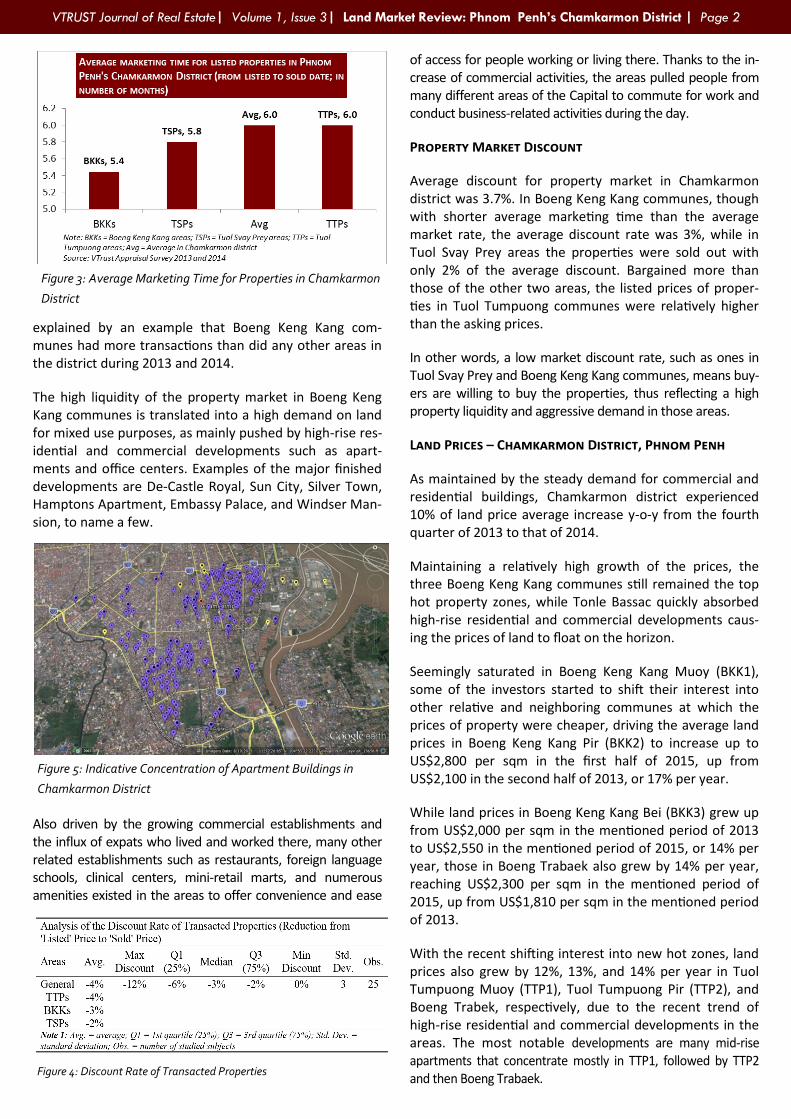
Out of the property listings from the fourth quarter of 2013 to the fourth quarter of 2014, the survey indicated that 42% of the listings were successfully sold, while 31% of them remained unsold in the same period. Status of another 21% of the listings were unknown.
Property Liquidity by Locations
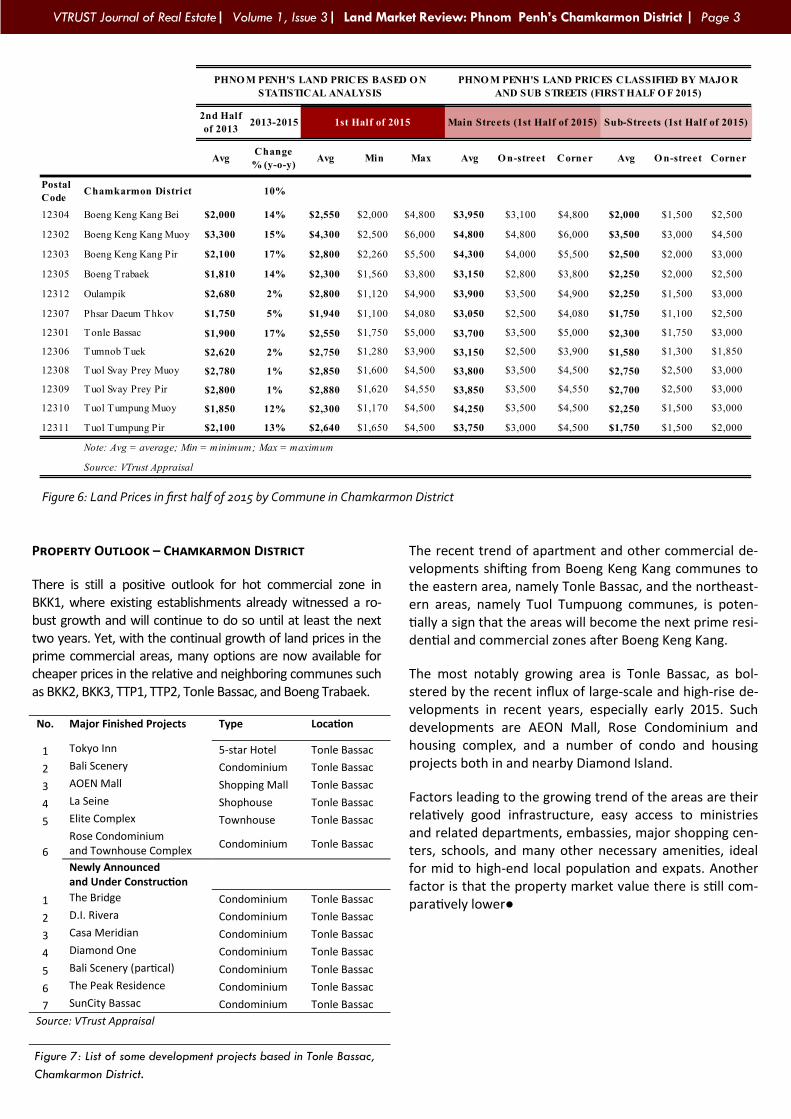
Despite a relatively strong demand on property market in Chamkarmon district, the listings normally took about 6 months to achieve sales. With a stronger demand than any other areas within this commercial district, Boeng Keng Kang communes had an average marketing time of 5.4 months, followed by Tuol Svay Prey communes, which would averagely take 5.8 months for the listed properties to be sold. Tuol Tumpuong communes, which did not make much difference, would averagely take about 6 months of marketing time.
With shorter marketing time for listed properties to be sold, property market in the areas are with higher liquidity than those in the areas with longer marketing time, better
Chamkarmon Market Review 2015 Despite Some Slowdown, Southern, Eastern Fringes of the District on the Rise
Figure 1: Values of Approved Construction Projects from 2011 to
2015 (in US$ Billion)
Figure 2: Chamkarmon’s Property Market Performance from Q4
2013 to Q4 2014.
2 VTRUST Journal of Real Estate| Volume 1, Issue 3| Land Market Review: Phnom Penh’s Chamkarmon District | Page 2
explained by an example that Boeng Keng Kang com-munes had more transactions than did any other areas in the district during 2013 and 2014.
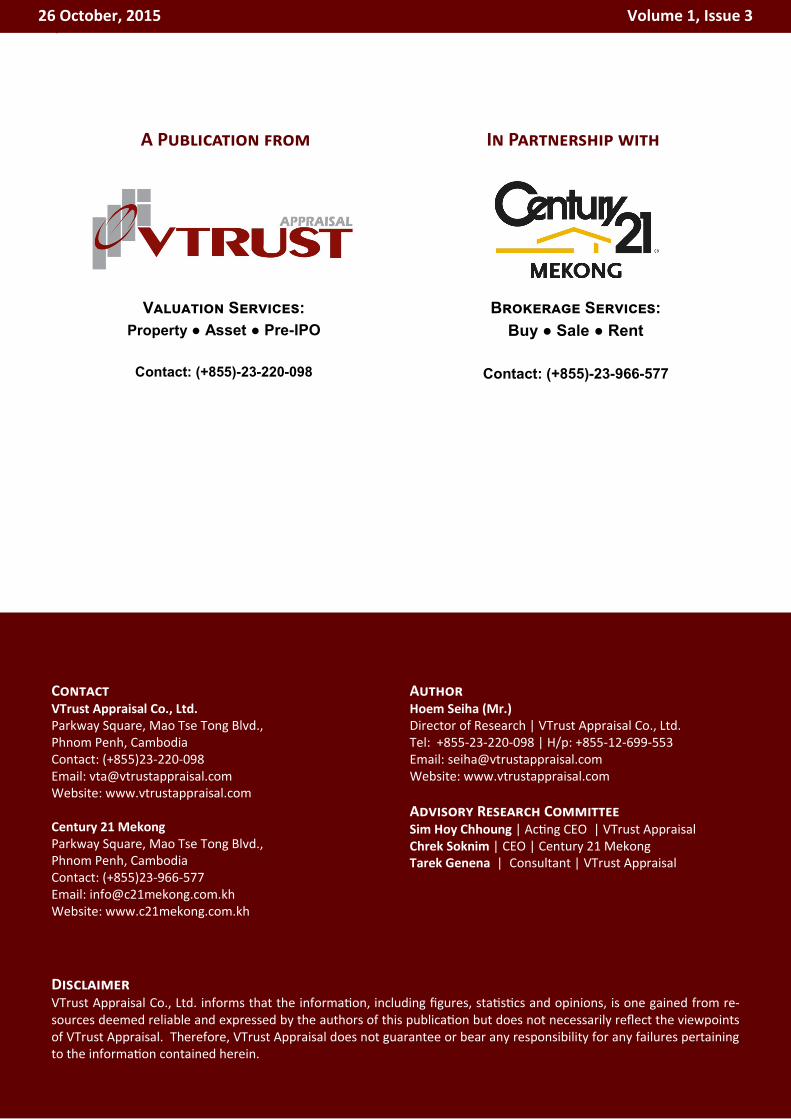
The high liquidity of the property market in Boeng Keng Kang communes is translated into a high demand on land for mixed use purposes, as mainly pushed by high-rise res-idential and commercial developments such as apart-ments and office centers. Examples of the major finished developments are De-Castle Royal, Sun City, Silver Town, Hamptons Apartment, Embassy Palace, and Windser Man-sion, to name a few.
Also driven by the growing commercial establishments and the influx of expats who lived and worked there, many other related establishments such as restaurants, foreign language schools, clinical centers, mini-retail marts, and numerous amenities existed in the areas to offer convenience and ease
of access for people working or living there. Thanks to the in-crease of commercial activities, the areas pulled people from many different areas of the Capital to commute for work and conduct business-related activities during the day.
Property Market Discount
Average discount for property market in Chamkarmon district was 3.7%. In Boeng Keng Kang communes, though with shorter average marketing time than the average market rate, the average discount rate was 3%, while in Tuol Svay Prey areas the properties were sold out with only 2% of the average discount. Bargained more than those of the other two areas, the listed prices of proper-ties in Tuol Tumpuong communes were relatively higher than the asking prices.
In other words, a low market discount rate, such as ones in Tuol Svay Prey and Boeng Keng Kang communes, means buy-ers are willing to buy the properties, thus reflecting a high property liquidity and aggressive demand in those areas.
Land Prices – Chamkarmon District, Phnom Penh
As maintained by the steady demand for commercial and residential buildings, Chamkarmon district experienced 10% of land price average increase y-o-y from the fourth quarter of 2013 to that of 2014.
Maintaining a relatively high growth of the prices, the three Boeng Keng Kang communes still remained the top hot property zones, while Tonle Bassac quickly absorbed high-rise residential and commercial developments caus-ing the prices of land to float on the horizon.
Seemingly saturated in Boeng Keng Kang Muoy (BKK1), some of the investors started to shift their interest into other relative and neighboring communes at which the prices of property were cheaper, driving the average land prices in Boeng Keng Kang Pir (BKK2) to increase up to US$2,800 per sqm in the first half of 2015, up from US$2,100 in the second half of 2013, or 17% per year.
While land prices in Boeng Keng Kang Bei (BKK3) grew up from US$2,000 per sqm in the mentioned period of 2013 to US$2,550 in the mentioned period of 2015, or 14% per year, those in Boeng Trabaek also grew by 14% per year, reaching US$2,300 per sqm in the mentioned period of 2015, up from US$1,810 per sqm in the mentioned period of 2013.
With the recent shifting interest into new hot zones, land prices also grew by 12%, 13%, and 14% per year in Tuol Tumpuong Muoy (TTP1), Tuol Tumpuong Pir (TTP2), and Boeng Trabek, respectively, due to the recent trend of high-rise residential and commercial developments in the areas. The most notable developments are many mid-rise apartments that concentrate mostly in TTP1, followed by TTP2 and then Boeng Trabaek.
Figure 3: Average Marketing Time for Properties in Chamkarmon
District
Figure 5: Indicative Concentration of Apartment Buildings in
Chamkarmon District
Figure 4: Discount Rate of Transacted Properties
3 VTRUST Journal of Real Estate| Volume 1, Issue 3| Land Market Review: Phnom Penh’s Chamkarmon District | Page 2 VTRUST Journal of Real Estate| Volume 1, Issue 3| Land Market Review: Phnom Penh’s Chamkarmon District | Page 3
Property Outlook – Chamkarmon District
There is still a positive outlook for hot commercial zone in BKK1, where existing establishments already witnessed a ro-bust growth and will continue to do so until at least the next two years. Yet, with the continual growth of land prices in the prime commercial areas, many options are now available for cheaper prices in the relative and neighboring communes such as BKK2, BKK3, TTP1, TTP2, Tonle Bassac, and Boeng Trabaek.
The recent trend of apartment and other commercial de-velopments shifting from Boeng Keng Kang communes to the eastern area, namely Tonle Bassac, and the northeast-ern areas, namely Tuol Tumpuong communes, is poten-tially a sign that the areas will become the next prime resi-dential and commercial zones after Boeng Keng Kang.
The most notably growing area is Tonle Bassac, as bol-stered by the recent influx of large-scale and high-rise de-velopments in recent years, especially early 2015. Such developments are AEON Mall, Rose Condominium and housing complex, and a number of condo and housing projects both in and nearby Diamond Island.
Factors leading to the growing trend of the areas are their relatively good infrastructure, easy access to ministries and related departments, embassies, major shopping cen-ters, schools, and many other necessary amenities, ideal for mid to high-end local population and expats. Another factor is that the property market value there is still com-paratively lower●
No. Major Finished Projects Type Location
1 Tokyo Inn 5-star Hotel Tonle Bassac
2 Bali Scenery Condominium Tonle Bassac
3 AOEN Mall Shopping Mall Tonle Bassac
4 La Seine Shophouse Tonle Bassac
5 Elite Complex Townhouse Tonle Bassac
6
Rose Condominium and Townhouse Complex
Condominium Tonle Bassac
Newly Announced and Under Construction
1 The Bridge Condominium Tonle Bassac
2 D.I. Rivera Condominium Tonle Bassac
3 Casa Meridian Condominium Tonle Bassac
4 Diamond One Condominium Tonle Bassac
5 Bali Scenery (partical) Condominium Tonle Bassac
6 The Peak Residence Condominium Tonle Bassac
7 SunCity Bassac Condominium Tonle Bassac
Source: VTrust Appraisal
Figure 7: List of some development projects based in Tonle Bassac,
Chamkarmon District.
Figure 6: Land Prices in first half of 2015 by Commune in Chamkarmon District
AvgChange
% (y-o-y)Avg Min Max Avg O n-street Corner Avg O n-street Corner
Postal
CodeChamkarmon District 10%
12304 Boeng Keng Kang Bei $2,000 14% $2,550 $2,000 $4,800 $3,950 $3,100 $4,800 $2,000 $1,500 $2,500
12302 Boeng Keng Kang Muoy $3,300 15% $4,300 $2,500 $6,000 $4,800 $4,800 $6,000 $3,500 $3,000 $4,500
12303 Boeng Keng Kang Pir $2,100 17% $2,800 $2,260 $5,500 $4,300 $4,000 $5,500 $2,500 $2,000 $3,000
12305 Boeng Trabaek $1,810 14% $2,300 $1,560 $3,800 $3,150 $2,800 $3,800 $2,250 $2,000 $2,500
12312 Oulampik $2,680 2% $2,800 $1,120 $4,900 $3,900 $3,500 $4,900 $2,250 $1,500 $3,000
12307 Phsar Daeum Thkov $1,750 5% $1,940 $1,100 $4,080 $3,050 $2,500 $4,080 $1,750 $1,100 $2,500
12301 Tonle Bassac $1,900 17% $2,550 $1,750 $5,000 $3,700 $3,500 $5,000 $2,300 $1,750 $3,000
12306 Tumnob Tuek $2,620 2% $2,750 $1,280 $3,900 $3,150 $2,500 $3,900 $1,580 $1,300 $1,850
12308 Tuol Svay Prey Muoy $2,780 1% $2,850 $1,600 $4,500 $3,800 $3,500 $4,500 $2,750 $2,500 $3,000
12309 Tuol Svay Prey Pir $2,800 1% $2,880 $1,620 $4,550 $3,850 $3,500 $4,550 $2,700 $2,500 $3,000
12310 Tuol Tumpung Muoy $1,850 12% $2,300 $1,170 $4,500 $4,250 $3,500 $4,500 $2,250 $1,500 $3,000
12311 Tuol Tumpung Pir $2,100 13% $2,640 $1,650 $4,500 $3,750 $3,000 $4,500 $1,750 $1,500 $2,000
Note: Avg = average; Min = minimum; Max = maximum
Source: VTrust Appraisal
PHNO M PENH'S LAND PRICES BASED O N
STATISTICAL ANALYSIS
PHNO M PENH'S LAND PRICES CLASSIFIED BY MAJO R
AND SUB STREETS (FIRST HALF O F 2015)
2nd Half
of 2013Main Streets (1st Half of 2015) Sub-Streets (1st Half of 2015)2013-2015 1st Half of 2015
4
Contact VTrust Appraisal Co., Ltd. Parkway Square, Mao Tse Tong Blvd., Phnom Penh, Cambodia Contact: (+855)23-220-098 Email: [email protected] Website: www.vtrustappraisal.com Century 21 Mekong Parkway Square, Mao Tse Tong Blvd., Phnom Penh, Cambodia Contact: (+855)23-966-577 Email: [email protected] Website: www.c21mekong.com.kh
Author Hoem Seiha (Mr.) Director of Research | VTrust Appraisal Co., Ltd. Tel: +855-23-220-098 | H/p: +855-12-699-553 Email: [email protected] Website: www.vtrustappraisal.com
Advisory Research Committee Sim Hoy Chhoung | Acting CEO | VTrust Appraisal Chrek Soknim | CEO | Century 21 Mekong Tarek Genena | Consultant | VTrust Appraisal
26 October, 2015 Volume 1, Issue 3
A Publication from In Partnership with
Disclaimer VTrust Appraisal Co., Ltd. informs that the information, including figures, statistics and opinions, is one gained from re-sources deemed reliable and expressed by the authors of this publication but does not necessarily reflect the viewpoints of VTrust Appraisal. Therefore, VTrust Appraisal does not guarantee or bear any responsibility for any failures pertaining to the information contained herein.
Valuation Services:
Property ● Asset ● Pre-IPO
Contact: (+855)-23-220-098
Brokerage Services:
Buy ● Sale ● Rent
Contact: (+855)-23-966-577