challenges of soil nutrient management - alberta · challenges of soil nutrient management ......
TRANSCRIPT

Challenges of Soil Nutrient Management
Ross H. McKenzieAgriculture Research Div.
Alberta Agriculture
Agronomy UpdateLethbridge, AB
Jan 18, 2011

Outline:
1. Effects of weather conditions on soils.2. What happened to nutrients in 2010?3. What management changes could be considered?4. Ortho vs Polyphosphate fertilizer –facts vs myths5. Variable Rate Fertilizer application and
Understanding nutrient variability in the field6. Planning your fertilizer options for 2011.

Soil Fertility and Plant Nutrition
• Nitrogen (N), phosphorus (P) are frequently deficient• Potassium (K) is occasionally deficient• Sulphur (S) is occasionally deficient on dryland with
Canola being of greater concern• Micronutrients – rarely required

Effect of Weather on Soil Factors

Precipitation at Lethbridge

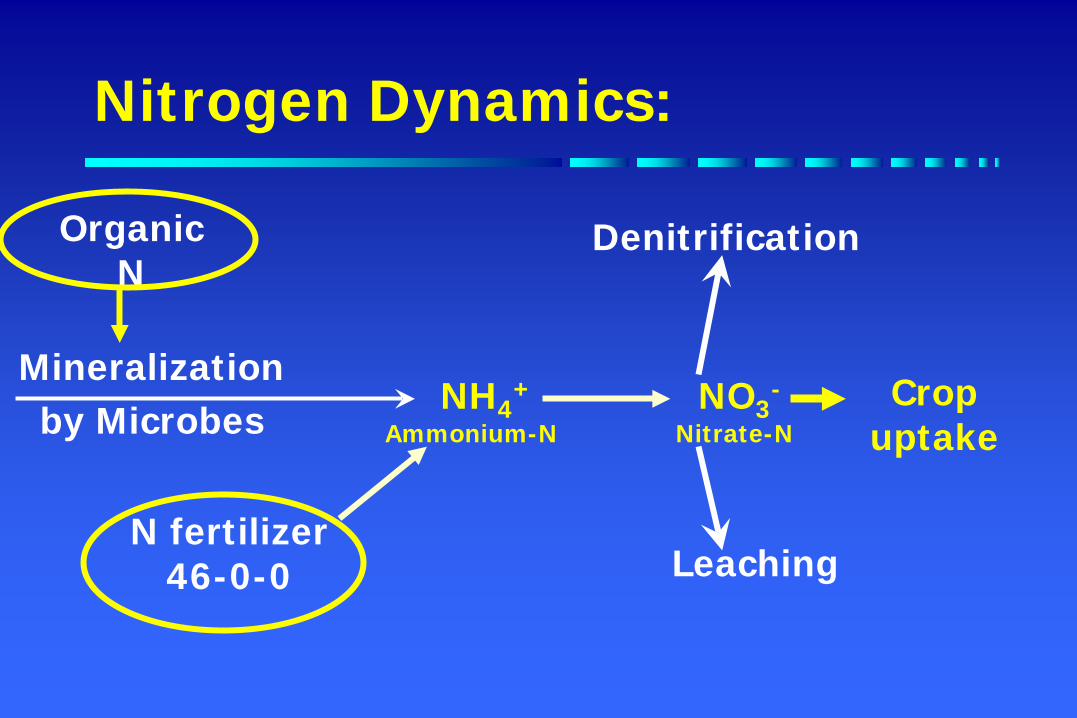
Nitrogen Dynamics:
NH4+ NO3
-
Ammonium-N Nitrate-N
OrganicN
Mineralizationby Microbes
Denitrification
Leaching
Cropuptake
N fertilizer46-0-0
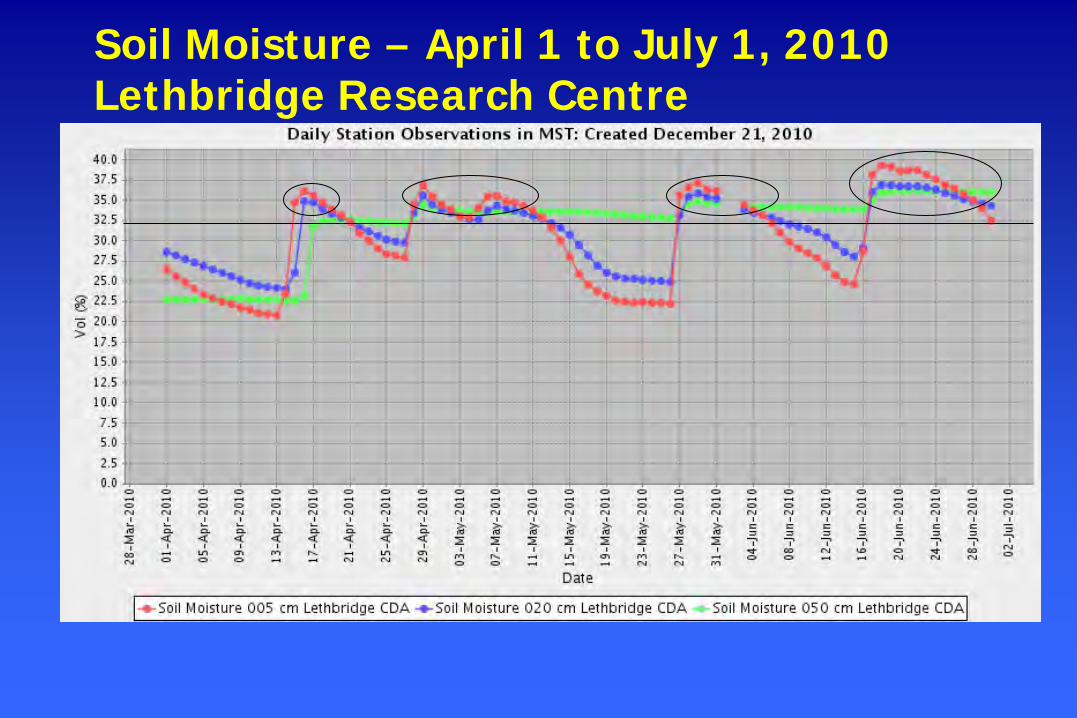
Soil Moisture – April 1 to July 1, 2010Lethbridge Research Centre

Soil Temperature

Summary of Environmental Conditions
• Most areas of southern Alberta received 200 to >300 mm of precipitation between April 13 and June 22
• Had relatively warm soil temperatures in June• Had about 30 to 45 days when soils were at or
above field capacity –• Result - high potential for:
–Leaching–Denitrification

2. What happened to nutrients in 2010?

Effect of Weather on Crops• Excess soil water affected soil Nitrate N:
• Potential leaching - reduced nitrate-N level in soil• Potential denitrification - reduced nitrate-N level in soil.
• Crops suffered:– Due to a lack of Oxygen and Excess Water – Due to limited up-take of adequate N amounts from soil
• Yellowing of Crops – Causes:– Cool temperatures – induced crop stress and yellowing– Saturated soils – caused lack of Oxygen– Saturated soils – crops aren’t taking up water and therefore
aren’t taking up nitrate-N

Examples of Nitrate-N Leaching(lb NO3/ac)Depth Corn Canola0-6” 80 376-12 85 2712-24 112 5524-36 67 4736-48 50 4948-60” 37 43Total 431 258
Irrigated fields between Coaldale and Taber – sampled in late Nov 2010

Lesson from this:
• Soil sample selected fields to determine residual soil N levels–You may need to reduce N fertilizer rates
for some fields next spring!

What could have been done to reduce N losses?
Possible Options:• Band N fertilizer – reduced N loss with banded versus
broadcast/incorporated fertilizer• Use higher N fertilizer rates ? NO - Is a risky option
– could have been a drier than normal year as predicted• Use slow N release fertilizer such as ESN
– This a sensible option – but is this economical to do every year?
– Agrotain likely would have had minimal benefit

Nitrogen Management in June• Did you need to apply more N fertilizer in June or early July?
– Possibly – but wet field conditions were a limiting factor!• How?
– In-crop Broadcast Application of Granular Urea (46-0-0)• Relatively high risk of volatilization (gassing off of urea)• Broadcast Agrotain coated urea at ~30 to 40 lb N/ac• Need rain to move the fertilizer into the soil
– Liquid UAN (28-0-0)• Apply using jet stream nozzles at ~30 to 40 lb N/ac • If soil surface was moist – best to add Agrotain to minimize
volatilization• Some crop burning will occur
• Always leave check strip in each field to assess the benefit

How long before in-crop applied N fertilizer is available to plants?
• For 28-0-0– 25% is available after it is moved into the soil by rain– Rest will release over ~2 to 3 weeks
• For 46-0-0– ~2 to 3 weeks after rains move it into soil
• Agrotain would protect from gassing off of urea!
• Surface Broadcast ESN - NOT Recommended – release time would be too slow

Why were crop yields relatively good despite excess rain and N losses?
• Soils were warm and moist throughout the growing season – ideal for microbial breakdown of soil organic matter!
• Result – Likely much greater mineralization and conversion of organic N to nitrate-N for crop growth this year– Yields were still relatively good – but quality was
marginal with lower protein, frost damage, etc.

Environmental Affects with Other Nutrients:
• Phosphorus (PO4-3) & Potassium (K+) – Neither form will
leach - Minimal concerns with availability – wet conditions may have reduced availability
• Sulphate – (SO4- ) – Significant leaching potential
– Could do an in-crop broadcast application of 21-0-0-24 ammonium sulphate.
• Micronutrient Concerns ?– Minimal affects on reduced micronutrient availability – Generally - excess water, + N and S deficiencies would
be greatest limitations.

Polymer-coatedUrea
Urea
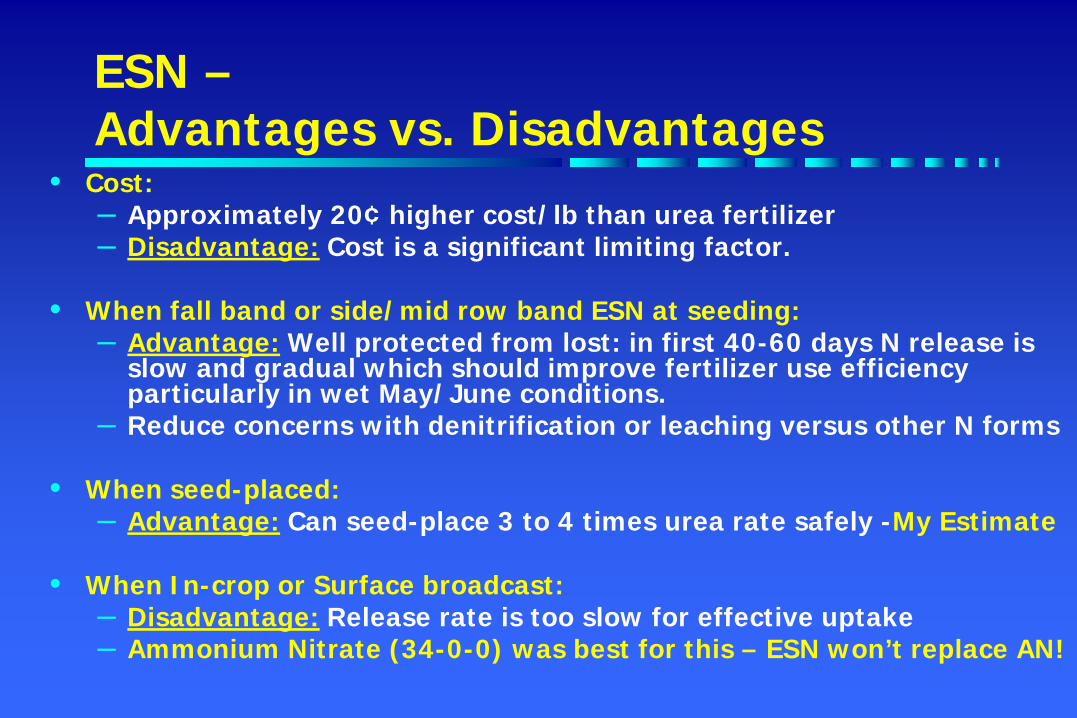
ESN –Advantages vs. Disadvantages
• Cost:– Approximately 20¢ higher cost/lb than urea fertilizer – Disadvantage: Cost is a significant limiting factor.
• When fall band or side/mid row band ESN at seeding:– Advantage: Well protected from lost: in first 40-60 days N release is
slow and gradual which should improve fertilizer use efficiency particularly in wet May/June conditions.
– Reduce concerns with denitrification or leaching versus other N forms
• When seed-placed:– Advantage: Can seed-place 3 to 4 times urea rate safely -My Estimate
• When In-crop or Surface broadcast:– Disadvantage: Release rate is too slow for effective uptake– Ammonium Nitrate (34-0-0) was best for this – ESN won’t replace AN!
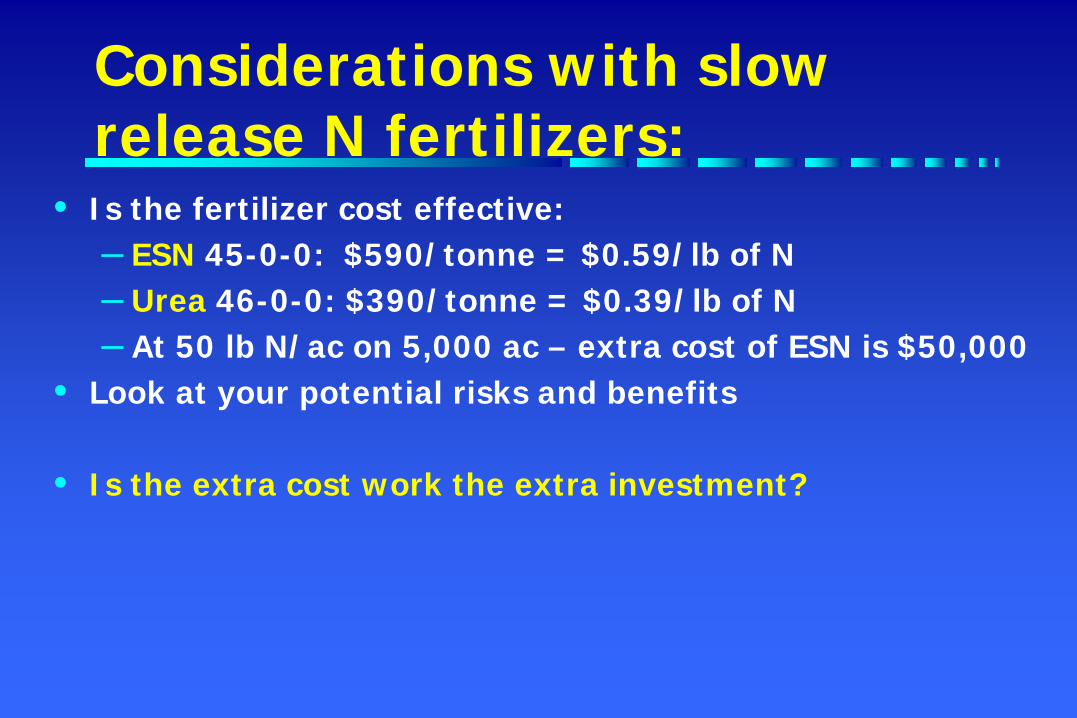
Considerations with slow release N fertilizers:
• Is the fertilizer cost effective:– ESN 45-0-0: $590/tonne = $0.59/lb of N– Urea 46-0-0: $390/tonne = $0.39/lb of N– At 50 lb N/ac on 5,000 ac – extra cost of ESN is $50,000
• Look at your potential risks and benefits
• Is the extra cost work the extra investment?

4. Ortho vs Polyphosphate fertilizer
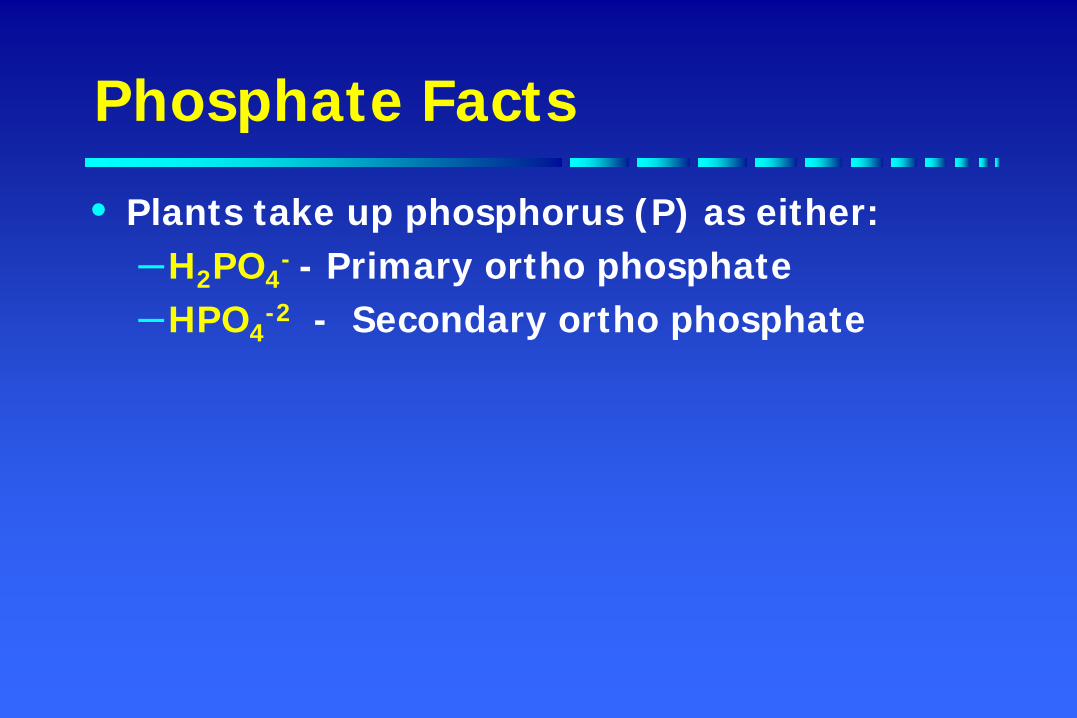
Phosphate Facts
• Plants take up phosphorus (P) as either:–H2PO4
- - Primary ortho phosphate –HPO4
-2 - Secondary ortho phosphate

Phosphate Fertilizer - Types• Granular Mono-ammonium phosphate fertilizer (11-51-0)
– is a very soluble granular product – as the granules dissolve, orthophosphate is released into the soil solution.
– Therefore - readily available in moist soil!• Liquid Phosphorus fertilizer
– 10-34-0: Ammonium phosphate liquid –– P component is composed of about 70% polyphosphate
and 30% orthophosphate. • P is in longer chains with NH4 – is a very soluble
fertilizer that breaks down and releases quickly – Liquid Ortho Phosphate – readily available P form

5. Variable Rate Fertilizer Application
Understanding nutrient variability in the field

Variable Rate Fertilizer Technology
• What is it? Application of different rates of fertilizer on uniquely different soil areas within a field
• Purpose? To optimize fertilizer inputs and crop yield
• Four R’s: Right Source – Time – Place – Rate
• How? Fertilizer rates are changed according to a preset field map developed based on various types of information

What are the potential benefits of VRF application?
• Instead of applying a single rate of fertilizer throughout an entire field, lower rates are applied in less productive areas and more is applied in more productive areas.
• In some cases may apply higher fertilizer rates on less productive areas to gradually improve productivity
• Potential Result – more effective and efficient utilization of fertilizer application and greater economic returns.
• It sounds reasonable in theory – BUT – Need to sort out how to make it work successfully.

Variable Rate Fertilizer Technology
• Have very good engineering technology to apply variable rates of fertilizer accurately over changing landscape
• The key to making VRF technology work is to identify crop management zones– This is not a simple or easy task.
• We have a way to go to sort out how to develop accurate prescription fertilizer maps that are economical.

Soils vary with topography
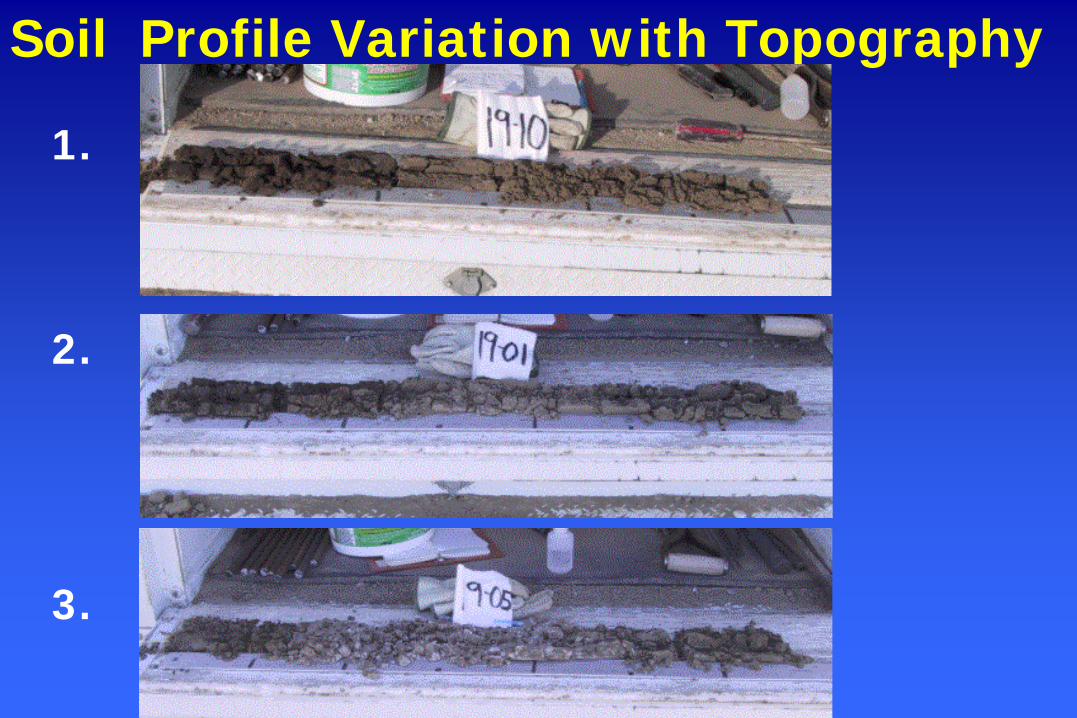
Soil Profile Variation with Topography
1.
2.
3.

Soil Physical and Chemical Characteristics Change with Slope Position
• Depressional area
• Lower slope position
• Mid slope position
• Upper slope position
• Knolls
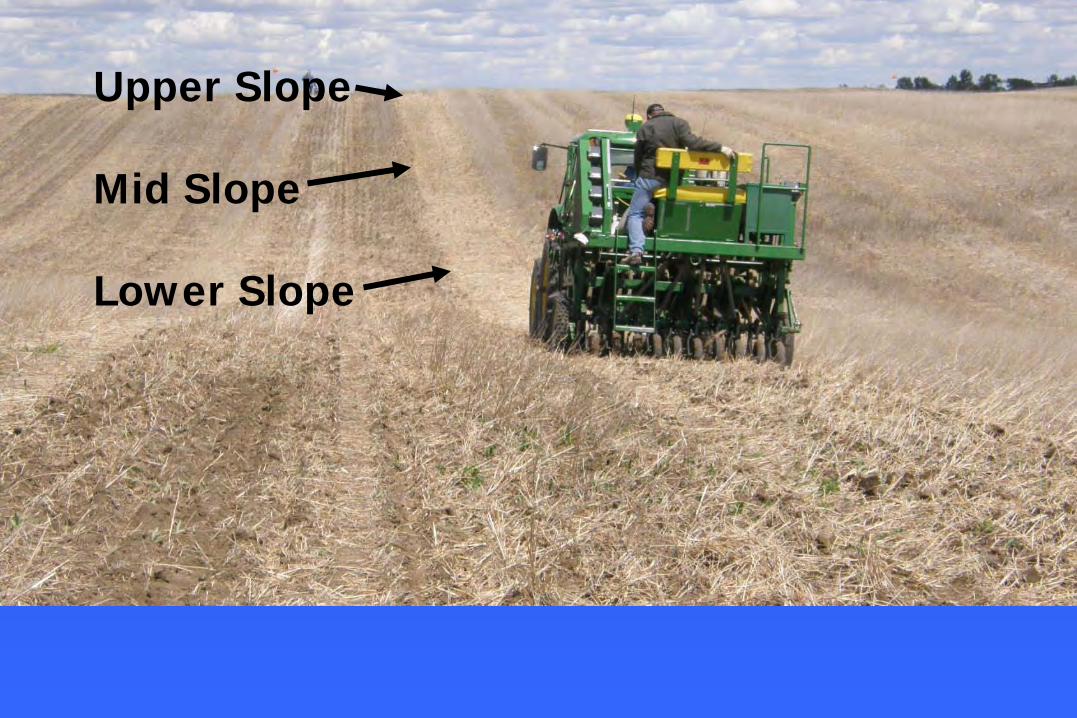
Upper Slope
Mid Slope
Lower Slope

What are the soil characteristics of a knolls, mid and lower slopes??• Physical:
• Chemical:

What are the soil characteristics of upper slopes or eroded knolls??• Physical:
– Limited top soil (Ah horizon)– Lower soil Organic Matter (OM) -> very poor soil structure– Soil will crust easily after a rain -> Reduced crop emergence– Reduced water infiltration – increased runoff– Higher bulk density –> reduced water percolation and rooting depth– Less stored soil water after rainfall
• Chemical:– Lower soil fertility – mostly N + P + K + some micronutrients– Low OM –> store house of nutrients is greatly reduced
• Reduced nutrient cycling to release nutrients for plant growth• Reduced soil fertility and nutrient status
– Very high soil pH –> high lime and carbonates can further reduce nutrient availability
– Increased surface soil salinity -> Subsoil salts near the soil surface

What are the effects of upper versus lower slope on crop growth??• Nutrient availability - ?
• Soil moisture reserves in subsoil - ?
• Crop emergence - ?
• Rooting depth - ?
• Result – affect on crop growth and yield potential ?

How to develop prescription fertilizer maps?• Yield Maps - Crop yield maps not well correlated to
fertilizer requirement• Remote Sensing Imagery – Can be difficult to relate
different areas to fertilizer requirements • Soil Mapping– Detailed map of soil types in the field
– look at physical, chemical and nutrient levels – is the best approach
– Must be done by a qualified soil surveyor

Factors to consider in developing crop management zones?• Topography – slope position• Soil variability:
– Soil Texture – sand vs clay content– Organic matter content– Soil pH– Depth of top soil/to subsoil– Soil nutrient levels – N, P, K, S, others at time of
seeding– Soil moisture status at time of seeding

Theory Behind Prescription Fertilizer Maps• How to develop yield maps?
– Base on Detailed Soil Map– Base on Topography– Base on Yield Maps– Base on Remote Sensing/Satellite Imagery– Base on Knowledge of Your Fields– Then Soil Sample Selected Zones

• ½ mile transect• 16 sampling sites
Which is most variable?N-P-K-S-
How variable are soils?
Variable Rate Fertilizer StudyMercer Seed Farm

Site N (0-24”) P K S pH1. 27 40 1079 17 5.62. 20 44 1008 14 5.73. 17 87 1282 16 5.64. 18 117 1689 19 5.55. 25 14 649 <5 7.46. 28 11 664 <5 7.77. 23 12 907 <5 7.58. 23 70 1352 17 5.29. 23 10 711 10 7.810 22 10 540 <5 7.711. 15 91 1361 12 5.812 22 20 696 <5 6.313 21 6 540 <5 7.714 20 7 484 23 7.715 24 15 540 16 7.716 17 41 1173 <5 6.9

Variation in Soil Nutrients with Landscape
Nutrient Low High MedianNitrate-N (0-24”) 15 28 23Phosphorus (0-6”) 6 117 20Potassium (0-6”) 484 1689 696Sulphate-S (0-6”) <5 23 10pH (0-6”) 5.2 7.8 6.9

3050
3055
3060
3065
3070
3075
3080
3085
3090
1 2 3 4 5 6 7 8 9 10 11 12 13 14 15 16
Elev
atio
n (
ft)
Transect Location
Elevation Change Over a Half Mile on Mercer Farm
Elev (Feet)

0
10
20
30
40
50
60
70
3050
3055
3060
3065
3070
3075
3080
3085
3090
1 2 3 4 5 6 7 8 9 10 11 12 13 14 15 16
Soil
N (
lb/a
c)
Elev
atio
n (
ft)
Transect Number
Soil Nitrate-nitrogen Variation with Landscape
Elevation (ft) Soil N

0
20
40
60
80
100
120
140
3050
3055
3060
3065
3070
3075
3080
3085
3090
1 2 3 4 5 6 7 8 9 10 11 12 13 14 15 16
Soil
P (
lb/a
c)
Elev
atio
n (
ft)
Transect Location
Soil Phosphorus Variation with LandscapeElev (Feet)
Soil P

0
20
40
60
80
100
120
140
3050
3055
3060
3065
3070
3075
3080
3085
3090
1 2 3 4 5 6 7 8 9 10 11 12 13 14 15 16
Soil
P (
lb/a
c)
Elev
atio
n (
ft)
Transect Location
Soil Phosphorus Variation with LandscapeElev (Feet)
Soil P

0
200
400
600
800
1000
1200
1400
1600
1800
3050
3055
3060
3065
3070
3075
3080
3085
3090
1 2 3 4 5 6 7 8 9 10 11 12 13 14 15 16
Soil
K (
lb/a
c)
Elev
atio
n (
ft)
Transect Number
Soil Potassium Variation with Landscape
Elevation (ft)
Soil K

Which areas should receive higher rates of fertilizer?• N was uniformly deficient
• Knolls– Very deficient in P– Lowest K levels but not deficient
• Lower slope position– Deficient in S

Lessons from this:
• Soil nutrient levels can be quite variable across rolling landscape – but variation is not consistent with topographic position.
• Task of identifying crop management zones for developing fertilizer prescription maps is a huge challenge – without a good understanding of soil variability
• We need to learn a great deal more how nutrients vary and how crops respond to fertilizer across landscapes.

VRF Technology – Field Maps• Starting Point - Create crop management zones with in a field
– Crop Management Zones used to develop prescription fertilizer maps
• Crop management zones are developed based on:– Soil types in a field– Topography– Satellite imagery – visible and other spectra– Crop yield maps
• After management zones are identified –each zone must be intensively soil sampled to develop fertilizer recommendations

Summary for Next Spring:• Soil sample and test selected fields to determine nutrient
levels
• Try sampling uniquely different soil areas in the same field to develop a sense of variation in some selected fields
• Will soil N and S levels in fields be higher or lower than normal in your fields?– What are your soil P levels?
Ross H. McKenzie
Research Scientist - AgronomyAgriculture Research Division
AARD, LethbridgePhone: 403-381-5842