challenges in the tea industry - epc kenya - homeepckenya.org/images/stories/publications/highlights...
TRANSCRIPT
KENYA TEA INDUSTRY HIGHLIGHTS 2012
1.0 Kenya’s Tea Production, Consumption and Exports in 2011
1.1 Kenya’s Tea Production
The 2011 closed with a total production of 377 million Kilograms compared to
399 million Kilograms in 2010, representing a 5% drop
Earnings from exports in 2011 stood at Kshs. 109 billion compared to Kshs. 97
billion in 2010.
The total export volumes stood at 421 million Kilograms, which was a 5% decline
from 441 million Kilograms in 2010.
The average price of US dollars 2.99 was recorded in 2011 compared to US
dollars 2.75 in 2010.
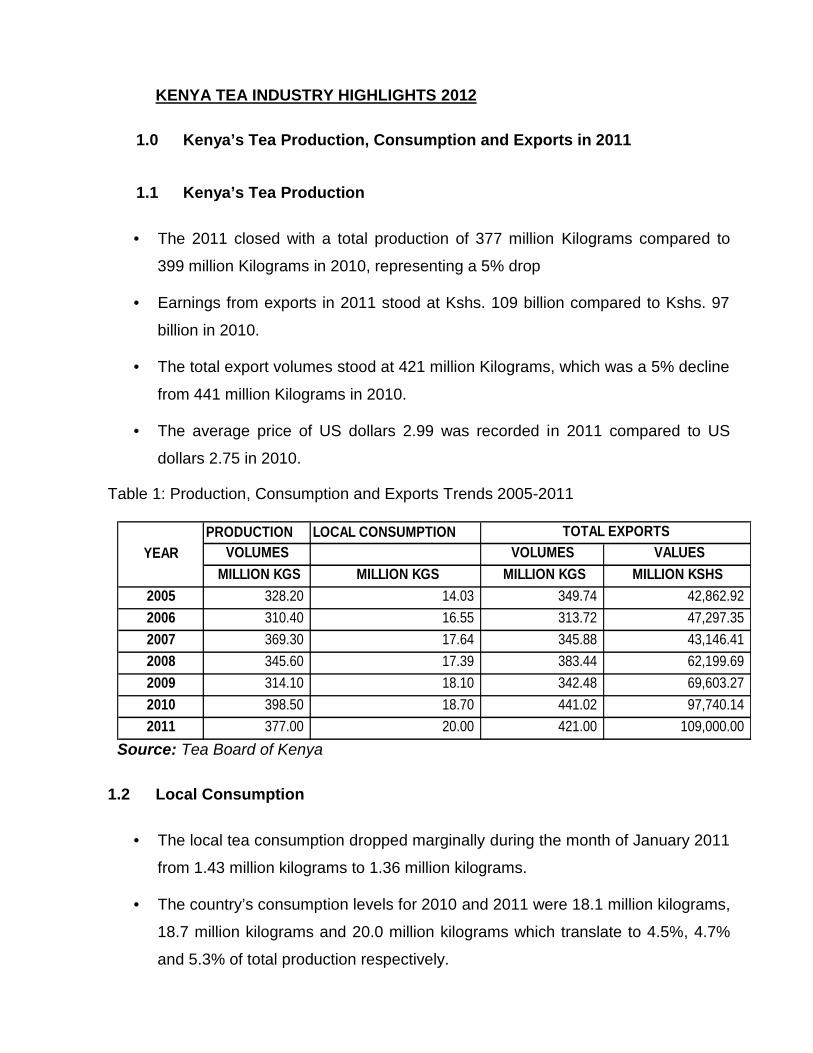
Table 1: Production, Consumption and Exports Trends 2005-2011
PRODUCTION LOCAL CONSUMPTIONVOLUMES VOLUMES VALUES
MILLION KGS MILLION KGS MILLION KGS MILLION KSHS2005 328.20 14.03 349.74 42,862.922006 310.40 16.55 313.72 47,297.352007 369.30 17.64 345.88 43,146.412008 345.60 17.39 383.44 62,199.692009 314.10 18.10 342.48 69,603.272010 398.50 18.70 441.02 97,740.142011 377.00 20.00 421.00 109,000.00
YEARTOTAL EXPORTS
Source: Tea Board of Kenya
1.2 Local Consumption
The local tea consumption dropped marginally during the month of January 2011
from 1.43 million kilograms to 1.36 million kilograms.
The country’s consumption levels for 2010 and 2011 were 18.1 million kilograms,
18.7 million kilograms and 20.0 million kilograms which translate to 4.5%, 4.7%
and 5.3% of total production respectively.
2
1.3 Kenya’s Tea Exports Markets in 2011
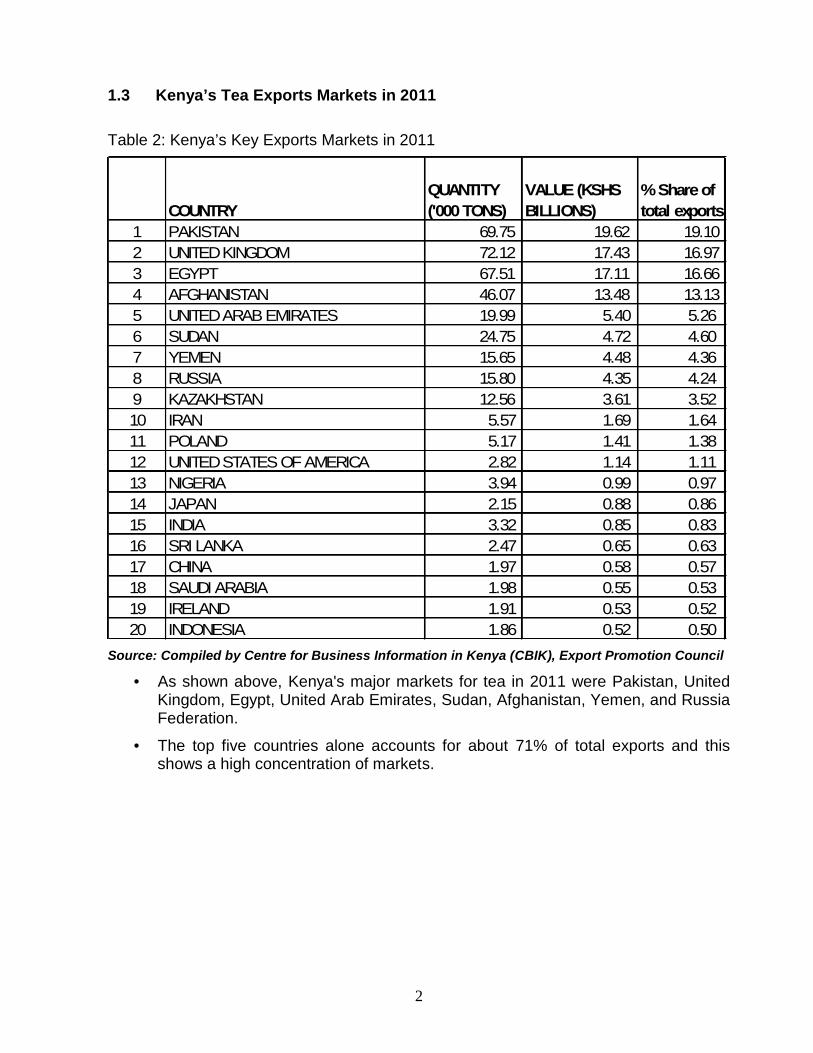
Table 2: Kenya’s Key Exports Markets in 2011
COUNTRYQUANTITY('000 TONS)
VALUE (KSHSBILLIONS)
% Share oftotal exports
1 PAKISTAN 69.75 19.62 19.102 UNITED KINGDOM 72.12 17.43 16.973 EGYPT 67.51 17.11 16.664 AFGHANISTAN 46.07 13.48 13.135 UNITED ARAB EMIRATES 19.99 5.40 5.266 SUDAN 24.75 4.72 4.607 YEMEN 15.65 4.48 4.368 RUSSIA 15.80 4.35 4.249 KAZAKHSTAN 12.56 3.61 3.5210 IRAN 5.57 1.69 1.6411 POLAND 5.17 1.41 1.3812 UNITED STATES OF AMERICA 2.82 1.14 1.1113 NIGERIA 3.94 0.99 0.9714 JAPAN 2.15 0.88 0.8615 INDIA 3.32 0.85 0.8316 SRI LANKA 2.47 0.65 0.6317 CHINA 1.97 0.58 0.5718 SAUDI ARABIA 1.98 0.55 0.5319 IRELAND 1.91 0.53 0.5220 INDONESIA 1.86 0.52 0.50
Source: Compiled by Centre for Business Information in Kenya (CBIK), Export Promotion Council
As shown above, Kenya's major markets for tea in 2011 were Pakistan, UnitedKingdom, Egypt, United Arab Emirates, Sudan, Afghanistan, Yemen, and RussiaFederation.
The top five countries alone accounts for about 71% of total exports and thisshows a high concentration of markets.
3
2.0 KEY PLAYERS IN THE WORLD TEA MARKET
2.1 World Production Trends
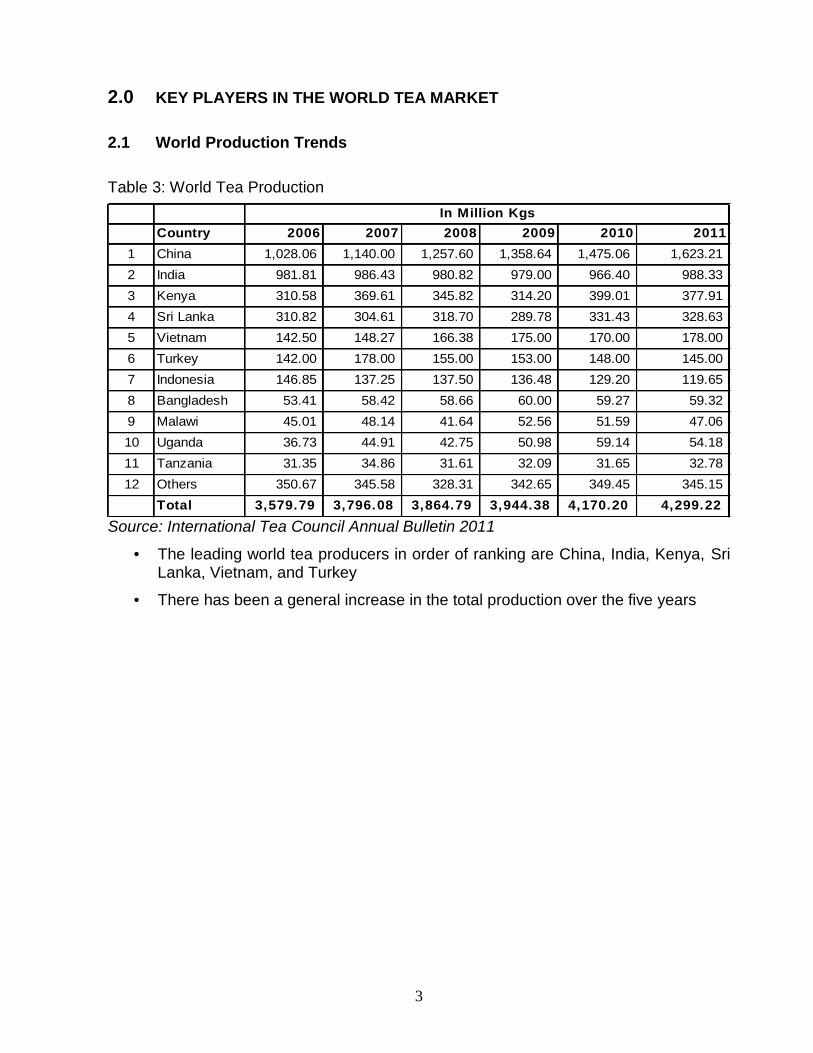
Table 3: World Tea Production
Country 2006 2007 2008 2009 2010 20111 China 1,028.06 1,140.00 1,257.60 1,358.64 1,475.06 1,623.212 India 981.81 986.43 980.82 979.00 966.40 988.333 Kenya 310.58 369.61 345.82 314.20 399.01 377.914 Sri Lanka 310.82 304.61 318.70 289.78 331.43 328.635 Vietnam 142.50 148.27 166.38 175.00 170.00 178.006 Turkey 142.00 178.00 155.00 153.00 148.00 145.007 Indonesia 146.85 137.25 137.50 136.48 129.20 119.658 Bangladesh 53.41 58.42 58.66 60.00 59.27 59.329 Malawi 45.01 48.14 41.64 52.56 51.59 47.0610 Uganda 36.73 44.91 42.75 50.98 59.14 54.1811 Tanzania 31.35 34.86 31.61 32.09 31.65 32.7812 Others 350.67 345.58 328.31 342.65 349.45 345.15
Total 3,579.79 3,796.08 3,864.79 3,944.38 4,170.20 4,299.22
In Mil l ion Kgs
Source: International Tea Council Annual Bulletin 2011
The leading world tea producers in order of ranking are China, India, Kenya, SriLanka, Vietnam, and Turkey
There has been a general increase in the total production over the five years
4
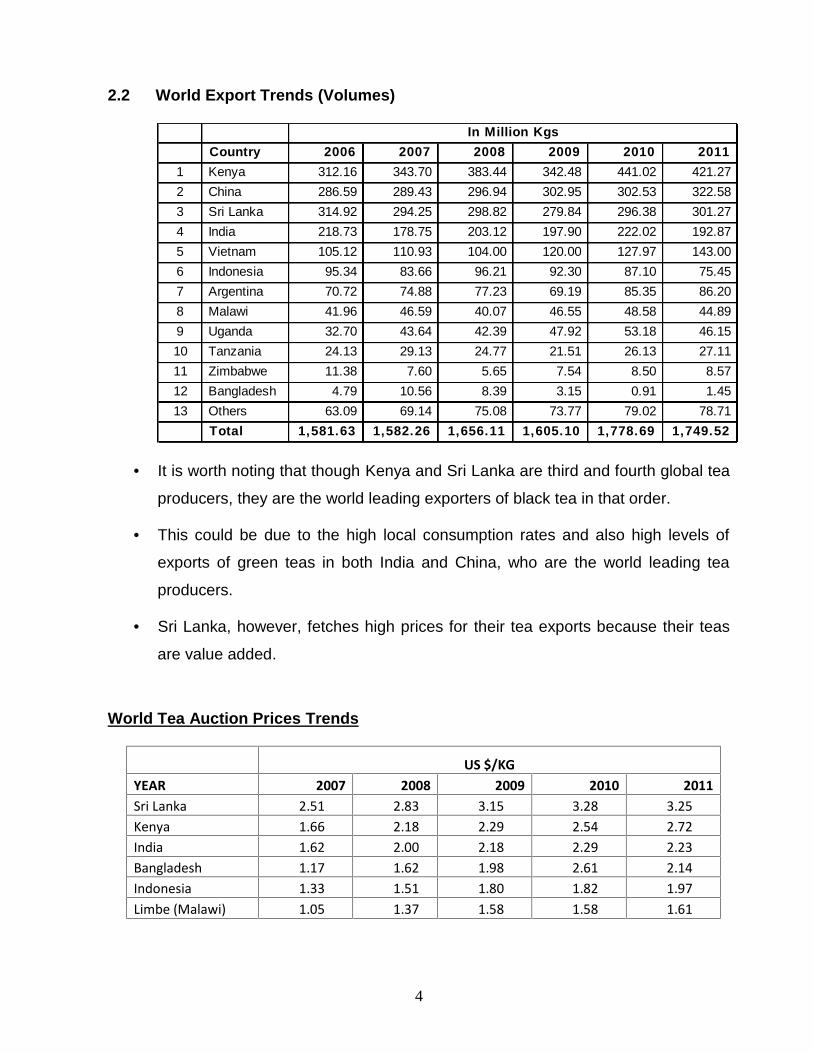
2.2 World Export Trends (Volumes)
Country 2006 2007 2008 2009 2010 20111 Kenya 312.16 343.70 383.44 342.48 441.02 421.272 China 286.59 289.43 296.94 302.95 302.53 322.583 Sri Lanka 314.92 294.25 298.82 279.84 296.38 301.274 India 218.73 178.75 203.12 197.90 222.02 192.875 Vietnam 105.12 110.93 104.00 120.00 127.97 143.006 Indonesia 95.34 83.66 96.21 92.30 87.10 75.457 Argentina 70.72 74.88 77.23 69.19 85.35 86.208 Malawi 41.96 46.59 40.07 46.55 48.58 44.899 Uganda 32.70 43.64 42.39 47.92 53.18 46.1510 Tanzania 24.13 29.13 24.77 21.51 26.13 27.1111 Zimbabwe 11.38 7.60 5.65 7.54 8.50 8.5712 Bangladesh 4.79 10.56 8.39 3.15 0.91 1.4513 Others 63.09 69.14 75.08 73.77 79.02 78.71
Total 1,581.63 1,582.26 1,656.11 1,605.10 1,778.69 1,749.52
In Mil l ion Kgs
It is worth noting that though Kenya and Sri Lanka are third and fourth global tea
producers, they are the world leading exporters of black tea in that order.
This could be due to the high local consumption rates and also high levels of
exports of green teas in both India and China, who are the world leading tea
producers.
Sri Lanka, however, fetches high prices for their tea exports because their teas
are value added.
World Tea Auction Prices Trends
US $/KGYEAR 2007 2008 2009 2010 2011Sri Lanka 2.51 2.83 3.15 3.28 3.25Kenya 1.66 2.18 2.29 2.54 2.72India 1.62 2.00 2.18 2.29 2.23Bangladesh 1.17 1.62 1.98 2.61 2.14Indonesia 1.33 1.51 1.80 1.82 1.97Limbe (Malawi) 1.05 1.37 1.58 1.58 1.61
5
3.0 CHALLENGES IN KENYA’S TEA SECTOR
The challenges in Tea sector Include among others:
vagaries of weather/climate change impacts
high concentration of markets and product range
price and exchange rate fluctuations, and
high cost of production.
infrastructural and logistical including slow cargo turn-around time at theport of Mombasa
The best option to address the above challenges is for the country to consider marketdiversification and product differentiation. This will be achieved only if Kenya considersproviding incentives like other competitors (especially Sri Lanka) do to the producersand packers of teas through duty free imports of flavours and packing equipment andmaterials and also placing all factories under the special economic zones.
3.1 Value additions in tea: Product differentiation
There are opportunities for the country to move towards serving specific marketsegments where consumer purchase decisions are made on the basis not of price, butof some perceived ‘quality’ attributes, with these ‘quality’ attributes generating awillingness on the part of consumers to pay more for the product.
Quality attributes may take many forms,
Geographical designation of origin/geographical indications, Certification of some distinct quality or a trademark.
The attributes may relate to the production process (e.g. organic, sustainable, or animalwelfare-focused production methods) or the functioning of the supply chain (e.g. fair-trade).
3.2 Benefits for ‘quality-based product differentiation’
Consumers are willing to pay more for such products In more affluent segments of society, as income increases people do not eat
more, but rather they eat differently, favouring ‘quality-differentiated’ food anddrink products
an opportunity in an era of accelerating preference erosion and increasedcompetition not only on export markets but also on regional and domesticmarkets