ceteris paribus - lse research...
TRANSCRIPT
Abstract There is theoretical evidence that economic and family policies have an important impact on mother’s employment. The aim of this article is to study empirically the women’s transitions from employment to non-employment after they have their first birth in Belgium, West-Germany, Italy, Spain and Sweden. The paper investigates the evolution of post-birth employment across time and how these shifts are related to - cross-country - different policies and society. We also test if the withdrawal from work is due to marriage or to motherhood. Results show that Spain and West-Germany are the countries with the lowest rates of staying-on in the labour market after childbearing. Higher education is a key explanatory factor of the probability of post-birth employment in all countries, except for Sweden. In the period 1973–93, Belgian and especially Spanish mothers increased their probability of post-birth employment, ceteris paribus. The opposite movement occurred in West-Germany. Italy and Sweden remained fairly constant. This trend is mainly explained by the taxation system (joint vs. separate), education and part-time employment. JEL Classification: I20, J13, J18, J20 Key Words: employment transitions, part-time work, motherhood, education. This paper was produced as part of the Centre’s Labour Markets Programme Acknowledgements
I would like to thank Professor Stephen Nickell for his helpful comments and suggestions. I would also like to thank participants at the CEP Labour Workshop and IZA Family and Work Conference. Financial help from the “Fundaci´on Ram´on Areces” is acknowledged, as well as the United Nations for the provision of data. I am responsible for any remaining errors. Maria Gutiérrez-Domènech is a member of the Centre for Economic Performance, London School of Economics. Correspondence to: CEP, LSE, 10 Portugal Street, London WC2 2AE. E-mail: [email protected] Published by Centre for Economic Performance London School of Economics and Political Science Houghton Street London WC2A 2AE Maria Gutiérrez-Domènech, submitted March 2003 ISBN 0 7530 1604 4 Individual copy price: £5
Employment After Motherhood:
A European Comparison
Maria Gutiérrez-Domènech
May 2003
1. Introduction and Literature 2 2. Data and Covariates 4 2.1 Countries 5 2.2 Variables 6 3. Country Comparison: Labour Market, Taxation and Welfare Policies 7 4. Descriptive Statistics 9 4.1 The Withdrawal of Women from Work 10 4.2 Is the Withdrawal from Work Due to Marriage or to Motherhood? 14 5. Model 16 6. Simulation 20 7. Policy Evaluation 25 8. Conclusions 27 References 29 Appendices 31
The Centre for Economic Performance is financed by the Economic and Social Research Council.
1 Introduction and Literature Review
There is theoretical evidence that labour and family policies have an impact on femalelabour supply, especially amongst mothers. In his book, Becker (1993) models femalelabour supply taking into account family decisions. Women with children allocate theirtime between the labour market and childcare. There are several factors that determinetheir choice: preferences and cultural aspects, the price of childcare, pos-sible substitutes for childcare and family taxation policies. All these elements play afundamental role in a mother’s employment decision and consequently, in the transitionsfrom employment to non-employment after first birth. In order to evaluate how vari-ous policies affect female participation around childbearing, cross-country and cross-timecomparison is important.
Transitions to non-employment after childbearing matter because they are likely to causea loss in human capital and future wages, and this effect is expected to be larger thelonger the time spent out of work. For example, Beblo and Wolf (2002) find evidence thatdiscontinuous employment caused by maternal leave reduces the wage for females, ceterisparibus. Depending on the economic situation and governmental rules, women might facebarriers to return to work after a period of childcare leave.
In this paper we investigate the transitions of women from employment to non-employmentafter first birth. We analyse the factors that increase or reduce employment after child-bearing and, for fixed characteristics, how this depends on specific country behaviour.We also explore how the expected probability of employment after birth has evolved overtime. We focus on Belgium, West-Germany, Italy, Spain and Sweden since these exhibitsubstantial differences in policies and social behaviour.
Although this issue has been addressed in these countries (especially in Germany andSweden), our contribution is to make a comprehensive comparison and harmonise re-search on the likelihood of employment after first birth. We use the same data (Familyand Fertility Survey) for each country and select identical variables, cohorts and time hori-zon. We trace the post-birth employment probability for a representative recent mother.That is, we determine the chances of employment after childbearing of a woman withcertain characteristics, given that she is in any of the countries under examination. Dif-ferences in predictions for employment across countries are caused by distinct policiesand/or unobserved heterogeneity that we do not capture with our controls. Our aim isalso to identify the effect of changes in policies on employment after birth.
These countries differ in the rigidity of their labour markets (particularly the non-availabilityof part-time jobs), family taxation and subsidised childcare.1 These factors have beenshown to affect simultaneously fertility and female labour supply. For example, Del Boca(2002) uses panel data from the Bank of Italy to analyse how imperfections in the labourmarket and characteristics of the publicly-funded childcare system discourage both family
1They have also differences in cultural-family rules. In Southern Europe, grandparents are more likelyto live in the same household, providing indirect childcare. However, their effect on childcare could goeither way if they require health assistance.
2
formation and participation in Italy. Apps and Rees (2001) find evidence that countrieswith individual rather than joint taxation are likely to have at once high fertility and fe-male labour supply. They also show that family support through improved availability ofoptions for domestic childcare is more effective for female participation than direct childpayments.
The withdrawal of women from work has been studied for several single countries. Dex,Joshi, McCulloch and Macran (1996) use the 1958 National Child Development Studycohort to model employment transitions around childbearing in the UK. They find thateducation is the main factor that secures women’s job continuity after motherhood. Con-trary to what the authors expected, delaying motherhood helps high-educated women toremain at work but it is not essential. For the US, Desai and Waite (1991) test if the oc-cupational sex composition2 determines the likelihood that recent mothers are employed.They find that the probability of being employed after childbearing depends mainly onthose occupational characteristics that raise the opportunity cost of being in the labourforce, independently of sex composition. They also distinguish between women with highand low work commitment depending on their answer to the question if they plan to workat age 35. As expected, they find that those who said yes had a greater probability ofremaining at work after motherhood. However, women with low commitment were moreresponsive to financial pressures and worked when they had to. Ondrich, Spiess and Yang(1996) study the return to work after childbirth in Germany using a hazard approach.They focus on the legal parental leave period and the post-parental leave. Their resultsshow that once the protection expires, mothers with strong labour force attachment (mea-sured by years of experience and pre-birth full-time contracts) are more likely to return.
Motherhood employment has been extensively studied in Sweden. For instance, Ronsenand Sunstrom (1996) look at mother’s employment transitions around birth in Swedenand Norway. They use a hazard approach to analyse the entry into employment afterbirth, with special focus on the effect of parental leave policies. They find that womenwho have the right to a paid leave are much more likely to resume employment in bothcountries. Bernhardt (1986) analyses women’s home attachment at first birth, using alogistic model for three educational groups. She concludes that the likelihood of being athome 12 months after confinement is significantly affected by education, marital status,early labour-force withdrawal and duration of the union. Furthermore, the paper showsthat low educated women have become over time closer to other educational groups interms of home attachment. Bernhardt (1988) writes about the increasing tendency toreduce working hours among one-child mothers, particularly among women with a lowlevel of education. Part-time work has become the ‘combination strategy’ (family andwork) for both women who previously would have selected the ‘home strategy’ and forthose who would have taken the ‘career strategy’, as the author defines it. Similar resultsare developed in Ellingsaeter and Ronsen (1996) and Kravdal (1992) for Norway. In the80s, Norwegian labour force participation rates for mothers with the youngest child under3 years increased substantially from 47% to 69%. This increase was accompanied by arise in part-time work, partly thanks to the state, which is a good creator of part-time jobs.
2They call female occupations those with a majority of women in the market.
3
In Southern Europe, Adam (1996a) uses the Spanish Household and Expenditure Survey(ECPF) for the period 1985–90 to study married women’s labour force transitions. Theadvantage of the Family and Fertility Spanish data is that it has richer information aboutwomen3 but its greatest weakness compared to hers is that there are no income covari-ates. The author concludes that children are the main reason for mothers’ abandoningthe labour force. However, the principal cause of re-entry is the insecurity of husband’semployment rather than children.
Although the vast majority of research has been done for single countries, there are,however, two papers that deal with more than one country. Gustafsson, Wetzels andVlasblom (1996) compare women’s labour force transitions related to childbirth in Ger-many, Sweden and Great Britain. They use different panels for each country: the GSOEPfor Germany, the Swedish HUS and the British BHPS. Their results show that Germanand British women have higher full-time employment pre-first-birth. German women staylonger at home with children because of their breadwinner regime. They find evidencethat the accumulation of human capital is a main determinant for re-entry in Germanyand Great Britain whereas it is not in Sweden. Another study by Saurel-Cubizolles,Romito, Escriba-Aguir, Lelong, Pons and Ancel (1999) describes the return to work afterchildbirth in France, Italy and Spain, and how this is related to their different maternityleave policies. They also use different surveys4 for each country to undertake their analy-sis. Their results show that the percentage of women coming back to work within a yearafter the birth is around 80% in both France and Italy. The proportion is lower in Spain(53%). The gap of post-birth leave was related to each country’s policies. For example,Italian women returned to work later, which they say is due to their longer post-birthmaternity leave.
The paper is organised as follows: in Section 2, we explain our data sources. In Section 3we describe the labour market, maternity leave and taxation regimes in Belgium, West-Germany, Italy, Spain and Sweden. We look at the transitions across these countries inSection 4 with a description of the staying-on-rates in employment after childbearing. Wenext focus on our model in Section 5. The aim is to analyse the probability of employmentafter motherhood, given females’ observed characteristics and labour market conditions.In Section 6 we simulate the foreseen post-birth employment of a representative individ-ual if she was employed before the birth and living in each of our studied countries. Weproceed with an evaluation of the impact of policies on post-birth employment in Section7. We then conclude in Section 8.
2 Data and Covariates
The data come from the Family and Fertility Survey (FFS). The structure of the question-naire was originally produced by the United Nations but the collection was undertaken by
3Adam (1996b) points out in her paper the shortcoming of ECPF, which is the lack of female’seducation, experience and regions.
4Their sample for Spain only covers the Valencian region.
4
different institutions.5 This has caused variations in the available explanatory variablessince not all the proposed questionnaire sections were applied in all countries. Despitethis drawback, these data have the advantage that whenever we have coinciding variables,they derive from the same question and have the same interpretation. For our analysis,we have selected those relevant explanatory variables that exist in all five countries inorder to estimate the probability of post-birth employment.
Each individual responds to the survey at a particular moment of time. Then, she isasked to give information about her past. That is, the poll asks every woman to buildup her history. For instance, the dates of her marriage, first cohabitation, sequence ofjobs (starting and ending date of her job for up to 30 different employments), calendarof children born and sequence of schooling (up to 10 different courses). In consequence,since it is a retrospective survey, there will be errors coming from the individuals’ lack ofmemory. Another shortcoming of this survey is the lack of wage and income variables.For our estimation analysis we select those women who had at least a first birth.
2.1 Countries
2.1.1 Belgium: Flemish and Brussels capital region6
Belgian data were collected in the Flemish and Brussels capital region between 1991 and1992. Therefore, our results are not representative of the whole of Belgium, but only forthe Flemish and Brussels capital region. The number of valid interviews was 2088 forwomen and 1319 for men, obtained with a percentage of responses of 69.2% and 66.3%respectively. Individuals were between 20 and 41 years old.
2.1.2 West-Germany
The survey file contains information on 5036 persons (2024 men and 3012 women) bornbetween 1952 and 1972, aged 20–39 on 1st January 1992. Interviewing took place in 1992.
2.1.3 Italy
The target population was women and men aged 20–49. The interviews were carried outbetween November 1995 and January 1996. There were 4824 women interviewed and 1206men.
2.1.4 Spain
The data come from the Spanish Family and Fertility Survey, a data set collected by theCentro de Investigaciones Sociologicas (CIS) between June and November of 1995. Thesample is built at the national level with individuals aged between 18 and 49 years old.The number of valid interviews was 4021 for women and 1991 for men, obtained with apercentage of responses of 83.6% and 77% respectively.
5We obtained FFS directly from the United Nations. We have FFS project number 93, approved bythe FFS commission.
6From now on, any time we talk about Belgium we only refer to the Flemish and Brussels capitalregions.
5
2.1.5 Sweden
The Swedish Family Survey conducted in 1992/93 consists of eight cohorts: women bornin 1949, 1954, 1959, 1964 and 1969; men born in 1949, 1959 and 1964. The interviewstook place at the end of 1992 and at the beginning of 1993. A total of 4229 womenand 2177 men were included in the sample, altogether 3318 women and 1666 men wereinterviewed.
2.2 Variables
A major effort has been undertaken to select those explanatory variables7 that are com-parable across our countries. These are the following: size of the city of origin (City),being religious (Religious), education, cohort, married at first birth (Married1C ), monthlyworking experience from 15 years old to the pre-birth job (Experience), age at first birthand its square (AgeAt1C and AgeAt1C2 ), age of first job (AgeAt1Job). All explanatoryvariables are taken at one year pre-birth, except for education.8 The scale of the degreesin education goes from zero to six in accord with the International Standard Classificationof Education (ISCED). From this variable, we have constructed four dummy variables E1(with value one if the maximum level is 0 or 1, primary school), E2 (one if the individualbelongs to category 2 or 3, secondary school), E3Voc (one if she has level 4, vocationaldegree) and E3GrPo (one if she is at 5 or 6, graduate or post-graduate degree). Ourreference category is the lowest level E1. Notice that category E3Voc does not exist ei-ther in Italy nor in Sweden. We also control for post-confinement duration dummies andcalendar year dummies.
In order to make our sample consistent across countries, we select cohorts born between1951 and 1970 and observable calendar years up to 1993. Surveys in Spain and Italy wereundertaken in 1995, which means that individuals of the same cohort might be observedlonger compared to the other countries.9 We restrict those individuals to be followed-upuntil 1993. In Sweden, we have women for five specific cohorts: 1949, 1954, 1959, 1964and 1969. This means that we have not been able to completely homogenise cohorts.Nevertheless, we believe that our results are fairly comparable. For the estimation, weselect those women who had a first birth. We have 1969 observations in Belgium, 1350 inWest-Germany, 2856 in Italy, 2470 in Spain and 2291 in Sweden.
6
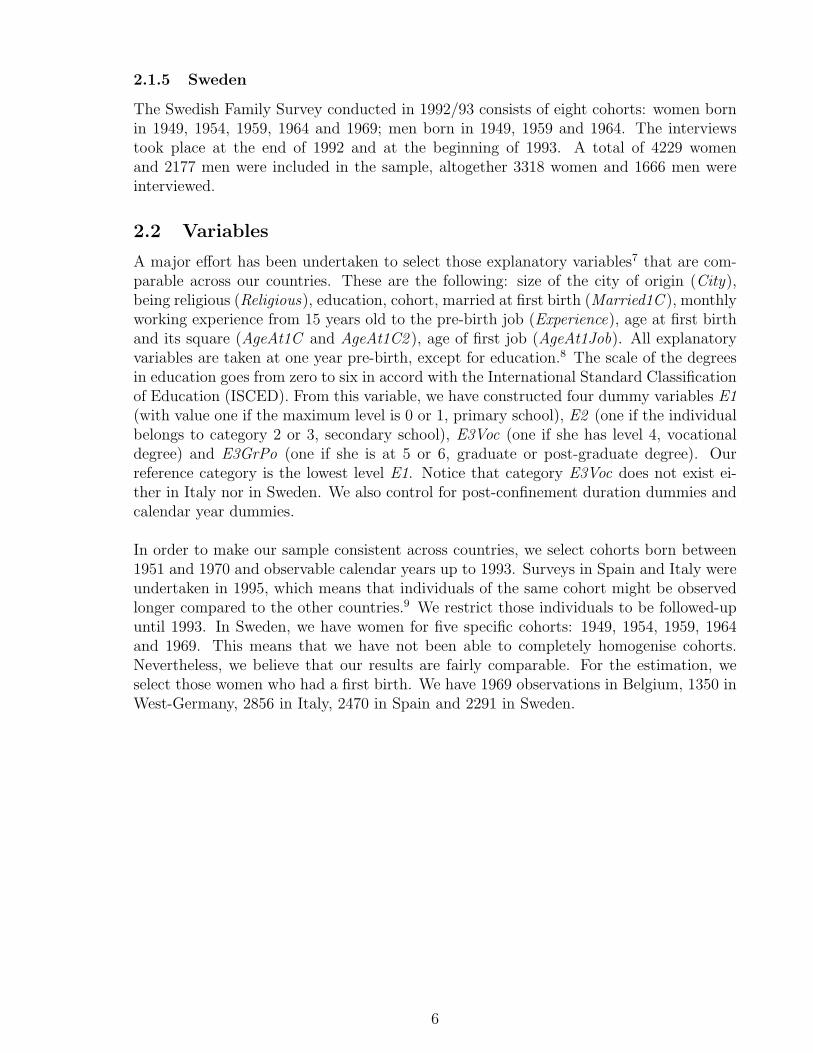
Table 1: Maternity Leave and Benefits1: 1975–97
Duration of leave2 Cash benefits3
Countries 1975 1985 1990 1997 1975 1985 1990 1997Belgium 14 14 14 15 60 80 80 77Germany 14 14 14 14 100 100 100 100Italy 22 22 22 22 80 80 80 80Spain 12 14 16 16 75 75 75 100Sweden 30 51 51 64 90 70 71 62
1Source: Gauthier (2000) and Moss and Deven (1990).2Duration of the leave in weeks.3Cash benefits as a percentage of regular wages.
Table 2: Childcare Leave2 Schemes in 1999
Countries Duration2 Cash Benefits3 Flexibility
Belgium 3 37% Up to the child’s fourth birthdayGermany 36∗ 24% Immediately after paid maternity leaveItaly 6 30% Up to the child’s ninth birthdaySpain 36∗ Unpaid Immediately after paid maternity leaveSweden 15 66% Up to the child’s eighth birthday
1Source: Gauthier (2000).2Duration in months.3Cash benefits as % of wage.∗Duration includes the post-birth period covered by the maternity leave.
3 Country Comparison: Labour Market, Taxation
and Welfare Policies
We summarise in Table 1 the main characteristics of maternity/parental leave10 and ben-efits in these countries. We also provide information on childcare leave11 in Table 2.
7Full description of the variables in Table 13.8Education level is taken at the date an individual completes school, which could occur after the birth.
We were obliged to take this measure since schooling calendar is missing in Belgium, West-Germany andItaly. In the latter countries, only the highest level of education at completion date is reported. Despitethis, we believe that this variable is adequate at capturing an individual’s human capital at birth. First,most women are likely to exit schooling before childbearing. Second, for those who finish later, the finallevel achieved is a measure of their expectations in the labour market.
9Notice that we have a retrospective survey.10The term maternity/parental leave refers to paid leave during the period immediately prior and after
childbirth.11Childcare leave refers to optional extended leave after maternity/parental leave.
7
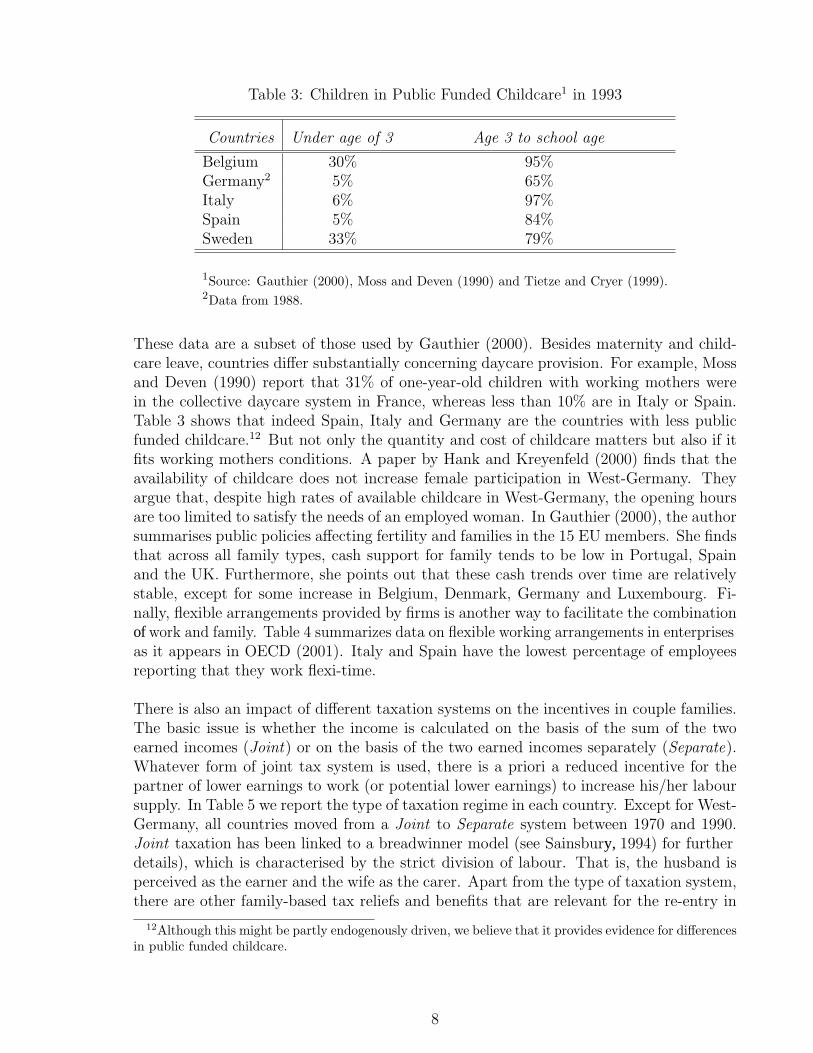
Table 3: Children in Public Funded Childcare1 in 1993
Countries Under age of 3 Age 3 to school age
Belgium 30% 95%Germany2 5% 65%Italy 6% 97%Spain 5% 84%Sweden 33% 79%
1Source: Gauthier (2000), Moss and Deven (1990) and Tietze and Cryer (1999).2Data from 1988.
These data are a subset of those used by Gauthier (2000). Besides maternity and child-care leave, countries differ substantially concerning daycare provision. For example, Mossand Deven (1990) report that 31% of one-year-old children with working mothers werein the collective daycare system in France, whereas less than 10% are in Italy or Spain.Table 3 shows that indeed Spain, Italy and Germany are the countries with less publicfunded childcare.12 But not only the quantity and cost of childcare matters but also if itfits working mothers conditions. A paper by Hank and Kreyenfeld (2000) finds that theavailability of childcare does not increase female participation in West-Germany. Theyargue that, despite high rates of available childcare in West-Germany, the opening hoursare too limited to satisfy the needs of an employed woman. In Gauthier (2000), the authorsummarises public policies affecting fertility and families in the 15 EU members. She findsthat across all family types, cash support for family tends to be low in Portugal, Spainand the UK. Furthermore, she points out that these cash trends over time are relativelystable, except for some increase in Belgium, Denmark, Germany and Luxembourg. Fi-nally, flexible arrangements provided by firms is another way to facilitate the combinationof work and family. Table 4 summarizes data on flexible working arrangements in enterprisesas it appears in OECD (2001). Italy and Spain have the lowest percentage of employeesreporting that they work flexi-time.
There is also an impact of different taxation systems on the incentives in couple families.The basic issue is whether the income is calculated on the basis of the sum of the twoearned incomes (Joint) or on the basis of the two earned incomes separately (Separate).Whatever form of joint tax system is used, there is a priori a reduced incentive for thepartner of lower earnings to work (or potential lower earnings) to increase his/her laboursupply. In Table 5 we report the type of taxation regime in each country. Except for West-Germany, all countries moved from a Joint to Separate system between 1970 and 1990.Joint taxation has been linked to a breadwinner model (see Sainsbury, 1994) for furtherdetails), which is characterised by the strict division of labour. That is, the husband isperceived as the earner and the wife as the carer. Apart from the type of taxation system,there are other family-based tax reliefs and benefits that are relevant for the re-entry in
12Although this might be partly endogenously driven, we believe that it provides evidence for differencesin public funded childcare.
8
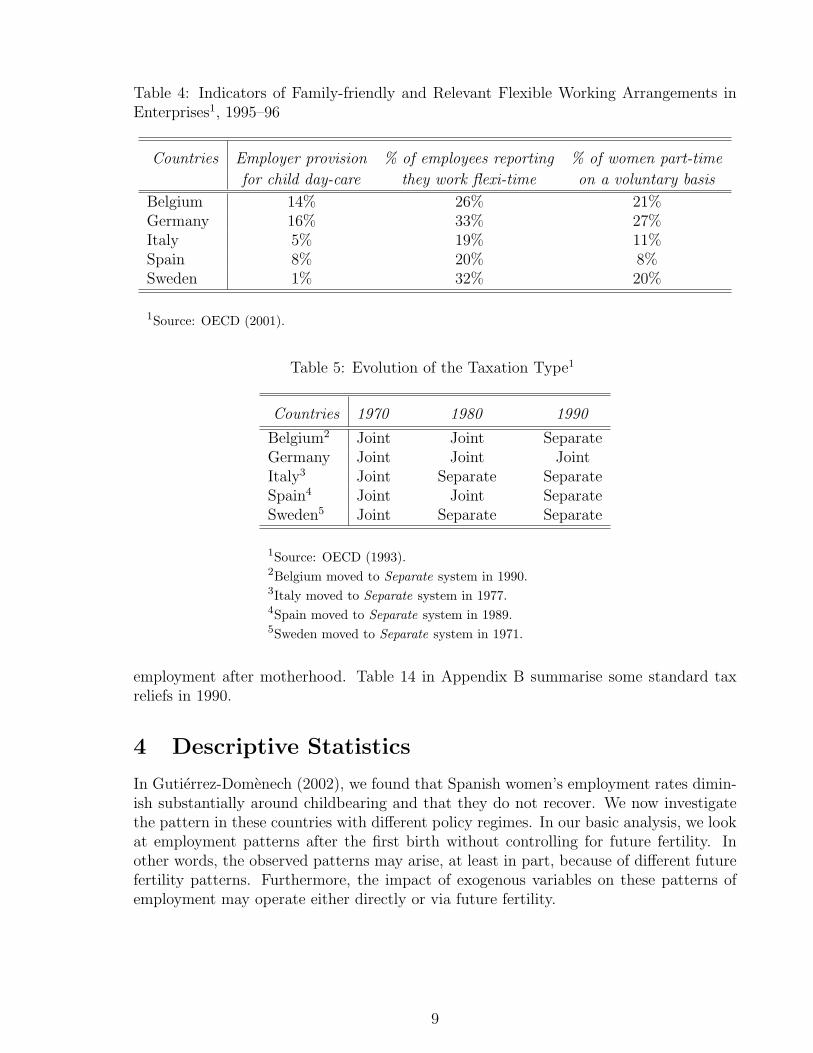
Table 4: Indicators of Family-friendly and Relevant Flexible Working Arrangements inEnterprises1, 1995–96
Countries Employer provision % of employees reporting % of women part-time
for child day-care they work flexi-time on a voluntary basis
Belgium 14% 26% 21%Germany 16% 33% 27%Italy 5% 19% 11%Spain 8% 20% 8%Sweden 1% 32% 20%
1Source: OECD (2001).
Table 5: Evolution of the Taxation Type1
Countries 1970 1980 1990
Belgium2 Joint Joint SeparateGermany Joint Joint JointItaly3 Joint Separate SeparateSpain4 Joint Joint SeparateSweden5 Joint Separate Separate
1Source: OECD (1993).2Belgium moved to Separate system in 1990.3Italy moved to Separate system in 1977.4Spain moved to Separate system in 1989.5Sweden moved to Separate system in 1971.
employment after motherhood. Table 14 in Appendix B summarise some standard taxreliefs in 1990.
4 Descriptive Statistics
In Gutierrez-Domenech (2002), we found that Spanish women’s employment rates dimin-ish substantially around childbearing and that they do not recover. We now investigatethe pattern in these countries with different policy regimes. In our basic analysis, we lookat employment patterns after the first birth without controlling for future fertility. Inother words, the observed patterns may arise, at least in part, because of different futurefertility patterns. Furthermore, the impact of exogenous variables on these patterns ofemployment may operate either directly or via future fertility.
9
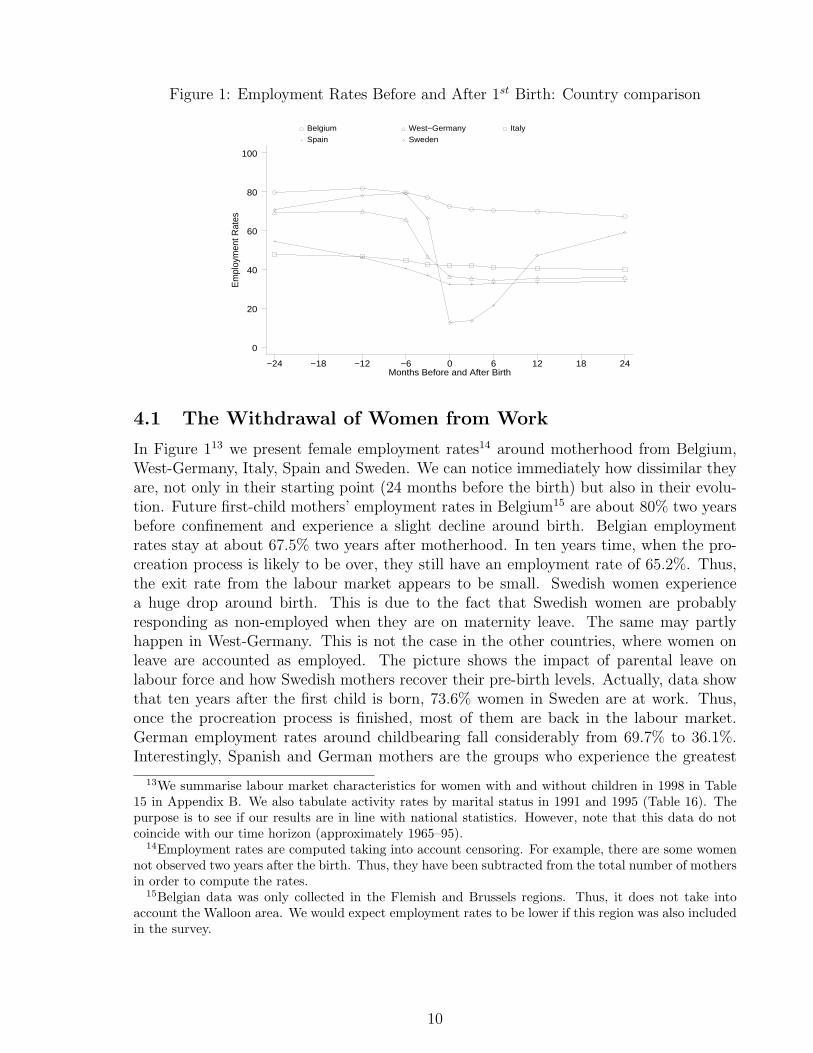
Figure 1: Employment Rates Before and After 1st Birth: Country comparison
Em
ploy
men
t Rat
es
Months Before and After Birth−24 −18 −12 −6 0 6 12 18 24
0
20
40
60
80
100
Belgium West−Germany Italy
Spain Sweden
4.1 The Withdrawal of Women from Work
In Figure 113 we present female employment rates14 around motherhood from Belgium,West-Germany, Italy, Spain and Sweden. We can notice immediately how dissimilar theyare, not only in their starting point (24 months before the birth) but also in their evolu-tion. Future first-child mothers’ employment rates in Belgium15 are about 80% two yearsbefore confinement and experience a slight decline around birth. Belgian employmentrates stay at about 67.5% two years after motherhood. In ten years time, when the pro-creation process is likely to be over, they still have an employment rate of 65.2%. Thus,the exit rate from the labour market appears to be small. Swedish women experiencea huge drop around birth. This is due to the fact that Swedish women are probablyresponding as non-employed when they are on maternity leave. The same may partlyhappen in West-Germany. This is not the case in the other countries, where women onleave are accounted as employed. The picture shows the impact of parental leave onlabour force and how Swedish mothers recover their pre-birth levels. Actually, data showthat ten years after the first child is born, 73.6% women in Sweden are at work. Thus,once the procreation process is finished, most of them are back in the labour market.German employment rates around childbearing fall considerably from 69.7% to 36.1%.Interestingly, Spanish and German mothers are the groups who experience the greatest
13We summarise labour market characteristics for women with and without children in 1998 in Table15 in Appendix B. We also tabulate activity rates by marital status in 1991 and 1995 (Table 16). Thepurpose is to see if our results are in line with national statistics. However, note that this data do notcoincide with our time horizon (approximately 1965–95).
14Employment rates are computed taking into account censoring. For example, there are some womennot observed two years after the birth. Thus, they have been subtracted from the total number of mothersin order to compute the rates.
15Belgian data was only collected in the Flemish and Brussels regions. Thus, it does not take intoaccount the Walloon area. We would expect employment rates to be lower if this region was also includedin the survey.
10
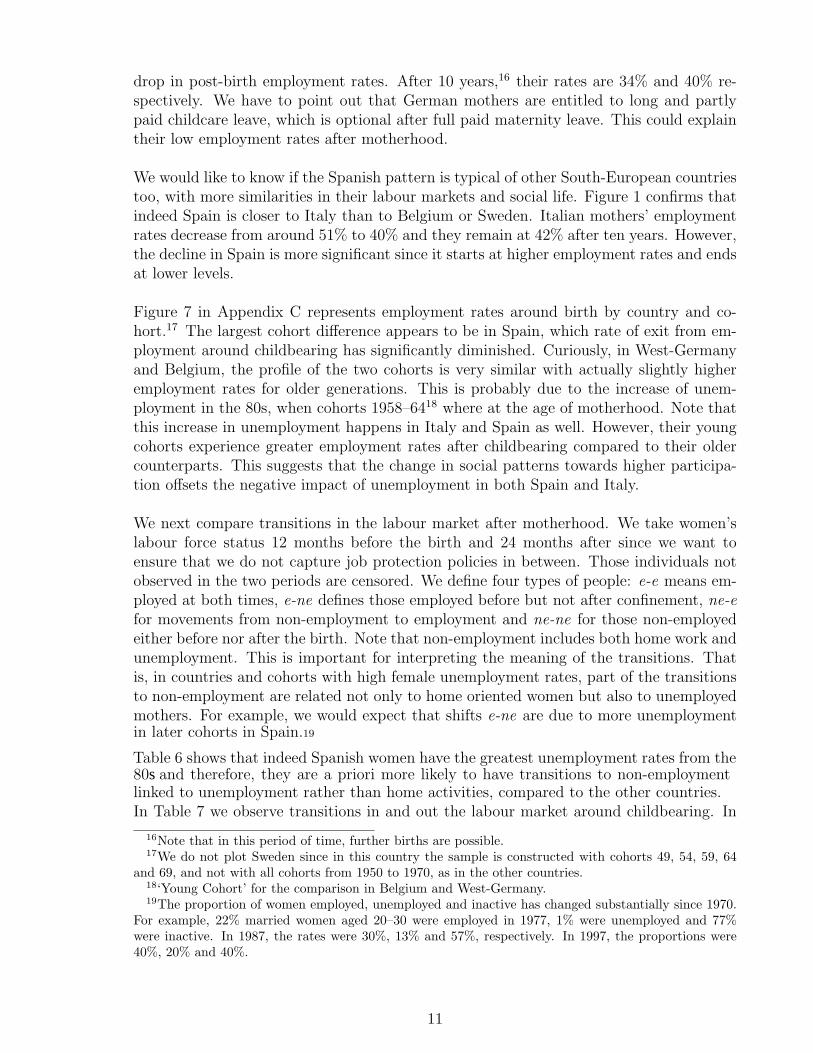
drop in post-birth employment rates. After 10 years,16 their rates are 34% and 40% re-spectively. We have to point out that German mothers are entitled to long and partlypaid childcare leave, which is optional after full paid maternity leave. This could explaintheir low employment rates after motherhood.
We would like to know if the Spanish pattern is typical of other South-European countriestoo, with more similarities in their labour markets and social life. Figure 1 confirms thatindeed Spain is closer to Italy than to Belgium or Sweden. Italian mothers’ employmentrates decrease from around 51% to 40% and they remain at 42% after ten years. However,the decline in Spain is more significant since it starts at higher employment rates and endsat lower levels.
Figure 7 in Appendix C represents employment rates around birth by country and co-hort.17 The largest cohort difference appears to be in Spain, which rate of exit from em-ployment around childbearing has significantly diminished. Curiously, in West-Germanyand Belgium, the profile of the two cohorts is very similar with actually slightly higheremployment rates for older generations. This is probably due to the increase of unem-ployment in the 80s, when cohorts 1958–6418 where at the age of motherhood. Note thatthis increase in unemployment happens in Italy and Spain as well. However, their youngcohorts experience greater employment rates after childbearing compared to their oldercounterparts. This suggests that the change in social patterns towards higher participa-tion offsets the negative impact of unemployment in both Spain and Italy.
We next compare transitions in the labour market after motherhood. We take women’slabour force status 12 months before the birth and 24 months after since we want toensure that we do not capture job protection policies in between. Those individuals notobserved in the two periods are censored. We define four types of people: e-e means em-ployed at both times, e-ne defines those employed before but not after confinement, ne-efor movements from non-employment to employment and ne-ne for those non-employedeither before nor after the birth. Note that non-employment includes both home work andunemployment. This is important for interpreting the meaning of the transitions. Thatis, in countries and cohorts with high female unemployment rates, part of the transitionsto non-employment are related not only to home oriented women but also to unemployedmothers. For example, we would expect that shifts e-ne are due to more unemploymentin later cohorts in Spain.19
Table 6 shows that indeed Spanish women have the greatest unemployment rates from the80s and therefore, they are a priori more likely to have transitions to non-employmentlinked to unemployment rather than home activities, compared to the other countries.In Table 7 we observe transitions in and out the labour market around childbearing. In
16Note that in this period of time, further births are possible.17We do not plot Sweden since in this country the sample is constructed with cohorts 49, 54, 59, 64
and 69, and not with all cohorts from 1950 to 1970, as in the other countries.18‘Young Cohort’ for the comparison in Belgium and West-Germany.19The proportion of women employed, unemployed and inactive has changed substantially since 1970.
For example, 22% married women aged 20–30 were employed in 1977, 1% were unemployed and 77%were inactive. In 1987, the rates were 30%, 13% and 57%, respectively. In 1997, the proportions were40%, 20% and 40%.
11
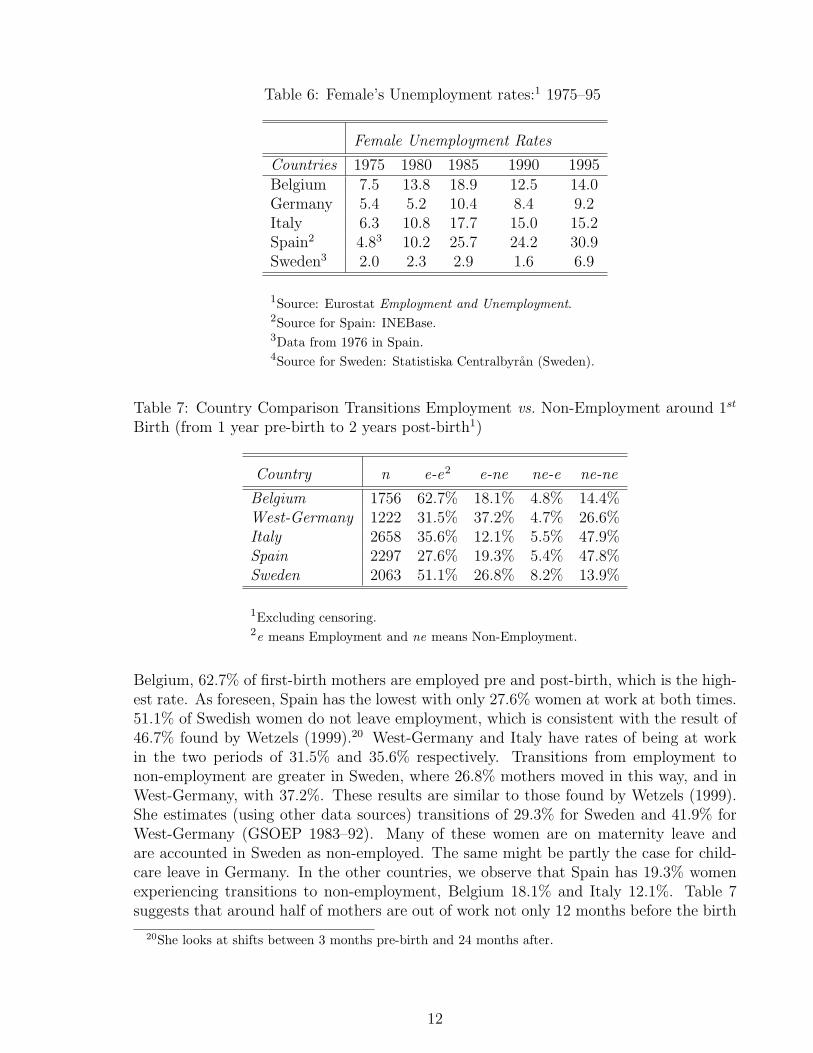
Table 6: Female’s Unemployment rates:1 1975–95
Female Unemployment Rates
Countries 1975 1980 1985 1990 1995Belgium 7.5 13.8 18.9 12.5 14.0Germany 5.4 5.2 10.4 8.4 9.2Italy 6.3 10.8 17.7 15.0 15.2Spain2 4.83 10.2 25.7 24.2 30.9Sweden3 2.0 2.3 2.9 1.6 6.9
1Source: Eurostat Employment and Unemployment.2Source for Spain: INEBase.3Data from 1976 in Spain.4Source for Sweden: Statistiska Centralbyran (Sweden).
Table 7: Country Comparison Transitions Employment vs. Non-Employment around 1st
Birth (from 1 year pre-birth to 2 years post-birth1)
Country n e-e2 e-ne ne-e ne-ne
Belgium 1756 62.7% 18.1% 4.8% 14.4%West-Germany 1222 31.5% 37.2% 4.7% 26.6%Italy 2658 35.6% 12.1% 5.5% 47.9%Spain 2297 27.6% 19.3% 5.4% 47.8%Sweden 2063 51.1% 26.8% 8.2% 13.9%
1Excluding censoring.2e means Employment and ne means Non-Employment.
Belgium, 62.7% of first-birth mothers are employed pre and post-birth, which is the high-est rate. As foreseen, Spain has the lowest with only 27.6% women at work at both times.51.1% of Swedish women do not leave employment, which is consistent with the result of46.7% found by Wetzels (1999).20 West-Germany and Italy have rates of being at workin the two periods of 31.5% and 35.6% respectively. Transitions from employment tonon-employment are greater in Sweden, where 26.8% mothers moved in this way, and inWest-Germany, with 37.2%. These results are similar to those found by Wetzels (1999).She estimates (using other data sources) transitions of 29.3% for Sweden and 41.9% forWest-Germany (GSOEP 1983–92). Many of these women are on maternity leave andare accounted in Sweden as non-employed. The same might be partly the case for child-care leave in Germany. In the other countries, we observe that Spain has 19.3% womenexperiencing transitions to non-employment, Belgium 18.1% and Italy 12.1%. Table 7suggests that around half of mothers are out of work not only 12 months before the birth
20She looks at shifts between 3 months pre-birth and 24 months after.
12
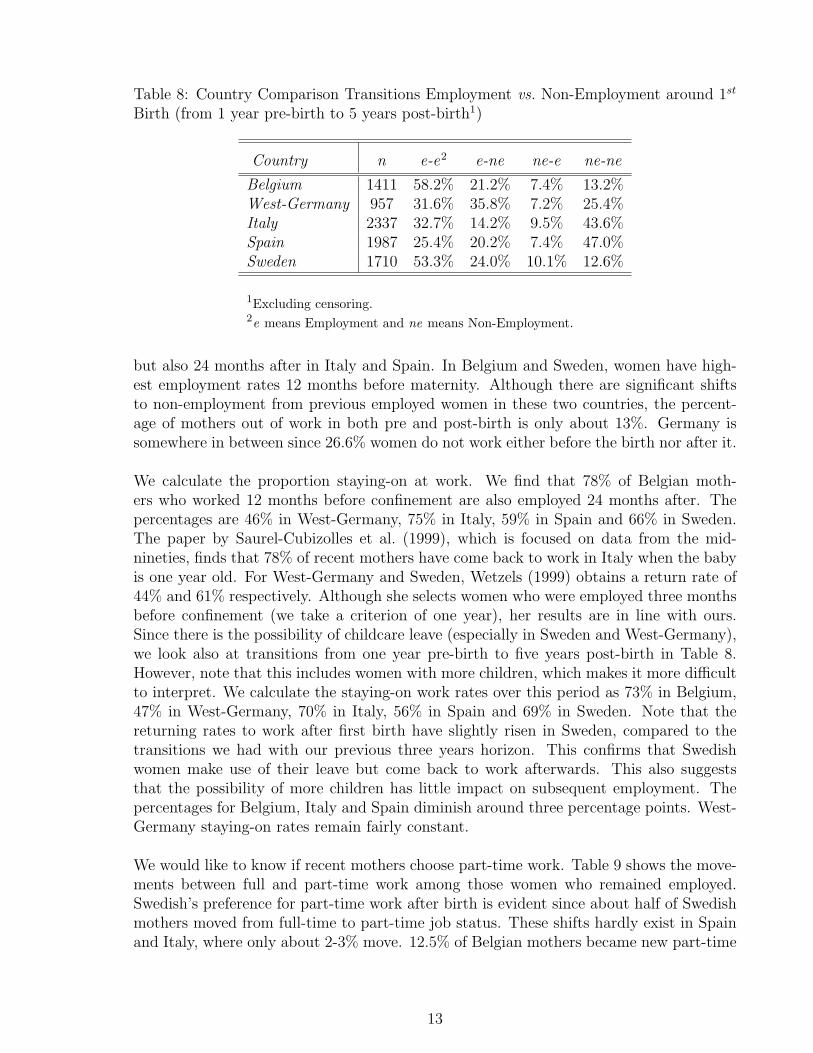
Table 8: Country Comparison Transitions Employment vs. Non-Employment around 1st
Birth (from 1 year pre-birth to 5 years post-birth1)
Country n e-e2 e-ne ne-e ne-ne
Belgium 1411 58.2% 21.2% 7.4% 13.2%West-Germany 957 31.6% 35.8% 7.2% 25.4%Italy 2337 32.7% 14.2% 9.5% 43.6%Spain 1987 25.4% 20.2% 7.4% 47.0%Sweden 1710 53.3% 24.0% 10.1% 12.6%
1Excluding censoring.2e means Employment and ne means Non-Employment.
but also 24 months after in Italy and Spain. In Belgium and Sweden, women have high-est employment rates 12 months before maternity. Although there are significant shiftsto non-employment from previous employed women in these two countries, the percent-age of mothers out of work in both pre and post-birth is only about 13%. Germany issomewhere in between since 26.6% women do not work either before the birth nor after it.
We calculate the proportion staying-on at work. We find that 78% of Belgian moth-ers who worked 12 months before confinement are also employed 24 months after. Thepercentages are 46% in West-Germany, 75% in Italy, 59% in Spain and 66% in Sweden.The paper by Saurel-Cubizolles et al. (1999), which is focused on data from the mid-nineties, finds that 78% of recent mothers have come back to work in Italy when the babyis one year old. For West-Germany and Sweden, Wetzels (1999) obtains a return rate of44% and 61% respectively. Although she selects women who were employed three monthsbefore confinement (we take a criterion of one year), her results are in line with ours.Since there is the possibility of childcare leave (especially in Sweden and West-Germany),we look also at transitions from one year pre-birth to five years post-birth in Table 8.However, note that this includes women with more children, which makes it more difficultto interpret. We calculate the staying-on work rates over this period as 73% in Belgium,47% in West-Germany, 70% in Italy, 56% in Spain and 69% in Sweden. Note that thereturning rates to work after first birth have slightly risen in Sweden, compared to thetransitions we had with our previous three years horizon. This confirms that Swedishwomen make use of their leave but come back to work afterwards. This also suggeststhat the possibility of more children has little impact on subsequent employment. Thepercentages for Belgium, Italy and Spain diminish around three percentage points. West-Germany staying-on rates remain fairly constant.
We would like to know if recent mothers choose part-time work. Table 9 shows the move-ments between full and part-time work among those women who remained employed.Swedish’s preference for part-time work after birth is evident since about half of Swedishmothers moved from full-time to part-time job status. These shifts hardly exist in Spainand Italy, where only about 2-3% move. 12.5% of Belgian mothers became new part-time
13
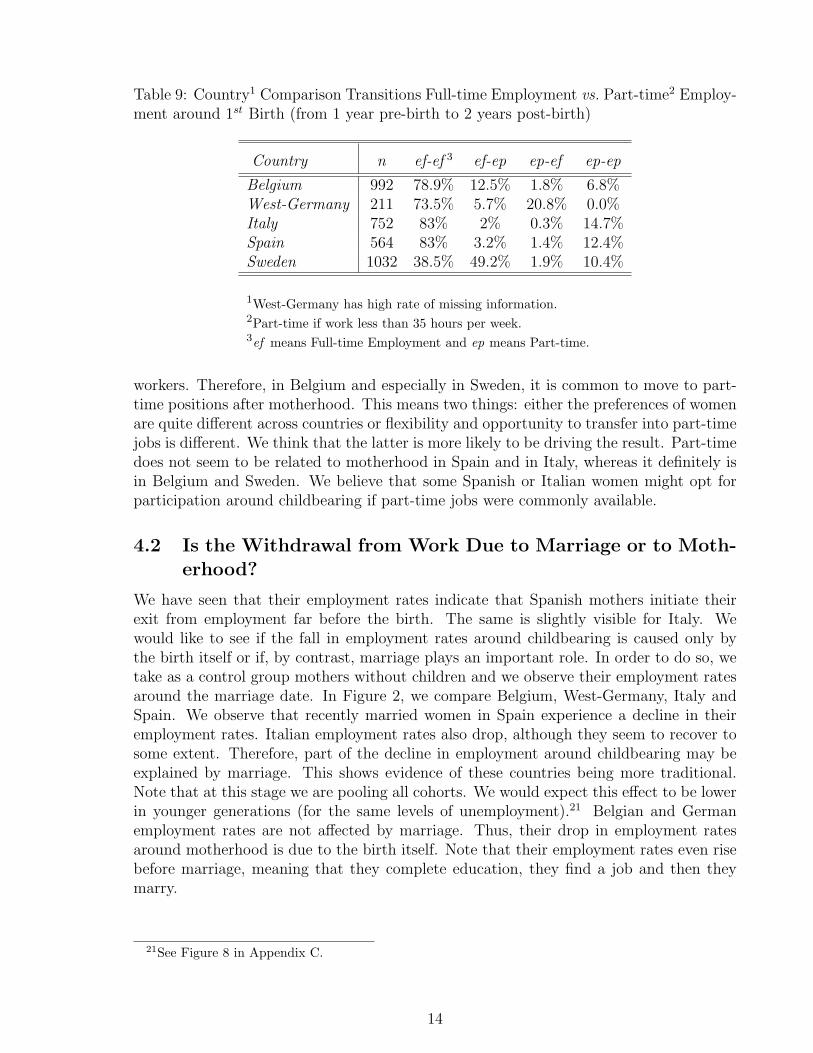
Table 9: Country1 Comparison Transitions Full-time Employment vs. Part-time2 Employ-ment around 1st Birth (from 1 year pre-birth to 2 years post-birth)
Country n ef-ef 3 ef-ep ep-ef ep-ep
Belgium 992 78.9% 12.5% 1.8% 6.8%West-Germany 211 73.5% 5.7% 20.8% 0.0%Italy 752 83% 2% 0.3% 14.7%Spain 564 83% 3.2% 1.4% 12.4%Sweden 1032 38.5% 49.2% 1.9% 10.4%
1West-Germany has high rate of missing information.2Part-time if work less than 35 hours per week.3ef means Full-time Employment and ep means Part-time.
workers. Therefore, in Belgium and especially in Sweden, it is common to move to part-time positions after motherhood. This means two things: either the preferences of womenare quite different across countries or flexibility and opportunity to transfer into part-timejobs is different. We think that the latter is more likely to be driving the result. Part-timedoes not seem to be related to motherhood in Spain and in Italy, whereas it definitely isin Belgium and Sweden. We believe that some Spanish or Italian women might opt forparticipation around childbearing if part-time jobs were commonly available.
4.2 Is the Withdrawal from Work Due to Marriage or to Moth-erhood?
We have seen that their employment rates indicate that Spanish mothers initiate theirexit from employment far before the birth. The same is slightly visible for Italy. Wewould like to see if the fall in employment rates around childbearing is caused only bythe birth itself or if, by contrast, marriage plays an important role. In order to do so, wetake as a control group mothers without children and we observe their employment ratesaround the marriage date. In Figure 2, we compare Belgium, West-Germany, Italy andSpain. We observe that recently married women in Spain experience a decline in theiremployment rates. Italian employment rates also drop, although they seem to recover tosome extent. Therefore, part of the decline in employment around childbearing may beexplained by marriage. This shows evidence of these countries being more traditional.Note that at this stage we are pooling all cohorts. We would expect this effect to be lowerin younger generations (for the same levels of unemployment).21 Belgian and Germanemployment rates are not affected by marriage. Thus, their drop in employment ratesaround motherhood is due to the birth itself. Note that their employment rates even risebefore marriage, meaning that they complete education, they find a job and then theymarry.
21See Figure 8 in Appendix C.
14
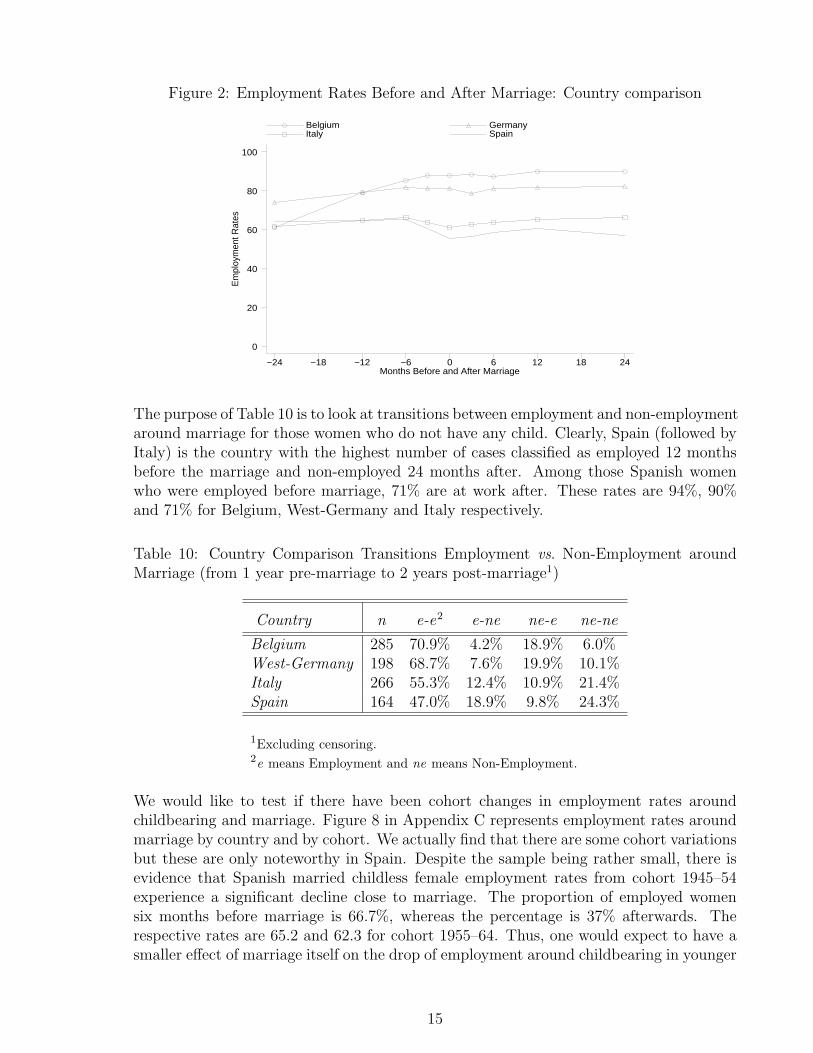
Figure 2: Employment Rates Before and After Marriage: Country comparison
Em
ploy
men
t Rat
es
Months Before and After Marriage
Belgium Germany Italy Spain
−24 −18 −12 −6 0 6 12 18 24
0
20
40
60
80
100
The purpose of Table 10 is to look at transitions between employment and non-employmentaround marriage for those women who do not have any child. Clearly, Spain (followed byItaly) is the country with the highest number of cases classified as employed 12 monthsbefore the marriage and non-employed 24 months after. Among those Spanish womenwho were employed before marriage, 71% are at work after. These rates are 94%, 90%and 71% for Belgium, West-Germany and Italy respectively.
Table 10: Country Comparison Transitions Employment vs. Non-Employment aroundMarriage (from 1 year pre-marriage to 2 years post-marriage1)
Country n e-e2 e-ne ne-e ne-ne
Belgium 285 70.9% 4.2% 18.9% 6.0%West-Germany 198 68.7% 7.6% 19.9% 10.1%Italy 266 55.3% 12.4% 10.9% 21.4%Spain 164 47.0% 18.9% 9.8% 24.3%
1Excluding censoring.2e means Employment and ne means Non-Employment.
We would like to test if there have been cohort changes in employment rates aroundchildbearing and marriage. Figure 8 in Appendix C represents employment rates aroundmarriage by country and by cohort. We actually find that there are some cohort variationsbut these are only noteworthy in Spain. Despite the sample being rather small, there isevidence that Spanish married childless female employment rates from cohort 1945–54experience a significant decline close to marriage. The proportion of employed womensix months before marriage is 66.7%, whereas the percentage is 37% afterwards. Therespective rates are 65.2 and 62.3 for cohort 1955–64. Thus, one would expect to have asmaller effect of marriage itself on the drop of employment around childbearing in younger
15
generations. This generational evolution in employment rates around marriage is not asimportant in the other countries.22
5 Model
Our purpose is to determine how a woman’s observed characteristics before her first birthaffect her probability of working after the baby is born. We are interested in transitionsfrom employment (12 months before the birth) to non-employment.
Mothers who were at work before the birth decide monthly after the birth if they par-ticipate in the labour market. They maximise their utility subject to their budget andtime constraint (see Becker, 1993) for further details on family-labour supply models). Forgiven preferences, family and taxation policies have an impact on the mother’s budget (e.gsubsidies for childcare) and time constraint (public available child-care or flexible23 hours),and these policies could make it more likely that women participate, ceteris paribus. Si-multaneously, mothers who choose to be active are affected by job opportunities (i.eunemployment rates) that resolve if they are employed. These job opportunities also dif-fer across countries. In our analysis, we estimate a reduced form for the employment afterchildbearing that embodies both the decision process and the economic situation.
In order to have a comparable sample, we use those cohorts and observable years that arecommon among our countries. These are cohorts 1951–1970,24 and years up to 1993.25
We estimate a probit model that takes into account the sample selection that arises frombeing employed or not before the birth. We first determine the characteristics that makeit more likely to belong to the sub-sample of being at work before the birth and thenthe factors that determine that this sub-group is employed or not after the birth. In theselection equation we control for the unemployment rates in order to identify the model.In the restricted sample (women who were at work 12 months before childbearing) wehave 1603 individuals for Belgium, 935 for West-Germany, 960 for Italy, 914 for Spainand 1783 for Sweden.
The main tool we use is the Latent Variable Model for Binary Variables.26 We observe abinary variable Eit, which is a woman i labour force participation at time t. This variableEit can only be observed in two states: a woman is at work (Eit=1) or not (Eit=0).Nevertheless, not all women in the labour force are there with the same certainty. Wesuppose that there is an unobserved or so-called latent variable Ei
∗t that generates the
observed Eit’s. Those women who have larger values of Ei∗t are observed as Eit=1, while
22We are surprised about the rather small cohort variation in Italy. We would have expected a closerpattern with respect to Spain.
23Notice that if women have full flexibility on the number of hours, they face a continuous timeconstraint. By contrast, if they must either work full-time or not work, they face a kink in the timeconstraint that could lead them to non-participation with higher probability.
241949–69 for Sweden and 1952–70 for West-Germany.25Notice that FFS’s interviews are done between 1995–96 in Spain and Italy, which means that we
observe individuals from equal cohort longer in these two countries. We artificially constrain their historyup to 1993.
26We base our model description on Long (1997).
16
those with smaller values of Ei∗t are observed as Eit=0. The idea of a latent Ei
∗t is that
there is an underlying propensity to work that generates the observed state through thefollowing measurement equation:
Eit =
{1 if Ei
∗t > τ
0 if Ei∗t <= τ
(1)
where τ is the threshold.
The latent Ei∗t is assumed to be linearly related to the observed characteristics xit by
the structural model:Ei
∗t = xitβ + εit (2)
Although we are not able to observe Ei∗t , a change in Ei
∗t results in a change in what we
indeed observe, namely, whether a woman is at work at that time. Some characteristics,for example, the number of children in the household, will modify the woman’s propensityto be employed as opposed to working at home. We would expect that a new birth willdiminish the propensity to work up to a point to overcome a threshold that makes thiswoman decide to leave the labour force and stay at home.
Since E=1 when E∗ > 0 and E∗ = xβ + ε,
Pr(E = 1|x) = Pr(E∗ > 0|x) = Pr(xβ + ε > 0|x) = Pr(ε > −xβ|x).27
We assume that our errors follow a normal distribution with E(ε|x) = 0, which resultin the probit model. The normal distribution is symmetric, meaning that Pr(E = 1|x) =Pr(ε <= xβ|x). This is the cumulative density function of the error distribution evaluatedat xβ. Consequently,
Pr(E = 1|x) = Φ(xβ) (3)
These models permit us to compute how different explanatory variables affect the prob-ability that an individual belongs to a particular status (categorical dependent variable).Here, the probit estimation has the target to determine the probability of a woman withcertain characteristics being at work or not. Since we are interested in the evolution of awoman’s career post-first-birth, we estimate a monthly probit28 from the moment of birthonwards.
If observations are independent, the general likelihood function of a probit model is:
L(β/E,X) =∏E=1
Φ(xiβ)∏E=0
(1− Φ(xiβ)) (4)
E is a random variable that takes value 1 if the individual is employed and 0 otherwise.In our probit, we have the following specification:
L(β/E, X) =∏E=1
Φ(αtDt +∑
k
βkxkit)∏E=0
(1− Φ(αtDt +∑
k
βkxkit)) (5)
27We take the threshold τ as zero. There is no loss of generality here because the threshold is absorbedinto the constant term.
28We assume that the errors are normally distributed.
17
Dt is a matrix with 96 columns, one for each month after motherhood.29 For example, D1
is a column vector that takes value 1 for each individual at the month one after birth and0 otherwise. Similarly, D2 takes value 1 at month 2 after confinement and 0 otherwise,and so on. xkit is a vector of explanatory variable k for each individual i and time afterbirth t. βk is the vector of the coefficients of the explanatory variables and αt is the vectorwith the coefficients of the time effects. If we maximise the log-likelihood of the previousexpression, we will find the estimates for βk and αt. Note that we do not observe allindividuals after first motherhood up to 96 months, which means that the contribution ofeach individual to the whole explanatory matrix does not have the same length. We areaware that observing individuals over a heterogenous period of time might produce mis-leading estimates because their may be a systematic relationship between period of stayin the sample and employment status. In order to check this, we re-estimate the samemodel and restrict the sample to those individuals who appear throughout the period(older individuals). After this restriction, we have 1062 observations in Belgium, 688 inWest-Germany, 2056 in Italy, 1684 in Spain and 1410 in Sweden. Results (see Table 17 inAppendix B) are numerically similar to those estimated with the whole sample (Table 11).
To facilitate the interpretation of the results, we plot the predicted probability pathof being at work for different representative individuals (called RI). The estimated prob-ability of being employed at each month after first birth is given by the next expression,where we substitute our selected values for xkRIt.
Prob(E = 1)RIt = Φ(αtDt +∑
k
βkxkRIt) (6)
For this exercise, we are also interested in analysing the evolution through time of theimpact of education on employment after childbearing. We re-estimate our probit withinteractions between E3GrPo30 and our time dummies. We reduce the time dummiesto D3, D6, D12, D24, D48, and D96. This means that we plot the probability of beingemployed at each of these post-birth periods.
Table 11 shows the marginal effects of the probability of employment after childbear-ing. We observe that the higher the level of education31 achieved pre-confinement, themore likely are mothers to remain employed after childbearing. Interestingly, education issignificant in all countries except for Sweden, which means that Swedish mothers’ employ-ment after first birth is less affected by their differences in education. This result is in linewith the paper by Gustafsson et al. (1996). They show that human capital is not a maindeterminant for re-entry in Sweden, whereas it is in Germany and Great Britain. Swedenis characterised by its generous public childcare provision, which means that many women
29We analyse post-birth labour force status up to 96 months after the confinement.30Dummy (1 if highest education is university or post-graduate degree).31It would be interesting to control for partner’s education as a proxy for the effect of external income
on female labour supply. However, partner’s education is only available at the interview’s date (not retro-spectively). Although this could be a good proxy for Spain or Italy (where most women are married whenchildbearing and there are few divorces), it is not for Sweden or West-Germany. In Gutierrez-Domenech(2002), we control for partner’s education and find that Spanish women whose partner have mediumeducation are less likely to work after childbearing, ceteris paribus, compared to those whose partnershave no qualifications. However, mothers with graduate husband’s are more likely to be employed.
18
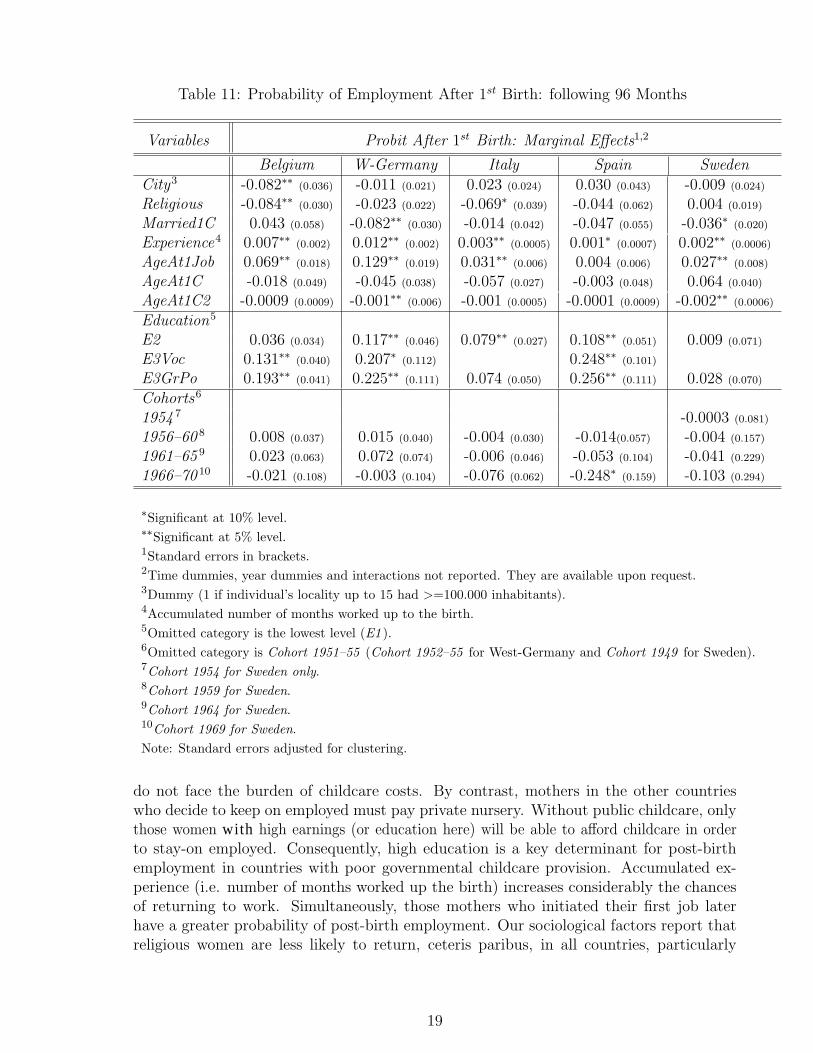
Table 11: Probability of Employment After 1st Birth: following 96 Months
Variables Probit After 1st Birth: Marginal Effects1,2
Belgium W-Germany Italy Spain SwedenCity3 -0.082∗∗ (0.036) -0.011 (0.021) 0.023 (0.024) 0.030 (0.043) -0.009 (0.024)
Religious -0.084∗∗ (0.030) -0.023 (0.022) -0.069∗ (0.039) -0.044 (0.062) 0.004 (0.019)
Married1C 0.043 (0.058) -0.082∗∗ (0.030) -0.014 (0.042) -0.047 (0.055) -0.036∗ (0.020)
Experience4 0.007∗∗ (0.002) 0.012∗∗ (0.002) 0.003∗∗ (0.0005) 0.001∗ (0.0007) 0.002∗∗ (0.0006)
AgeAt1Job 0.069∗∗ (0.018) 0.129∗∗ (0.019) 0.031∗∗ (0.006) 0.004 (0.006) 0.027∗∗ (0.008)
AgeAt1C -0.018 (0.049) -0.045 (0.038) -0.057 (0.027) -0.003 (0.048) 0.064 (0.040)
AgeAt1C2 -0.0009 (0.0009) -0.001∗∗ (0.006) -0.001 (0.0005) -0.0001 (0.0009) -0.002∗∗ (0.0006)
Education5
E2 0.036 (0.034) 0.117∗∗ (0.046) 0.079∗∗ (0.027) 0.108∗∗ (0.051) 0.009 (0.071)
E3Voc 0.131∗∗ (0.040) 0.207∗ (0.112) 0.248∗∗ (0.101)
E3GrPo 0.193∗∗ (0.041) 0.225∗∗ (0.111) 0.074 (0.050) 0.256∗∗ (0.111) 0.028 (0.070)
Cohorts6
1954 7 -0.0003 (0.081)
1956–60 8 0.008 (0.037) 0.015 (0.040) -0.004 (0.030) -0.014(0.057) -0.004 (0.157)
1961–65 9 0.023 (0.063) 0.072 (0.074) -0.006 (0.046) -0.053 (0.104) -0.041 (0.229)
1966–70 10 -0.021 (0.108) -0.003 (0.104) -0.076 (0.062) -0.248∗ (0.159) -0.103 (0.294)
∗Significant at 10% level.∗∗Significant at 5% level.1Standard errors in brackets.2Time dummies, year dummies and interactions not reported. They are available upon request.3Dummy (1 if individual’s locality up to 15 had >=100.000 inhabitants).4Accumulated number of months worked up to the birth.5Omitted category is the lowest level (E1 ).6Omitted category is Cohort 1951–55 (Cohort 1952–55 for West-Germany and Cohort 1949 for Sweden).7Cohort 1954 for Sweden only.8Cohort 1959 for Sweden.9Cohort 1964 for Sweden.10Cohort 1969 for Sweden.Note: Standard errors adjusted for clustering.
do not face the burden of childcare costs. By contrast, mothers in the other countrieswho decide to keep on employed must pay private nursery. Without public childcare, onlythose women with high earnings (or education here) will be able to afford childcare in orderto stay-on employed. Consequently, high education is a key determinant for post-birthemployment in countries with poor governmental childcare provision. Accumulated ex-perience (i.e. number of months worked up the birth) increases considerably the chancesof returning to work. Simultaneously, those mothers who initiated their first job laterhave a greater probability of post-birth employment. Our sociological factors report thatreligious women are less likely to return, ceteris paribus, in all countries, particularly
19
in Belgium and Spain. The size of the city where the individual grew up impacts nega-tively on the probability of post-birth employment all countries, except in Italy and Spain.
Until now we have made no attempt to separate out the effect of future fertility patternson post-birth employment from other more direct effects. Thus, variables influencingpost-first birth employment can operate either directly or via their impact on subsequentfertility. To give some idea of the implications, we estimate the probability of employmentafter first birth only for those women who remain with one child. Of course, this means weare selecting a sub-sample based on a variable which may be endogenous to employment.Nevertheless, the subsequent results will still be informative. The number of observationsis 663 in Belgium, 574 in West-Germany, 965 in Italy, 711 in Spain and 600 in Sweden.Table 18 in Appendix B shows the results for this sub-sample. With this new estimation,we observe that religion loses generally the negative impact that it had in the estimationwith the whole sample. This suggests that religion effect is operating via its impact onfuture fertility. The coefficients on the remaining characteristics change little but bothestimations differ substantially in the duration and calendar year dummies.
6 Simulation
In this section we focus on two issues. First, we are interested in whether the probabilityof post-birth employment has experienced variations in time within each country. Forinstance, do mothers in 1990 have a greater probability of post-birth employment thantheir counterparts in 1973? Second, we would like to take a representative individual andobserve her probability of post-birth employment, given that she is mother in Belgium,West-Germany, Italy, Spain or Sweden.32
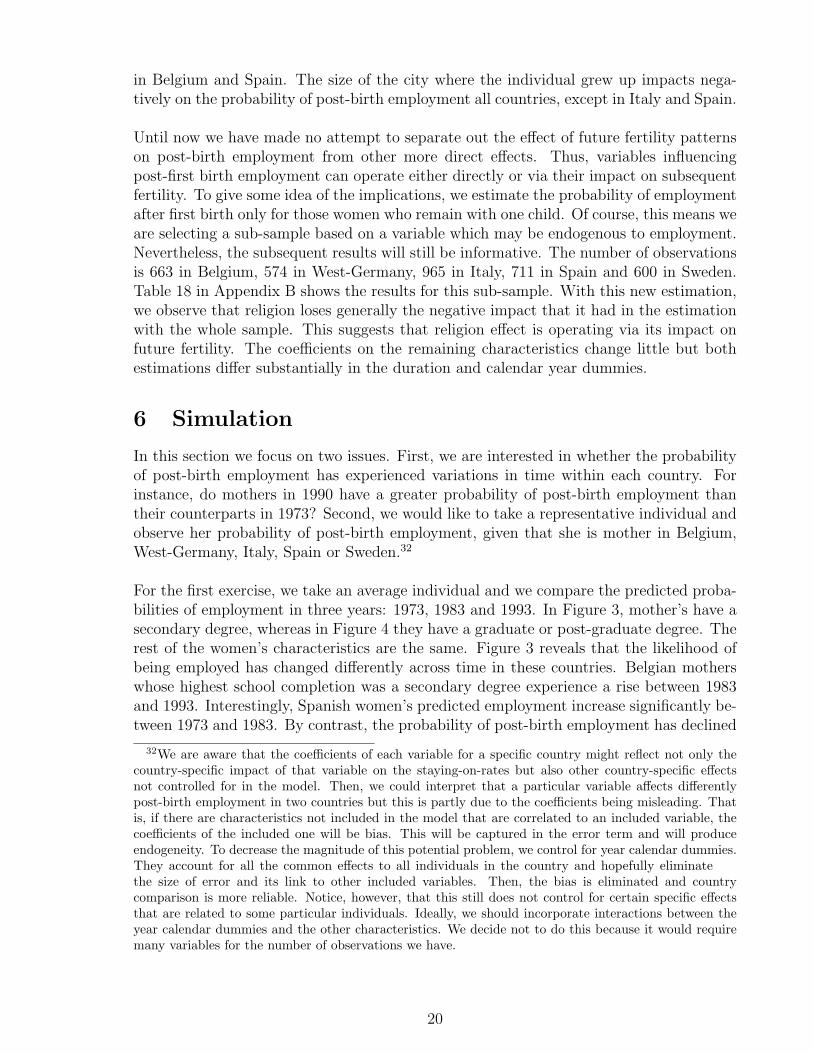
For the first exercise, we take an average individual and we compare the predicted proba-bilities of employment in three years: 1973, 1983 and 1993. In Figure 3, mother’s have asecondary degree, whereas in Figure 4 they have a graduate or post-graduate degree. Therest of the women’s characteristics are the same. Figure 3 reveals that the likelihood ofbeing employed has changed differently across time in these countries. Belgian motherswhose highest school completion was a secondary degree experience a rise between 1983and 1993. Interestingly, Spanish women’s predicted employment increase significantly be-tween 1973 and 1983. By contrast, the probability of post-birth employment has declined
32We are aware that the coefficients of each variable for a specific country might reflect not only thecountry-specific impact of that variable on the staying-on-rates but also other country-specific effectsnot controlled for in the model. Then, we could interpret that a particular variable affects differentlypost-birth employment in two countries but this is partly due to the coefficients being misleading. Thatis, if there are characteristics not included in the model that are correlated to an included variable, thecoefficients of the included one will be bias. This will be captured in the error term and will produceendogeneity. To decrease the magnitude of this potential problem, we control for year calendar dummies.They account for all the common effects to all individuals in the country and hopefully eliminatethe size of error and its link to other included variables. Then, the bias is eliminated and countrycomparison is more reliable. Notice, however, that this still does not control for certain specific effectsthat are related to some particular individuals. Ideally, we should incorporate interactions between theyear calendar dummies and the other characteristics. We decide not to do this because it would requiremany variables for the number of observations we have.
20
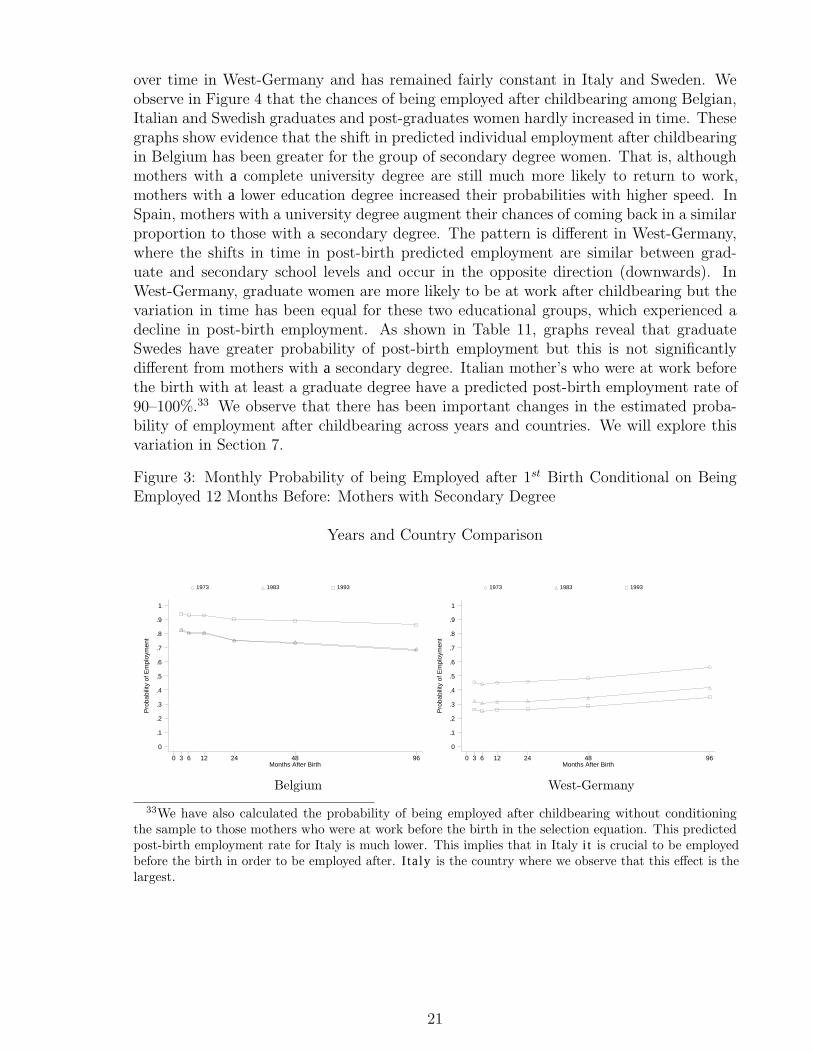
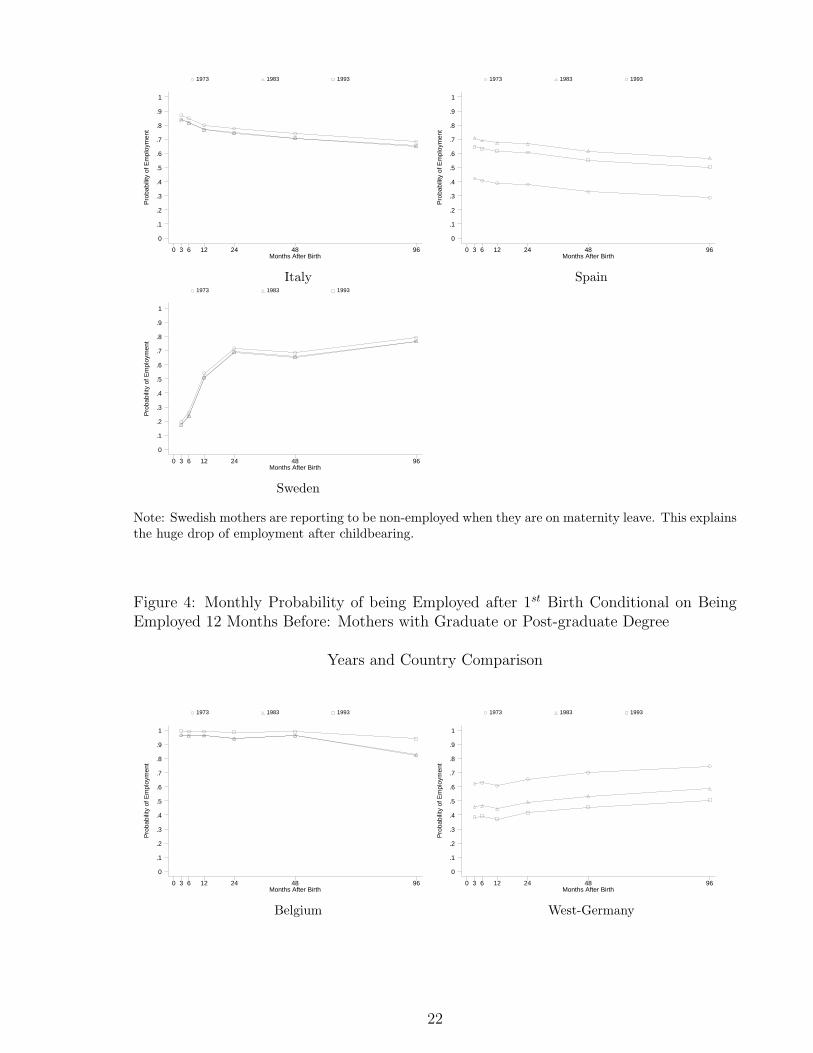
over time in West-Germany and has remained fairly constant in Italy and Sweden. Weobserve in Figure 4 that the chances of being employed after childbearing among Belgian,Italian and Swedish graduates and post-graduates women hardly increased in time. Thesegraphs show evidence that the shift in predicted individual employment after childbearingin Belgium has been greater for the group of secondary degree women. That is, althoughmothers with a complete university degree are still much more likely to return to work,mothers with a lower education degree increased their probabilities with higher speed. InSpain, mothers with a university degree augment their chances of coming back in a similarproportion to those with a secondary degree. The pattern is different in West-Germany,where the shifts in time in post-birth predicted employment are similar between grad-uate and secondary school levels and occur in the opposite direction (downwards). InWest-Germany, graduate women are more likely to be at work after childbearing but thevariation in time has been equal for these two educational groups, which experienced adecline in post-birth employment. As shown in Table 11, graphs reveal that graduateSwedes have greater probability of post-birth employment but this is not significantlydifferent from mothers with a secondary degree. Italian mother’s who were at work beforethe birth with at least a graduate degree have a predicted post-birth employment rate of90–100%.33 We observe that there has been important changes in the estimated proba-bility of employment after childbearing across years and countries. We will explore thisvariation in Section 7.
Figure 3: Monthly Probability of being Employed after 1st Birth Conditional on BeingEmployed 12 Months Before: Mothers with Secondary Degree
Years and Country Comparison
Pro
babi
lity
of E
mpl
oym
ent
Months After Birth0 3 6 12 24 48 96
0
.1
.2
.3
.4
.5
.6
.7
.8
.9
1
1973 1983 1993
Belgium
Pro
babi
lity
of E
mpl
oym
ent
Months After Birth0 3 6 12 24 48 96
0
.1
.2
.3
.4
.5
.6
.7
.8
.9
1
1973 1983 1993
West-Germany
33We have also calculated the probability of being employed after childbearing without conditioningthe sample to those mothers who were at work before the birth in the selection equation. This predictedpost-birth employment rate for Italy is much lower. This implies that in Italy i t is crucial to be employedbefore the birth in order to be employed after. I ta ly is the country where we observe that this effect is thelargest.
21
Pro
babi
lity
of E
mpl
oym
ent
Months After Birth0 3 6 12 24 48 96
0
.1
.2
.3
.4
.5
.6
.7
.8
.9
1
1973 1983 1993
Italy
Pro
babi
lity
of E
mpl
oym
ent
Months After Birth0 3 6 12 24 48 96
0
.1
.2
.3
.4
.5
.6
.7
.8
.9
1
1973 1983 1993
Spain
Pro
babi
lity
of E
mpl
oym
ent
Months After Birth0 3 6 12 24 48 96
0
.1
.2
.3
.4
.5
.6
.7
.8
.9
1
1973 1983 1993
Sweden
Note: Swedish mothers are reporting to be non-employed when they are on maternity leave. This explainsthe huge drop of employment after childbearing.
Figure 4: Monthly Probability of being Employed after 1st Birth Conditional on BeingEmployed 12 Months Before: Mothers with Graduate or Post-graduate Degree
Years and Country Comparison
Pro
babi
lity
of E
mpl
oym
ent
Months After Birth0 3 6 12 24 48 96
0
.1
.2
.3
.4
.5
.6
.7
.8
.9
1
1973 1983 1993
Belgium
Pro
babi
lity
of E
mpl
oym
ent
Months After Birth0 3 6 12 24 48 96
0
.1
.2
.3
.4
.5
.6
.7
.8
.9
1
1973 1983 1993
West-Germany
22
Pro
babi
lity
of E
mpl
oym
ent
Months After Birth0 3 6 12 24 48 96
0
.1
.2
.3
.4
.5
.6
.7
.8
.9
1
1973 1983 1993
Italy
Pro
babi
lity
of E
mpl
oym
ent
Months After Birth0 3 6 12 24 48 96
0
.1
.2
.3
.4
.5
.6
.7
.8
.9
1
1973 1983 1993
Spain
Pro
babi
lity
of E
mpl
oym
ent
Months After Birth0 3 6 12 24 48 96
0
.1
.2
.3
.4
.5
.6
.7
.8
.9
1
1973 1983 1993
Sweden
Note: Swedish mothers are reporting to be non-employed when they are on maternity leave. This explainsthe huge drop of employment after childbearing.
Figure 5: Monthly Probability of being Employed after 1st Birth Conditional on BeingEmployed 12 Months Before: Mothers with Secondary Degree
Pro
babi
lity
of E
mpl
oym
ent
Months After Birth0 3 6 12 24 48 96
0
.1
.2
.3
.4
.5
.6
.7
.8
.9
1
Belgium West−Germany Italy
Spain Sweden
1973
Pro
babi
lity
of E
mpl
oym
ent
Months After Birth0 3 6 12 24 48 96
0
.1
.2
.3
.4
.5
.6
.7
.8
.9
1
Belgium West−Germany Italy
Spain Sweden
1993
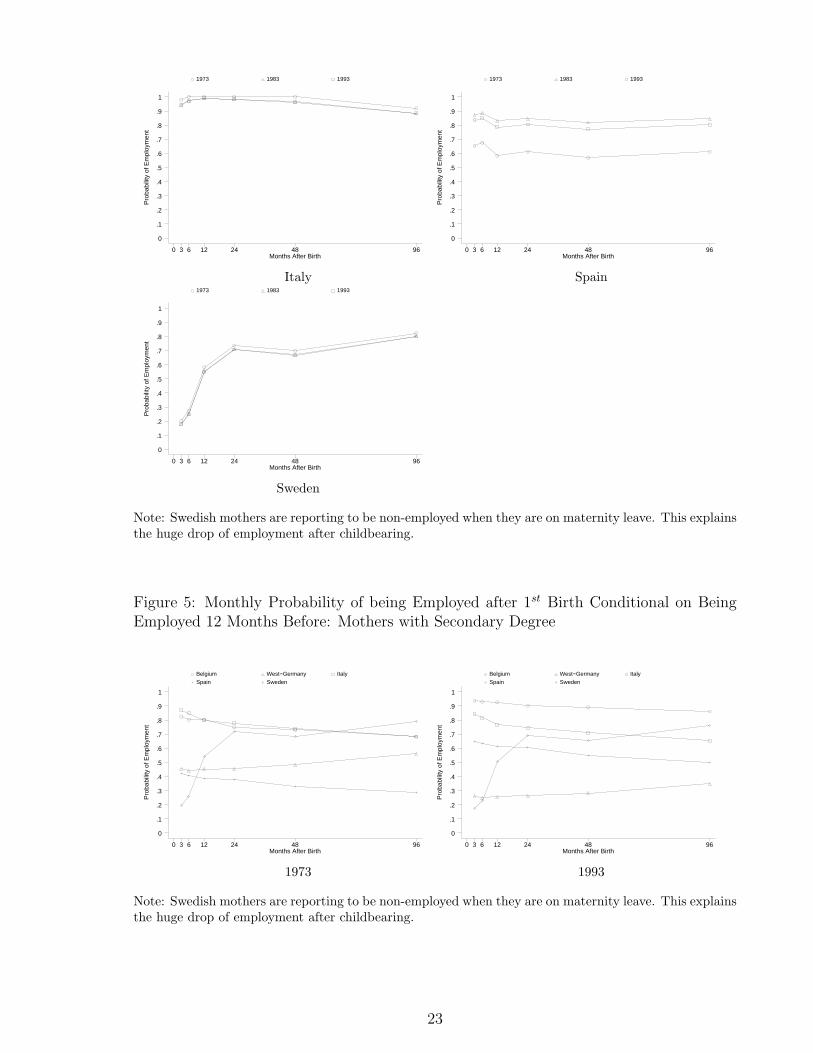
Note: Swedish mothers are reporting to be non-employed when they are on maternity leave. This explainsthe huge drop of employment after childbearing.
23
For our second exercise, Figure 5 compares the predicted post-birth employment ratesacross countries for women with a secondary degree in 1973 and 1993. Notice that Spainis the only country to experience a large shift upwards. Thus, Spain has had a clearchange in behaviour within 1973–93. The forecast of being employed after childbearingdecrease with post-birth time in Belgium, Italy and Spain. This may be due to the en-largement of families, which impacts negatively on female’s participation. By contrast,both German and Swedish women’s employment is predicted to rise with post-birthtime. We are surprised about the low forecast levels of employment after childbearing inWest-Germany and their decline in latter periods. However, as reported by Ondrich et al.(1996), ‘since 1979 German federal maternity leave and benefit policy has given womenincentives to stay at home and take care of their newborn and youngest children. In1986 this leave and benefit policy was changed in several ways, turning it into a pow-erful instrument for delaying a mother’s return to work after childbirth’. In their paper,they show evidence that the rise in the generosity of maternity leave has had the effectthat mothers interrupt their careers for longer periods. This could also explain our results.
Figure 6 replicates Figure 5 for those women who had only one child.34 We observethat in Belgium the declining trend in the predicted probability of employment afterfirst birth disappears slightly when we base our analysis on single child women. Thismakes sense since drops in employment after first birth are likely to be caused by morebirths. However, in Belgium, there seems not to be much difference between those moth-ers who only ever had one child and the whole sample of mothers, especially in 1993.In West-Germany, the post-birth time profile does not vary but, in both 1973 and 1993,the probabilities increase by about 20% and 10% respectively for all post-birth periodsin the sample of single child mothers. Italian mothers with only one child ever have aslight increase on post-birth employment in 1993.35 compared to the whole group. Thissuggests that extra children in 1993 do not have a big negative impact on post-birth em-ployment in Italy. Sweden experiences a parallel upwards shift in 1973 for the restrictedsample of single mothers, although this disappears in 1993. Spanish single mothers have apost-birth employment rate around 30% greater than the whole group of mothers in 1973.The gap is 15% in 1993. This suggests that in Spain in 1973 there are two groups. One,who have only one child and are more committed to the job market; the other grouphave more than one child and are substantially less committed. This effect is reducedin 1993. Note that the distinction between single child mothers and all mothers is moremuted in the other countries.
34Notice that the sample restricted to single child ever mothers is likely to have a higher proportion ofyoung cohorts compared to the whole sample since they are more likely to have only one child so far.
35We are not able to interpret the result for Italy in 1973.
24
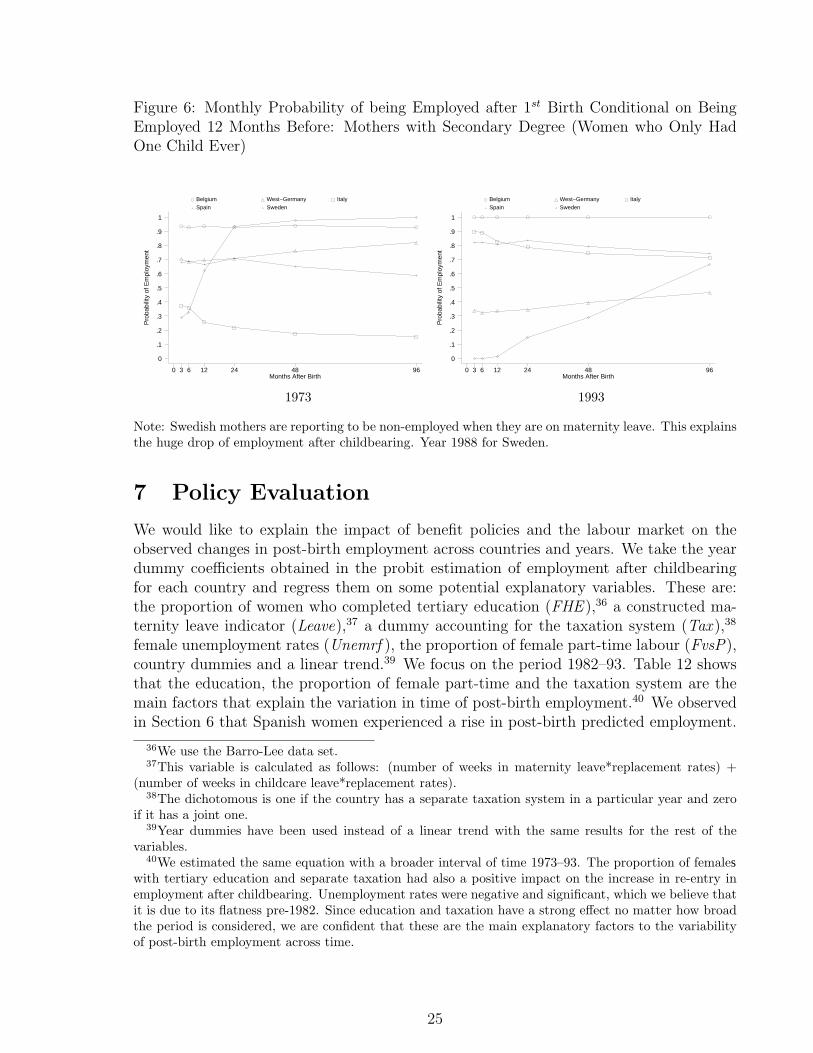
Figure 6: Monthly Probability of being Employed after 1st Birth Conditional on BeingEmployed 12 Months Before: Mothers with Secondary Degree (Women who Only HadOne Child Ever)
Pro
babi
lity
of E
mpl
oym
ent
Months After Birth0 3 6 12 24 48 96
0
.1
.2
.3
.4
.5
.6
.7
.8
.9
1
Belgium West−Germany Italy
Spain Sweden
1973
Pro
babi
lity
of E
mpl
oym
ent
Months After Birth0 3 6 12 24 48 96
0
.1
.2
.3
.4
.5
.6
.7
.8
.9
1
Belgium West−Germany Italy
Spain Sweden
1993
Note: Swedish mothers are reporting to be non-employed when they are on maternity leave. This explainsthe huge drop of employment after childbearing. Year 1988 for Sweden.
7 Policy Evaluation
We would like to explain the impact of benefit policies and the labour market on theobserved changes in post-birth employment across countries and years. We take the yeardummy coefficients obtained in the probit estimation of employment after childbearingfor each country and regress them on some potential explanatory variables. These are:the proportion of women who completed tertiary education (FHE ),36 a constructed ma-ternity leave indicator (Leave),37 a dummy accounting for the taxation system (Tax ),38
female unemployment rates (Unemrf ), the proportion of female part-time labour (FvsP),country dummies and a linear trend.39 We focus on the period 1982–93. Table 12 showsthat the education, the proportion of female part-time and the taxation system are themain factors that explain the variation in time of post-birth employment.40 We observedin Section 6 that Spanish women experienced a rise in post-birth predicted employment.
36We use the Barro-Lee data set.37This variable is calculated as follows: (number of weeks in maternity leave*replacement rates) +
(number of weeks in childcare leave*replacement rates).38The dichotomous is one if the country has a separate taxation system in a particular year and zero
if it has a joint one.39Year dummies have been used instead of a linear trend with the same results for the rest of the
variables.40We estimated the same equation with a broader interval of time 1973–93. The proportion of females
with tertiary education and separate taxation had also a positive impact on the increase in re-entry inemployment after childbearing. Unemployment rates were negative and significant, which we believe thatit is due to its flatness pre-1982. Since education and taxation have a strong effect no matter how broadthe period is considered, we are confident that these are the main explanatory factors to the variabilityof post-birth employment across time.
25
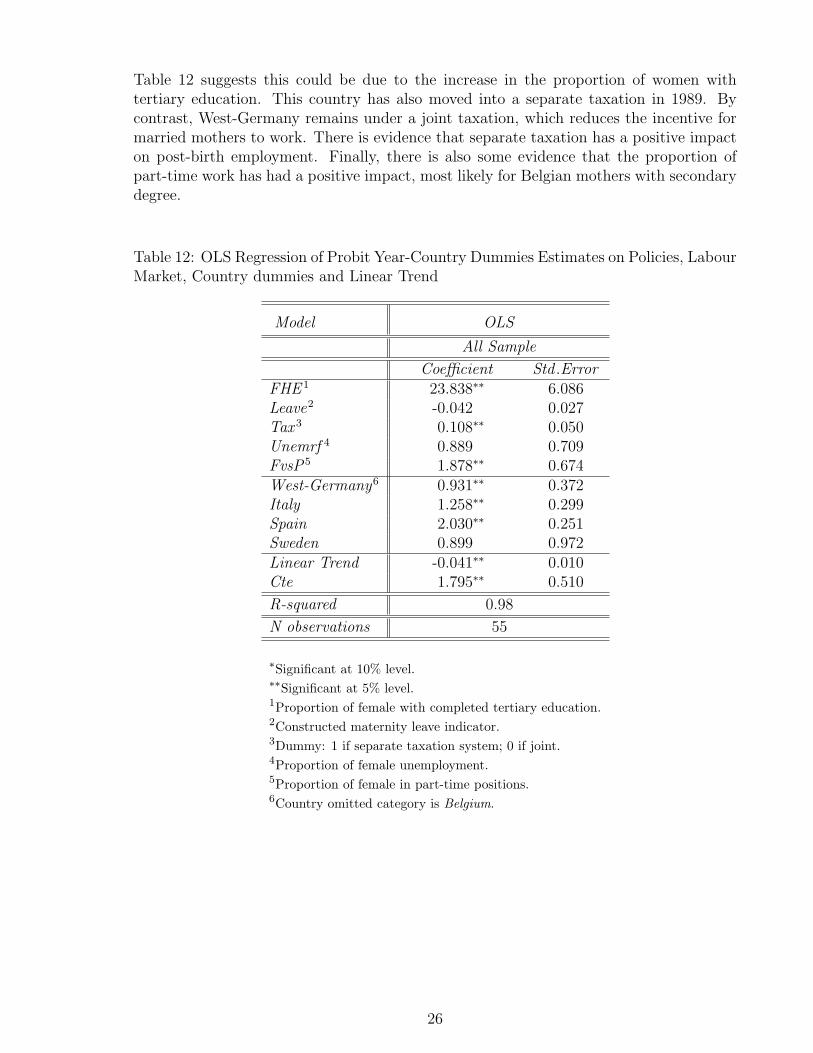
Table 12 suggests this could be due to the increase in the proportion of women withtertiary education. This country has also moved into a separate taxation in 1989. Bycontrast, West-Germany remains under a joint taxation, which reduces the incentive formarried mothers to work. There is evidence that separate taxation has a positive impacton post-birth employment. Finally, there is also some evidence that the proportion ofpart-time work has had a positive impact, most likely for Belgian mothers with secondarydegree.
Table 12: OLS Regression of Probit Year-Country Dummies Estimates on Policies, LabourMarket, Country dummies and Linear Trend
Model OLS
All Sample
Coefficient Std .ErrorFHE 1 23.838∗∗ 6.086Leave2 -0.042 0.027Tax 3 0.108∗∗ 0.050Unemrf 4 0.889 0.709FvsP5 1.878∗∗ 0.674West-Germany6 0.931∗∗ 0.372Italy 1.258∗∗ 0.299Spain 2.030∗∗ 0.251Sweden 0.899 0.972Linear Trend -0.041∗∗ 0.010Cte 1.795∗∗ 0.510
R-squared 0.98
N observations 55
∗Significant at 10% level.∗∗Significant at 5% level.1Proportion of female with completed tertiary education.2Constructed maternity leave indicator.3Dummy: 1 if separate taxation system; 0 if joint.4Proportion of female unemployment.5Proportion of female in part-time positions.6Country omitted category is Belgium.
26
8 Conclusions
In this paper we focus on the transitions from employment to non-employment after moth-erhood in five countries: Belgium, West-Germany, Italy, Spain and Sweden. We observecohorts born between 1951 and 1970. We use the same data source for each country inorder to develop a comprehensive analysis of the main individual and institutional factorsthat determine employment after motherhood. We also estimate the probability stay onemployment after childbearing and how this has evolved across time. Our main purposeis to understand the differences between countries.
From our comparison, we find that Spain and West-Germany are the countries with byfar the highest decline in employment rates after first child. Our staying-on rates confirmthe view that West-German employed women are strongly affected by first-birth. We findthat of those mothers who were employed one year before first birth, only 46% are atwork two years afterwards. The proportions are 78% in Belgium, 75% in Italy, 66% inSweden and 59% in Spain. Although the staying-on rates on a two-year horizon are notmuch apart in Spain and Sweden, they differ in two main aspects. First, Swedish mothershave higher pre-birth employment rates. Second, Spanish drops are permanent ratherthan temporary. This means that once the procreation process is finished, more Swedishmothers are at work.
From those women who are employed both before and after confinement, we observe thatthere are noticeable differences across countries in terms of transitions full-time vs. part-time. In Belgium, 12.5% women move from full-time to part-time after the birth of a firstchild. The rate is 49.2% in Sweden. Only about 3% do in Italy and Spain, and 5% inWest-Germany. We believe that this reflects disparity in the free choice of the number ofworking hours, rather than these countries being apart in female preferences. The lessonis that post-birth employment rates would be higher in West-Germany, Italy and Spain ifmothers were offered broader flexibility to combine childcare and work part-time. That is,we might have more mothers moving into part-time employment instead of into inactivity.
In our probit estimation, we observe that women with graduate degrees are more likely tobe at work after childbearing in all countries, except for Sweden. In the latter, educationdoes not significantly raise the chances of post-birth employment. We also find that thenumber of months worked up to motherhood increase the probability of being employedafter first birth. Thus, the accumulation of human capital increases the probability ofpost-birth employment.
A representative mother who was at work before the birth has a different predicted post-birth probability of employment depending upon the country where she lives. There arealso relevant changes across years. Belgian and especially Spanish mothers increased theirprobability of post-birth employment, ceteris paribus. The opposite movement occurredin West-Germany; Italy and Sweden remained fairly constant.
The paper attempts to separate out the effect of future fertility patterns on post-birthemployment from other more direct effects. We do this by estimating the probability ofemployment after first birth for those women who remain with one child. This reveals
27
that in Spain (especially in earlier years) there are two different groups of mothers. Onethat have only one child and are committed to the job market; the other have more thanone child and are less attached to it. This distinction is more muted in the other countries.
We observe that the predicted probability of being at work varies substantially acrosscountries and years. We then explore the factors that could have caused this. That is, welook for aggregate variables that changed within this period, which are potentially relatedto mothers’ employment. We find that the increase in completed female tertiary educa-tion, the separate taxation system and the proportion of part-time contracts consistentlyexplain the observed changes. This is important for policy. For instance, West-Germanymight experience an increase in post-birth employment if it moved into a separate tax-ation regime. Results also show that maternity leave does not significantly impact onpost-birth employment. Note that all these countries have the right of reinstatement inthe period 1973–93 but they differ in its generosity and length. We believe that a too longperiod of leave is counterproductive since it postpones return, which reduces female skillsand might further disincentive re-entry. The availability of long maternity leave shouldbe accompanied by public offered childcare (as in Sweden) or childcare tax relief (as inBelgium) so that women have the simultaneous choice of being at work and/or on leave.Besides, childcare should be flexible and accommodate mothers’ needs in their workingtime.
28
References
Adam, P. (1996a), Labour Force Transitions of Married Women in Spain, PhD thesis,European University Institute.
Adam, P. (1996b), Mothers in an Insider-Outsider Economy: The Puzzle of Spain,Journal of Population Economics 9, 301–323.
Apps, P. and Rees, R. (2001), Fertility, Female Labor Supply and Public Policy, IZA.Discussion Paper 409.
Beblo, M. and Wolf, E. (2002), The Wage Penalties of Heterogenous EmploymentBiographies: An Empirical Analysis for Germany, Centre for European EconomicResearch.
Becker, G. (1993), A Treatise on the Family, Harvard University Press.
Bernhardt, E. M. (1986), Women’s Home Attachment at First Birth, European Journalof Population 2, 5–29.
Bernhardt, E. M. (1988), The Choice of Part-time Work among Swedish One-childMothers, European Journal of Population 4, 117–144.
Del Boca, D. (2002), The Effect of Child Care and Part-time Opportunities on Partici-pation and Fertility Decisions in Italy, IZA. Discussion Paper 427.
Desai, S. and Waite, L. J. (1991), Womens Employment During Pregnancy and Afterthe First Birth: Occupational Characteristics and Work Commitment, AmericanSociological Review 56(4), 551–566.
Dex, S., Joshi, H., McCulloch, A. and Macran, S. (1996), Women’s EmploymentTransitions Around Childbearing, Centre for Economic Policy Research. Discussionpaper 1408.
Ellingsaeter, A. L. and Ronsen, M. (1996), The Dual Strategy: Motherhood and theWork Contract in Scandinavia, European Journal of Population 12, 239–260.
Gauthier, A. H. (2000), Public Policies Affecting Fertility and Families in Europe: Asurvey of the 15 Member States, Paper presented at the European Observatory onFamily Matters, Sevilla (Spain), September 2000.
Gustafsson, S., Wetzels, C. and Vlasblom, J. (1996), Women’s Labor Force Transi-tions in Connection with Childbirth: A Panel Data Comparison between Germany,Sweden and Great Britain, Journal of Population Economcs 9, 224–246.
Gutierrez-Domenech, M. (2002), Employment Penalty After Motherhood in Spain,Centre for Economic Performance, working paper 1177.
Hank, K. and Kreyenfeld, M. (2000), Does the Availability of Childcare Influence theEmployment of Mothers? Findins from Western Germany, MPIDR, working paper2000–003.
29
Kravdal, Ø. (1992), Forgone Labor Participation and Earning Due to ChildbearingAmong Norwegian Women, Demography 29(4), 545–563.
Long, J. S. (1997), Regression Models for Categorical and Limited Dependent Variables,SAGE Publications.
Moss, P. and Deven, F. (1990), Parental Leave: Progress or Pitfall? Research andPolicy Issues in Europe, NIDI/CBGS.
OECD (1993), Taxation in OECD Countries, OECD.
OECD (2001), Balancing Work and Family Life: Helping Parents into Paid Employment,OECD Employment Outlook.
Ondrich, J., Spiess, C. K. and Yang, Q. (1996), Barefoot and a German Kitchen:Federal Parental Leave and Benefit Policy and the Return to Work After Childbirthin Germany, Journal of Population Economics 9, 247–266.
Ronsen, M. and Sunstrom, M. (1996), Maternal Employment in Scandinavia: A Com-parison of the After-Birth Employment Activity of Norwegian and Swedish Women,Journal of Population Economics 9, 267–285.
Sainsbury, D. (1994), Gendering Welfare States, Sage London.
Saurel-Cubizolles, M. J., Romito, P., Escriba-Aguir, V., Lelong, N., Pons,R. M. and Ancel, P.-Y. (1999), Returning to Work After Childbirth in France,Italy and Spain, European Sociological Review 15, 179–194.
Tietze, W. and Cryer, D. (1999), Current trends in European early child care andeducation, Annals, AAPSS.
Wetzels, C. (1999), Squeezing Birth into Working Life. Household Panel Data Analy-ses comparing Germany, Great Britain, the Netherlands and Sweden, PhD thesis,Tinbergen Institute Research Series. Universiteit van Amsterdam.
30
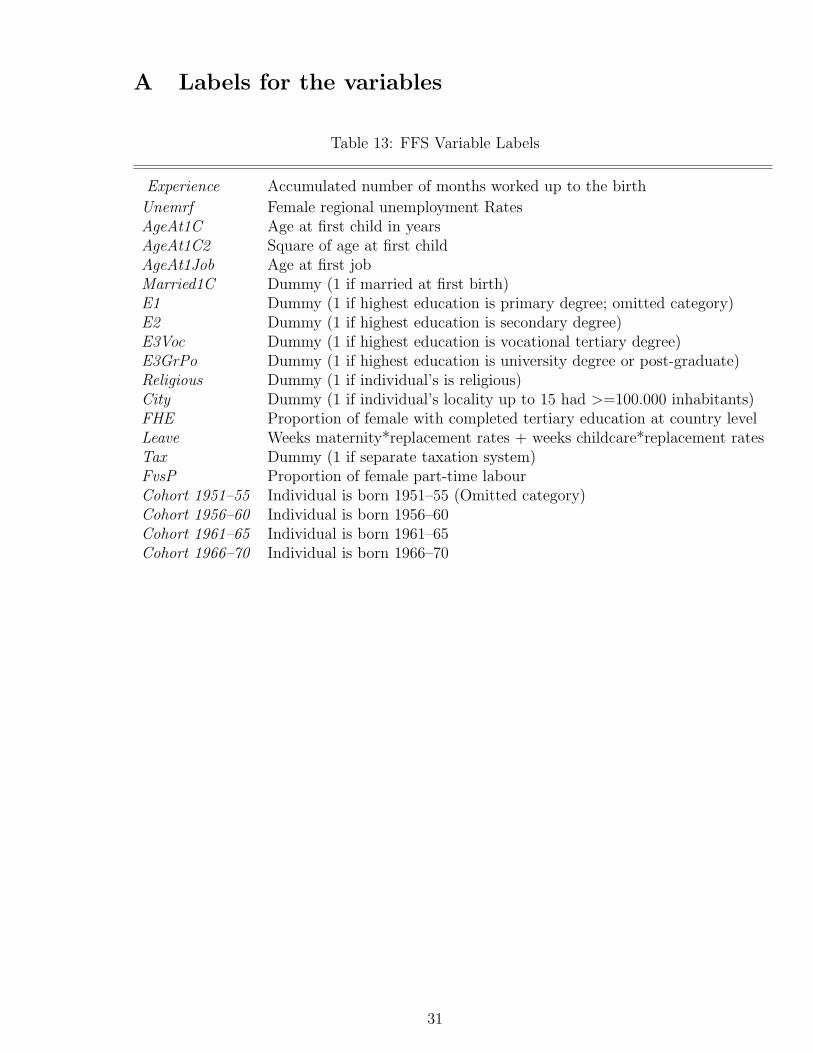
A Labels for the variables
Table 13: FFS Variable Labels
Experience Accumulated number of months worked up to the birth
Unemrf Female regional unemployment RatesAgeAt1C Age at first child in yearsAgeAt1C2 Square of age at first childAgeAt1Job Age at first jobMarried1C Dummy (1 if married at first birth)E1 Dummy (1 if highest education is primary degree; omitted category)E2 Dummy (1 if highest education is secondary degree)E3Voc Dummy (1 if highest education is vocational tertiary degree)E3GrPo Dummy (1 if highest education is university degree or post-graduate)Religious Dummy (1 if individual’s is religious)City Dummy (1 if individual’s locality up to 15 had >=100.000 inhabitants)FHE Proportion of female with completed tertiary education at country levelLeave Weeks maternity*replacement rates + weeks childcare*replacement ratesTax Dummy (1 if separate taxation system)FvsP Proportion of female part-time labourCohort 1951–55 Individual is born 1951–55 (Omitted category)Cohort 1956–60 Individual is born 1956–60Cohort 1961–65 Individual is born 1961–65Cohort 1966–70 Individual is born 1966–70
31
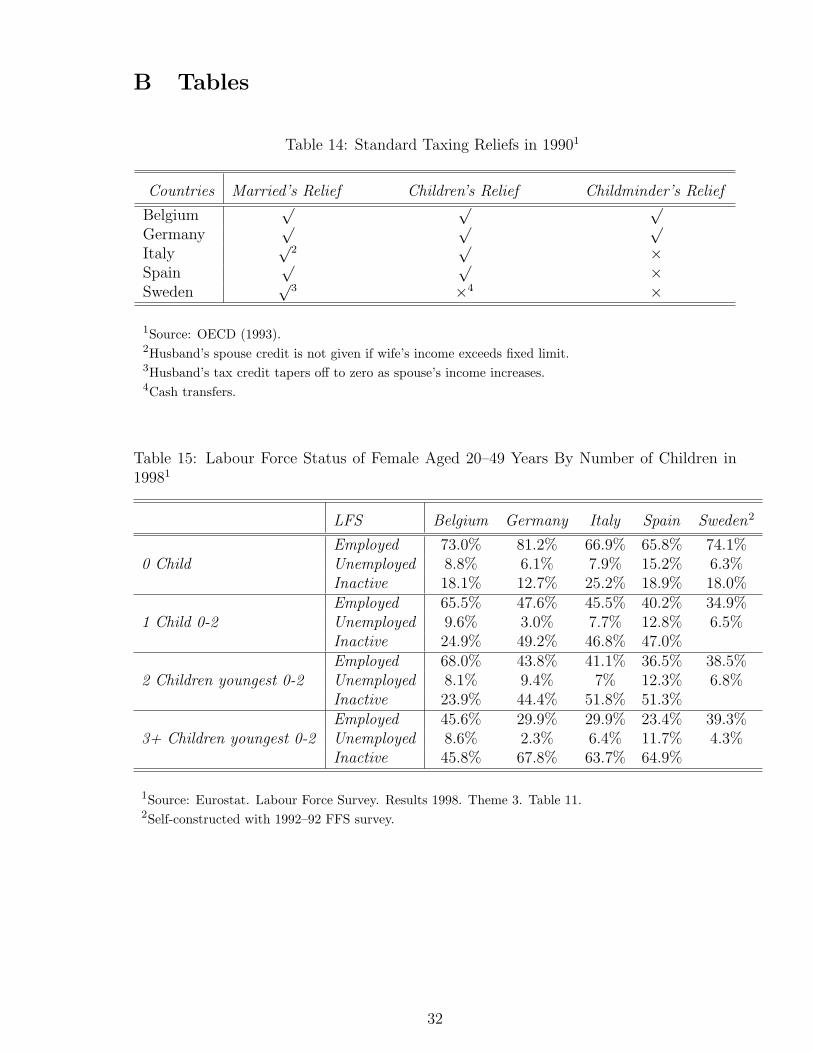
B Tables
Table 14: Standard Taxing Reliefs in 19901
Countries Married’s Relief Children’s Relief Childminder’s Relief
Belgium√ √ √
Germany√ √ √
Italy√
2√ ×
Spain√ √ ×
Sweden√
3 ×4 ×
1Source: OECD (1993).2Husband’s spouse credit is not given if wife’s income exceeds fixed limit.3Husband’s tax credit tapers off to zero as spouse’s income increases.4Cash transfers.
Table 15: Labour Force Status of Female Aged 20–49 Years By Number of Children in19981
LFS Belgium Germany Italy Spain Sweden2
Employed 73.0% 81.2% 66.9% 65.8% 74.1%0 Child Unemployed 8.8% 6.1% 7.9% 15.2% 6.3%
Inactive 18.1% 12.7% 25.2% 18.9% 18.0%Employed 65.5% 47.6% 45.5% 40.2% 34.9%
1 Child 0-2 Unemployed 9.6% 3.0% 7.7% 12.8% 6.5%Inactive 24.9% 49.2% 46.8% 47.0%Employed 68.0% 43.8% 41.1% 36.5% 38.5%
2 Children youngest 0-2 Unemployed 8.1% 9.4% 7% 12.3% 6.8%Inactive 23.9% 44.4% 51.8% 51.3%Employed 45.6% 29.9% 29.9% 23.4% 39.3%
3+ Children youngest 0-2 Unemployed 8.6% 2.3% 6.4% 11.7% 4.3%Inactive 45.8% 67.8% 63.7% 64.9%
1Source: Eurostat. Labour Force Survey. Results 1998. Theme 3. Table 11.2Self-constructed with 1992–92 FFS survey.
32
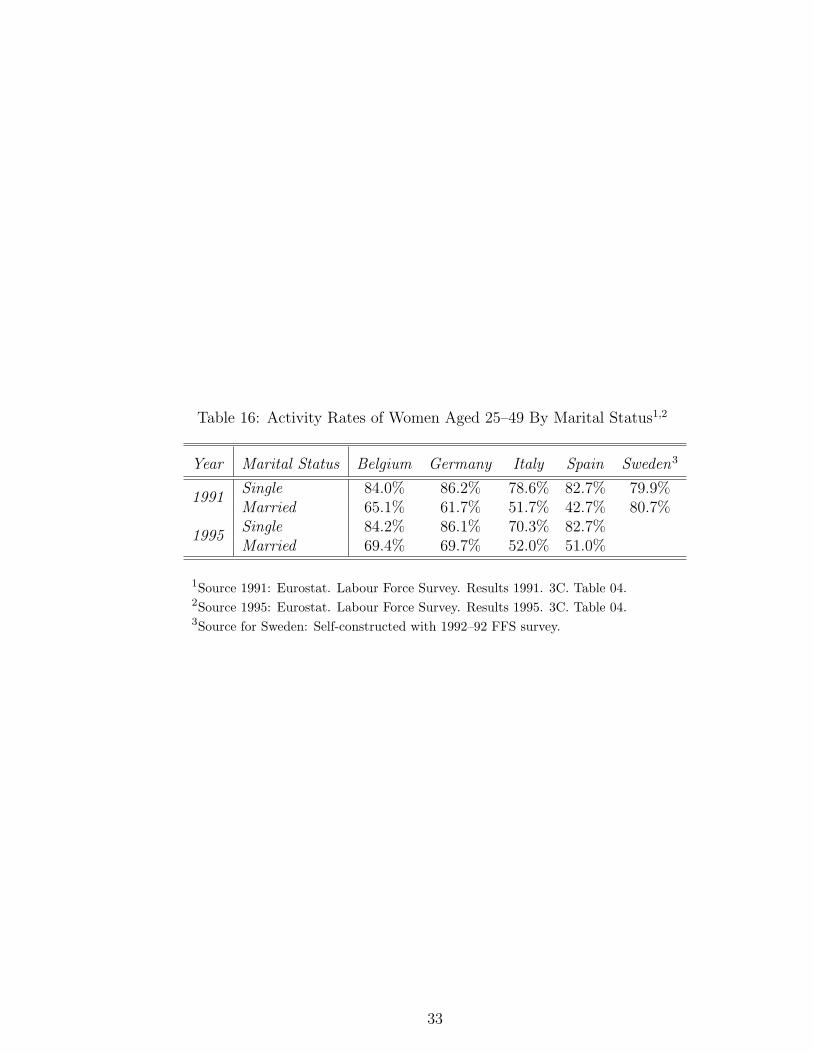
Table 16: Activity Rates of Women Aged 25–49 By Marital Status1,2
Year Marital Status Belgium Germany Italy Spain Sweden3
Single 84.0% 86.2% 78.6% 82.7% 79.9%1991
Married 65.1% 61.7% 51.7% 42.7% 80.7%Single 84.2% 86.1% 70.3% 82.7%
1995Married 69.4% 69.7% 52.0% 51.0%
1Source 1991: Eurostat. Labour Force Survey. Results 1991. 3C. Table 04.2Source 1995: Eurostat. Labour Force Survey. Results 1995. 3C. Table 04.3Source for Sweden: Self-constructed with 1992–92 FFS survey.
33
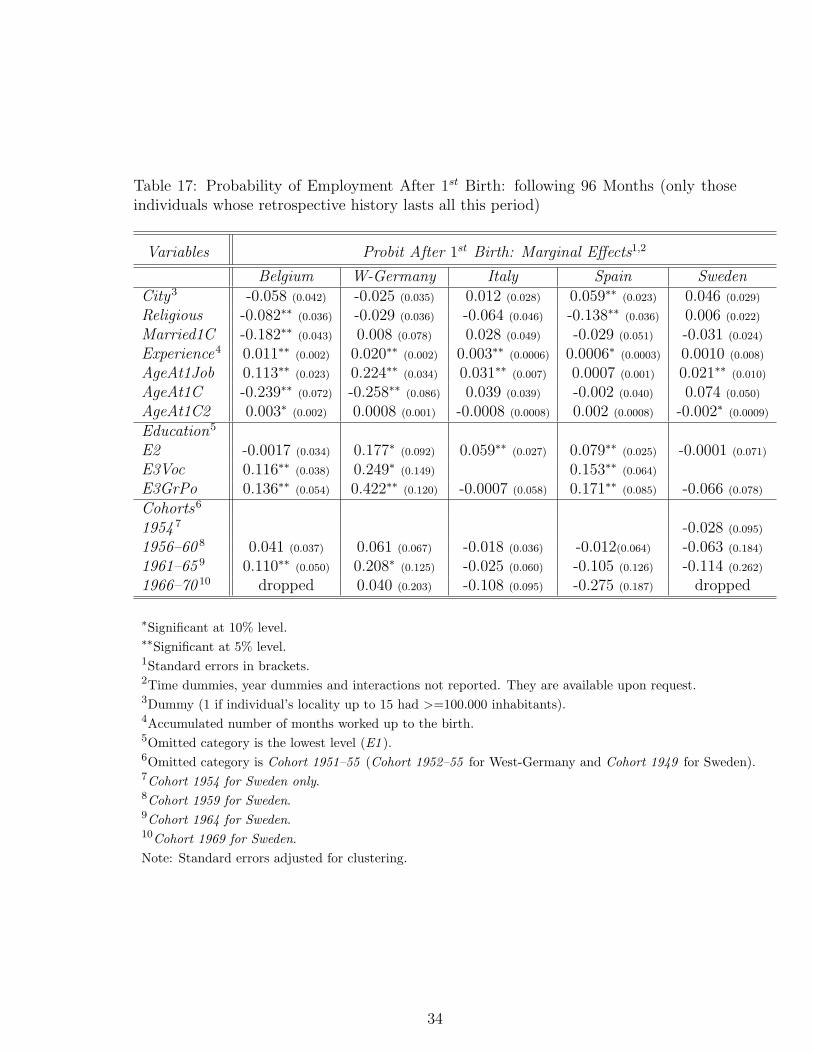
Table 17: Probability of Employment After 1st Birth: following 96 Months (only thoseindividuals whose retrospective history lasts all this period)
Variables Probit After 1st Birth: Marginal Effects1,2
Belgium W-Germany Italy Spain SwedenCity3 -0.058 (0.042) -0.025 (0.035) 0.012 (0.028) 0.059∗∗ (0.023) 0.046 (0.029)
Religious -0.082∗∗ (0.036) -0.029 (0.036) -0.064 (0.046) -0.138∗∗ (0.036) 0.006 (0.022)
Married1C -0.182∗∗ (0.043) 0.008 (0.078) 0.028 (0.049) -0.029 (0.051) -0.031 (0.024)
Experience4 0.011∗∗ (0.002) 0.020∗∗ (0.002) 0.003∗∗ (0.0006) 0.0006∗ (0.0003) 0.0010 (0.008)
AgeAt1Job 0.113∗∗ (0.023) 0.224∗∗ (0.034) 0.031∗∗ (0.007) 0.0007 (0.001) 0.021∗∗ (0.010)
AgeAt1C -0.239∗∗ (0.072) -0.258∗∗ (0.086) 0.039 (0.039) -0.002 (0.040) 0.074 (0.050)
AgeAt1C2 0.003∗ (0.002) 0.0008 (0.001) -0.0008 (0.0008) 0.002 (0.0008) -0.002∗ (0.0009)
Education5
E2 -0.0017 (0.034) 0.177∗ (0.092) 0.059∗∗ (0.027) 0.079∗∗ (0.025) -0.0001 (0.071)
E3Voc 0.116∗∗ (0.038) 0.249∗ (0.149) 0.153∗∗ (0.064)
E3GrPo 0.136∗∗ (0.054) 0.422∗∗ (0.120) -0.0007 (0.058) 0.171∗∗ (0.085) -0.066 (0.078)
Cohorts6
1954 7 -0.028 (0.095)
1956–60 8 0.041 (0.037) 0.061 (0.067) -0.018 (0.036) -0.012(0.064) -0.063 (0.184)
1961–65 9 0.110∗∗ (0.050) 0.208∗ (0.125) -0.025 (0.060) -0.105 (0.126) -0.114 (0.262)
1966–70 10 dropped 0.040 (0.203) -0.108 (0.095) -0.275 (0.187) dropped
∗Significant at 10% level.∗∗Significant at 5% level.1Standard errors in brackets.2Time dummies, year dummies and interactions not reported. They are available upon request.3Dummy (1 if individual’s locality up to 15 had >=100.000 inhabitants).4Accumulated number of months worked up to the birth.5Omitted category is the lowest level (E1 ).6Omitted category is Cohort 1951–55 (Cohort 1952–55 for West-Germany and Cohort 1949 for Sweden).7Cohort 1954 for Sweden only.8Cohort 1959 for Sweden.9Cohort 1964 for Sweden.10Cohort 1969 for Sweden.Note: Standard errors adjusted for clustering.
34
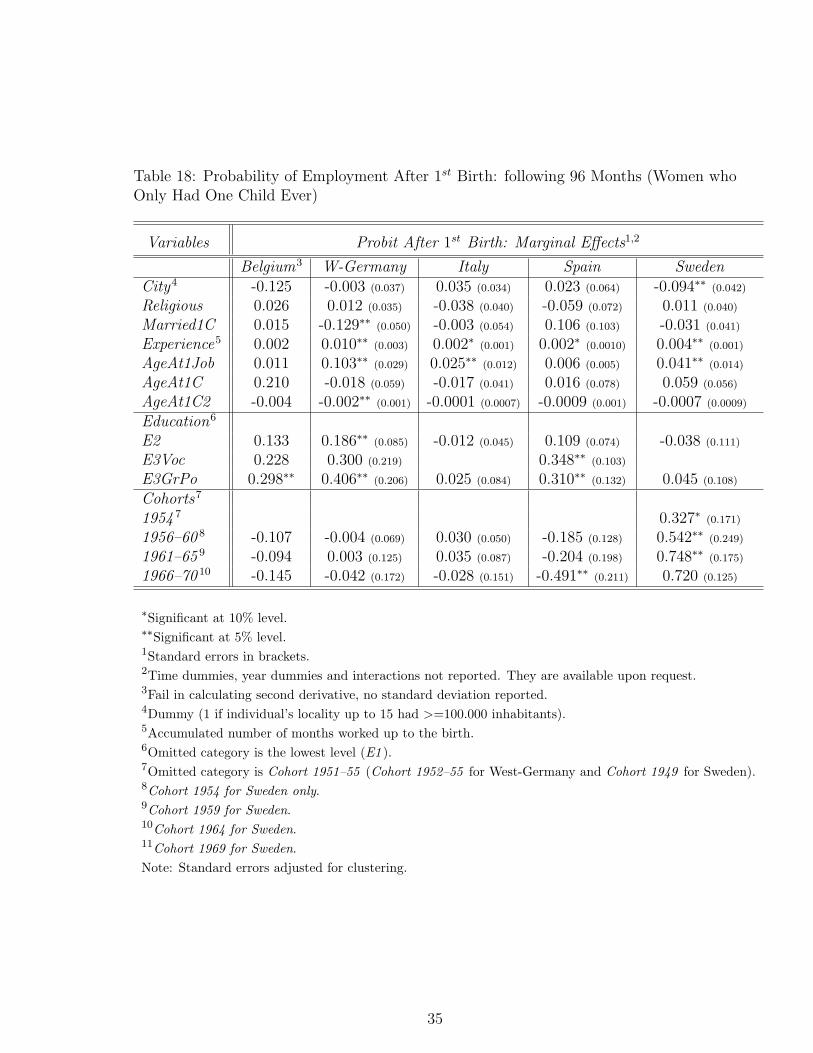
Table 18: Probability of Employment After 1st Birth: following 96 Months (Women whoOnly Had One Child Ever)
Variables Probit After 1st Birth: Marginal Effects1,2
Belgium3 W-Germany Italy Spain SwedenCity4 -0.125 -0.003 (0.037) 0.035 (0.034) 0.023 (0.064) -0.094∗∗ (0.042)
Religious 0.026 0.012 (0.035) -0.038 (0.040) -0.059 (0.072) 0.011 (0.040)
Married1C 0.015 -0.129∗∗ (0.050) -0.003 (0.054) 0.106 (0.103) -0.031 (0.041)
Experience5 0.002 0.010∗∗ (0.003) 0.002∗ (0.001) 0.002∗ (0.0010) 0.004∗∗ (0.001)
AgeAt1Job 0.011 0.103∗∗ (0.029) 0.025∗∗ (0.012) 0.006 (0.005) 0.041∗∗ (0.014)
AgeAt1C 0.210 -0.018 (0.059) -0.017 (0.041) 0.016 (0.078) 0.059 (0.056)
AgeAt1C2 -0.004 -0.002∗∗ (0.001) -0.0001 (0.0007) -0.0009 (0.001) -0.0007 (0.0009)
Education6
E2 0.133 0.186∗∗ (0.085) -0.012 (0.045) 0.109 (0.074) -0.038 (0.111)
E3Voc 0.228 0.300 (0.219) 0.348∗∗ (0.103)
E3GrPo 0.298∗∗ 0.406∗∗ (0.206) 0.025 (0.084) 0.310∗∗ (0.132) 0.045 (0.108)
Cohorts7
1954 7 0.327∗ (0.171)
1956–60 8 -0.107 -0.004 (0.069) 0.030 (0.050) -0.185 (0.128) 0.542∗∗ (0.249)
1961–65 9 -0.094 0.003 (0.125) 0.035 (0.087) -0.204 (0.198) 0.748∗∗ (0.175)
1966–70 10 -0.145 -0.042 (0.172) -0.028 (0.151) -0.491∗∗ (0.211) 0.720 (0.125)
∗Significant at 10% level.∗∗Significant at 5% level.1Standard errors in brackets.2Time dummies, year dummies and interactions not reported. They are available upon request.3Fail in calculating second derivative, no standard deviation reported.4Dummy (1 if individual’s locality up to 15 had >=100.000 inhabitants).5Accumulated number of months worked up to the birth.6Omitted category is the lowest level (E1 ).7Omitted category is Cohort 1951–55 (Cohort 1952–55 for West-Germany and Cohort 1949 for Sweden).8Cohort 1954 for Sweden only.9Cohort 1959 for Sweden.10Cohort 1964 for Sweden.11Cohort 1969 for Sweden.Note: Standard errors adjusted for clustering.
35
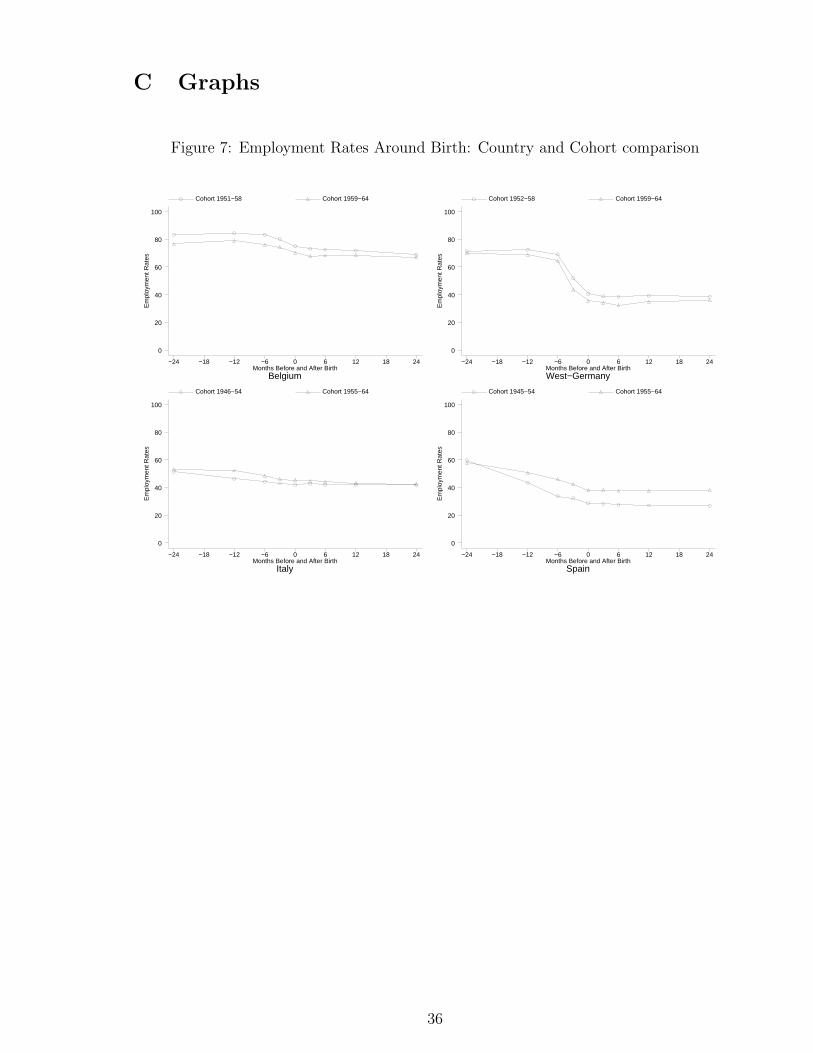
C Graphs
Figure 7: Employment Rates Around Birth: Country and Cohort comparisonE
mpl
oym
ent R
ates
BelgiumMonths Before and After Birth
Cohort 1951−58 Cohort 1959−64
−24 −18 −12 −6 0 6 12 18 24
0
20
40
60
80
100
Em
ploy
men
t Rat
es
West−GermanyMonths Before and After Birth
Cohort 1952−58 Cohort 1959−64
−24 −18 −12 −6 0 6 12 18 24
0
20
40
60
80
100
Em
ploy
men
t Rat
es
ItalyMonths Before and After Birth
Cohort 1946−54 Cohort 1955−64
−24 −18 −12 −6 0 6 12 18 24
0
20
40
60
80
100
Em
ploy
men
t Rat
es
SpainMonths Before and After Birth
Cohort 1945−54 Cohort 1955−64
−24 −18 −12 −6 0 6 12 18 24
0
20
40
60
80
100
36
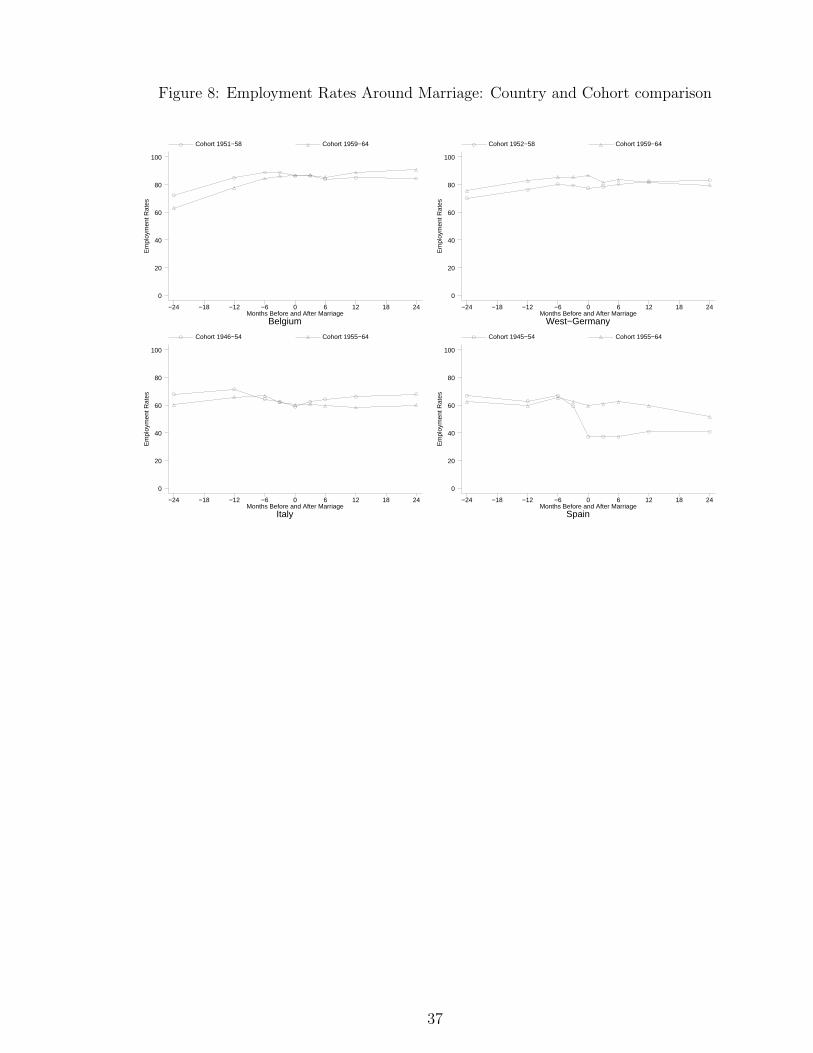
Figure 8: Employment Rates Around Marriage: Country and Cohort comparison
Em
ploy
men
t Rat
es
BelgiumMonths Before and After Marriage
Cohort 1951−58 Cohort 1959−64
−24 −18 −12 −6 0 6 12 18 24
0
20
40
60
80
100
Em
ploy
men
t Rat
es
West−GermanyMonths Before and After Marriage
Cohort 1952−58 Cohort 1959−64
−24 −18 −12 −6 0 6 12 18 24
0
20
40
60
80
100
Em
ploy
men
t Rat
es
ItalyMonths Before and After Marriage
Cohort 1946−54 Cohort 1955−64
−24 −18 −12 −6 0 6 12 18 24
0
20
40
60
80
100
Em
ploy
men
t Rat
es
SpainMonths Before and After Marriage
Cohort 1945−54 Cohort 1955−64
−24 −18 −12 −6 0 6 12 18 24
0
20
40
60
80
100
37

CENTRE FOR ECONOMIC PERFORMANCE Recent Discussion Papers
566 T. Kirchmaier The Performance Effects of European Demergers
565 P. Lopez-Garcia Labour Market Performance and Start-Up Costs: OECD Evidence
564 A. Manning The Real Thin Theory: Monopsony in Modern Labour Markets
563 D. Quah Digital Goods and the New Economy
562 H. Gospel
P. Willman High Performance Workplaces: the Role of Employee Involvement in a Modern Economy. Evidence on the EU Directive Establishing a General Framework for Informing and Consulting Employees
561 L. R. Ngai Barriers and the Transition to Modern Growth
560 M. J. Conyon R. B. Freeman
Shared Modes of Compensation and Firm Performance: UK Evidence
559 R. B. Freeman R. Schettkat
Marketization of Production and the US-Europe Employment Gap
558 R. B. Freeman The Labour Market in the New Information Economy
557 R. B. Freeman Institutional Differences and Economic Performance Among OECD Countries
556 M. Guttierrez- Domenech The Impact of the Labour Market on the Timing of Marriage and Births in Spain
555 H. Gospel J. Foreman
The Provision of Training in Britain: Case Studies of Inter-Firm Coordination
554 S. Machin Factors of Convergence and Divergence in Union Membership
553 J. Blanden S. Machin
Cross-Generation Correlations of Union Status for Young People in Britain
552 D. Devroye R. B. Freeman
Does Inequality in Skills Explain Inequality of Earnings Across Advanced Countries?
551 M. Guadalupe The Hidden Costs of Fixed Term Contracts: the Impact on Work Accidents
550 G. Duranton City Size Distribution as a Consequence of the Growth Process
549 S. Redding A. J. Venables
Explaining Cross-Country Export Performance: International Linkages and Internal Geography
548 T. Bayoumi M. Haacker
It’s Not What You Make, It’s How You Use IT: Measuring the Welfare Benefits of the IT Revolution Across Countries
547 A. B. Bernard S. Redding P. K. Schott H. Simpson
Factor Price Equalization in the UK?
546 M. Gutierrez- Domenech
Employment Penalty After Motherhood in Spain
545 S. Nickell S. Redding J. Swaffield
Educational Attainment, Labour Market Institutions and the Structure of Production
544 S. Machin A. Manning J. Swaffield
Where the Minimum Wage Bites Hard: the Introduction of the UK National Minimum Wage to a Low Wage Sector
543 R. Belfield D. Marsden
Matchmaking: the Influence of Monitoring Environments on the Effectiveness of Performance Pay Systems
542 C. A. Pissarides Consumption and Savings With Unemployment Risk: Implications for Optimal Employment Contracts
541 M. Amiti C. A. Pissarides
Trade and Industrial Location with Heterogeneous Labor
540 G. Duranton H. G. Overman
Testing for Localisation Using Micro-Geographic Data
To order a discussion paper, please contact the Publications Unit Tel 020 7955 7673 Fax 020 7955 7595 Email [email protected]
Web site http://cep.lse.ac.uk