certs microgrid mechanical switch test report...the certs microgrid test bed at aep’s dolan...
TRANSCRIPT
CERTS Microgrid
Mechanical Switch Test Report _________________________________________________
D. Klapp, R. Zimmerly, J. Howard
AEP Dolan Technology Center
Groveport, OH
2
Table of contents:
1. Definitions and acronyms ........................................................................................... 3
2. Executive Summary.................................................................................................... 4
3. Introduction................................................................................................................. 6
4. Equipment Used.......................................................................................................... 7
5. Relay protection elements........................................................................................... 8
6. Other relay features................................................................................................... 11
7. Relay commissioning................................................................................................ 11
8. Installation of Equipment.......................................................................................... 18
9. Field Testing and Results.......................................................................................... 23
9.1. Synchronized closing:....................................................................................... 23
9.2. Loss of utility source (grid anti-islanding): ...................................................... 40
9.3. 3 Phase Reverse Power: .................................................................................... 49
9.4. Single Phase Reverse Power:............................................................................ 52
9.5. Dead Bus Close:................................................................................................ 55
10. Conclusion ................................................................................................................ 58
11. Associated Documents.............................................................................................. 60
3
1. Definitions and acronyms
a. CERTS: Consortium for Electric Reliability Technology Solutions b. IEEE 1547: Standard for interconnecting distributed resources
with electric power systems c. DSP: Digital signal processor d. PCC: Point of common coupling e. DR: Distributed resource f. SEL: Schweitzer Engineering Laboratories g. MS17: Mechanical switch installed in the CERTS test bed h. ABB: Manufacturer of MS17
4
2. Executive Summary
The CERTS microgrid test bed at AEP’s Dolan Technology Center includes a semiconductor static switch as a paralleling device. This equipment, along with a DSP controller, offers sub-cycle connection and disconnection between the microgrid and utility. However, similar equipment is not easily duplicated and has a high cost. Therefore, a mechanical switch alternative was produced that offers comparable performance and IEEE 1547 compliance at a reduced price. The mechanical switch and its associated microprocessor relay used for the project were chosen from major manufacturers of utility equipment. An ABB SACE Emax UL low voltage AC circuit breaker was selected, along with a Schweitzer SEL-700GT intertie relay. Existing cabinet space and wiring was utilized to install this equipment in the test bed. However, the cost of a new installation is estimated $25,000, which compares to the estimated $150,000 cost for a semiconductor switch. Prior to installation in the test bed, a series of IEEE 1547 compliant tests were run on the SEL-700GT. This was done using an Omicron 256 test set in a laboratory environment. Taking into account a 60ms maximum operating time of the mechanical switch, the tests demonstrated the relay’s ability to operate within the specifications of IEEE 1547. With the mechanical switch and SEL-700GT relay installed in the test bed, another series of tests were run. These tests included synchronized closing, loss of utility anti-islanding, three phase and single phase reverse power, and dead bus close. In order to improve power quality during testing, the relay’s voltage protection elements were made more stringent. This was done as an attempt to improve the mechanical switch’s ability to operate on abnormal voltage conditions and allow the microgrid generator to remain online. As an alternative to adjusting these settings, additional voltage elements can be added to the relay’s logic that focus on power quality tripping and could ignore the IEEE 1547 reconnection timer.
5
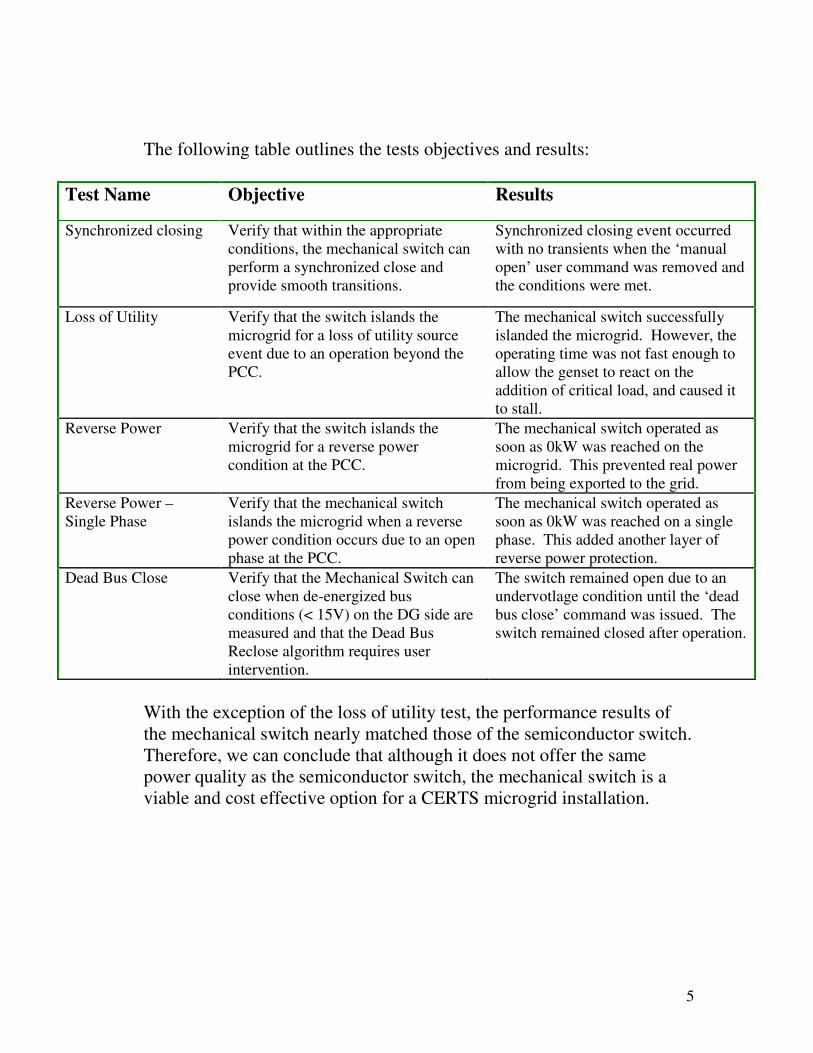
The following table outlines the tests objectives and results:
Test Name Objective Results
Synchronized closing Verify that within the appropriate conditions, the mechanical switch can perform a synchronized close and provide smooth transitions.
Synchronized closing event occurred with no transients when the ‘manual open’ user command was removed and the conditions were met.
Loss of Utility Verify that the switch islands the microgrid for a loss of utility source event due to an operation beyond the PCC.
The mechanical switch successfully islanded the microgrid. However, the operating time was not fast enough to allow the genset to react on the addition of critical load, and caused it to stall.
Reverse Power Verify that the switch islands the microgrid for a reverse power condition at the PCC.
The mechanical switch operated as soon as 0kW was reached on the microgrid. This prevented real power from being exported to the grid.
Reverse Power – Single Phase
Verify that the mechanical switch islands the microgrid when a reverse power condition occurs due to an open phase at the PCC.
The mechanical switch operated as soon as 0kW was reached on a single phase. This added another layer of reverse power protection.
Dead Bus Close Verify that the Mechanical Switch can close when de-energized bus conditions (< 15V) on the DG side are measured and that the Dead Bus Reclose algorithm requires user intervention.
The switch remained open due to an undervotlage condition until the ‘dead bus close’ command was issued. The switch remained closed after operation.
With the exception of the loss of utility test, the performance results of the mechanical switch nearly matched those of the semiconductor switch. Therefore, we can conclude that although it does not offer the same power quality as the semiconductor switch, the mechanical switch is a viable and cost effective option for a CERTS microgrid installation.
6
3. Introduction Presently the CERTS microgrid test bed includes a high speed semiconductor static switch and a dedicated DSP controller as a utility interface located at the Point of Common Coupling (PCC). This system was originally fabricated for the CERTS Microgrid Project and offered sub-cycle connection and disconnection between the microgrid and the utility. This solution, while fully functional, has tradeoffs. As an example, similar semiconductor equipment in general is not easily duplicated or readily available in a cost effective, timely manner. In the market today, these devices tend to be custom engineered for each application and consume a substantial portion of the project’s overall monetary budget.
Because of this there is a need to replicate the static switch and its DSP controller with more commonly used, readily available electrical equipment. We will demonstrate that a mechanical power circuit breaker and a commonly available microprocessor relay can perform a majority of the function at a reduced cost and time table. In addition to reducing cost, we shall also demonstrate that this alternative mechanical switch, when coupled with the CERTS controls algorithms, can maintain IEEE 1547 compliance.

7
4. Equipment Used
The components chosen for this mechanical switch are not manufacturer specific and are only one of many possible alternative suppliers. Our intent was only to demonstrate a workable solution and to explorer the tradeoffs between cost and functionality. The mechanical breaker selected is an ABB SACE Emax UL 800A frame power circuit breaker. This is a low voltage AC circuit breaker with 42kA fault current interrupting capability, and 60ms maximum trip time. Options for shunt trip, closing coil and auxiliary contacts were included. It is installed in parallel with the semiconductor static switch and interfaces with a microprocessor relay. The relay selected is a Schweitzer Engineering Laboratory (SEL) 700GT intertie protection relay. It is designed to accommodate IEEE 1547 protection functions, as well as a two-breaker system and generator protection elements. The 700GT relay allows the user to specify the Input/Output board preferences, and represents a solution that could be tailored for this specific purpose. In our application we are not using a two-breaker setup, so the PT and CT terminals could be assigned for two separate purposes. Terminal X is measuring at the PCC, and terminal Y is measuring current and voltage entering and leaving the protected zone of the microgrid. These measurement points were assigned according to semiconductor static switch’s existing points. The relay’s protection functions are only being applied at the mechanical switch, while all downstream equipment is individually protected. The relay is programmed using the Schweitzer AcSELerator quickset software, which also includes the ability to remotely communicate to the unit.
8
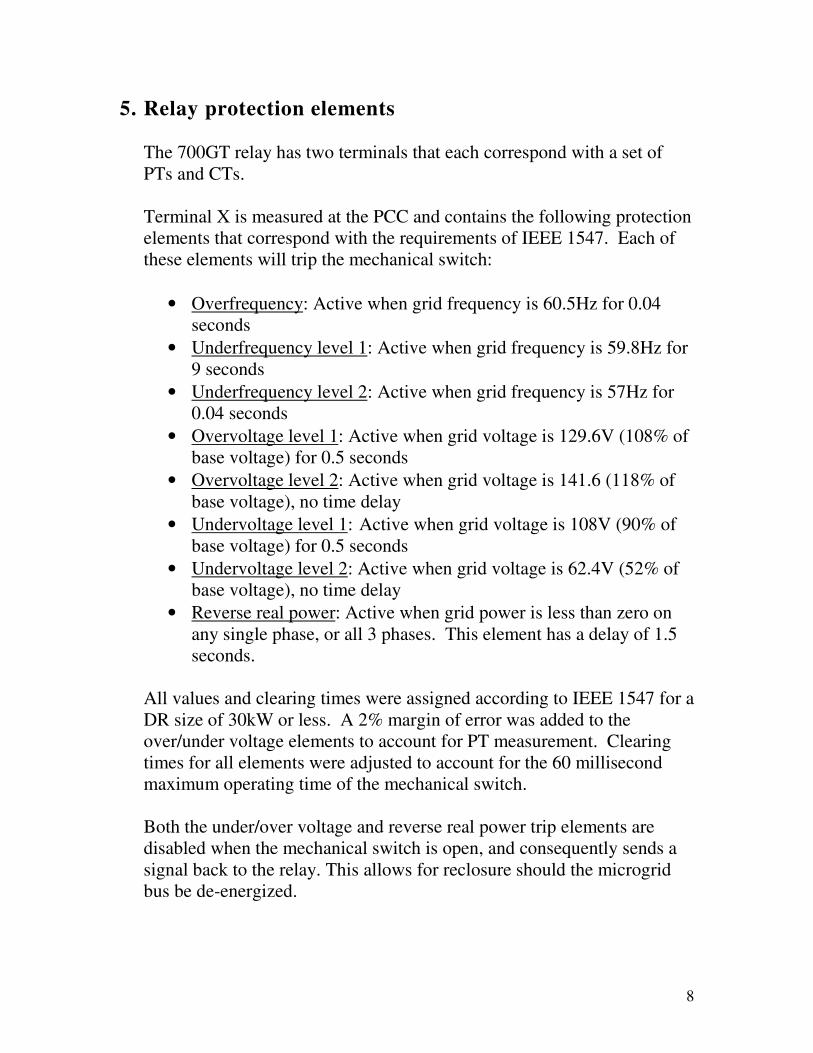
5. Relay protection elements
The 700GT relay has two terminals that each correspond with a set of PTs and CTs. Terminal X is measured at the PCC and contains the following protection elements that correspond with the requirements of IEEE 1547. Each of these elements will trip the mechanical switch:
• Overfrequency: Active when grid frequency is 60.5Hz for 0.04 seconds
• Underfrequency level 1: Active when grid frequency is 59.8Hz for 9 seconds
• Underfrequency level 2: Active when grid frequency is 57Hz for 0.04 seconds
• Overvoltage level 1: Active when grid voltage is 129.6V (108% of base voltage) for 0.5 seconds
• Overvoltage level 2: Active when grid voltage is 141.6 (118% of base voltage), no time delay
• Undervoltage level 1: Active when grid voltage is 108V (90% of base voltage) for 0.5 seconds
• Undervoltage level 2: Active when grid voltage is 62.4V (52% of base voltage), no time delay
• Reverse real power: Active when grid power is less than zero on any single phase, or all 3 phases. This element has a delay of 1.5 seconds.
All values and clearing times were assigned according to IEEE 1547 for a DR size of 30kW or less. A 2% margin of error was added to the over/under voltage elements to account for PT measurement. Clearing times for all elements were adjusted to account for the 60 millisecond maximum operating time of the mechanical switch.
Both the under/over voltage and reverse real power trip elements are disabled when the mechanical switch is open, and consequently sends a signal back to the relay. This allows for reclosure should the microgrid bus be de-energized.

9
Once activated, any of the IEEE 1547 protection elements will initiate a 5 minute timer. The SEL-700GT will not allow the mechanical switch to perform a close operation until 5 minutes has elapsed after an IEEE 1547 protection event has occurred. This is done so to comply with IEEE 1547 requirements. The 5 minute timer is enabled in the relay’s logic by utilizing a logic variable with pickup and dropout timers. Whenever an IEEE 1547 trip element is active the logic variable immediately picks up and remains active. This variable effectively puts the relay in a ‘trip state’, and when it drops out after 5 minutes along with any abnormal conditions the relay is allowed to enter a ‘close state’ in which synchronization can occur. Power Quality Tripping
The relay is also capable of performing more stringent undervoltage and overvoltage trips that focus on power quality. This would be implemented with separate undervoltage and overvoltage elements, measured on the microgrid, which operates instantaneously at a threshold above the IEEE 1547 voltage protection requirements. Since such an event would not violate the IEEE 1547 criteria for abnormal voltages, the element would not initiate the 5 minute reconnection timer. In order to override the IEEE 1547 timer due to abnormal conditions, the power quality trip element is excluded from the 5 minute timer logic variable equation. Therefore the relay could operate on utility voltage sags and swells and allow the mechanical switch to re-close as soon as the synchronization elements are within range.
10
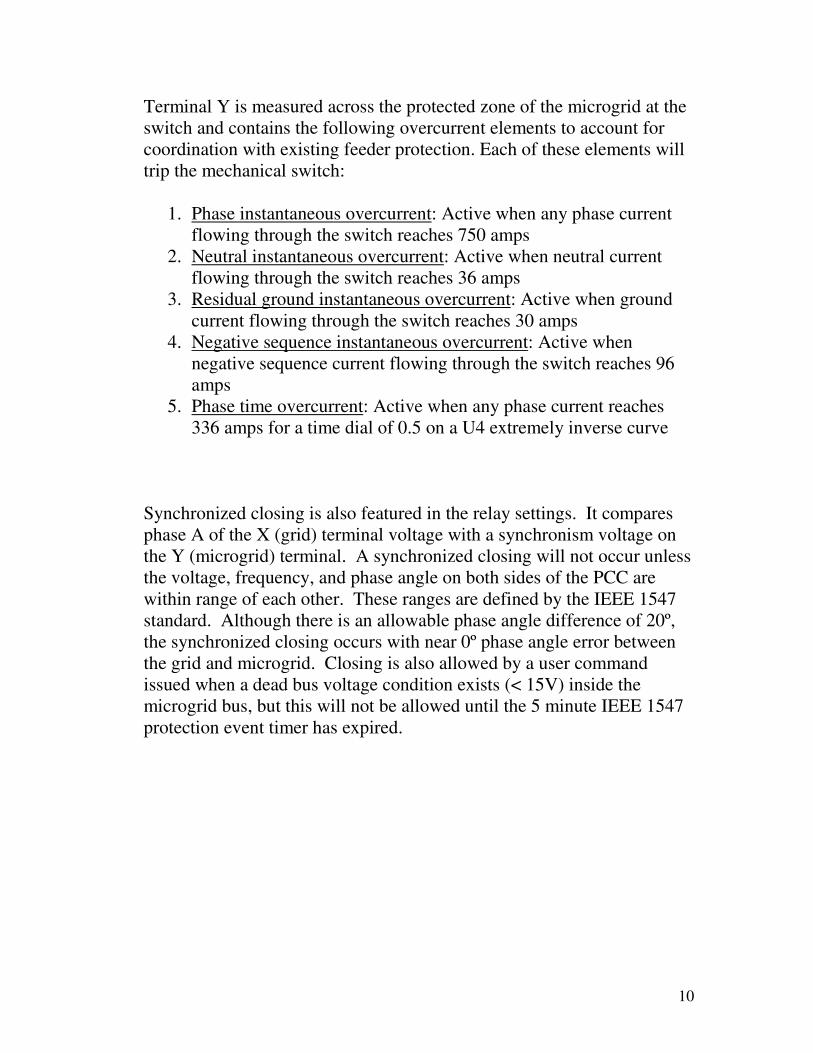
Terminal Y is measured across the protected zone of the microgrid at the switch and contains the following overcurrent elements to account for coordination with existing feeder protection. Each of these elements will trip the mechanical switch:
1. Phase instantaneous overcurrent: Active when any phase current flowing through the switch reaches 750 amps
2. Neutral instantaneous overcurrent: Active when neutral current flowing through the switch reaches 36 amps
3. Residual ground instantaneous overcurrent: Active when ground current flowing through the switch reaches 30 amps
4. Negative sequence instantaneous overcurrent: Active when negative sequence current flowing through the switch reaches 96 amps
5. Phase time overcurrent: Active when any phase current reaches 336 amps for a time dial of 0.5 on a U4 extremely inverse curve
Synchronized closing is also featured in the relay settings. It compares phase A of the X (grid) terminal voltage with a synchronism voltage on the Y (microgrid) terminal. A synchronized closing will not occur unless the voltage, frequency, and phase angle on both sides of the PCC are within range of each other. These ranges are defined by the IEEE 1547 standard. Although there is an allowable phase angle difference of 20º, the synchronized closing occurs with near 0º phase angle error between the grid and microgrid. Closing is also allowed by a user command issued when a dead bus voltage condition exists (< 15V) inside the microgrid bus, but this will not be allowed until the 5 minute IEEE 1547 protection event timer has expired.

11
6. Other relay features
The 700GT has 10 inputs and 11 outputs available for use. The outputs are being utilized for remote tripping and closing of the mechanical switch, and also to send data to the metering network in the test bed. The inputs are used to receive status from the mechanical switch and adjacent breakers in the test bed, as well as a signal from the fire protection system on site. Communications in and out of the relay are being done through two separate ports. The first is an ethernet port that is capable of real time data display and file transfer, as well as modbus functions. The second is a fiber serial port that is capable of SEL communications and receiving an IRIG-B signal for time synchronization with other equipment in the test bed.
7. Relay commissioning
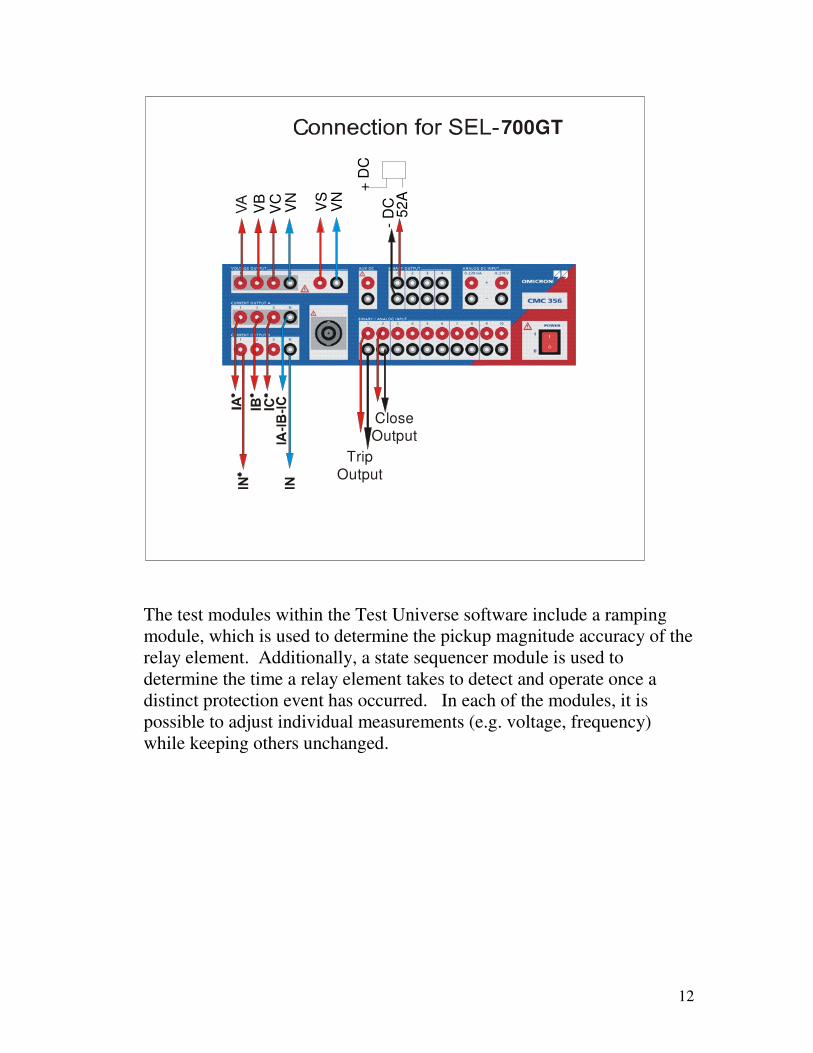
To test that the relay will function as programmed, an Omicron 256 test set and Omicron Test Universe software were used. This unit is designed to perform low level secondary stimulation of the actual voltage and current signals associated with various protection and control events. It contains two sets of current outputs, one set of voltage outputs, and an extra voltage channel for synchronism check. Therefore this set is ideal for testing the necessary IEEE 1547 compliance points. It also features binary inputs and outputs, which were used to simulate the actual feedback from the power breaker, as though it were installed in the field. This feedback loop was completed by programming trip and close logic to outputs on the relay that would send signals to the binaries on the test set, and therefore act as triggers for the tests. The following diagram displays the test setup used:
12
Trip
Output
700GT
VB
VN
VC
VS
VN
CloseOutput
52
A
+ D
C
- D
C
The test modules within the Test Universe software include a ramping module, which is used to determine the pickup magnitude accuracy of the relay element. Additionally, a state sequencer module is used to determine the time a relay element takes to detect and operate once a distinct protection event has occurred. In each of the modules, it is possible to adjust individual measurements (e.g. voltage, frequency) while keeping others unchanged.
13
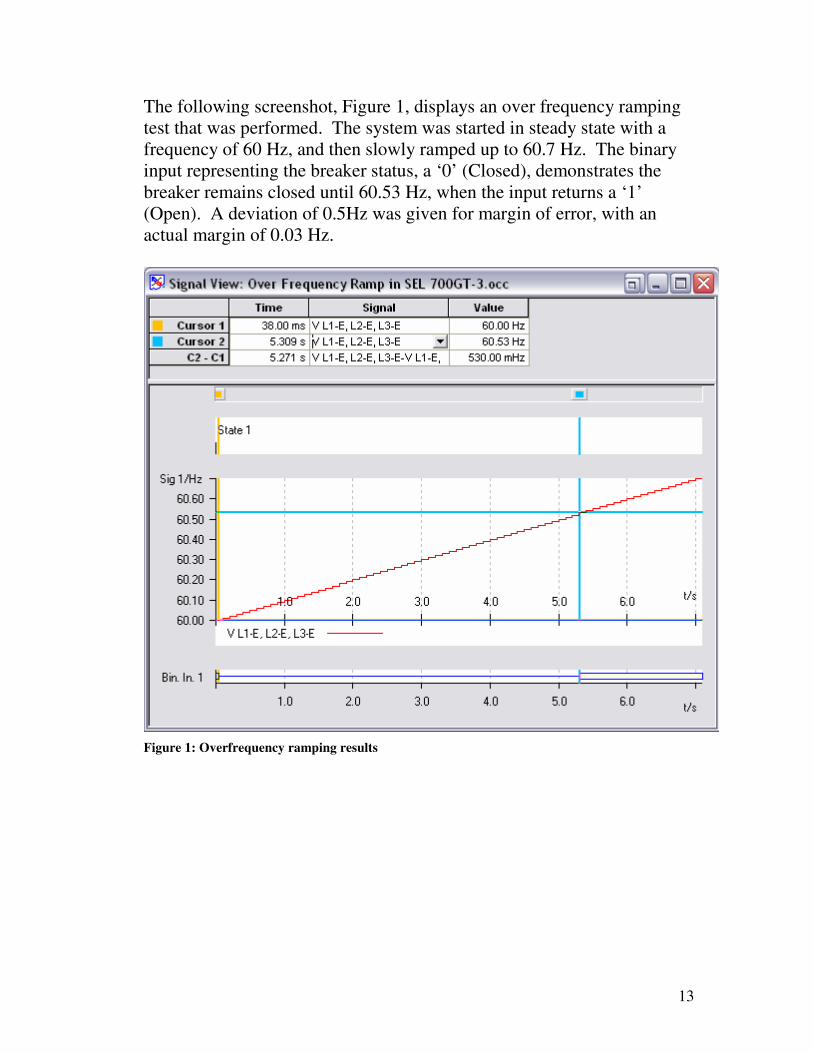
The following screenshot, Figure 1, displays an over frequency ramping test that was performed. The system was started in steady state with a frequency of 60 Hz, and then slowly ramped up to 60.7 Hz. The binary input representing the breaker status, a ‘0’ (Closed), demonstrates the breaker remains closed until 60.53 Hz, when the input returns a ‘1’ (Open). A deviation of 0.5Hz was given for margin of error, with an actual margin of 0.03 Hz.
Figure 1: Overfrequency ramping results
14
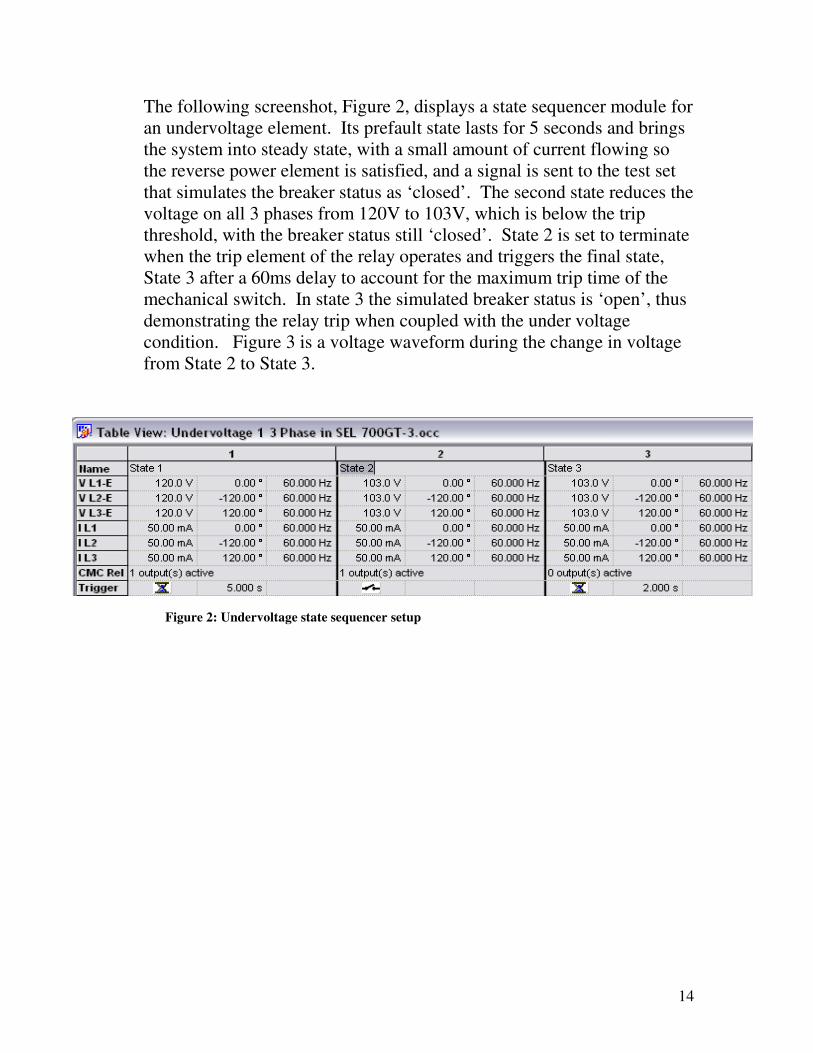
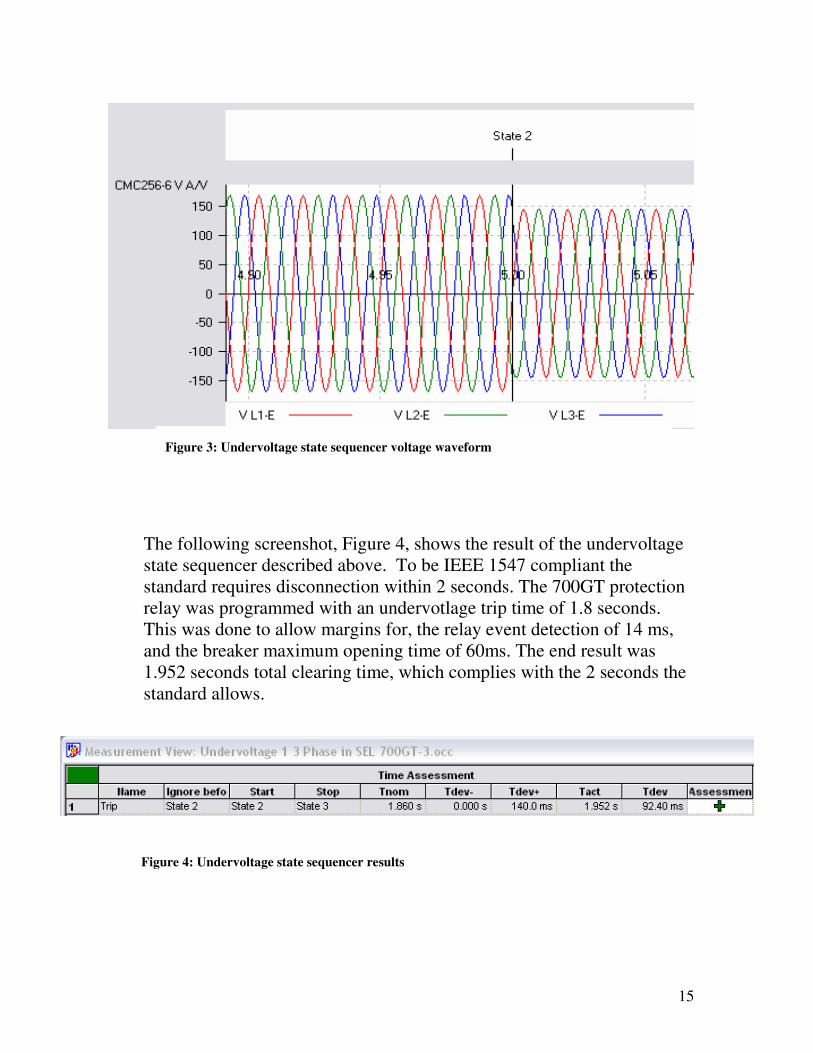
The following screenshot, Figure 2, displays a state sequencer module for an undervoltage element. Its prefault state lasts for 5 seconds and brings the system into steady state, with a small amount of current flowing so the reverse power element is satisfied, and a signal is sent to the test set that simulates the breaker status as ‘closed’. The second state reduces the voltage on all 3 phases from 120V to 103V, which is below the trip threshold, with the breaker status still ‘closed’. State 2 is set to terminate when the trip element of the relay operates and triggers the final state, State 3 after a 60ms delay to account for the maximum trip time of the mechanical switch. In state 3 the simulated breaker status is ‘open’, thus demonstrating the relay trip when coupled with the under voltage condition. Figure 3 is a voltage waveform during the change in voltage from State 2 to State 3.
Figure 2: Undervoltage state sequencer setup
15
The following screenshot, Figure 4, shows the result of the undervoltage state sequencer described above. To be IEEE 1547 compliant the standard requires disconnection within 2 seconds. The 700GT protection relay was programmed with an undervotlage trip time of 1.8 seconds. This was done to allow margins for, the relay event detection of 14 ms, and the breaker maximum opening time of 60ms. The end result was 1.952 seconds total clearing time, which complies with the 2 seconds the standard allows.
Figure 3: Undervoltage state sequencer voltage waveform
Figure 4: Undervoltage state sequencer results
16
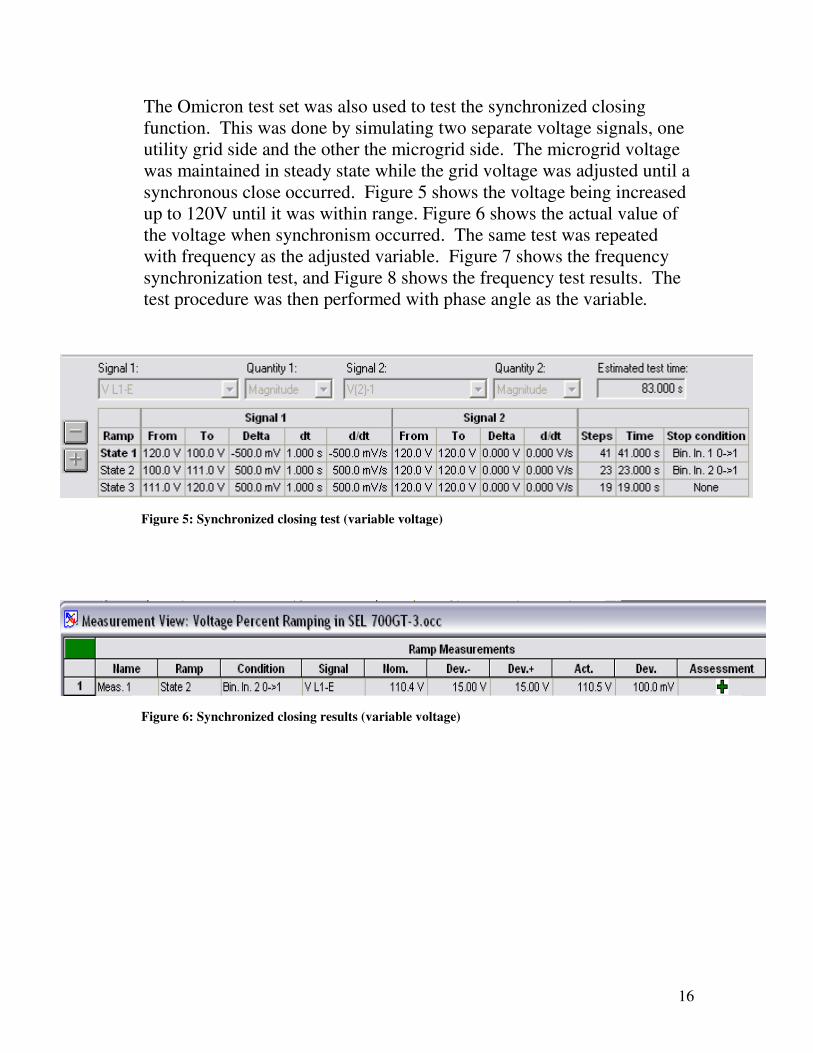
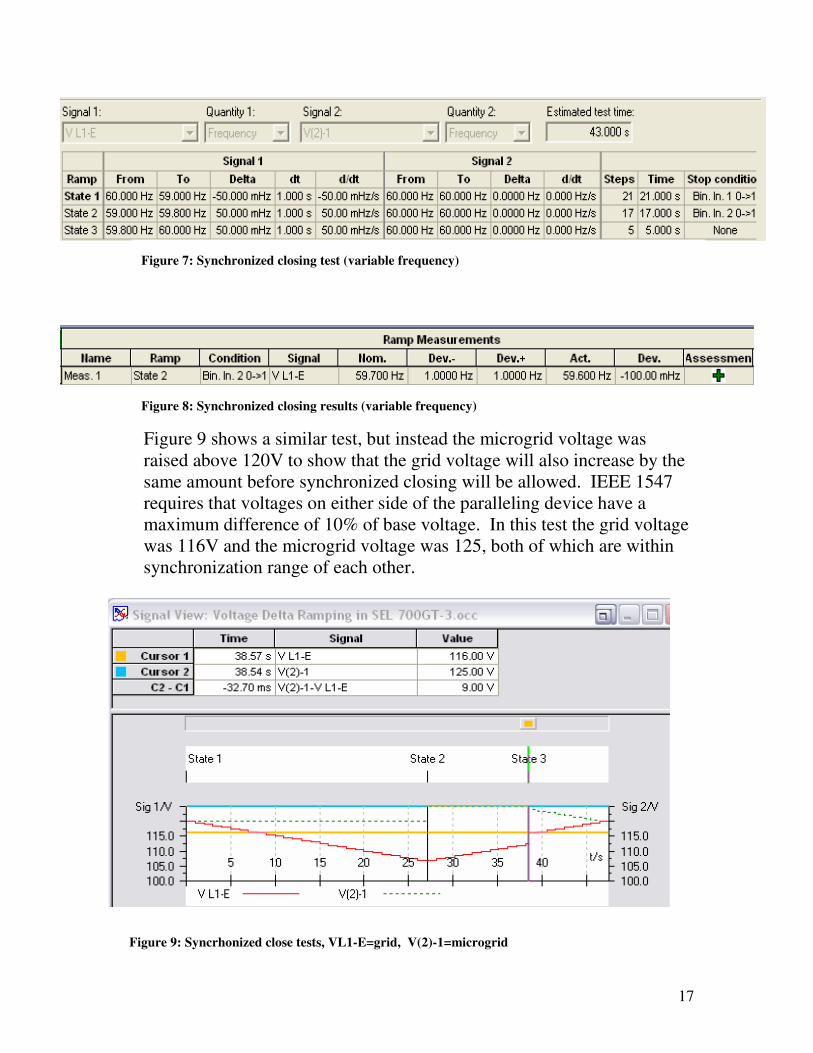
The Omicron test set was also used to test the synchronized closing function. This was done by simulating two separate voltage signals, one utility grid side and the other the microgrid side. The microgrid voltage was maintained in steady state while the grid voltage was adjusted until a synchronous close occurred. Figure 5 shows the voltage being increased up to 120V until it was within range. Figure 6 shows the actual value of the voltage when synchronism occurred. The same test was repeated with frequency as the adjusted variable. Figure 7 shows the frequency synchronization test, and Figure 8 shows the frequency test results. The test procedure was then performed with phase angle as the variable.
Figure 5: Synchronized closing test (variable voltage)
Figure 6: Synchronized closing results (variable voltage)
17
Figure 9 shows a similar test, but instead the microgrid voltage was raised above 120V to show that the grid voltage will also increase by the same amount before synchronized closing will be allowed. IEEE 1547 requires that voltages on either side of the paralleling device have a maximum difference of 10% of base voltage. In this test the grid voltage was 116V and the microgrid voltage was 125, both of which are within synchronization range of each other.
Figure 7: Synchronized closing test (variable frequency)
Figure 8: Synchronized closing results (variable frequency)
Figure 9: Syncrhonized close tests, VL1-E=grid, V(2)-1=microgrid
18
8. Installation of Equipment
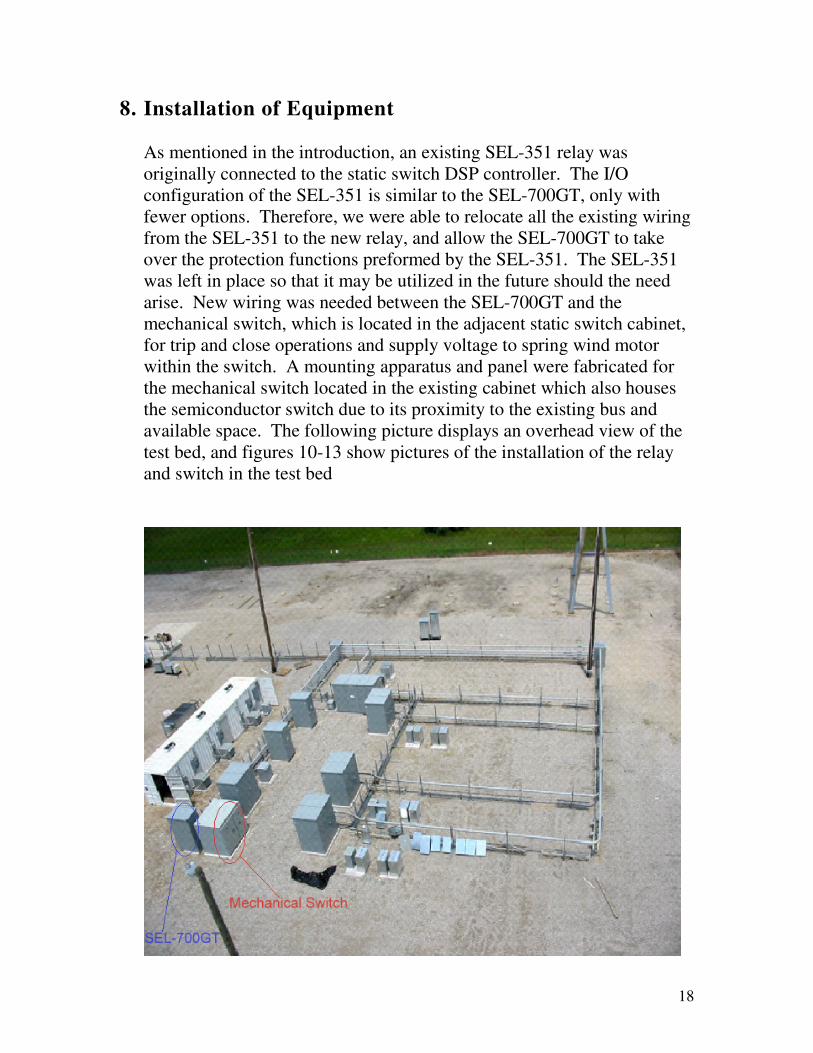
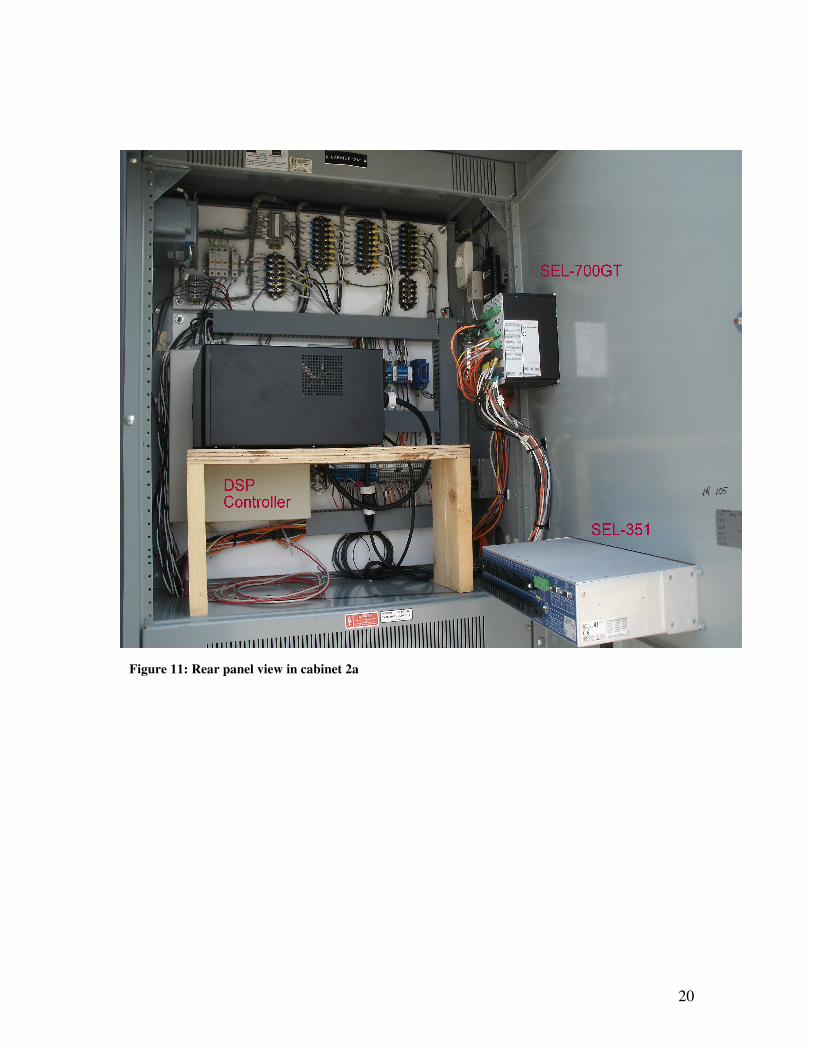
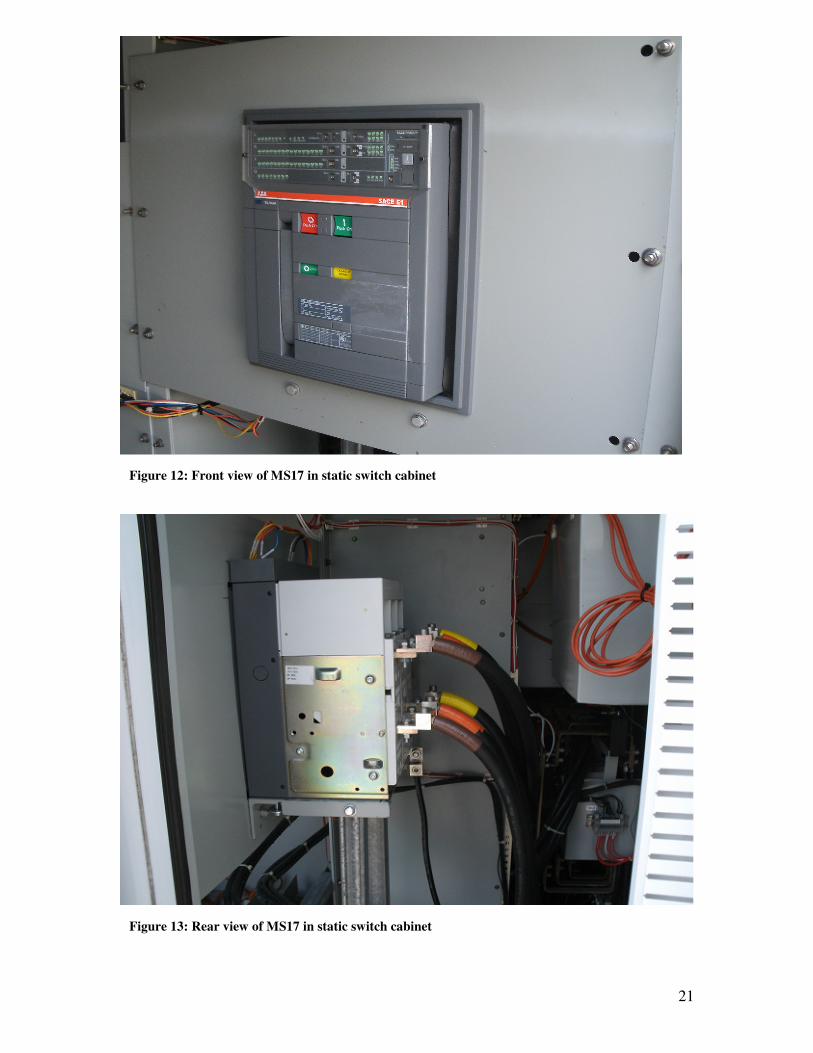
As mentioned in the introduction, an existing SEL-351 relay was originally connected to the static switch DSP controller. The I/O configuration of the SEL-351 is similar to the SEL-700GT, only with fewer options. Therefore, we were able to relocate all the existing wiring from the SEL-351 to the new relay, and allow the SEL-700GT to take over the protection functions preformed by the SEL-351. The SEL-351 was left in place so that it may be utilized in the future should the need arise. New wiring was needed between the SEL-700GT and the mechanical switch, which is located in the adjacent static switch cabinet, for trip and close operations and supply voltage to spring wind motor within the switch. A mounting apparatus and panel were fabricated for the mechanical switch located in the existing cabinet which also houses the semiconductor switch due to its proximity to the existing bus and available space. The following picture displays an overhead view of the test bed, and figures 10-13 show pictures of the installation of the relay and switch in the test bed
19
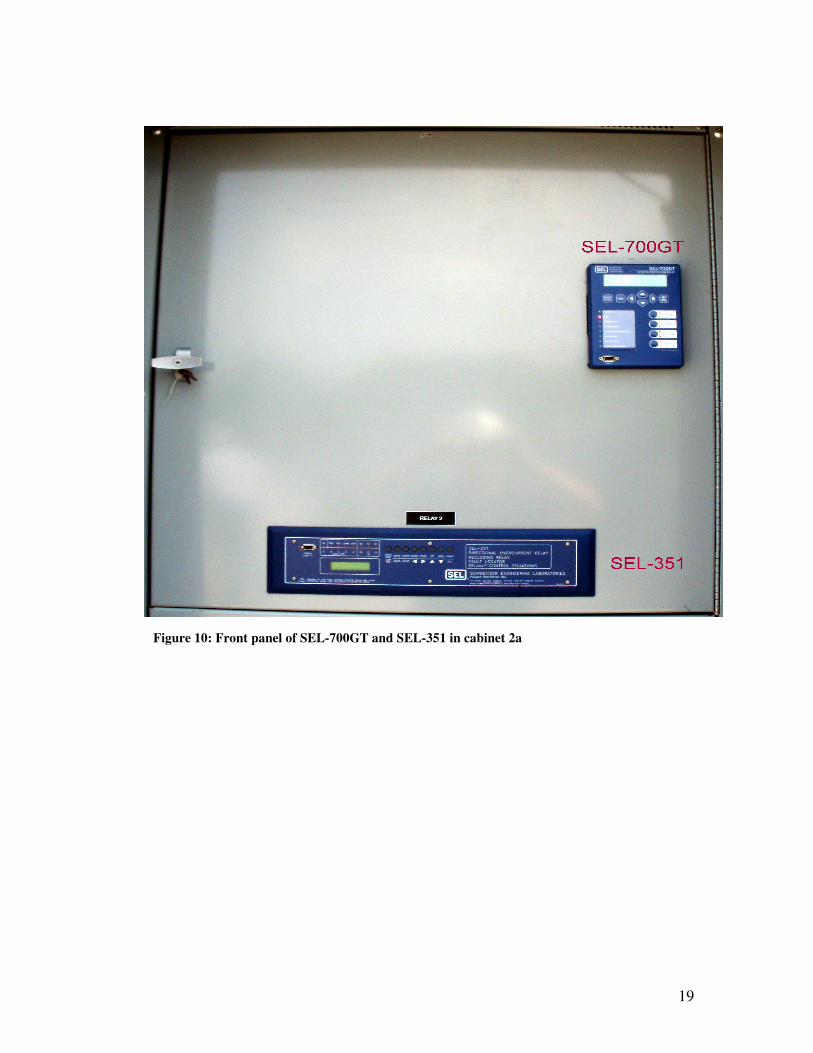
Figure 10: Front panel of SEL-700GT and SEL-351 in cabinet 2a
20
Figure 11: Rear panel view in cabinet 2a
21
Figure 12: Front view of MS17 in static switch cabinet
Figure 13: Rear view of MS17 in static switch cabinet
22
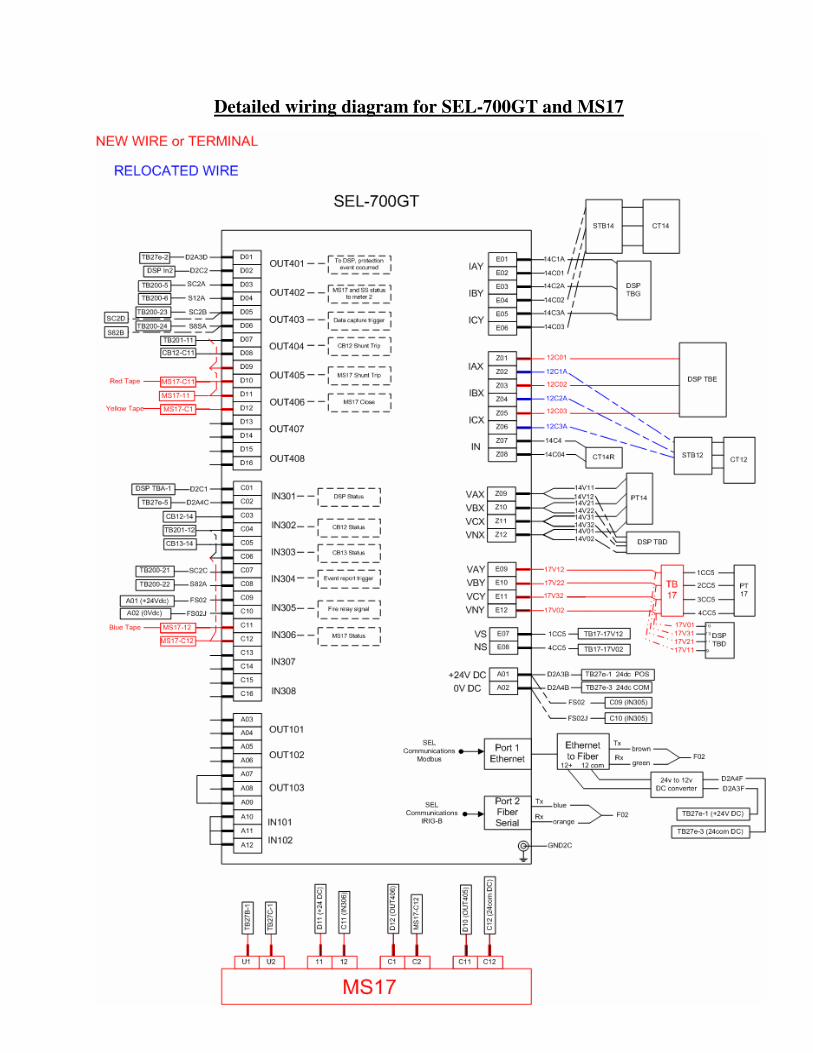
Detailed wiring diagram for SEL-700GT and MS17
23
9. Field Testing and Results
After installation and commissioning was complete, a series of tests were performed to test the CERTS capability and IEEE 1547 compliance of the equipment. These tests took place at Walnut Test Site and utilized the following equipment:
• ABB SACE Emax mechanical switch (MS17)
• S&C semiconductor static switch & DSP controller
• SEL-700GT microprocessor relay
• (3) 95kW load banks on the protected zone of the microgrid (LB3, LB4, LB5)
• (1) 95kW load bank on the unprotected zone of the microgrid (LB6)
• (1) 500kW load bank on the utility grid
• (1) Tecogen 60kW inverter-based genset (A2)
• Test bed safety circuit breaker
• Desktop PC to run Labview and metering programs
The tests that were conducted consist of the following:
9.1. Synchronized closing:
In order to demonstrate IEEE 1547 compliant synchronized closing with smooth transitions, 40kW of load was placed on both the protected and unprotected zones of the microgrid. A genset on the microgrid was also energized and dispatched to 20kW. The protected section of the microgrid begins in an isolated state, and since the islanded load is greater than the dispatched load, the frequency within the protected zone is approximately 59.84Hz. However, the frequency is still within acceptable IEEE 1547 synchronization limit of 0.3Hz relative to the 60Hz ideal grid frequency. Additionally the voltage and phase angle of the grid and microgrid were within an acceptable range of each other. To initiate the test, the ‘manual open’ command was removed from the switch and a synchronized close was allowed to occur when all synchronization conditions were met. Data collected during the closure indicates all the IEEE 1547 requirements were present.
24
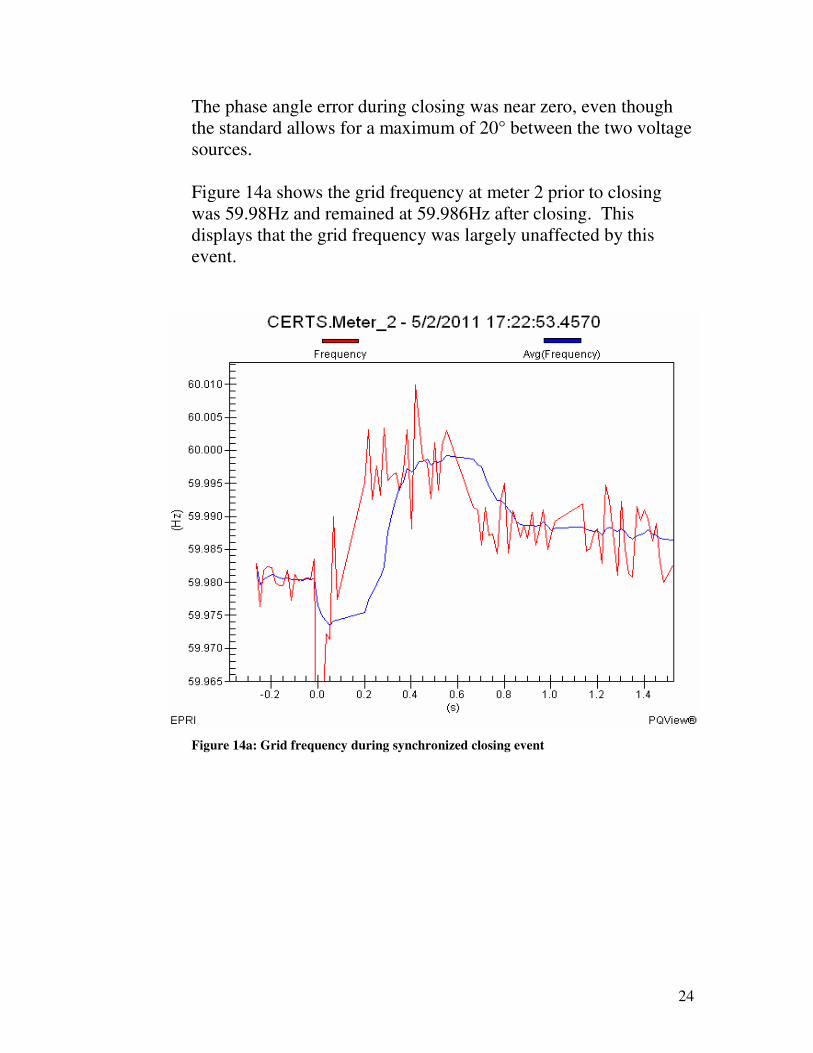
The phase angle error during closing was near zero, even though the standard allows for a maximum of 20° between the two voltage sources.
Figure 14a shows the grid frequency at meter 2 prior to closing was 59.98Hz and remained at 59.986Hz after closing. This displays that the grid frequency was largely unaffected by this event.
Figure 14a: Grid frequency during synchronized closing event
25
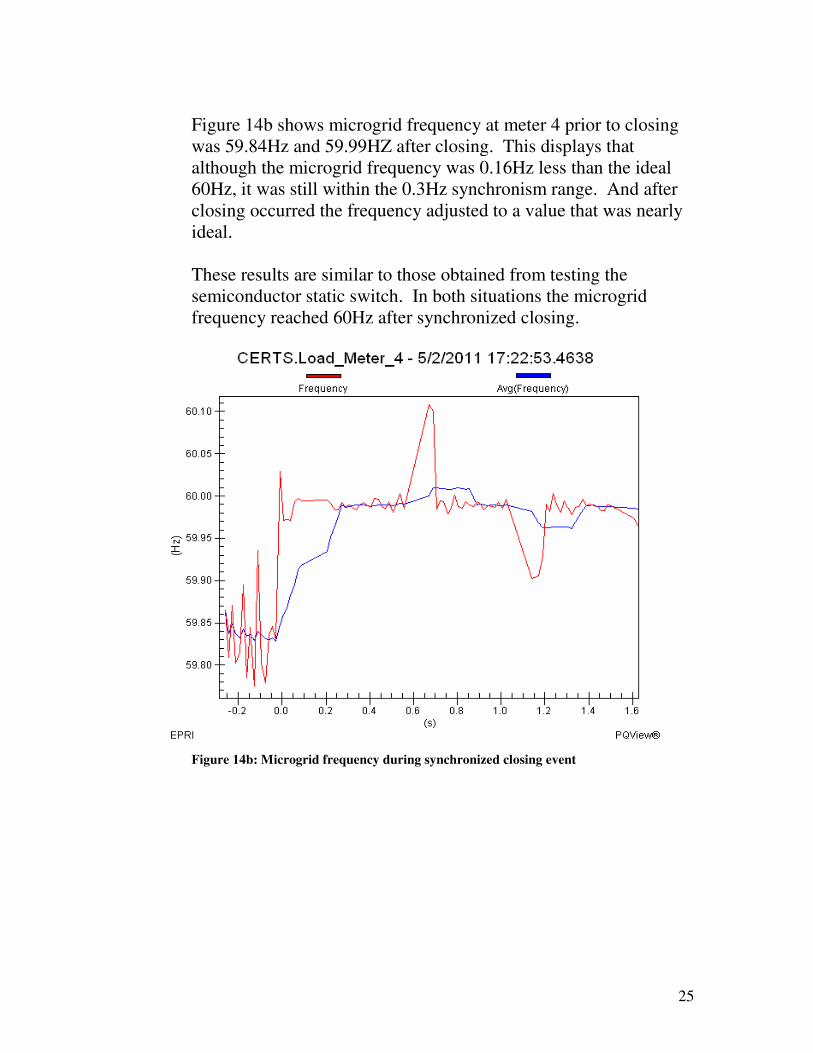
Figure 14b shows microgrid frequency at meter 4 prior to closing was 59.84Hz and 59.99HZ after closing. This displays that although the microgrid frequency was 0.16Hz less than the ideal 60Hz, it was still within the 0.3Hz synchronism range. And after closing occurred the frequency adjusted to a value that was nearly ideal. These results are similar to those obtained from testing the semiconductor static switch. In both situations the microgrid frequency reached 60Hz after synchronized closing.
Figure 14b: Microgrid frequency during synchronized closing event
26
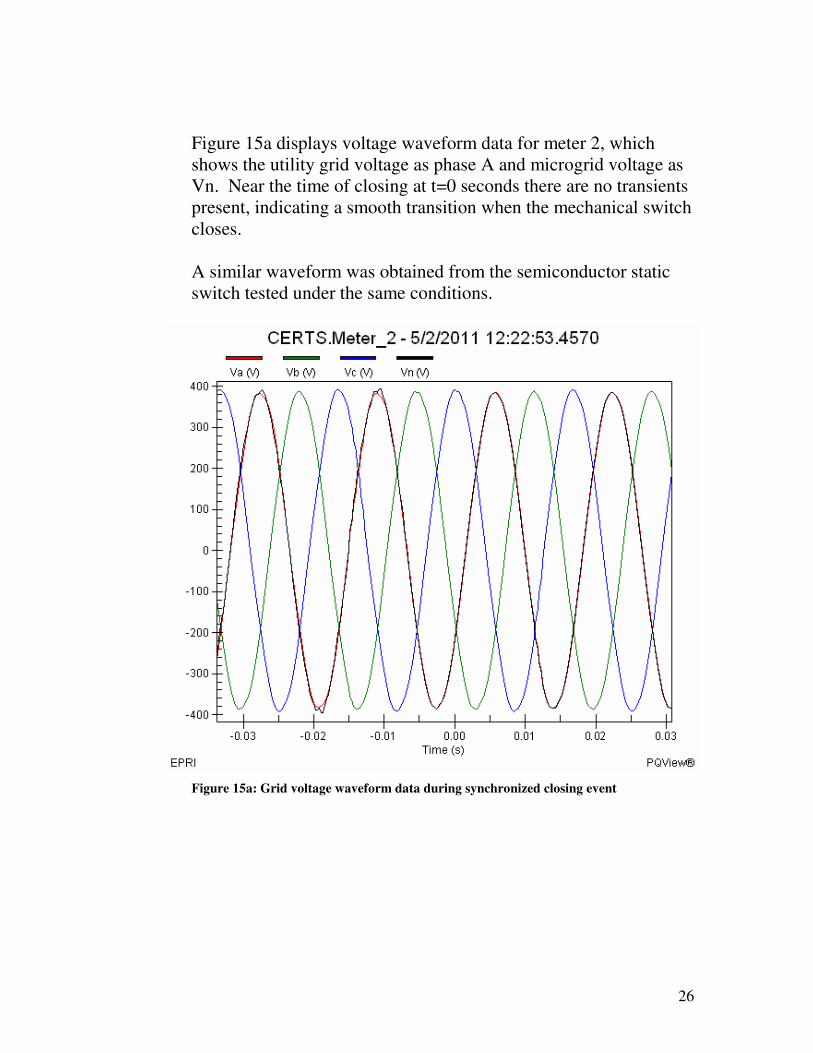
Figure 15a displays voltage waveform data for meter 2, which shows the utility grid voltage as phase A and microgrid voltage as Vn. Near the time of closing at t=0 seconds there are no transients present, indicating a smooth transition when the mechanical switch closes. A similar waveform was obtained from the semiconductor static switch tested under the same conditions.
Figure 15a: Grid voltage waveform data during synchronized closing event
27
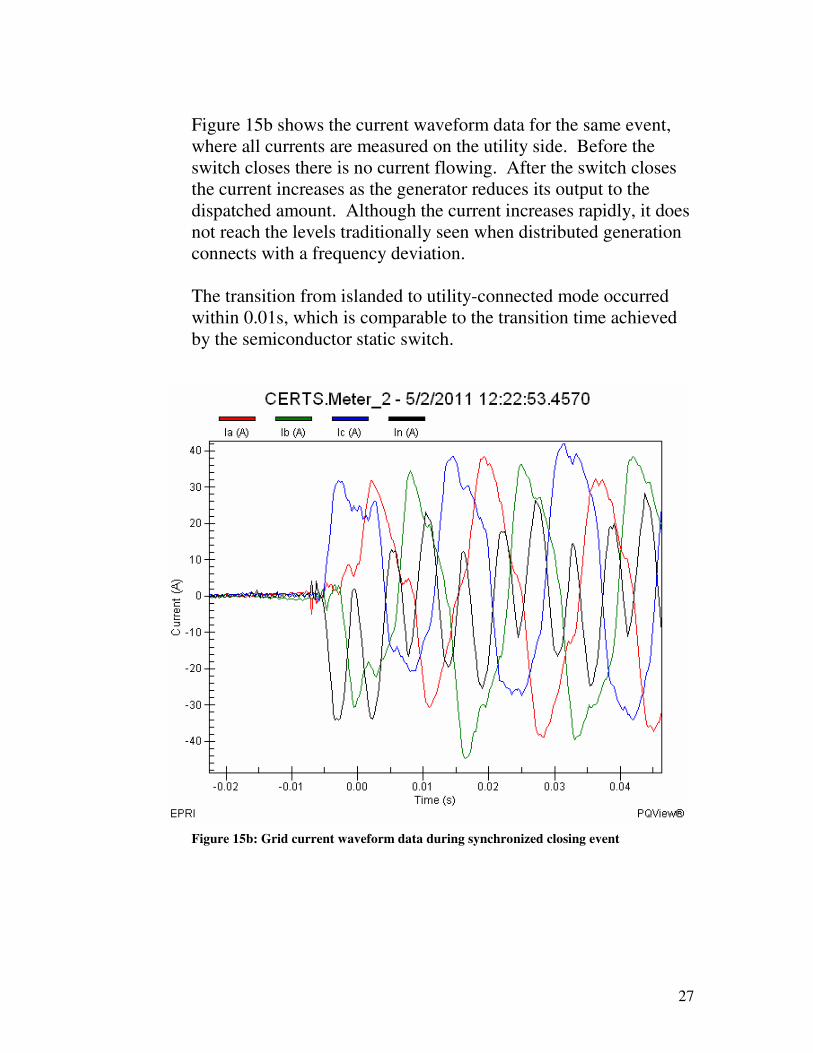
Figure 15b shows the current waveform data for the same event, where all currents are measured on the utility side. Before the switch closes there is no current flowing. After the switch closes the current increases as the generator reduces its output to the dispatched amount. Although the current increases rapidly, it does not reach the levels traditionally seen when distributed generation connects with a frequency deviation. The transition from islanded to utility-connected mode occurred within 0.01s, which is comparable to the transition time achieved by the semiconductor static switch.
Figure 15b: Grid current waveform data during synchronized closing event
28
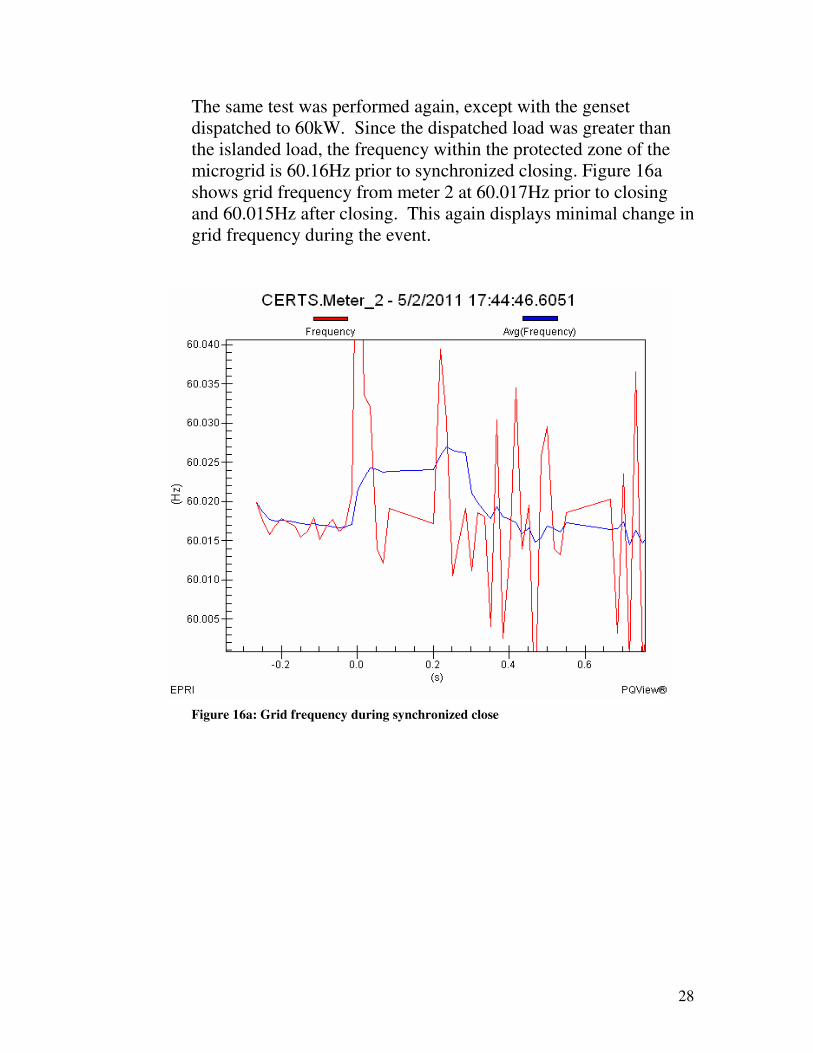
The same test was performed again, except with the genset dispatched to 60kW. Since the dispatched load was greater than the islanded load, the frequency within the protected zone of the microgrid is 60.16Hz prior to synchronized closing. Figure 16a shows grid frequency from meter 2 at 60.017Hz prior to closing and 60.015Hz after closing. This again displays minimal change in grid frequency during the event.
Figure 16a: Grid frequency during synchronized close
29
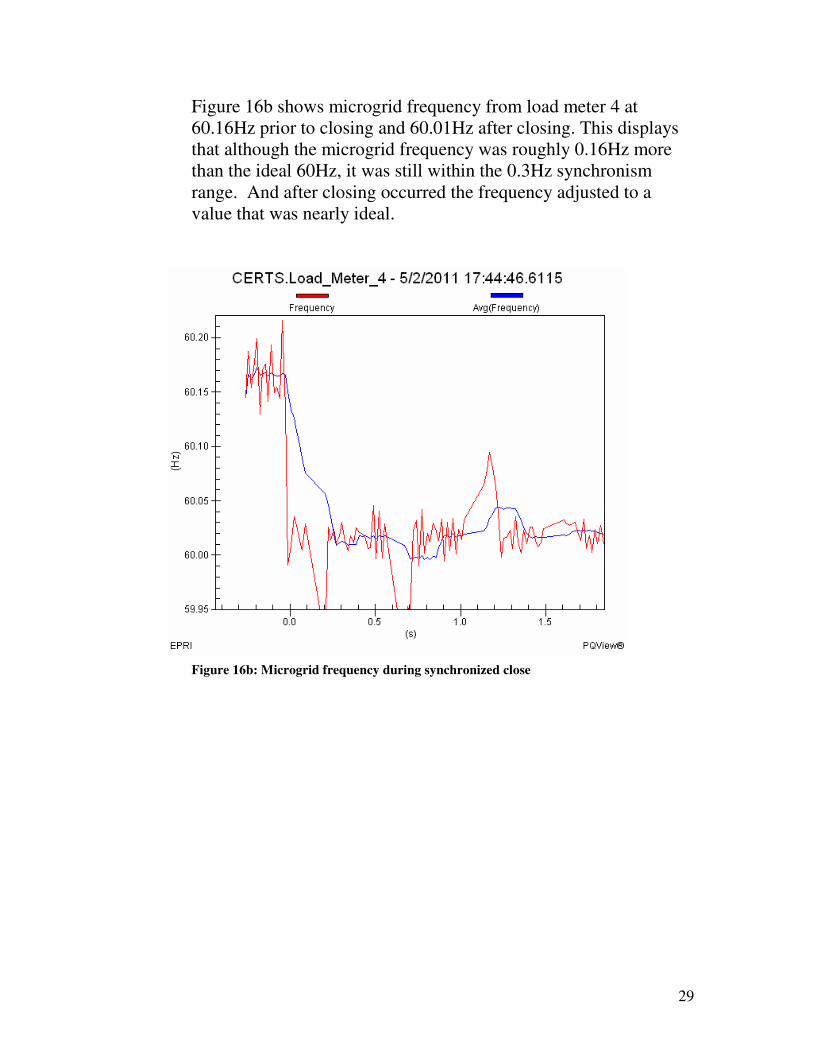
Figure 16b shows microgrid frequency from load meter 4 at 60.16Hz prior to closing and 60.01Hz after closing. This displays that although the microgrid frequency was roughly 0.16Hz more than the ideal 60Hz, it was still within the 0.3Hz synchronism range. And after closing occurred the frequency adjusted to a value that was nearly ideal.
Figure 16b: Microgrid frequency during synchronized close
30
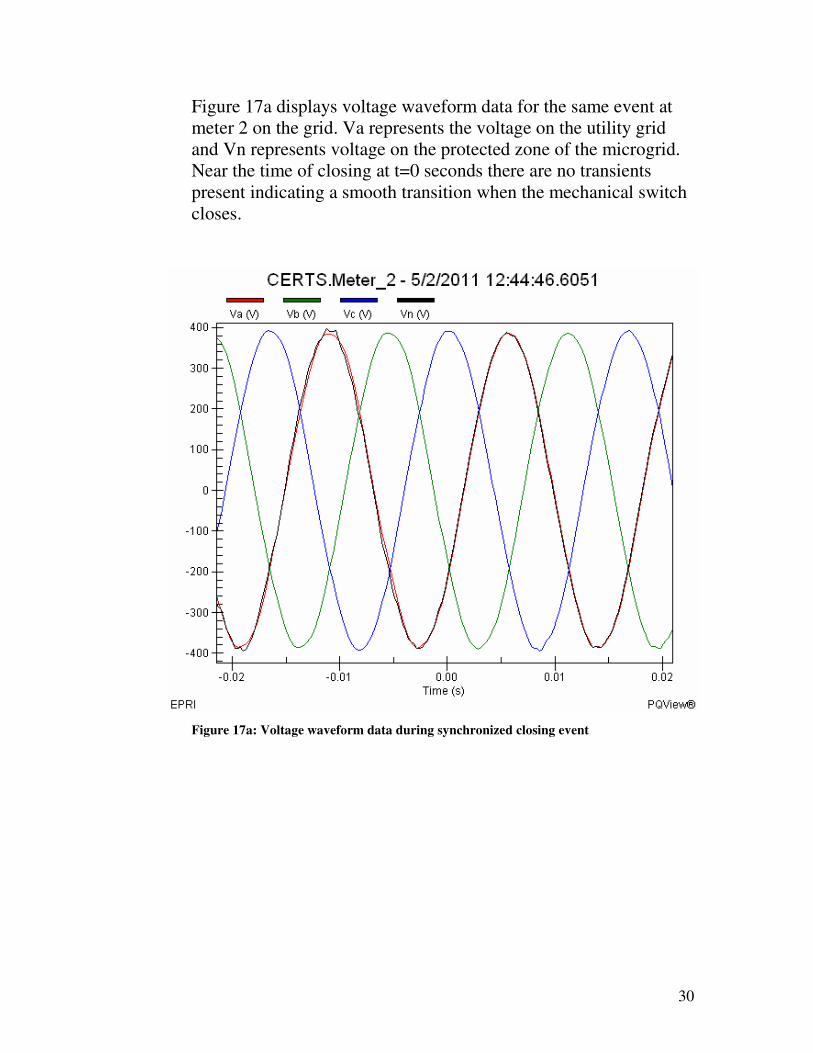
Figure 17a displays voltage waveform data for the same event at meter 2 on the grid. Va represents the voltage on the utility grid and Vn represents voltage on the protected zone of the microgrid. Near the time of closing at t=0 seconds there are no transients present indicating a smooth transition when the mechanical switch closes.
Figure 17a: Voltage waveform data during synchronized closing event
31
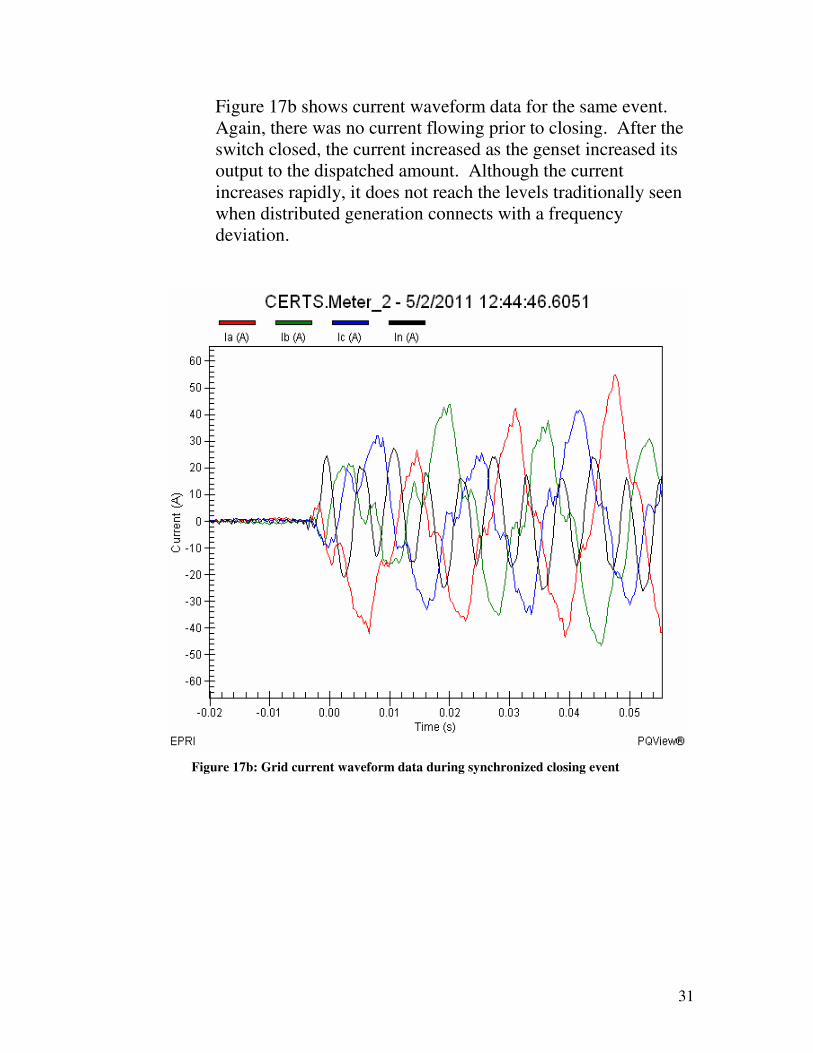
Figure 17b shows current waveform data for the same event. Again, there was no current flowing prior to closing. After the switch closed, the current increased as the genset increased its output to the dispatched amount. Although the current increases rapidly, it does not reach the levels traditionally seen when distributed generation connects with a frequency deviation.
Figure 17b: Grid current waveform data during synchronized closing event
32
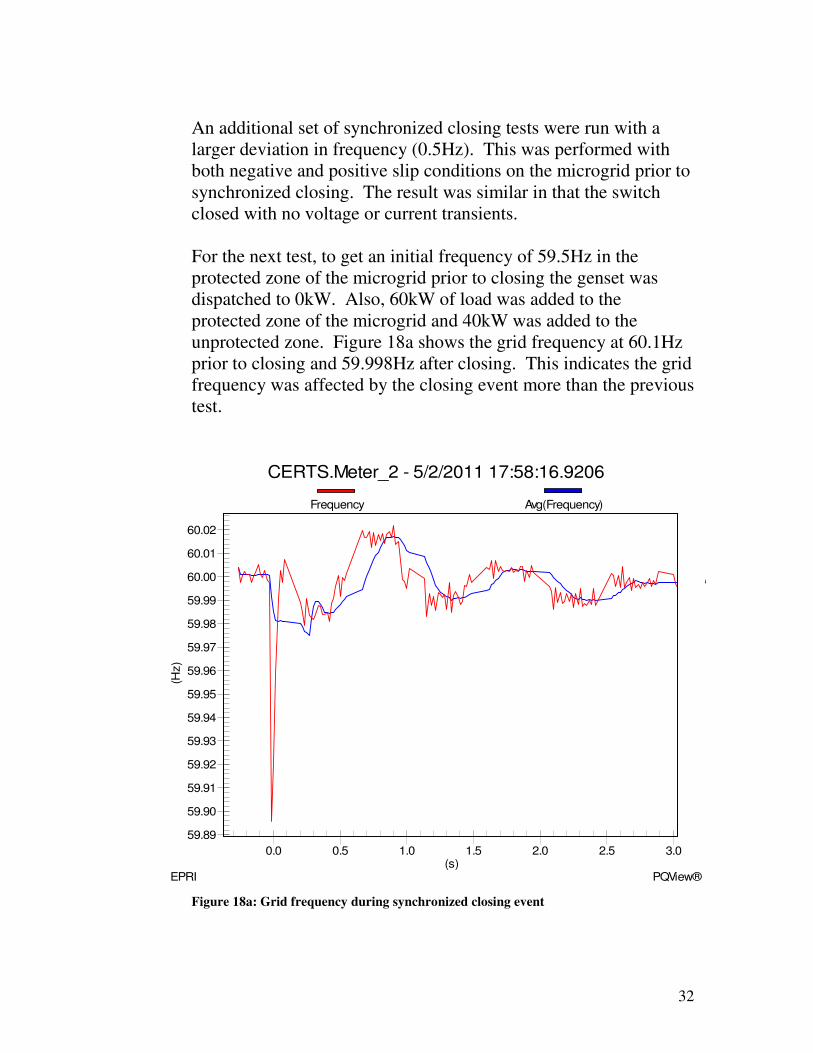
An additional set of synchronized closing tests were run with a larger deviation in frequency (0.5Hz). This was performed with both negative and positive slip conditions on the microgrid prior to synchronized closing. The result was similar in that the switch closed with no voltage or current transients.
For the next test, to get an initial frequency of 59.5Hz in the protected zone of the microgrid prior to closing the genset was dispatched to 0kW. Also, 60kW of load was added to the protected zone of the microgrid and 40kW was added to the unprotected zone. Figure 18a shows the grid frequency at 60.1Hz prior to closing and 59.998Hz after closing. This indicates the grid frequency was affected by the closing event more than the previous test.
59.89
59.90
59.91
59.92
59.93
59.94
59.95
59.96
59.97
59.98
59.99
60.00
60.01
60.02
0.0 0.5 1.0 1.5 2.0 2.5 3.0
CERTS.Meter_2 - 5/2/2011 17:58:16.9206
EPRI PQView®
(H
z)
(s)
Frequency Avg(Frequency)
Figure 18a: Grid frequency during synchronized closing event
33
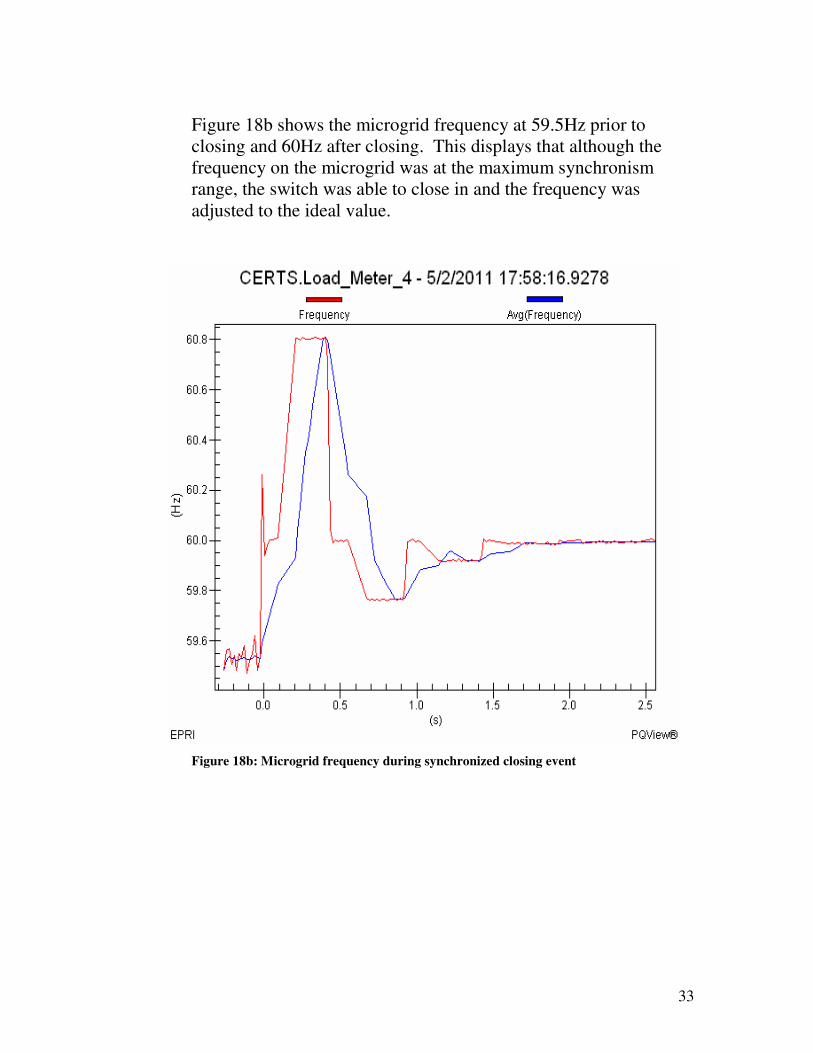
Figure 18b shows the microgrid frequency at 59.5Hz prior to closing and 60Hz after closing. This displays that although the frequency on the microgrid was at the maximum synchronism range, the switch was able to close in and the frequency was adjusted to the ideal value.
Figure 18b: Microgrid frequency during synchronized closing event
34
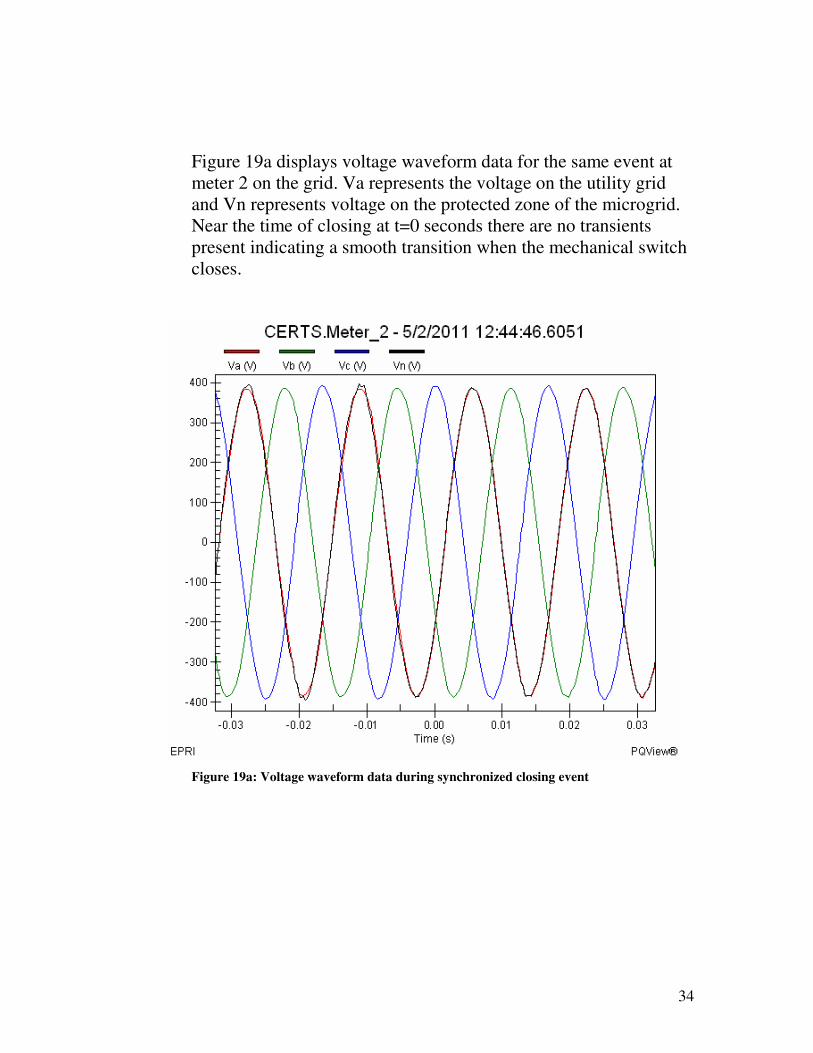
Figure 19a displays voltage waveform data for the same event at meter 2 on the grid. Va represents the voltage on the utility grid and Vn represents voltage on the protected zone of the microgrid. Near the time of closing at t=0 seconds there are no transients present indicating a smooth transition when the mechanical switch closes.
Figure 19a: Voltage waveform data during synchronized closing event
35
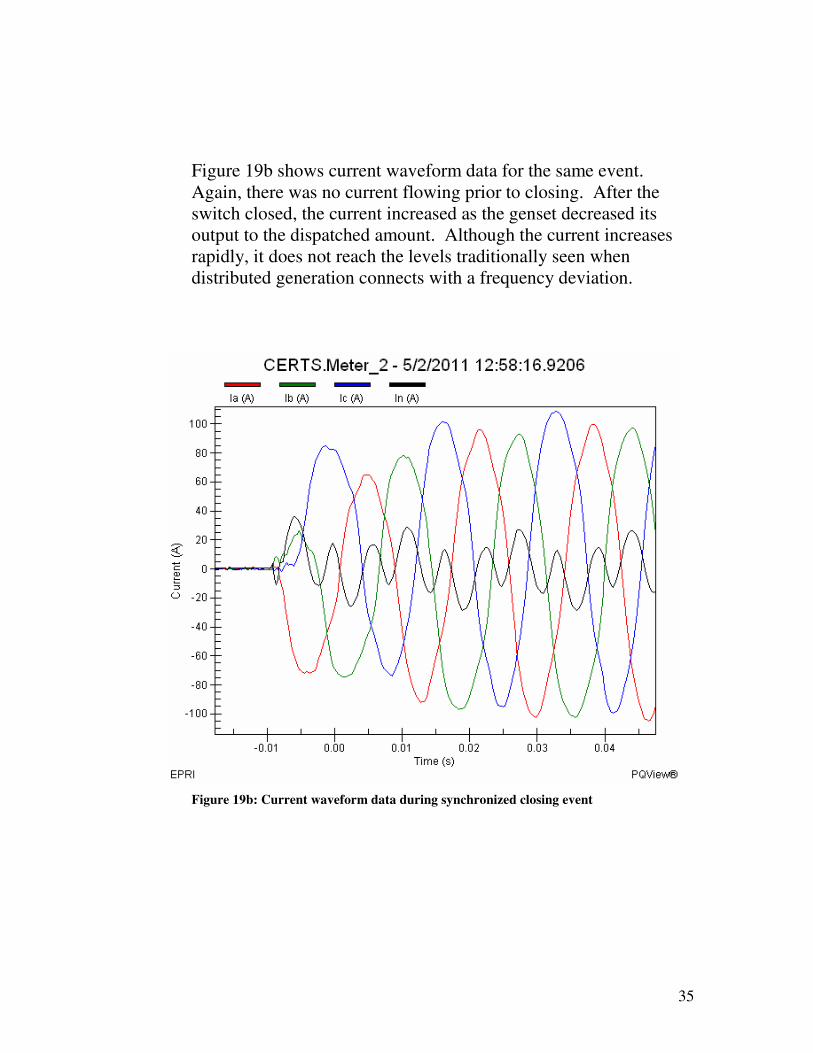
Figure 19b shows current waveform data for the same event. Again, there was no current flowing prior to closing. After the switch closed, the current increased as the genset decreased its output to the dispatched amount. Although the current increases rapidly, it does not reach the levels traditionally seen when distributed generation connects with a frequency deviation.
Figure 19b: Current waveform data during synchronized closing event
36
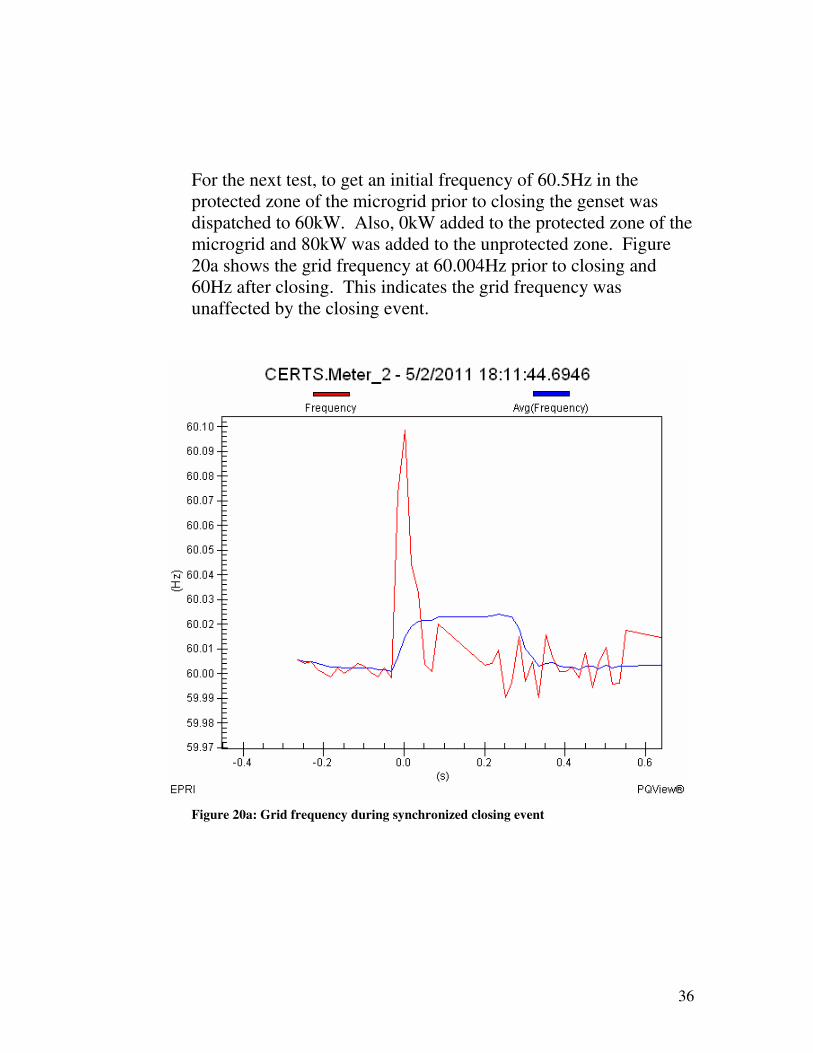
For the next test, to get an initial frequency of 60.5Hz in the protected zone of the microgrid prior to closing the genset was dispatched to 60kW. Also, 0kW added to the protected zone of the microgrid and 80kW was added to the unprotected zone. Figure 20a shows the grid frequency at 60.004Hz prior to closing and 60Hz after closing. This indicates the grid frequency was unaffected by the closing event.
Figure 20a: Grid frequency during synchronized closing event
37
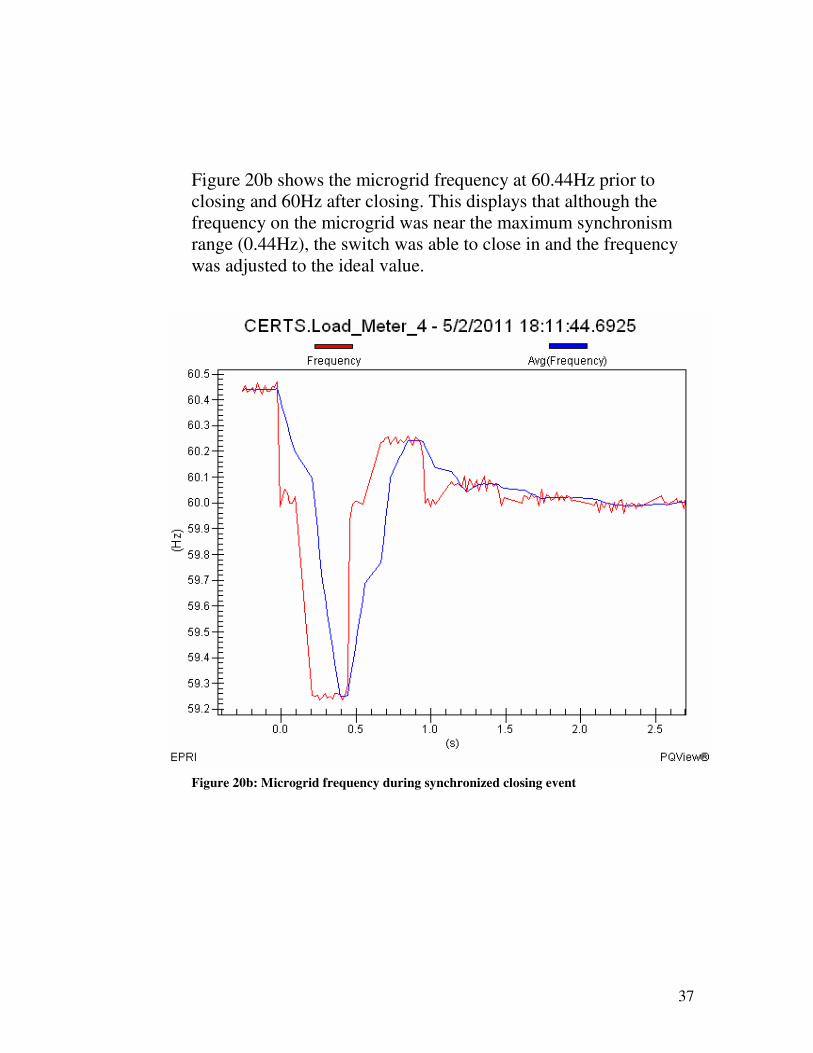
Figure 20b shows the microgrid frequency at 60.44Hz prior to closing and 60Hz after closing. This displays that although the frequency on the microgrid was near the maximum synchronism range (0.44Hz), the switch was able to close in and the frequency was adjusted to the ideal value.
Figure 20b: Microgrid frequency during synchronized closing event
38
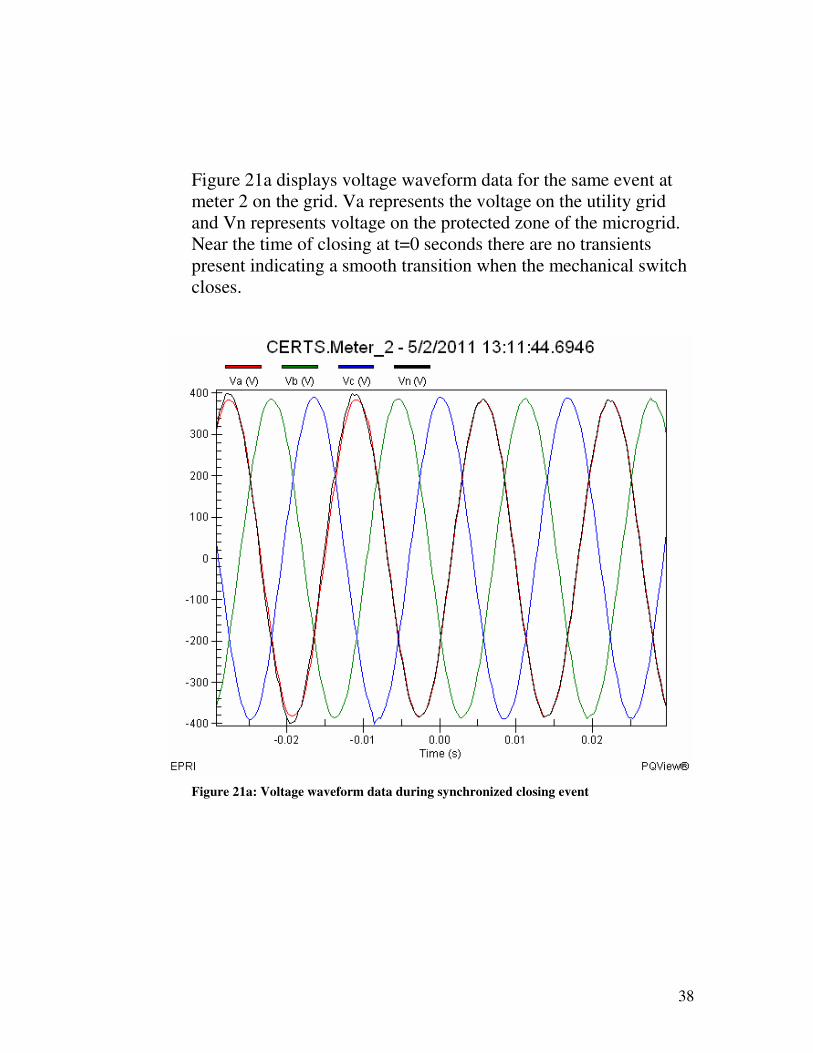
Figure 21a displays voltage waveform data for the same event at meter 2 on the grid. Va represents the voltage on the utility grid and Vn represents voltage on the protected zone of the microgrid. Near the time of closing at t=0 seconds there are no transients present indicating a smooth transition when the mechanical switch closes.
Figure 21a: Voltage waveform data during synchronized closing event
39
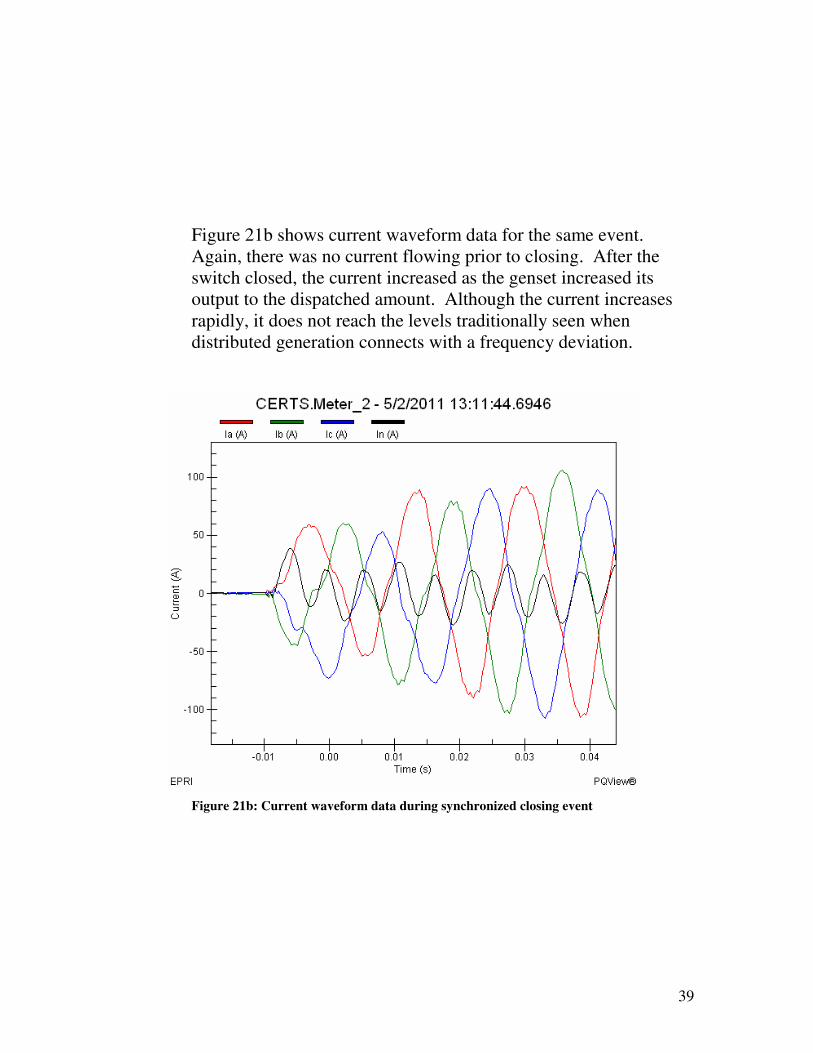
Figure 21b shows current waveform data for the same event. Again, there was no current flowing prior to closing. After the switch closed, the current increased as the genset increased its output to the dispatched amount. Although the current increases rapidly, it does not reach the levels traditionally seen when distributed generation connects with a frequency deviation.
Figure 21b: Current waveform data during synchronized closing event
40
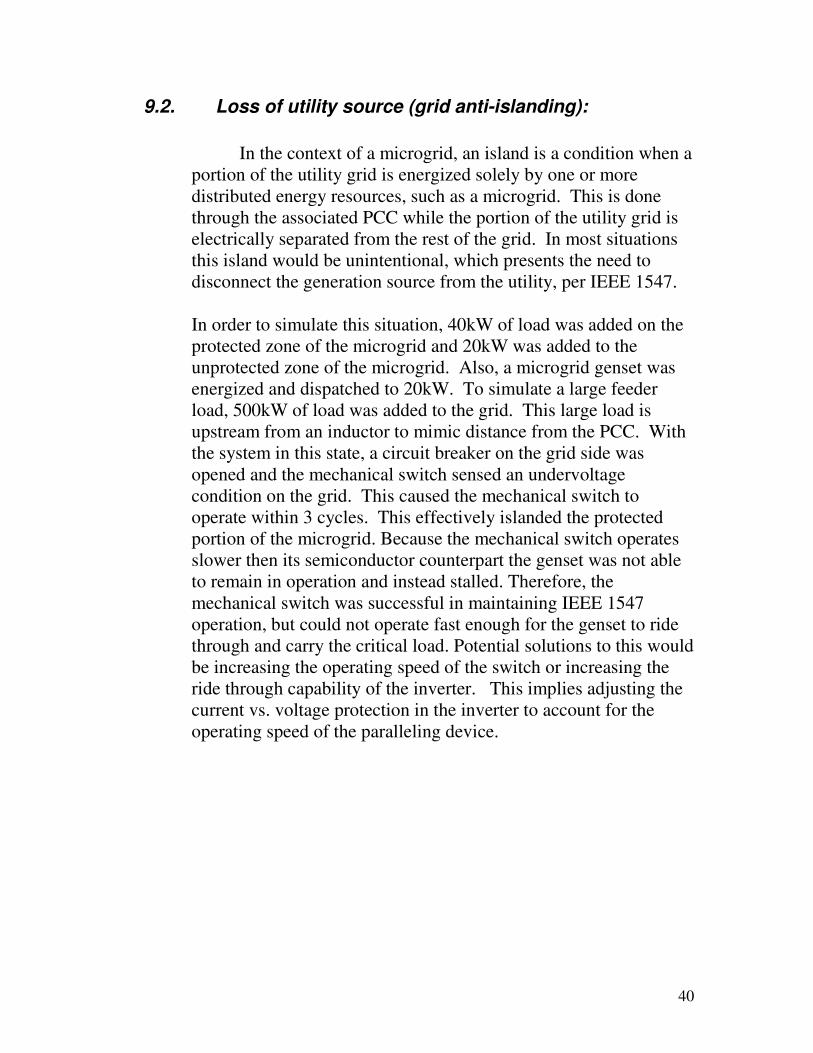
9.2. Loss of utility source (grid anti-islanding):
In the context of a microgrid, an island is a condition when a portion of the utility grid is energized solely by one or more distributed energy resources, such as a microgrid. This is done through the associated PCC while the portion of the utility grid is electrically separated from the rest of the grid. In most situations this island would be unintentional, which presents the need to disconnect the generation source from the utility, per IEEE 1547.
In order to simulate this situation, 40kW of load was added on the protected zone of the microgrid and 20kW was added to the unprotected zone of the microgrid. Also, a microgrid genset was energized and dispatched to 20kW. To simulate a large feeder load, 500kW of load was added to the grid. This large load is upstream from an inductor to mimic distance from the PCC. With the system in this state, a circuit breaker on the grid side was opened and the mechanical switch sensed an undervoltage condition on the grid. This caused the mechanical switch to operate within 3 cycles. This effectively islanded the protected portion of the microgrid. Because the mechanical switch operates slower then its semiconductor counterpart the genset was not able to remain in operation and instead stalled. Therefore, the mechanical switch was successful in maintaining IEEE 1547 operation, but could not operate fast enough for the genset to ride through and carry the critical load. Potential solutions to this would be increasing the operating speed of the switch or increasing the ride through capability of the inverter. This implies adjusting the current vs. voltage protection in the inverter to account for the operating speed of the paralleling device.
41
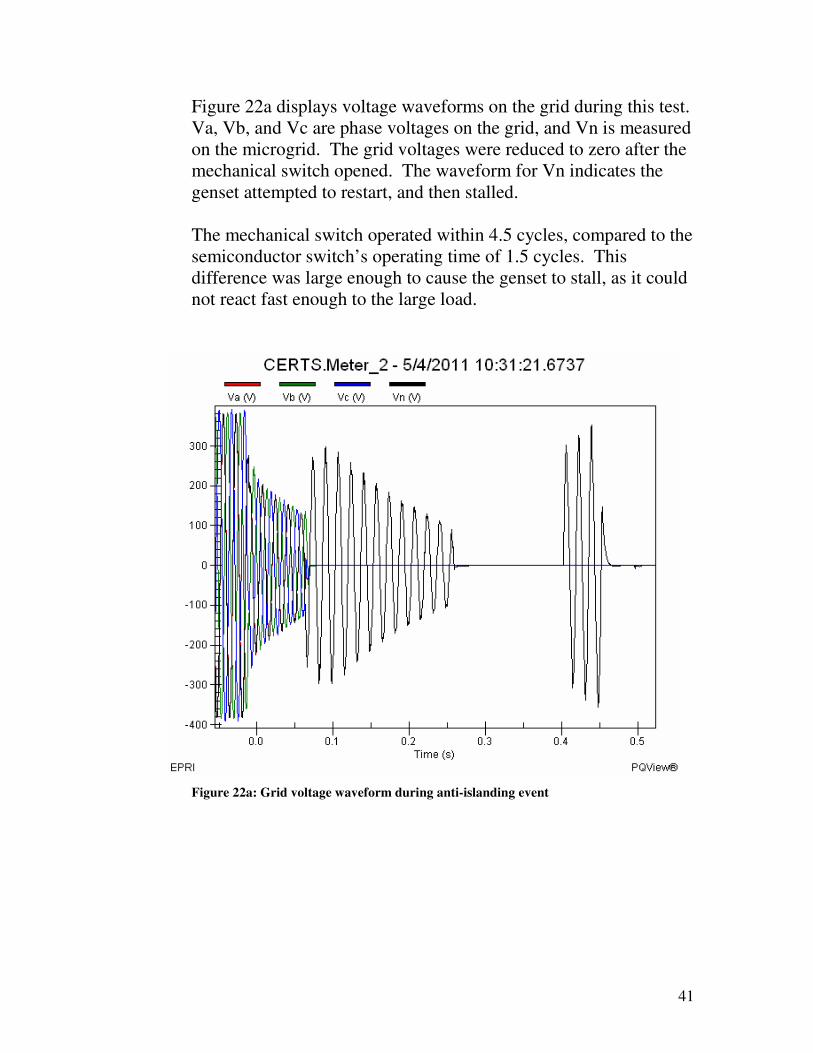
Figure 22a displays voltage waveforms on the grid during this test. Va, Vb, and Vc are phase voltages on the grid, and Vn is measured on the microgrid. The grid voltages were reduced to zero after the mechanical switch opened. The waveform for Vn indicates the genset attempted to restart, and then stalled. The mechanical switch operated within 4.5 cycles, compared to the semiconductor switch’s operating time of 1.5 cycles. This difference was large enough to cause the genset to stall, as it could not react fast enough to the large load.
Figure 22a: Grid voltage waveform during anti-islanding event
42
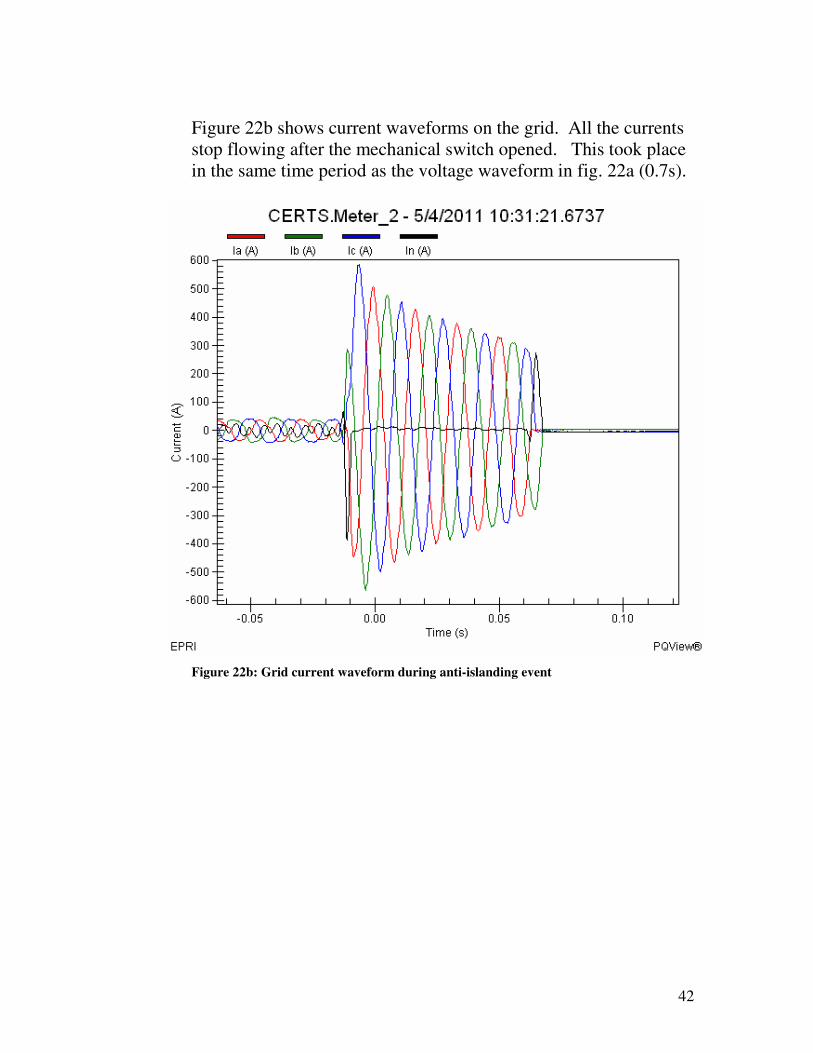
Figure 22b shows current waveforms on the grid. All the currents stop flowing after the mechanical switch opened. This took place in the same time period as the voltage waveform in fig. 22a (0.7s).
Figure 22b: Grid current waveform during anti-islanding event
43
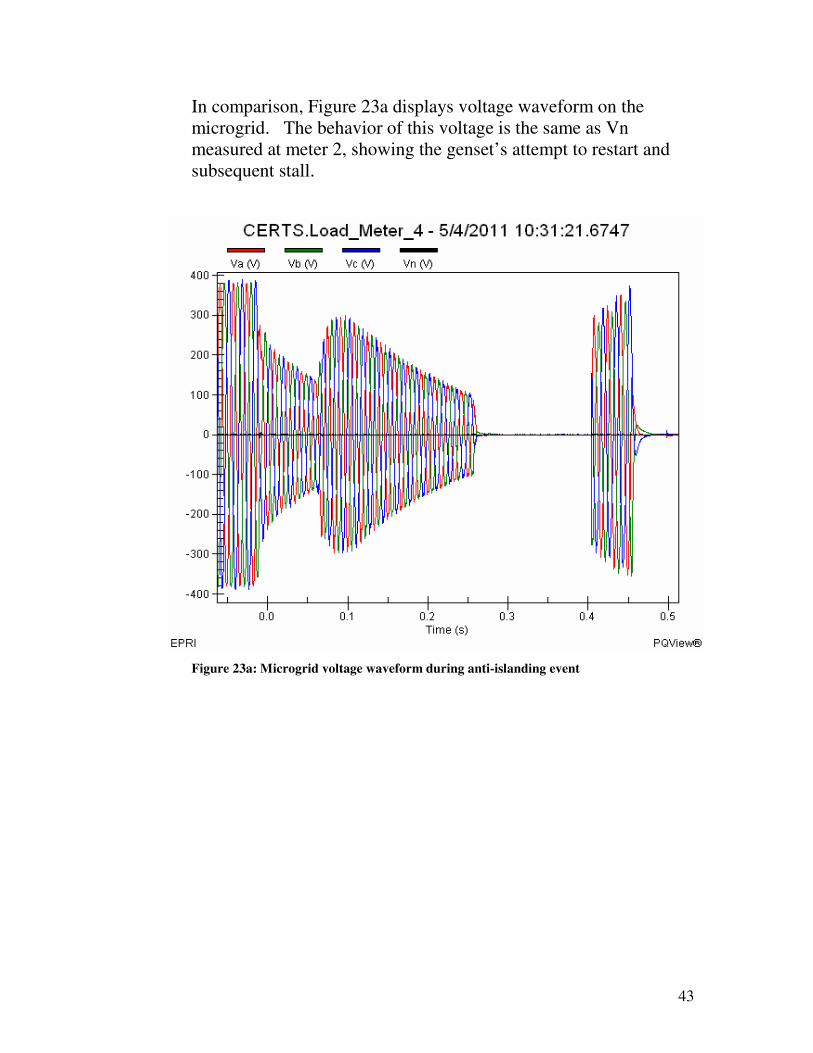
In comparison, Figure 23a displays voltage waveform on the microgrid. The behavior of this voltage is the same as Vn measured at meter 2, showing the genset’s attempt to restart and subsequent stall.
Figure 23a: Microgrid voltage waveform during anti-islanding event
44
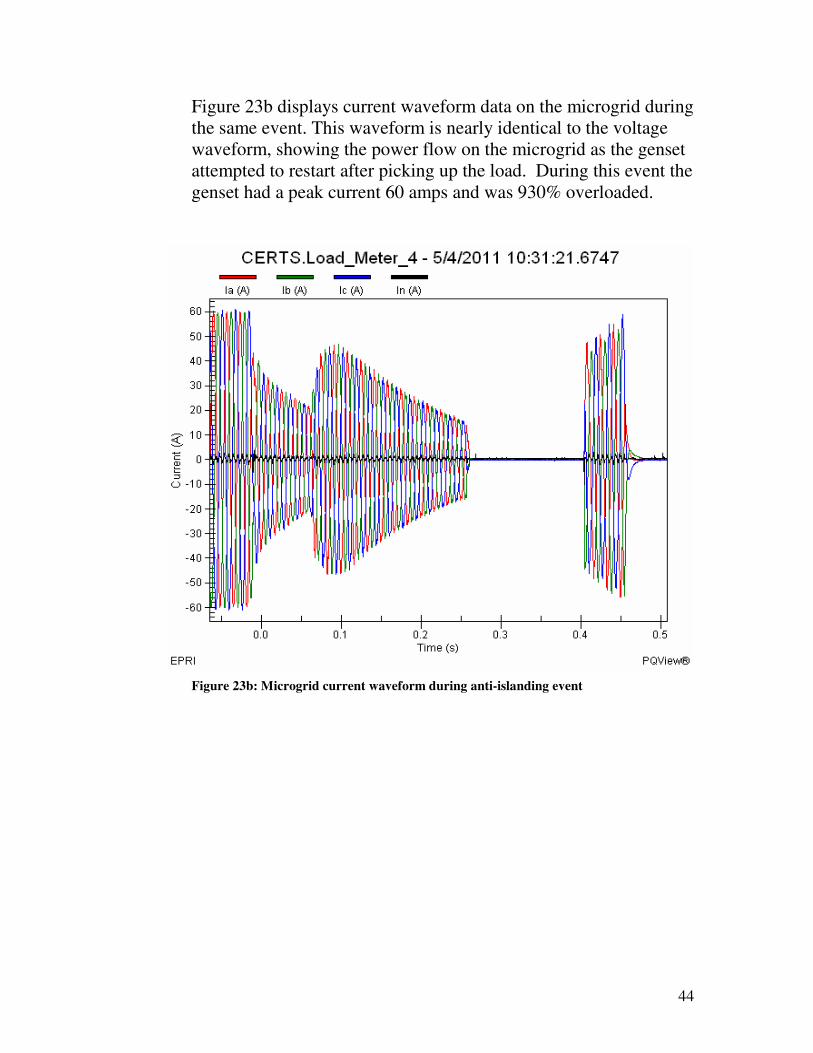
Figure 23b displays current waveform data on the microgrid during the same event. This waveform is nearly identical to the voltage waveform, showing the power flow on the microgrid as the genset attempted to restart after picking up the load. During this event the genset had a peak current 60 amps and was 930% overloaded.
Figure 23b: Microgrid current waveform during anti-islanding event
45
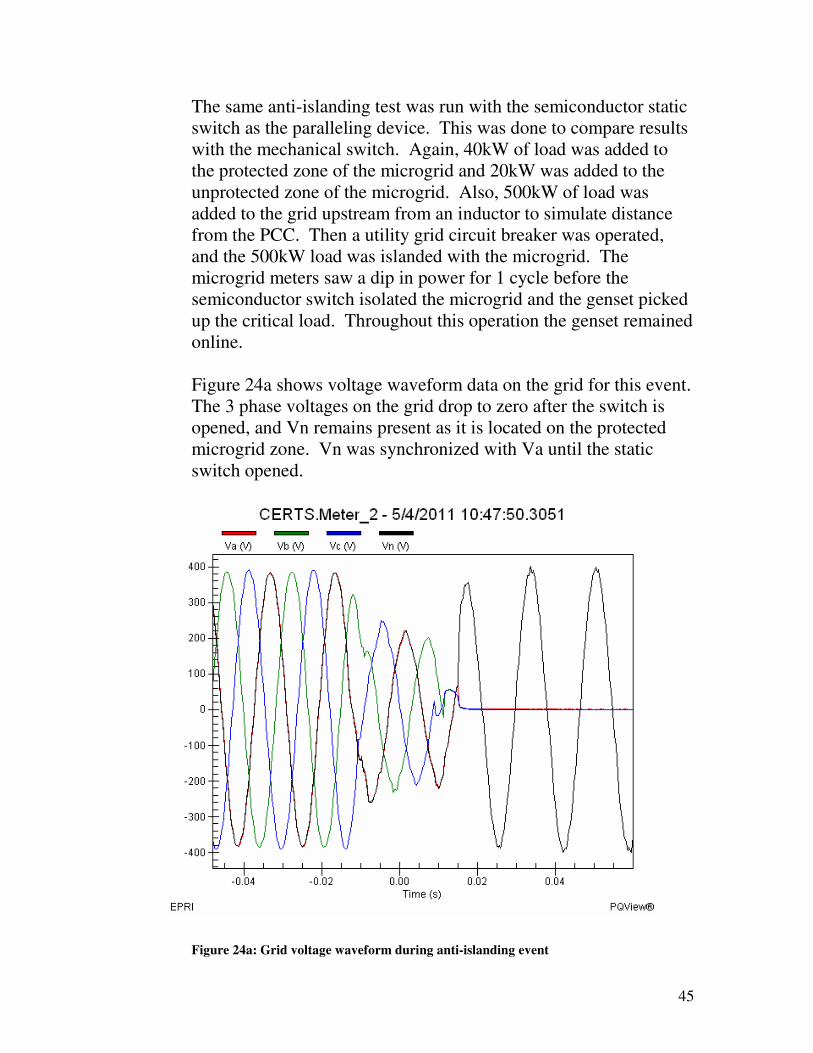
The same anti-islanding test was run with the semiconductor static switch as the paralleling device. This was done to compare results with the mechanical switch. Again, 40kW of load was added to the protected zone of the microgrid and 20kW was added to the unprotected zone of the microgrid. Also, 500kW of load was added to the grid upstream from an inductor to simulate distance from the PCC. Then a utility grid circuit breaker was operated, and the 500kW load was islanded with the microgrid. The microgrid meters saw a dip in power for 1 cycle before the semiconductor switch isolated the microgrid and the genset picked up the critical load. Throughout this operation the genset remained online. Figure 24a shows voltage waveform data on the grid for this event. The 3 phase voltages on the grid drop to zero after the switch is opened, and Vn remains present as it is located on the protected microgrid zone. Vn was synchronized with Va until the static switch opened.
Figure 24a: Grid voltage waveform during anti-islanding event
46
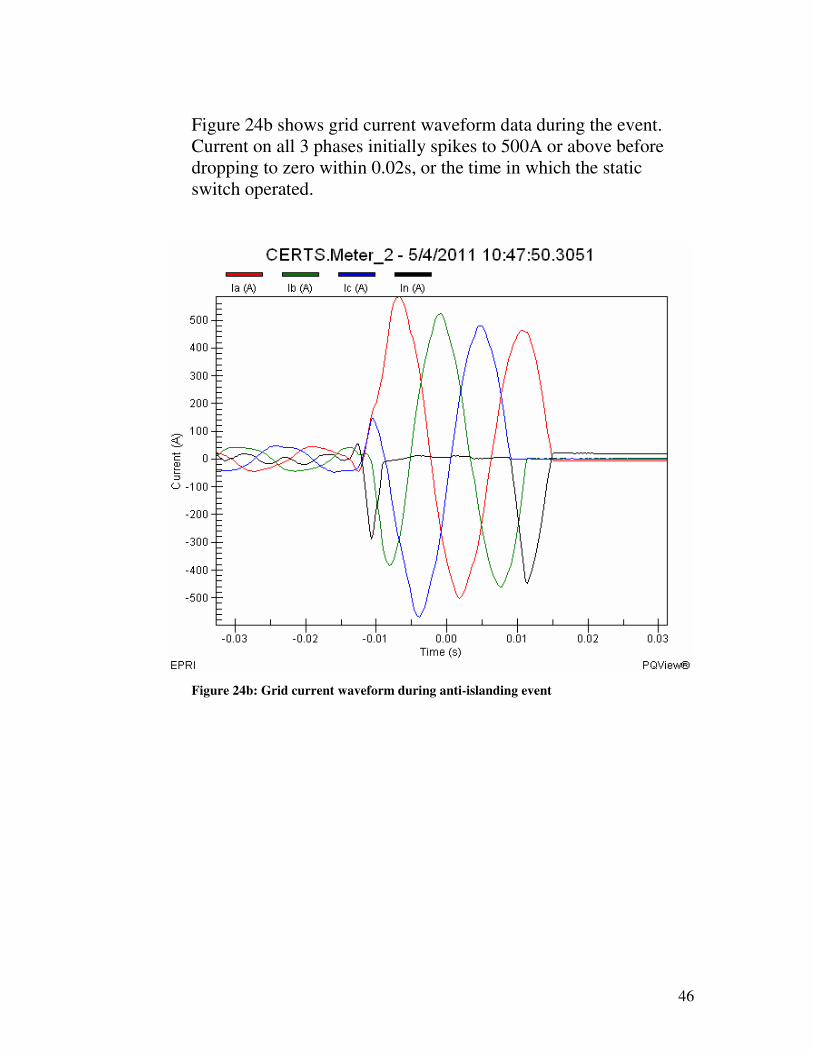
Figure 24b shows grid current waveform data during the event. Current on all 3 phases initially spikes to 500A or above before dropping to zero within 0.02s, or the time in which the static switch operated.
Figure 24b: Grid current waveform during anti-islanding event
47
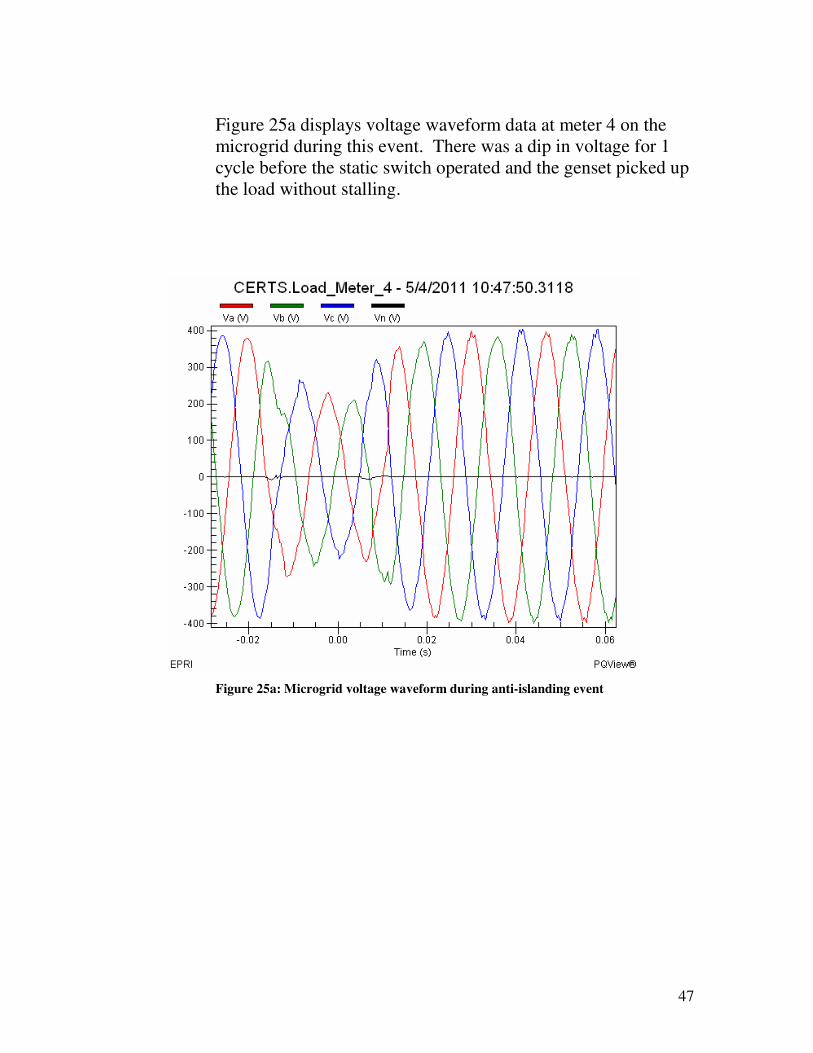
Figure 25a displays voltage waveform data at meter 4 on the microgrid during this event. There was a dip in voltage for 1 cycle before the static switch operated and the genset picked up the load without stalling.
Figure 25a: Microgrid voltage waveform during anti-islanding event
48
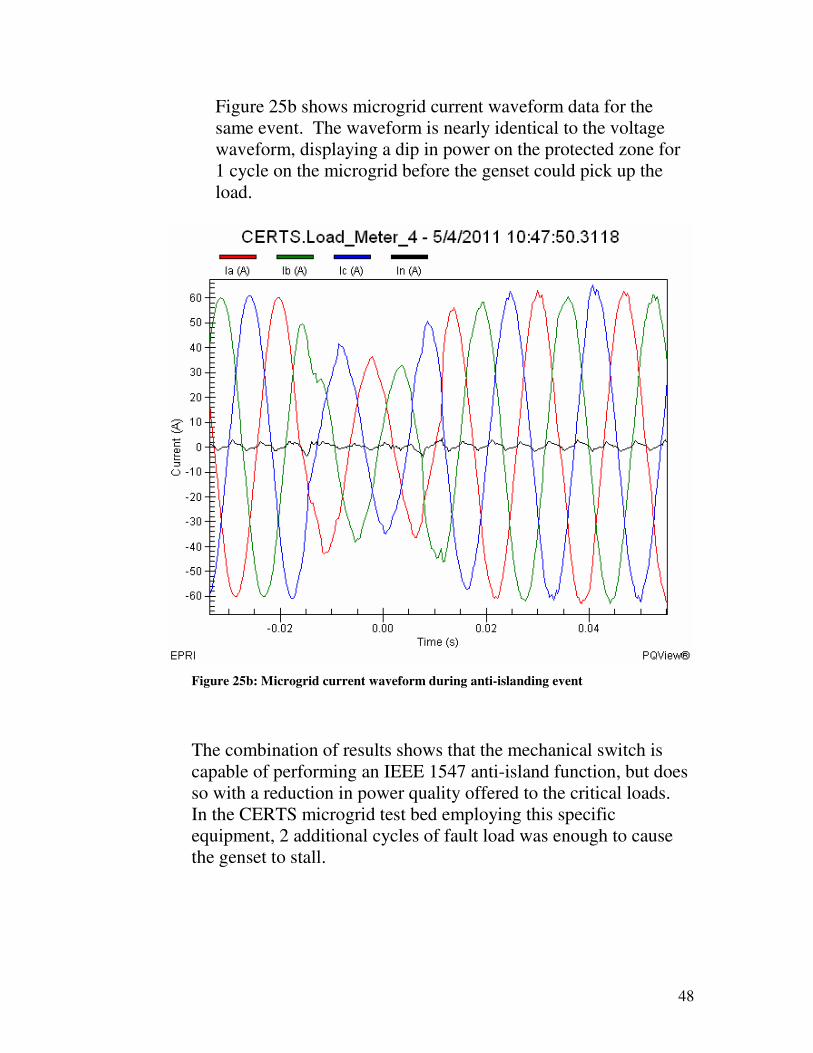
Figure 25b shows microgrid current waveform data for the same event. The waveform is nearly identical to the voltage waveform, displaying a dip in power on the protected zone for 1 cycle on the microgrid before the genset could pick up the load.
Figure 25b: Microgrid current waveform during anti-islanding event
The combination of results shows that the mechanical switch is capable of performing an IEEE 1547 anti-island function, but does so with a reduction in power quality offered to the critical loads. In the CERTS microgrid test bed employing this specific equipment, 2 additional cycles of fault load was enough to cause the genset to stall.
49
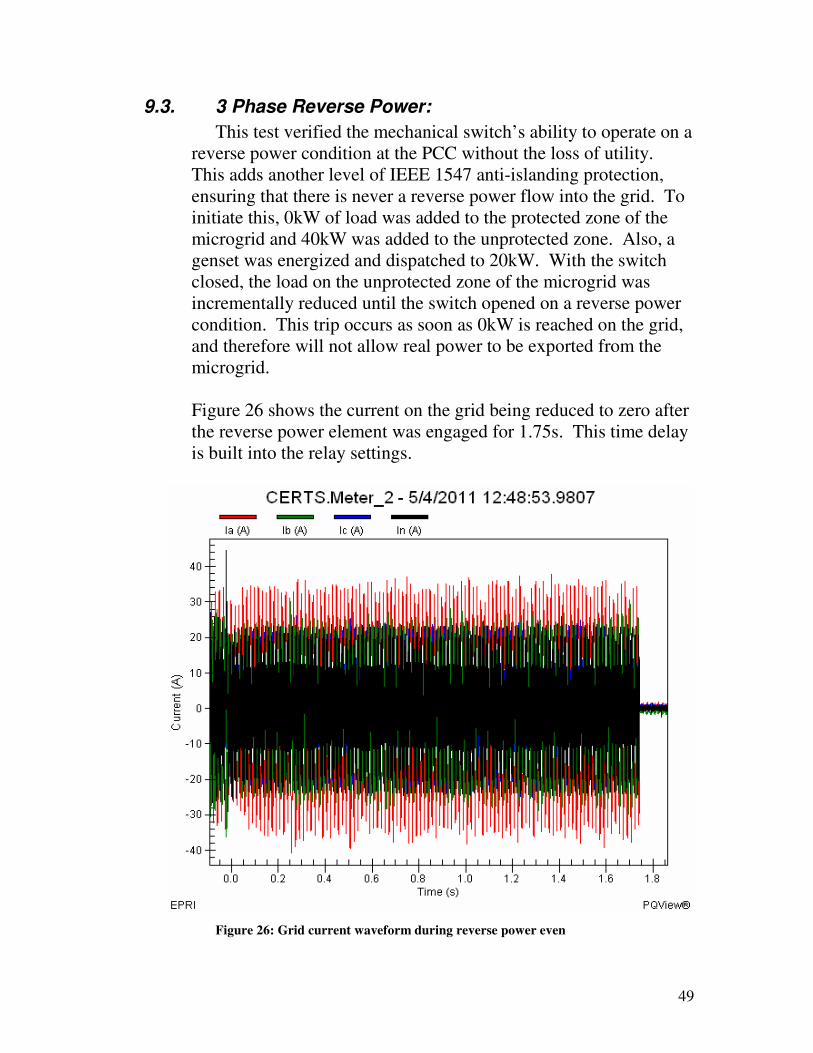
9.3. 3 Phase Reverse Power:
This test verified the mechanical switch’s ability to operate on a reverse power condition at the PCC without the loss of utility. This adds another level of IEEE 1547 anti-islanding protection, ensuring that there is never a reverse power flow into the grid. To initiate this, 0kW of load was added to the protected zone of the microgrid and 40kW was added to the unprotected zone. Also, a genset was energized and dispatched to 20kW. With the switch closed, the load on the unprotected zone of the microgrid was incrementally reduced until the switch opened on a reverse power condition. This trip occurs as soon as 0kW is reached on the grid, and therefore will not allow real power to be exported from the microgrid.
Figure 26 shows the current on the grid being reduced to zero after the reverse power element was engaged for 1.75s. This time delay is built into the relay settings.
Figure 26: Grid current waveform during reverse power even
50
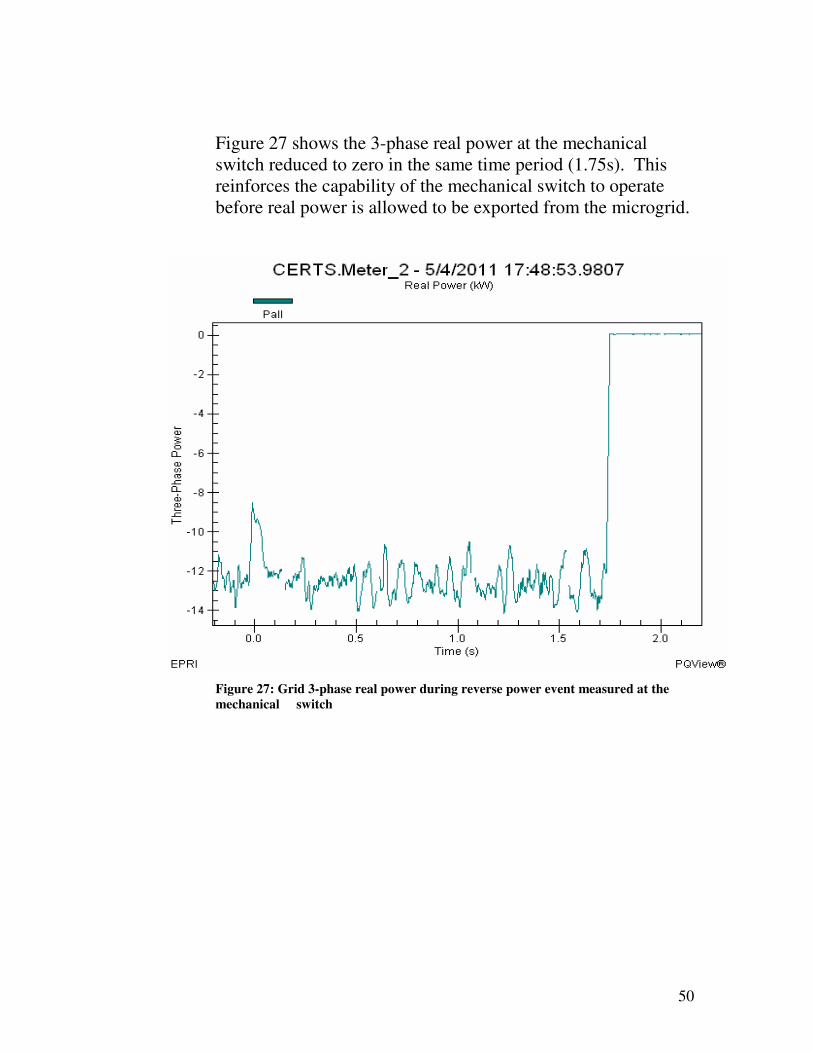
Figure 27 shows the 3-phase real power at the mechanical switch reduced to zero in the same time period (1.75s). This reinforces the capability of the mechanical switch to operate before real power is allowed to be exported from the microgrid.
Figure 27: Grid 3-phase real power during reverse power event measured at the
mechanical switch
51
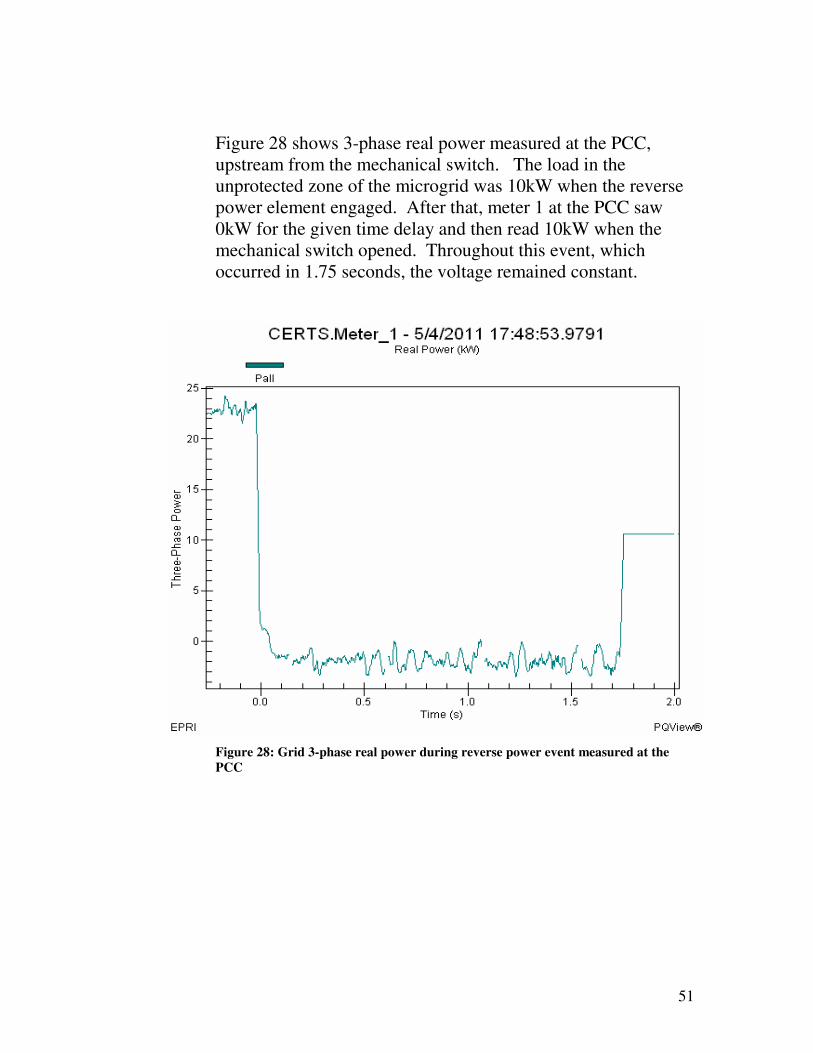
Figure 28 shows 3-phase real power measured at the PCC, upstream from the mechanical switch. The load in the unprotected zone of the microgrid was 10kW when the reverse power element engaged. After that, meter 1 at the PCC saw 0kW for the given time delay and then read 10kW when the mechanical switch opened. Throughout this event, which occurred in 1.75 seconds, the voltage remained constant.
Figure 28: Grid 3-phase real power during reverse power event measured at the
PCC
52
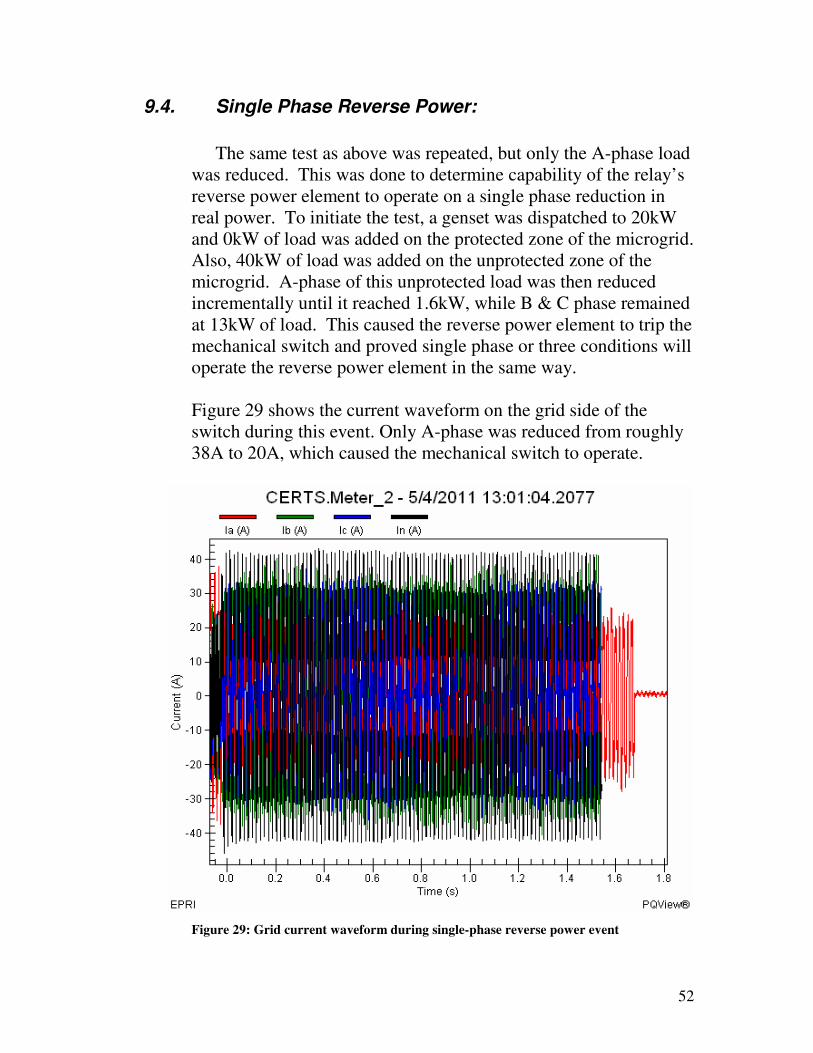
9.4. Single Phase Reverse Power:
The same test as above was repeated, but only the A-phase load was reduced. This was done to determine capability of the relay’s reverse power element to operate on a single phase reduction in real power. To initiate the test, a genset was dispatched to 20kW and 0kW of load was added on the protected zone of the microgrid. Also, 40kW of load was added on the unprotected zone of the microgrid. A-phase of this unprotected load was then reduced incrementally until it reached 1.6kW, while B & C phase remained at 13kW of load. This caused the reverse power element to trip the mechanical switch and proved single phase or three conditions will operate the reverse power element in the same way.
Figure 29 shows the current waveform on the grid side of the switch during this event. Only A-phase was reduced from roughly 38A to 20A, which caused the mechanical switch to operate.
Figure 29: Grid current waveform during single-phase reverse power event
53
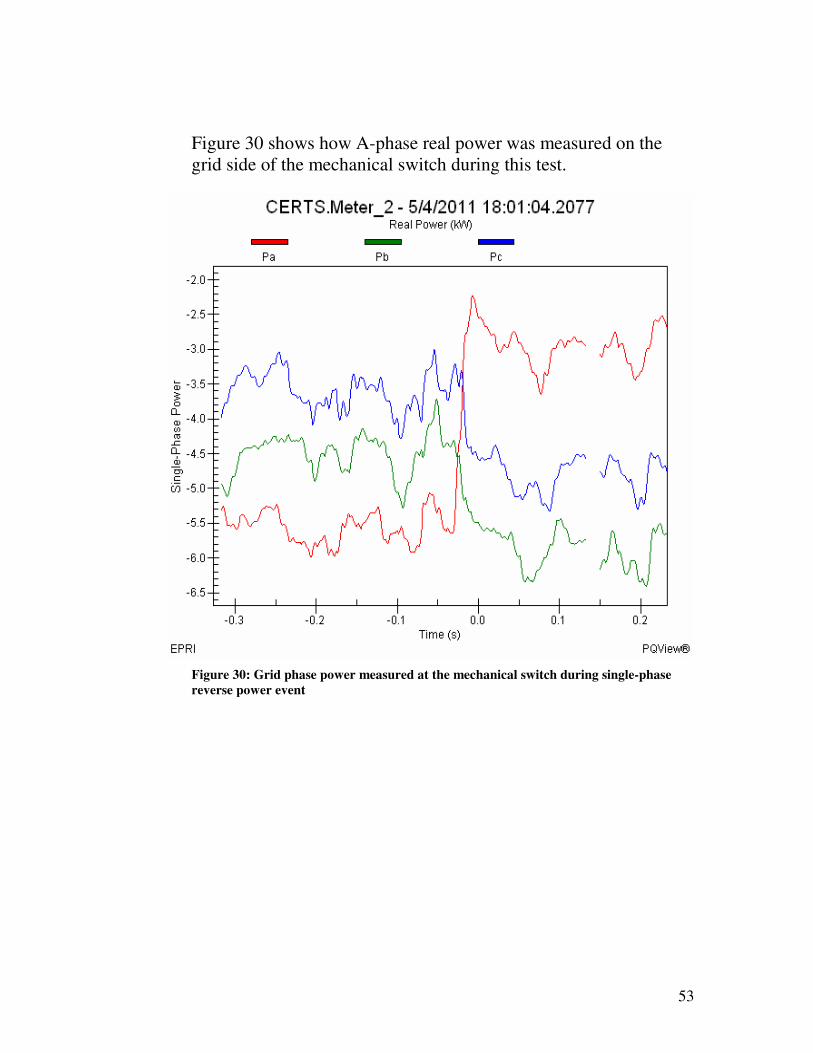
Figure 30 shows how A-phase real power was measured on the grid side of the mechanical switch during this test.
Figure 30: Grid phase power measured at the mechanical switch during single-phase
reverse power event
54
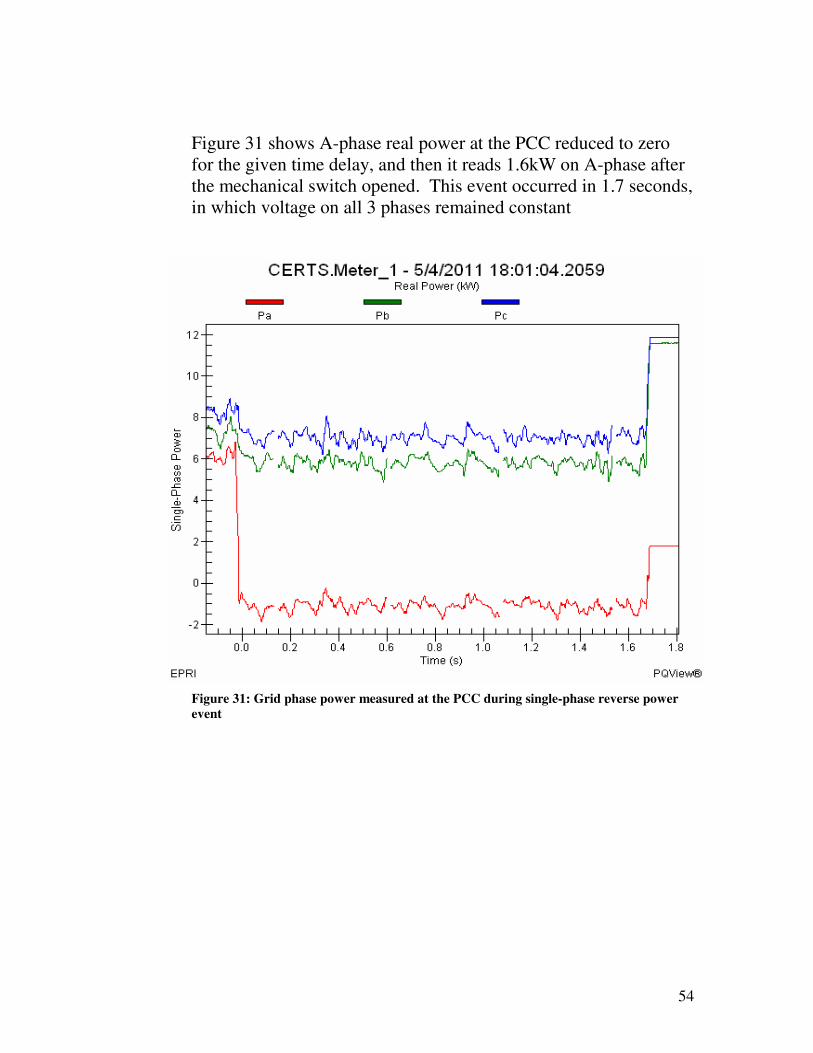
Figure 31 shows A-phase real power at the PCC reduced to zero for the given time delay, and then it reads 1.6kW on A-phase after the mechanical switch opened. This event occurred in 1.7 seconds, in which voltage on all 3 phases remained constant
Figure 31: Grid phase power measured at the PCC during single-phase reverse power
event
55
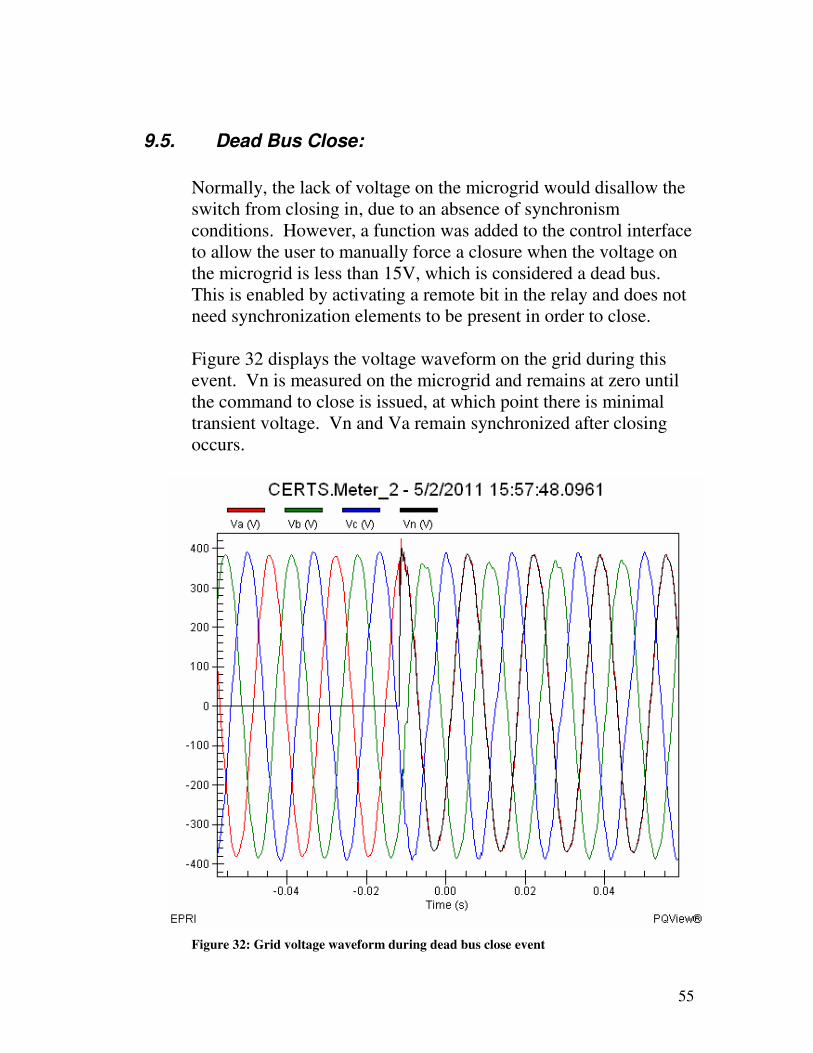
9.5. Dead Bus Close:
Normally, the lack of voltage on the microgrid would disallow the switch from closing in, due to an absence of synchronism conditions. However, a function was added to the control interface to allow the user to manually force a closure when the voltage on the microgrid is less than 15V, which is considered a dead bus. This is enabled by activating a remote bit in the relay and does not need synchronization elements to be present in order to close.
Figure 32 displays the voltage waveform on the grid during this event. Vn is measured on the microgrid and remains at zero until the command to close is issued, at which point there is minimal transient voltage. Vn and Va remain synchronized after closing occurs.
Figure 32: Grid voltage waveform during dead bus close event
56
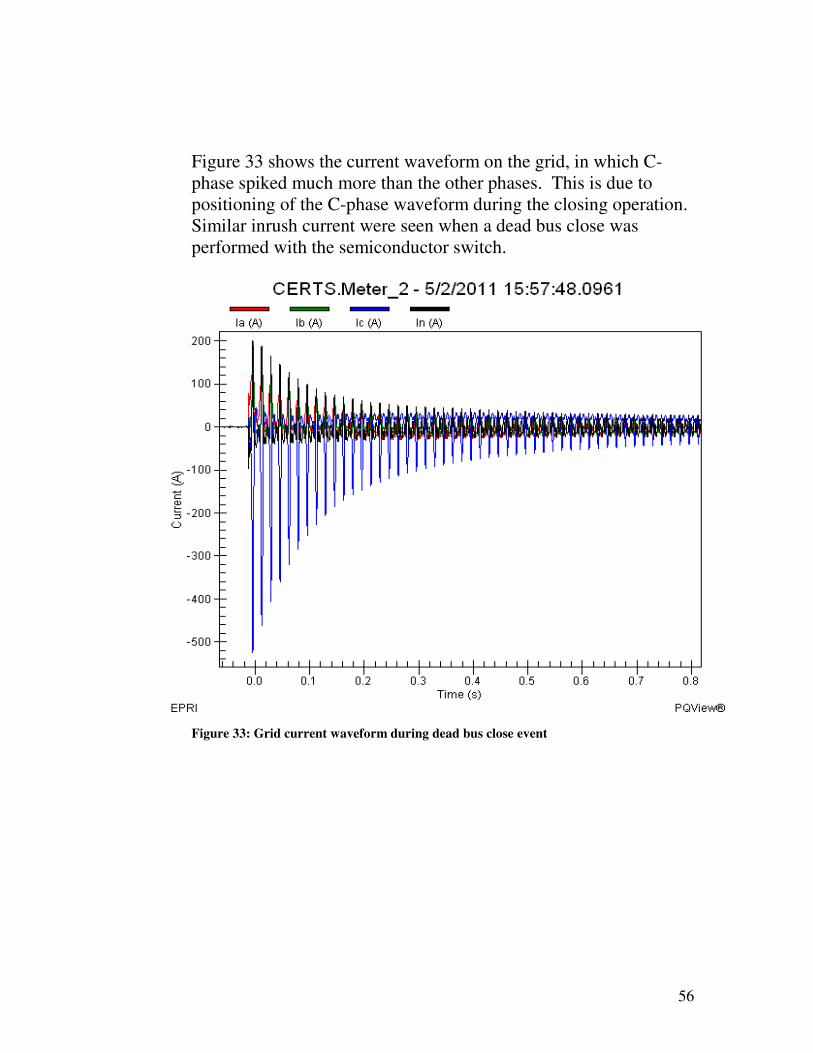
Figure 33 shows the current waveform on the grid, in which C-phase spiked much more than the other phases. This is due to positioning of the C-phase waveform during the closing operation. Similar inrush current were seen when a dead bus close was performed with the semiconductor switch.
Figure 33: Grid current waveform during dead bus close event
57
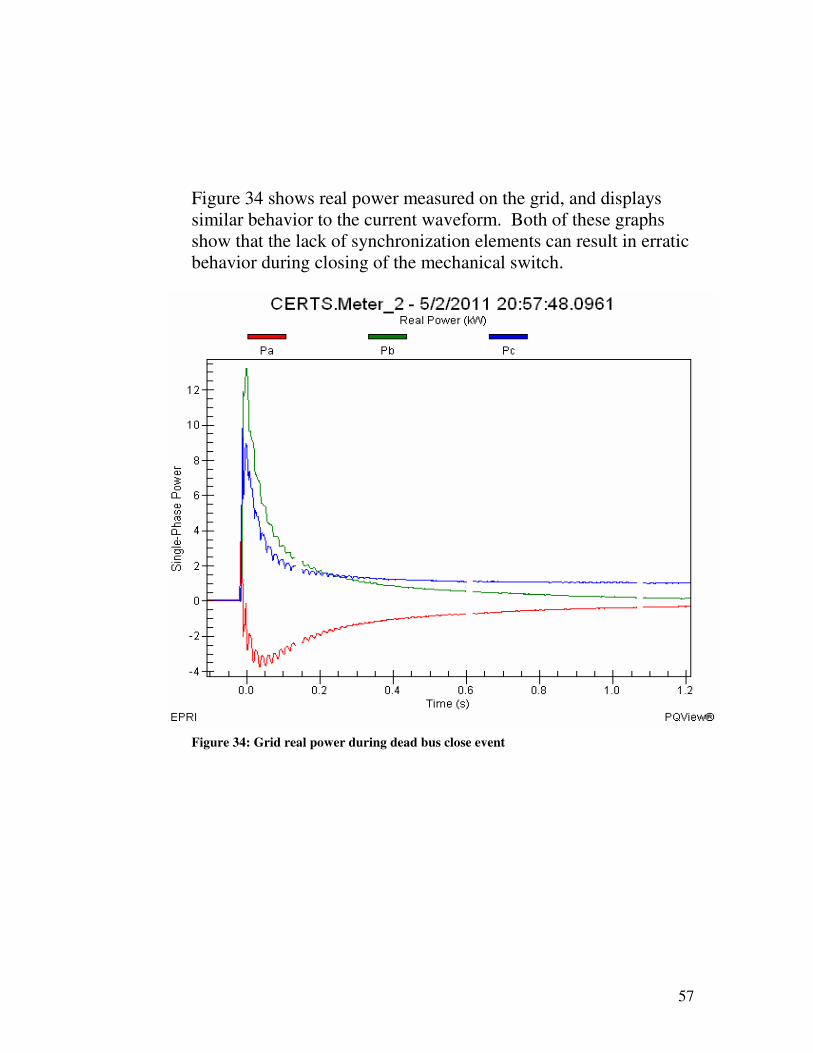
Figure 34 shows real power measured on the grid, and displays similar behavior to the current waveform. Both of these graphs show that the lack of synchronization elements can result in erratic behavior during closing of the mechanical switch.
Figure 34: Grid real power during dead bus close event

58
10. Conclusion
The purpose of implementing this equipment was to make a direct comparison between the semiconductor static switch and the mechanical switch. Consequently, the mechanical switch was selected and designed according to the existing specifications of the semiconductor switch within the realm of the IEEE 1547 standard. Therefore, in utilizing the same test bed environment we were able to create the best possible situation for a functional comparison. Prior to performing field testing, the relay commissioning procedure performed in the laboratory proved the relay’s ability operate within the confines of IEEE 1547. The relay elements were programmed according to the values defined by the standard, and also accounted for operating time of the mechanical switch. This method allowed us to install the relay in the test bed and be confident in its IEEE 1547 compliance. Upon completion of both laboratory and field testing, a clear assessment could be made about the mechanical switch’s ability to perform as a paralleling device in a CERTS microgrid. The following table details the tests objectives and results:
59
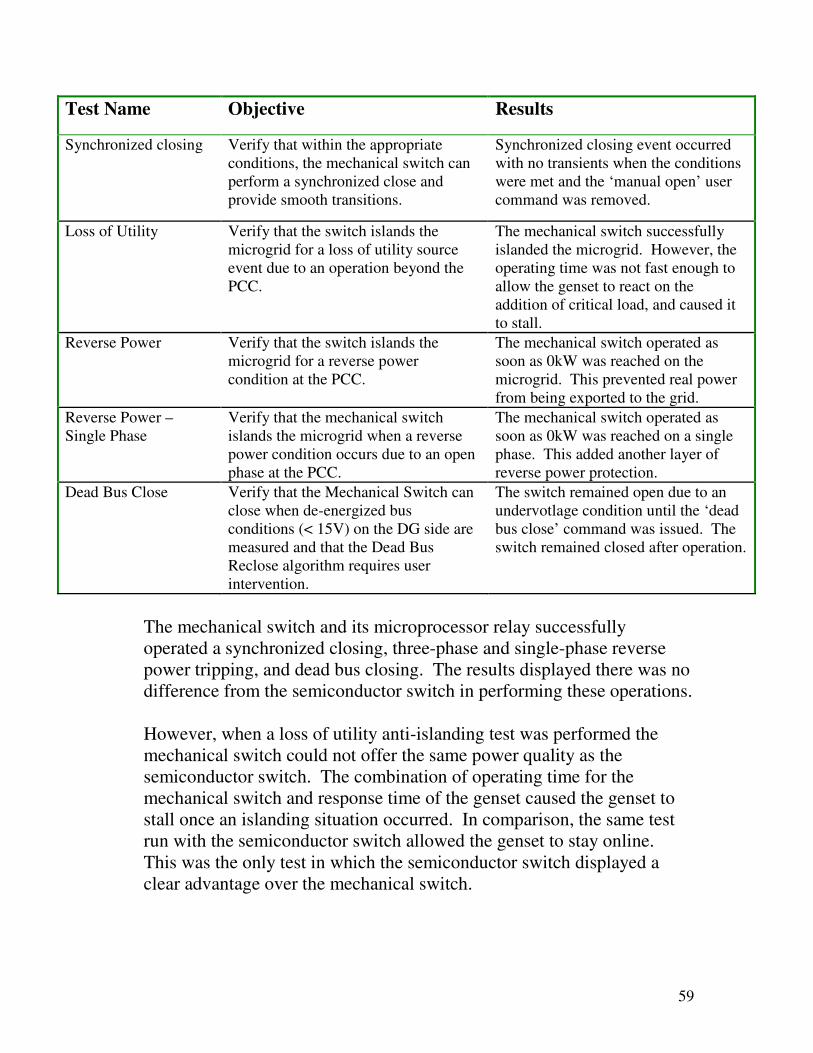
Test Name Objective Results
Synchronized closing Verify that within the appropriate conditions, the mechanical switch can perform a synchronized close and provide smooth transitions.
Synchronized closing event occurred with no transients when the conditions were met and the ‘manual open’ user command was removed.
Loss of Utility Verify that the switch islands the microgrid for a loss of utility source event due to an operation beyond the PCC.
The mechanical switch successfully islanded the microgrid. However, the operating time was not fast enough to allow the genset to react on the addition of critical load, and caused it to stall.
Reverse Power Verify that the switch islands the microgrid for a reverse power condition at the PCC.
The mechanical switch operated as soon as 0kW was reached on the microgrid. This prevented real power from being exported to the grid.
Reverse Power – Single Phase
Verify that the mechanical switch islands the microgrid when a reverse power condition occurs due to an open phase at the PCC.
The mechanical switch operated as soon as 0kW was reached on a single phase. This added another layer of reverse power protection.
Dead Bus Close Verify that the Mechanical Switch can close when de-energized bus conditions (< 15V) on the DG side are measured and that the Dead Bus Reclose algorithm requires user intervention.
The switch remained open due to an undervotlage condition until the ‘dead bus close’ command was issued. The switch remained closed after operation.
The mechanical switch and its microprocessor relay successfully operated a synchronized closing, three-phase and single-phase reverse power tripping, and dead bus closing. The results displayed there was no difference from the semiconductor switch in performing these operations. However, when a loss of utility anti-islanding test was performed the mechanical switch could not offer the same power quality as the semiconductor switch. The combination of operating time for the mechanical switch and response time of the genset caused the genset to stall once an islanding situation occurred. In comparison, the same test run with the semiconductor switch allowed the genset to stay online. This was the only test in which the semiconductor switch displayed a clear advantage over the mechanical switch.
60
Considering the major cost advantage and availability of the mechanical switch and microprocessor relay, apart from a disadvantage in power quality, the test results provide reinforcement of the mechanical switch’s viability as a an alternative to a semiconductor switch in a CERTS microgrid environment.
11. Associated Documents
• CERTS SEL 700GT Omicron Test.pdf (Extracted from Omicron
Test Universe software)
• SEL 700GT Omicron Test.occ (Omicron test universe file)
• CERTS SEL 700GT Settings.PDF (Relay settings extracted from
SEL software)
• SEL 700GT.rdb (SEL file)
• CERTS SEL 700GT Wiring Diagram.pdf (Wiring diagram)