cerebral metabolic effects of organophosphorus anticholinesterase compounds
TRANSCRIPT
Metabolic Brain Disease, Vol. 1, No. 2, 1986
Cerebral Metabolic Effects of Organophosphorus Anticholinesterase Compounds
Alexander L. Miller 1-3 and Miguel A. Medina 2
Received August 14, 1985; accepted October 21, 1985
Rats treated intravenously with an organophosphorus anticholinesterase compound, paraoxon or soman, were sacrificed 2 to 131 min later, using 0.7 sec of focused microwave irradiation (25 kW at 915 MHz). Brain regional rates of glucose utilization during 3-min intervals were determined with labeled glucose and fluorodeoxyglucase as tracers. Levels of glucose, lactate, ATP, and creatine phosphate were assayed in the same samples. The two compounds differed markedly in their effects on brain metabolism. Paraoxon (0.8 LDs0 ) depressed rates of glucose use in all brain regions, without causing consistent changes in brain metabolite levels. This depressant effect was most pronounced during the first 30 min after toxin exposure and had largely disappeared by 2 hr. Soman (0.8q).95 LDs0) was variable in its effects. Animals that showed seizure-like behavior had marked increases in glucose use in diencephalon and cerebrum but no changes in cerebellum or brain stem. Rapid rates of glucose use were associated with high levels of lactic acid and lower levels of creatine phosphate. In cerebrum, but not diencephalon, levels of ATP fell by as much as 50% in strongly affected animals by 30-130 min after soman. All of these effects were reversible with atropine. Soman-treated animals that did not have seizure-like activity did not exhibit these brain metabolic changes. These results and those of others show that cholinergic compounds vary greatly in their effects on brain glucose and energy metabolism. Although noncholinergic mechanisms are a possibility, the most parsimonious explanation for these findings is that cholinesterase inhibitors vary in their affinity for different central nervous system (CNS) acetylcholine receptor populations.
KEY WORDS: soman; paraoxon; brain regions; glucose metabolism; energy metabolism; cholinesterase inhibitors.
Department of Psychiatry, University of Texas Health Science Center at San Antonio, San Antonio, Texas 78284.
2Department of Pharmacology, University of Texas Health Science Center at San Antonio, San Antonio, Texas 78284.
3To whom correspondence should be addressed at Department of Psychiatry, University of Texas Health Science Center, 7703 Floyd Curl Drive, San Antonio, Texas 78284.
147 0885-7490/86/0600-0147505.00/0 �9 1986 Plenum Publishing Corporation
148 Miller and Medina
I N T R O D U C T I O N
Organophosphorus anticholinesterase compounds irreversibly inhibit cholinesterase, causing excessive cholinergic activity. They are a component of many insecticides and of "nerve gases." Mild toxicity is associated with behavioral and cognitive changes, whereas the most prominent aspect of severe toxicity is impairment of respiration. Groups particularly at risk for toxic exposure include (1) persons involved in the manufacture or application of insecticides (e.g., crop-duster pilots) and (2) military personnel, Typical of the insecticide group is parathion [diethyl O-(4-nitrophenyl)- phosphorothioate]. Its active metabolite is paraoxon (diethyl 4-nitrophenyl phosphate). An extremely toxic "nerve gas" is soman (pinacolyl methylphosphono- fluoridate).
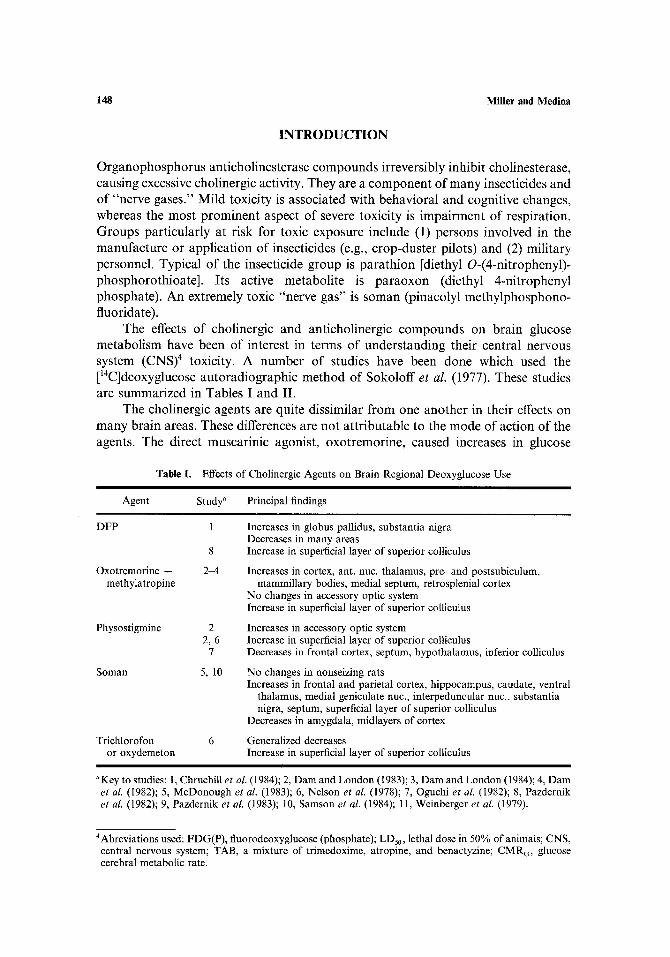
The effects of cholinergic and anticholinergic compounds on brain glucose metabolism have been of interest in terms of understanding their central nervous system ( C N S ) 4 toxicity. A number of studies have been done which used the [~4C]deoxyglucose autoradiographic method of Sokoloff et al. (1977). These studies are summarized in Tables I and II.
The cholinergic agents are quite dissimilar from one another in their effects on many brain areas. These differences are not attributable to the mode of action of the agents. The direct muscarinic agonist, oxotremorine, caused increases in glucose
Table I. Effects of Cholinergic Agents on Brain Regional Deoxyglucose Use
Agent S tud / Principal findings
DFP
Oxotremorine + methylatropine
Physostigmine
1
8
2M
2 2,6
7
Soman 5, 10
Trichlorofon 6 or oxydemeton
Increases in globus pallidus, substantia nigra Decreases in many areas Increase in superficial layer of superior colliculus
Increases in cortex, ant. nuc. thalamus, pre- and postsubiculum, mammillary bodies, medial septum, retrosplenial cortex
No changes in accessory optic system Increase in superficial layer of superior colliculus
Increases in accessory optic system Increase in superficial layer of superior colliculus Decreases in frontal cortex, septum, hypothalamus, inferior colliculus
No changes in nonseizing rats Increases in frontal and parietal cortex, hippocampus, caudate, ventral
thalamus, medial geniculate nut., interpeduncular nuc., substantia nigra, septum, superficial layer of superior colliculus
Decreases in amygdala, midlayers of cortex
Generalized decreases Increase in superficial layer of superior colliculus
aKey to studies: 1, Chruchill e t al. (1984); 2, Dam and London (1983); 3, Dam and London (1984); 4, Dam et al. (1982); 5, McDonough et al. (1983); 6, Nelson e t al. (1978); 7, Oguchi e t al. (1982); 8, Pazdernik et al. (1982); 9, Pazdernik et al. (1983); 10, Samson et al. (1984); 11, Weinberger e t al. (1979).
4Abreviations used: FDG(P), fluorodeoxyglucose (phosphate); LDs0, lethal dose in 50% of animals; CNS, central nervous system; TAB, a mixture of trimedoxime, atropine, and benactyzine; CMR~, glucose cerebral metabolic rate.
Brain Metabolism and Cholinergic Compounds 149
Agent
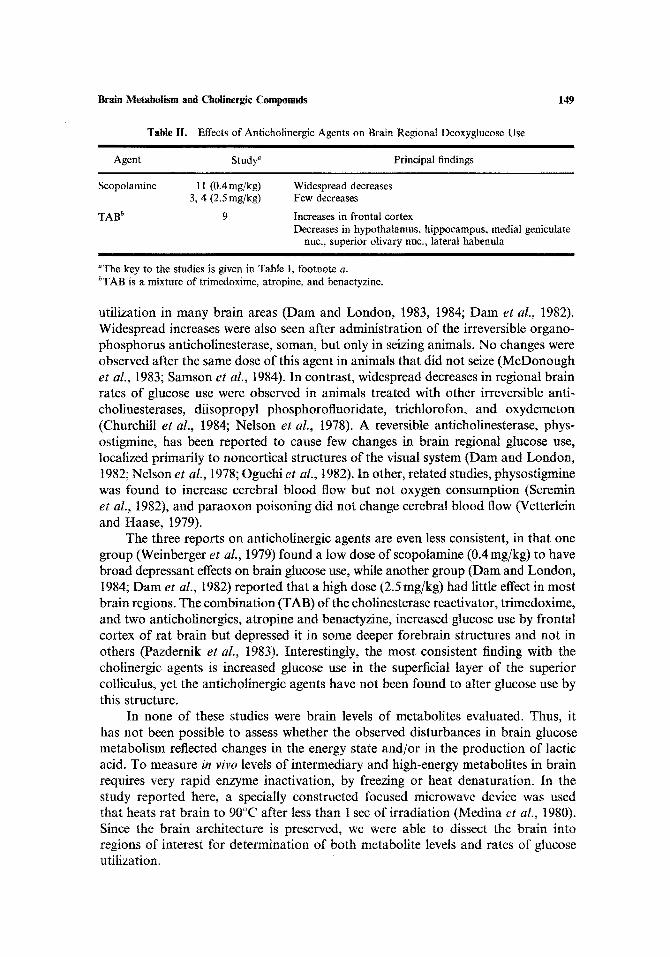
Table II. Effects of Anticholinergic Agents on Brain Regional Deoxyglucose Use i l l
Study ~ Principal findings
Scopolamine ] 1 (0.4 mg/kg) Widespread decreases 3, 4 (2.5 mg/kg) Few decreases
TAB b 9 Increases in frontal cortex Decreases in hypothalamus, hippocampus, medial geniculate
nuc., superior olivary nuc., lateral habenula I I i i
"The key to the studies is given in Table I, footnote a. bTAB is a mixture of trimedoxime, atropine, and benactyzine.
utilization in many brain areas (Dam and London, 1983, 1984; Dam et al., 1982). Widespread increases were also seen after administration of the irreversible organo- phosphorus anticholinesterase, soman, but only in seizing animals. No changes were observed after the same dose of this agent in animals that did not seize (McDonough et al., 1983; Samson et al., 1984). In contrast, widespread decreases in regional brain rates of glucose use were observed in animals treated with other irreversible anti- cholinesterases, diisopropyl phosphorofluoridate, trichlorofon, and oxydemeton (Churchill et al., 1984; Nelson et al., 1978). A reversible anticholinesterase, phys- ostigrnine, has been reported to cause few changes in brain regional glucose use, localized primarily to noncortical structures of the visual system (Dam and London, 1982; Nelson et aL, 1978; Oguchi et al., 1982). In other, related studies, physostigmine was found to increase cerebral blood flow but not oxygen consumption (Scremin et al., 1982), and paraoxon poisoning did not change cerebral blood flow (Vetterlein and Haase, 1979).
The three reports on anticholinergic agents are even less consistent, in that one group (Weinberger et al., 1979) found a low dose of scopolamine (0.4 mg/kg) to have broad depressant effects on brain glucose use, while another group (Dam and London, 1984; Dam et al., 1982) reported that a high dose (2.5 mg/kg) had little effect in most brain regions. The combination (TAB) of the cholinesterase reactivator, trimedoxime, and two anticholinergics, atropine and benactyzine, increased glucose use by frontal cortex of rat brain but depressed it in some deeper forebrain structures and not in others (Pazdernik et al., 1983). Interestingly', the most consistent finding with the cholinergic agents is increased glucose use in the superficial layer of the superior colliculus, yet the anticholinergic agents have not been found to alter glucose use by this structure.
In none of these studies were brain levels of metabolites evaluated. Thus, it has not been possible to assess whether the observed disturbances in brain glucose metabolism reflected changes in the energy state and/or in the production of lactic acid. To measure in vivo levels of intermediary and high-energy metabolites in brain requires very rapid enzyme inactivation, by freezing or heat denaturation. In the study reported here, a specially constructed focused microwave device was used that heats rat brain to 90~ after less than 1 sec of irradiation (Medina et aL, 1980). Since the brain architecture is preserved, we were able to dissect the brain into regions of interest for determination of both metabolite levels and rates of glucose utilization.
150 Miller and Medina
M E T H O D S
Sprague-Dawley rats weighing 250-300 g were used in all experiments. They were allowed food and water ad lib. [6-14C]Glucose was obtained from Amersham (Arlington Heights, Ill.). Both [3H]- and [14C]fluorodeoxyglucose were purchased from New England Nuclear (Boston).
Glucose utilization in paraoxon-treated animals was determined by a dual-label method described in earlier studies (Miller and Corddry, 1981; Miller et al., 1982). Rats were injected in a tail vein with paraoxon. At varying time periods after the administration of this compound, the animals were injected by the same route with a mixture of D-[6-14C]glucose (0.167/~Ci/g; sp act 57mCi/mmol) and D-[3H]fluoro- deoxyglucose (0.5 #Ci/g; sp act 78 Ci/mmol) and sacrificed 2 or 5 rain later by subjecting them to 0.7 sec of microwave irradiation. The microwave instrument used was a 25-kW oven operating at 915MHz and its characteristics have been described previously (Medina et al., 1980). The brains were removed and dissected into regions. Each area was homogenized in the following volume and concentration of HC104 containing 5 mM EDTA: cerebrum, 9 vol of 1 N HC104; pons-medulla and midbrain, 0.75 ml of 2 N HC104; and cerebellum and diencephalon, 0.75 ml of 4 N HC104. The homogenates were spun at 15,000 g for 10 min and the supernatants neutralized with 1 N KOH and allowed to remain at 0~ for 30 min. The supernatants were respun and separated from the precipitated KC104. The extracts were then chromatographically separated to identify the amounts of radioactive label in free glucose and fluorodeoxy- glucose and in metabolites of these two compounds. The details of these separations have been published (Miller et al., 1982; Miller and Kiney, 1981). Rates of glucose use were calculated from the data with each tracer compound.
Determination of glucose utilization by the above described method in soman treated rats resulted in a high variability. We also observed considerable variability in the response of individual rats to doses of soman. Some rats were severely affected by 0.8 of the LDs0 dose, while in others minimal or no effects were visible. Our initial method for determining glucose utilization depends upon the comparison of data from two separate groups of rats injected with isotope. Thus, if the animals within each group have a differential response to the compound, there will be large variances in the group means. In order to overcome this problem we changed to a different technique which is similar to the radioisotope method described above but which determines brain rates of glucose utilization in individual rats rather than in groups. This also enabled us to correlate the behavioral responses to soman of each rat with its brain regional rate of glucose utilization.
The method for determining the glucose cerebral metabolic rate (CMRa) with a combination of [3H]fluorodeoxyglucose and [L4C]fluorodeoxyglucose (sp act 300 mCi/mmol) was first described by Crane et al. (1978), using [3H]deoxyglucose and [~4C]deoxyglucose as tracers. In brief, ~4C and 3H isotopes of fluorodeoxyglucose (FDG) were intravenously injected in sequence. The interval between the first and second injections was 3 rain and that between the second injection and the sacrifice by microwave irradiation was also 3 rain. The brains were removed and extracted as described above. The extracts were chromatographically separated into FDG and fluorodeoxyglucose phosphate (FDGP) (Miller and Kiney, 1981), as well as assayed
Brain Metabolism and Cholinergic Compounds 151
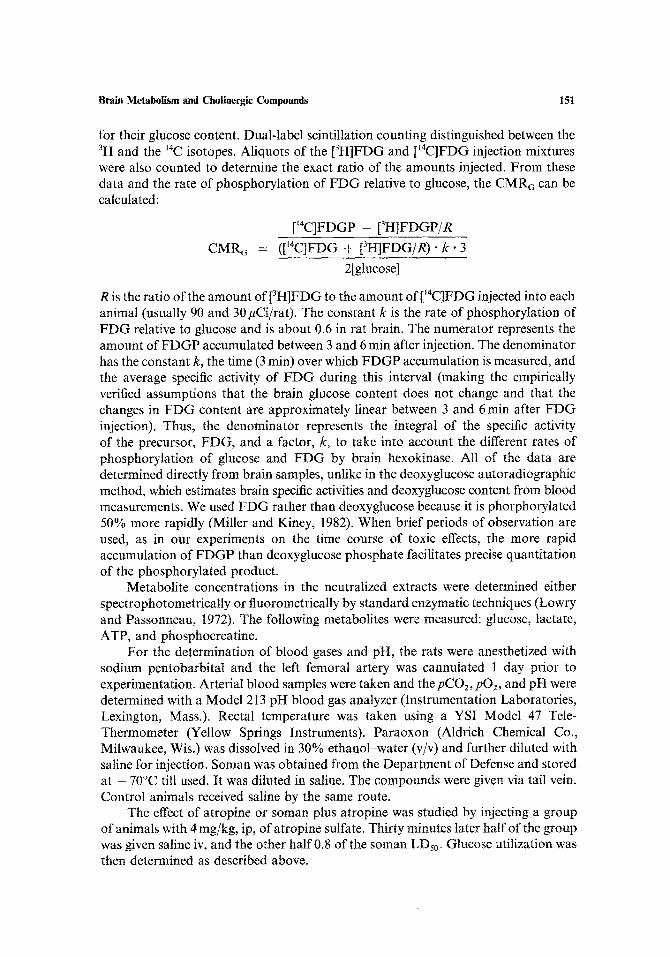
for their glucose content. Dual-label scintillation counting distinguished between the 3H and the 14C isotopes. Aliquots of the [3H]FDG and [laC]FDG injection mixtures were also counted to determine the exact ratio of the amounts injected. From these data and the rate of phosphorylation of FDG relative to glucose, the CMRc can be calculated:
[~4C]FDGP -- [3H]FDGP/R
CMR~ = ([~4C]FDG + [3H]FDG/R)" k" 3
2[glucose]
R is the ratio of the amount of [3H]FDG to the amount of [~4C]FDG injected into each animal (usually 90 and 30 #Ci/rat). The constant k is the rate of phosphorylation of FDG relative to glucose and is about 0.6 in rat brain. The numerator represents the amount of FDGP accumulated between 3 and 6 rain after injection. The denominator has the constant k, the time (3 min) over which FDGP accumulation is measured, and the average specific activity of FDG during this interval (making the empirically verified assumptions that the brain glucose content does not change and that the changes in FDG content are approximately linear between 3 and 6 min after FDG injection). Thus, the denominator represents the integral of the specific activity of the precursor, FDG, and a factor, k, to take into account the different rates of phosphorylation of glucose and FDG by brain hexokinase. All of the data are determined directly from brain samples, unlike in the deoxyglucose autoradiographic method, which estimates brain specific activities and deoxyglucose content from blood measurements. We used FDG rather than deoxyglucose because it is phorphorylated 50% more rapidly (Miller and Kiney, 1982). When brief periods of observation are used, as in our experiments on the time course of toxic effects, the more rapid accumulation of FDGP than deoxyglucose phosphate facilitates precise quantitation of the phosphorylated product.
Metabolite concentrations in the neutralized extracts were determined either spectrophotometrically or fluorometrically by standard enzymatic techniques (Lowry and Passonneau, 1972). The following metabolites were measured: glucose, lactate, ATP, and phosphocreatine.
For the determination of blood gases and pH, the rats were anesthetized with sodium pentobarbital and the left femoral artery was cannulated l day prior to experimentation. Arterial blood samples were taken and the pCO2, pO~, and pH were determined with a Model 213 pH blood gas analyzer (Instrumentation Laboratories, Lexington, Mass.). Rectal temperature was taken using a YSI Model 47 Tele- Thermometer (Yellow Springs Instruments). Paraoxon (Aldrich Chemical Co., Milwaukee, Wis.) was dissolved in 30% ethanol-water (v/v) and further diluted with saline for injection. Soman was obtained from the Department of Defense and stored at - 70~ till used. It was diluted in saline. The compounds were given via tail vein. Control animals received saline by the same route.
The effect of atropine or soman plus atropine was studied by injecting a group of animals with 4 mg/kg, ip, of atropine sulfate. Thirty minutes later half of the group was given saline iv, and the other half 0.8 of the soman LDs0. Glucose utilization was then determined as described above.
152 Miller and Medina
All chemicals used for the metaboli te assays were reagent grade.
Protein content was determined by the method of Lowry et al. (1951), after dissolving the perchloric acid-insoluble precipitates in 1 N N a O H ,
R E S U L T S
The LDs0 values for in t ravenous pa raoxon and soman were found to be 0.209
and 0.0385 mg/kg, respectively, by the method of Weil (1952). The adminis t ra t ion of
these agents at half their LDs0 values produced no consistent changes in bra in regional metabolic rates or metaboli te levels (data no t shown). N or was there gross evidence
of intoxicat ion in these animals. At doses of 0.8-0.95 LDs0, however, metabol ic effects were evident with each agent and, as detailed below, differed with each agent.
The paraoxon- t rea ted rats were quite consistent in their response to the agent. At
the higher dose (0.8 LDs0 ) they showed mild physical evidence of toxicity (trembling, increased salivation) bu t no evidence of respiratory impairment . Arterial b lood gases were normal in six animals.
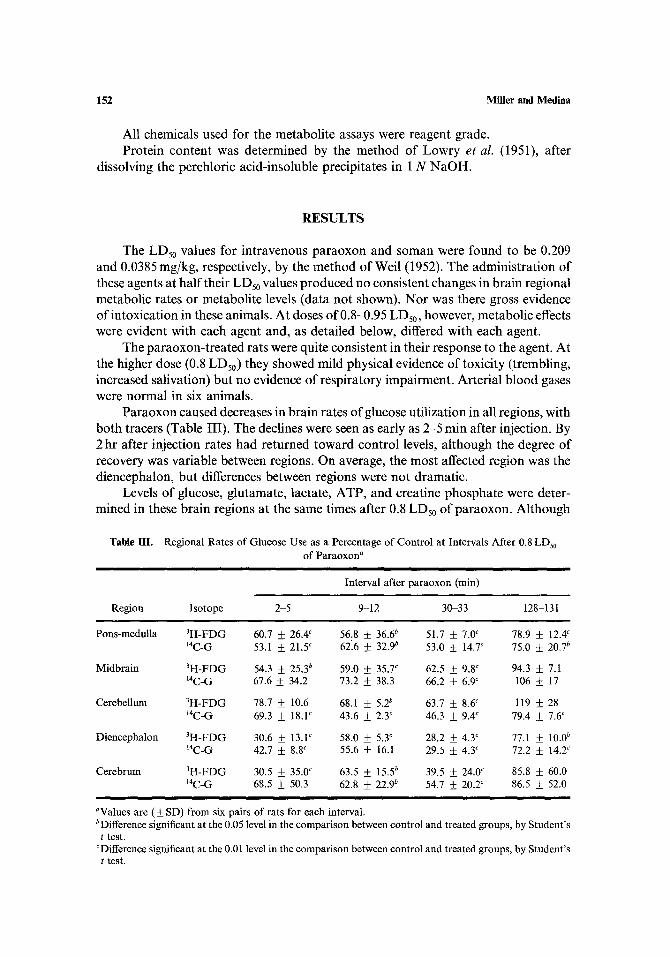
Paraoxon caused decreases in bra in rates of glucose ut i l izat ion in all regions, with
bo th tracers (Table III). The declines were seen as early as 2-5 min after injection. By 2 hr after injection rates had re turned toward control levels, a l though the degree of
recovery was variable between regions. On average, the most affected region was the
diencephalon, bu t differences between regions were no t dramatic. Levels of glucose, glutamate, lactate, ATP, and creatine phosphate were deter-
mined in these b ra in regions at the same times after 0.8 LDs0 of paraoxon. Al though
Table IlL Regional Rates of Glucose Use as a Percentage of Control at Intervals After 0.8 LDs0 of Paraoxon a
Interval after paraoxon (rain)
Region Isotope 2-5 9-12 30-33 128-131
Pons-medulla 3H-FDG 60.7 _ 26.4 c 56.8 • 36.6 b 51.7 • 7.0 c 78.9 +_ 12.4 c 14C-G 53.1 • 21,5 c 62.6 • 32.90 53,0 • 14.7 c 75.0 _ 20.7 b
Midbrain 3H-FDG 54.3 • 25,3 b 59.0 ___ 35.7 c 62.5 _+ 9.8 c 94.3 • 7.1 14C-G 67.6 • 34.2 73.2 • 38.3 66.2 _ 6.9 C 106 ___ 17
Cerebellum 3H-FDG 78.7 • 10.6 68.1 • 5.2 b 63.7 • 8.6 c 119 • 28 14C-G 69.3 -t- 18.1 c 43.6 • 2,3 c 46.3 _ 9.4 c 79.4 • 7.6 c
Diencephalon 3H-FDG 30.6 + 13.V 58.0 • 5.3 ~ 28.2 • 4.3 c 77.1 • 10.0 b IaC-G 42.7 + 8.8 c 55.6 • 16.1 29.5 _+ 4.3 c 72.2 • 14.2 ~
Cerebrum 3H-FDG 30.5 • 35.0 ~ 63.5 • 15.5 b 39.5 • 24.0 c 85.8 • 60.0 14C-G 68.5 • 50.3 62.8 • 22.9 b 54.7 • 20.2 c 86.5 • 52.0
aValues are (• SD) from six pairs of rats for each interval. bDifference significant at the 0.05 level in the comparison between control and treated groups, by Student's t test.
CDifference significant at the 0.01 level in the comparison between control and treated groups, by Student's t test.
Brain Metabolism and Cholinergic Compounds 153
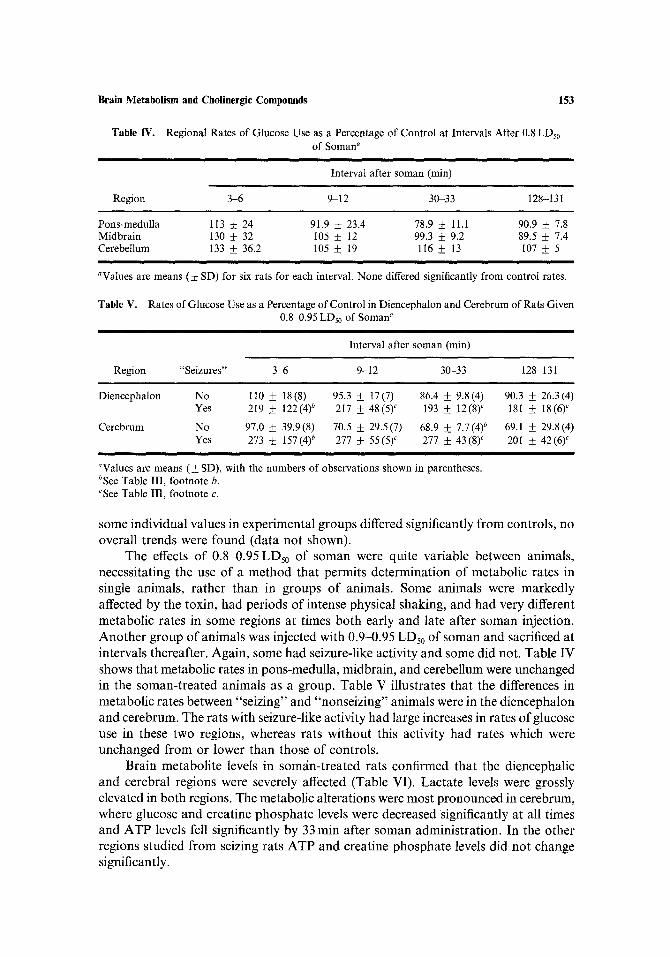
Table IV. Regional Rates of Glucose Use as a Percentage of Control at Intervals After 0.8 LDs0 of Soman"
Interval after soman (min)
Region 3-6 9-12 30-33 128-131
Pons-medulla 113 + 24 91.9 • 23.4 78.9 _ 11.1 90.9 • 7.8 Midbrain 130 ___ 32 105 • 12 99.3 • 9.2 89.5 _ 7.4 Cerebellum 133 • 36.2 105 • 19 116 __+ 13 107 + 5
aValues are means (• SD) for six rats for each interval. None differed significantly from control rates.
Table V. Rates of Glucose Use as a Percentage of Control in Diencephalon and Cerebrum of Rats Given 0.84).95 LDs0 of Soman a
Interval after soman (rain)
Region "Seizures" 345 9-12 30-33 128 131
Diencephalon No 110 _+ 18(8) 95.3 __+ 17(7) 86.4 • 9.8(4) 90.3 + 26.3(4) Yes 219 _+ 122(4) b 217 + 48(5) ~ 193 • 12(8) c 181 • 18(6) c
Cerebrum No 97.0 • 39.9(8) 70.5 __+ 29.5(7) 68.9 + 7.7(4) b 69.1 • 29.8(4) Yes 273 • 157(4) b 277 ___ 55(5) ~ 277 _+ 43(8) c 201 • 42(6) c
aValues are means (__+ SD), with the numbers of observations shown in parentheses. bSee Table III, footnote b. cSee Table III, footnote c.
some indiv idua l values in exper imenta l g roups differed significantly f rom controls , no overal l t rends were found (da ta not shown).
The effects o f 0.84).95 LDs0 o f soman were quite var iable between animals , necessi ta t ing the use o f a me thod tha t permi ts de t e rmina t ion o f metabo l ic rates in single animals , ra ther than in groups o f animals . Some animals were m a r k e d l y affected by the toxin, had per iods o f intense physical shaking, and had very different metabo l ic rates in some regions at t imes bo th early and late af ter soman injection. A n o t h e r g roup o f an imals was injected with 0.9-0.95 LDs0 o f soman and sacrificed at intervals thereafter . Again , some had seizure-l ike act ivi ty and some did not. Table IV shows that metabol ic rates in pons-medul la , midbra in , and cerebellum were unchanged in the soman- t r ea t ed an imals as a group. Table V i l lustrates tha t the differences in metabo l i c rates between "se iz ing" and "nonse iz ing" animals were in the d iencepha lon and cerebrum. The rats with seizure-l ike act ivi ty had large increases in rates o f glucose use in these two regions, whereas rats wi thout this act ivi ty had rates which were unchanged f rom or lower than those o f controls .
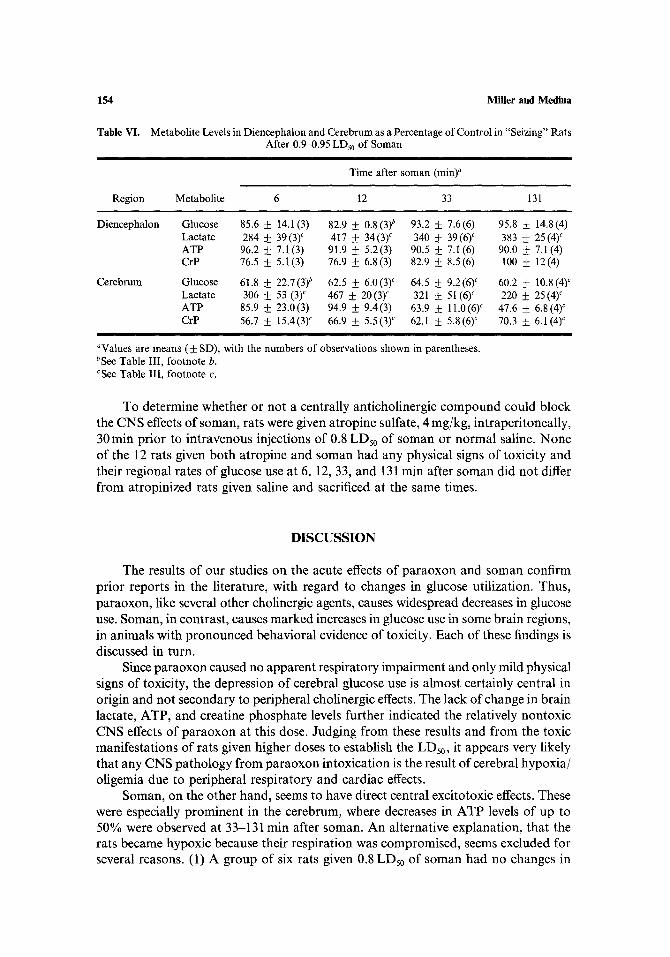
Brain me tabo l i t e levels in som~in-treated rats conf i rmed that the d iencephal ic and cerebra l regions were severely affected (Table VI). Lac ta te levels were grossly elevated in bo th regions. The metabol ic a l terat ions were most p ronounced in cerebrum, where glucose and creat ine phospha t e levels were decreased signif icantly at all t imes and A T P levels fell s ignificantly by 33 min af ter soman admin i s t ra t ion . In the o ther regions s tudied f rom seizing rats A T P and creat ine phospha t e levels did no t change significantly.
154
Table VI.
Region
Miller and Medina
Metabolite Levels in Diencephalon and Cerebrum as a Percentage of Control in "Seizing" Rats After 0.9-0.95 LDs0 of Soman
i
Time after soman (rain) ~
Metabolite 6 12 33 131
Diencephalon
Cerebrum
Glucose 85.6 + 14.1(3) 82.9 + 0.8(3) b 93.2 +__ 7.6(6) 95.8 + 14.8(4) Lactate 284 • 39(3) c 417 _ 34(3) c 340 • 39(6) c 383 _ 25(4) c ATP 96.2 + 7.1 (3) 91.9 +__ 5.2(3) 90.5 + 7.1 (6) 90.0 _ 7.l (4) CrP 76.5 + 5.1(3) 76.9 + 6.8(3) 82.9 __+ 8.5(6) 100 + 12(4)
Glucose 61.8 • 22.7(3) b 62.5 +__ 6.0(3) c 64.5 • 9.2(6) ~ 60.2 __+ 10.8(4) c Lactate 306 _+_+ 53 (3) c 467 • 20 (3) ~ 321 • 51 (6) c 220 • 25 (4) c ATP 85.9 • 23.0(3) 94.9 _ 9.4(3) 63.9 + 11.0(6) c 47.6 + 6.8(4) ~ CrP 56.7 • 15.4(3) ~ 66.9 • 5.5(3) c 62.1 • 5.8(6) c 70.3 • 6.1(4) c
aValues are means (+ SD), with the numbers of observations shown in parentheses. bSee Table III, footnote b. cSee Table III, footnote e.
To determine whether or not a centrally anticholinergic compound could block the CNS effects of soman, rats were given atropine sulfate, 4 mg/kg, intraperitoneally, 30 rain prior to intravenous injections of 0.8 LDs0 of soman or normal saline. None of the 12 rats given both atropine and soman had any physical signs of toxicity and their regional rates of glucose use at 6, 12, 33, and 131 min after soman did not differ from atropinized rats given saline and sacrificed at the same times.
D I S C U S S I O N
The results of our studies on the acute effects of paraoxon and soman confirm prior reports in the literature, with regard to changes in glucose utilization. Thus, paraoxon, like several other cholinergic agents, causes widespread decreases in glucose use. Soman, in contrast, causes marked increases in glucose use in some brain regions, in animals with pronounced behavioral evidence of toxicity. Each of these findings is discussed in turn.
Since paraoxon caused no apparent respiratory impairment and only mild physical signs of toxicity, the depression of cerebral glucose use is almost certainly central in origin and not secondary to peripheral cholinergic effects. The lack of change in brain lactate, ATP, and creatine phosphate levels further indicated the relatively nontoxic CNS effects of paraoxon at this dose. Judging from these results and from the toxic manifestations of rats given higher doses to establish the LD50, it appears very likely that any CNS pathology from paraoxon intoxication is the result of cerebral hypoxia/ oligemia due to peripheral respiratory and cardiac effects.
Soman, on the other hand, seems to have direct central excitotoxic effects. These were especially prominent in the cerebrum, where decreases in ATP levels of up to 50% were observed at 33-131 rain after soman. An alternative explanation, that the rats became hypoxic because their respiration was compromised, seems excluded for several reasons. (1) A group of six rats given 0.8 LDs0 of soman had no changes in
Brain Metabolism and Cholinergic Compounds 155
arterial pO2 or pCO2, even though they showed definite physical signs of intoxication. (2) The effect of hypoxia on brain lactate levels is reported to be about the same in all the brain regions we examined (Duffy et al., 1972, 1982), and hypoxic increases in deoxyglucose use are found in all regions [although they are inhomogeneous within a region (Shimada, 1981; Duffy et al., 1982)].
Table I makes it clear that cholinergic compounds differ markedly in their effects on brain regional deoxyglucose use. Soman's stimulatory effects were similar to those of oxotremorine and unlike those of any of the other organophosphorus compounds studied. The differences between anticholinesterase agents can be explained either by postulating that there are differences in noncholinergic properties of the drugs or by postulating that they differ in their ability to inactivate cholinesterase in different receptor populations. The fact that atropine-pretreated rats did not have the large increases in glucose use by diencephalon and cerebrum found in many soman-treated rats argues for the latter explanation. The finding that large doses of soman depress cerebral glucose utilization in rats pretreated with a mixture of antidotes to soman's cholinergic effects has, on the other hand, been used to support the hypothesis that soman does have noncholinergic properties (Samson et al., 1984).
We did not perform neuropathological studies on soman-treated rats, but our finding that the most affected regions were cerebrum and diencephalon is in general agreement with the locations of neuronal degeneration and necrosis in rat brain after acute soman intoxication (McLeod et al., 1984). The decreases in cerebral ATP levels at 33 and 131 rain after soman are considerably greater than those found during prolonged status epileptions in rodents (Duffy et al., 1975). Low levels of ATP over a prolonged period are predictive of both cell damage and failure to recover function in experimental models of brain injury (Siesjo, 1978). It is worth noting that the levels of lactate we found in forebrain, although high, did not approach those thought to be associated with tissue damage (Myers et al., 1979; Plum, 1983). Lactate levels, moreover, were about the same in diencephalon, which had near-normal ATP levels, as in cerebrum, which had much lower levels. Thus, our data do not indicate that the extent of lactic acidosis correlated with the impairment of ATP production, in contrast to recent in vitro studies (Hillered et al., 1984).
ACKNOWLEDGMENT
This work was supported by The Department of the Army, Contract D A MD 17- 81-C-1240.
R E F E R E N C E S
Churchill, L., Pazdernik, T. L., Cross, R. S., Giesler, M., Nelson, S. R., and Samson, F. E. (1984). Impact of DFP on local glucose utilization in antidote-pretreated rats. Trans. Am. Soc. Neurochem. 15: 177.
Crane, P. D., Braun, L. D., Cornford, E. M., Cremer, J. E., Glass, J. M., and Oldendorf, W. H. (1978). Dose dependent reduction of glucose of utilization by pentobarbital in rat brain Stroke 9; 12-18.
Dam, M., and London, E. D. (1983). Effects of cholinomimetics on glucose utilization in rat brain optic systems. Eur. J. Pharmacol. 87: 137-140.
156 Miller and Medina
Dam, M., and London, E. D. (1984). Glucose utilization in the Papez circuit: Effects of oxotremorine and scopolamine. Brain Res. 295: 132144.
Dam, M., Wamsley, J. K., Rapoport, S. I., and London, E. D. (1982). Effects of oxotremorine on local glucose utilization in the rat cerebral cortex. J. Neurosci. 2: 1072-1078.
Duffy, T. E., Nelson, S. R., and Lowry, O. H. (1972). Cerebral carbohydrate metabolism during acute hypoxia and recovery. J. Neurochem. 19: 959-977.
Duffy, T. E., Howse, D. C., and Plum, F. (1975). Cerebral energy metabolism during experimental status epilepticus. J. Neurochem. 24: 925-934.
Duffy, T. E., Cavazzuti, M., Cruz, N. F., and Sokoloff, L. (1982). Local cerebral glucose metabolism in newborn dogs: Effects of hypoxia and holothane anesthesia. Ann. Neurol. 11: 233-246.
Hillered, L., Ernster, L., and Siesjo, B. K. (1984). Influence of in vitro lactic acidosis and hypercapnia on respiratory activity of isolated rat brain mitochondria. J. Cereb. Blood Flow Metab. 4: 430-437.
Lowry, O. H., and Passonneau, J. V. (1972). A Flexible System of Enzymatic Analysis, Academic Press, New York.
Lowry, O. H., Rosebrough, N. J., Farr, A. L., and Randall, R. J. (1951). Protein measurement with the Folin phenol reagent. J. Biol. Chem. 193: 265-275.
McDonough, J. H., Jr., Hackley, B. E., Jr., Cross, R., Samson, F., and Nelson, S. (1983). Brain regional glucose use during soman-induced seizures. Neurotoxicology 4: 203-210.
McLeod, C. G., Singer, A. W., and Harrington, D. G. (1984). Acute neuropathology in soman poisoned rats. Neurotoxicology 5:53 58.
Medina, M. A., Deam, A. P , and Stavinoha, W. B. (1980). Inactivation of brain tissue by microwave irradiation. In Passonneau, J. V., Hawkins, R. A., Lust, W. D., and Welsh, F. A. (eds.), Cerebral Metabolism and Neural Function, Williams and Wilkins, Baltimore, pp. 56-69.
Miller, A. L., and Corddry, D. H. (1981). Brain carbohydrate metabolism in developing rats during hypercapnia. J. Neurochem. 36: 1202-1210.
Miller, A. L., and Kiney, C. A. (1981). Metabolism of [14C]fluorodeoxyglucose by rat brain in vivo. Life Sci. 28: 2071-2076.
Miller, A. L., Shamban, A. T., Corddry, D. H., and Kiney, C. A. (1982). Cerebral metabolic responses to electroconvulsive shock and their modification by hypercapnia. J. Neurochem. 38: 916-924.
Myers, R. E. (1979). A unitary theory of causation of anoxic and hypoxic brain pathology. In Fahn, S., Davis, J. N., and Rowland, L. P. (eds.), Advances in Neurology, Vol. 26: Cerebral Hypoxia and lts Consequences, Raven Press, New York, pp. 195-213.
Nelson, S. R., Doull, J., Tuckman, B. A., Cristiano, P. J., and Samson, F. E. (1978). Regional brain metabolism changes induced by acetylcholinesterase inhibitors. Brain Res. 157: 186-190.
Oguchi, K., Arakawa, K., Nelson, S. R., and Samson, F. (1982). The influence of droperidol, diazepam, and physostigmine on ketamine-induced behavior and brain regional glucose utilization in rat. Anesthesiology 57: 353-358.
Pazdernik, T. L., Cross, R. S., Mewes, K;, Samson, F., and Nelson, S. R. (1982). Superior colliculus activation by retinal nicotinic ganglion cells: A 2-deoxyglucose study. Brain Res. 243:197 200.
Pazdernik, T. L., Cross, R., Nelson, S., Samson, F., and McDonough, J., Jr. (1983). Soman-induced depression of brain activity in TAB-pretreated rats: A 2-deoxyglucose study. Neurotoxicology 4: 27-34.
Plum, F. (1983). What causes infarction in ischemic brain? The Robert Wartenberg Lecture. Neurology 33: 222-233.
Samson, F.E., Pazdernik, T.L., Cross, R.S., Giesler, M.P., Mewes, K., Nelson, S.R., and McDonough, J. H. (1984). Soman induced changes in brain regional glucose use. Fund. Appl. Toxicol. 4: S173-S183.
Scremin, O. U., Sonnenschein, R. R., and Rubinstein, E. H. (1982). Cholinergic cerebral vasodilation in the rabbit: Absence of concomitant metabolic activation. J. Cereb. Blood Flow Metab. 2: 241-247.
Shimada, M. (1981). Glucose uptake in mouse brain regions under hypoxic hypoxia. Neurochem. Res. 6: 993-1003.
Siesjo, B. K. (1978). in Brain Energy Metabolism, Wiley, New York, pp. 398-526. Sokoloff, L., Reivich, M., Kennedy, C., DesRosiers, M. H., Patlak, C. S., Pettigrew, K. D., Sakurada, O.,
and Shinohara, M. (1977). The [14C]deoxyglucose method for the measurement of local cerebral glucose utilization: Theory, procedure and normal values in the conscious and anesthetized albino rat. J. Neurochem. 28: 897-916.
Vetterlein, F., and Haase, W. (1979). Regional blood flow determinations in the rat during paraoxon- poisoning and treatment with atropine and obidoxime. Toxicology 12: 173-181.
Weil, C. (1952). Tables for convenient calculation of median-effective dose (LDs0 or EDs0 ) and instructions in their use. Biometrics 8: 249-255.
Weinberger, J., Greenberg, J. H., Waldman, M. T. G., Sylvestro, A., and Reivich, M. (1979). The effect of scopolamine on local glucose metabolism in rat brain. Brain Res. 177: 337-345.