cep discussion paper no 1473 march 2017 is distance dead...
TRANSCRIPT
ISSN 2042-2695
CEP Discussion Paper No 1473
March 2017
Is Distance Dead? Face-to-Face Communication and Productivity in Teams
Diego Battiston Jordi Blanes i Vidal
Tom Kirchmaier
Abstract Has technology made face-to-face communication redundant? We investigate using a natural experiment in an organisation where a worker must communicate complex electronic information to a colleague. Productivity is higher when the teammates are (exogenously) in the same room and, inside the room, when their desks are closer together. We establish face-to-face communication as the main mechanism, and rule out alternative channels such as higher effort by co-located workers. The effect is stronger for urgent and complex tasks, for homogeneous workers, and for high pressure conditions. We highlight the opportunity costs of face-to-face communication and their dependence on organisational slack.
Keywords: teamwork, face-to-face communication, distance, organisations JEL codes: D23; M11
This paper was produced as part of the Centre’s Growth Programme. The Centre for Economic Performance is financed by the Economic and Social Research Council.
Acknowledgements We thank Oriana Bandiera, David de Meza, Luis Garicano, Rocco Macchiavello, Alan Manning, Ignacio Palacios-Huerta, Steve Pischke, Yona Rubinstein and Roberto Weber for valuable insights. Special thanks also to Chief Constable Ian Hopkins QPM, and to Steven Croft, Peter Langmead-Jones, Duncan Stokes, Ian Wiggett and many others at the Greater Manchester Police for making this project possible.
Diego Battiston, Department of Economics and Centre for Economic Performance, London School of Economics. Jordi Blanes i Vidal, Department of Management and Centre for Economic Performance, London School of Economics. Tom Kirchmaier, Financial Markets Group and Centre for Economic Performance, London School of Economics.
Published by Centre for Economic Performance London School of Economics and Political Science Houghton Street London WC2A 2AE
All rights reserved. No part of this publication may be reproduced, stored in a retrieval system or transmitted in any form or by any means without the prior permission in writing of the publisher nor be issued to the public or circulated in any form other than that in which it is published.
Requests for permission to reproduce any article or part of the Working Paper should be sent to the editor at the above address.
D. Battiston, J. Blanes i Vidal and T. Kirchmaier, submitted 2017.

1 Introduction
To function effectively, organisations rely on the timely and accurate internal communica-
tion of information (Hayek 1945, Arrow 1974). Over time, advances in telecommunication
and information technologies have allowed organisations and teams to be more geograph-
ically dispersed (Forman and van Zeebroeck 2012, Freeman et al., 2014). This trend has
prompted some scholars and commentators to herald the ’death of distance’ (Cairncross
2001, Friedman 2005), whereby organisations fully fragment geographically1. A symptom of
this fragmentation is the offshoring of business support services such as customer services,
credit bureaus, and telephone call centres (Jensen et al., 2005). Another manifestation is
the growing trend in working from home practices (Mateyka et al. 2012, Bloom et al. 2015).
Many have argued instead that face-to-face interactions remain crucial in the new
technological environment (Gaspar and Glaeser 1998, Storper and Venables 2004). The
geographical clustering of high skilled creative industries in expensive locations has been
interpreted as prima facie evidence in support of this notion (Glaeser, 2014). Reports of
global technology firms forcing their engineers to work alongside each other (Reses 2013,
Zuckerberg 2015) seem to provide additional, if indirect, evidence. Despite this, very little
is known about the extent to which the ability to communicate in person increases the
productivity of information-intensive teams. For instance, we do not know how quickly
productivitiy decays with physical distance in these settings. Little is also known about how
the benefits of co-location may depend on the urgency and informational complexity of the
issues facing the organisation, on the homogeneity and stability of the workforce, and on the
general pressures in the working environment.
Understanding these issues would allow for nuanced predictions of the circumstances
in which communication technologies can substitute or complement human communication.
For instance, do we expect face-to-face communication to be important in helping to solve
non-routine problems? Will very urgent decisions (or decisions taken under a lot of pres-
sure) be automated in the future? As societies grapple with the disruptive consequences of
technological change, a better understanding of these questions would permit us to prepare
1The following quote by Nandan Nilekani, the founder of Infosys, is instructive: ’(Communication tech-nologies) created a platform where intellectual work, intellectual capital, could be delivered from anywhere.It could be disaggregated, delivered, distributed, produced and put back together again - and this gave awhole new degree of freedom to the way we do work, especially work of an intellectual nature.’ Paradoxically,this insight was provided by Nilekani to Thomas Friedman through a personal conversation, when the latterflew to Bangalore to interview the former (Friedman, 2005).
2

for and respond to these trends. From a policy perspective, it would also be valuable to
managers searching for the optimal organisation of their personnel and activities.
Unfortunately, tackling these questions is empirically challenging. In addition to the
well-known difficulty of measuring the internal operations of organisations, an appropriate
setting must be found with sufficient richness in the composition of teams, the nature of the
tasks or products assigned to them and the proximity between co-workers. Even if these
challenges are overcome, researchers face the obstacle that the geographical configuration
of organisations is often the result of an efficiency-maximising decision process, prompting
endogeneity concerns.
This Study We exploit a natural experiment to provide evidence on the relation between
distance, communication and productivity in a large public sector organisation: the branch
in charge of answering 999 calls and allocating officers to incidents in the Greater Manch-
ester Police. An incoming call is answered by a call handler, who describes the incident
in the internal computer system. When the handler officially creates the incident, its de-
tails are available to the radio operator responsible for the neighbourhood where the incident
occurred. The radio operator then allocates a police officer on the basis of incident character-
istics and officer availability. The main measure of performance available to the organisation
is the time that it takes for the operator to allocate an officer2. Unfortunately, delays often
result from the radio operator’s need to gather additional information. One way in which
she can do this is by communicating with the call handler electronically or in person.
We exploit the fact that handlers and operators are spread across four rooms, each
in a separate part of Manchester. Each room contains the radio operators responsible for
the surrounding neighbourhoods, as well as a subset of the call handlers, who can take
calls from anywhere in Manchester. This arrangement implies that, for some incidents, an
operator reads the information inputted in the system by a handler located in the same
room. For other incidents, the information will instead have been entered by a handler
based in another location. An important consequence of co-location is that it allows the
two teammates, handler and operator, to communicate face-to-face if they wish to do so.
We argue, and show with a set of balancing tests, that the computerised queuing system
matching incoming calls to newly available handlers creates exogenous variation in the co-
2We describe this measure in detail in Section 2. There, we also list its advantages and potential lim-itations and explain why the organisation assigned high importance to this measure during our sampleperiod.
3
location of handler and operator.
Our setting is ideal to measure when and how proximity between teammates allows for
better transmission of information. In addition to exploiting the exogeneity of this proximity,
we can take advantage of the fact that our setting generates substantial variation in the
individual composition of teams, the types of tasks that each team is assigned to, and the
conditions under which these teams operate. The availability of a meaningful performance
variable at the incident level permits the measurement of the benefits of co-location, under
different scenarios. By leveraging information on the flow of incoming tasks we are also able
to determine whether face-to-face communication has costs for the organisation, in addition
to benefits.
Results We find that allocation time is 2% faster when handler and operator work in
the same room. An important consequence of this faster response is that it decreases the
likelihood that the operator misses the country-wide target for a maximum allocation time
- a metric by which police forces are evaluated by the UK Home Office. We also show that
proximity within the room is important - the effect of co-location is 4% when handler and
operator are sitting very close together.
To establish face-to-face communication as the primary explanatory mechanism, we
undertake a series of tests. Firstly, we show that allocation time is lower when the same pair
of workers are sitting inside the room closer together. This finding rules out unobservable
characteristics in the match between handler and operator (correlated with co-location) as
the main mechanism behind the baseline findings. We provide additional evidence in this
respect with a placebo test that exploits an organisational restructure that altered the regular
workplaces of handlers and operators.
Secondly, we show that there is no evidence of handler and operator assigning more
importance to co-located incidents. This alternative mechanism could be due to visual peer
pressure or a psychological effect triggered by a co-located teammate. By using several
proxies, we show that the quality of the handler’s electronic communication does not appear
to be higher when a co-located co-worker will be reading the incident’s description. We also
find that operators do not assign higher priority to co-located incidents, and at the expense
of other contemporaneous incidents.
We further distinguish between alternative mechanisms by examining the behaviour
of the handler after officially creating the incident. Under the face-to-face communication
4

mechanism, the handler spends time talking to the operator, which temporarily prevents her
from being available to take new calls. Alternative mechanisms, such as better electronic
communication on the handler’s part or higher effort by the operator, do not naturally have
that prediction. We show that handlers spend more time ’unavailable’ to take new calls
following the creation of co-located incidents, which provides indirect evidence that they are
communicating with the operator in these incidents.
We provide two additional sets of results. Firstly, we establish that being able to
communicate face-to-face has a higher effect for: (a) more urgent and information-intensive
incidents, (b) in conditions of higher operator workload, (c) when the teammates are more
homogeneous (in terms of age and gender), and (d) when the teammates have worked to-
gether more often in the past. Secondly, we highlight and compute the opportunity costs of
face-to-face communication. Every second that the handler spends talking to the operator
about a recently created incident cannot be devoted to answering new calls. We show that,
in our setting, the number of incoming calls per on duty handler is relatively low, which
means that handlers sometimes are waiting for, rather than answering, calls. This makes
the opportunity cost of face-to-face communication relatively low and the net benefit pos-
itive. We argue that, if the organisational slack was lower and face-to-face communication
took longer, the net benefit could be very different.
Contribution This paper provides, we believe, the first detailed causal evidence on the
relation between proximity, communication and productivity inside organisations. Of course,
the study involves a particular setting and production technology. As such, the implications
are stronger for high pressure environments such as the healthcare professionals assessing
and treating patients in emergency rooms, or the frontline staff and their supervisors in air
traffic control, the military, and other time-critical settings.
More generally, we also believe that the insights on the contingent value of face-to-face
communication have broader applicability. The finding that the urgency and information-
intensity of tasks are important determinants of this value are both intuitive and of general
relevance. Equally significant is the result that geographical and social distance are strategic
complements in communication-intensive production settings. We outline in the conclusion
a number of policy prescriptions based on this finding.
Lastly, we are the first to provide a measure of the opportunity cost of the time spent
engaging in face-to-face communication. Computing these measures would be impossible
5
without the high granularity of the dataset, in particular with regards to the ability to
follow workers’ behaviour and the inflow of tasks in real time. One lesson that is of likely
general applicability is that the cost of communication depends on the alternative use of the
worker’s time, and therefore on the amount of slack in the organisation.
Related Literature This paper connects to three strands of literature. A large body of
work examines the relation between geographical proximity, assumed to facilitate face-to-face
interactions, and the diffusion and generation of knowledge (Jaffe et al. 1993, Thompson and
Fox-Kean 2005). A challenge here is to disentangle geographical distance from other factors,
such as knowledge or social distance, correlated with it, but recent papers by Boudreau,
et al. (2014), Catalini (2016) and Catalini et al. (2016) make substantial progress in this
respect. While this literature is mainly concerned with forming new teams in order to
create new knowledge, our setting is more similar to the problem-solving organisations of
Radner (1993) or Garicano (2000). An advantage of our paper is that teams and incidents
are exogenously formed, which allows us to concentrate on how face-to-face communication
enables the resolution of the issues facing the organisation.
The second strand of the literature is on teamwork. Most empirical work here has been
on the measurement of team-specific human capital (Hayes et al. 2006, Bartel et al. 2014,
Jaravel et al. 2016), or on the effects of team-based incentives in settings where production
is individual (Hamilton et al. 2003, Bandiera et al. 2013). Our main distinction with this
work is the emphasis on communication effectiveness in an environment of team, rather than
individual, production3. The closest parallel here is probably Boning et al. (2007) panel-
data study on the incentives of problem-solving teams. By exploiting a natural experiment
and measuring the production process very precisely, we identify the costs and benefits of a
particular channel through which ’problem-solving teams’ solve problems.
The focus on how human (i.e. face-to-face) communication contributes to the pro-
duction process creates a link with studies examining the impact of new technologies on
organisations and workers (Bresnahan et al. 2002, Autor et al. 2003, Acemoglu and Autor
2011, Bloom et al. 2014). Our paper strongly complements Bloom et al. (2015) finding that
working from home increased productivity in a Chinese call centre. The contrast with our
result that co-location is more efficient is likely the result of the many differences between
3Mas and Moretti (2009) and Chan (2016) study social incentives when workers produce largely individ-ually but are jointly responsible for a wider outcome, such as the waiting times of incoming customers. Thisintroduces a joint production component to their effort decisions.
6

the two settings. A very important one is probably the complexity of the production pro-
cess. While the simple individual production of Bloom et al. (2015) can be easily monitored
and co-ordinated remotely, we show that, in organisations requiring tight co-ordination be-
tween colleagues, working in the same place may instead be more effective4. We provide
evidence in this respect by showing that the benefits of co-location are contingent on the
information-intensity of the incident.
Plan We describe the institutional setting in Section 2. We introduce the data and the
empirical strategy in Section 3. We present the main results of the paper in Section 4. In
Section 5, we provide evidence in support of the face-to-face communication mechanism.
Section 6 explores the heterogeneity of the main results. In Section 7, we provide a cost-
benefit analysis of the face-to-face communication effect. Section 8 concludes.
2 Institutional Setting
We exploit a natural experiment in the Operational Communications Branch (OCB) of the
Greater Manchester Police (GMP). The OCB is the unit in charge of answering 999 calls
from members of the public and managing the allocation of officers to the corresponding
incidents. Figure 1 provides a simplified visualisation of this production process.
Call Handler Emergency calls requesting the police are allocated to call handlers using
a standard computerised queuing system. A result of the system is that any handler can
respond to calls from any Manchester location.
The handler questions the caller, assigns an opening code and a grade level, and records
any information deemed relevant. The grade level can range from one to three and, very
coarsely, determines the official urgency of an incident. The opening code describes, horizon-
tally and at a fairly detailed level, the type of issue that the incident relates to (neighbour
dispute, disturbance in licensed premises, etc.). The description of the incident will include
information on the individuals involved, their states of mind, the existence of prior history
between these individuals and the likelihood of further incidents in the near future5.
4One way to interpret face-to-face communication is as an efficient channel to coordinate the informationthat a receiver needs with the messages that a sender sends.
5The language used in these descriptions is highly efficient, as it includes a large number of officialand unofficial abbreviations for features of incidents that appear repeatedly. For instance, official abbre-viations include A/ABAN (apparently abandoned) and NFA (no fixed abode). Unofficial but widely used
7

All the information above is recorded in GMPICS, a specialised IT package used
throughout the GMP to create, record and manage incidents6. The handler ticks a box
in GMPICS to officially create the incident, and then indicates her status as ’not ready’
(which allows the handler, among other things, to step away from his desk), or instead
’ready to receive new calls’. Under the ’ready’ status, a call can arrive at any point and
must immediately be answered by the handler.
Radio Operator When an incident is created, it immediately appears on the computer
screen of the radio operator overseeing the Manchester subdivision where the incident oc-
curred. The allocation of incidents to radio operators is deterministic, since at any point in
time there is only a single operator in charge of a specific subdivision (a corollary of this is
that handlers do not decide to which operator they assign an incident). Radio operators are
in charge of processing the information inputted by the handler and allocating police officers
to incidents, on the basis of incident characteristics and officer availability.
Lacking a direct link with the caller, the radio operator has to rely on the information
recorded by the handler in GMPICS. It is, however, often the case that additional information
is needed before an officer can be allocated. For instance, written descriptions of incidents
are regarded by radio operators as lacking sufficient emotional content, which makes it harder
to understand the state of mind of the victim and the impact that the incident has had on it.
Similarly, a full characterisation of the physical surroundings where the incident occurred, or
of the complex relationships between the people involved are often difficult to communicate
in writing. A complete picture of the incident is often necessary to efficiently match incidents
with officers, advise the attending officer of important details that she may find at the scene,
or even understand the level of priority that the incident merits7.
The additional information can be acquired by conducting targeted searches on specific
abbreviations include XXX (very drunk). Despite this, the written descriptions inevitably fail to perfectlycommunicate the full richness of the information gathered by the call handler.
6Our personal conversations with multiple handlers, radio operators and their supervisors indicate thatGMPICS is widely regarded as an efficient, if relatively outmoded, system. GMPICS was developed in-house and incrementally over more than two decades. OCB staff receive extensive training and accumulateconsiderable expertise in its use.
7Regarding the optimal matching between incidents and officers, note for instance that some incidentscan be responded alternatively by sworn police officers or by PCSOs (police community support officers)and the likelihood that the more extensive legal powers and expertise of police officers may be neededis decision-relevant information. Similarly, incidents involving vulnerable individuals require officers withspecialist training, which makes it critical to understand the condition of the caller and other individualsaffected. More generally, certain officers are particularly well-suited to dealing with specific types of incidentsor individuals.
8
individuals or addresses in the GMP databases, asking the call handler or contacting the
initial caller directly. Often, the allocation of an officer will be delayed until the radio
operator can gather this information.
Teamwork In this paper our definition of a team comprises the combination of the call
handler and the radio operator. While officially equal in rank, the positions of call handler
and radio operator are associated with different status within the OCB. This stems from the
fact that the job of radio operator is both more complex and more stressful, as it involves
carrying out a variety of tasks in parallel and bearing the ultimate responsibility for the
outcomes of incidents. The decision-making authority of radio operators is also wider. For
instance, they can overrule the code and grade allocated by the handler (although this is in
practice rare). Accordingly, radio operators earn a higher salary and have on average more
experience in the OCB. Many in fact transferred into radio operations from the call handling
desk, a move widely seen in the organisation as a promotion.
Face-to-Face Communication When a radio operator regards the electronic description
of an incident insufficient, an efficient and fast way to gather this information is to ask
the handler in person8. More common in our setting (according to our sources), handlers
often decide to complement the written description with additional information delivered
face-to-face. When handler and operator are communicating in person, the handler will
typically need to be in ’not ready’ status, as she may otherwise be forced to abruptly end
the conversation when a new call arrives.
Members of the OCB attach several advantages to face-to-face communication: firstly,
it is a highly efficient channel, in that it allows for rapid, short exchanges that provide imme-
diate feedback to both teammates. Secondly, non-verbal cues can help to communicate fuzzy
concepts that in writing would require lengthy descriptions. Thirdly, it is a more natural
vehicle for the use of colloquialisms that can succinctly and effectively communicate charac-
teristics of an incident including the physical or mental condition of the individuals involved.
For a variety of reasons (including the possibility of future audits of the official GMPICS
descriptions) these colloquialisms are less likely to be used in written communication.
8Communicating on the phone is theoretically possible but in practice unlikely, as a handler in status’ready to take new calls’ cannot be contacted on the phone without first alerting the handler’s supervisor.On the other hand, a handler can easily switch status from ’ready’ to ’not ready’ if an operator approachesin person with the need to clarify some doubt.
9

Co-Location In the period between November 2009 and January 2012, OCB staff were
spread across four buildings or ’rooms’, each in a different part of Manchester: Claytonbrook,
Leigh, Tameside and Trafford. Every room accommodated the radio operators overseeing
the surrounding subdivisions (Figure 2 displays the areas overseen from each of the four
locations). As discussed earlier, call handlers were not geographically specialised. However,
for historical reasons they were also dispersed across the four locations. This assignment
meant that radio operators would sometimes be reading the descriptions of incidents created
by same room handlers, while on other occasions the handlers were based in a different part
of Manchester.
In January 2012, a major reorganisation of the OCB reassigned all handlers to a single
location (Trafford), while radio operators were divided between Claytonbrook and Tameside.
This put an end to the natural experiment that we study here.
Measures of Performance As is the case with other public sector organisations (Dewa-
tripont et al., 1999), objectives in the GMP are multifaceted and often vague. The prevention
of harm or damage to property, the satisfaction and reassurance of the public, and the appli-
cation of sufficient but proportionate force are all important objectives that escape precise
measurement. Capturing every one of these objectives with explicit measures of performance
is therefore an impossible task. Our first measure of performance is the allocation time of
an incident: the time elapsed between its creation by the call handler and the allocation of
an officer by the radio operator. We also study the effect of distance on response time: the
time between creation and the officer reaching an incident’s scene9.
The two measures that we use are undoubtedly partial. They do not capture, for
instance, any notion of whether the ’right’ officer was allocated to an incident, or whether
the attending officer was in possession of all the relevant information prior to arrival. They
also do not indicate whether or not excessive or insufficient resources were allocated to resolve
an incident. The measures, however, have features that make them particularly appropriate
for this study. Firstly, they are available at the incident level, the same level at which the
variation in distance occurs in our study. As long as the improvement in allocation and
9These two measures are strongly correlated, since response time is equal to allocation time plus theofficer’s travel time. It is worth noting that better information on the part of the radio operator could affecttravel time also. Imagine, for instance, a radio operator deciding whether to allocate the closest officer, oran officer with a specialised skill. Better information could reveal that the incident does not require thespecialised skill, and that the officer with the shorter travel time can be safely allocated.
10

response times that we document in Section 4 is not accompanied by a deterioration of
unobserved dimensions of performance, physical proximity between handler and operator
will have lead to higher organisational efficiency.
Secondly and most importantly, they are critical measures for the organisation. Survey
evidence suggests that response time is one of the most important determinants of citizens’
satisfaction with their police forces (Dodd and Simmons 2002/03). Furthermore, in 2008 the
UK Home Office established nation-wide numerical targets regarding allocation and response
times10. While these targets were nominally scrapped in June 2010, police forces continued
to regard them as objectives and to believe that they were being informally evaluated on
this basis (Curtis, 2015). There is substantial evidence that the leadership of the GMP
internalised the need for minimising these times. One example can be found in the GMP
Incident Response Policy manual April 2011. Only one tactical performance monitoring is
reflected in the manual: allocation and response times. In particular, the manual indicates
that11:
The OCB will produce daily reports regarding graded response performance. This
will include the % of incidents resourced within target and the % attended within
target for each division. This will enable ongoing analysis of the accuracy of the
resource management of that BCU.
3 Empirical Strategy
In this section we present and discuss the dataset and main variables of the paper. We
also first explain the empirical strategy, and then justify it with a set of balancing tests.
Establishing a causal effect between proximity and performance is not an easy task. In
addition to exploiting the idiosyncratic allocation of incidents to handlers, which we outline
in this section, we will need to consider the possibility that distance represents a proxy
10For Grade 1 crimes, for instance, these targets were for a maximum of two minutes and fifteen minutesfor allocation time and response time, respectively. The equivalent targets for Grade 2 (respectively Grade3) were 20 and 60 minutes (respectively 120 and 240 minutes).
11Additional examples include the following. The launching in April 2010 of a website where the publiccould access up-to-date statistics on response times, separately for each of the twelve divisions (Pilling,2010). Secondly, the fact that throughout our sample period every report by the GMP to the ManchesterCity Council Citizenship and Inclusion Overview and Scrutiny Committee provided detailed statistics onresponse times and, if these were deemed unsatisfactory, a list of reasons for the failure. Lastly, informationon response times was also frequently discussed in the reports produced by the HMIC (the central body thatin the UK regulates and monitors police forces). For an example, see HMIC (2012).
11

for unobserved characteristics of the handler, or handler/operator pair. We postpone the
discussion of these confounding effects, together with the tests that we use to evaluate them
empirically, to Section 4.
Dataset Our baseline dataset contains every incident reported through the phone to the
GMP between November 2009 and December 2011. We restrict our attention to incidents
where the handler allocated the call a grade below or equal to three, therefore transferring
responsibility to a radio operator rather than to a divisional commander. For every incident
we observe, among others, the allocation and response time, the location of the incident, the
grade and (horizontal) opening code, the identity of the call handler and radio operator, and
the desk position from which the handler took the call. The dataset was made available to
us under a strict confidentiality agreement.
Table 1 provides basic summary statistics for the main variables in our study. Note
first that our sample size is very large, as it includes close to one million incidents. In around
one in four observations the handler and operator are in the same room. The performance
variables are highly right-skewed. For response, for instance, the median time is 19 minutes,
while the average time is more than four times larger12.
We find that there is considerable gender and age variation among handlers and op-
erators. Consistently with our earlier discussion of the differences in status, operators are
significantly older than handlers. They are also more likely to be female, likely the result of
females being more likely to regard the OCB as a long-term career choice.
Intuition of Empirical Strategy The computerised queuing system allocating calls to
handlers works as follows. As calls come in, they join the back of a call queue. The system
matches the call at the front of the queue with the next handler that becomes available. If
the call queue is empty and several handlers start to become available, they form their own
queue. The system then matches the handler at the front of the handler queue with the next
incoming call. The system creates exogenous variation in the co-location of the handler and
operator involved in an incident. We visualise this notion in Figures 3A and 3B where, for
simplicity, we assume that there are only two locations (Trafford and Leigh), rather than
12The maximum value is more than 15 days, likely the result of some error in the classification of theincident. The fact that the left hand side variables in our regressions are in logarithmic form should dampenthe effect of outlying observations. Nevertheless, in Appendix Table A10 we show that our baseline estimatesare robust to the exclusion of these outliers.
12

four.
Assume that, within a relatively narrow time horizon, two calls (one from Trafford,
one from Leigh) reach the queuing system, and that two handlers (one based in Trafford, the
other in Leigh) become available. The exact timing at which handlers become available is
the result of a large number of factors, including the length of their previous calls, the time
at which the calls started, the existence and length of ’not ready’ periods etc. Similarly, the
exact order at which the calls arrive is the result of many factors, including the times at
which the incidents occurred, the delay in dialling 999 and the further delay in opting for a
police service and being transferred to the GMP. These factors are arguably orthogonal to
the factors determining the order at which handlers become available. It follows that two
handlers that are on duty during the same time period should be equally likely to be the
one assigned to an incoming call. If, as in Figure 3A, the handlers are assigned calls from a
subdivision that their room oversees, they will be co-located with the radio operators with
whom they have to communicate electronically. For arguably exogenous reasons, they may
instead be assigned a call (and have to communicate with an operator) from a different area
of Manchester. We capture this variation with the dummy variable SameRoom, which is
the main independent variable in our study.
We have just argued that, conditional of the exact time period at which a call arrives,
on duty handlers should be equally likely to be assigned that call. In practice, some rooms
(for instance Trafford) were bigger than others (e.g. Leigh) and therefore contain a larger
number of handlers. This implies that the likelihood of SameRoom = 1 will be mechanically
higher if the call originates in a Trafford neighbourhood, relative to a Leigh neighborhood.
Calls originating from Trafford and Leigh may also have different characteristics, which
could independently affect their average allocation and response times. Therefore, our claim
regarding the exogeneity of the variable SameRoom is only conditional on hour (i.e. year X
month X day X hour of day) and (handler and operator) room fixed effects13.
Estimating Equation Our baseline estimating equation is:
yi = βSameRoomj(i)k(i) + θt(i) + λj(i) + µk(i) + πg(i) + γh(i) + Xi + εi (1)
13In most regressions, we use hour fixed effects to condition for the exact time period at which a callarrives. Our findings are qualitative unchanged if we instead control for the half-hour or quarter-hour period(see, for instance, Appendix Table A7).
13

where yi is a measure of OCB performance for incident i. Throughout our paper, allocation
and response times are measured in log form, both for ease of interpretation of the coeffi-
cients and in the presence of right-skewness to minimise the effect of outlying observations.
Consistently with our earlier discussion, we control for θt(i) (the fixed effect for the hour t at
which the incident arrived) and λj(i) and µk(i) (the fixed effects for the rooms j and k from
which the incident was handled and dispatched). Our main independent variable of interest
is the dummy SameRoomj(i)k(i), which takes value 1 when rooms j and k coincide.
We also control in our baseline specification for πg(i) and γh(i) (the fixed effects for
the individual handler g and operator h assigned to the incident) and by other incident
characteristics (such as the assigned grade) included in the vector Xi. These latter controls
are not essential for identification, but should contribute to the reduction of the standard
errors. We cluster these standard errors at the operator room and year/month level. In
Appendix Tables A1 and A2 we show that the baseline findings are robust to the inclusion
or exclusion of additional controls and to alternative clustering choices.
Balancing Tests Our first set of tests examines the balance of incident (grade, location
of the incident scene), worker (gender, age, location of the desk, current workload) and
room time-varying (measures of current average workload) variables across the co-location
of handler and operator. To perform these tests, we regress each variable on SameRoom,
after controlling for hour and room fixed effects. These standard balance regressions are
essentially variations of equation (1), with incident characteristics on the left hand side
and without the right hand side non-essential controls. To ease interpretation, non-binary
dependent variables are standardised.
The results in Figure 4, where we label each row in the left axis by the regression
dependent variable, plot the estimated confidence intervals of SameRoom. To illustrate the
need for our empirical strategy, we report for every variable the estimates of two regressions:
with and without the hour and room controls. We find first that SameRoom is (uncondition-
ally) strongly correlated with incident characteristics: the estimates are large and most are
statistically significant. The introduction of the hour and room controls, however, greatly
decreases both the standard errors and the estimates, which then become extremely small in
magnitude. For instance, among the non-binary variables all the estimated coefficients imply
an effect of SameRoom lower than .005 standard deviations of the dependent variable14.
14Appendix Figure A1 shows that it is the room controls that are critical to the empirical strategy. Failing
14
We also find that, after including the hour and room controls, only two of the sixteen
coefficients are statistically different from zero at the 5% level. Although higher than one-
in-twenty, we regard this ratio as remarkably low considering that the regressions are run on
close to one million observations. Note further that the significant coefficient associated with
the Grade 1 regression is both small in magnitude and negative, suggesting that same room
incidents are more likely to be allocated a low priority by the handler, and should therefore
have higher allocation and response times.
The variables in Figure 4 do not include the incident opening code, an important determinant
of allocation and response times. The opening code is captured empirically by a large
set of dummy variables that are mechanically correlated with each other, which creates
a mechanical correlation on the results of balance regressions based on equation (1). We
therefore switch the dependent and independent variables, and estimate:
SameRoomj(i)k(i) = αi + θt(i) + λj(i) + µk(i) + εi (2)
where αi are the fixed effects for the incident opening code. We find that the F-statistic of
joint significance of these effects is 1.15 (P-value = .30), suggesting that SameRoom and
the opening code dummies are conditionally uncorrelated. Overall, we interpret the results
of estimating (2) and the regressions of Figure 4 as consistent with our assumption that
co-location between the handler and operator of an incident is conditionally orthogonal to
incident, handler, operator and room time-varying characteristics.
4 Main Results
In this section we present and interpret the baseline results of the paper. We then use a
number of tests to confirm that these estimates can indeed be interpreted as the causal effect
of distance on performance, rather than the result of distance being a proxy for unobserved
determinants of allocation and response time. The section concludes with an investigation of
potential spillovers onto other (contemporaneous) incidents assigned to the radio operator.
Baseline Estimates Our baseline regressions are variations of equation (1). In the first
two columns of Table 2 we find that allocation and response time are approximately 2%
faster on average when handler and operator are located in the same room. At the mean
to control for the hour of the incident does not lead to a stronger correlation between SameRoom and theincident characteristics.
15
(respectively, median) of the independent variable, this 2% translates into 76 seconds (re-
spectively, 5.4 seconds) saved in terms of allocation time. For response time these savings
are of 104 and 20 seconds, evaluated at the mean and median respectively.
We also investigate whether these times are ’on target’. Throughout our sample period,
it was an explicit objective of the UK Home Office that allocation and response times should
typically be below certain levels15. As a result, the GMP recorded information on whether
the target maximum time was exceeded for an incident. We use these dummies as dependent
variables and find in Columns 3 and 4 that the likelihood of being on target is higher when
SameRoom = 1. For instance, the coefficient in Column 3 indicates that the likelihood of
missing the allocation target decreases by .4 percentage points (around 2% of the mean of
.25), when handler and operator are co-located.
Lastly, we find in Column 5 no evidence of co-location affecting the likelihood that
incidents classified as crimes are cleared by the GMP16.
Estimates by Distance Inside the Room Table 2 has established that co-location of
handler and operator is associated with higher performance, relative to them working in
rooms in separate areas of Manchester. We now investigate whether performance improves
as distance decreases even when handler and operator are already working in the same room.
In addition to providing richer evidence on the functional form of the relation between
distance and teamwork performance, within-room variation allows the introduction of han-
dler/operator pair fixed effects in the regression. We argue in the next subsection that the
introduction of these controls strengthens the credibility of our claim regarding the causal
interpretation of the estimates.
The assignment of desks to workers was as follows. Inside a room, a fixed desk would be
earmarked for the radio operator overseeing a specific subdivision. Handlers, on the other
hand, were free to work from any remaining and available desk. To measure the within-
15See Section 2 for details about these targets. The fact that the ’on target’ dummies are affected byco-location confirms that the results are not disproportionately due to extreme values of the allocation andresponse time distributions. It also reinforces the relevance of the results from a policy perspective.
16The absence of a statistically significant effect on the likelihood of clearing the crime may be due tothe fact that our sample size is much smaller in this regression, since only around 16% of incidents arecrimes. Nevertheless, it is somewhat surprising given the findings of Blanes i Vidal and Kirchmaier (2016)that a faster response time increases the likelihood of clearing the crime. In that paper, the identificationstrategy exploits discontinuities in distance across locations next to each other but on different sides ofdivision boundaries. In the current paper, co-location between handler and operator would likely not be avalid instrument for response time. The exclusion restriction is unlikely to be satisfied because co-locationcould affect clearance likelihood through many channels in addition to faster response times.
16

room distance between desks, we use yearly-updated floorplans of the four OCB rooms (see
Figure 5 for an example)17. We set distance to zero if handler and operator are not in the
same room, and add the interaction of distance and the same room variable to our baseline
specification.
We provide two types of evidence. In Table 3 distance is measured parametrically,
in logs. In Figure 6 we instead split distance into four categories of approximately equal
sample size, and plot the interactions of SameRoom with these dummies. The estimates
from both specifications indicate that teammates that sit closer together are more productive.
In the parametric estimation, a 10% decrease in within-room distance is associated with a
2.6% increase in the effect of SameRoom on allocation time. The non-parametric evidence
is perhaps more informative. We find that incidents assigned to workers separated by a
distance lower than 2 (e.g. diagonally adjacent desks at most) are on average allocated and
responded 4% faster. The effect decreases monotonically with distance and becomes zero
when handler and operator are separated by a distance higher than 418.
A question evident in Figure 6 is why should the benefits of proximity be so local
in our context, to the point where being in the other side of the room is equivalent to
being on the other side of Manchester. While we cannot provide a definitive answer, our
conversations with GMP staff have pointed to the fact that some supervisors are less than
encouraging regarding the communication between handlers and operators, as they view
these conversations as distractions from the handlers’ main role. A consequence of these
attitudes is that handlers are often unwilling to stand out too much by stepping far away
from their desks.
Establishing a Causal Interpretation Our preferred interpretation of the findings in
Table 2 is that: (a) being physically closer allows teammates to communicate face-to-face,
and (b) in settings where information is complex and must be processed relatively quickly,
17The floorplans are unfortunately not to scale, which prevents us from measuring distance in metric unitsand is likely to introduce measurement error in the within-room distance variable. Instead, desks are depictedin the floorplans in a matrix (x, y) format. Our measure is therefore the euclidean distance between desksinside this matrix. D =
√[(yRO − yH)2 + (xRO − xH)2], where yRO is the position of the radio operator
along the row dimension and the other coordinates are defined accordingly. As an example, two adjacentdesks in the same row or column are at a distance of one, while the distance between two diagonally-adjacentdesks is
√2 = 1.4.
18To interpret this, note that two desks that are three positions apart along both the row and the columndimension are separated by an euclidean distance of 4.2. Two desks separated by three positions along onedimension and two positions along the other are at a distance of 3.6.
17
this additional communication channel is performance-improving. An alternative interpre-
tation is that call handlers may be better informed or motivated to deal with incidents
originating in the geographical area that surrounds their workplace. To understand this
potential confounding effect, note in Figures 2 and 3A that SameRoom = 1 when a handler
based in a location is allocated an incident from the geographical area surrounding that
location. If handlers are more effective at dealing with cases that occur closeby, the findings
in Table 2 may reflect proximity to the incident scene, rather than to the co-worker.
A second alternative interpretation is that co-location may be a proxy for some un-
observed dimension of similarity between teammates. In an extreme example, imagine that
workers communicate through room-specific language, which makes electronic communica-
tion with individuals outside one’s room less efficient. This would be the case if, for instance,
there are strong local dialects and the workers in a room are drawn from the neighbourhoods
surrounding that room. In that case, co-location would represent a proxy for the ease of elec-
tronic communication between teammates, as opposed to providing a performance-improving
additional communication channel.
In Columns 3 and 4 of Table 3 we find evidence that is inconsistent with the two
alternative interpretations above. We add a set of handler/operator pair fixed effects to the
baseline regressions, and estimate the effect of distance within the room on performance.
Because handlers and operators do not typically change workplace, the introduction of pair
fixed effects effectively absorbs the same room variable.
We find that the same pair of workers operating from the same room are more pro-
ductive when their desks are closer together. The estimated coefficients are in fact almost
identical to those in Columns 1 and 2, without the pair fixed effects. These effects absorb any
characteristics of the match between handler and operator (including the match between the
handler and the location of the incident). The robustness to their inclusion therefore con-
firms that it is the location of the handler relative to the operator that causes the estimated
Table 2 decreases in allocation and response times.
A second strategy to evaluate the above is to perform a placebo test using the post-2012
information. As we mentioned in Section 2, the 2012 reorganisation of the OCB relocated
all the call handlers to Trafford, while the radio operators were split between Claytonbrook
and Tameside. Therefore, handlers and operators never shared a room after 2012. Using the
information on the workplaces of handlers and operators just before the reorganisation, we
can construct ’placebo same room’ variables taking value one when an incident is allocated
18
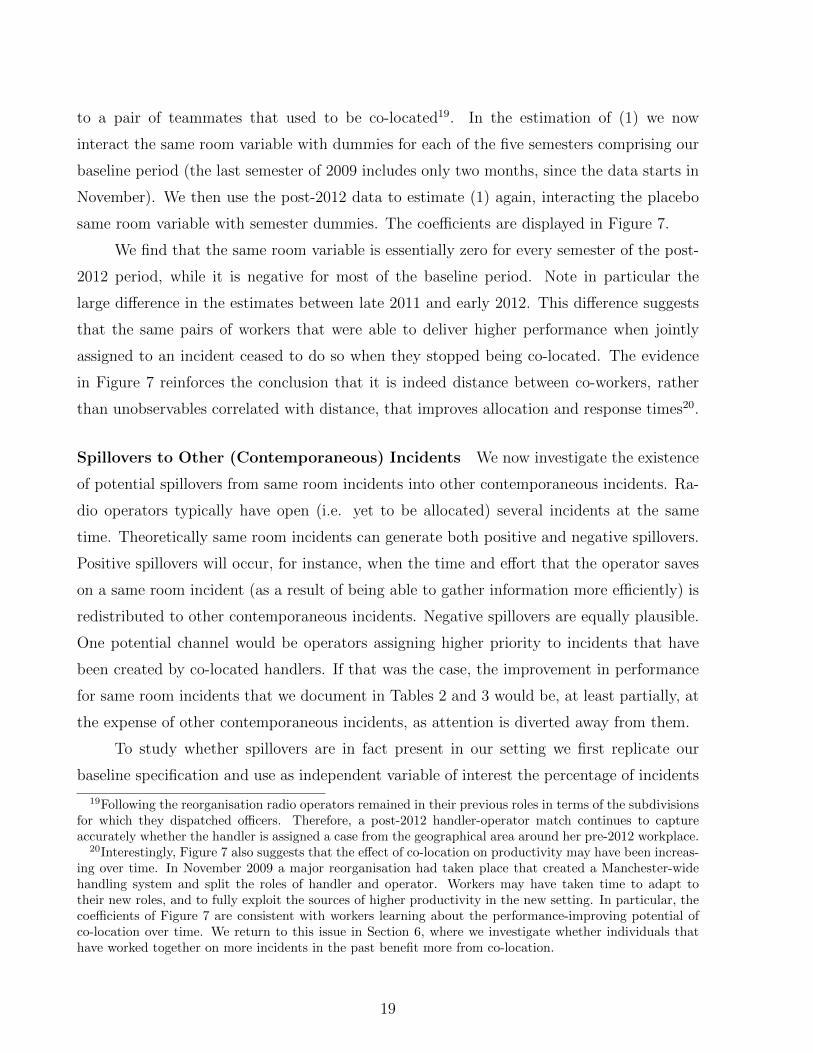
to a pair of teammates that used to be co-located19. In the estimation of (1) we now
interact the same room variable with dummies for each of the five semesters comprising our
baseline period (the last semester of 2009 includes only two months, since the data starts in
November). We then use the post-2012 data to estimate (1) again, interacting the placebo
same room variable with semester dummies. The coefficients are displayed in Figure 7.
We find that the same room variable is essentially zero for every semester of the post-
2012 period, while it is negative for most of the baseline period. Note in particular the
large difference in the estimates between late 2011 and early 2012. This difference suggests
that the same pairs of workers that were able to deliver higher performance when jointly
assigned to an incident ceased to do so when they stopped being co-located. The evidence
in Figure 7 reinforces the conclusion that it is indeed distance between co-workers, rather
than unobservables correlated with distance, that improves allocation and response times20.
Spillovers to Other (Contemporaneous) Incidents We now investigate the existence
of potential spillovers from same room incidents into other contemporaneous incidents. Ra-
dio operators typically have open (i.e. yet to be allocated) several incidents at the same
time. Theoretically same room incidents can generate both positive and negative spillovers.
Positive spillovers will occur, for instance, when the time and effort that the operator saves
on a same room incident (as a result of being able to gather information more efficiently) is
redistributed to other contemporaneous incidents. Negative spillovers are equally plausible.
One potential channel would be operators assigning higher priority to incidents that have
been created by co-located handlers. If that was the case, the improvement in performance
for same room incidents that we document in Tables 2 and 3 would be, at least partially, at
the expense of other contemporaneous incidents, as attention is diverted away from them.
To study whether spillovers are in fact present in our setting we first replicate our
baseline specification and use as independent variable of interest the percentage of incidents
19Following the reorganisation radio operators remained in their previous roles in terms of the subdivisionsfor which they dispatched officers. Therefore, a post-2012 handler-operator match continues to captureaccurately whether the handler is assigned a case from the geographical area around her pre-2012 workplace.
20Interestingly, Figure 7 also suggests that the effect of co-location on productivity may have been increas-ing over time. In November 2009 a major reorganisation had taken place that created a Manchester-widehandling system and split the roles of handler and operator. Workers may have taken time to adapt totheir new roles, and to fully exploit the sources of higher productivity in the new setting. In particular, thecoefficients of Figure 7 are consistent with workers learning about the performance-improving potential ofco-location over time. We return to this issue in Section 6, where we investigate whether individuals thathave worked together on more incidents in the past benefit more from co-location.
19
assigned to the operator that, in the period surrounding the index incident, are same room
incidents. Positive spillovers should lead to a negative coefficient for this variable because, if
same room incidents are easier to deal with, a higher share of those will allow for more time
and effort being available for the index incident. Negative spillovers would instead imply
that valuable attention or resources are diverted away from the index incident when other
incidents are handled in the same room, leading to higher allocation and response times, and
a positive coefficient in this regression21.
We find in Table 4 no evidence of either positive or negative spillovers. Given the
uncertainty about the time horizon on which spillovers might occur, we calculate the inde-
pendent variable at the 60, 30, and 15 minutes time horizon. We find in every case that a
higher share of same room incidents does not translate into different performance for other
contemporaneous incidents.
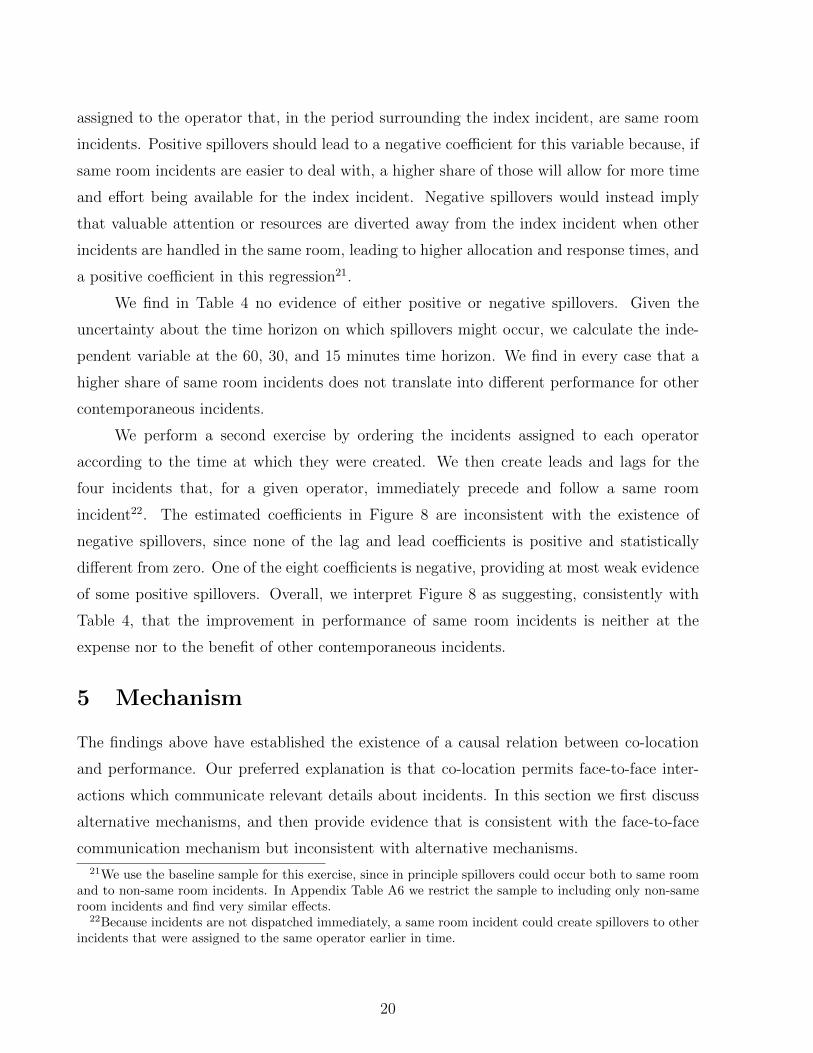
We perform a second exercise by ordering the incidents assigned to each operator
according to the time at which they were created. We then create leads and lags for the
four incidents that, for a given operator, immediately precede and follow a same room
incident22. The estimated coefficients in Figure 8 are inconsistent with the existence of
negative spillovers, since none of the lag and lead coefficients is positive and statistically
different from zero. One of the eight coefficients is negative, providing at most weak evidence
of some positive spillovers. Overall, we interpret Figure 8 as suggesting, consistently with
Table 4, that the improvement in performance of same room incidents is neither at the
expense nor to the benefit of other contemporaneous incidents.
5 Mechanism
The findings above have established the existence of a causal relation between co-location
and performance. Our preferred explanation is that co-location permits face-to-face inter-
actions which communicate relevant details about incidents. In this section we first discuss
alternative mechanisms, and then provide evidence that is consistent with the face-to-face
communication mechanism but inconsistent with alternative mechanisms.
21We use the baseline sample for this exercise, since in principle spillovers could occur both to same roomand to non-same room incidents. In Appendix Table A6 we restrict the sample to including only non-sameroom incidents and find very similar effects.
22Because incidents are not dispatched immediately, a same room incident could create spillovers to otherincidents that were assigned to the same operator earlier in time.
20

Alternative Mechanisms The first alternative channel consists of the handler exerting
more effort in the transmission of the GMPICS electronic information under co-location.
The second alternative channel is similar: the operator might exert more effort in the in-
terpretation of this information, and the subsequent allocation of an officer, for co-located
incidents23.
We can think of two plausible reasons why workers may exert more effort under co-
location, even in the absence of face-to-face communication24. The first reason would be
some type of (silent) psychological effect leading to higher priority assigned to incidents that
will be read, or were written, by a same room co-worker. Given the findings in Columns 3 and
4 of Table 3 this effect should of course be dependent on the within-room distance between
the co-workers. The second potential reason would be handler and operator exerting visual
peer pressure on each other, similarly to the visual pressure among supermarket cashiers
identified by Mas and Moretti (2009).
We regard this second reason as very unlikely, in particular with regards to the handler
exerting peer pressure on the operator, as several features of the institutional setting are
inconsistent with it. Firstly, while handler and operator are ’teammates’, they are not
actually ’peers’. As discussed in Section 2, operators are both more senior and uniquely
responsible for the allocation of the incident, which makes it improbable that they may feel a
lot of pressure from handlers. There is in fact little scope for handlers to even be aware of the
allocation and response times of the incidents that they created, unless they actively search
for them in the GMPICS system. Furthermore, the cognitive and desk-bound activities
of the operator are difficult to monitor visually, especially relatively to manual tasks like
supermarket item checking. For instance, an operator may appear busy by virtue of looking
at her computer screen, while in fact paying little attention to her work. In addition, there
are significant physical barriers (computer monitors, desk screens...) between the workers
in the rooms of our setting. These barriers make it impossible to observe the behaviour of
23The preferential allocation of scarce resources such as police officers to co-located incidents and indetriment of other incidents could also be regarded as an alternative channel. The evidence in Section 4showing the lack of negative spillovers is inconsistent with this alternative channel.
24Note that face-to-face communication could lead to the higher motivation of its receiver (in this case,the radio operator). Storper and Venables (2004) argue persuasively that face-to-face communication canserve as a signal about the importance of a task, thereby stimulating a ’psychological rush’ that leads togreater and better efforts. In our context, it is possible that discussing an incident in person may induce theoperator to devote more time and effort to it, and this channel is not incompatible with the higher abilityto deal with the incident resulting from a richer information set. Similarly, to the extent that the act ofcommunicating face-to-face itself requires effort, it is by construction co-linear with it.
21

all but the closest co-workers, unless a handler actively stands up from her desk. While it
is possible in theory for a handler to stand up and watch over the operator’s shoulder in
silence, we think that is an unlikely possibility.
Evidence on the Handler’s Effort Mechanism The first alternative mechanism con-
sists of the handler communicating better electronically. We now test whether there is any
evidence of the handler being more precise and thorough in the electronic communication
of co-located incidents. We have three good measures of this communication. The first one
is the handler’s creation time: the time elapsed between the handler answering the call and
the creation of the incident in the GMPICS system. Remember that this creation time takes
place before the radio operator is officially informed of the incident’s existence. We expect
that a more thorough and precise electronic communication will require more time devoted
to writing the description of the incident, and probably also to the elicitation of the informa-
tion from the caller. In Column 1 of Table 5 we however replicate our baseline specification
using creation time as dependent variable, and find that it is unaffected by co-location.
As complementary measures of the quality of the electronic communication, we use
the number of characters and number of words in the first line of the description of the
incident25. Unsurprisingly, these two variables are very correlated with each other, even after
conditioning on the baseline set of controls (Appendix Table A8). They are also strongly
correlated with the creation time, suggesting that, despite their coarseness, there is valuable
information in them. In Columns 2 and 3 of Table 5 we find that these variables are not
different for co-located incidents.
To conclude, we find no evidence that the electronic information inputted by handlers
is better or worse for co-located incidents, relative to other incidents. Therefore, higher effort
on the handler’s part does not appear to be an important mechanism in our setting.
Indirect Evidence on the Face-to-Face Communication Mechanism The mecha-
nisms outlined above entail different predictions about the behaviour of the handler after
the incident has been created, in particular with respect to the likelihood that the handler
is ’not ready’ to take a new call. Consider first the alternative mechanism whereby the
25Unfortunately, due to a combination of technical challenges and the extreme confidentiality of thisinformation, we were not able to obtain the full content of these descriptions. The first line of the incidentdescription consists of a maximum of 210 characters, and serves as a quick summary of the nature of theincident. When operators have more than one incident open at one time, they typically only see the firstline of this description, which then plays a role similar to the subject of an email in an inbox.
22
operator exerts more effort for co-located incidents. Handlers are continually monitored by
their supervisors, and are expected to remain at their desks unless there is a reason to leave
them. Therefore, any handler exerting visual pressure on an operator would typically be
doing so from her desk, an activity that is perfectly compatible with being available to take
a new call. Similarly, the notion that operators are psychologically prone to exert more effort
for co-located incidents does not require any change in behaviour on the handler’s part. In
particular, it does not require handlers being more or less willing to take new calls after
creating co-located incidents.
Face-to-face communication, on the other hand, is an activity that typically requires
the handler’s full attention. Being in ’ready’ status while talking to an operator risks having
to either ignore an incoming call (an offence so serious that it is likely to trigger disciplinary
action) or abruptly cut short the discussion of important details. Therefore, a prediction of
the face-to-face communication channel is that, following the creation of co-located incidents,
handlers will be more likely to be in ’not ready’ status. This prediction is not shared by
alternative plausible channels.
In Column 4 of Table 5 we replicate the baseline specification using the length of
the ’Not Ready’ interval following an incident as the dependent variable. The SameRoom
coefficient is 2.5% and statistically significant, suggesting that handlers step away from
their desks (or remain on their desks while being unavailable) for longer periods following
co-located incidents. In Column 5 of Table 5, we repeat this exercise using as dependent
variable a dummy for whether the handler signals her immediate availability to take new
calls or instead takes some ’not ready’ time at all. Again, we find that the likelihood of not
being immediately available is higher for co-located incidents. While there is no conclusive
evidence that they are using this time to communicate in person with the operator, we
interpret this finding as strongly suggestive of face-to-face communication being the main
mechanism through which co-location improves performance.
6 Heterogeneity
In this section we identify characteristics of incidents, teammates and the working environ-
ment that are associated with a higher effect of proximity on performance. We do this for
two reasons. Firstly, the exercise is valuable from a policy perspective. A better under-
standing of the specific circumstances in which co-location has the highest impact can help
23
guide the decisions of organisations searching for the optimal geographical configuration of
its personnel and activities. Secondly, studying the heterogeneity of the effect can provide
additional evidence consistent with the face-to-face communication mechanism.
Characteristics of Incidents We first examine whether the effects from Table 2 are
stronger for some types of incidents, relative to others. We focus on two particularly relevant
characteristics of incidents: their urgency and the complexity of the information required
to understand and describe them. The main hypothesis is that if co-location improves
performance because it enables face-to-face communication, we should find a stronger effect
for complex incidents where a lot of information must be transmitted. In addition to being
intuitive, this hypothesis is consistent with the vast literature arguing that human production
is at a lower risk of being substituted by technology for (cognitive) non-routine tasks, relative
to routine tasks (Acemoglu and Autor, 2011).
We also study empirically the relation between the urgency of an incident and the
effect of co-location on performance. In principle, it is unclear what the sign of this relation
should be. On the one hand, the ability to communicate information quickly might be more
valuable and therefore used more often when an allocation decision needs to be done faster.
On the other hand, in very urgent incidents (e.g. a serious crime in progress) the operator
may not want to wait for many nuanced details and will instead allocate an officer as quickly
as possible. If that is the case, more urgent incidents will be associated with a lower effect
of co-location on allocation time.
Both theoretical concepts, ’urgency’ and ’information intensity’, have elusive empirical
counterparts. The information intensity of incidents is difficult to measure because we un-
fortunately lack access to complete characterisations of the features of every incident in our
dataset. We also lack the full GMIPCS descriptions recorded by handlers, although of course
any classification of an incident reliant on the actions taken by its call handler would risk
confusing the diligence or ability of the handler with the intrinsic features of the incident.
To overcome the measurement challenges above we use information based on generic
incident types to create an indirect measure of information intensity, as follows. We first
classify each incident according to its opening code/grade combination. We then regress
creation time (the time elapsed between the handler answering the call and the creation
of the incident) on every one of the resulting 144 dummies. The fitted values from this
regression, which constitute our measure of (predicted) information intensity, capture how
24

long on average it takes for handlers to extract information from the caller and record it
in GMPICS, for every incident type. Although the measure is undoubtedly coarse, our
interpretation is that incident types with high average creation time should be those where
the amount and complexity of information is typically the largest. We construct our measure
of (predicted) urgency in an equivalent way, this time regressing allocation time on the 144
incident type dummies (naturally, lower average allocation time is interpreted as higher
urgency).
We interact our measures of information intensity and urgency with the same room
dummy in the baseline regression. For ease of interpretation, these measures are entered as
above-median dummies. The estimates are displayed in Table 6. We find first that incident
types of high average information intensity are associated with a higher effect of co-location
on performance26. We also find weaker evidence on the urgency of incidents exacerbating the
effect of co-location. In particular, the estimate for the interaction with urgency is negative,
although statistically significant only in the allocation time regression27.
We interpret the estimates from Table 6 as indicating that co-location does not increase
performance for non-urgent, non-complex incidents. It, however, decreases allocation time
(respectively, response time) by 4% (respectively, 2.7%) for incidents that are above-median
both in their urgency and their information intensity. The estimate on the interaction with
information intensity is, in particular, consistent with the notion that co-location enables an
additional communication channel, leading to higher performance for incidents when a lot
of communication is necessary.
Characteristics of the Working Environment In our second heterogeneity exercise, we
study whether co-location improves performance more when workers have to deal with more
incidents. Our main interest is in the workload of the operator, because it is for operators
that a high number of incoming incidents in their subdivision can start to accumulate,
exerting competing demands on their attention. Our hypothesis is that, if co-location allows
operators to quickly resolve any doubt through face-to-face communication, it should be
26This finding is robust to measuring information intensity with quintiles (Appendix Figure A2) andin parametric (log) format (Appendix Table A4). It is also robust to building the information intensityprediction exclusively with out-of-sample (i.e. pre-November 2009 and post-January 2012) observations(Appendix Table A3).
27Both effects become statistically stronger if information intensity is measured parametrically (AppendixTable A4). However, we find that the effect of co-location does not vary when we use a simpler and coarsermeasure of the urgency of an incident: its grade. Although the effect is stronger for Grade 1 incidents,relative to Grade 2 and Grade 3, the differences are not statistically significant (see Appendix Table A9).
25
more valuable when the time and effort of the operator are scarce, that is, in periods of
higher workload28.
Our measure of the operator’s workload is the number of incidents created in the
subdivision that the operator is overseeing during the hour of the index incident (note that
there is a single operator responsible, at any one time, for a subdivision). For ease of
interpretation, we enter this measure in the baseline regression as an above-median dummy,
both by itself and interacted with the same room variable.
The results are displayed in Table 7. We first find that allocation and response times are
slower when the operator is busier, as expected. Our main interest is in the estimate of the
interaction between the same room variable and the high operator workload dummy, which
we find to be negative and statistically significant. The estimated coefficients indicate that
co-location reduces allocation time (respectively, response time) by 1.1% (respectively, .8%)
during periods of low operator workload, but 2.9% (respectively, 2%) during periods of high
workload. This finding lends support to our hypothesis that the benefit of communicating
personally with the handler is higher when the operator is more pressured for time and needs
to gather information more quickly29.
Characteristics of the Workers We now examine whether the effect of co-location on
performance is stronger when the teammates share the same age and gender, and have worked
together more often in the past. We expect this to be the case, for two reasons. Firstly,
workers of a similar background (or more familiar with each other) may feel more likely to
initiate the face-to-face communication exchanges that transmit information regarding an
incident. This is because they may be more likely to sit close to each other, or, conditional
on the within-room distance, they may be more likely to leave their desk and talk to each
other. Secondly, in person communication may also be more efficient among these types of
28By contrast, our understanding of the institutional environment is that the notion of being ’pressured fortime’ is less meaningful for handlers. Handlers deal with incidents sequentially and share the responsibilityof responding to incoming calls with a large number of colleagues (since every handler can handle incidentsfrom every Manchester area). Together with the fact that handlers are not responsible for the allocation ofofficers to incidents, this implies that we do not have a strong hypothesis about the relation between ourmeasure below of handler workload and the effect of co-location on performance
29Our measure of the handler workload is very coarse, mostly because as discussed earlier, the notion thathandlers are busier in some periods relative to others is not clear-cut. We use the (above-median dummy ofthe) number of incoming calls during the index hour, divided by the number of available handlers. Becausethis variable is defined at the Manchester-wide level, it is absorbed in the baseline regression by the hourfixed effect. We find in Table 7 that the coefficient on the interaction with the same room variable is smallerin magnitude and only weakly statistically significant.
26
workers30.
In Table 8 we display estimates of our baseline specification, where we add a same
gender dummy, the (log of the) difference in age, and the (log of the) number of past
incidents in which handler and operator worked together. We further interact these variables
with the same room variable. To isolate the effect of the handler/operator pair experience,
the specification controls for the individual experiences of handler and operator and their
interactions with the same room variable.
Our main finding is that the estimates for the three interactions of interest are statis-
tically significant and of the expected sign. For instance, the effect of co-location is 2.9%
when handler and operator share the same gender, but only 1.3% when they do not. A 10%
increase in the age difference (respectively, number of past interactions) between handler and
operator decreases the effect of co-location on performance by 2.6% (respectively, it increases
it by 2.2%). These findings are consistent with the notion that face-to-face communication,
and therefore co-location, leads to higher performance among co-workers that know and
understand each other better31. On the other hand, the non-significant interactions with
individual experience suggest that, unless it is specific to the teammate in this particular
incident, individual experience does not by itself allow workers to exploit better the potential
advantages of co-location.
7 The Cost of Face-To-Face Communication
Section 5 has shown that handlers spend 2.5% more time unavailable to take new calls
following the creation of co-located incidents. This unavailability imposes a cost on the
organisation, as it contributes to incoming calls being answered with a longer delay. In this
30Storper and Venables (2004) discuss how the transmission of uncodifiable information (at which face-to-face communication excels) depends on a ’communication infrastructure’ that is specific to a sender-receiverpair. This infrastructure is likely improved through learning by doing, leading to more efficient face-to-facecommunication as the teammates accumulate experience with each other. It is also likely more efficientamong demographically proximate teammates. Alternatively, we could interpret demographic proximity asa proxy for the existence of friendship ties between two co-workers (Bandiera, Barankay and Rasul, 2010). Ifworkers are more willing to and effective at communicating face-to-face with their friends, a similar predictionfor the relation between demographic proximity and the effect of co-location on performance would arise.
31We find qualitatively similar results when age and past interactions are measured as above-mediandummies (see Appendix Table A5). While not the focus of this paper it is interesting to note that, even whenteammates are not co-located, a similar age and a longer experience with each other are still associated withhigher performance (although this is not the case for the same gender variable). A potential explanationof these estimates is that, given the complexity of the information that must often be transmitted, evenelectronic communication is more efficient among these types of teammates.
27

section we provide a framework to measure the opportunity cost of the time spent in face-
to-face communication, so that it can be compared to its benefit. We then compute this cost
in our organisation.
Theoretical Framework We formalise the process by which calls to the police arise, join
the call queue and are answered. Assume a population of individuals (of normalised size
1) who can potentially call the police. Every individual can be in one out of three states:
dormant (waiting for an incident to happen), in the call queue, or on the phone with the
handler. xi, i = 1, 2, 3 denotes the share of individuals in each state. H < 1 handlers are on
duty to answer calls.
Transitions between states are as follows. Dormant callers join the queue at an exoge-
nous rate a per unit of time. All callers must spend at least one unit of time there before
being assigned a handler. When a call is being answered, it terminates (and the caller re-
joins the dormant pool) at a constant rate υ (with 1/υ being the average duration of calls).
The number of handlers that become available to take new calls per unit of time is υx3. The
total number of calls answered per unit of time is then min{υx3, x2}, since it is limited both
by the number of newly available handlers and by the size of the call queue.
Using this simple framework we can show that the size of the call queue evolves over
time depending on the difference between the inflow (the number of dormant individuals who
encounter an incident) and the outflow (the number of queued calls answered by handlers):
∆x2
∆t= a (1− x2 − x3)−min{υx3, x2} (3)
Similarly,∆x3
∆t= min{υx3, x2} − υx3 (4)
If υx3 < x2, then it must be that all handlers are busy and x3 = H. Combining
equations (3) and (4) and assuming steady state, we compute the time in the queue for
incoming calls, q∗, as:
q∗ =
{(1−H)υH− 1
aif H < a
a+υ+aυ
1 if H ≥ aa+υ+aυ
(5)
This framework generates the following predictions. First, incoming calls are answered
immediately when there are many handlers (H high), few dormant calls become actual calls
(a low) and calls are brief (υ high). Secondly, ∂q∗
∂(1/υ)> 0 so an increase in average call length
leads to longer queuing times. Lastly, this effect is lower when the number of handlers is
28
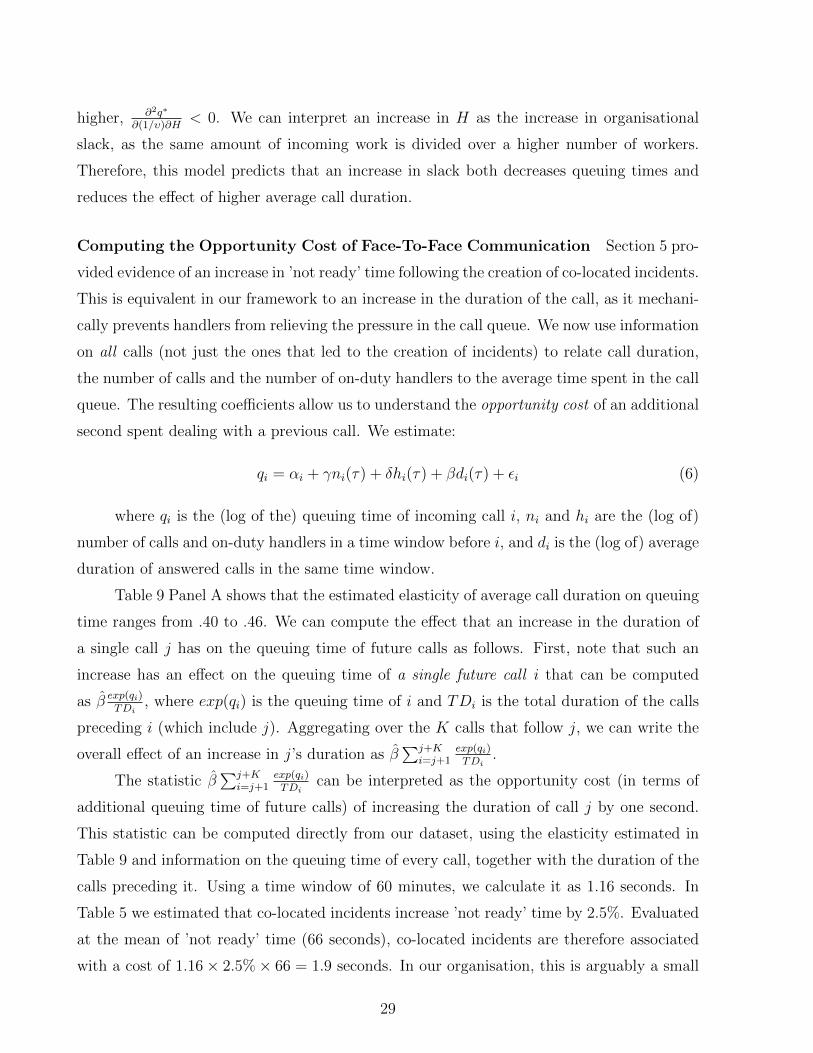
higher, ∂2q∗
∂(1/υ)∂H< 0. We can interpret an increase in H as the increase in organisational
slack, as the same amount of incoming work is divided over a higher number of workers.
Therefore, this model predicts that an increase in slack both decreases queuing times and
reduces the effect of higher average call duration.
Computing the Opportunity Cost of Face-To-Face Communication Section 5 pro-
vided evidence of an increase in ’not ready’ time following the creation of co-located incidents.
This is equivalent in our framework to an increase in the duration of the call, as it mechani-
cally prevents handlers from relieving the pressure in the call queue. We now use information
on all calls (not just the ones that led to the creation of incidents) to relate call duration,
the number of calls and the number of on-duty handlers to the average time spent in the call
queue. The resulting coefficients allow us to understand the opportunity cost of an additional
second spent dealing with a previous call. We estimate:
qi = αi + γni(τ) + δhi(τ) + βdi(τ) + εi (6)
where qi is the (log of the) queuing time of incoming call i, ni and hi are the (log of)
number of calls and on-duty handlers in a time window before i, and di is the (log of) average
duration of answered calls in the same time window.
Table 9 Panel A shows that the estimated elasticity of average call duration on queuing
time ranges from .40 to .46. We can compute the effect that an increase in the duration of
a single call j has on the queuing time of future calls as follows. First, note that such an
increase has an effect on the queuing time of a single future call i that can be computed
as β̂ exp(qi)TDi
, where exp(qi) is the queuing time of i and TDi is the total duration of the calls
preceding i (which include j). Aggregating over the K calls that follow j, we can write the
overall effect of an increase in j’s duration as β̂∑j+K
i=j+1exp(qi)TDi
.
The statistic β̂∑j+K
i=j+1exp(qi)TDi
can be interpreted as the opportunity cost (in terms of
additional queuing time of future calls) of increasing the duration of call j by one second.
This statistic can be computed directly from our dataset, using the elasticity estimated in
Table 9 and information on the queuing time of every call, together with the duration of the
calls preceding it. Using a time window of 60 minutes, we calculate it as 1.16 seconds. In
Table 5 we estimated that co-located incidents increase ’not ready’ time by 2.5%. Evaluated
at the mean of ’not ready’ time (66 seconds), co-located incidents are therefore associated
with a cost of 1.16× 2.5%× 66 = 1.9 seconds. In our organisation, this is arguably a small
29

cost, when compared with the decreases in allocation and response times of 76 and 104
seconds respectively that we estimated in Section 432.
Motivated by our theoretical framework, we expect the opportunity cost of face-to-face
communication to be lower when organisational slack, as captured by the relation between
on duty handlers and incoming calls, is higher. In Panels B and C we repeat the exercise
in Panel A for the subsamples of calls with high and low organizational slack. Consistently
with the prediction that increasing a call’s duration is less costly when the relative number
of handlers is higher, we find a higher elasticity in Panel C (high slack) and a lower in Panel
B (low slack). Replicating the analysis above, we calculate costs associated with co-location
of 3.2 (respectively 1.1) seconds, for periods of low (respectively high) slack.
Overall, our analysis highlights the importance of measuring the opportunity cost of
the time engaged in face-to-face communication, as well as the dependence of this cost on
the slack characterising the organisation. In our setting, we find this cost to be much lower
than the benefit.
8 Conclusion
This paper has provided evidence of a causal relation between proximity and performance, in
a teamwork setting characterised by the communication of complex information. A series of
additional tests point towards face-to-face communication as the most important mechanism.
We have also provided additional evidence on the heterogeneity of the main result and
highlighted that face-to-face communication has opportunity costs, as well as benefits. We
are not aware of any existing study studying these questions that is comparable in terms of
the detail of analysis and the credibility of the estimated effects.
One immediate policy prescription for the specific organisation that we study is in terms
of supervisors’ awareness of the benefits of communication between co-workers. Discussions
between handler and operator following the creation of incidents were not encouraged and
were even frowned upon by some supervisors. Because the cost of communication is orders
of magnitude smaller than the benefit, one implication is that, in our specific context, there
may be too little communication among co-located workers rather than too much. This
32The benefits and costs associated with co-location affect different types of calls. The costs are for theaverage call, including those which do not lead to incidents and those leading to incidents that are notdeemed to merit a response within four hours of the incident creation. The benefits are instead concentratedon the calls that are deemed important enough to be assigned to a radio operator.
30

indicates that a change of norms and culture to encourage more communication could be
potentially enhancing. More generally, however, the fact that the cost of communication is
not zero indicates that the limitations on the information sets of decision-makers highlighted
by Hayek (1945) and Arrow (1974) are unlikely to be fully overcome.
Our findings provide direct guidance to managers organising the geographical distribu-
tion of activities. Most directly, the evidence casts doubt on the appropriateness of telecom-
muting policies in settings where workers must communicate complex information to each
other. Our results further suggest that telecommuting may be particularly unsuitable (and
co-location of teammates particularly valuable) when activities are informationally demand-
ing, workers are homogenous and likely to be busy, and teams are likely to be stable.
There may be additional implications for recruitment policy. A large literature in
organisational behaviour is concerned with the advantages and challenges of diversity in
the workplace (Shore et al., 2009). In economics, a parallel body of work has studied
the differences in productivity between homogeneous and heterogeneous teams (Hamilton
et al. 2012, Hjort 2014, Lyons 2016), a question of clear recruitment policy implications.
Our results indicate that the relative benefits of homogeneity depend on the geographical
configuration of activities. In particular, a more homogeneous organisation is most valuable
when workers are likely to be based in the same physical space.
Our results also identify a distinct driver of firm-specific human capital accumulation
(Topel, 1991), with implications for staff turnover and team-rotation policies. Consistently
with Hayes et al. (2006) and Jaravel et al. (2016), we find in Section 6 that workers
accumulate human capital that is specific to a particular co-worker. Importantly, our finding
is however that this capital is most valuable (or more rapidly accumulated) among co-located
workers. It follows that managers should be wary of the team disruption induced by turnover
particularly when the team members work in close proximity.
31

FIGURES
32

33
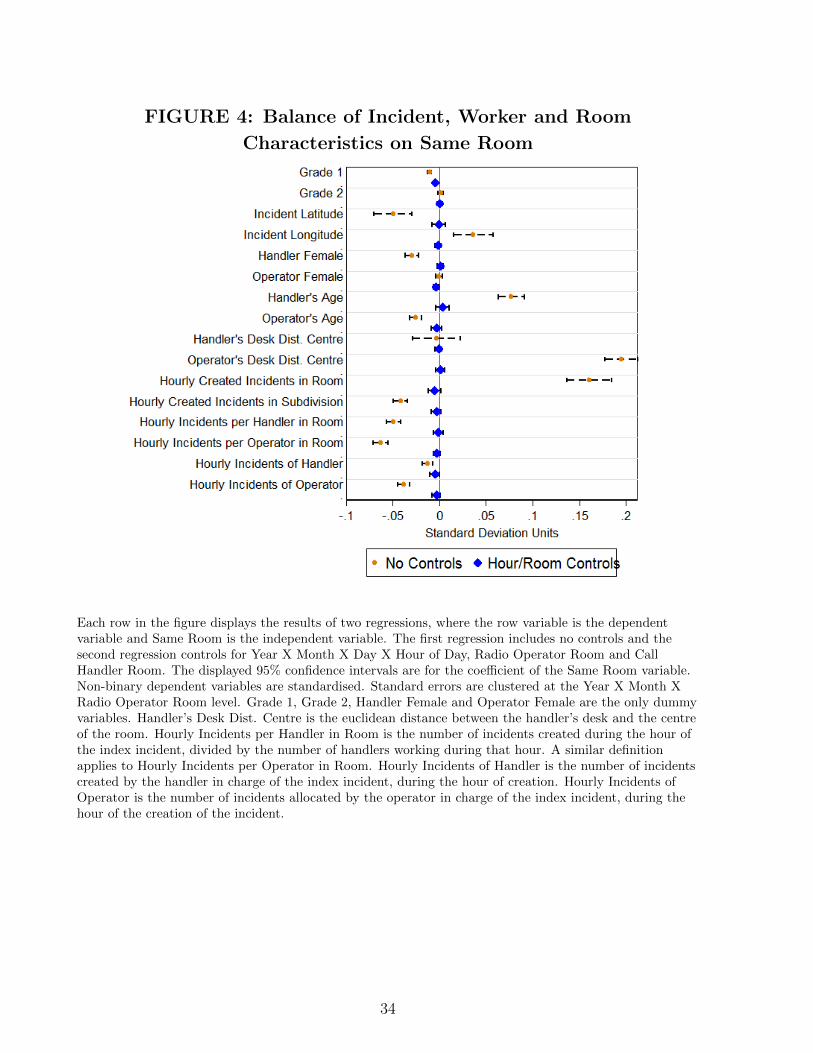
FIGURE 4: Balance of Incident, Worker and Room
Characteristics on Same Room
Each row in the figure displays the results of two regressions, where the row variable is the dependentvariable and Same Room is the independent variable. The first regression includes no controls and thesecond regression controls for Year X Month X Day X Hour of Day, Radio Operator Room and CallHandler Room. The displayed 95% confidence intervals are for the coefficient of the Same Room variable.Non-binary dependent variables are standardised. Standard errors are clustered at the Year X Month XRadio Operator Room level. Grade 1, Grade 2, Handler Female and Operator Female are the only dummyvariables. Handler’s Desk Dist. Centre is the euclidean distance between the handler’s desk and the centreof the room. Hourly Incidents per Handler in Room is the number of incidents created during the hour ofthe index incident, divided by the number of handlers working during that hour. A similar definitionapplies to Hourly Incidents per Operator in Room. Hourly Incidents of Handler is the number of incidentscreated by the handler in charge of the index incident, during the hour of creation. Hourly Incidents ofOperator is the number of incidents allocated by the operator in charge of the index incident, during thehour of the creation of the incident.
34

35

36

37
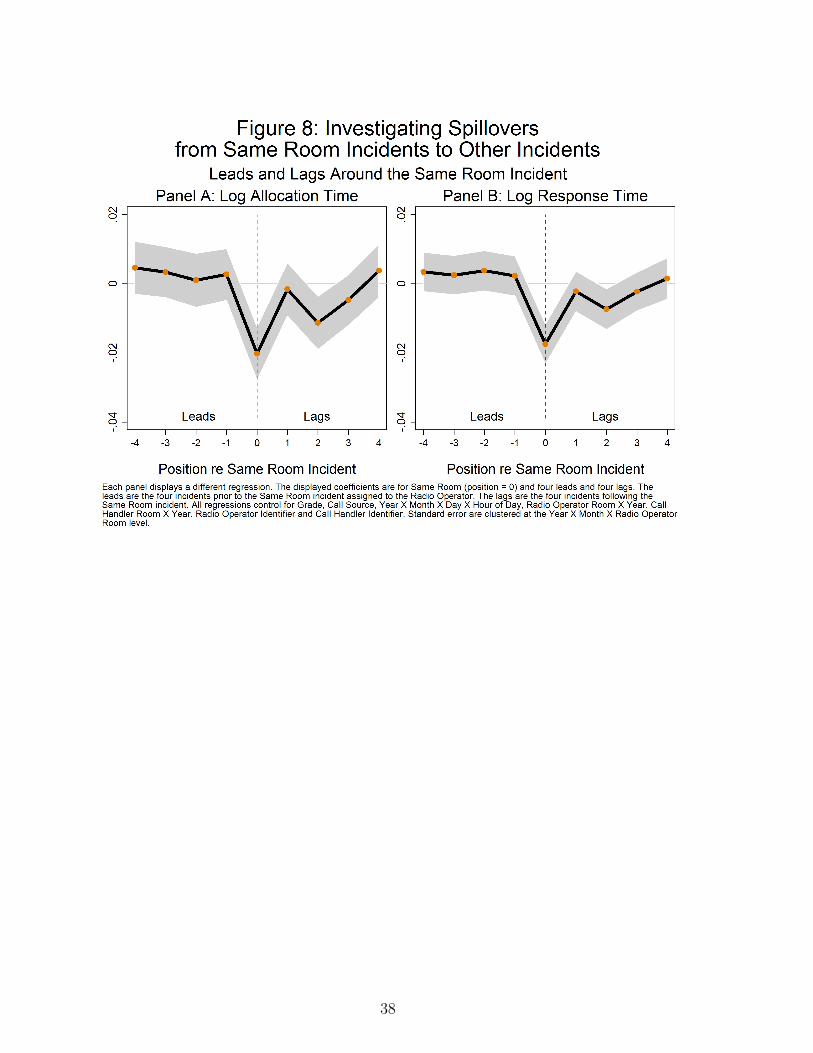
38

TABLES
TABLE 1: SUMMARY STATISTICS
Mean Median SD Min MaxAllocation Time (min.) 64.124 4.583 276.568 0 21331.78On Target Allocation .748 1 .434 0 1Response Time (min.) 87.484 19.933 311.166 .05 21391.92On Target Response .877 1 .328 0 1Creation Time (min.) 3.889 2.85 4.946 0 219.533Grade 1 .197 0 .398 0 1Grade 2 .432 0 .495 0 1Same Room .229 0 .42 0 1Distance inside Room 4.34 4.243 1.782 .5 11.885Handler Female .27 0 .444 0 1Operator Female .498 0 .5 0 1Handler’s Age 38.406 38 11.471 19 64Operator’s Age 45.15 46 8.243 19 66
This Table reports summary statistics for the baseline sample (N=957137). An observation is an incident. Allocation time is thetime between the creation of the incident by the call handler and the allocation of a police officer by the radio operator. Responsetime is the time between creation of the incident and the police officer arriving at the scene. On target allocation (respectively,response) is a dummy taking value one if the allocation time falls wihin the UK Home Office targets, which are 2, 20 and 120minutes (respectively 15, 60 and 240 minutes) for Grades 1, 2 and 3. Creation Time is the time between the handler answering thecall and the creation of the incident in GMPICS. Grade 1 and Grade 2 are dummies for the grade of the incident. Same Room isa dummy when handler and operator are located in the same room. Distance inside the room is the euclidean distance betweenthe handler and the radio operator desks. This variable is defined in this table only when same room is equal to one (N=219184).Handler female and operator female are dummy variables.
TABLE 2: BASELINE ESTIMATES
(1) (2) (3) (4) (5)Dep. Log Alloc. Log Response On Target On Target Cleared
Variable Time Time Alloc. Response
Same Room -.02*** -.017*** .004*** .002*** -.001(.004) (.003) (.001) (.001) (.003)
This table displays estimates of OLS regressions of five different performance measures on whether the call handler and the radiooperator are located in the same room. The sample includes all incidents received by the GMP between November 2009 andDecember 2011 (N=957137). In Column (1) the performance variable is the log of the allocation time (i.e. the time betweenthe creation of the incident by the call handler and the allocation of a police officer by the radio operator). In Column (2) theperformance variable is the log of the response time (i.e. the time between the creation of the incident and the police officer arrivingat the scene). In Columns (3) and (4) the dependent variables are dummy variables taking value one if allocation and response timesfall within the UK Home Office targets, respectively. The target response times for Grades 1, 2 and 3 are 15, 60 and 240 minutes,respectively. The target allocation times are 2, 20 and 120 minutes. In Column (5) the dependent variable is a dummy taking valueone if the crime was cleared. In Column (5) the sample includes only incidents that the police classified as crimes (N=156550). Allregressions include indicators for Grade, Call Source, Year X Month X Day X Hour of Day, Radio Operator Room, Call HandlerRoom, Radio Operator and Call Handler. Standard errors are clustered at the Year X Month X Radio Operator Room level.
39

TABLE 3: HETEROGENEITY OF SAME ROOMBY DISTANCE INSIDE ROOM
Individual F.E. Pair F.E.
(1) (2) (3) (4)Dep. Variable Log Alloc. Log Response Log Alloc. Log Response
Time Time Time Time
Same Room -.049*** -.035*** - -(.012) (.01) - -
Same Room .026*** .018*** .027*** .017**X Log Distance (.009) (.007) (.01) (.008)
This table displays estimates of OLS regressions of allocation time and response time on whether the call handlerand the radio operator are located in the same room, interacted with the distance between their desks when theyare in the same room. The sample includes all incidents received by the GMP between 2009 and 2012 (N=957137).The distance between their desks is calculated as the euclidean distance in the floorplans provided by the GMP.All regressions include indicators for Grade, Call Source, Year X Month X Day X Hour of Day, Radio OperatorRoom X Year and Call Handler Room X Year. Columns (1) and (2) also include Radio Operator and Call HandlerIdentifiers. Columns (3) and (4) include Radio Operator/Call Handler Pair Identifiers. Standard errors are clusteredat the Year X Month X Radio Operator Room level.
TABLE 4: INVESTIGATING SPILLOVERSTO OTHER INCIDENTS, BY SAME ROOM INCIDENTS
Spillovers by Same Room Incidents during Period:
60 min. 30 min. 15 min.
(1) (2) (3) (4) (5) (6)Dependent LogAlloc LogResp LogAlloc LogResp LogAlloc LogResp
Variable Time Time Time Time Time Time
% Same Room .005 .004 .006 .007 .009 .007Incidents Received (.005) (.004) (.006) (.004) (.007) (.005)
by Operator
This table investigates potential spillovers from Same Room incidents into other contemporaneous incidents. The dependentvariables in the OLS regressions are log of allocation time and log of response time. The independent variable is the percentageof incidents during the index incident time period for which the call handler and the radio operator were located in the sameroom, excluding the index incident. In Columns (1) and (2) the period comprises of 60 minutes (respectively, 30 minutes forcolumns (3) and (4) and 15 minutes for columns (5) and (6)). All regressions include indicators for Grade, Call Source, Year XMonth X Day X Hour of Day, Radio Operator Room, Call Handler Room, Radio Operator and Call Handler. The regressionsalso include indicators for whether there were no calls received by the Radio Operator during the time period. Standard errorsare clustered at the Year X Month X Radio Operator Room level.
40

TABLE 5: INVESTIGATING EFFECTSON OTHER ACTIONS BY THE HANDLER
(1) (2) (3) (4) (5)Dep.Var. Log Creation Log Number Log Number Log Not Not
Time of Characters of Words Ready Ready>0
Same Room .00446 -.0004 -.00028 .0252*** .00447**(.00326) (.00138) (.0015) (.00927) (.00201)
This table displays estimates of OLS regressions of three actions by the handler prior to creating the incident, on whether the callhandler and the radio operator are located in the same room. The sample includes all incidents received by the GMP betweenNovember 2009 and December 2011. In Column (1) the dependent variable is the log of the creation time (i.e. the time betweenthe handler answering the call and the creation of the incident). In Column (2) the dependent variable is the number of charactersin the first line of the description of the incident (maximum number of characters = 210). In Column (3) the dependent variableis the number of words in the first line of the description of the incident. In Column (4) the dependent variable is the log of thenot ready time following the creation of the incident. In Column (5) the dependent variable is a dummy for whether the not readytime takes value bigger than zero. All regressions include indicators for Grade, Call Source, Year X Month X Day X Hour of Day,Radio Operator Room, Call Handler Room, Radio Operator and Call Handler. Standard errors are clustered at the Year X MonthX Radio Operator Room level.
TABLE 6: HETEROGENEITY OF SAME ROOMBY INCIDENT CHARACTERISTICS
(1) (2)Dep. Variable Log Alloc. Log Response
Time Time
Same Room .001 -.001(.008) (.006)
Same Room X Urgent -.019*** -.007(.008) (.006)
Same Room X Information Intensive -.021*** -.02***(.008) (.006)
This table displays estimates of OLS regressions of allocation and response time on the Same Roomdummy, interacted in measures of the urgency and information intensity of an incident. To computethe information intensity variable we use the sample from 2008 to 2014 and regress the creation time(i.e. the time between the handler answering the call and the creation of the incident) on the openingcode/grade indicators. We then assign to every opening code/grade incident type its predicted creationtime, and label an incident type as being information intensive if its predicted creation time is abovethe median. To compute the urgency variable, we do a similar exercise using allocation time insteadof creation time. All regressions also include indicators for Call Source, Year X Month X Day X Hourof Day, Radio Operator Room, Call Handler Room, Radio Operator and Call Handler, and openingcode/grade indicators. Standard errors are clustered at the Year X Month X Radio Operator Roomlevel.
41

TABLE 7: HETEROGENEITY OF SAME ROOMBY WORKER WORKLOAD
(1) (2)Dep. Variable Log Alloc. Log Response
Time Time
Same Room -.011* -.008*(.006) (.004)
Same Room X High Operator Workload -.018** -.012*(.008) (.006)
Same Room X High Handler Workload -.006 -.01*(.008) (.006)
High Operator Workload .128*** .046***(.005) (.004)
This table displays estimates of OLS regressions of allocation and response time on the Same Roomdummy, interacted with measures of the workload of the operator and handler. To compute the operatorworkload measure, we use the number of incidents created in the operator’s subdivion during the indexhour. To compute the handler workload measure, we use the number of Manchester-wide incidentsduring the index hour, divided by the number of handlers on duty during that hour. The variables inthe regression are dummies taking value one when the workload is above the sample median. We reportthe uninteracted operator workload measure. The uninteracted handler workload measure is absorbedby the Year X Month X Day X Hour of Day fixed effects. All regressions also include indicators forCall Source, Year X Month X Day X Hour of Day, Radio Operator Room, Call Handler Room, RadioOperator and Call Handler. Standard errors are clustered at the Year X Month X Radio Operator Roomlevel.
42
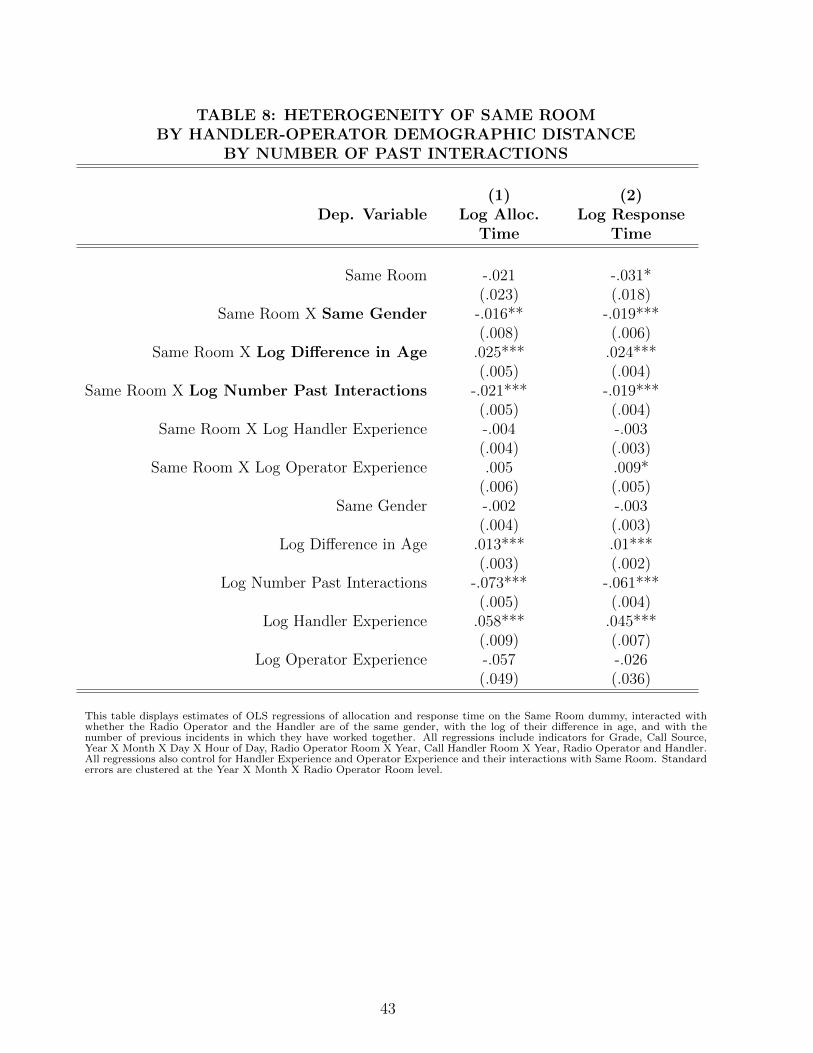
TABLE 8: HETEROGENEITY OF SAME ROOMBY HANDLER-OPERATOR DEMOGRAPHIC DISTANCE
BY NUMBER OF PAST INTERACTIONS
(1) (2)Dep. Variable Log Alloc. Log Response
Time Time
Same Room -.021 -.031*(.023) (.018)
Same Room X Same Gender -.016** -.019***(.008) (.006)
Same Room X Log Difference in Age .025*** .024***(.005) (.004)
Same Room X Log Number Past Interactions -.021*** -.019***(.005) (.004)
Same Room X Log Handler Experience -.004 -.003(.004) (.003)
Same Room X Log Operator Experience .005 .009*(.006) (.005)
Same Gender -.002 -.003(.004) (.003)
Log Difference in Age .013*** .01***(.003) (.002)
Log Number Past Interactions -.073*** -.061***(.005) (.004)
Log Handler Experience .058*** .045***(.009) (.007)
Log Operator Experience -.057 -.026(.049) (.036)
This table displays estimates of OLS regressions of allocation and response time on the Same Room dummy, interacted withwhether the Radio Operator and the Handler are of the same gender, with the log of their difference in age, and with thenumber of previous incidents in which they have worked together. All regressions include indicators for Grade, Call Source,Year X Month X Day X Hour of Day, Radio Operator Room X Year, Call Handler Room X Year, Radio Operator and Handler.All regressions also control for Handler Experience and Operator Experience and their interactions with Same Room. Standarderrors are clustered at the Year X Month X Radio Operator Room level.
43

TABLE 9: OPPORTUNITY COSTOF HIGHER CALL DURATION
(1) (2) (3)Dep. Var. = 15 min. 30 min. 60 min.
Log Queuing Time Window Window Window
Panel A: All
Log Calls .579*** .583*** .557***(.003) (.004) (.004)
Log Handlers -.513*** -.514*** -.488***(.004) (.004) (.004)
Log Avg Call Duration .46*** .457*** .4***(.005) (.005) (.006)
Panel B: High Organisational Slack
Log Calls .445*** .464*** .399***(.005) (.006) (.006)
Log Handlers -.422*** -.435*** -.353***(.006) (.007) (.007)
Log Avg Call Duration .349*** .362*** .342***(.005) (.006) (.007)
Panel C: Low Organisational Slack
Log Calls .846*** .766*** .611***(.007) (.008) (.008)
Log Handlers -.625*** -.568*** -.451***(.007) (.008) (.008)
Log Avg Call Duration .642*** .605*** .472***(.008) (.009) (.011)
This table displays estimates of OLS regressions of queuing time on measures of organisational slackand average call duration in the period preceding the start of the call. We estimate the effectsseparately at 15, 30 and 60 minutes periods before the call. High organisational slack is defined asperiods during which the number of calls per handler was below the median. The sample includes allcalls received by the GMP during the second semester of 2011. N=908945 for panel A, N=454077 forpanel B and N=454868 for panel C. All regressions include an indicator for whether the call reachedthe GMP through an emergency line.
44
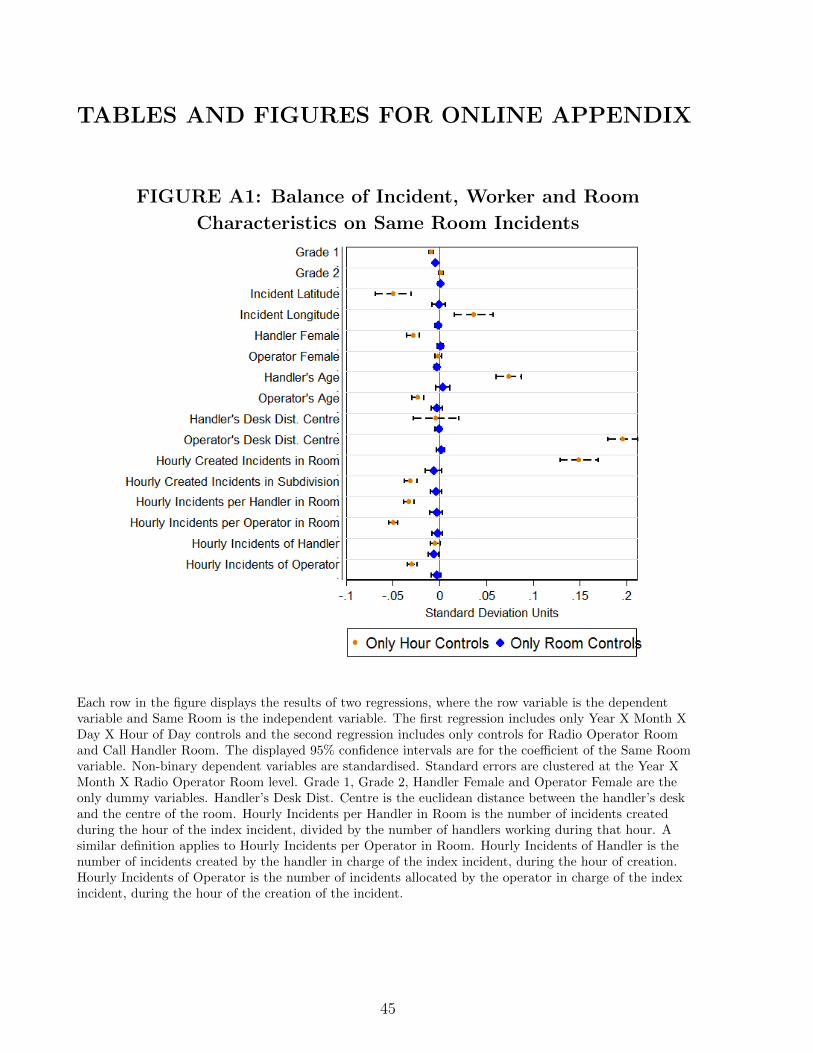
TABLES AND FIGURES FOR ONLINE APPENDIX
FIGURE A1: Balance of Incident, Worker and Room
Characteristics on Same Room Incidents
Each row in the figure displays the results of two regressions, where the row variable is the dependentvariable and Same Room is the independent variable. The first regression includes only Year X Month XDay X Hour of Day controls and the second regression includes only controls for Radio Operator Roomand Call Handler Room. The displayed 95% confidence intervals are for the coefficient of the Same Roomvariable. Non-binary dependent variables are standardised. Standard errors are clustered at the Year XMonth X Radio Operator Room level. Grade 1, Grade 2, Handler Female and Operator Female are theonly dummy variables. Handler’s Desk Dist. Centre is the euclidean distance between the handler’s deskand the centre of the room. Hourly Incidents per Handler in Room is the number of incidents createdduring the hour of the index incident, divided by the number of handlers working during that hour. Asimilar definition applies to Hourly Incidents per Operator in Room. Hourly Incidents of Handler is thenumber of incidents created by the handler in charge of the index incident, during the hour of creation.Hourly Incidents of Operator is the number of incidents allocated by the operator in charge of the indexincident, during the hour of the creation of the incident.
45
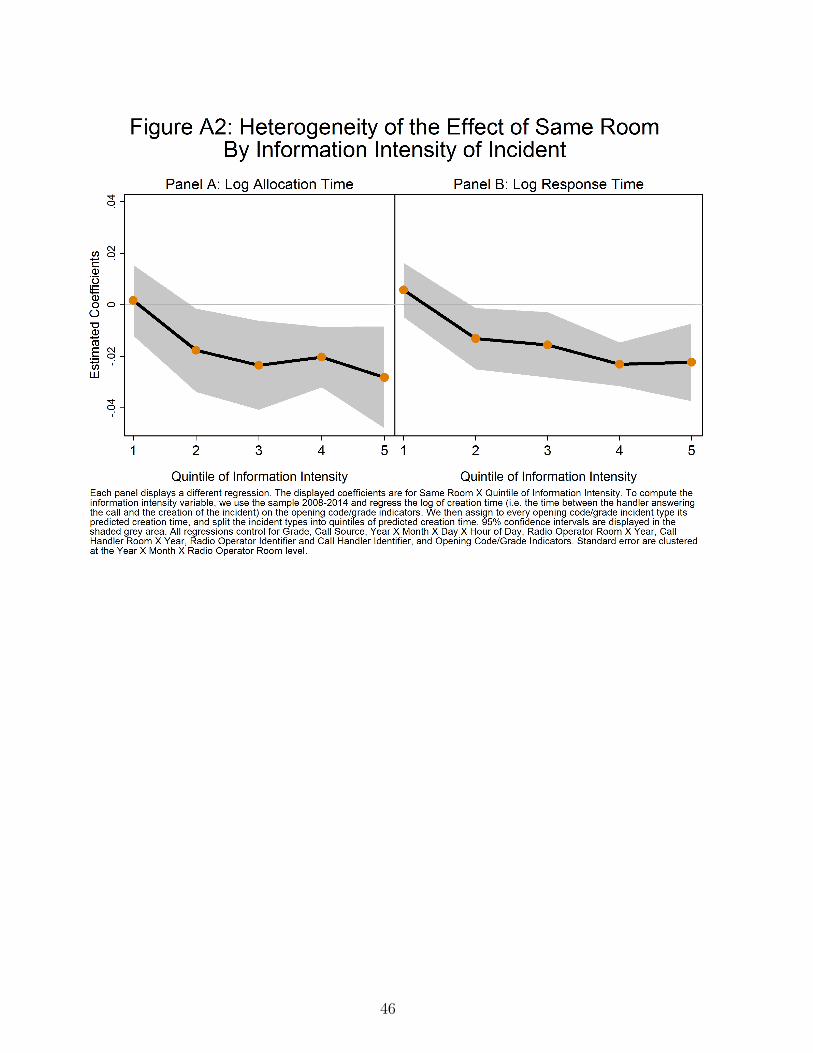
46
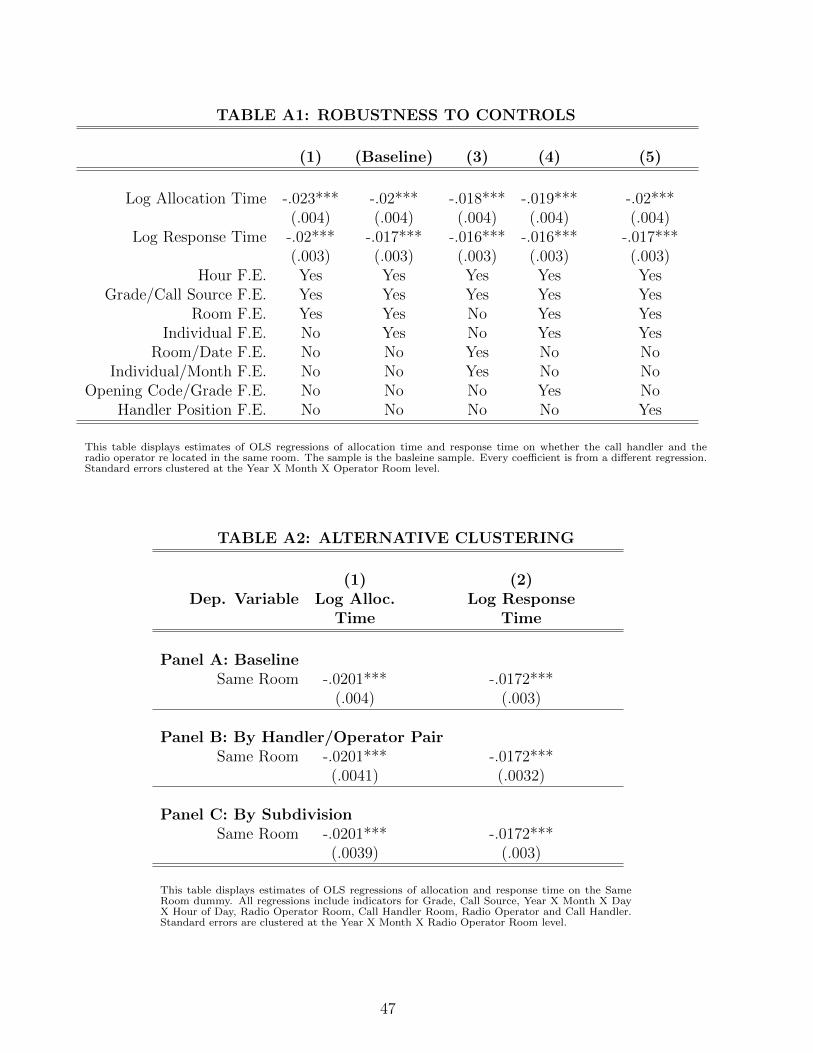
TABLE A1: ROBUSTNESS TO CONTROLS
(1) (Baseline) (3) (4) (5)
Log Allocation Time -.023*** -.02*** -.018*** -.019*** -.02***(.004) (.004) (.004) (.004) (.004)
Log Response Time -.02*** -.017*** -.016*** -.016*** -.017***(.003) (.003) (.003) (.003) (.003)
Hour F.E. Yes Yes Yes Yes YesGrade/Call Source F.E. Yes Yes Yes Yes Yes
Room F.E. Yes Yes No Yes YesIndividual F.E. No Yes No Yes Yes
Room/Date F.E. No No Yes No NoIndividual/Month F.E. No No Yes No No
Opening Code/Grade F.E. No No No Yes NoHandler Position F.E. No No No No Yes
This table displays estimates of OLS regressions of allocation time and response time on whether the call handler and theradio operator re located in the same room. The sample is the basleine sample. Every coefficient is from a different regression.Standard errors clustered at the Year X Month X Operator Room level.
TABLE A2: ALTERNATIVE CLUSTERING
(1) (2)Dep. Variable Log Alloc. Log Response
Time Time
Panel A: BaselineSame Room -.0201*** -.0172***
(.004) (.003)
Panel B: By Handler/Operator PairSame Room -.0201*** -.0172***
(.0041) (.0032)
Panel C: By SubdivisionSame Room -.0201*** -.0172***
(.0039) (.003)
This table displays estimates of OLS regressions of allocation and response time on the SameRoom dummy. All regressions include indicators for Grade, Call Source, Year X Month X DayX Hour of Day, Radio Operator Room, Call Handler Room, Radio Operator and Call Handler.Standard errors are clustered at the Year X Month X Radio Operator Room level.
47
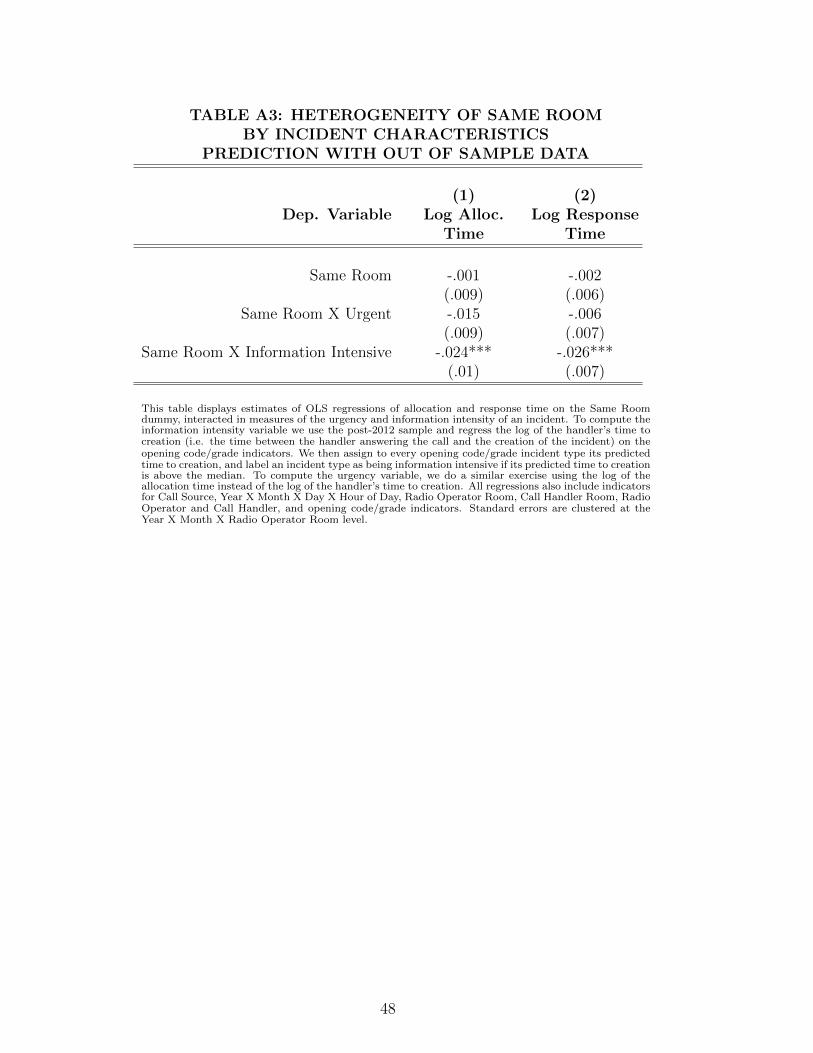
TABLE A3: HETEROGENEITY OF SAME ROOMBY INCIDENT CHARACTERISTICS
PREDICTION WITH OUT OF SAMPLE DATA
(1) (2)Dep. Variable Log Alloc. Log Response
Time Time
Same Room -.001 -.002(.009) (.006)
Same Room X Urgent -.015 -.006(.009) (.007)
Same Room X Information Intensive -.024*** -.026***(.01) (.007)
This table displays estimates of OLS regressions of allocation and response time on the Same Roomdummy, interacted in measures of the urgency and information intensity of an incident. To compute theinformation intensity variable we use the post-2012 sample and regress the log of the handler’s time tocreation (i.e. the time between the handler answering the call and the creation of the incident) on theopening code/grade indicators. We then assign to every opening code/grade incident type its predictedtime to creation, and label an incident type as being information intensive if its predicted time to creationis above the median. To compute the urgency variable, we do a similar exercise using the log of theallocation time instead of the log of the handler’s time to creation. All regressions also include indicatorsfor Call Source, Year X Month X Day X Hour of Day, Radio Operator Room, Call Handler Room, RadioOperator and Call Handler, and opening code/grade indicators. Standard errors are clustered at theYear X Month X Radio Operator Room level.
48
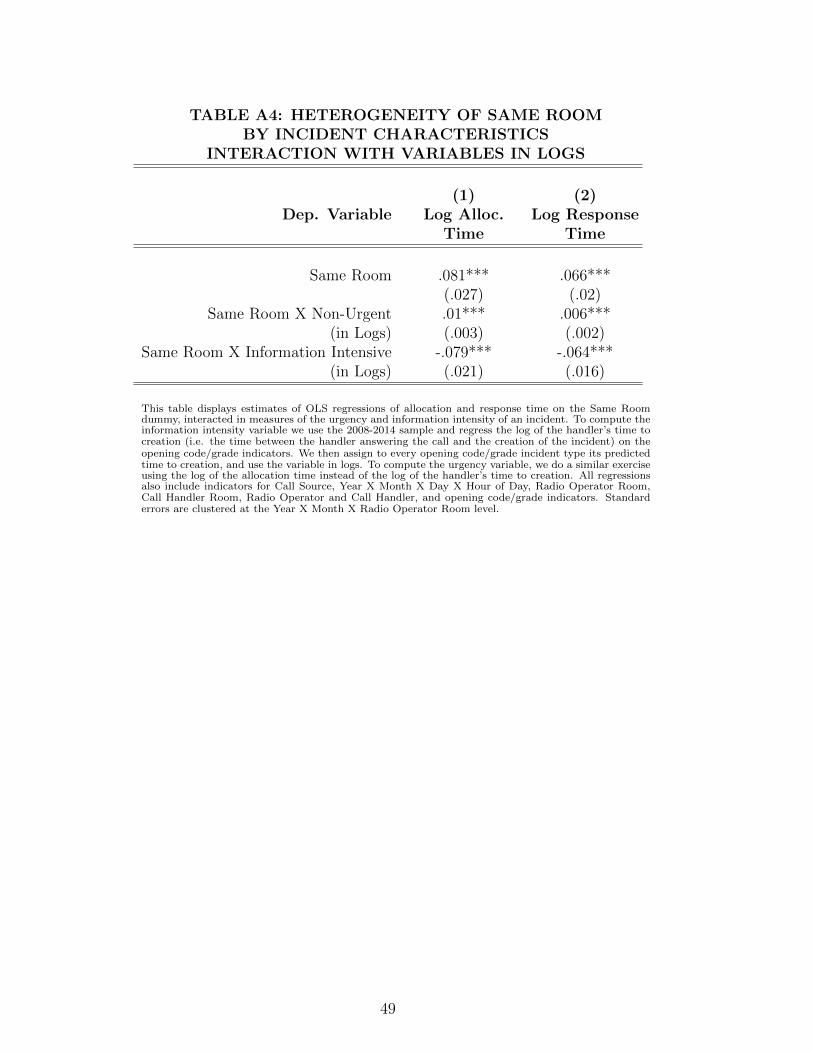
TABLE A4: HETEROGENEITY OF SAME ROOMBY INCIDENT CHARACTERISTICS
INTERACTION WITH VARIABLES IN LOGS
(1) (2)Dep. Variable Log Alloc. Log Response
Time Time
Same Room .081*** .066***(.027) (.02)
Same Room X Non-Urgent .01*** .006***(in Logs) (.003) (.002)
Same Room X Information Intensive -.079*** -.064***(in Logs) (.021) (.016)
This table displays estimates of OLS regressions of allocation and response time on the Same Roomdummy, interacted in measures of the urgency and information intensity of an incident. To compute theinformation intensity variable we use the 2008-2014 sample and regress the log of the handler’s time tocreation (i.e. the time between the handler answering the call and the creation of the incident) on theopening code/grade indicators. We then assign to every opening code/grade incident type its predictedtime to creation, and use the variable in logs. To compute the urgency variable, we do a similar exerciseusing the log of the allocation time instead of the log of the handler’s time to creation. All regressionsalso include indicators for Call Source, Year X Month X Day X Hour of Day, Radio Operator Room,Call Handler Room, Radio Operator and Call Handler, and opening code/grade indicators. Standarderrors are clustered at the Year X Month X Radio Operator Room level.
49

TABLE A5: HETEROGENEITY OF SAME ROOMBY DEMOGRAPHIC DISTANCE (MEDIAN)
BY NUMBER OF PAST INTERACTIONS (MEDIAN)
(1) (2)Dep. Variable Log Alloc. Log Response
Time Time
Same Room -.0107 -.0093(.0093) (.0071)
Same Room X Same Gender -.0191*** -.0215***(.008) (.0061)
Same Room X Difference in Age High .0129 .0125**(.0079) (.006)
Same Room X Number Past Interactions High -.0005* -.0001(.0003) (.0002)
Same Gender -.0027 -.0033(.0041) (.003)
Difference in Age High .0166*** .0077(.0063) (.0048)
Number Past Interactions High -.0338*** -.0274***(.0049) (.0038)
This table displays estimates of OLS regressions of allocation and response time on the Same Room dummy, interacted withwhether the Radio Operator and the Handler are of the same gender, with their difference in age (measured as an abovemedian dummy), and with the number of previous incidents in which they have worked together (measured as an above mediandummy). All regressions include indicators for Grade, Call Source, Year X Month X Day X Hour of Day, Radio Operator RoomX Year, Call Handler Room X Year, Radio Operator and Handler. All regressions also control for Handler Experience andOperator Experience. Standard errors are clustered at the Year X Month X Radio Operator Room level.
50
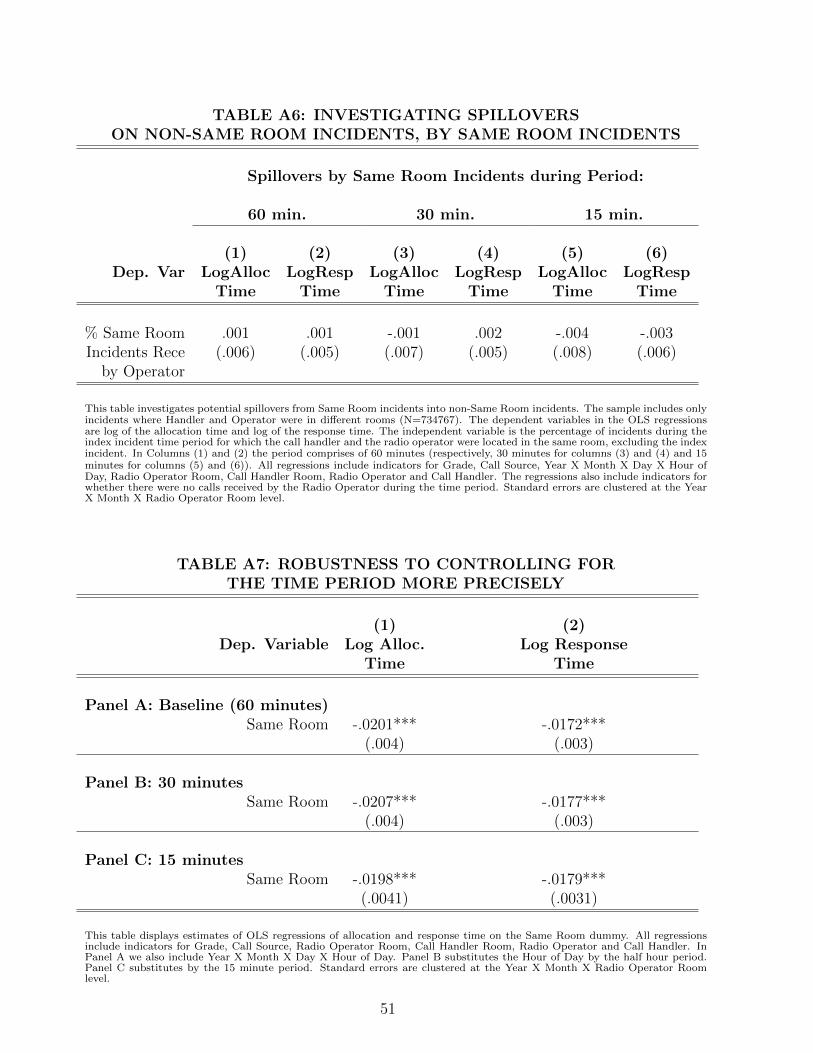
TABLE A6: INVESTIGATING SPILLOVERSON NON-SAME ROOM INCIDENTS, BY SAME ROOM INCIDENTS
Spillovers by Same Room Incidents during Period:
60 min. 30 min. 15 min.
(1) (2) (3) (4) (5) (6)Dep. Var LogAlloc LogResp LogAlloc LogResp LogAlloc LogResp
Time Time Time Time Time Time
% Same Room .001 .001 -.001 .002 -.004 -.003Incidents Rece (.006) (.005) (.007) (.005) (.008) (.006)
by Operator
This table investigates potential spillovers from Same Room incidents into non-Same Room incidents. The sample includes onlyincidents where Handler and Operator were in different rooms (N=734767). The dependent variables in the OLS regressionsare log of the allocation time and log of the response time. The independent variable is the percentage of incidents during theindex incident time period for which the call handler and the radio operator were located in the same room, excluding the indexincident. In Columns (1) and (2) the period comprises of 60 minutes (respectively, 30 minutes for columns (3) and (4) and 15minutes for columns (5) and (6)). All regressions include indicators for Grade, Call Source, Year X Month X Day X Hour ofDay, Radio Operator Room, Call Handler Room, Radio Operator and Call Handler. The regressions also include indicators forwhether there were no calls received by the Radio Operator during the time period. Standard errors are clustered at the YearX Month X Radio Operator Room level.
TABLE A7: ROBUSTNESS TO CONTROLLING FORTHE TIME PERIOD MORE PRECISELY
(1) (2)Dep. Variable Log Alloc. Log Response
Time Time
Panel A: Baseline (60 minutes)Same Room -.0201*** -.0172***
(.004) (.003)
Panel B: 30 minutesSame Room -.0207*** -.0177***
(.004) (.003)
Panel C: 15 minutesSame Room -.0198*** -.0179***
(.0041) (.0031)
This table displays estimates of OLS regressions of allocation and response time on the Same Room dummy. All regressionsinclude indicators for Grade, Call Source, Radio Operator Room, Call Handler Room, Radio Operator and Call Handler. InPanel A we also include Year X Month X Day X Hour of Day. Panel B substitutes the Hour of Day by the half hour period.Panel C substitutes by the 15 minute period. Standard errors are clustered at the Year X Month X Radio Operator Roomlevel.
51
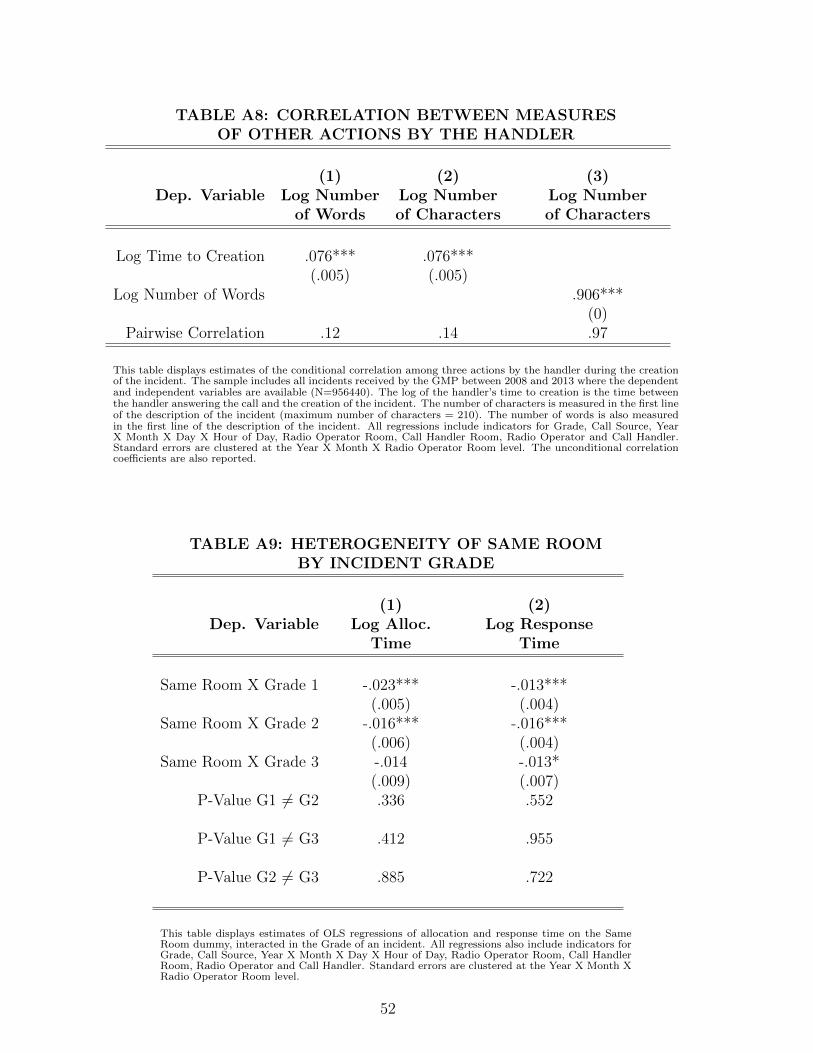
TABLE A8: CORRELATION BETWEEN MEASURESOF OTHER ACTIONS BY THE HANDLER
(1) (2) (3)Dep. Variable Log Number Log Number Log Number
of Words of Characters of Characters
Log Time to Creation .076*** .076***(.005) (.005)
Log Number of Words .906***(0)
Pairwise Correlation .12 .14 .97
This table displays estimates of the conditional correlation among three actions by the handler during the creationof the incident. The sample includes all incidents received by the GMP between 2008 and 2013 where the dependentand independent variables are available (N=956440). The log of the handler’s time to creation is the time betweenthe handler answering the call and the creation of the incident. The number of characters is measured in the first lineof the description of the incident (maximum number of characters = 210). The number of words is also measuredin the first line of the description of the incident. All regressions include indicators for Grade, Call Source, YearX Month X Day X Hour of Day, Radio Operator Room, Call Handler Room, Radio Operator and Call Handler.Standard errors are clustered at the Year X Month X Radio Operator Room level. The unconditional correlationcoefficients are also reported.
TABLE A9: HETEROGENEITY OF SAME ROOMBY INCIDENT GRADE
(1) (2)Dep. Variable Log Alloc. Log Response
Time Time
Same Room X Grade 1 -.023*** -.013***(.005) (.004)
Same Room X Grade 2 -.016*** -.016***(.006) (.004)
Same Room X Grade 3 -.014 -.013*(.009) (.007)
P-Value G1 6= G2 .336 .552
P-Value G1 6= G3 .412 .955
P-Value G2 6= G3 .885 .722
This table displays estimates of OLS regressions of allocation and response time on the SameRoom dummy, interacted in the Grade of an incident. All regressions also include indicators forGrade, Call Source, Year X Month X Day X Hour of Day, Radio Operator Room, Call HandlerRoom, Radio Operator and Call Handler. Standard errors are clustered at the Year X Month XRadio Operator Room level.
52

TABLE A10: ROBUSTNESS TO EXCLUSION OFOUTLYING OBSERVATIONS
(1) (2)Dep. Variable Log Alloc. Log Response
Time Time
Panel A: Excluding .5%Same Room -.0193*** -.0171***
(.0039) (.0029)
Panel B: Excluding 1%Same Room -.0196*** -.0164***
(.0038) (.0028)
Panel C: Excluding 5%Same Room -.0174*** -.0136***
(.0036) (.0026)
This table displays estimates of OLS regressions of allocation and response time on the Same Room dummy.All regressions include indicators for Grade, Call Source, Radio Operator Room, Call Handler Room, RadioOperator and Call Handler. In Panel A Column (1) (respectively, Column (2)) we drop from the baselinesample the observations with the .5% highest values of allocation time (respectively, response time). InPanels B and C we do the same for the 1% and 5% highest values. Standard errors are clustered at the YearX Month X Radio Operator Room level.
53

TABLE A11: HETEROGENEITY OF SAME ROOMBY DISTANCE TO SUPERVISOR DESK
(1) (2)Dep. Variable Log Alloc. Log Response
Time Time
Same Room -.055*** -.037***(.017) (.013)
Same Room X Log Distance Handler/Operator .026*** .018***(.009) (.007)
Same Room X Log Distance Handler/Supervisor .001 0(.008) (.006)
Same Room X Log Distance Operator/Supervisor .006 .002(.009) (.007)
Log Distance Handler/Supervisor .001 .003(.005) (.004)
Log Distance Operator/Supervisor -.101*** -.061***(.014) (.013)
This table displays estimates of OLS regressions of allocation and response time on the Same Room dummy, interactedwith the distance between the handler’s desk and the (closest) supervisor’s desk, and the distance between the operator’sdesk and the (closest) supervisor’s desk. The interaction with the distance between the handler’s desk and the operator’sdesk is entered as a control. All regressions include indicators for Grade, Call Source, Year X Month X Day X Hour of Day,Radio Operator Room X Year, Call Handler Room X Year, Radio Operator and Handler. Standard errors are clustered atthe Year X Month X Radio Operator Room level.
54
REFERENCES
Acemoglu, D., and Autor, D. (2011), “Skills, tasks and technologies: Implicationsfor employment and earnings”, Handbook of Labor Economics, 4, 1043-1171.
Arrow, K. E. (1974), “The limits of organization”, Norton.Autor, D. H., Levy, F., and Murnane, R. J. (2003), “The skill content of re-
cent technological change: An empirical exploration”, The Quarterly Journal of Economics,118(4), 1279-1333.
Bandiera, O., Barankay, I., and Rasul, I. (2013), “Team incentives: evidence froma firm level experiment”, Journal of the European Economic Association, 11(5), 1079-1114.
Bartel, A. P., Beaulieu, N. D., Phibbs, C. S., and Stone, P. W. (2014),“Human capital and productivity in a team environment: evidence from the healthcaresector”, American Economic Journal. Applied Economics, 6(2), 231.
Blanes i Vidal, J. and Kirchmaier, T. (2017), “The effect of police response timeon crime detection”, Working paper.
Bloom, N., Garicano, L., Sadun, R., and Van Reenen, J. (2014), “The dis-tinct effects of information technology and communication technology on firm organization”,Management Science, 60(12), 2859-2885.
Bloom, N., Liang, J., Roberts, J., and Ying, Z. J. (2015), “Does working fromhome work? Evidence from a Chinese experiment”, The Quarterly Journal of Economics,qju032.
Boning, B., Ichniowski, C., and Shaw, K. (2007), “Opportunity counts: Teamsand the effectiveness of production incentives”, Journal of Labor Economics, 25(4), 613-650.
Boudreau, K., Brady, T., Ganguli, I., Gaule, P., Guinan, E., Hollenberg,T., and Lakhani, K. R. (2014), “A field experiment on search costs and the formation ofscientific collaborations”, Working paper.
Bresnahan, T. F., Brynjolfsson, E., and Hitt, L. M. (2002), “Information tech-nology, workplace organization, and the demand for skilled labor: Firm-level evidence”, TheQuarterly Journal of Economics, 117(1), 339-376.
Cairncross, F. (2001), “The death of distance: How the communications revolutionis changing our lives”, Harvard Business Press.
Catalini, C. (2016), “Microgeography and the direction of inventive activity”, Work-ing paper.
Catalini, C., Fons-Rosen, C., and Gaule, P. (2016), “Did cheaper flights changethe direction of science?”, Working paper.
Chan, D. C. (2016), “Teamwork and moral hazard: evidence from the emergencydepartment”, Journal of Political Economy, 124(3), 734-770.
Curtis, I. (2015), “The use of targets in policing ”, available at: https://www.gov.uk/government/uploads/system/uploads/attachmentdata/file/466058/ReviewTargets2015.pdf
Dewatripont, M., Jewitt, I., and Tirole, J. (1999), “The economics of careerconcerns, part II: Application to missions and accountability of government agencies”, TheReview of Economic Studies, 66(1), 199-217.
Dodd, T., and Simmons, J. (Eds.) (2002/03), “British Crime Survey”, availableat http://webarchive.nationalarchives.gov.uk/20110220105210/rds.homeoffice.gov.uk/rds/pdfs2/hosb703.pdf
55

Forman, C., and van Zeebroeck, C., (2012), “From wires to partners: How theInternet has fostered RD collaborations within firms”, Management Science 58(8): 1549-1568.
Freeman, R. B., Ganguli, I., and Murciano-Goroff, R. (2014), “Why and where-fore of increased scientific collaboration”, National Bureau of Economic Research.
Friedman, T. L. (2005), “The world is flat: A brief history of the twenty-first cen-tury”, Macmillan.
Garicano, L. (2000), “Hierarchies and the Organization of Knowledge in Production”,Journal of Political Economy, 108(5), 874-904.
Gaspar, J., and Glaeser, E. L. (1998), “Information technology and the future ofcities”, Journal of Urban Economics, 43(1), 136-156.
Glaeser, E. (2014), “Triumph of the City, PanHamilton, B. H., Nickerson, J. A., and Owan, H. (2003), “Team incentives and
worker heterogeneity: An empirical analysis of the impact of teams on productivity andparticipation”, Journal of Political Economy, 111(3), 465-497.
Hamilton, B. H., Nickerson, J. A., and Owan, H. (2012), “Diversity and pro-ductivity in production teams.”, In Advances in the Economic Analysis of Participatory andLabor-Managed Firms, Emerald Group Publishing Limited.
Hayek, F. A. (1945), “The Use of Knowledge in Society”, The American EconomicReview, 35(4), 519-530.
Hayes, R. M., Oyer, P., and Schaefer, S. (2006), “Coworker complementarityand the stability of top-management teams”, Journal of Law, Economics, and Organization,22(1), 184-212.
Hjort, J. (2014), “Ethnic divisions and production in firms”, The Quarterly Journalof Economics, 129(4), 1899-1946.
Jaffe, A. B., Trajtenberg, M., and Henderson, R. (1993), “Geographic local-ization of knowledge spillovers as evidenced by patent citations”, The Quarterly Journal ofEconomics, 108(3), 577-598.
Jaravel, X., Petkova, N., and Bell, A. (2016), “Team-specific capital and innova-tion”, Working paper.
Jensen, J. B., Kletzer, L. G., Bernstein, J., and Feenstra, R. C. (2005),“Tradable services: Understanding the scope and impact of services offshoring”. In BrookingsTrade Forum (pp. 75-133). Brookings Institution Press.
Lyons, E. (2016), “Team production in international labor markets: Experimentalevidence from the field”, American Economic Journal: Applied Economics.
Mas, A., and Moretti, E. (2009), “Peers at work”, The American Economic Review,99(1), 112-145.
Mateyka, P. J., Rapino, M., and Landivar, L. C. (2012), “Home-based work-ers in the United States: 2010”, US Department of Commerce, Economics and StatisticsAdministration, US Census Bureau.
Pilling, K. (2010), “Police to publish call response times on website”, available at:http://www.independent.co.uk/news/uk/crime/police-to-publish-call-response-times-on-website-1949967.html
Radner, R. (1993), “The organization of decentralized information processing”, Econo-metrica, 1109-1146.
56

Reses, J. (2013), “Memorandum to Yahoo Employees”available at:http://www.businessinsider.com/yahoo-working-from-home-memo-2013-2?IR=T
Shore, L. M., Chung-Herrera, B. G., Dean, M. A., Ehrhart, K. H., Jung,D. I., Randel, A. E., and Singh, G. (2009), “Diversity in organizations: Where are wenow and where are we going?”, Human Resource Management Review, 19(2), 117-133.
Storper, M., and Venables, A. J. (2004), “Buzz: face-to-face contact and theurban economy”, Journal of Economic Geography, 4(4), 351-370.
Thompson, P., and Fox-Kean, M. (2005), “Patent citations and the geography ofknowledge spillovers: A reassessment”, American Economic Review, 450-460.
Topel, R. (1991), “Specific capital, mobility, and wages: Wages rise with job senior-ity”, Journal of Political Economy, 99(1), 145-176.
Zuckerberg, M. (2015), “Mark Zuckerberg Live Video at Facebook HQ (IntroducingNew Facebook Office Inside)”available at: https://www.youtube.com/watch?v=l–zev 37QA
57

CENTRE FOR ECONOMIC PERFORMANCE Recent Discussion Papers
1472 Sarah Flèche Teacher Quality, Test Scores and Non-Cognitive Skills: Evidence from Primary School Teachers in the UK
1471 Ester Faia Gianmarco Ottaviano
Global Banking: Risk Taking and Competition
1470 Nicholas Bloom Erik Brynjolfsson Lucia Foster Ron Jarmin Megha Patnaik Itay Saporta-Eksten John Van Reenen
What Drives Differences in Management?
1469 Kalina Manova Zhihong Yu
Multi-Product Firms and Product Quality
1468 Jo Blanden Kirstine Hansen Sandra McNally
Quality in Early Years Settings and Children’s School Achievement
1467 Joan Costa-Font Sarah Flèche
Parental Sleep and Employment: Evidence from a British Cohort Study
1466 Jo Blanden Stephen Machin
Home Ownership and Social Mobility
1465 Decio Coviello Stefano Gagliarducci
Tenure in Office and Public Procurement
1464 Claudia Olivetti Barbara Petrongolo
The Economic Consequences of Family Policies: Lessons from a Century of Legislation in High-Income Countries
1463 Claudia Hupkau Marion Leturcq
Fertility and Mothers' Labor Supply: New Evidence Using Time-to-Conception
1462 Clement Bellet The Paradox of the Joneses: Superstar Houses and Mortgage Frenzy in Suburban America

1461 Georg Graetz Guy Michaels
Is Modern Technology Responsible for Jobless Recoveries?
1460 Thomas Breda Alan Manning
Diversity and Social Capital within the Workplace: Evidence from Britain
1459 Monica Langella Alan Manning
Diversity and Neighbourhood Satisfaction
1458 Giordano Mion Luca David Opromolla Alessandro Sforza
The Diffusion of Knowledge via Managers’ Mobility
1457 Kristian Behrens Giordano Mion Yasusada Murata Jens Suedekum
Distorted Monopolistic Competition
1456 Tony Beatton Michael P. Kidd Stephen Machin Dipa Sarkar
Larrikin Youth: New Evidence on Crime and Schooling
1455 Andrew Eyles Stephen Machin Sandra McNally
Unexpected School Reform: Academisation of Primary Schools in England
1454 Rabah Arezki Thiemo Fetzer Frank Pisch
On the Comparative Advantage of U.S. Manufacturing: Evidence from the Shale Gas Revolution
1453 Randolph Bruno Nauro Campos Saul Estrin Meng Tian
Foreign Direct Investment and the Relationship Between the United Kingdom and the European Union
1452 Stephen J. Redding Esteban Rossi-Hansberg
Quantitative Spatial Economics
The Centre for Economic Performance Publications Unit Tel 020 7955 7673 Fax 020 7404 0612
Email [email protected] Web site http://cep.lse.ac.uk