cep discussion paper no 1147 may 2012 immigration...
TRANSCRIPT

ISSN 2042-2695
CEP Discussion Paper No 1147
May 2012
Immigration, Offshoring and American Jobs
Gianmarco I. P. Ottaviano,
Giovanni Peri and Greg C. Wright
Abstract How do offshoring and immigration affect the employment of native workers? What kinds of jobs
suffer, or benefit, most from the competition created by offshore and immigrant workers? In contrast
to the existing literature that has mostly looked at the effects of offshoring and immigration
separately, we argue that one can gain useful insights by jointly investigating the interactions among
native, immigrant and offshore workers. We develop our argument in three steps. First, we present
some new facts on 58 U.S. manufacturing industries from 2000 to 2007. Second, we build on
Grossman and Rossi-Hansberg (2008) to design a model of task assignment among heterogeneous
native, immigrant and offshore workers that fits those facts. Third, we use the model to draw
systematic predictions about the effects of immigration and offshoring on native workers and we test
these predictions on the data. We find that, within the manufacturing sector, immigrants do not
compete much with natives, as these two groups of workers are relatively specialized in tasks at
opposite ends of the skill intensity spectrum. Offshore workers, on the other hand, seem to be
specialized in tasks of intermediate skill intensity. We also find that offshoring has no effect on native
employment in the aggregate, while the effect of immigration on native employment is positive. This
hints at the presence of a “productivity effect" whereby offshoring and immigration improve industry
efficiency, thereby creating new jobs.
Keywords: Employment, production tasks, immigrants, offshoring
JEL Classifications: F22, F23, J24, J61
This paper was produced as part of the Centre’s Globalisation Programme. The Centre for Economic
Performance is financed by the Economic and Social Research Council.
Acknowledgements This paper was written as part of the project “Mobility of People and Mobility of Firms" coordinated
by the Centro Studi Luca d’Agliano (LdA) and funded by the Fondazione CRT. We thank Daron
Acemoglu, Giorgio Barba-Navaretti, Rosario Crinò, Gordon Hanson, Rob Feenstra, Gene Grossman,
Alan Manning, John McLaren, Peter Neary, Esteban Rossi-Hansberg, Dan Trefler and participants in
several seminars and conferences for useful comments and suggestions.
Gianmarco Ottaviano is an Associate of the Globalisation Programme, Centre for Economic
Performance and Professor of Economics, London School of Economics. Giovanni Peri is a Professor
of Economics in the Department of Economics at the University of California, Davis. Greg Wright is
a Lecturer in Economics at the University of Essex.
Published by
Centre for Economic Performance
London School of Economics and Political Science
Houghton Street
London WC2A 2AE
All rights reserved. No part of this publication may be reproduced, stored in a retrieval system or
transmitted in any form or by any means without the prior permission in writing of the publisher nor
be issued to the public or circulated in any form other than that in which it is published.
Requests for permission to reproduce any article or part of the Working Paper should be sent to the
editor at the above address.
G. I. P. Ottaviano, G. Peri and G. C. Wright, submitted 2012
1 Introduction
The relocation of jobs abroad by multinationals and the increased labor market competition due to immigrant
workers are often credited with the demise of many manufacturing jobs once held by American citizens. While
it is certainly true that manufacturing production and employment, as a percentage of the total economy, have
declined over recent decades in the U.S., measuring the impact of those two aspects of globalization on jobs has
been difficult. This is due to the possible presence of two opposing effects. On the one hand, there is a direct
“displacement effect": offshoring some production processes or hiring immigrants to perform them directly
reduces the demand for native workers. On the other hand, there is an indirect “productivity effect": the
cost savings associated with employing immigrant and offshore labor increases the efficiency of the production
process, thus raising the demand for native workers—if not in the same tasks that are offshored or given to
immigrant workers, then certainly in tasks that are complementary to them.
Several recent papers have emphasized the potential productivity effect of offshoring, arguing that this effect
could offset or even reverse the displacement effect and thereby generate an overall non-negative effect on the
wage or employment of native workers (Grossman and Rossi-Hansberg, 2008; Costinot and Vogel, 2010; Harrison
and McMillan, 2011; Wright 2012). These papers focus on the patterns of substitutability between native and
offshore workers. Other papers have suggested that immigrants may generate an analogous productivity effect
by increasing the demand for native workers, especially in production tasks that are complementary to those
performed by immigrants (Ottaviano and Peri, 2012; Peri, 2009; Peri and Sparber, 2009). These papers look at
the patterns of substitutability between native and immigrant workers. Little attention has been paid so far to
the simultaneous patterns of substitutability between native, immigrant and offshore workers.
In this paper we argue that the joint investigation of the interactions among these three groups of workers
is useful in order to improve our understanding of the impact of globalization on the U.S. labor market and,
in particular, to answer two hotly debated questions. First, how do declines in offshoring and immigration
costs affect the employment of native workers? Second, what kinds of jobs suffer, or benefit, the most from the
competition created by offshore and immigrant workers?
At the core of our argument are the observations that jobs (“tasks") vary in terms of the relative intensity
of use of workers’ skills, workers differ in terms of their relative abundance of those skills, and the relative
abundance of workers with specific skills varies systematically across native, immigrant and offshore groups. As
long as only natives are available, producers will do with the skill composition they have. Once immigrant and
offshore workers become employable, efficiency gains can be reaped by hiring them to perform tasks in which
they have a relative (“comparative") advantage. This gives native workers the opportunity to specialize in the
tasks in which they exhibit their own relative advantage. If strong enough, the productivity effect associated
with this efficient pattern of task specialization may offset the displacement effect of immigration and offshoring
2
on native workers’ employment.
We develop this argument in three steps. First, we present some new facts on 58 industries, which together
comprise the U.S. manufacturing sector, from 2000 to 2007. We argue that these facts are consistent with a
scenario in which: (a) there is stronger substitutability between immigrants and offshore workers than between
immigrants and natives; (b) immigrant, native and offshore workers are relatively specialized in tasks of different
skill complexity; and, in particular, (c) immigrants are relatively specialized in low complexity tasks, natives in
high complexity tasks, and offshore workers in medium complexity tasks.1Unfortunately, the complexity of the
tasks performed by offshore workers is not directly observable.
In the second step we build on Grossman and Rossi-Hansberg (2008) to design a partial equilibrium model
of task assignment among heterogeneous native, immigrant and offshore workers within an industry that is
consistent with the observed facts. We then use the model to draw systematic predictions of the effects of
falling barriers to immigration and offshoring on the tasks, the employment share and the employment level
of native workers. An important assumption of the model, not directly observable but consistent with a series
of facts that we present, is that offshore workers specialize in “intermediate" tasks, in between immigrants
and natives, on the task complexity spectrum. The model generates two main sets of predictions. On one
hand— borrowing the terminology of Costinot and Vogel (2010)— a decline in immigration costs leads to “task
upgrading" of immigrants as these workers are assigned some medium complexity tasks that were previously
performed by offshore workers. Moreover, lower immigration costs have little impact on the task complexity of
native workers, who are located at the high end of the task complexity spectrum. On the other hand a decline in
offshoring costs simultaneously lead to task upgrading of natives and task downgrading of immigrants: offshore
workers are assigned the most complex among the low complexity tasks previously performed by immigrants,
as well as the least complex among the high complexity tasks previously performed by natives. In this case, the
result is increased task polarization between immigrants and natives in the domestic labor market.
The other set of predictions concerns the response of industry employment following the reallocations of
tasks described above. Employment shares move as dictated by the “displacement effect": a group of workers
from which tasks are taken away sees its employment share fall; a group of workers to which new tasks are
assigned sees its employment share increase. If the “productivity effect" is weak, employment levels move in
the same direction as employment shares. On the other hand, when the efficiency gains from immigration or
offshoring are strong enough, employment levels may increase for all groups of workers and not only for those
whose employment shares go up. This happens because, thanks to the higher overall efficiency of the production
process, the groups of workers whose employment shares go down get a smaller share but the size of the overall
1The choice to focus on manufacturing and not include services reflects the research questions we have chosen to address. It is
also forced on us by data availability as there is limited data on services offshoring. Moreover, the production function approach
at the core of our analysis is much better understood in the context of manufacturing than in the context of services. Lastly, the
range of skills spanned by tasks is richer in manufacturing than in services, leaving more room for gains due to their reallocation.
3
pie increases. Intuitively, the changes in employment shares are determined by movements along the relative
labor demand curves of the different groups of workers, as dictated by changes in their relative efficiency. The
changes in employment levels, however, are also affected by the outward shifts in labor demand produced by
the increase in the overall efficiency of the production process.
In the end, whether the employment of natives rises or falls when immigration and offshoring become easier,
and whether the observed change is consistent with our story, is an empirical issue. Thus, the third and last
step of our argument brings the two sets of predictions derived from the theoretical model to the data. By using
employment data on immigrants and natives from the American Community Survey (ACS) and on offshore
workers by U.S. multinational affiliates from the Bureau of Economic Analysis (BEA), we indeed find that
easier offshoring reduces the employment shares of both native and immigrant workers while easier immigration
reduces the employment share of offshore workers only, with no impact on the employment share of natives.
Nonetheless, when we look at employment levels (rather than shares), we find that easier offshoring does not
have any significant effect whereas easier immigration has a positive and significant impact on natives. This is
consistent with the existence of positive productivity effects due to immigration and offshoring.
By matching occupation data from the ACS with the manual, communication and cognitive skill content of
tasks performed in each occupation (from the U.S. Department of Labor’s O*NET abilities survey), we then
assess the response of the skill intensity (“complexity") of those tasks to immigration and offshoring. Here we
find that easier offshoring raises the average complexity of native tasks, increasing the gap between native and
immigrant task complexity. In contrast, easier immigration has no effect on the average complexity of native
tasks. Overall, our findings imply that immigrants do not compete much with natives and that the reason for
this is that they are concentrated at opposite ends of the task complexity spectrum. Offshore workers, instead,
are specialized in tasks of intermediate complexity (not directly observed) generating some competition with
both immigrants and natives, revealed by the effect on employment shares and on task intensities of those two
groups.
The rest of the paper is organized as follows. The next section describes the novel contributions of this paper
in the context of the existing literature. Section 3 presents the data, highlighting some key facts that inform
the subsequent analysis. Section 4 presents a theoretical model consistent with those facts, deriving predictions
to be brought under econometric scrutiny. Section 5 produces the econometric evidence on the predictions of
the theoretical model. Section 6 concludes.
2 Related Literature
Several recent papers have analyzed the effect of offshoring on the demand for domestic labor and are relevant
to the present analysis. On the theoretical front, Grossman and Rossi-Hansberg (2008) provide a simple model
4
of trade in production tasks. As already mentioned, this model will serve as the framework for our analysis,
though we will focus on employment rather than on wage effects as they instead do. It is worth mentioning
that this theory owes much to previous work on trade in intermediates, including seminal work by Jones and
Kierzkowski (1990) and Feenstra and Hanson (1996, 1999), who present models in which trade in intermediate
goods has consequences for labor demand much like those described in Grossman and Rossi-Hansberg (2008).
Recent and relevant empirical work includes Crinò (2010), Hummels, Jorgenson, Munch and Xiang (2010),
Harrison and McMillan (2011) and Wright (2012), each of which have tested some of the implications of existing
theories with respect to the wage and employment effects of offshoring. Crinò (2010), who focuses on services
offshoring, and Hummels, Jorgenson, Munch and Xiang (2010), who focus on Denmark, both find positive wage
and employment effects of offshoring for relatively skilled workers, especially for those performing more complex
production tasks, but find that less skilled workers may suffer displacement. Wright (2012) finds a positive
productivity effect of offshoring for domestic firms but, on net, an aggregate decline in low-skill employment.
Harrison and McMillan (2011) find that a crucial distinction is between “horizontal" and “vertical" offshoring
(the first aimed at locally serving foreign markets and the second aimed at producing intermediates that the
multinational then re-imports to its domestic market), with the first hurting and the second stimulating domestic
employment.
The present paper combines the above literature with the literature on the labor market effects of immigrants
(e.g. Card, 2001; Card 2009; Borjas, 2003), proposing a common structure to think about offshoring and
immigration within manufacturing industries. In particular, our theoretical model and empirical analysis address
two sets of previously unanswered questions. First, are offshore workers primarily competing with natives or with
immigrants? And, conversely, is hiring immigrant workers an alternative to offshoring jobs, or do immigrants
compete directly with natives? Second, does hiring immigrants or moving jobs offshore increase productivity (by
cutting costs) and hence expand production (and possibly total employment) in an industry? In so doing, we
extend the offshoring model by Grossman and Rossi-Hansberg (2008) to allow for immigration, which provides
a simple, though still rich, way of thinking about these two phenomena within a unified framework. While the
immigration literature has also analyzed the impact of immigrants on task allocation and productivity (e.g., Peri
and Sparber, 2009; Peri, 2012; Chassamboulli and Palivos, 2010), we expand on it by considering a multi-sector
environment and an open economy.2 What we find is that the joint analysis of immigration and offshoring
indeed generates novel insights that are necessarily overlooked when considering each of those two phenomena
in isolation.
The only other papers we are aware of that tackle the analysis of immigration and offshoring in a joint
2Blinder (2007), Jensen and Kletzer (2007), Levy and Murnane (2006), Becker, Ekholm and Muendler (2007) find that tasks that
intensively use cognitive-communication and non-routine skills are harder to offshore. Peri and Sparber (2009) find that immigrants
have a comparative disadvantage (lower productivity) in performing communication-intensive tasks. None of these contributions,
however, tackles the issue of the joint effects of offshoring and immigration on the employment shares, the employment levels and
the task assignment of native, immigrant and offshore workers as we do.
5
framework are Olney (2009) and Barba Navaretti, Bertola and Sembenelli (2008). The first paper assumes
that immigrants are identical to natives and that their variation across U.S. states and industries is exogenous.
Moreover, native workers are assumed to be immobile across states and industries so that the impacts of
immigration or offshoring manifest themselves entirely through wages. We think our model and its derived
empirical implementation constitute a step forward from the reduced form approach of that study. The second
paper presents a model of immigration and offshoring and tests its implications on firm-level data for Italy. It
does not look, however, at the skill endowments of workers and the skill intensity of tasks nor at industry-level
employment effects.
The importance of assortative matching between the skill requirements of tasks and the skill endowments of
workers has been recently stressed by Costinot and Vogel (2010). These authors tackle the thorny theoretical
issue of how to determine factor allocation and factor prices in economies with a large number of goods and
factors. By focusing on a Roy-like assignment model, in which a continuum of factors (“workers") are employed
to produce a continuum of goods (“tasks"), they show that the comparative advantage of high skill workers
in high complexity tasks provides sufficient conditions for rich comparative static predictions on the effects of
various shocks to labor demand and supply. Among possible shocks, offshoring is explicitly analyzed. Following
Grossman and Rossi-Hansberg (2008), Costinot and Vogel (2010) model easier offshoring as an increase in off-
shore labor productivity. Then, assuming that offshore workers have a comparative advantage in low complexity
tasks, they conclude that easier offshoring induces task upgrading of all workers and rising wage inequality due
to the increase in the effective supply of poorer low-skill workers. Costinot and Vogel (2010) do not consider
immigration explicitly. They do, however, discuss the effects of changes in the composition of labor supply and
these results can shed light on the effects of immigration. For example, if one assumes that immigrants are
relatively less skilled than natives, immigration entails a rise in the relative number of low-skill workers in the
labor force of the receiving country. The impact of immigration is then similar to the impact of offshoring:
task upgrading for all workers and increasing wage inequality. Since our model also features a Roy-like assign-
ment problem, their tools and techniques can be used to generalize our theoretical results, with two important
differences. First, our focus is on the employment effects rather than on the wage effects. Second, our joint
consideration of immigration and offshoring uncovers a differential response of native employment to shocks
to the cost of immigrating or offshoring workers, a result that follows from the specialization of immigrants in
tasks of low skill intensity and of offshore workers in tasks of medium skill intensity.
Costinot and Vogel (2010) are not the first to deal with assignment models in an international context.
Applications to trade can be found, for instance, in Grossman and Maggi (2000), Grossman (2004), Yeaple
(2005), Ohnsorge and Trefler (2007), Blanchard and Willmann (2008), Costinot (2009), Monte (2011), and Sly
(2011). Examples of applications to offshoring are Kremer and Maskin (2006), Antras, Garicano, and Rossi-
6
Hansberg (2006), and Nocke and Yeaple (2008). None of these papers, however, deals jointly with offshoring
and immigration.
Finally, also related to our paper are works that investigate the determinants of “job polarization", defined
as rising employment shares in the highest and the lowest wage occupations (Autor, Katz and Kearney, 2006;
Goos and Manning, 2007). Three main explanations of job polarization have been put forth: the technological
substitution of non-manual, routine jobs in the middle of the wage distribution (Autor and Katz, 1999; Autor,
Levy and Murnane, 2003); the offshoring of these jobs (Blinder, 2007); or the “butlerization" or demand-
driven explanation, whereby a rising income share at the top of the distribution leads to increased demand
for low-skill services (Manning, 2004). In summarizing the findings of this literature, Goos, Manning and
Salomons (2009) conclude that job polarization is hard to explain in terms of simple skill-biased technological
change since one observes growth in employment in both the highest-skilled (professional and managerial) and
lowest-skilled (personal services) occupations. Technical substitution of non-manual, routine jobs seems to be
a better explanation of job polarization than offshoring and butlerization because of the pervasive effect of
technology across sectors and countries. The present paper focuses on manufacturing jobs only while also
bringing immigration into the picture. We provide a somewhat different characterization of polarization in the
US market, defined as the increasing difference in the types of jobs performed by immigrants relative to those
performed by natives.
3 Data and Descriptive Statistics
In this section we present simple statistical evidence on U.S. manufacturing industries that is consistent with
a story of task specialization among native, immigrants and offshore workers according to a specific pattern
of comparative advantages. In particular, the data show that natives and immigrants have revealed relative
advantages in high and low complexity jobs, respectively. The revealed relative advantage of offshore workers
is not directly observable. However two related facts are observed. First the cognitive and communication
intensity of native jobs is higher (and the manual intensity lower) in manufacturing industries where offshoring
is relatively large. Second, in manufacturing industries the cognitive, communication and manual intensities of
native jobs are not related to the relative importance of immigration. Third, a positive and significant relation
between immigration and the cognitive and communication intensities of native jobs exists in non-manufacturing
industries where offshoring is negligible. These facts suggest a specific pattern of relative advantages in manu-
facturing industries. Immigrants specialize in low complexity tasks, natives specialize in high complexity tasks
and offshore workers specialize in intermediate complexity tasks. Specialization according to relative advantages
implies not only that immigration has a weaker “displacement effect" on natives than offshoring, but also that
7
immigration and offshoring may generate a positive “productivity effect"3.
We formalize this story in Section 4 through a simple theoretical model that, first, demonstrates the internal
consistency of the story’s logic and, second, derives mutually consistent empirical predictions about the effects
of immigration and offshoring on the employment share, the employment level and the job assignment of native
workers. Section 5 then brings these predictions to the data. It should be noted that, while the theoretical
model is designed to be consistent with the descriptive evidence of the present section, the econometric scrutiny
will involve a more rigorous methodology and will test moments of the data different from those on which the
assumptions of the model are based.
3.1 Employment
To measure the employment of native, immigrant and offshore workers in each industry-year using a consistent
and comparable industry classification, we merge data on multinational employment from the Bureau of Eco-
nomic Analysis (BEA) with data on native and foreign-born workers from the IPUMS samples (Ruggles et al
2008) of the Census and the American Community Survey (ACS). The only years in which this merger can be
consistently and reliably done are those from 2000 to 2007. We therefore take these eight years as our period of
observation.
Information on offshore employment is obtained from the Bureau of Economic Analysis (BEA) U.S. Direct
Investment Abroad dataset, which collects data on the operations of U.S. parent companies and their affiliates.
From this dataset we obtain the total number of employees working abroad in foreign affiliates of U.S. parent
companies, by industry of the U.S. parent. These are jobs directly generated abroad by multinationals4. Of
additional and growing importance are jobs created as U.S. multinational firms outsource production to unaffil-
iated foreign sub-contractors, so-called arm’s length offshoring (see, e.g., Antras, 2003). We would have liked to
include a direct measure of these jobs in the count of total offshore employment but, unfortunately, this is impos-
sible due to lack of data. We do, however, construct a proxy for this variable, as follows. Assuming that a large
part of the production output of these offshored jobs is subsequently imported as intermediate inputs by the U.S.
parent company, we calculate the ratio of imports of intermediates by the U.S. parent coming from affiliates and
employment in those affiliates. We then scale the imports of the U.S. parent coming from non-affiliates (data
that are also available from the BEA) by this ratio to impute the employment in sub-contracting companies.
This procedure assumes that the labor content per unit of production of sub-contracted intermediate inputs is
the same as for production in U.S. affiliates in the same industry. Adding the imputed employment increases
offshore employment by 60-80% in most industries, confirming the importance of arm’s length offshoring. While
3 In non-manufacturing sectors offshoring tasks is relatively costly. Thus tasks are assigned primarily to natives or immigrants
with a higher likelihood of substitution between them. The productivity effect may still exist, however.4As is standard in this literature, here we do not include in the definition of offshoring jobs that are sub-contracted abroad by
purely national firms.
8
we will also report the results with this more inclusive offshore employment measure in Section 5, here and
there we prefer to emphasize the more conservative approach whereby we restrict the analysis only to workers
directly employed abroad by multinationals.
Data on native and immigrant workers come from the ACS and Census IPUMS samples for the period
2000-2007.5 We add up all workers not living in group quarters, who worked at least one week during the
year, weighting them by the sample weights assigned by the ACS in order to make the sample nationally
representative. “Immigrants" are all foreign-born workers who were not citizens at birth. “Natives" are all
other U.S. workers. The relevant industry classification in the Census-ACS data 2000-2007 is the INDNAICS
classification, which is based on the North American Industry Classification System (NAICS). Since the BEA
industries are also associated with unique 4-digit NAICS industries, we are able to develop a straightforward
concordance between the two datasets.
The 58 industries on which we have data and their BEA codes are reported in Table A1 while Figure A1
reports the evolution of the employment shares of native, immigrant and offshore workers across industries in
each year with the connecting lines showing averages over time. From 2000 to 2007 there was only a fairly
modest increase in the overall share of immigrant and offshore employment in total manufacturing employment
(the former increased from 12.8% to 14% and the latter from 22.3% to 29.3%). The figure also shows that, not
only all industries hired immigrants and offshore workers but that the differences across them are potentially
large enough to allow for the identification of the differential effects of immigration and offshoring over the
period.
While the employment shares of the different groups of workers vary across industries, there are interesting
patterns of co-variation. Panel (a) of Figure 1 depicts the correlations between native and immigrant employment
shares over the period of observation. Panel (b) provides the same type of information for native and offshore
workers. The figure reveals a lack of correlation between the shares of immigrant and native workers. In contrast,
it highlights a strong negative correlation between the shares of offshore and native workers. These correlations
suggest that competition for jobs may be tougher between natives and offshore workers than between natives
and immigrants.
Figure 2 looks at yearly employment and wage growth rates. Panel (a) reveals a positive correlation between
the growth rates of employment of natives and immigrants whereas panel (b) shows no correlation between
growth of natives and offshore workers. This is again consistent with weaker natives-immigrants employment
competition relative to natives-offshore workers in the presence of positive productivity effects associated with
both immigration and offshoring. Panels (c) and (d) look at the correlations between changes in native wages and
5For year 2000 we use the 5% Census sample. For 2001 we use the 1-in-232 national random sample. For 2002, we use the
1-in-261 national random sample. For 2003 we use the 1-in-236 national random sample. For 2004 we use the 1-in-239 national
random sample. For 2005, 2006 and 2007 the 1-in-100 national random samples are used.
9
changes in immigrant and offshore employment6. The two panels do not detect any significant correlation. We
interpret this as consistent with native wages being largely exogenous to each of our manufacturing industries,
because of worker mobility across them.
3.2 Tasks
Data on the tasks performed by immigrants and natives is constructed using the U.S. Department of Labor’s
O*NET abilities survey, which provides information on the characteristics of each occupation. Based on the
Standard Occupation Classification (SOC), the dataset assigns numerical values to describe the importance
of distinct abilities (“skills") required by different occupations (“tasks"). Each numerical value measures the
intensity of a task in a given skill. Following Peri and Sparber (2009), we merge these task-specific values with
individual workers in the 2000 Census, re-scaling each value so that it equals the percentile score in that year.
This gives a measure of the relative importance of a given skill among U.S. workers ranging between 0 and 1.
For instance, a task with a score of 0.02 for some skill indicates that only 2 percent of workers in the U.S. in
2000 were supplying that skill less intensively. We then assign these O*NET percentile scores to individuals
from 2000 to 2007 using the ACS variable occ1990, which provides an occupational crosswalk over time.
We focus on three skill indices: Cognitive Intensity, Communication Intensity and Manual Intensity. These
are constructed by averaging the relevant skill variables. Specifically, Cognitive Intensity includes ten variables
classified as “cognitive and analytical" in O*NET. Communication Intensity includes four variables capturing
written and oral expression as well as understanding. Manual Intensity includes nineteen variables capturing
dexterity, strength and coordination.7 We have also calculated a synthetic Complexity index summarizing
the intensity of a task in cognitive-communication skills relative to manual skills. This index is defined as:
Complexity = ln((Cognitive Intensity+Communication Intensity)Manual Intensity). It ranges between −∞and +∞.Overall, our sample consists of 295 occupations in the manufacturing sector over the years 2000-2007. This
type of information is available for immigrants and natives but unfortunately not for offshore workers. Absent
direct information on the specific occupation of offshore workers, a crucial challenge for us will be to indirectly
assess the average skill intensity of offshore tasks. The four panels of Figure 3 plot the share of hours worked
by immigrants relative to the total number of hours worked by immigrant and native workers as a function
of Cognitive Intensity, Communication Intensity, Manual Intensity and Complexity across occupations (tasks)-
years. The figure clearly shows that immigrants are disproportionately represented in tasks characterized by low
6The wages of natives are constructed as follows. From the Census-ACS data we consider only U.S.-born individuals who are
employed (i.e., who have worked at least one week in the year and at least one hour in the week) and who have non-zero wage
income, excluding the self-employed. We take yearly wage income deflated by the consumption price index to constant 2005 dollars
and average it at the industry level, weighting each individual by the corresponding sample weight in the Census.7The variables used for each index are listed in Appendix C.
10
Cognitive Intensity, low Communication Intensity, high Manual Intensity and low overall Complexity. Figure
4 plots the same type of information but restricts the sample to workers with low educational attainment
(i.e., workers with a high school diploma or less). The message is the same: even within the low educated,
immigrants are relatively specialized in tasks with low cognitive and communication content, low complexity
and high manual content. In this respect, the revealed relative advantage of immigrants in low complexity tasks
seems to be pervasive8.
While the skill intensity of offshored tasks is unobservable, we can nonetheless gauge some indirect evidence
from the way offshoring affects the skill intensity of native and immigrant tasks. Figure 5 reports this type of
information in the case of all immigrants and natives. Figure 6 does the same for workers with a high school
diploma or less. Both figures plot the change in the Complexity of tasks performed by natives and immigrants
against the change in the shares of offshore and immigrant employment, across manufacturing industries over
the period 2000-2007. Both figures convey a similar message, even though the message is clearer and stronger
in the case of all workers. Increases in the share of offshore workers are associated with significant increases
in the complexity of tasks performed by natives as well as decreases in the complexity of tasks performed by
immigrants. In contrast, increases in the share of immigrants are not associated with any significant change in
the complexity of native or immigrant tasks. Hence, a stronger presence of offshore workers is associated with
a larger differential (polarization) in task complexity between natives and immigrants while a stronger presence
of immigrants is unrelated with that differential. Similar patterns arise when we focus on Cognitive Intensity,
Communication Intensity and Manual Intensity separately but we do not report them for conciseness.
The finding that changes in native complexity are not significantly correlated with changes in the share of
immigrants may surprise readers familiar with Peri and Sparber (2009), as these authors find that native task
complexity is sensitive to the share of immigrants. This can easily be explained, however and it is consistent
with our theory. In this study we focus on (mostly tradable) manufacturing industries whereas Peri and Sparber
(2009) consider all employment, most of which is in (non tradable) services. Since offshoring was still negligible
outside the manufacturing sector during our period of observation, we interpret this discrepancy as a signal
that, when viable, offshore workers play an important role in weakening the competition between immigrants
and natives. Table 1 explores this interpretation by regressing native complexity on immigrants’ complexity and
employment share, distinguishing between manufacturing (“tradable") and non-manufacturing (“non-tradable")
industries. All workers are included. The table shows significant positive correlation between native complexity
and immigrant employment share within non-tradable industries (Column 2), but no correlation is detected
between native complexity and immigrant employment share in tradable industries (Column 1)9. This supports
8This finding concurs with existing evidence. Peri and Sparber (2009) show that, due to their imperfect knowledge of language
and local norms, immigrants have a relative advantage in tasks with high manual intensity and a relative disadvantage in tasks
with high communication intensity.9 In the regressions in Table 1 we also control for the complexity of immigrant jobs and for time and industry fixed effects.
11
the idea that in non-tradable industries the competition between natives and immigrants is more direct and
immigration pushes native workers to “upgrade" their jobs. In tradable industries, instead, this does not
happen because offshore workers are those performing most of the intermediate-complex tasks and in direct
competition with immigrants. While the results shown are not direct evidence of this they are consistent with
this explanation.
To refine the analysis of the role of offshoring within manufacturing, Figure 7 compares two subsets of
our 58 industries, partitioned according to the ratio of multinationals’ re-imports from affiliates to local sales—
i.e., according to the degree of “vertical" (foreign production gets re-imported) versus “horizontal" (foreign
production is sold locally) offshoring. Since across industries the median value of that ratio is 0.20 with standard
deviation 0.10, we compare industries with ratios larger than 30 per cent with industries with ratios below 10
per cent, omitting industries with values between 0.1 and 0.3 in order to make the comparison starker. The
figure shows that industries with high ratios exhibit a positive and significant correlation between the share of
offshore workers and native complexity. There is, instead, no significant correlation in industries with low ratios.
This is consistent with the idea that vertical offshoring is the one fitting better our story of offshoring tasks in
the medium-complexity range (to reduce costs). Horizontal offshoring, instead, may be associated with sending
abroad a larger range of tasks, specific also to marketing and sales, rather than only to production.
Our overall interpretation of the descriptive evidence presented in this section is that natives seem to compete
more directly with offshore than immigrant workers. This can be explained by a specific pattern of relative
advantages across the three groups of workers, with immigrants specializing in low complexity tasks, natives in
high complexity tasks and offshore workers in intermediate complexity tasks.
4 A Labor Market Model of Task Allocation
A simple partial equilibrium model consistent with the descriptive evidence reported in the previous section can
be designed following Grossman and Rossi-Hansberg (2008). Consider a small open economy that is active in
several perfectly competitive sectors, indexed = 1 . We focus on one of these sectors and leave both the
sector index and the time dependence of variables implicit for ease of notation. We will make them explicit
when we get to the empirics.
The sector employs two primary factors, workers with employment level and a sector-specific factor
with endowment . To match the descriptive evidence on wages in Section 3, the sector is small enough to
face infinitely elastic labor supply at given wages.10 All workers are endowed with one unit of labor each but
10This leads to a crucial difference between our model and those by Grossman and Rossi-Hansberg (2008) and by Costinot
and Vogel (2010). Both these models consider the general equilibrium effects of offshoring on wages under an economy-wide full
employment constrains. In Appendix A we propose an extension of our model in which the assumption of perfectly elastic labor
supply at given wages does not hold. There we show that, while with an endogenous native wage immigration and offshoring also
have wage effects, the corresponding employment effects discussed in Section 4.3 remain qualitatively the same.
12
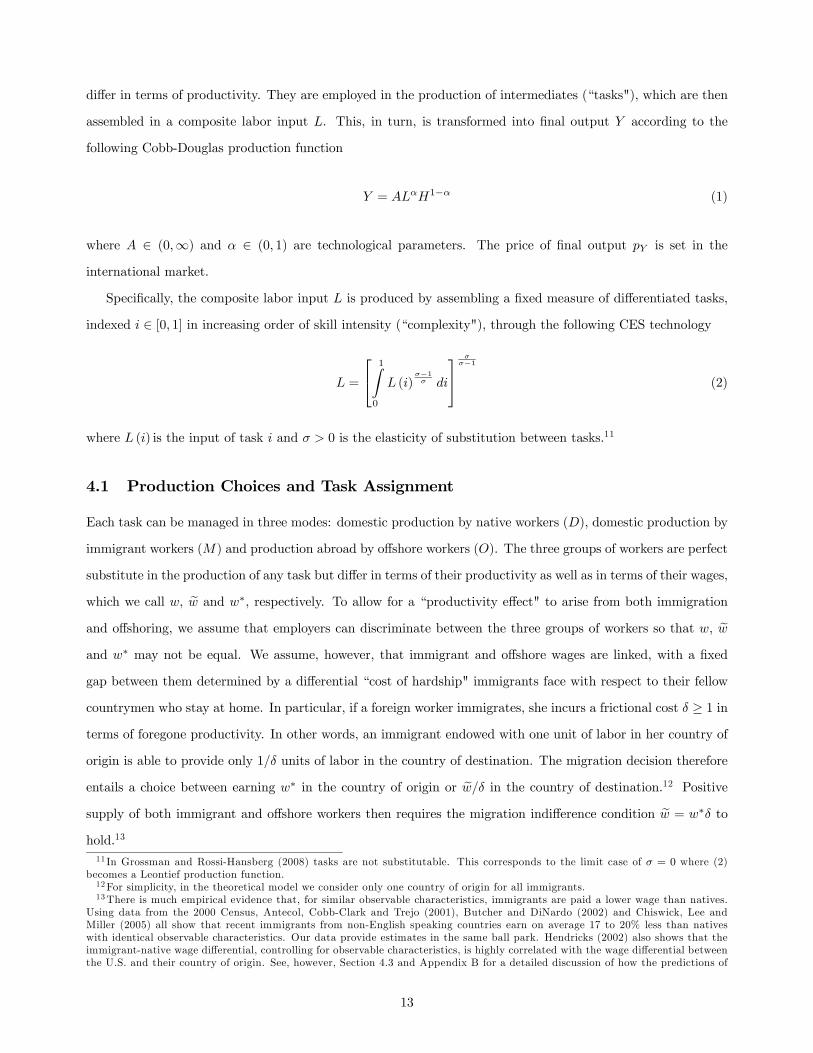
differ in terms of productivity. They are employed in the production of intermediates (“tasks"), which are then
assembled in a composite labor input . This, in turn, is transformed into final output according to the
following Cobb-Douglas production function
= 1− (1)
where ∈ (0∞) and ∈ (0 1) are technological parameters. The price of final output is set in the
international market.
Specifically, the composite labor input is produced by assembling a fixed measure of differentiated tasks,
indexed ∈ [0 1] in increasing order of skill intensity (“complexity"), through the following CES technology
=
⎡⎣ 1Z0
()−1
⎤⎦
−1
(2)
where () is the input of task and 0 is the elasticity of substitution between tasks.11
4.1 Production Choices and Task Assignment
Each task can be managed in three modes: domestic production by native workers (), domestic production by
immigrant workers () and production abroad by offshore workers (). The three groups of workers are perfect
substitute in the production of any task but differ in terms of their productivity as well as in terms of their wages,
which we call , e and ∗, respectively. To allow for a “productivity effect" to arise from both immigration
and offshoring, we assume that employers can discriminate between the three groups of workers so that , eand ∗ may not be equal. We assume, however, that immigrant and offshore wages are linked, with a fixed
gap between them determined by a differential “cost of hardship" immigrants face with respect to their fellow
countrymen who stay at home. In particular, if a foreign worker immigrates, she incurs a frictional cost ≥ 1 interms of foregone productivity. In other words, an immigrant endowed with one unit of labor in her country of
origin is able to provide only 1 units of labor in the country of destination. The migration decision therefore
entails a choice between earning ∗ in the country of origin or e in the country of destination.12 Positivesupply of both immigrant and offshore workers then requires the migration indifference condition e = ∗ to
hold.13
11 In Grossman and Rossi-Hansberg (2008) tasks are not substitutable. This corresponds to the limit case of = 0 where (2)becomes a Leontief production function.12For simplicity, in the theoretical model we consider only one country of origin for all immigrants.13There is much empirical evidence that, for similar observable characteristics, immigrants are paid a lower wage than natives.
Using data from the 2000 Census, Antecol, Cobb-Clark and Trejo (2001), Butcher and DiNardo (2002) and Chiswick, Lee and
Miller (2005) all show that recent immigrants from non-English speaking countries earn on average 17 to 20% less than natives
with identical observable characteristics. Our data provide estimates in the same ball park. Hendricks (2002) also shows that the
immigrant-native wage differential, controlling for observable characteristics, is highly correlated with the wage differential between
the U.S. and their country of origin. See, however, Section 4.3 and Appendix B for a detailed discussion of how the predictions of
13

In light of the descriptive evidence reported in Section 3, we now introduce assumptions that ensure that
immigrant, offshore and native workers specialize in low, medium and high complexity tasks, respectively. In
so doing, we follow Grossman and Rossi-Hansberg (2008) and define tasks so that they all require the same
unit labor requirement when performed by native workers. Accordingly, the marginal cost of producing
task employing native workers is () = . If task is instead offshored, its unit input requirement is
() with () ≥ 1. This implies a marginal cost of producing task employing offshore workers equal to
() = ∗(). Lastly, if task is assigned to immigrants, its unit input requirement is () with () ≥ 1so that the marginal cost of producing task employing immigrants is () = e() = ∗(). Hence,
in all tasks natives are more productive but, due to wage differences, not necessarily cheaper than immigrant
and offshore workers. We interpret a lower value of the frictional parameter as “easier offshoring" and a lower
value of the frictional parameter as “easier immigration".
As native, immigrant and offshore workers are perfectly substitutable, in equilibrium any task will be per-
formed by only one type of workers: the one that entails the lowest marginal cost for that task.14 A task is
offshored rather than performed by natives whenever the former option is cheaper so that () ≤ () or
equivalently
≥ ∗() (3)
Analogously, a task is assigned to an immigrant rather than a native worker whenever it is cheaper to do so.
This is the case whenever () ≤ () or equivalently
≥ ∗() (4)
Finally, a task is offshored rather than performed by immigrants whenever () ≤ () or equivalently
() ≤ () (5)
Necessary and sufficient conditions for the envisaged pattern of task specialization to materialize are as follows.
Imposing
0() 0 and
∗(1)
∗(0)(6)
the model would change were firms assumed to be unable to discriminate between native and immigrants workers.14 If native, immigrant and offshore workers were imperfectly substitutable, each task could be performed by “teams" consisting
of the three types of workers. Then, rather than full specialization of workers’ types in different tasks, one would observe partial
specialization, with the shares of the three types in each task inversely related to the corresponding marginal costs. While in reality
several tasks are indeed performed by a combination of differ types of workers, nonetheless the intuition behind the key results of
the model is better served by assuming perfect substitutability.
14
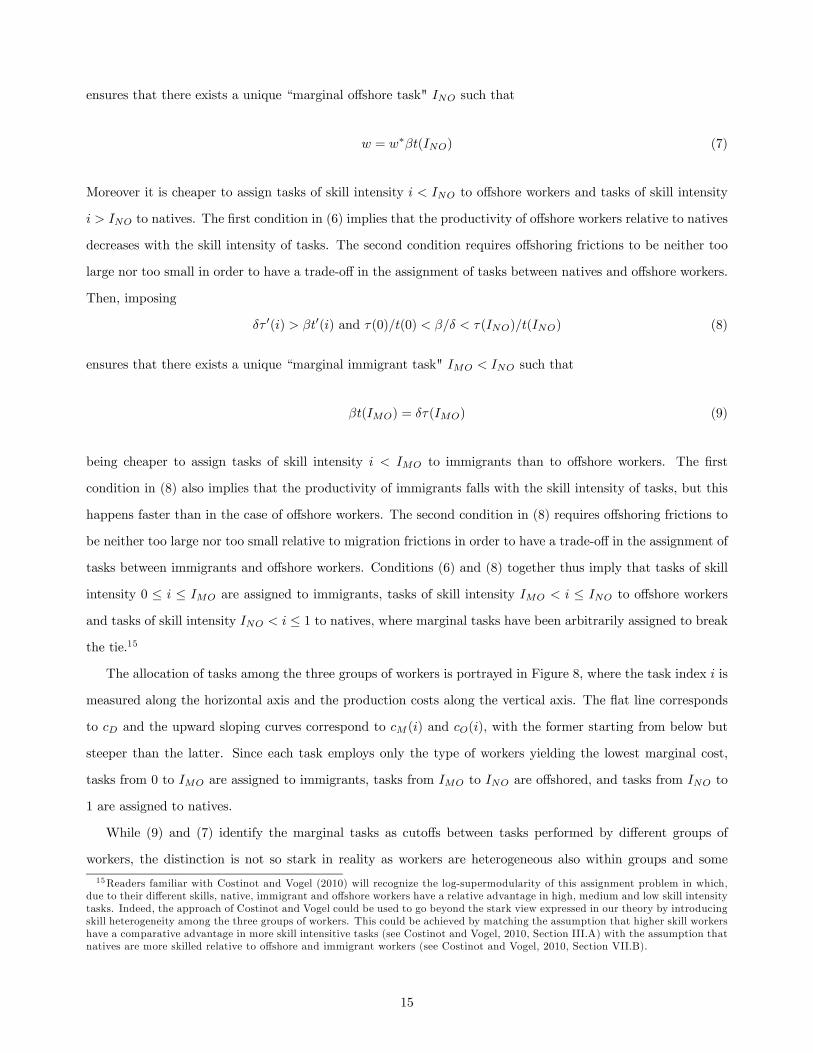
ensures that there exists a unique “marginal offshore task" such that
= ∗() (7)
Moreover it is cheaper to assign tasks of skill intensity to offshore workers and tasks of skill intensity
to natives. The first condition in (6) implies that the productivity of offshore workers relative to natives
decreases with the skill intensity of tasks. The second condition requires offshoring frictions to be neither too
large nor too small in order to have a trade-off in the assignment of tasks between natives and offshore workers.
Then, imposing
0() 0() and (0)(0) ()() (8)
ensures that there exists a unique “marginal immigrant task" such that
() = () (9)
being cheaper to assign tasks of skill intensity to immigrants than to offshore workers. The first
condition in (8) also implies that the productivity of immigrants falls with the skill intensity of tasks, but this
happens faster than in the case of offshore workers. The second condition in (8) requires offshoring frictions to
be neither too large nor too small relative to migration frictions in order to have a trade-off in the assignment of
tasks between immigrants and offshore workers. Conditions (6) and (8) together thus imply that tasks of skill
intensity 0 ≤ ≤ are assigned to immigrants, tasks of skill intensity ≤ to offshore workers
and tasks of skill intensity ≤ 1 to natives, where marginal tasks have been arbitrarily assigned to breakthe tie.15
The allocation of tasks among the three groups of workers is portrayed in Figure 8, where the task index is
measured along the horizontal axis and the production costs along the vertical axis. The flat line corresponds
to and the upward sloping curves correspond to () and (), with the former starting from below but
steeper than the latter. Since each task employs only the type of workers yielding the lowest marginal cost,
tasks from 0 to are assigned to immigrants, tasks from to are offshored, and tasks from to
1 are assigned to natives.
While (9) and (7) identify the marginal tasks as cutoffs between tasks performed by different groups of
workers, the distinction is not so stark in reality as workers are heterogeneous also within groups and some
15Readers familiar with Costinot and Vogel (2010) will recognize the log-supermodularity of this assignment problem in which,
due to their different skills, native, immigrant and offshore workers have a relative advantage in high, medium and low skill intensity
tasks. Indeed, the approach of Costinot and Vogel could be used to go beyond the stark view expressed in our theory by introducing
skill heterogeneity among the three groups of workers. This could be achieved by matching the assumption that higher skill workers
have a comparative advantage in more skill intensitive tasks (see Costinot and Vogel, 2010, Section III.A) with the assumption that
natives are more skilled relative to offshore and immigrant workers (see Costinot and Vogel, 2010, Section VII.B).
15
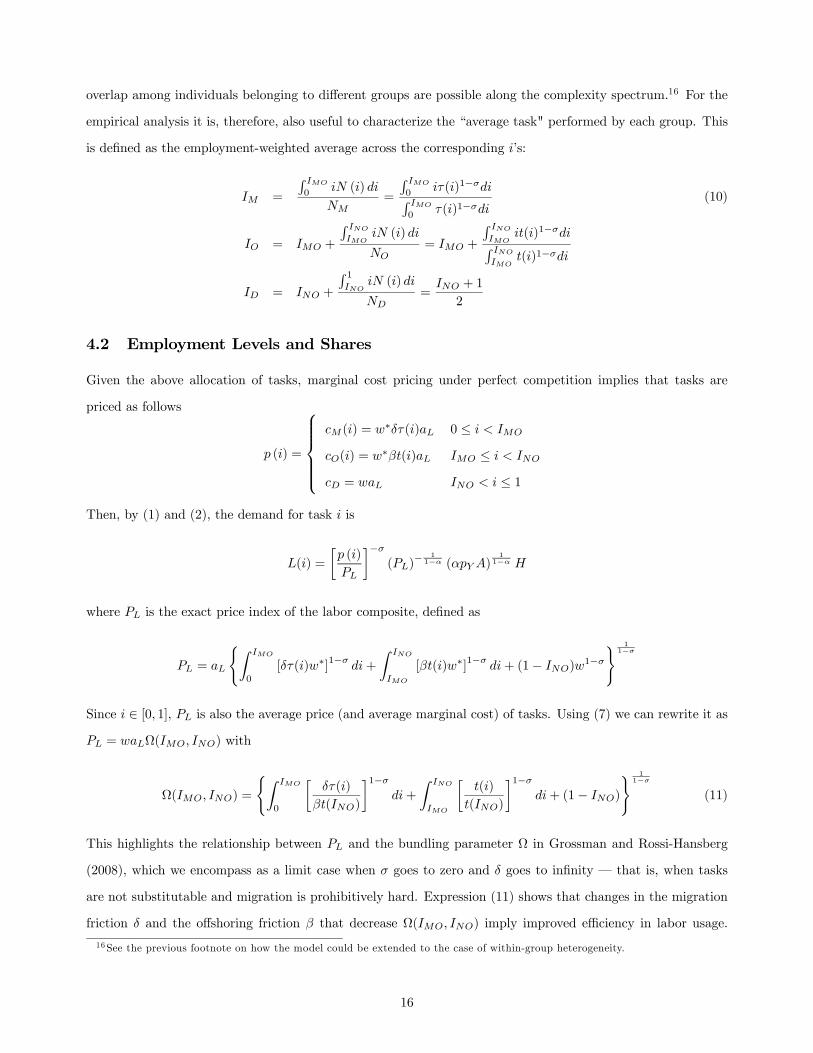
overlap among individuals belonging to different groups are possible along the complexity spectrum.16 For the
empirical analysis it is, therefore, also useful to characterize the “average task" performed by each group. This
is defined as the employment-weighted average across the corresponding ’s:
=
R
0 ()
=
R
0()1−R
0()1−
(10)
= +
R
()
= +
R
()1−R
()1−
= +
R 1
()
=
+ 1
2
4.2 Employment Levels and Shares
Given the above allocation of tasks, marginal cost pricing under perfect competition implies that tasks are
priced as follows
() =
⎧⎪⎪⎪⎪⎨⎪⎪⎪⎪⎩ () = ∗() 0 ≤
() = ∗() ≤
= ≤ 1
Then, by (1) and (2), the demand for task is
() =
∙ ()
¸−()
− 11− ()
11−
where is the exact price index of the labor composite, defined as
=
(Z
0
[()∗]1− +Z
[()∗]1− + (1− )1−
) 11−
Since ∈ [0 1], is also the average price (and average marginal cost) of tasks. Using (7) we can rewrite it as = Ω( ) with
Ω( ) =
(Z
0
∙()
()
¸1−+
Z
∙()
()
¸1−+ (1− )
) 11−
(11)
This highlights the relationship between and the bundling parameter Ω in Grossman and Rossi-Hansberg
(2008), which we encompass as a limit case when goes to zero and goes to infinity – that is, when tasks
are not substitutable and migration is prohibitively hard. Expression (11) shows that changes in the migration
friction and the offshoring friction that decrease Ω( ) imply improved efficiency in labor usage.
16See the previous footnote on how the model could be extended to the case of within-group heterogeneity.
16

This is the source of the productivity effects of immigration and offshoring discussed in Section 4.3.
Taking into account the different marginal productivity of the three groups of workers, the amount of labor
demanded to perform task is
() =
⎧⎪⎪⎪⎪⎨⎪⎪⎪⎪⎩()() 0 ≤
()() ≤
() ≤ 1
so that immigrant, offshore and native employment levels are given by
=
Z
0
() =1
∗
µ
¶1−()
− 1− (12)
=
Z
() =1
∗
µ
¶1−()
− 1−
=
Z 1
() =1
µ
¶1−()
− 1−
where = ()1
1− 0 is a combination of parameters and exogenous variables, and the exact price
indices of immigrant, offshore and native tasks are given by
=
(Z
0
[()∗]1−
) 11−
=
(Z
[()∗]1−
) 11−
= ©(1− )
1−ª 11−
(13)
Note that is the number of immigrants employed whereas, due to the frictional migration cost, the corre-
sponding number of units of immigrant labor is . Hence, sector employment is = + + .
The shares of the three groups of workers in sectorial employment are thus
=( )
1−
( )1− + ()
1− + ()1− (∗)
(14)
=()
1−
( )1−
+ ()1−
+ ()1−
(∗)
=(∗) ()
1−
( )1−
+ ()1−
+ ()1−
(∗)
4.3 Comparative Statics
We are interested in how marginal and average tasks, as well as employment shares and levels, vary across the
three types of workers when offshoring and migration costs change.
Given (9) and (7), the solution of our task assignment problem implies that marginal tasks exhibit the
17

following properties:
0
0
= 0
0
These highlight the adjustments in employment occurring in terms of the number of tasks allocated to the three
groups of workers. They can be readily interpreted using Figure 8. For example, a reduction in offshoring
costs (lower ) shifts () downward, thus increasing the number of offshored tasks through a reduction in
both the number of tasks assigned to immigrants ( 0) and the number of tasks assigned to natives
( 0). Analogously, a reduction in the migration costs (lower ) shifts () downward, thus increasing
the number of tasks assigned to immigrants through a decrease in the number of offshored tasks (higher ).
Accordingly, given (10) we also have the following properties for average tasks:
0
0 (15)
= 0
0
These are driven by compositional changes due to adjustments both in the number of tasks allocated to the
three groups and in the employment shares of the different tasks allocated to the three groups. Note that
changes in migration costs have also a negative impact on the average offshored task ( 0). The
impact of offshoring costs on the average offshore task () is, instead, ambiguous. This is due to opposing
adjustments in the allocation of tasks given that, when falls, some of the additional offshore tasks have low
(i.e. falls) while others have high (i.e. rises).
Looking at (14), the impacts of declining and on employment shares are all unambiguous. By making
offshore workers more productive and thus reducing the price index of offshore tasks relative to all tasks, a lower
offshoring cost, , reallocates tasks from immigrants and natives to offshore workers. By reducing the price
index of immigrant tasks relative to all tasks, a lower migration cost, , moves tasks away from offshore and
native workers toward immigrants:
0
0
0 (16)
0
0
0
These results capture the signs of the “displacement effects" for the three groups of workers.
Turning to the impact of declining and on employment levels, expressions (12) reveal an additional
18
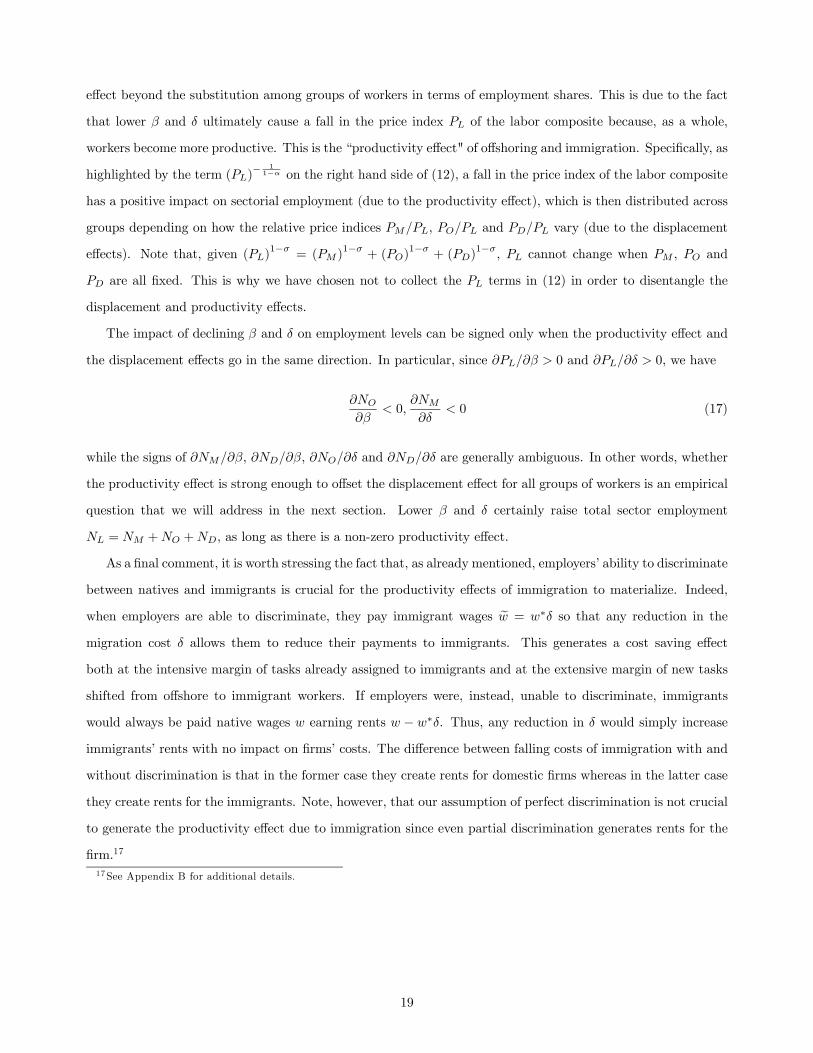
effect beyond the substitution among groups of workers in terms of employment shares. This is due to the fact
that lower and ultimately cause a fall in the price index of the labor composite because, as a whole,
workers become more productive. This is the “productivity effect" of offshoring and immigration. Specifically, as
highlighted by the term ()− 11− on the right hand side of (12), a fall in the price index of the labor composite
has a positive impact on sectorial employment (due to the productivity effect), which is then distributed across
groups depending on how the relative price indices , and vary (due to the displacement
effects). Note that, given ()1−
= ( )1−
+ ()1−
+ ()1−
, cannot change when , and
are all fixed. This is why we have chosen not to collect the terms in (12) in order to disentangle the
displacement and productivity effects.
The impact of declining and on employment levels can be signed only when the productivity effect and
the displacement effects go in the same direction. In particular, since 0 and 0, we have
0
0 (17)
while the signs of , , and are generally ambiguous. In other words, whether
the productivity effect is strong enough to offset the displacement effect for all groups of workers is an empirical
question that we will address in the next section. Lower and certainly raise total sector employment
= + +, as long as there is a non-zero productivity effect.
As a final comment, it is worth stressing the fact that, as already mentioned, employers’ ability to discriminate
between natives and immigrants is crucial for the productivity effects of immigration to materialize. Indeed,
when employers are able to discriminate, they pay immigrant wages e = ∗ so that any reduction in the
migration cost allows them to reduce their payments to immigrants. This generates a cost saving effect
both at the intensive margin of tasks already assigned to immigrants and at the extensive margin of new tasks
shifted from offshore to immigrant workers. If employers were, instead, unable to discriminate, immigrants
would always be paid native wages earning rents − ∗. Thus, any reduction in would simply increase
immigrants’ rents with no impact on firms’ costs. The difference between falling costs of immigration with and
without discrimination is that in the former case they create rents for domestic firms whereas in the latter case
they create rents for the immigrants. Note, however, that our assumption of perfect discrimination is not crucial
to generate the productivity effect due to immigration since even partial discrimination generates rents for the
firm.17
17See Appendix B for additional details.
19
5 Empirical Specifications and Econometric Results
In this section we bring the predictions of our model to the data. We target the three sets of predictions
highlighted in the previous section about the effects of easier immigration and offshoring on the employment
shares, the employment levels and the average task assignments of natives and of the other groups of workers,
as highlighted in (15), (16), and (17), respectively.
The predictions of the model have been derived for a single industry leaving industry and time indices
implicit for notational convenience. Hence, in order to implement (10), (12), and (14) empirically we begin by
identifying the parameters that vary across industries (to be indexed by ) and over time (to be indexed by )
and those that do not (and carry no index). First, the offshoring and immigration cost parameters vary across
industries and over time, and thus we label them and . We motivate this in Section 5.1 in which we
present our empirical measures. Second, we consider the specific factor endowment to be industry-specific
but not time-varying. The same holds for the baseline sector-specific total factor productivity . We allow,
however, for random productivity shocks through a possibly serially correlated error term . Both and
will be captured by an industry fixed effect. Finally, as wages have been assumed to be equalized across
industries, we allow them to vary only though time, writing and ∗ , which calls for a time effect.
To summarize, we will exploit differences in immigration and offshoring costs within industries over time
in order to identify the impact on native and immigrant employment as well as on native and immigrant task
specialization.
5.1 Costs of Immigration and Offshoring
Driving the shifts in and are changes in the accessibility of offshore and immigrant workers. Since
we do not observe industry-specific offshoring and immigration costs, we begin by using direct measures of the
employment share of immigrant and offshore workers across industries and over time as explanatory variables. If
the variation in costs, once we control for industry and time effects, is the main source of variation in immigration
and offshoring within an industry, then the OLS regression will identify the effect on native outcomes of changes
in the cost of immigration and offshoring. As we are aware that this is an heroic assumption, we instrument
the share of immigrants and offshore workers with variables proxying their cross-industry costs and availability.
The assumption that offshoring costs vary across industries departs from Grossman and Rossi-Hansberg
(2008), who suggest that this cost is more or less the same across industries. This is probably true if one
wants to stress, as they do, the technological dimension of offshoring costs, which implies very little variation
across similar tasks in different industries. Our focus is, instead, on the trade cost dimension of offshoring,
which hampers the re-import of the output generated by offshored tasks and is affected by industry-specific
characteristics. In this respect, in order to capture exogenous variation in offshoring costs and generate an
20
instrument for offshore employment in an industry-year, we collect two types of U.S. tariff data, each by year
and product: Most Favored Nation (MFN) tariffs and Information Technology Agreement (ITA) tariffs. These
are then aggregated up to the BEA industry level for each year, weighting the tariffs by the value of imports
in each detailed industry, where we obtain U.S. imports from Feenstra, Romalis and Schott (2002). The MFN
tariffs are mandated for all WTO signatories, while the ITA tariffs had been adopted by 43 countries at the
end of our period (2007), covering 97 percent of world trade in technology products. The ITA covers a range
of manufactured technology products (see Appendix E for a full list of products and adopters) and, for our
purposes, is an important source of time-series variation, as MFN tariffs do not change much within industries
over our period.
The instrument we use to proxy cost-driven immigration by industry and year extends the method first
proposed by Altonji and Card (1991) and Card, (2001) to identify cost-driven local shifts in immigrants. We
exploit the fact that foreigners from different countries have increased or decreased their relative presence in the
U.S. according to changes to the cost of migrating and to domestic conditions that are specific to their countries
of origin. The different initial presence of immigrants from different origins in an industry makes that industry
more or less subject to those shifts in origin-specific cost- and push-factors. Using these two facts we impute the
population of each of 10 main groups of immigrants across industries over time18. Specifically, we use the initial
share of immigrant workers, by origin-group, in each industry and we augment it by the aggregate growth rate,
of the population of the group, in the U.S. relative to the US total population. Adding across origin-groups we
then obtain the imputed share of foreign-born in employment. We call this measure "Imputed Immigration"
and note that it varies across industry and time. This index is similar to the constructed shift-share instrument
often used in studies of immigration in local labor markets (e.g., Card, 2001; Card and DiNardo, 2000; Peri and
Sparber, 2009), except that it exploits differences in the presence of immigrant groups (from different countries)
across industries, rather than across localities. There are some recent papers that document the existence of
industry and occupation-specific immigrants networks (e.g. Patel and Vella 2007) , in part due to the geographic
concentration of industries.
Our identification works if industries, as localities, are important vehicles for immigrants networks. This is
likely to be stronger in industries that are geographically concentrated. In Section 5.5.3 we will focus exclusively
on industries that are highly concentrated geographically. Because of localized ethnic networks (Bartel, 1989),
we would expect that the initial distribution of immigrants in such industries would be an even stronger predictor
of future immigration flows. This is indeed what we will find.
18The ten countries/regions of origin are: Mexico, Rest of Latin America, Canada-Australia-New Zealand, Western Europe,
Eastern Europe, China, India, Rest of Asia, Africa, and Other.
21
5.2 Effects on Employment Shares
We begin by estimating the impacts of variation in immigration and offshoring costs on the shares of native,
immigrant and offshore workers, thereby exploring the relative substitutability of these worker types through the
extent to which they displace one another. In Section 5.3 we will then analyze the impact on the employment
levels of these groups, which includes the productivity impact of the changing costs of immigration and off-
shoring. Finally, in Section 5.4, we will explore the impact on the task specialization of natives and immigrants.
Using the same notation as we used in the theoretical model but making industry and time indices explicit as
discussed above, we implement (14) empirically by estimating the following three regressions
= + + () + () + (18)
= + + () + (19)
= + + () + (20)
where and are the employment shares of offshore and immigrant workers in industry at time , the
’s are industry fixed effects, the ’s are time effects, and the ’s are (potentially) serially correlated errors.
Estimation is based on 2SLS using the instruments described in Section 5.1.
Equation (18) estimates the impact of variations in offshoring and immigration share driven by push and
cost factors as captured by the instruments, on native workers’ share of employment. By including industry
effects we only exploit variation within a 4-digit NAICS manufacturing industry over time. We also control
for common-year effects and, as a result, any time-invariant difference in offshoring costs across industries and
any common trend in offshoring costs over time will not contribute to the identification of the effect. Equation
(19) estimates the effect of variation in offshoring costs on the immigrant share of employment and, conversely,
equation (20) estimates the effect on the share of offshore worker of a decrease in immigration costs.
From Section 4.3 the predictions of the model are as follows: 0 ≈ 0 0 and 0 Table
2 reports the estimated effects. First, columns (1)-(4) show the 2SLS effects of increasing shares of immigrant
and offshore workers on the share of native workers. Because the shares must sum to 1, the immigrant and
offshore worker shares are collinear, and so we must estimate their effects separately (as the sole regressors in
separate regressions). We therefore estimate each effect, first, using both instrumental variables (columns (1)
and (2)) for offshoring or immigration and, then, using a single instrumental variable — i.e., only the imputed
immigration measure for immigration shares and only tariffs for offshore worker shares (columns (3) and (4)).
Column (5) adopts the more inclusive definition of offshoring — augmented by the arm’s length component.
Columns (6) reports the effects of variation in offshoring costs on the share of immigrants and Column (7)
22
shows the effect of variation in immigration costs on the share of offshore workers. Ineach case we using the
single relevant instrumental variable. The standard errors reported in each regression are heteroskedasticity
robust and clustered at the sector level to account for the potential serial correlation of errors.
The results are interesting and encouraging as the four predictions of the model are mostly matched by the
estimates. Looking along the first row, we see that increased immigration in an industry has an insignificant
effect on the share of native employment in that industry and a negative (non significant) effect on the share of
offshore employment (recall that the model predicted no effect on natives and a negative effect on immigrants,
respectively). Stronger results are obtained in the second row, which shows that there is a negative effect of
offshore employment on the share of both native and immigrant workers in an industry, exactly as predicted in
(16). Each of the estimates is significantly different from zero. In addition, the coefficients on the two measures
of offshore employment (Column 3 and 5) are nearly identical.
These findings suggest that immigrants and natives compete more with offshore workers than with each-
other. This is consistent with a large part of the labor literature (e.g., Card, 2001; or Ottaviano and Peri, 2008)
that does not find a significant negative impact of immigrants on native employment. Conversely, if the share of
immigrants were to decrease due to an increase in the cost of immigration — for instance, due to more restrictive
immigration laws — our results imply that immigrants are more likely to be substituted by offshore workers than
by native workers. As the decline in offshoring costs has a greater impact on natives than on immigrants, our
results also suggest that over the 8 years considered (2000-2007) the tasks that were offshored were likely to be
at the high end of the task spectrum for offshore workers.
5.3 Effects on Employment Levels
Another important implication of our model, highlighted in Section 4.3, is the existence of a “productivity
effect" that results from hiring immigrant or offshore workers when the associated costs decline. Such an effect
leads to an increase in the aggregate demand for all worker types. This productivity effect, combined with the
effect on shares described in the previous section, should imply a mitigated, null, or perhaps even positive effect
of offshoring on native employment and a positive effect of immigration on native employment. Table 3 presents
the estimated coefficients from the following four regressions that empirically implement (12):
= + +() + () + (21)
= + +() + (22)
= + + () + (23)
23
where , and are the logarithm of the employment levels of native, immigrant and offshore
workers, respectively. The method of estimation used is 2SLS using the cost-driven offshoring and immigration
instruments19. In Table 4 we then present the estimates for the aggregate employment regression:
= + +() + () + (24)
where is aggregate logarithm of employment in industry and year . In all specifications, the ’s are
industry fixed effects, the ’s are time effects, and ’s are (possibly) serially correlated errors. The effects
estimated in Table 3 combine the productivity effects with the displacement effects. Regression (24), instead,
captures the pure productivity effects of offshoring and immigration at the industry level. A positive estimate
of and would imply a positive overall productivity effect of a drop in offshoring and immigration
costs . Estimation is performed by 2SLS and heteroskedasticity-robust standard errors clustered by industry
are reported.
The results presented in Table 3 are in line with the predictions of the model. Firstly, it is important to
note that the first-stage F-Statistics are not too large but usually above the less stringent Stock and Yogo test-
statistic for weak instruments. In fact they are 4.79 when jointly estimated and 7.43 when estimated separately.
The employment estimates seem to reveal a positive and significant productivity effect of immigration, and an
implied positive productivity effect of offshoring, on native-born workers. A decline of the costs of immigration
associated to a 1% increase in immigrants produces an increase in the employment of natives equal to 0.42%
(Table 3, column (3)) and has no significant effect on the total employment of offshore workers (Table 3, column
(7)). The productivity effect of offshoring is revealed by the fact that, whereas offshoring unambiguously reduced
the share of natives in an industry (Table 2, columns (1) and (3)), it has no effect on aggregate employment of
natives (Table 3, columns (1)-(5)). Thus, while offshore workers compete directly with natives, their employment
generates productivity gains that “increase the size of the pie", leading to an overall neutral impact on native
employment. Table 4 shows directly the results from specification (24) which are informative on the size and
significance of the productivity effects. Those coefficients show the impact of decreasing costs of offshoring and
immigration on the overall size of the “employment pie" to be distributed across workers. As evidenced by
the 2SLS results, both offshoring and immigration have positive productivity effects on the industry, however
such an effect is only statistically significant in the case of immigration20. Columns (1) and (2) in Table 4
show that an increase in immigrant share equal to 1% increases aggregate employment by 3.9%, implying a
significant expansion, driven by the productivity effect. This is a substantial effect, particularly if we keep in
19 In specifications of Table 3 we include the logarithm of the level (rather than the share) of immigrants and offshore workers
as explanatory variables to produce coefficients that can be interpreted as elasticities. As we use the same cost and push-driven
instruments for immigraton and tariffs for offshoring the identifying variation is the same as in the other tables.20The results on offshoring are broadly consistent with Amiti and Wei (2005), who also find evidence of productivity effects by
estimating conditional and unconditional labor demand functions.
24
mind that manufacturing employment actually declined over this period. At the same time an increase in the
share of offshore employment by 1% is associated with an increase in aggregate employment by 1.72%, but
the effect (although large) is not significant. Column (3) and (4) of Table 4 show the direct OLS regression
of the aggregate employment on the imputed share of immigrants (a measure of migration openness for the
sector) and on sector specific tariffs (a measure of offshoring costs). The regression confirms that an increase
in cost-driven availability of immigrants drives up significantly the employment of the sector. A decrease in
off-shoring costs, on the other hand, has a positive, but not significant, effect on employment. Interestingly,
the presence of productivity effects due to immigration and offshoring implies that, even taken together, these
two forms of globalization of labor have not harmed native employment in industries most exposed to them.
To the contrary, the cost savings obtained from the tasks performed by immigrants and offshore workers have
promoted an expansion of these industries relative to others and have ultimately led to increased demand for
native workers relative to a scenario in which all tasks were performed by natives.
5.4 Effects on Tasks
Finally, our model has predictions regarding the effects of offshoring and immigration costs on the skill intensity
of the tasks performed by the three groups of workers. To see whether these predictions find support in the
data, we focus on the average rather than the marginal task21 performed by each group, which we compute by
weighting the individual indices of complexity described in Section 3 by hours worked.
Given that skill intensity measures are only available for natives and immigrants, we implement (10) empir-
ically for these two groups by estimating the following two regressions
= + + () + () + (25)
= + + () + () + (26)
The variables and in (26) are the average skill intensities of tasks assigned to natives and immigrants,
respectively; and are the employment shares of offshore and immigrant workers in industry at time
. The ’s represent industry fixed effects, the ’s are time effects. Finally the ’s are (possibly) serially
correlated errors.
Table 5 shows the results from OLS and 2SLS specifications, where we use, as always, the instruments
described in Section 5.1. We present the effects on the summary indices of Complexity, and , as well
as the effect on Communication Intensity, Cognitive Intensity and Non-Manual Intensity (the inverse of the
Manual index) separately. We focus on the 2SLS results, reported in the third and fourth row. The first stage
21For the reasons discussed in Section 4.1 the predictions on average tasks hold also in a probabilistic environment where there
would be regions of task overlap between workers and hence no marginal task.
25
F-Statistics are quite strong (well a bove 10) and the first column in Table 5 shows a positive and significant
effect of offshoring and no effect of immigration on the Complexity of native tasks. The same holds true for
their Communication Intensity, Cognitive Intensity and Non-Manual Intensity. Again this is consistent with the
predictions of the theoretical model. Columns (5) and (6) indicate that offshoring has little effect on the skill
intensity of immigrant tasks but, at the same time, has a large positive impact on the gap between immigrant
and native tasks ( − ). This suggests that the role of offshore workers hollowing out the task spectrum
operates primarily by forcing native workers into more complex tasks. This confirms the results found on
employment shares (of native and immigrants) in Table 2. Offshoring leads to increased polarization in native
and immigrant specialization, mainly by pushing natives towards more complex jobs. The effect is not negligible.
Since the standard deviation across sectors in the share of offshore workers during the period is around 14%,
such difference multiplied by the coefficient on the complexity index estimated in column (1) implies a difference
in task complexity of natives of 9%. This is about half of the standard deviation of complexity across sectors,
and also half of the average difference in complexity of tasks performed by immigrants and natives.
5.5 Extensions and Checks
Before concluding we discuss three issues concerning three key assumptions of our theoretical framework: the
type of offshoring we model; the lack of a wage response to increased offshoring and immigration; the strength
of our immigration instrument when we restrict to industries that are relatively concentrated in space.
5.5.1 Horizontal versus Vertical Offshoring
A recent study by Harrison and McMillan (2011) emphasizes that, in order to identify the effects of offshore
employment on domestic employment, one needs to distinguish between “horizontal" and “vertical" offshoring.
In particular, they show that increased “horizontal" offshoring - through which production is moved abroad to
serve the local market- hurts domestic jobs. In contrast, “vertical" offshoring - through which some intermediate
stages of production are moved abroad and the intermediates are re-imported to the U.S. for further processing
- is found to be beneficial to domestic employment. For this reason it is interesting to re-run our regressions of
Table 5 on a sample of industries that are relatively intensive in vertical offshoring. This is also more consistent
with our theoretical framework, which is a model of vertical rather than horizontal offshoring.
In our sample we are able to identify those industries for which re-exporting to the headquarters, as opposed
to generating purely local sales, is a more important activity for the affiliates. Specifically, using the BEA data
we can calculate the aggregate value of exports from affiliates to headquarters as well as the total value of local
sales of affiliates. Then, we can rank industries in terms of their import-to-local-sales ratios, which we take as
a measure of the intensity of vertical offshoring. Finally, we re-run our regressions focusing on industries whose
26
import-to-local-sales ratios are above some thresholds. Based on Harrison and McMillan (2011), as well as on
the logic of our model, we expect to find stronger results for industries with higher import-to-local-sales ratios.
Table 6, columns (1)-(3), report the 2SLS effect of variation in offshoring costs on native task complexity when
we limit the sample to industries with high intensity of vertical offshoring, as defined according to three different
threshold values22 . Since this procedure selects subsets of industries, in each case the sample of observations
is reduced accordingly. The patterns identified in these columns reproduce the aggregate patterns from the
previous section, with the primary difference being that, as expected, the effect is stronger for industries at the
highest relative intensity of vertical offshoring. In columns (4)-(6), the corresponding estimates for industries
with low intensity of vertical offshoring show instead a weak (not significant) effect on native task complexity.
Hence, it is the vertical nature of offshoring activities that seems to generate competition between natives and
offshore workers, thereby altering the allocation of production tasks within industries.
5.5.2 Wage Effects
Our model and empirical strategy have examined employment across industries in order to capture the produc-
tivity consequences of immigration and offshoring. However, in the presence of imperfect mobility of workers,
or barriers to transferring skills from one industry to another, a portion of the industry-specific effects of im-
migration and offshoring could be captured by wage rather than employment differentials. In particular, while
the U.S. labor force is mobile geographically, as well as across industries, in the short run wages may not be
perfectly equalized.
To address this issue, we check directly whether industry wages are affected by offshoring and immigration
by running a specification like (21), except using the average wage of natives instead of their employment as
the dependent variable. The average wage is constructed from ACS data, as detailed in Section 3.1. The results
reported in Table 7 are quite clear and consistent across each specification (with each effect estimated via
separate regressions to be consistent with the specification in Table 2). While the point-estimates of the effect
of increased offshoring and immigration on native wages are always positive, those effects are never significant.
These results confirm that, while there may be a productivity effect of offshoring and immigration on wages,
the assumption of inter-sector mobility of workers is reasonable as the adjustment to cross-sector productivity
differences takes place mainly through employment reallocation.
5.5.3 Geographically Concentrated Industries
As discussed in Section 5.1, the immigration instrument we adopt is usually constructed using variation across
localities rather than industries. As further check that industry-specific network effects of immigrants also
22We choose thresholds of the ratio of re-imports to total local sales of 0.3, 0.2 and 0.1. This range spans the intermediate range
of values as the median ratio in the whole sample is 0.2.
27
rely on geographic concentration of an industry, we re-run regression (21), focusing on industries that are
particularly concentrated in space. Since our 2SLS approach relies on a strong relationship between the flow of
immigrants from a particular country into an industry and the share of U.S. immigrants from the same country
already working in that industry, the first-stage regression should show increased power for more geographically
concentrated industries. The reason is that new immigrants tend to favor destinations where the costs of
hardship are lower thanks to the presence of the ethnic networks created by previous immigrants (Card, 2001;
Card and DiNardo, 2000; Peri and Sparber, 2009). A recent paper by Vella and Patel (2007) also shows a
concentration of immigrants by location and type of occupation.
Specifically, in order to capture the degree to which an industry is concentrated within the U.S., we calculate a
geographic Gini coefficient for each industry using data on state and industry employment in 2000. Interestingly,
the manufacturing sector as a whole is significantly more concentrated than non-manufacturing, with an average
Gini of 0.75 compared to 0.72, which bodes well for the validity of the instrument overall. In other words, an
immigrant’s decision regarding which industry to work in may overlap with their choice of location, strengthening
the network effects underlying our IV approach. We therefore take the manufacturing average as our threshold
and reproduce the first-stage regression using only those industries with a Gini larger than 0.75, a value that is
also near the median and so selects nearly 50% of the sample.
The corresponding findings are depicted in Table 8. Comparing the 2SLS results in columns (3) and (4)
with the results for the entire sample in Table 3, we see that restricting the sample to more concentrated
industries increases the estimated, average impact of immigrants on native employment. Note also that this is
not true in the OLS estimates in columns (1) and (2) in which the estimated, average impact of immigrants on
natives declines slightly. Combined with the relatively stronger first-stage coefficient shown in column (3) (to
be compared with column (3) in Table 3) we interpret this as overall evidence that our immigration instrument
has more power in for spatially concentrated industries and for those, the productivity effect of immigration is
also somewhat stronger.
6 Conclusions
We have analyzed the effects of easier offshoring and immigration on the employment share, employment level
and task specialization of native workers within the U.S. manufacturing sector from 2000 to 2007. As mentioned
in the introduction, there are very few attempts to combine analyses of immigration and offshoring on labor
markets. Analyzing each in isolation misses the possibility that hiring immigrants or offshoring productive tasks
are alternatives that are simultaneously available to producers and may compete with each other or with hiring
a native worker.
We have modeled and found empirical support for a scenario in which jobs (“tasks") vary in terms of their
28

relative intensity of workers’ skills and workers differ in terms of their relative endowment of those skills with
a systematic component across native, immigrant or offshore groups. As long as only natives are available,
producers will only employ them. Once immigrant and offshore workers become employable, efficiency gains
can be reaped by hiring them to perform tasks in which, due to their skills, they have a relative advantage, giving
native workers the opportunity to specialize in the tasks in which they exhibit their own relative advantage. If
strong enough, the productivity effect associated with this improved task assignment may offset the displacement
effect of immigration and offshoring on native workers’ employment.
Despite the widely held belief that immigration and offshoring are reducing the job opportunities of U.S.
natives, we have found instead that, during our period of observation, manufacturing industries with a larger
increase in global exposure (through offshoring and immigration) fared better than those with lagging exposure
in terms of native employment growth.
29
References
Altonji, Joseph G. and David Card, 1991. “The Effects of Immigration on the Labor Market Outcomes of
Less-skilled Natives," NBER Chapters, in: Immigration, Trade and the Labor Market, pages 201-234 National
Bureau of Economic Research, Inc.
Amiti Mary and Shang-Jin Wei (2005) “Fear of service outsourcing: is it justified?," Economic Policy, Vol. 20,
No. 42, pp. 308-347.
Antecol, Heather, Deborah A. Cobb-Clark and Stephen J. Trejo (2001) “Immigration Policy and the Skills
of Immigrants to Australia, Canada, and the United States," Claremont Colleges Working Papers 2001-26,
Claremont Colleges.
Antras, Pol (2003) “Firms, Contracts, and Trade Structure," Quarterly Journal of Economics, Vol. 118 No. 4,
pp. 1375-1418
Antras, Pol, Luis Garicano and Esteban Rossi-Hansberg (2006) "Offshoring in a Knowledge Economy,"Quarterly
Journal of Economics, Vol. 121, No. 1, pp. 31-77.
Autor, David H. and Lawrence Katz (1999) “Changes in the Wage Structure and Earnings Inequality," in O.
Ashenfelter and D. Card, eds., Handbook of Labor Economics, vol. 3A, North-Holland, pp. 1463-1555.
Autor, David H., Lawrence Katz and Melissa S. Kearney (2006) “The Polarization of the U.S. Labor Market,"
American Economics Association Papers and Proceedings, Vol. 96, No.2, pp. 189-194.
Autor, David H., Levy, Frank and Richard J. Murnane (2003) “The Skill Content of Recent Technological
Change: An Empirical Exploration," Quarterly Journal of Economics, Vol. 118, No. 4., pp. 1279-1334.
Barba Navaretti, Giorgio, Giuseppe Bertola and Alessandro Sembenelli (2008) “Offshoring and Immigrant
Employment - Firm-Level Theory and Evidence," Centro Studi Luca d’Agliano Development Studies Working
Paper No. 245.
Bartel, Ann P. (1989) “Where Do the New US Immigrants Live?," Journal of Labor Economics, Vol. 7, No. 4,
pp. 371-391.
Becker, Sascha O., Ekholm, Karolina and Marc-Andreas Muendler (2009) “Offshoring and the Onshore Com-
position of Tasks and Skills," CEPR Discussion Paper No. 7391.
Blanchard, Emily and Gerald Willmann (2011) “Trade, Education and the Shrinking Middle Class", Manuscript
Blinder, Alan (2007) “How Many U.S. Jobs Might Be Offshorable?," CEPS Working Paper No. 142.
30
Borjas, George J. (2003) “The Labor Demand Curve is Downward Sloping: Reexamining the Impact of Immi-
gration on the Labor Market,”Quarterly Journal of Economics, Vol. 118, No. 4, pp. 1335-1374.
Butcher, Kristin F. and John DiNardo (2002) “The Immigrant and Native-Born Wage Distributions: Evi-
dence from United States Censuses," Industrial and Labor Relations Review, ILR Review, ILR School, Cornell
University, Vol. 56, No. 1, pp. 97-121.
Card, David (2001) “Immigrant Inflows, Native Outflows, and the Local labor Market Impacts of Higher Im-
migration,”Journal of Labor Economics, Vol. 19, pp. 22-64.
Card, David (2009) “Immigration and Inequality," American Economic Review, American Economic Associa-
tion, vol. 99(2), pages 1-21, May.
Card, David and John DiNardo (2000) “Do Immigrant Inflows Lead to Native Outflows?," American Economic
Review, Vol. 90, No. 2, pp. 360-367.
Chassamboulli, Andri and Palivos, Theodore (2010) “Give me your Tired, your Poor, so I can Prosper: Immi-
gration in Search Equilibrium", Manuscript.
Chiswick, Barry R., Yew Liang Lee and Paul W. Miller (2005) “Immigrant Earnings: A Longitudinal Analysis,"
Review of Income and Wealth, Vol. 51, No. 4, pp. 485-503.
Costinot, Arnaud (2009) “An Elementary Theory of Comparative Advantage," Econometrica, Vol. 77, No. 4,
pp. 1165-1192
Costinot, Arnaud and Jonathan Vogel (2010) “Matching and Inequality in the World Economy," Journal of
Political Economy, Vol. 118, pp. 747-786.
Crinò, Rosario (2010) “Service Offshoring and White-Collar Employment," The Review of Economic Studies, ,
Volume 77, No. 2, pp. 595-632.
Ebenstein, Avraham, Harrison, Ann, McMillan, Margaret and Shannon Phillips (2009) “Estimating the Impact
of Trade and Offshoring on American Workers Using the Current Population Surveys," NBER Working Paper
No. 15107.
Feenstra, Robert and Gordon Hanson (1996) “Foreign Investment, Outsourcing and Relative Wages" in R.C.
Feenstra, G.M. Grossman and D.A. Irwin, eds., The Political Economy of Trade Policy: Papers in Honor of
Jagdish Bhagwati, Cambride, MA: MIT Press.
Feenstra, Robert and Gordon Hanson (1999) “The Impact of Outsourcing and High Technology Capital on
Wages: Estimates for the United States 1979-1990," Quarterly Journal of Economics., Vol. 114, No. 3, pp.
907-940.
31
Feenstra, Robert, Romalis, John and Peter K. Schott (2002) “U.S. Imports, Exports and Tariff Data", The
Center for International Data, UC Davis.
Goos, Maarten and Alan Manning (2007) “Lousy and Lovely Jobs: The Rising Polarization of Work in Britain,"
The Review of Economics and Statistics, Vol. 89, No. 1, pp. 118-133.
Goos, Maarten, Alan Manning and Anna Salomons (2009) “The Polarization of the European Labor Market,"
American Economic Review Papers and Proceedings, Vol. 99, No. 2, pp. 58-63.
Grossman, Gene (2004) “The Distribution of Talent and the Pattern and Consequences of International Trade,"
Journal of Political Economy, Vol. 112, No. 1, pp. 209-239.
Grossman, Gene and Esteban Rossi-Hansberg (2008) “Trading Tasks: A Simple Theory of Offshoring, ”Ameri-
can Economic Review, Vol. 98, No. 5, pp. 1978-1997.
Grossman, Gene and Giovanni Maggi (2000) “Diversity and Trade, ”American Economic Review, Vol. 90, No.
5, pp. 1255-1275.
Harrison, Ann and Margaret McMillan (2011) “Offshoring Jobs? Multinational and U.S. Manufacturing Em-
ployment," Review of Economics and Statistics, Vol. 93, No. 3, pp. 857-875
Hendricks, Lutz (2002) “How Important is Human Capital for Development? Evidence from Immigrant Earn-
ings," American Economic Review, Vol. 92, No. 1, pp. 198-219.
Hummels, David, Rasmus Jorgenson, Jackob Munch and Chong Xiang (2010) “Wage and Employment Effects
of Outsourcing: Evidence from Danish Matched Worker-Firm Data," Manuscript, Purdue University, May 2010.
Jensen, Bradford J. and Lori Kletzer (2007) “Measuring Tradable Services and the Task Content of Offshorable
Services Jobs," Manuscript, University of California, Santa Cruz.
Jones, Ronald W. and Henryk Kierzkowski (1990) “The Role of Services in Production and International Trade:
A Theoretical Framework" in R. Jones and A. Kruegers, eds., The Political Economy of International Trade:
Essays in Honor of Robert E. Baldwin, Oxford: Basil Blackwell.
Kremer, Michael and Keith Maskin (2006) “Globalization and Inequality," Harvard University, manuscript.
Levy, Frank and Richard J. Murnane (2006) “How Computerized Work and Globalization Shape Human Skill
Demands," First International Conference on Globalization and Learning Conference Volume.
Manning, Alan (2004) “We Can Work it Out: The Impact of Technological Change on the Demand for Low-Skill
Workers," Scottish Journal of Political Economy, Vol. 51, pp. 581-608.
32
Mataloni, Raymond J. and Daniel R. Yorgason (2002) “Operations of U.S. Multinational Companies," Survey
of Current Business, Bureau of Economic Analysis.
Monte, Ferdinando (2011) “Skill Bias, Trade and Wage Dispersion" Journal of International Economics, Vol.
83, No. 8, pp. 202-218.
Ohnsorge, Franziska and Daniel Trefler (2007) “Sorting It Out: International Trade and Protection With
Heterogeneous Workers", Journal of Political Economy, Vol. 115, No. 5, 868-892.
Olney, William W. (2012) “Offshoring, Immigration, and the Native Wage Distribution,” forthcoming in Cana-
dian Journal of Economics.
Ottaviano Gianmarco I.P. and Giovanni Peri (2012) “Rethinking The Effect Of Immigration OnWages," Journal
of the European Economic Association, John Wiley & Sons, Ltd., vol. 10(1), pages 152-197, 02.
Peri, Giovanni (2012) “The Effect Of Immigration On Productivity: Evidence From U.S. States," The Review
of Economics and Statistics, MIT Press, vol. 94(1), pages 348-358, 07.
Peri, Giovanni and Chad Sparber (2009) “Task Specialization, Immigration and Wages,”American Economic
Journal : Applied Economics, Vol. 1, No. 3, pp. 135—169.
Ruggles, Steven , Matthew Sobek, Trent Alexander, Catherine A. Fitch, Ronald Goeken, Patricia Kelly
Hall, Miriam King, and Chad Ronnander (2008). Integrated Public Use Microdata Series: Version 3.0
[Machine-readable database]. Minneapolis, MN: Minnesota Population Center [producer and distributor], 2004.
http://www.ipums.org.
Sly, Nicholas (2011) “International Productivity Differences, Trade, and the Distributions of Factor Endow-
ments," Review of International Economics, forthcoming.
Patel Krishna and Francis Vella (2007). “Immigrant Networks and Their Implications for Occupational Choice
and Wages," IZA Discussion Papers 3217, Institute for the Study of Labor (IZA).
Wright, Greg C. (2012) “Revisiting the Employment and Wage Impacts of Offshoring," University of Essex,
manuscript.
Yeaple, Stephen (2005) “A Simple Model of Firm Heterogeneity, International Trade, and Wages," Journal of
International Economics, Vol. 65, No. 1, pp. 1-20.
Yeaple, Stephen and Volker Nocke (2008) “An Assignment Theory of Foreign Direct Investment," Review of
Economic Studies, Vol. 75, No. 2, pp. 529-557.
33
A Appendix: Endogenous Native Wages
In the main text we have assumed that each sector is not large enough to affect the domestic wage . Here we
discuss how would react if such an assumption did not hold.
Intuition is better served by focusing on the simple case of an economy with only two sectors indexed
= 1 2. In each sector immigrant, offshore and native labor demands are given by expressions like (12) with
corresponding price indices like (13). The two sectors may differ in terms of offshoring and immigration costs,
technological parameters, demand parameters, goods prices, and specific factor endowments. As in the model
in the main text, goods prices are exogenously determined in international markets and foreign workers
are in infinitely elastic supply at foreign wage ∗. Their utility maximizing decisions determine whether they
are employed as immigrants or offshore workers in the two sectors, or in some other non-modeled occupation
abroad. In contrast to the model in the main text, native workers are now in fixed supply and their
allocation between sectors is determined, together with their wage , by the clearing of the native labor market:
the sum of the two sectors’ native labor demands has to equal native labor supply (1 + 2
= ). The
equilibrium native wage then determines immigrant and offshore employment levels in the two sectors, 1 and
2, through the corresponding labor demands as in (12).
Specifically, given (11), (12), and (13) native labor demand in sector can be rewritten as
= ()−(1−)
()−
(1− )1−
[Ω( )]
(−1)(1−)−()
1−
with = ()
11− and
Ω( ) =
(Z
0
∙()
()
¸1−+
Z
∙()
()
¸1−+ (1− )
) 11−
Equilibrium in the native labor market is represented in Figure A2. This depicts a standard box diagram in
which the horizontal dimension measures native labor supply , the vertical dimension measures the native
wage, and (log-linearized) labor demands in the two sectors are depicted as decreasing in the native wage from
their respective origins 1 and 2. Accordingly, the equilibrium allocation of native workers between the two
sectors and the corresponding common wage are to be found at the crossing of the two labor demand schedules
where, by graphical construction, the native labor market clears. Figure A2 can be used to assess the effects of
changes in migration and offshoring costs on the wage of native workers as well as on their sectoral allocation.
For example, under our working assumptions, a fall in migration costs in sector 1 (lower 1) does not affect 1
and increases 1. This leads to a fall in Ω1(1
1). What then happens in the figure depends on whether¡
1 − 1¢ is larger or smaller than 1¡1− 1
¢, with the former measuring the substitutability of tasks and the
34
latter the importance of the task bundle for final production. When tasks are not easily substitutable (small
1) and the task bundle contributes a lot to final production (large 1), so that¡1 − 1¢ 1
¡1− 1
¢, a
lower Ω1(1 1) shifts the labor demand schedule of sector 1 upwards increasing the wage of natives and
their employment in sector 1. The opposite happens when tasks are easily substitutable (larger 1) and the
task bundle does not contribute much to final production (small 1), so that¡1 − 1¢ 1
¡1− 1
¢.
The effect of lower offshoring costs is, instead, more complex as a fall in 1 not only decreases 1 but also
increases 1, thus reducing Ω1(1
1). However, additionally, the native labor demand schedule shifts
upward when tasks are not easily substitutable (small 1) and the task bundle contributes a lot to final produc-
tion (large 1), and vice-versa. So, whether easier migration and easier offshoring lead to higher employment
and a higher native wage is, in the end, an empirical question that depends on sectoral characteristics.
B Appendix: No Discrimination between Natives and Immigrants
In the model presented in the main text, the productivity effect due to easier immigration stems from the fact
that falling costs of immigration create rents for domestic firms − () = − ∗() per unit task
for ∈ [0 ], just as the productivity effect due to easier offshoring stems from the fact that falling costs of
offshoring create rents for domestic firms − () = −∗() per unit task for ∈ [ ]. These
effects arise because we have assumed that firms can discriminate between immigrants and natives since they
know the wage ∗ in the country where immigrants come from as well as their common migration cost .
This ability to discriminate is crucial for the productivity effect due to easier immigration to materialize.
The argument can be spelled out following Grossman and Rossi-Hansberg (2008). In discussing the different
effects of easier offshoring and easier immigration, these authors assume, as we also do, that foreign workers can
stay in the foreign country and earn the wage ∗ or can move to the home country, at the cost of a fraction of
their working time, and earn the wage e. To avoid the existence of corner outcomes with no migration or infinitemigration, they also assume that foreign workers are heterogeneous in terms of their moving costs. Specifically,
a foreign worker captures only a fraction 1() of e when she moves to the home country. Without loss
of generality, foreign workers can be indexed in increasing order of moving costs so that 0() 0. Moreover,
Grossman and Rossi-Hansberg (2008) assume that immigrants are as productive as natives and that domestic
firms are not able to discriminate between natives and immigrants nor between immigrants with different moving
costs.
In terms of our notation, all these assumptions imply () = 1 and e = . They also imply that the marginal
immigrant earns the same net income in both locations so that = ∗(). This replaces our condition
e = ∗ in the main text and uniquely determines , which in turn determines the number of immigrants given
some distribution of foreign workers across moving costs.
35
To sum up, when firms are unable to discriminate, native, immigrant and offshore marginal costs become
= , () = ∗() = and () = ∗(), respectively. Accordingly, an inframarginal
immigrant earns rents −∗(). This implies that as the common immigration cost falls, additionalrents are created at both the intensive and the extensive task margins. Accordingly, new immigrants enter the
home country ( increases). More rents also accrue to the incumbent immigrants, but not to the home firms
whose profitability, therefore, does not change. “The difference between falling costs of offshoring and falling
costs of immigration is that the former create rents for domestic firms ... whereas the latter create rents for the
immigrants" (Grossman and Rossi-Hansberg, 2008).
In contrast, when firms can discriminate between natives and immigrants they fully appropriate the rents.
Ruling out offshoring for simplicity, in our model the rents per unit task when cheaper immigrants are employed
instead of natives amount to
− () = − ∗()
so that total rents correspond to the striped area in Figure A3. Being entirely appropriated by firms, these rents
are the source of the productivity effect due to immigration. Note that our assumption of perfect discrimination
is not crucial in order to generate a productivity effect due to immigration–as long as there is any degree of
discrimination some rent is generated.
C Appendix: Cognitive, Communication and Manual Intensities
The O*NET variables used to construct the cognitive, communication and manual intensity indices are the
following. Cognitive Intensity is the average of 10 variables: Fluency of Ideas, Originality, Problem Sensitivity,
Deductive Reasoning, Inductive Reasoning, Information Ordering, Category Flexibility, Mathematical Reason-
ing, Number Facility, Memorization. Each variable is the intensity of use of the skill associated to the occupation.
The value of the variable is the percentile of the occupation in the ranking of workers according to that skill
intensity. Communication Intensity is the average of 4 variables: Oral Comprehension, Written Comprehension,
Oral Expression, Written Expression. Manual Intensity is the average of 19 variables: Arm-Hand Steadiness,
Manual Dexterity, Finger Dexterity, Control Precision, Multilimb Coordination, Response Orientation, Rate
Control, Reaction Time, Wrist-Finger Speed, Speed of Limb Movement, Static Strength, Explosive Strength,
Dynamic Strength, Trunk Strength, Stamina, Extent Flexibility, Dynamic Flexibility, Gross Body Coordination,
Gross Body Equilibrium.
36
D Appendix: Offshore Employment Variables
Our measures of offshore employment draw from data on the employment and exports of affiliates of U.S.
multinational corporations (MNCs) from the BEA, U.S. Direct Investment Abroad: Operations of U.S. Parent
Companies and Their Foreign Affiliates, 2000-2007. According to Mataloni and Yorgason (2006), MNC output
in 1999 accounted for around half of manufacturing output and 63 percent of manufacturing exports. We also
restrict the sample further by using only majority-owned, non-bank MNC affiliates, however this restriction is
minor. The quality of this data has been investigated by Harrison and McMillan (2011) using inward FDI data
from Germany and Sweden, and while the authors find some discrepancies, these seem to be at least somewhat
explained by differences in the timing of reporting.
Specifically, we collect information on multinational affiliate employment by industry and year (58 manu-
facturing industries over 2000-2007), imports from MNC affiliates to their parents by industry and year, and
imports from non-affiliates to U.S. MNCs by industry and year.
In order to calculate total offshore employment due to U.S. offshoring, by MNCs and at arm’s length, we
begin with the actual employment of multinational affiliates and the aggregate exports of those affiliates to the
multinational parent firm. We then take the ratio of affiliate employment to affiliate exports for each industry
and year. This ratio is then set aside as a scaling factor, or an export labor requirement, for each industry
and year. Next, we multiply U.S. parent firm imports from non-affiliates by this scaling factor and the result
is our imputed arm’s length offshore employment. This is then combined with the affiliate employment values.
As mentioned in the main text, this procedure assumes an equivalent labor requirement per unit of exports for
affiliates and non-affiliates.
E Appendix: Information Technology Agreement Tariffs
The Information Technology Agreement is a tariff cutting agreement enacted by several World Trade Organi-
zation members. The first stage reduction in tariffs under the ITA occurred on 1 July 1997. The number of
signatories has steadily grown and now includes Albania, Australia, Bahrain, Bulgaria, Canada, China, Costa
Rica, Croatia, Dominican Republic, Egypt, El Salvador, the European Community, Georgia, Guatemala, Hon-
duras, Hong Kong, Iceland, India, Indonesia, Israel, Japan, Jordan, Korea, Kuwait, Kyrgyz Republic, Macao,
Malaysia, Mauritius, Moldova, Morocco, New Zealand, Nicaragua, Norway, Oman, Panama, Peru, Philippines,
Romania, Saudia Arabia, Singapore, Switzerland, Chinese Taipei, Thailand, Turkey, Ukraine, United Arab
Emirates, United States, and Vietnam.
The products covered by the ITA include data processing and storage products, audio and visual devices,
various electronics, various machines and parts and accessories to all of these. More specifically, the ITA
37

products are those under the following Harmonized System headings: 3818, 846911, 847010, 847021, 847029,
847030, 847040, 847050, 847090, 847110, 847130, 847141, 847149, 847150, 847160, 847170, 847180, 847190,
847290, 847321, 847329, 847330, 847350, 850440, 850450, 851711, 851719, 851721, 851722, 851730, 851750,
851780, 851790, 851810, 851830, 851829, 852020, 852311, 852312, 852313, 852320, 852390, 852431, 852439,
852440, 852491, 842499, 852510, 852520, 852540, 852790, 852910, 852990, 853120, 853190, 853210, 853221,
853222, 853223, 853224, 853225, 853229, 853230, 853290, 853310, 853321, 853329, 853331, 853339, 853340,
853390, 853650, 853650, 853650, 853669, 853690, 854110, 854121, 854129, 854130, 854140, 854150, 854160,
854190, 854212, 854213, 854214, 854219, 854230, 854240, 854250, 854290, 854381, 854389, 854441, 854449,
854451, 854470, 900911, 900921, 900990, 902610, 902620, 902680, 902690, 902720, 902730, 902750, 902780,
902790, 903040.
For more information on the ITA, see: http://www.wto.org/english/tratop
38
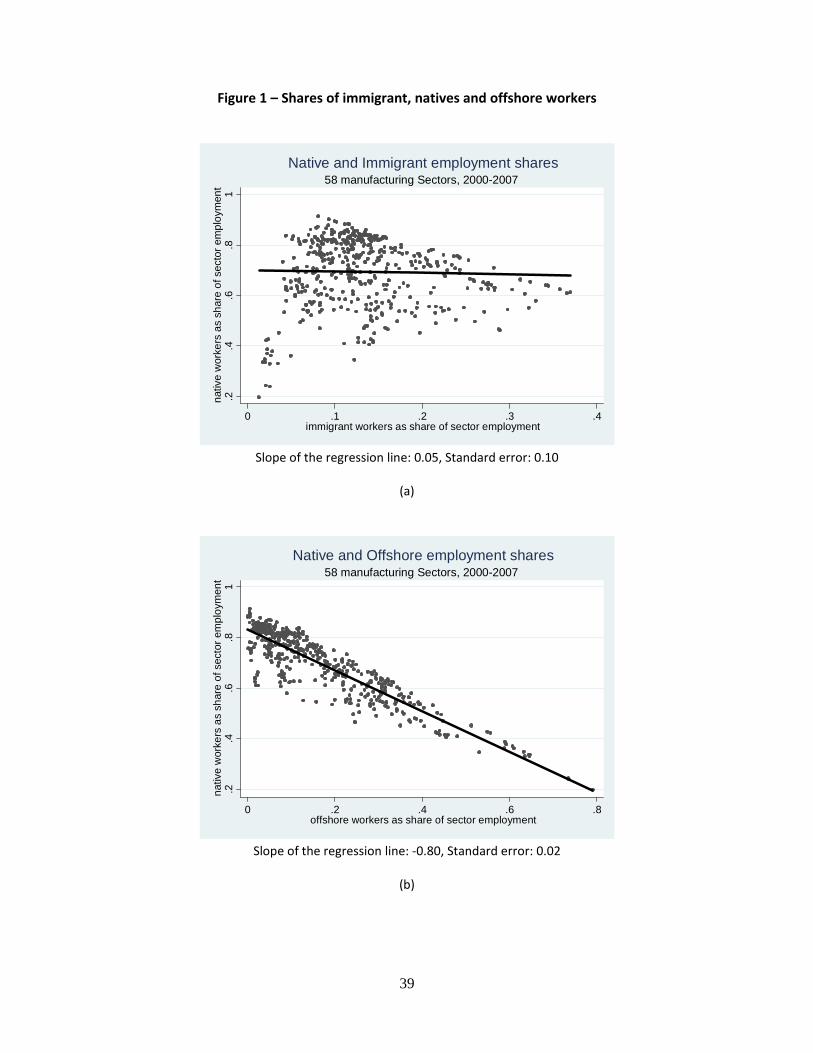
39
Figure 1 – Shares of immigrant, natives and offshore workers
.2.4
.6.8
1na
tive
wor
kers
as
shar
e of
sec
tor e
mpl
oym
ent
0 .1 .2 .3 .4immigrant workers as share of sector employment
58 manufacturing Sectors, 2000-2007Native and Immigrant employment shares
Slope of the regression line: 0.05, Standard error: 0.10
(a)
.2.4
.6.8
1na
tive
wor
kers
as
shar
e of
sec
tor e
mpl
oym
ent
0 .2 .4 .6 .8offshore workers as share of sector employment
58 manufacturing Sectors, 2000-2007Native and Offshore employment shares
Slope of the regression line: -0.80, Standard error: 0.02
(b)
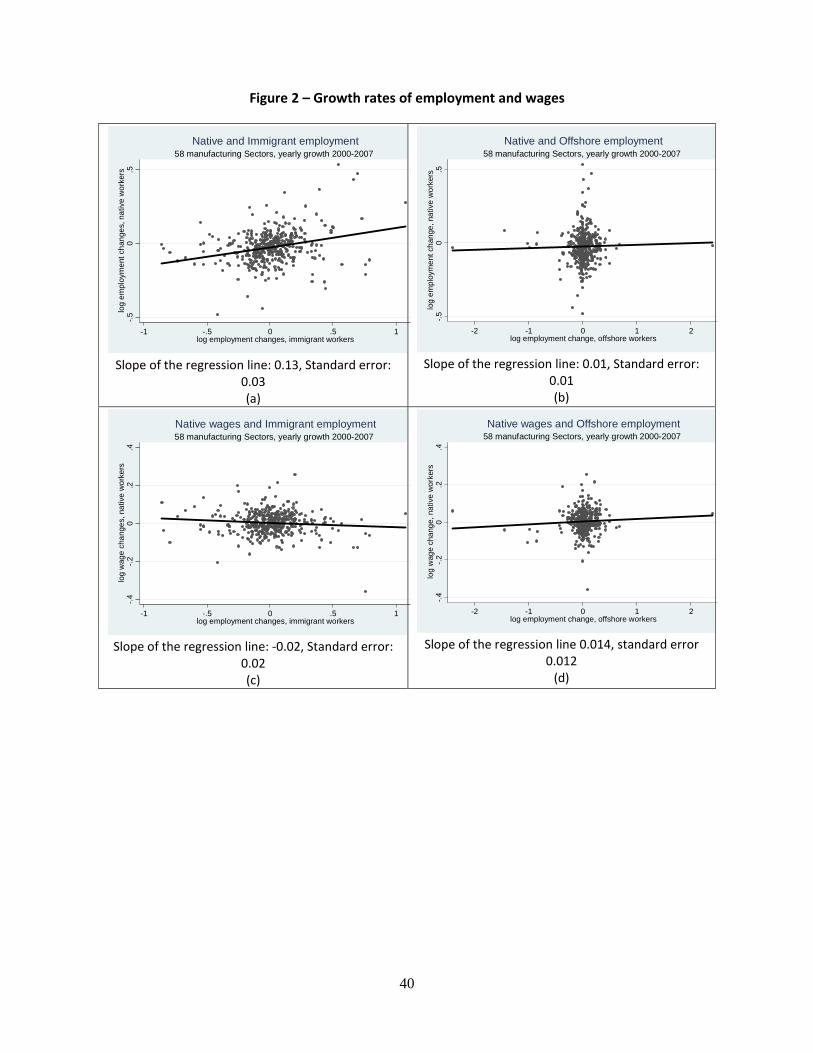
40
Figure 2 – Growth rates of employment and wages
-.50
.5lo
g em
ploy
men
t cha
nges
, nat
ive
wor
kers
-1 -.5 0 .5 1log employment changes, immigrant workers
58 manufacturing Sectors, yearly growth 2000-2007Native and Immigrant employment
Slope of the regression line: 0.13, Standard error: 0.03 (a)
-.50
.5lo
g em
ploy
men
t cha
nge,
nat
ive
wor
kers
-2 -1 0 1 2log employment change, offshore workers
58 manufacturing Sectors, yearly growth 2000-2007Native and Offshore employment
Slope of the regression line: 0.01, Standard error: 0.01 (b)
-.4-.2
0.2
.4lo
g w
age
chan
ges,
nat
ive
wor
kers
-1 -.5 0 .5 1log employment changes, immigrant workers
58 manufacturing Sectors, yearly growth 2000-2007Native wages and Immigrant employment
Slope of the regression line: -0.02, Standard error: 0.02 (c)
-.4-.2
0.2
.4lo
g w
age
chan
ge, n
ativ
e w
orke
rs
-2 -1 0 1 2log employment change, offshore workers
58 manufacturing Sectors, yearly growth 2000-2007Native wages and Offshore employment
Slope of the regression line 0.014, standard error 0.012
(d)
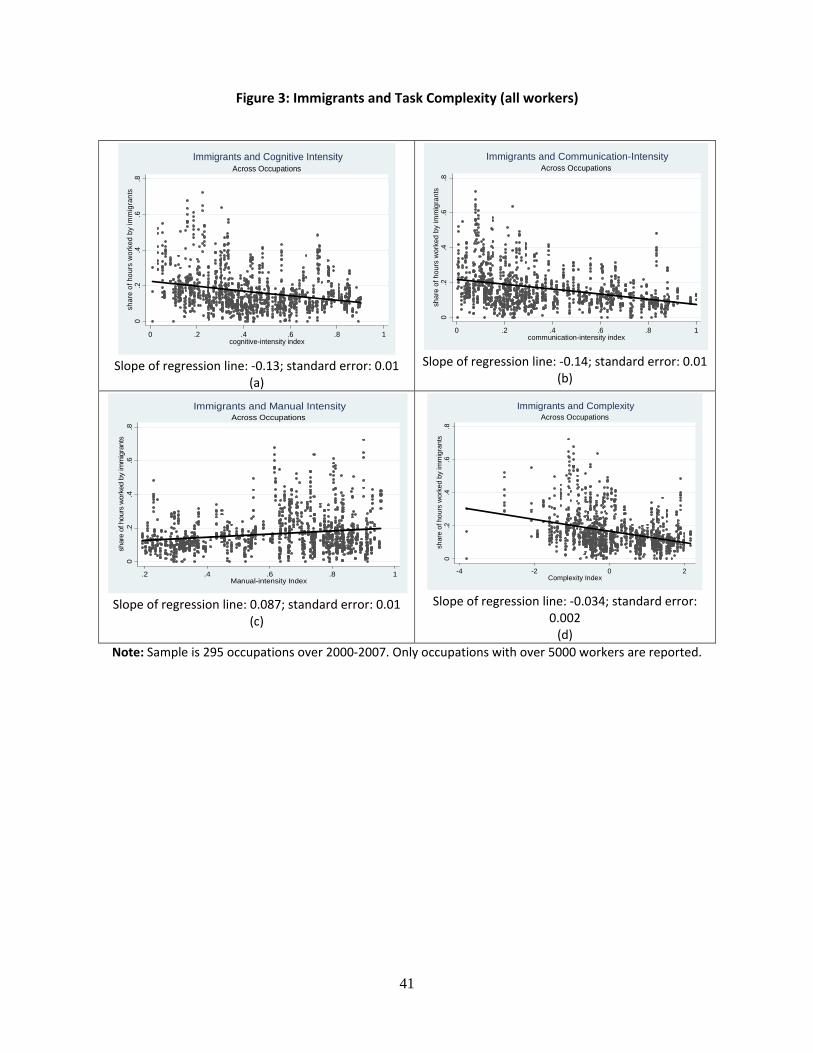
41
Figure 3: Immigrants and Task Complexity (all workers)
0
.2.4
.6.8
shar
e of
hou
rs w
orke
d by
imm
igra
nts
0 .2 .4 .6 .8 1cognitive-intensity index
Across OccupationsImmigrants and Cognitive Intensity
Slope of regression line: -0.13; standard error: 0.01
(a)
0.2
.4.6
.8sh
are
of h
ours
wor
ked
by im
mig
rant
s
0 .2 .4 .6 .8 1communication-intensity index
Across OccupationsImmigrants and Communication-Intensity
Slope of regression line: -0.14; standard error: 0.01(b)
0.2
.4.6
.8sh
are
of h
ours
wor
ked
by im
mig
rant
s
.2 .4 .6 .8 1Manual-intensity Index
Across OccupationsImmigrants and Manual Intensity
Slope of regression line: 0.087; standard error: 0.01 (c)
0.2
.4.6
.8sh
are
of h
ours
wor
ked
by im
mig
rant
s
-4 -2 0 2Complexity Index
Across OccupationsImmigrants and Complexity
Slope of regression line: -0.034; standard error:
0.002 (d)
Note: Sample is 295 occupations over 2000-2007. Only occupations with over 5000 workers are reported.
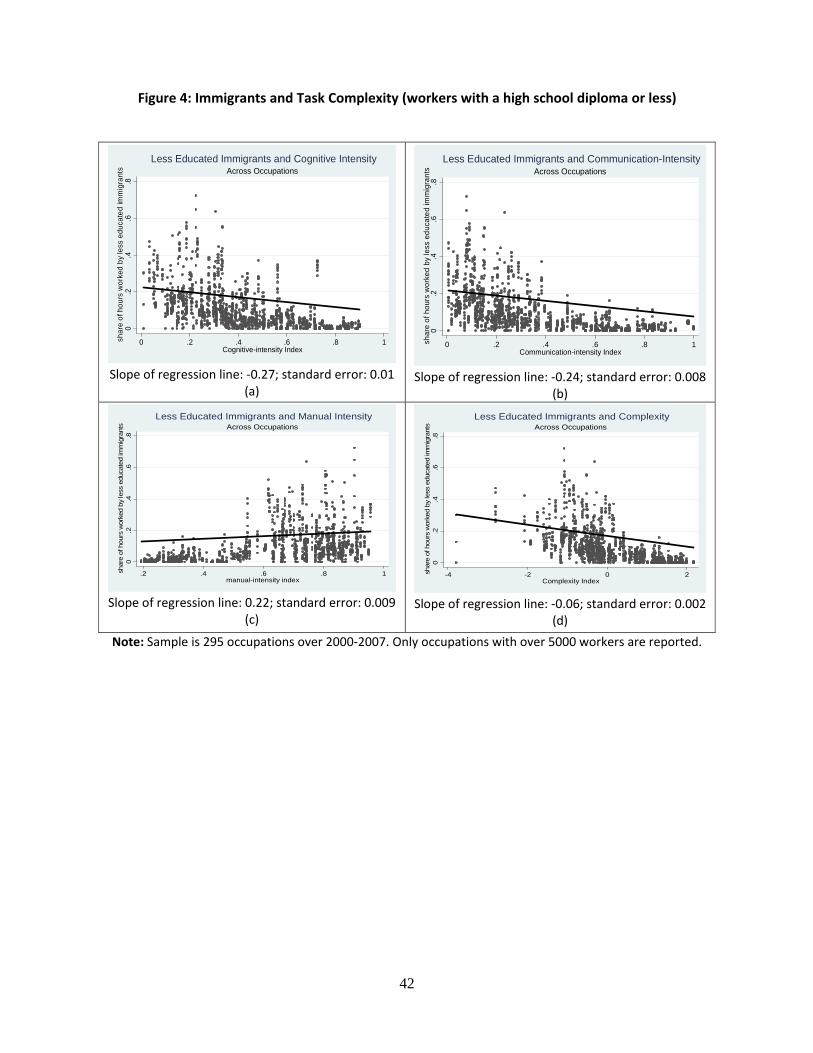
42
Figure 4: Immigrants and Task Complexity (workers with a high school diploma or less)
0
.2.4
.6.8
shar
e of
hou
rs w
orke
d by
less
edu
cate
d im
mig
rant
s
0 .2 .4 .6 .8 1Cognitive-intensity Index
Across OccupationsLess Educated Immigrants and Cognitive Intensity
Slope of regression line: -0.27; standard error: 0.01 (a)
0.2
.4.6
.8sh
are
of h
ours
wor
ked
by le
ss e
duca
ted
imm
igra
nts
0 .2 .4 .6 .8 1Communication-intensity Index
Across OccupationsLess Educated Immigrants and Communication-Intensity
Slope of regression line: -0.24; standard error: 0.008 (b)
0.2
.4.6
.8sh
are
of h
ours
wor
ked
by le
ss e
duca
ted
imm
igra
nts
.2 .4 .6 .8 1manual-intensity index
Across OccupationsLess Educated Immigrants and Manual Intensity
Slope of regression line: 0.22; standard error: 0.009 (c)
0.2
.4.6
.8sh
are
of h
ours
wor
ked
by le
ss e
duca
ted
imm
igra
nts
-4 -2 0 2Complexity Index
Across OccupationsLess Educated Immigrants and Complexity
Slope of regression line: -0.06; standard error: 0.002 (d)
Note: Sample is 295 occupations over 2000-2007. Only occupations with over 5000 workers are reported.
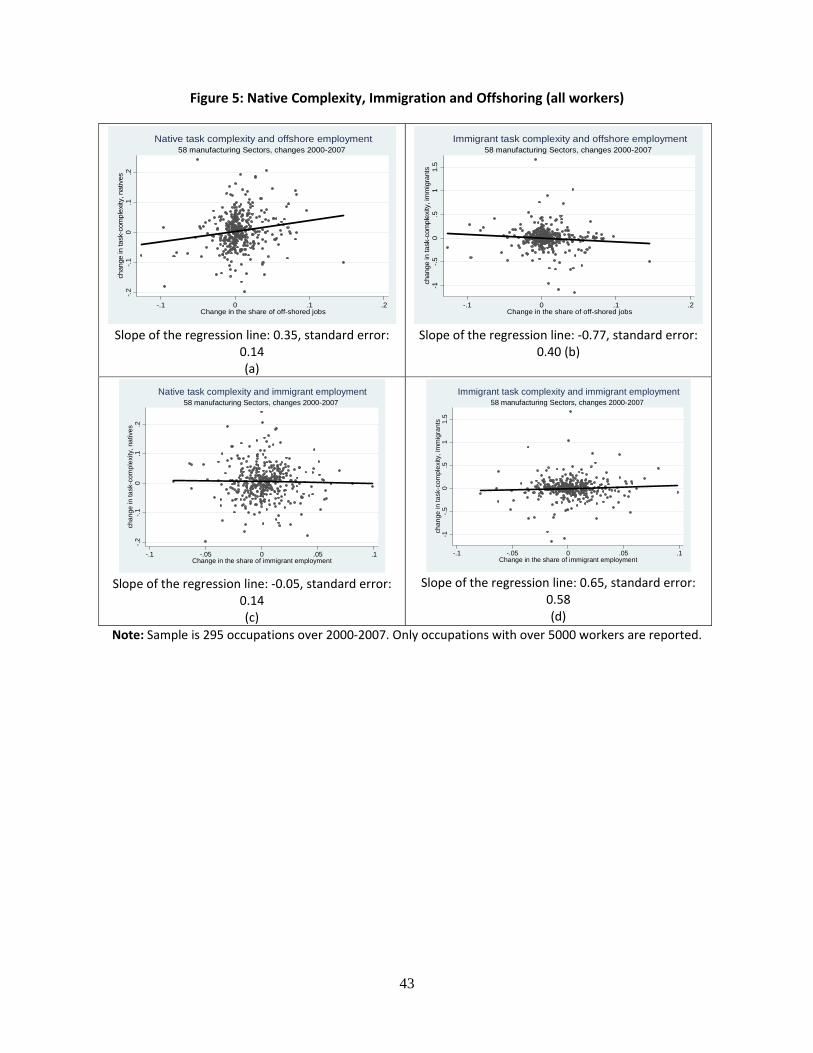
43
Figure 5: Native Complexity, Immigration and Offshoring (all workers)
-.2-.1
0.1
.2ch
ange
in ta
sk-c
ompl
exity
, nat
ives
-.1 0 .1 .2Change in the share of off-shored jobs
58 manufacturing Sectors, changes 2000-2007Native task complexity and offshore employment
Slope of the regression line: 0.35, standard error: 0.14 (a)
-1-.5
0.5
11.
5ch
ange
in ta
sk-c
ompl
exity
, im
mig
rant
s
-.1 0 .1 .2Change in the share of off-shored jobs
58 manufacturing Sectors, changes 2000-2007Immigrant task complexity and offshore employment
Slope of the regression line: -0.77, standard error: 0.40 (b)
-.2-.1
0.1
.2ch
ange
in ta
sk-c
ompl
exity
, nat
ives
-.1 -.05 0 .05 .1Change in the share of immigrant employment
58 manufacturing Sectors, changes 2000-2007Native task complexity and immigrant employment
Slope of the regression line: -0.05, standard error:
0.14 (c)
-1-.5
0.5
11.
5ch
ange
in ta
sk-c
ompl
exity
, im
mig
rant
s
-.1 -.05 0 .05 .1Change in the share of immigrant employment
58 manufacturing Sectors, changes 2000-2007Immigrant task complexity and immigrant employment
Slope of the regression line: 0.65, standard error:
0.58 (d)
Note: Sample is 295 occupations over 2000-2007. Only occupations with over 5000 workers are reported.
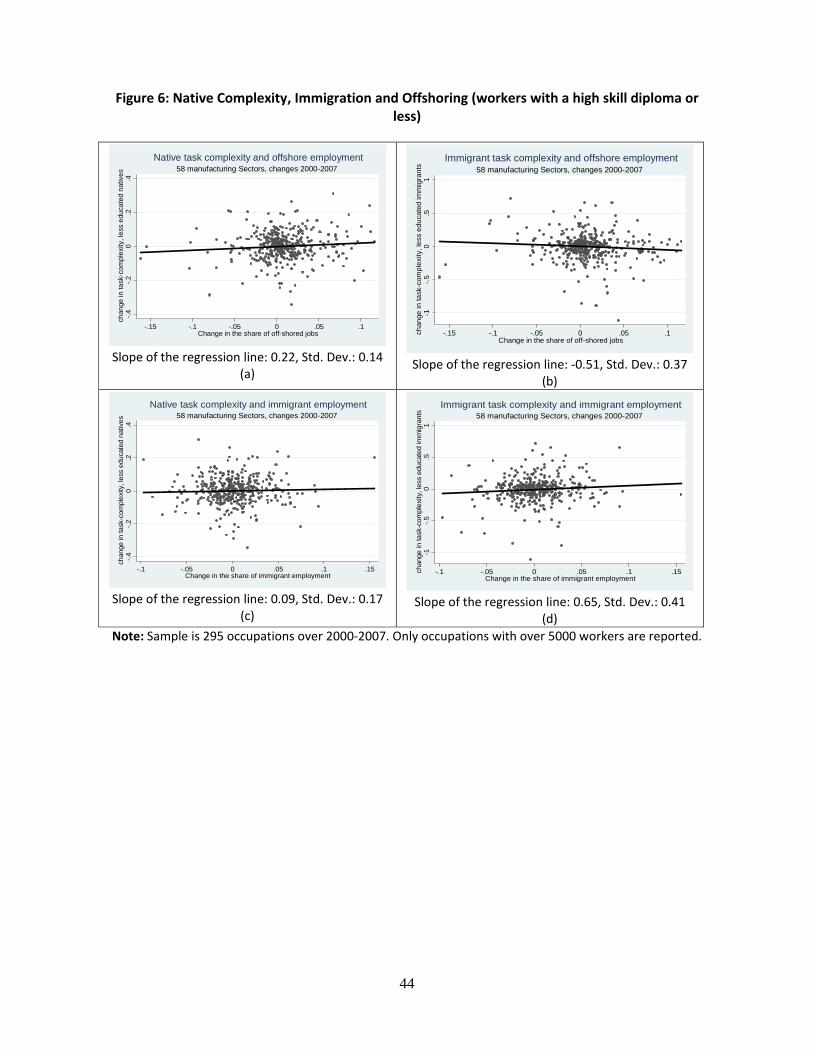
44
Figure 6: Native Complexity, Immigration and Offshoring (workers with a high skill diploma or less)
-.4
-.20
.2.4
chan
ge in
task
-com
plex
ity, l
ess
educ
ated
nat
ives
-.15 -.1 -.05 0 .05 .1Change in the share of off-shored jobs
58 manufacturing Sectors, changes 2000-2007Native task complexity and offshore employment
Slope of the regression line: 0.22, Std. Dev.: 0.14 (a)
-1-.5
0.5
1ch
ange
in ta
sk-c
ompl
exity
, les
s ed
ucat
ed im
mig
rant
s
-.15 -.1 -.05 0 .05 .1Change in the share of off-shored jobs
58 manufacturing Sectors, changes 2000-2007Immigrant task complexity and offshore employment
Slope of the regression line: -0.51, Std. Dev.: 0.37 (b)
-.4-.2
0.2
.4ch
ange
in ta
sk-c
ompl
exity
, les
s ed
ucat
ed n
ativ
es
-.1 -.05 0 .05 .1 .15Change in the share of immigrant employment
58 manufacturing Sectors, changes 2000-2007Native task complexity and immigrant employment
Slope of the regression line: 0.09, Std. Dev.: 0.17 (c)
-1-.5
0.5
1ch
ange
in ta
sk-c
ompl
exity
, les
s ed
ucat
ed im
mig
rant
s
-.1 -.05 0 .05 .1 .15Change in the share of immigrant employment
58 manufacturing Sectors, changes 2000-2007Immigrant task complexity and immigrant employment
Slope of the regression line: 0.65, Std. Dev.: 0.41 (d)
Note: Sample is 295 occupations over 2000-2007. Only occupations with over 5000 workers are reported.
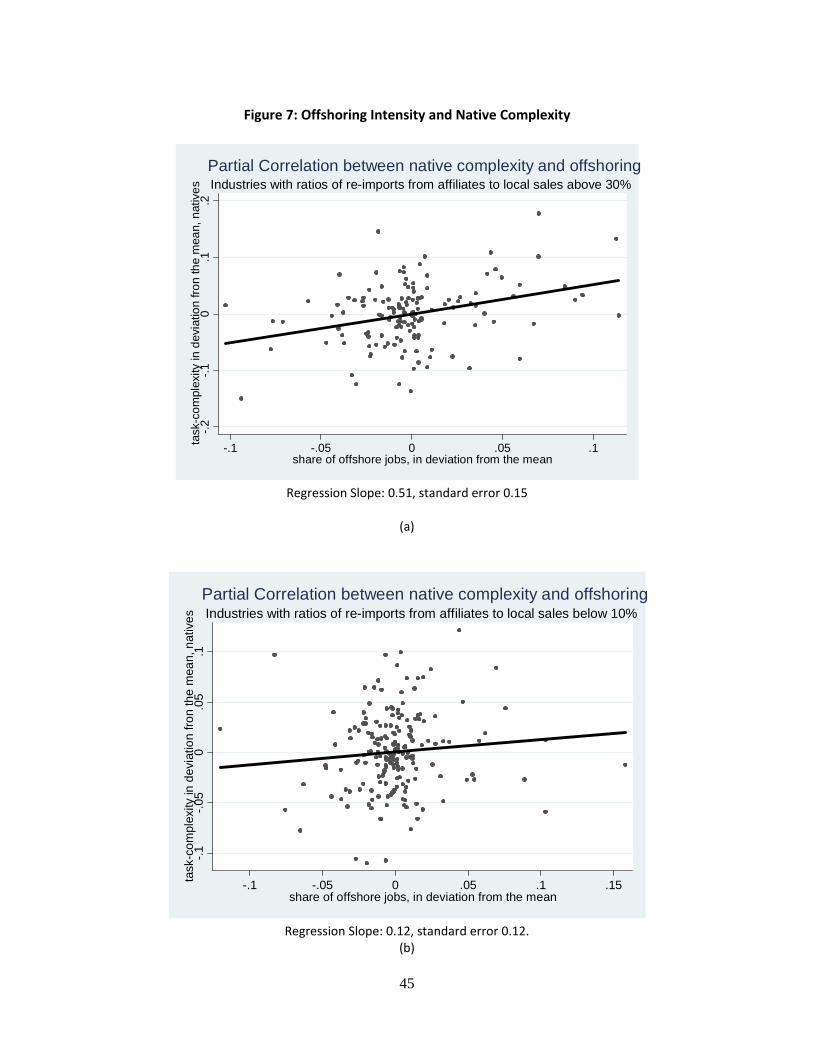
45
Figure 7: Offshoring Intensity and Native Complexity
-.2-.1
0.1
.2ta
sk-c
ompl
exity
in d
evia
tion
fron
the
mea
n, n
ativ
es
-.1 -.05 0 .05 .1share of offshore jobs, in deviation from the mean
Industries with ratios of re-imports from affiliates to local sales above 30%Partial Correlation between native complexity and offshoring
Regression Slope: 0.51, standard error 0.15
(a)
-.1-.0
50
.05
.1ta
sk-c
ompl
exity
in d
evia
tion
fron
the
mea
n, n
ativ
es
-.1 -.05 0 .05 .1 .15share of offshore jobs, in deviation from the mean
Industries with ratios of re-imports from affiliates to local sales below 10%Partial Correlation between native complexity and offshoring
Regression Slope: 0.12, standard error 0.12.
(b)
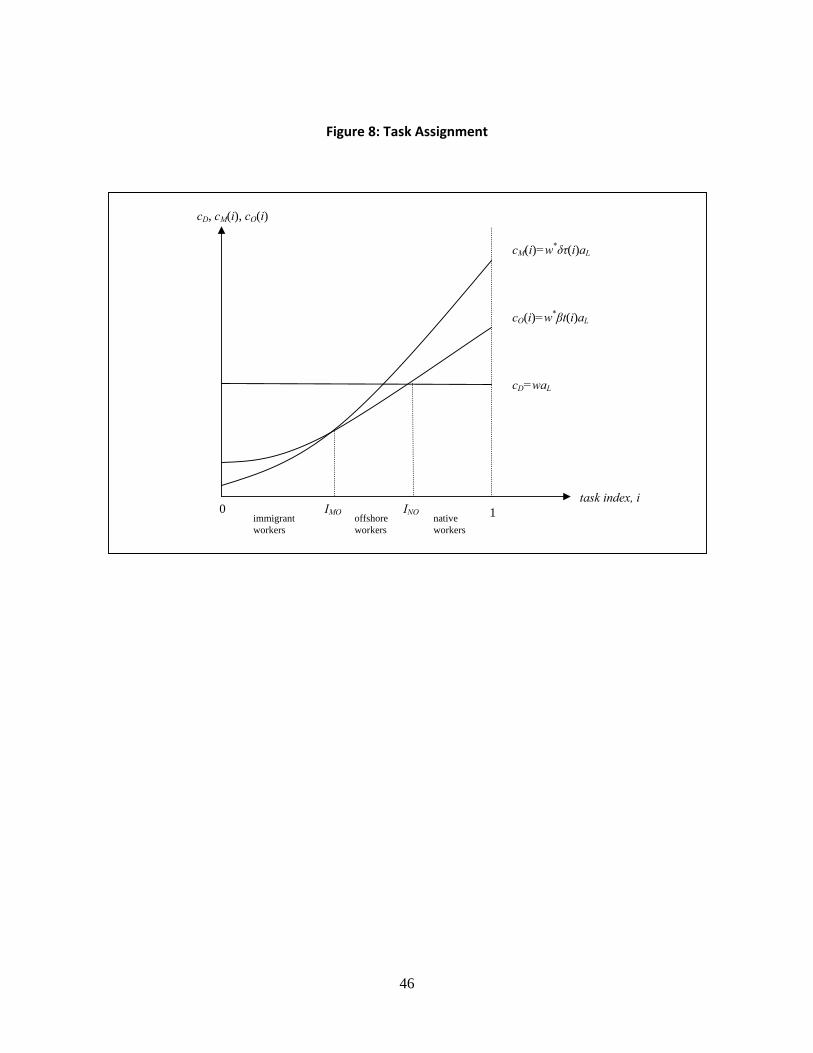
46
Figure 8: Task Assignment
cD=waL
cM(i)=w*δτ(i)aL
cO(i)=w*βt(i)aL
cD, cM(i), cO(i)
task index, i 1 0 IMO INO
immigrant workers
offshore workers
native workers
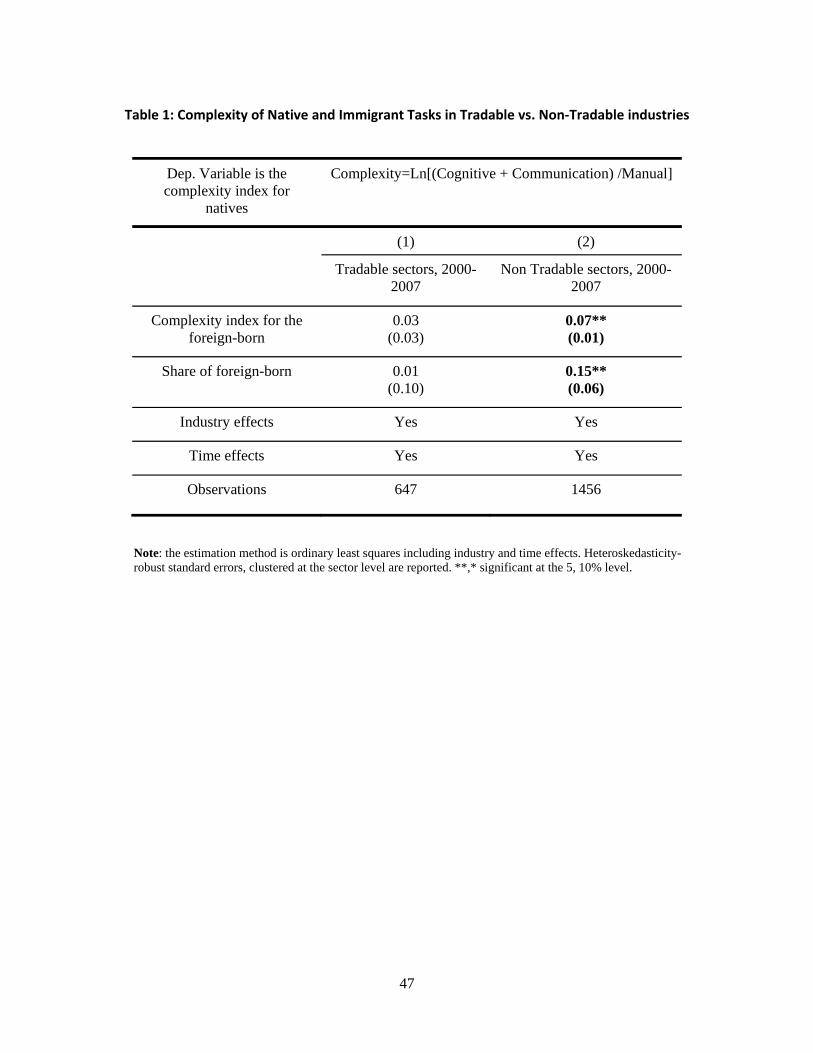
47
Table 1: Complexity of Native and Immigrant Tasks in Tradable vs. Non-Tradable industries
Dep. Variable is the complexity index for
natives
Complexity=Ln[(Cognitive + Communication) /Manual]
(1) (2)
Tradable sectors, 2000-2007
Non Tradable sectors, 2000-2007
Complexity index for the foreign-born
0.03 (0.03)
0.07** (0.01)
Share of foreign-born 0.01 (0.10)
0.15** (0.06)
Industry effects Yes Yes
Time effects Yes Yes
Observations 647 1456
Note: the estimation method is ordinary least squares including industry and time effects. Heteroskedasticity-robust standard errors, clustered at the sector level are reported. **,* significant at the 5, 10% level.
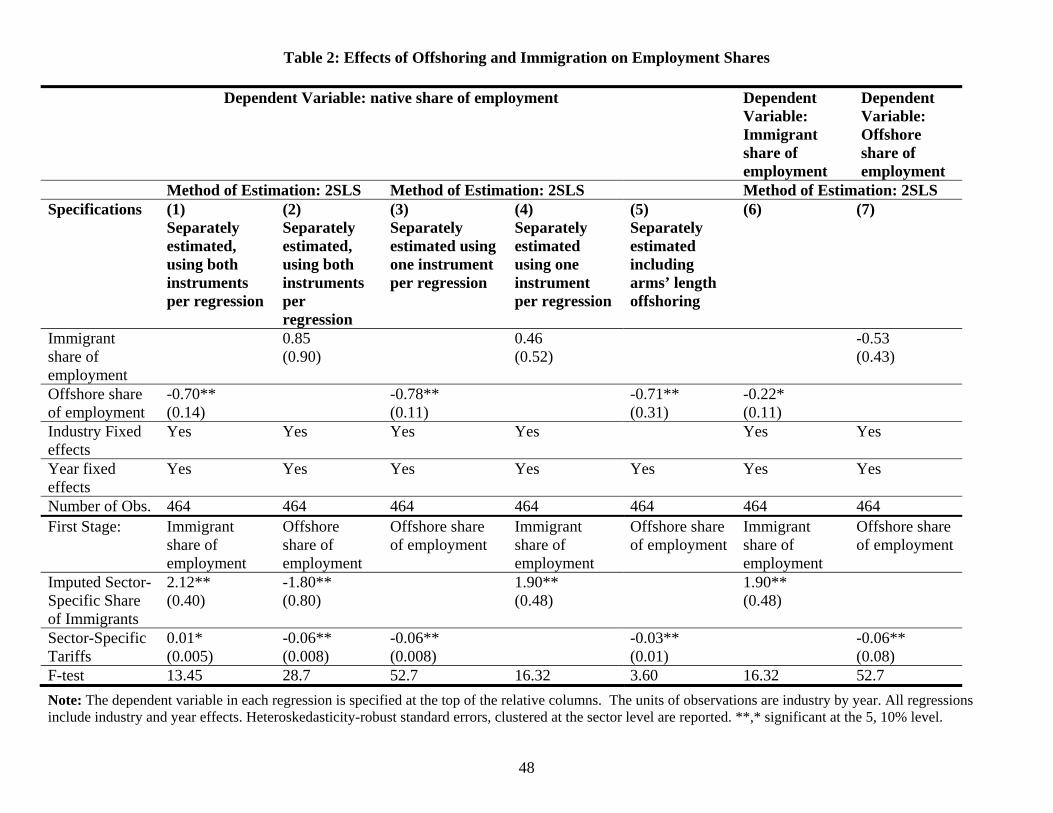
48
Table 2: Effects of Offshoring and Immigration on Employment Shares
Note: The dependent variable in each regression is specified at the top of the relative columns. The units of observations are industry by year. All regressions include industry and year effects. Heteroskedasticity-robust standard errors, clustered at the sector level are reported. **,* significant at the 5, 10% level.
Dependent Variable: native share of employment Dependent Variable: Immigrant share of employment
Dependent Variable: Offshore share of employment
Method of Estimation: 2SLS Method of Estimation: 2SLS Method of Estimation: 2SLS Specifications (1)
Separately estimated, using both instruments per regression
(2) Separately estimated, using both instruments per regression
(3) Separately estimated using one instrument per regression
(4) Separately estimated using one instrument per regression
(5) Separately estimated including arms’ length offshoring
(6) (7)
Immigrant share of employment
0.85 (0.90)
0.46 (0.52)
-0.53 (0.43)
Offshore share of employment
-0.70** (0.14)
-0.78** (0.11)
-0.71** (0.31)
-0.22* (0.11)
Industry Fixed effects
Yes Yes Yes Yes Yes Yes
Year fixed effects
Yes Yes Yes Yes Yes Yes Yes
Number of Obs. 464 464 464 464 464 464 464 First Stage: Immigrant
share of employment
Offshore share of employment
Offshore share of employment
Immigrant share of employment
Offshore share of employment
Immigrant share of employment
Offshore share of employment
Imputed Sector-Specific Share of Immigrants
2.12** (0.40)
-1.80** (0.80)
1.90** (0.48)
1.90** (0.48)
Sector-Specific Tariffs
0.01* (0.005)
-0.06** (0.008)
-0.06** (0.008)
-0.03** (0.01)
-0.06** (0.08)
F-test 13.45 28.7 52.7 16.32 3.60 16.32 52.7
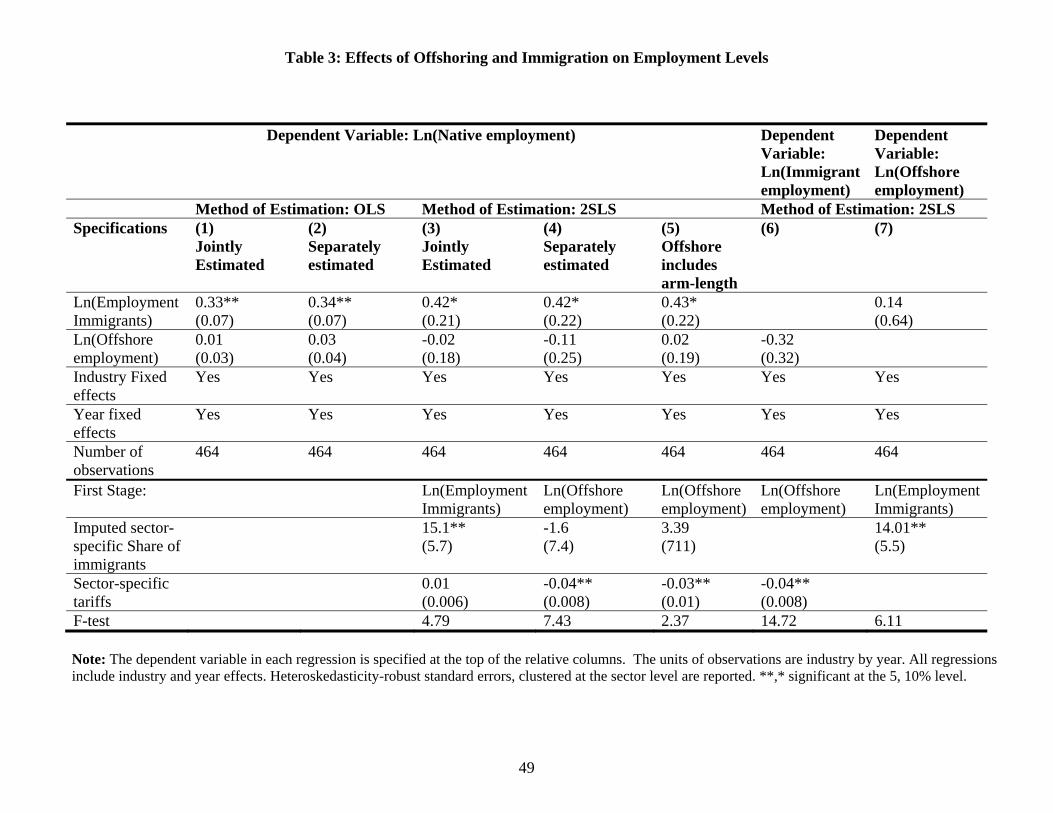
49
Table 3: Effects of Offshoring and Immigration on Employment Levels
Note: The dependent variable in each regression is specified at the top of the relative columns. The units of observations are industry by year. All regressions include industry and year effects. Heteroskedasticity-robust standard errors, clustered at the sector level are reported. **,* significant at the 5, 10% level.
Dependent Variable: Ln(Native employment) Dependent Variable: Ln(Immigrant employment)
Dependent Variable: Ln(Offshore employment)
Method of Estimation: OLS Method of Estimation: 2SLS Method of Estimation: 2SLS Specifications (1)
Jointly Estimated
(2) Separately estimated
(3) Jointly Estimated
(4) Separately estimated
(5) Offshore includes arm-length
(6) (7)
Ln(Employment Immigrants)
0.33** (0.07)
0.34** (0.07)
0.42* (0.21)
0.42* (0.22)
0.43* (0.22)
0.14 (0.64)
Ln(Offshore employment)
0.01 (0.03)
0.03 (0.04)
-0.02 (0.18)
-0.11 (0.25)
0.02 (0.19)
-0.32 (0.32)
Industry Fixed effects
Yes Yes Yes Yes Yes Yes Yes
Year fixed effects
Yes Yes Yes Yes Yes Yes Yes
Number of observations
464 464 464 464 464 464 464
First Stage: Ln(Employment Immigrants)
Ln(Offshore employment)
Ln(Offshore employment)
Ln(Offshore employment)
Ln(Employment Immigrants)
Imputed sector-specific Share of immigrants
15.1** (5.7)
-1.6 (7.4)
3.39 (711)
14.01** (5.5)
Sector-specific tariffs
0.01 (0.006)
-0.04** (0.008)
-0.03** (0.01)
-0.04** (0.008)
F-test 4.79 7.43 2.37 14.72 6.11
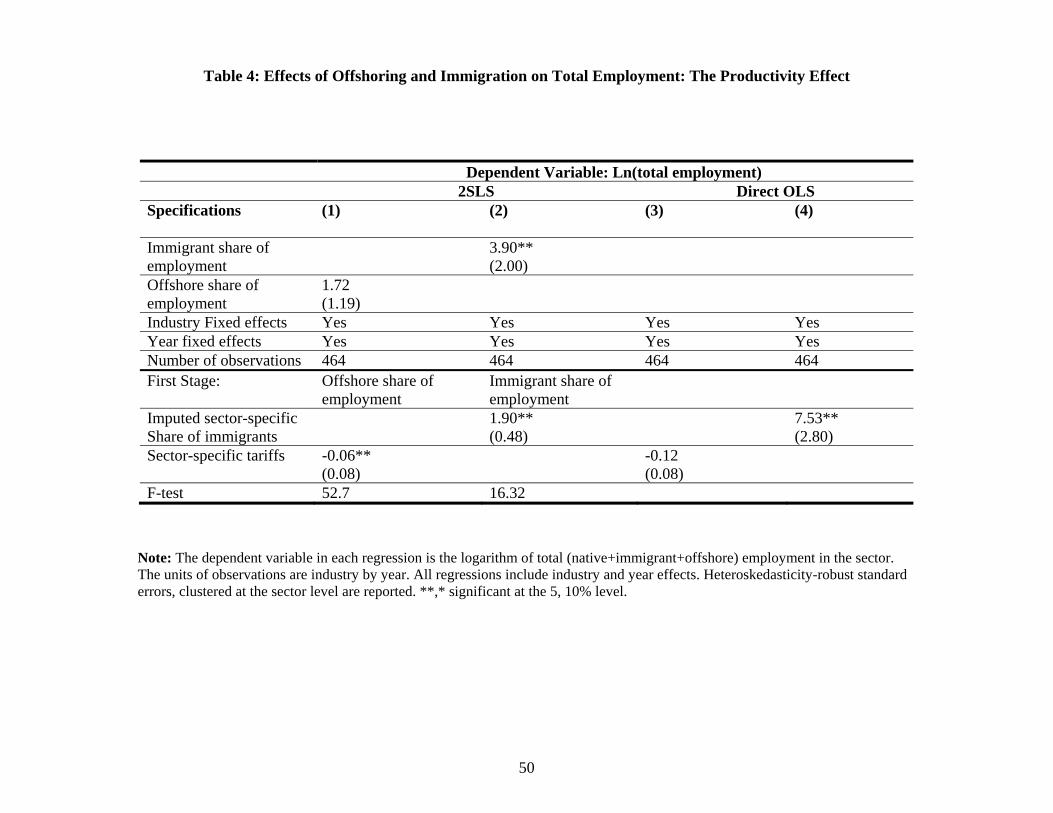
50
Table 4: Effects of Offshoring and Immigration on Total Employment: The Productivity Effect
Note: The dependent variable in each regression is the logarithm of total (native+immigrant+offshore) employment in the sector. The units of observations are industry by year. All regressions include industry and year effects. Heteroskedasticity-robust standard errors, clustered at the sector level are reported. **,* significant at the 5, 10% level.
Dependent Variable: Ln(total employment) 2SLS Direct OLS Specifications (1)
(2)
(3)
(4)
Immigrant share of employment
3.90** (2.00)
Offshore share of employment
1.72 (1.19)
Industry Fixed effects Yes Yes Yes Yes Year fixed effects Yes Yes Yes Yes Number of observations 464 464 464 464 First Stage: Offshore share of
employment Immigrant share of employment
Imputed sector-specific Share of immigrants
1.90** (0.48)
7.53** (2.80)
Sector-specific tariffs -0.06** (0.08)
-0.12 (0.08)
F-test 52.7 16.32
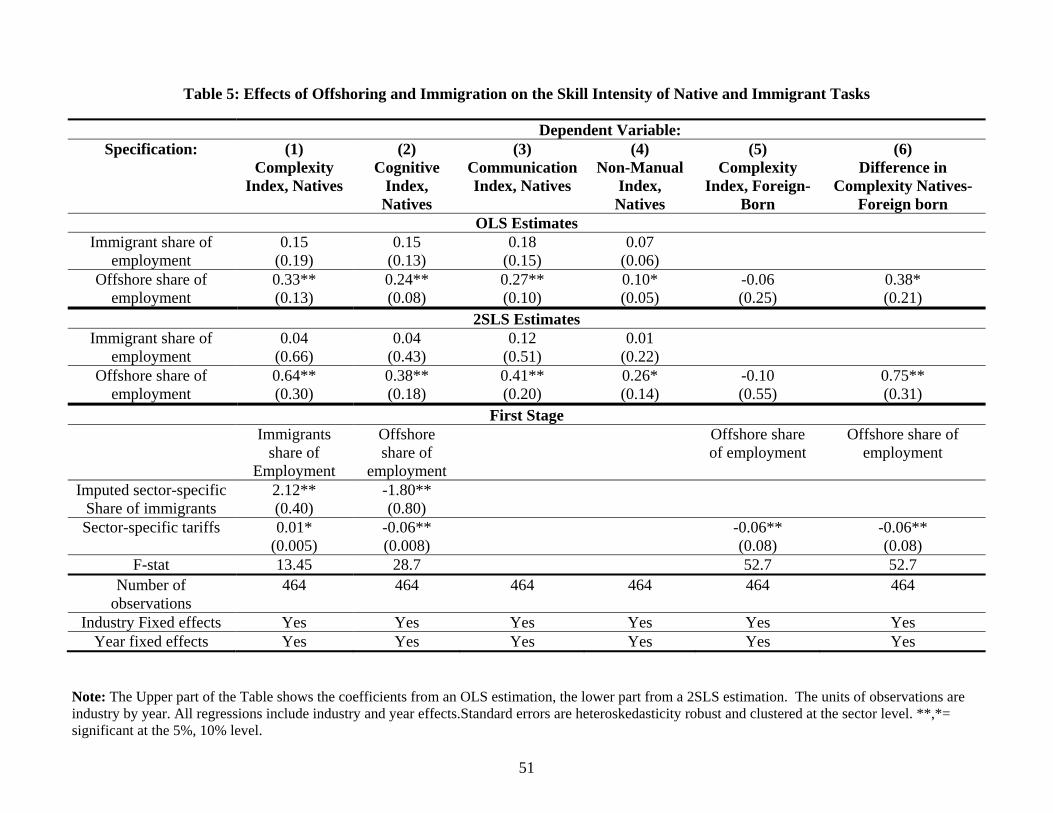
51
Table 5: Effects of Offshoring and Immigration on the Skill Intensity of Native and Immigrant Tasks
Note: The Upper part of the Table shows the coefficients from an OLS estimation, the lower part from a 2SLS estimation. The units of observations are industry by year. All regressions include industry and year effects.Standard errors are heteroskedasticity robust and clustered at the sector level. **,*= significant at the 5%, 10% level.
Dependent Variable: Specification: (1)
Complexity Index, Natives
(2) Cognitive
Index, Natives
(3) Communication Index, Natives
(4) Non-Manual
Index, Natives
(5) Complexity
Index, Foreign-Born
(6) Difference in
Complexity Natives-Foreign born
OLS Estimates Immigrant share of
employment 0.15
(0.19) 0.15
(0.13) 0.18
(0.15) 0.07
(0.06)
Offshore share of employment
0.33** (0.13)
0.24** (0.08)
0.27** (0.10)
0.10* (0.05)
-0.06 (0.25)
0.38* (0.21)
2SLS Estimates Immigrant share of
employment 0.04
(0.66) 0.04
(0.43) 0.12
(0.51) 0.01
(0.22)
Offshore share of employment
0.64** (0.30)
0.38** (0.18)
0.41** (0.20)
0.26* (0.14)
-0.10 (0.55)
0.75** (0.31)
First Stage Immigrants
share of Employment
Offshore share of
employment
Offshore share of employment
Offshore share of employment
Imputed sector-specific Share of immigrants
2.12** (0.40)
-1.80** (0.80)
Sector-specific tariffs 0.01* (0.005)
-0.06** (0.008)
-0.06** (0.08)
-0.06** (0.08)
F-stat 13.45 28.7 52.7 52.7 Number of
observations 464 464 464 464 464 464
Industry Fixed effects Yes Yes Yes Yes Yes Yes Year fixed effects Yes Yes Yes Yes Yes Yes
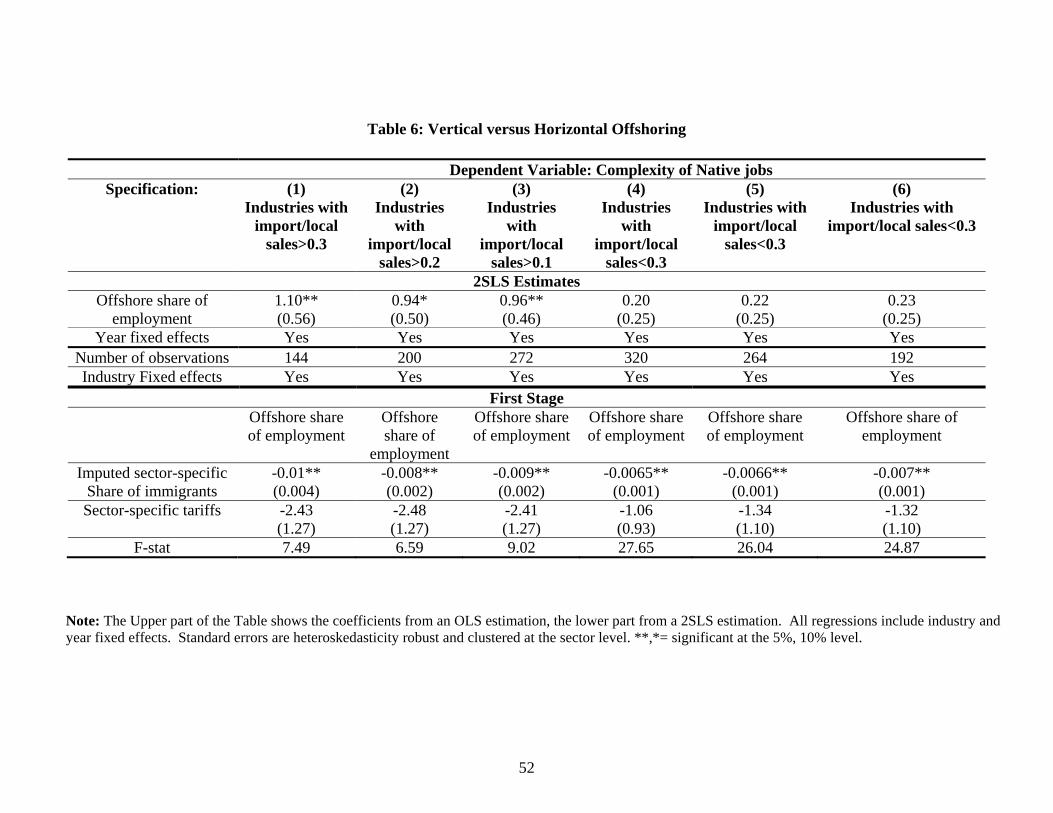
52
Table 6: Vertical versus Horizontal Offshoring
Note: The Upper part of the Table shows the coefficients from an OLS estimation, the lower part from a 2SLS estimation. All regressions include industry and year fixed effects. Standard errors are heteroskedasticity robust and clustered at the sector level. **,*= significant at the 5%, 10% level.
Dependent Variable: Complexity of Native jobs Specification: (1)
Industries with import/local
sales>0.3
(2) Industries
with import/local
sales>0.2
(3) Industries
with import/local
sales>0.1
(4) Industries
with import/local
sales<0.3
(5) Industries with
import/local sales<0.3
(6) Industries with
import/local sales<0.3
2SLS Estimates Offshore share of
employment 1.10** (0.56)
0.94* (0.50)
0.96** (0.46)
0.20 (0.25)
0.22 (0.25)
0.23 (0.25)
Year fixed effects Yes Yes Yes Yes Yes Yes Number of observations 144 200 272 320 264 192 Industry Fixed effects Yes Yes Yes Yes Yes Yes
First Stage Offshore share
of employment Offshore share of
employment
Offshore share of employment
Offshore share of employment
Offshore share of employment
Offshore share of employment
Imputed sector-specific Share of immigrants
-0.01** (0.004)
-0.008** (0.002)
-0.009** (0.002)
-0.0065** (0.001)
-0.0066** (0.001)
-0.007** (0.001)
Sector-specific tariffs -2.43 (1.27)
-2.48 (1.27)
-2.41 (1.27)
-1.06 (0.93)
-1.34 (1.10)
-1.32 (1.10)
F-stat 7.49 6.59 9.02 27.65 26.04 24.87
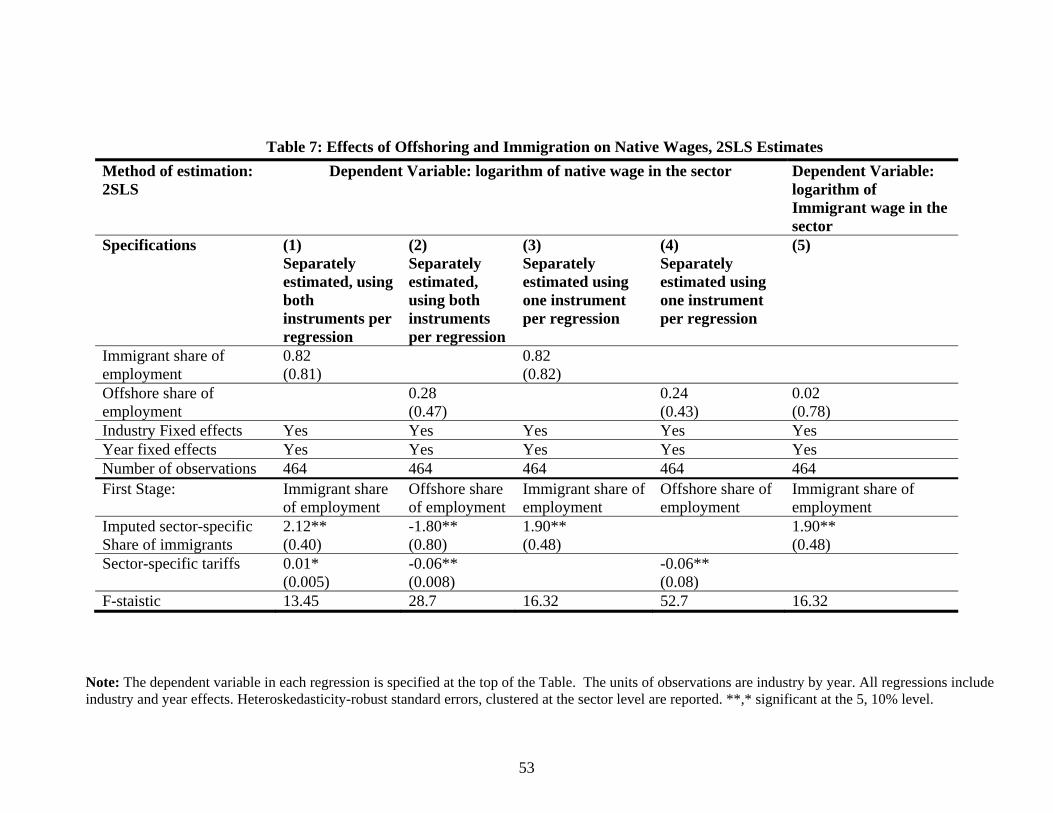
53
Table 7: Effects of Offshoring and Immigration on Native Wages, 2SLS Estimates
Note: The dependent variable in each regression is specified at the top of the Table. The units of observations are industry by year. All regressions include industry and year effects. Heteroskedasticity-robust standard errors, clustered at the sector level are reported. **,* significant at the 5, 10% level.
Method of estimation: 2SLS
Dependent Variable: logarithm of native wage in the sector Dependent Variable: logarithm of Immigrant wage in the sector
Specifications (1) Separately estimated, using both instruments per regression
(2) Separately estimated, using both instruments per regression
(3) Separately estimated using one instrument per regression
(4) Separately estimated using one instrument per regression
(5)
Immigrant share of employment
0.82 (0.81)
0.82 (0.82)
Offshore share of employment
0.28 (0.47)
0.24 (0.43)
0.02 (0.78)
Industry Fixed effects Yes Yes Yes Yes Yes Year fixed effects Yes Yes Yes Yes Yes Number of observations 464 464 464 464 464 First Stage: Immigrant share
of employment Offshore share of employment
Immigrant share of employment
Offshore share of employment
Immigrant share of employment
Imputed sector-specific Share of immigrants
2.12** (0.40)
-1.80** (0.80)
1.90** (0.48)
1.90** (0.48)
Sector-specific tariffs 0.01* (0.005)
-0.06** (0.008)
-0.06** (0.08)
F-staistic 13.45 28.7 16.32 52.7 16.32
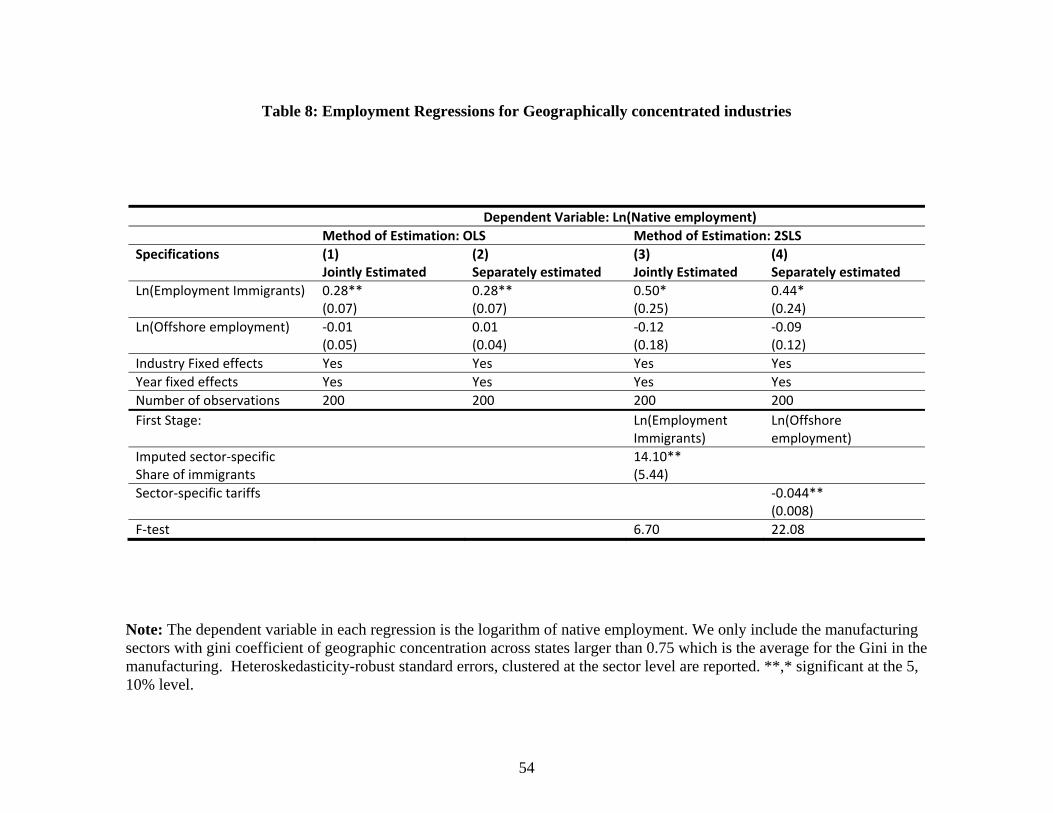
54
Table 8: Employment Regressions for Geographically concentrated industries
Note: The dependent variable in each regression is the logarithm of native employment. We only include the manufacturing sectors with gini coefficient of geographic concentration across states larger than 0.75 which is the average for the Gini in the manufacturing. Heteroskedasticity-robust standard errors, clustered at the sector level are reported. **,* significant at the 5, 10% level.
Dependent Variable: Ln(Native employment) Method of Estimation: OLS Method of Estimation: 2SLS Specifications (1)
Jointly Estimated (2) Separately estimated
(3) Jointly Estimated
(4) Separately estimated
Ln(Employment Immigrants) 0.28** (0.07)
0.28** (0.07)
0.50* (0.25)
0.44* (0.24)
Ln(Offshore employment) -0.01 (0.05)
0.01 (0.04)
-0.12 (0.18)
-0.09 (0.12)
Industry Fixed effects Yes Yes Yes Yes Year fixed effects Yes Yes Yes Yes Number of observations 200 200 200 200 First Stage: Ln(Employment
Immigrants) Ln(Offshore employment)
Imputed sector-specific Share of immigrants
14.10** (5.44)
Sector-specific tariffs -0.044** (0.008)
F-test 6.70 22.08
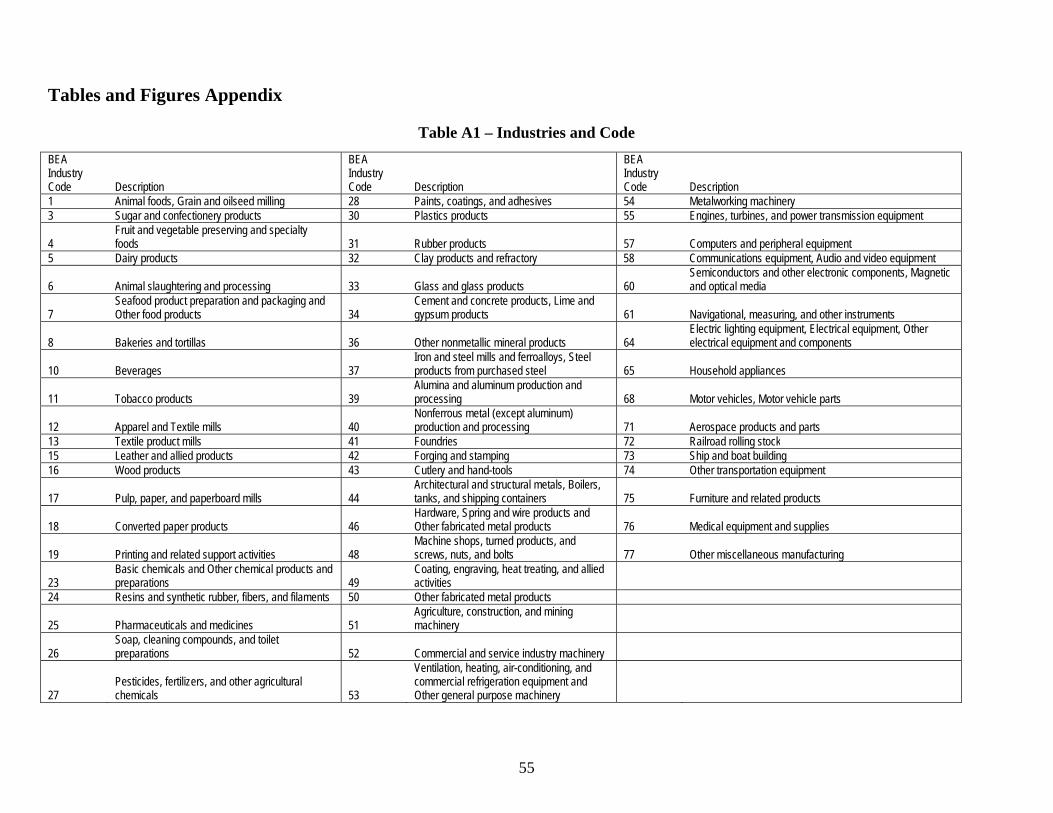
55
Tables and Figures Appendix
Table A1 – Industries and Code
BEA Industry Code Description
BEA Industry Code Description
BEA Industry Code Description
1 Animal foods, Grain and oilseed milling 28 Paints, coatings, and adhesives 54 Metalworking machinery3 Sugar and confectionery products 30 Plastics products 55 Engines, turbines, and power transmission equipment
4 Fruit and vegetable preserving and specialty foods 31 Rubber products 57 Computers and peripheral equipment
5 Dairy products 32 Clay products and refractory 58 Communications equipment, Audio and video equipment
6 Animal slaughtering and processing 33 Glass and glass products 60 Semiconductors and other electronic components, Magnetic and optical media
7 Seafood product preparation and packaging and Other food products 34
Cement and concrete products, Lime and gypsum products 61 Navigational, measuring, and other instruments
8 Bakeries and tortillas 36 Other nonmetallic mineral products 64 Electric lighting equipment, Electrical equipment, Otherelectrical equipment and components
10 Beverages 37 Iron and steel mills and ferroalloys, Steel products from purchased steel 65 Household appliances
11 Tobacco products 39 Alumina and aluminum production and processing 68 Motor vehicles, Motor vehicle parts
12 Apparel and Textile mills 40 Nonferrous metal (except aluminum) production and processing 71 Aerospace products and parts
13 Textile product mills 41 Foundries 72 Railroad rolling stock15 Leather and allied products 42 Forging and stamping 73 Ship and boat building16 Wood products 43 Cutlery and hand-tools 74 Other transportation equipment
17 Pulp, paper, and paperboard mills 44 Architectural and structural metals, Boilers, tanks, and shipping containers 75 Furniture and related products
18 Converted paper products 46 Hardware, Spring and wire products and Other fabricated metal products 76 Medical equipment and supplies
19 Printing and related support activities 48 Machine shops, turned products, and screws, nuts, and bolts 77 Other miscellaneous manufacturing
23 Basic chemicals and Other chemical products and preparations 49
Coating, engraving, heat treating, and allied activities
24 Resins and synthetic rubber, fibers, and filaments 50 Other fabricated metal products
25 Pharmaceuticals and medicines 51 Agriculture, construction, and mining machinery
26 Soap, cleaning compounds, and toilet preparations 52 Commercial and service industry machinery
27 Pesticides, fertilizers, and other agricultural chemicals 53
Ventilation, heating, air-conditioning, and commercial refrigeration equipment and Other general purpose machinery
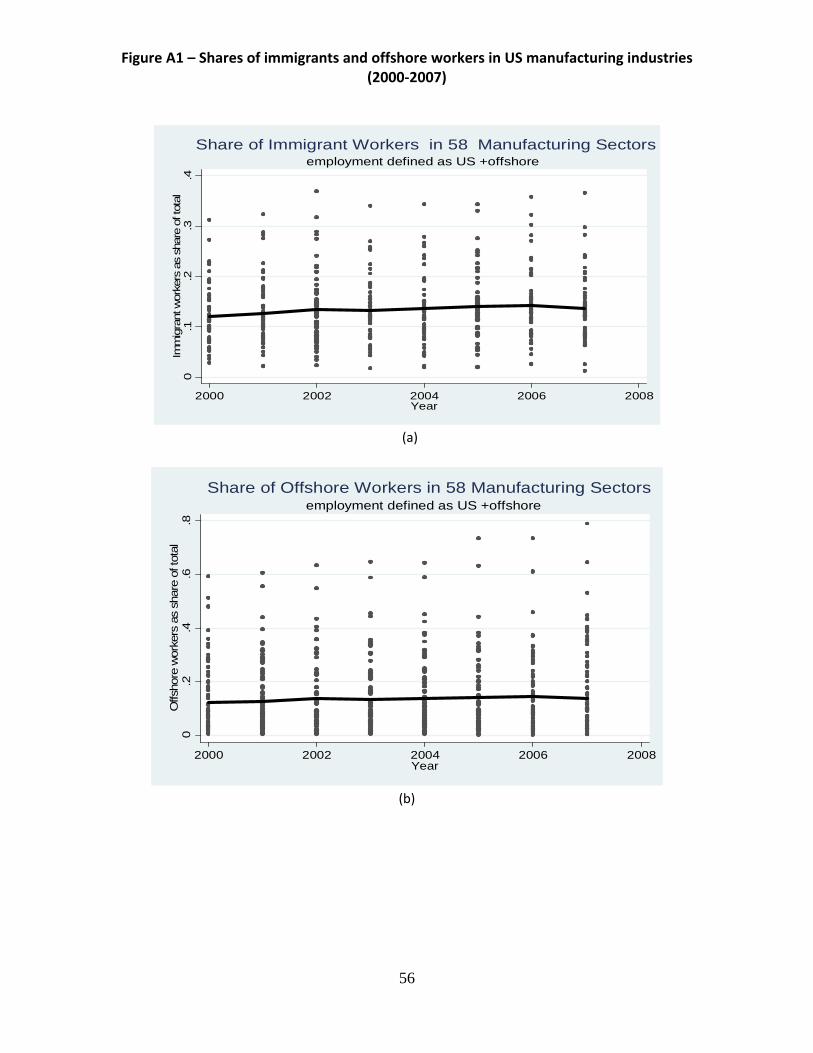
56
Figure A1 – Shares of immigrants and offshore workers in US manufacturing industries (2000-2007)
0.1
.2.3
.4Im
mig
rant
wor
kers
as
shar
e of
tota
l
2000 2002 2004 2006 2008Year
employment defined as US +offshoreShare of Immigrant Workers in 58 Manufacturing Sectors
(a)
0.2
.4.6
.8O
ffsho
re w
orke
rs a
s sh
are
of to
tal
2000 2002 2004 2006 2008Year
employment defined as US +offshore Share of Offshore Workers in 58 Manufacturing Sectors
(b)
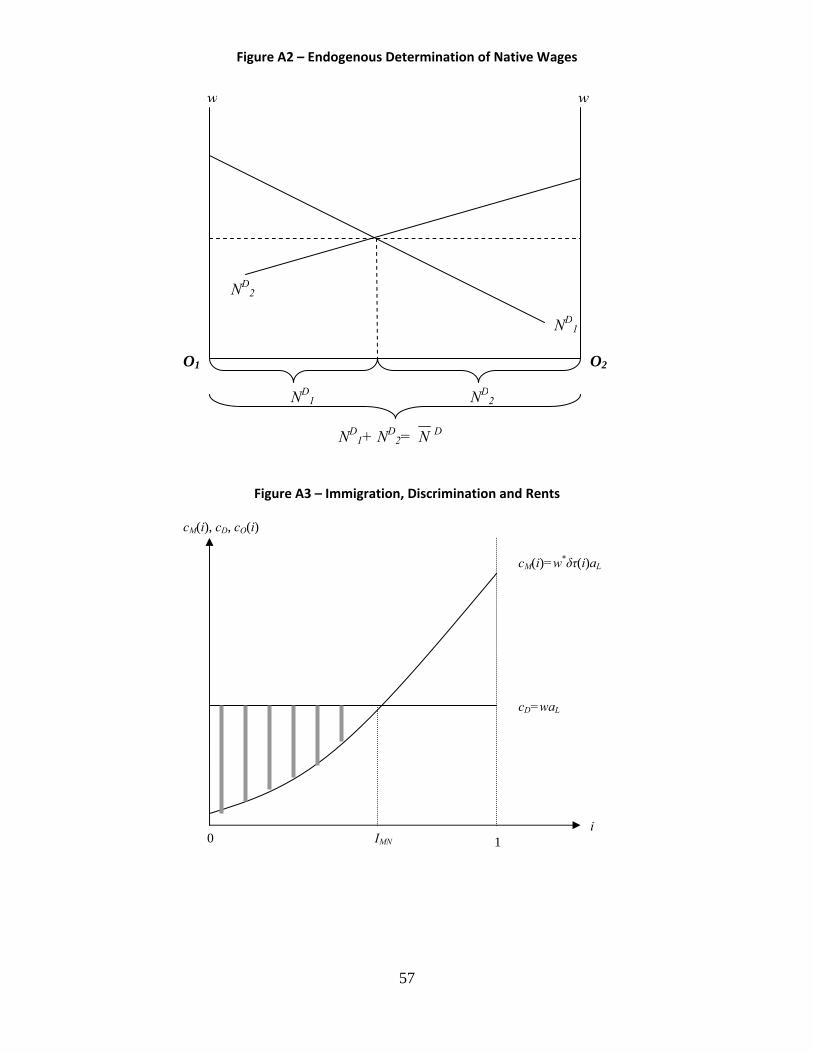
57
Figure A2 – Endogenous Determination of Native Wages
Figure A3 – Immigration, Discrimination and Rents
cD=waL
cM(i)=w*δτ(i)aL
cM(i), cD, cO(i)
i 1 0 IMN
w w
O1 O2
ND2
ND1
ND1 ND
2
ND1+ ND
2= N D

CENTRE FOR ECONOMIC PERFORMANCE
Recent Discussion Papers
1146 Thierry Mayer
Marc J. Melitz
Gianmarco I. P. Ottaviano
Market Size, Competition, and the Product
Mix of Exporters
1145 Oriana Bandiera
Luigi Guiso
Andrea Prat
Raffaella Sadun
What do CEOs Do?
1144 Oriana Bandiera
Luigi Guiso
Andrea Prat
Raffaella Sadun
Matching Firms, Managers, and Incentives
1143 Michael Boehm
Martin Watzinger
The Allocation of Talent over the Business
Cycle and its Effect on Sectoral Productivity
1142 Johannes Spinnewijn Heterogeneity, Demand for Insurance and
Adverse Selection
1141 Raphael Calel
Antoine Dechezleprêtre
Environmental Policy and Directed
Technological Change: Evidence from the
European Carbon Market
1140 Stephen J. Redding Goods Trade, Factor Mobility and Welfare
1139 Oriana Bandiera
Andrea Prat
Raffaella Sadun
Julie Wulf
Span of Control and Span of Activity
1138 Elhanan Helpman
Oleg Itskhoki
Marc-Andreas Muendler
Stephen Redding
Trade and Inequality: from Theory to
Estimation
1137 Andrew B. Bernard
Marco Grazzi
Chiara Tomasi
Intermediaries in International Trade: Direct
versus Indirect Modes of Export
1136 Ghazala Azmat
Rosa Ferrer
Gender Gaps in Performance: Evidence from
Young Lawyers
1135 Alex Bryson
John Forth
Minghai Zhou
CEP Bonding: Who Posts Performance
Bonds and Why?
1134 Alex Bryson
Rob Simmons
Giambattista Rossi
Why Are Migrants Paid More?

1133 Jörg Claussen
Tobias Kretschmer
Philip Mayrhofer
Incentives for Quality over Time - The Case
of Facebook Applications
1132 Bianca De Paoli
Pawel Zabczyk
Cyclical Risk Aversion, Precautionary Saving
and Monetary Policy
1131 Carlo Altomonte
Filippo De Mauro
Gianmarco I. P. Ottaviano
Armando Rungi
Vincent Vicard
Global Value Chains During the Great Trade
Collapse: A Bullwhip Effect?
1130 Swati Dhingra
John Morrow
The Impact of Integration on Productivity and
Welfare Distortions Under Monopolistic
Competition
1129 Gianmarco I. P. Ottaviano Agglomeration, Trade and Selection
1128 Luis Garicano
Claire Lelarge
John Van Reenen
Firm Size Distortions and the Productivity
Distribution: Evidence from France
1127 Nicholas A. Christakis
Jan-Emmanuel De Neve
James H. Fowler
Bruno S. Frey
Genes, Economics and Happiness
1126 Robert J. B. Goudie
Sach Mukherjee
Jan-Emmanuel De Neve
Andrew J. Oswald
Stephen Wu
Happiness as a Driver of Risk-Avoiding
Behavior
1125 Zack Cooper
Stephen Gibbons
Simon Jones
Alistair McGuire
Does Competition Improve Public Hospitals’
Efficiency? Evidence from a Quasi-
Experiment in the English National Health
Service
1124 Jörg Claussen
Tobias Kretschmer
Thomas Spengler
Market Leadership Through Technology -
Backward Compatibility in the U.S.
Handheld Video Game Industry
1123 Bernardo Guimaraes
Kevin D. Sheedy
A Model of Equilibrium Institutions
1122 Francesco Caselli
Tom Cunningham
Massimo Morelli
Inés Moreno de Barreda
Signalling, Incumbency Advantage, and
Optimal Reelection Rules
The Centre for Economic Performance Publications Unit
Tel 020 7955 7673 Fax 020 7955 7595
Email [email protected] Web site http://cep.lse.ac.uk