ceo connect 11 december 2018 - asx.com.au · asx ceo connect | 4 consistent dividend returns to...
TRANSCRIPT

ASXCEO CONNECT
11 December 2018

AGENDA
Melos Sulicich CEO
• Corporate Profile and History
• Strategy
• Key Highlights FY18
• Banking Business
• Wealth Business
• Summary
ASX CEO CONNECT | 2
ASX CEO CONNECT | 3
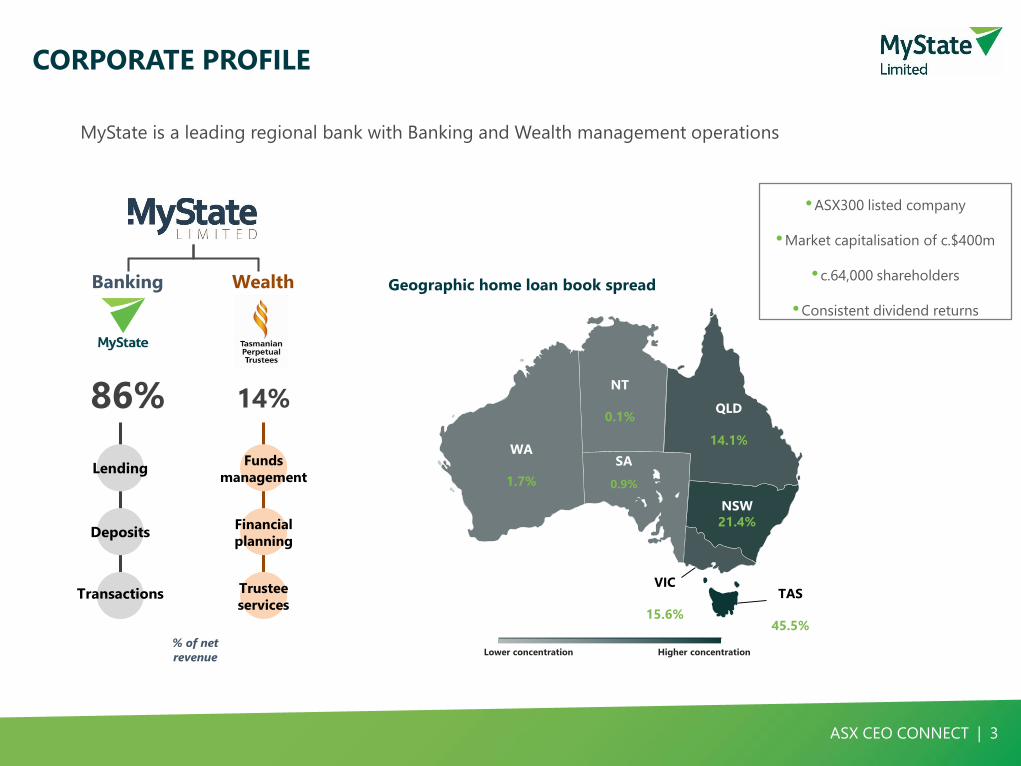
CORPORATE PROFILE
MyState is a leading regional bank with Banking and Wealth management operations
Lending
Deposits
% of net
revenue
Wealth
86%
Banking
Transactions
14%
Funds
management
Financial
planning
Trustee
services
•ASX300 listed company
•Market capitalisation of c.$400m
• c.64,000 shareholders
•Consistent dividend returns
Geographic home loan book spread
TAS
45.5%
VIC
15.6%
NSW
21.4%
QLD
14.1%
NT
0.1%
WA
1.7%
SA
0.9%
Lower concentration Higher concentration
ASX CEO CONNECT | 4
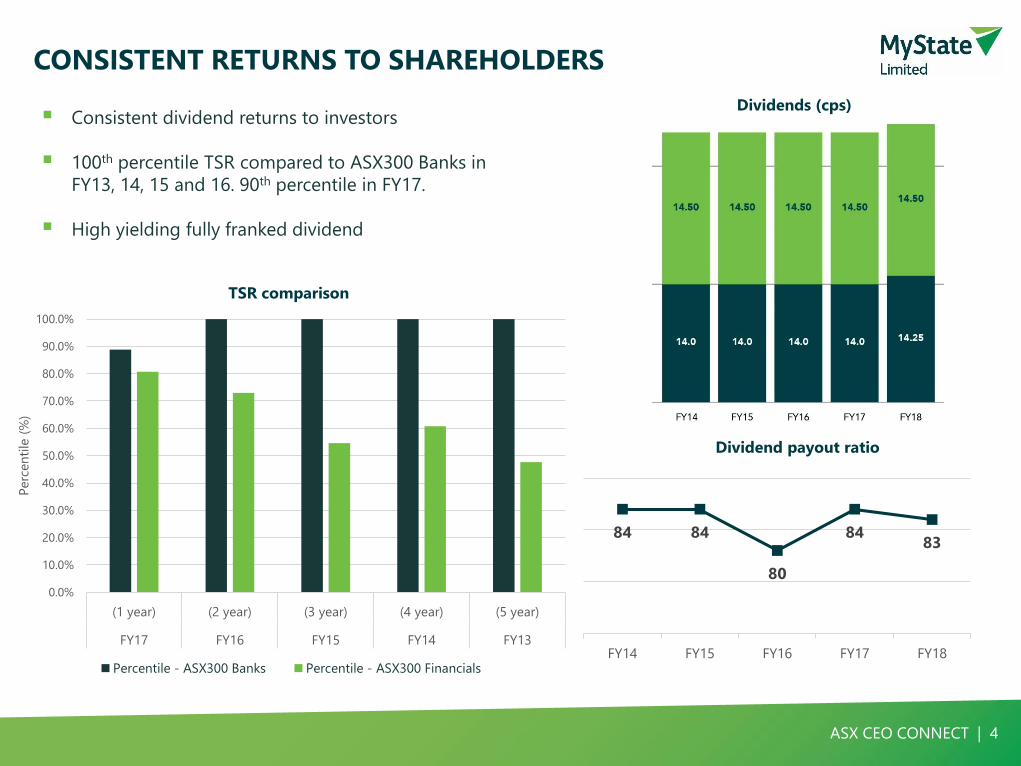
▪ Consistent dividend returns to investors
▪ 100th percentile TSR compared to ASX300 Banks in
FY13, 14, 15 and 16. 90th percentile in FY17.
▪ High yielding fully franked dividend
CONSISTENT RETURNS TO SHAREHOLDERS
0.0%
10.0%
20.0%
30.0%
40.0%
50.0%
60.0%
70.0%
80.0%
90.0%
100.0%
(1 year) (2 year) (3 year) (4 year) (5 year)
FY17 FY16 FY15 FY14 FY13
Perc
en
tile
(%
)
TSR comparison
Percentile - ASX300 Banks Percentile - ASX300 Financials
84 84
80
8483
FY14 FY15 FY16 FY17 FY18
Dividend payout ratio
Dividends (cps)
ASX CEO CONNECT | 5
2.50
3.00
3.50
4.00
4.50
5.00
5.50
6.00
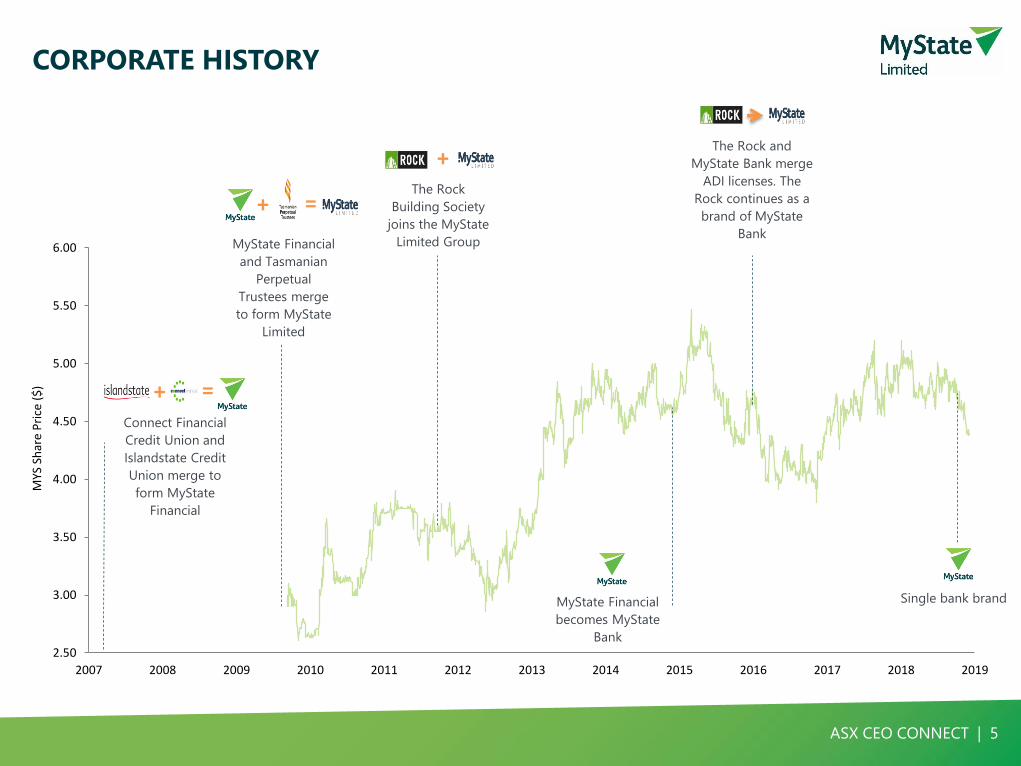
2007 2008 2009 2010 2011 2012 2013 2014 2015 2016 2017 2018 2019
MYS
Sh
are
Pri
ce (
$)
MyState Financial
and Tasmanian
Perpetual
Trustees merge
to form MyState
Limited
Connect Financial
Credit Union and
Islandstate Credit
Union merge to
form MyState
Financial
+ =
+ =The Rock
Building Society
joins the MyState
Limited Group
+
MyState Financial
becomes MyState
Bank
The Rock and
MyState Bank merge
ADI licenses. The
Rock continues as a
brand of MyState
Bank
CORPORATE HISTORY
Single bank brand
ASX CEO CONNECT | 6
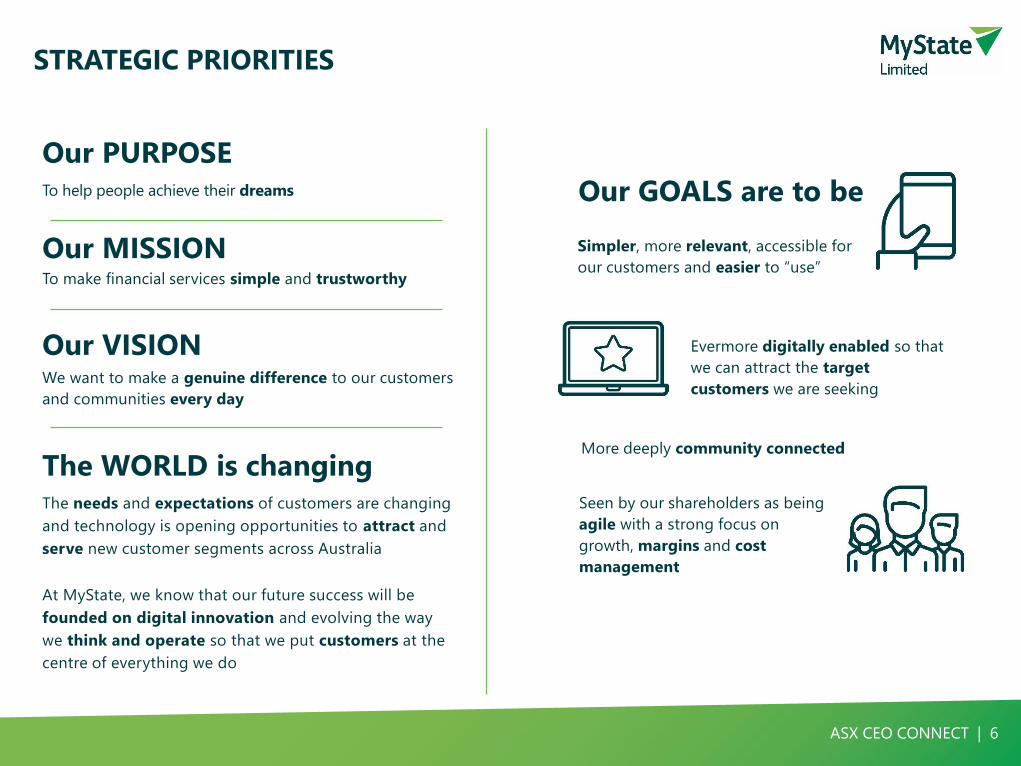
Our PURPOSETo help people achieve their dreams
Our VISIONWe want to make a genuine difference to our customers
and communities every day
The WORLD is changingThe needs and expectations of customers are changing
and technology is opening opportunities to attract and
serve new customer segments across Australia
At MyState, we know that our future success will be
founded on digital innovation and evolving the way
we think and operate so that we put customers at the
centre of everything we do
Our GOALS are to be
Our MISSIONTo make financial services simple and trustworthy
STRATEGIC PRIORITIES
Simpler, more relevant, accessible for
our customers and easier to “use”
Evermore digitally enabled so that
we can attract the target
customers we are seeking
More deeply community connected
Seen by our shareholders as being
agile with a strong focus on
growth, margins and cost
management
ASX CEO CONNECT | 7
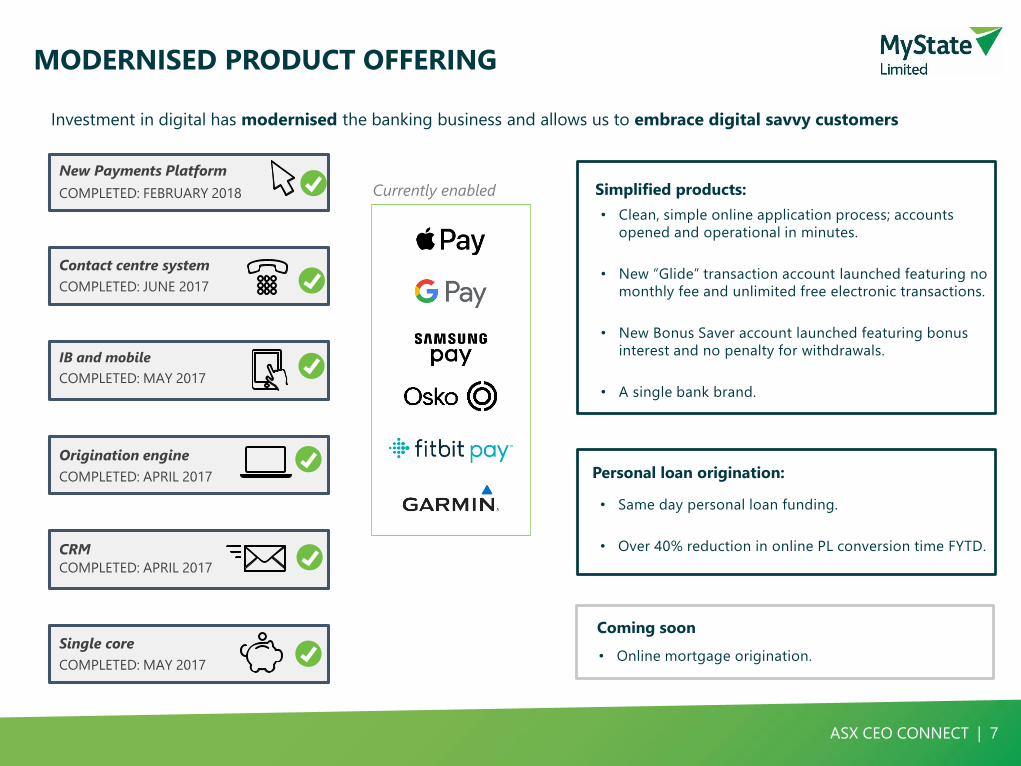
MODERNISED PRODUCT OFFERING
CRM
COMPLETED: APRIL 2017
IB and mobile
COMPLETED: MAY 2017
Single core
COMPLETED: MAY 2017
Contact centre system
COMPLETED: JUNE 2017
Origination engine
COMPLETED: APRIL 2017
New Payments Platform
COMPLETED: FEBRUARY 2018
Investment in digital has modernised the banking business and allows us to embrace digital savvy customers
Currently enabled Simplified products:
• Clean, simple online application process; accounts
opened and operational in minutes.
• New “Glide” transaction account launched featuring no
monthly fee and unlimited free electronic transactions.
• New Bonus Saver account launched featuring bonus
interest and no penalty for withdrawals.
• A single bank brand.
Personal loan origination:
• Same day personal loan funding.
• Over 40% reduction in online PL conversion time FYTD.
Coming soon
• Online mortgage origination.
ASX CEO CONNECT | 8
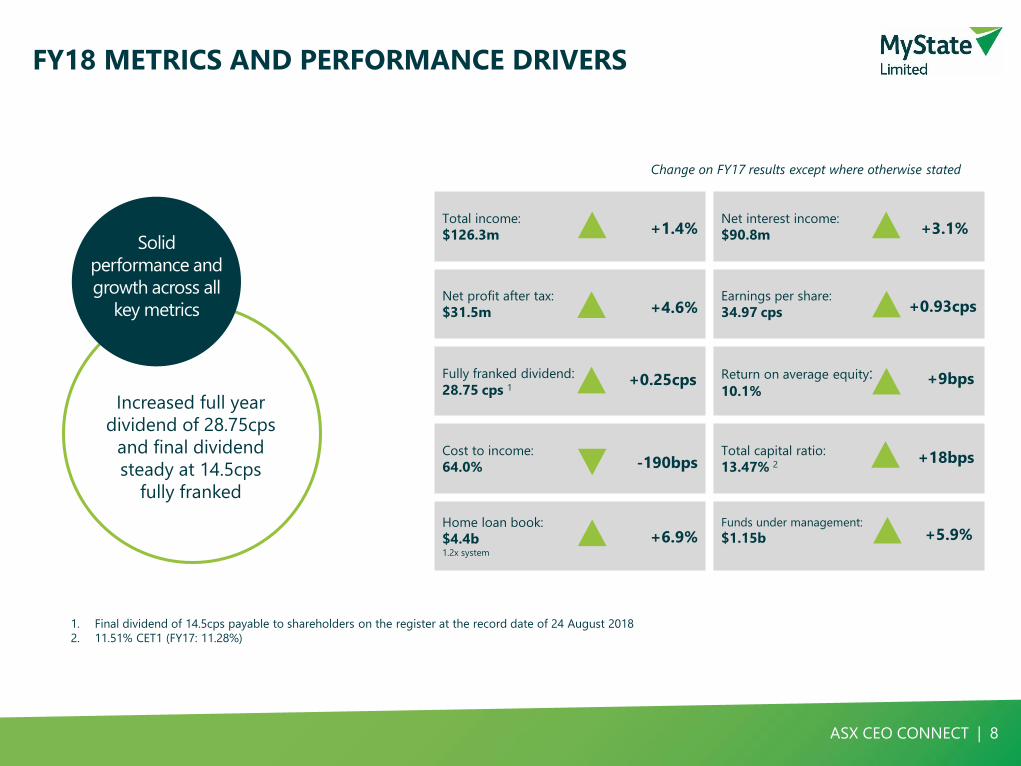
Total income:
$126.3m
Net interest income:
$90.8m
Net profit after tax:
$31.5m
Earnings per share:
34.97 cps
Fully franked dividend:
28.75 cps 1Return on average equity:10.1%
Cost to income:
64.0%
Total capital ratio:
13.47% 2
Home loan book:
$4.4b1.2x system
Funds under management:
$1.15b
FY18 METRICS AND PERFORMANCE DRIVERS
Change on FY17 results except where otherwise stated
+1.4%
-190bps
+6.9%
+3.1%
+5.9%
+18bps
+4.6% +0.93cps
Increased full year
dividend of 28.75cps
and final dividend
steady at 14.5cps
fully franked
Solid
performance and
growth across all
key metrics
1. Final dividend of 14.5cps payable to shareholders on the register at the record date of 24 August 2018
2. 11.51% CET1 (FY17: 11.28%)
+9bps+0.25cps
ASX CEO CONNECT | 9
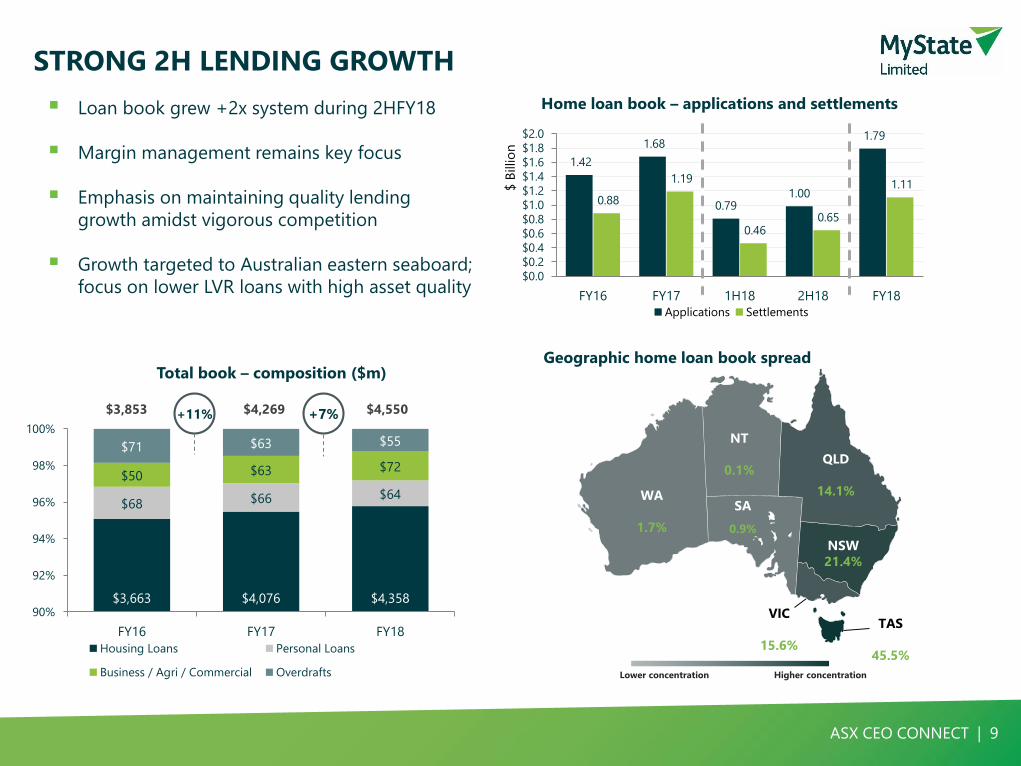
STRONG 2H LENDING GROWTH
▪ Loan book grew +2x system during 2HFY18
▪ Margin management remains key focus
▪ Emphasis on maintaining quality lending
growth amidst vigorous competition
▪ Growth targeted to Australian eastern seaboard;
focus on lower LVR loans with high asset quality
$3,663 $4,076 $4,358
$68 $66 $64
$50 $63 $72
$71 $63 $55
90%
92%
94%
96%
98%
100%
FY16 FY17 FY18
Total book – composition ($m)
Housing Loans Personal Loans
Business / Agri / Commercial Overdrafts
$3,853 $4,269 $4,550
Geographic home loan book spread
1.42
1.68
0.791.00
1.79
0.88
1.19
0.46 0.65
1.11
$0.0
$0.2
$0.4
$0.6
$0.8
$1.0
$1.2
$1.4
$1.6
$1.8
$2.0
FY16 FY17 1H18 2H18 FY18
$ B
illio
n
Home loan book – applications and settlements
Applications Settlements
+11% +7%
TAS
45.5%
VIC
15.6%
NSW
21.4%
QLD
14.1%
NT
0.1%
WA
1.7%
SA
0.9%
Lower concentration Higher concentration
ASX CEO CONNECT | 10
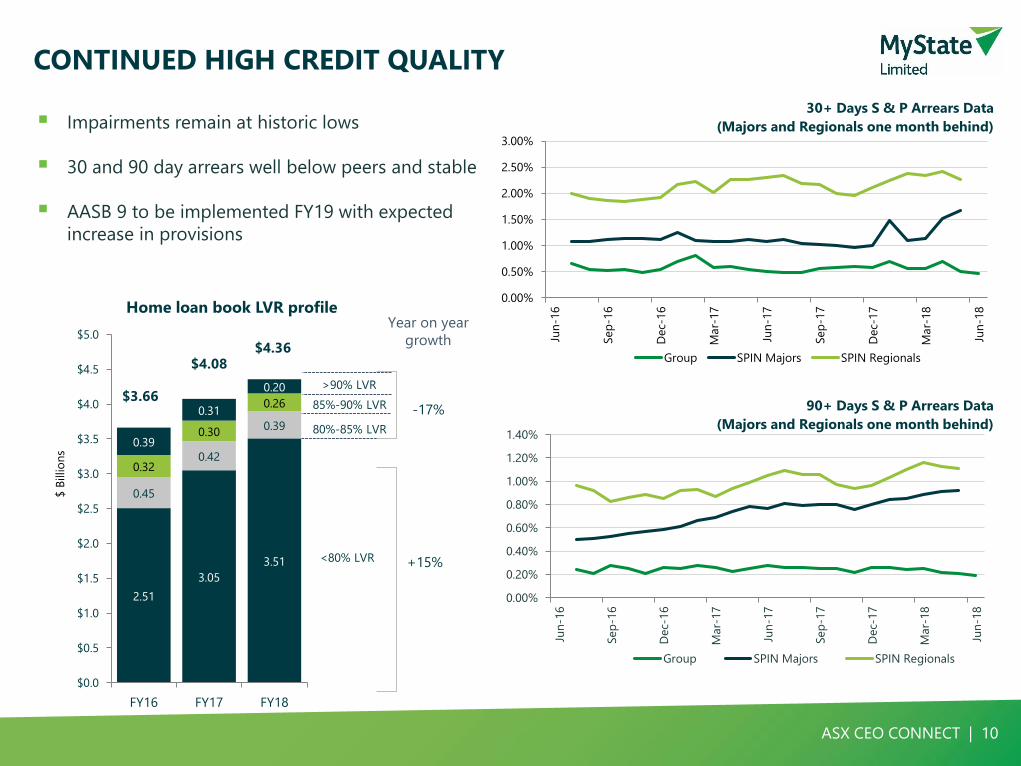
CONTINUED HIGH CREDIT QUALITY
▪ Impairments remain at historic lows
▪ 30 and 90 day arrears well below peers and stable
▪ AASB 9 to be implemented FY19 with expected
increase in provisions
0.00%
0.50%
1.00%
1.50%
2.00%
2.50%
3.00%
Jun
-16
Sep
-16
Dec-
16
Mar-
17
Jun
-17
Sep
-17
Dec-
17
Mar-
18
Jun
-18
30+ Days S & P Arrears Data
(Majors and Regionals one month behind)
Group SPIN Majors SPIN Regionals
0.00%
0.20%
0.40%
0.60%
0.80%
1.00%
1.20%
1.40%
Jun
-16
Sep
-16
Dec-
16
Mar-
17
Jun
-17
Sep
-17
Dec-
17
Mar-
18
Jun
-18
90+ Days S & P Arrears Data
(Majors and Regionals one month behind)
Group SPIN Majors SPIN Regionals
2.51
3.05
3.51
0.45
0.42
0.39
0.32
0.30
0.26
0.39
0.31
0.20
$0.0
$0.5
$1.0
$1.5
$2.0
$2.5
$3.0
$3.5
$4.0
$4.5
$5.0
FY16 FY17 FY18
$ B
illio
ns
Home loan book LVR profile
>90% LVR
85%-90% LVR
80%-85% LVR
<80% LVR
Year on year
growth
-17%
+15%
$3.66
$4.36$4.08
ASX CEO CONNECT | 11
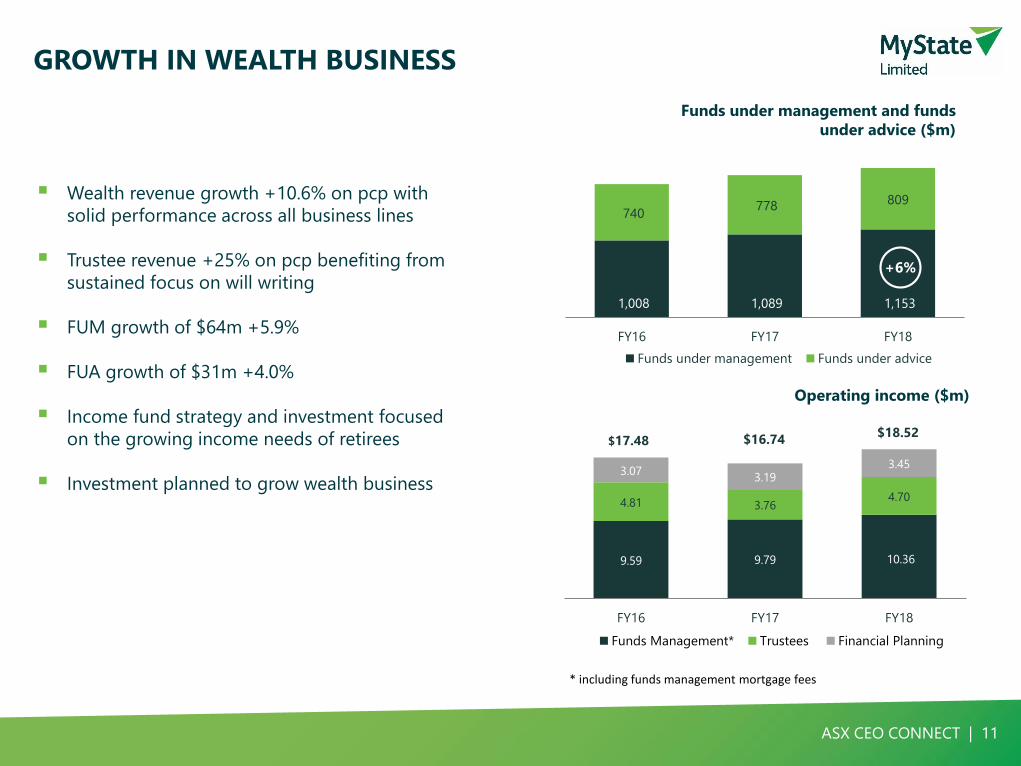
9.59 9.79 10.36
4.81 3.764.70
3.073.19
3.45
FY16 FY17 FY18
Operating income ($m)
Funds Management* Trustees Financial Planning
1,008 1,089 1,153
740 778 809
FY16 FY17 FY18
Funds under management Funds under advice
GROWTH IN WEALTH BUSINESS
▪ Wealth revenue growth +10.6% on pcp with
solid performance across all business lines
▪ Trustee revenue +25% on pcp benefiting from
sustained focus on will writing
▪ FUM growth of $64m +5.9%
▪ FUA growth of $31m +4.0%
▪ Income fund strategy and investment focused
on the growing income needs of retirees
▪ Investment planned to grow wealth business
$16.74$17.48$18.52
Funds under management and funds
under advice ($m)
+6%
* including funds management mortgage fees
ASX CEO CONNECT | 12
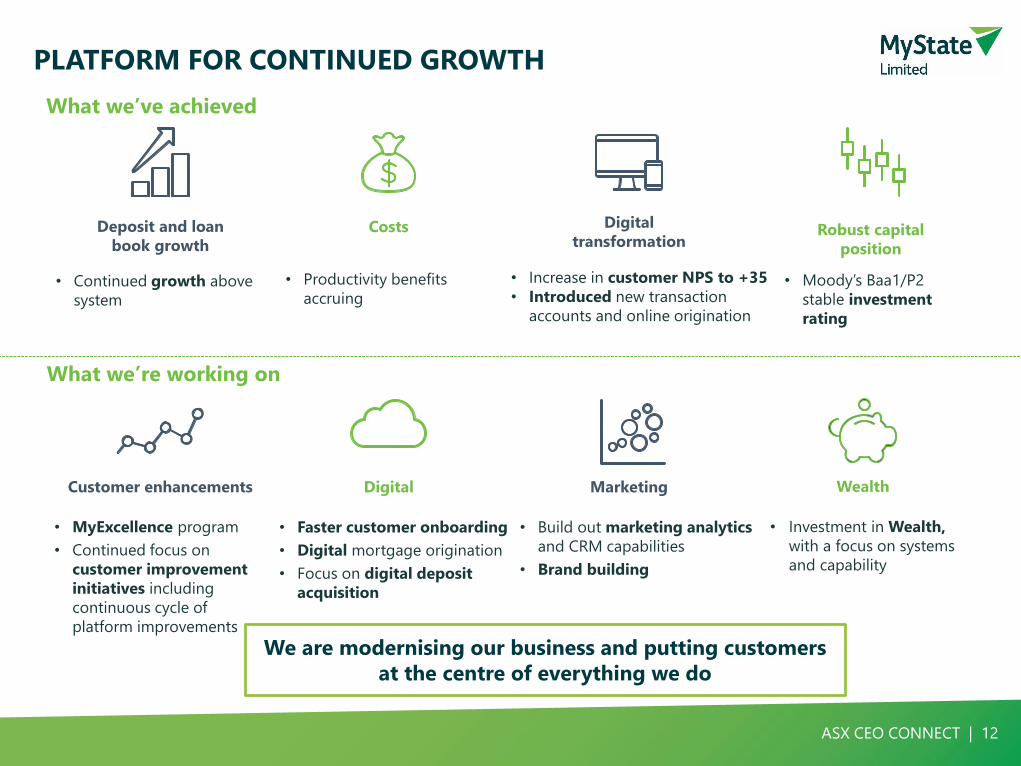
PLATFORM FOR CONTINUED GROWTH
What we’ve achieved
What we’re working on
Deposit and loan
book growth
• Continued growth above
system
Customer enhancements
• MyExcellence program
• Continued focus on
customer improvement
initiatives including
continuous cycle of
platform improvements
Digital
• Faster customer onboarding
• Digital mortgage origination
• Focus on digital deposit
acquisition
Costs
• Productivity benefits
accruing
Digital
transformation
• Increase in customer NPS to +35
• Introduced new transaction
accounts and online origination
Marketing
• Build out marketing analytics
and CRM capabilities
• Brand building
Robust capital
position
• Moody’s Baa1/P2
stable investment
rating
Wealth
• Investment in Wealth,
with a focus on systems
and capability
We are modernising our business and putting customers
at the centre of everything we do
ASX CEO CONNECT | 13
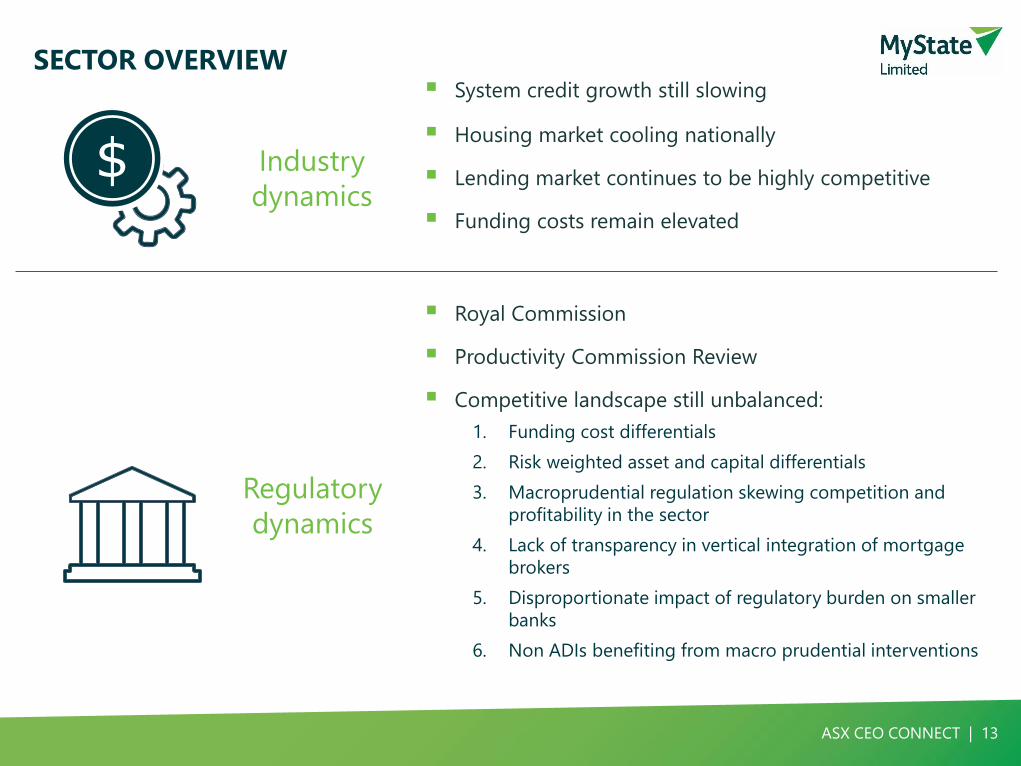
▪ System credit growth still slowing
▪ Housing market cooling nationally
▪ Lending market continues to be highly competitive
▪ Funding costs remain elevated
▪ Royal Commission
▪ Productivity Commission Review
▪ Competitive landscape still unbalanced:
1. Funding cost differentials
2. Risk weighted asset and capital differentials
3. Macroprudential regulation skewing competition and
profitability in the sector
4. Lack of transparency in vertical integration of mortgage
brokers
5. Disproportionate impact of regulatory burden on smaller
banks
6. Non ADIs benefiting from macro prudential interventions
Industry
dynamics
Regulatory
dynamics
$
SECTOR OVERVIEW
ASX CEO CONNECT | 14
DISCLAIMER
Summary Information
This Presentation contains summary information about MyState and its activities current as at
the date of this Presentation. The information is subject to change without notice and does
not purport to be complete or comprehensive. It does not purport to summarise all
information that an investor should consider when making an investment decision. It should
be read in conjunction with MyState's other periodic and continuous disclosure
announcements lodged with the Australian Securities Exchange, which are available at
www.asx.com.au.
Not Financial Product Advice
This Presentation is for information purposes only and is not financial product advice or a
recommendation to acquire shares. It has been prepared without taking into account any
investor’s objectives, financial position, situation or needs. Therefore, before making an
investment decision, investors should consider the appropriateness of the information in this
Presentation and have regard to their own objectives, financial situation and needs. Investors
should seek such financial, legal or tax advice as they deem necessary or consider
appropriate. MyState is not licensed to provide financial product advice in relation to the offer
of shares. Cooling off rights do not apply to the acquisition of the shares.
Financial Information
All information in this Presentation is in Australian dollars ($) unless stated otherwise. A
number of figures, amounts, percentages, estimates, calculations of value and fractions in this
presentation are subject to the effect of rounding. Accordingly, the actual calculation of these
figures may differ from the figures set out in this presentation and totals may vary slightly
due to rounding. All references to financial years (FY) appearing in this Presentation are to the
financial years ended on 30 June of the indicated year.
Past Performance
Past performance information, including past share price information, given in this
Presentation is given for illustrative purposes only and should not be relied upon as (and is
not) an indication of future performance.
Future Performance
This Presentation may contain “forward-looking” statements including statements
regarding MyState's intent, belief or current expectations with respect to their business
operations, market conditions, results of operations, financial conditions, and risk
management practices. Forward-looking statements can generally be identified by the
use of forward-looking words such as “anticipated”, “expected”, "aim", "predict",
“projections”, “guidance”, “forecast”, “estimates”, “could”, “may”, “target”, “consider”,
“will” and other similar expressions. Indications of, and guidance on, future earnings,
financial performance, and financial position are also forward looking statements .
Forward looking statements, opinions and estimates are based on assumptions and
contingencies which are subject to certain risks, uncertainties and change without
notice, as are statements about market and industry trends, which are based on
interpretations of current market conditions. Forward-looking statements including
projections, indications or guidance on future earnings or financial position and
estimates are provided as a general guide only and should not be relied upon as an
indication or guarantee of future performance. Should one or more of the risks or
uncertainties materialise, or should underlying assumptions prove incorrect, there can
be no assurance that actual outcomes will not differ materially from these statements.
To the fullest extent permitted by law, MyState and its directors, officers, employees,
advisers, agents and intermediaries disclaim any obligation or undertaking to release
any updates or revisions to the information to reflect any change in expectations or
assumptions.
Investment Risk
An investment in securities in MyState is subject to investment and other known and
unknown risks, some of which are beyond the control of MyState, including possible
loss of income or principal invested. MyState does not guarantee any particular rate of
return or the performance of MyState. Investors should have regard to the risk factors
outlined in this Presentation when making their investment decision.
Not an Offer
This Presentation is not an offer or an invitation to acquire shares in MyState or any
other financial products and is not a prospectus, product disclosure statement or other
offering document under Australian law or any other law. It is for information purposes
only.