central eyre iron project - iron road - home ird... · central eyre iron project. our technical...
TRANSCRIPT
www.ironroadlimited.com.au
Central Eyre Iron Project Our Technical Journey
October 2014
www.ironroadlimited.com.au
Forward Looking Statements This announcement contains certain statements with respect to future matters which may constitute "forward-looking statements". Such statements are only predictions and are subject to inherent risks and uncertainties which could cause actual values, results, performance or outcomes to differ materially from those expressed, implied or projected. Investors are cautioned that such statements are not guarantees of future performance and accordingly not to put undue reliance on forward-looking statements due to the inherent uncertainty therein.
Competent Persons’ Statements The information in this report that relates to the Exploration Target within EL4849 is based on and fairly represents information and supporting documentation compiled by Mr Milo Res, a Competent Person who is a Member of the Australasian Institute of Mining and Metallurgy. Mr Res has sufficient experience that is relevant to the style of mineralisation and the type of deposits under consideration and to the activity being undertaken to qualify as a Competent Person as defined in the 2012 Edition of the “Australasian Code for Reporting of Exploration Results, Mineral Resources and Ore Reserves”. Mr Res at the release date of the Exploration Target was a full time employee of Iron Road Limited and consents to the inclusion in the report of the matters based on this information in the form and context in which it appears.
The information in this report that relates to Mineral Resources estimated for the Boo-Loo prospect is based on and fairly represents information and supporting documentation compiled by Mr Ian MacFarlane, who is a Fellow of the Australasian Institute of Mining and Metallurgy and at the release date of the Mineral Resource statement was a full time employee of Coffey Mining. Mr MacFarlane has sufficient experience relevant to the style of mineralisation and the type of deposits under consideration and to the activity which he is undertaking to qualify as a Competent Person as defined in the 2004 Edition of the “Australasian Code for Reporting of Exploration Results, Mineral Resources and Ore Reserves”. Mr MacFarlane consents to the inclusion in the report of the matters based on his information in the form and context in which it appears.
The information in this report that relates to Mineral Resources estimated for the Murphy South / Rob Roy (MSRR) prospect is based on and fairly represents information and supporting documentation compiled by Ms Heather Pearce, who is a member of the Australasian Institute of Mining and Metallurgy, and at the time of issue was a full time employee of Iron Road Limited. This estimation was peer reviewed by Dr Isobel Clark, who is a Fellow of the Australasian Institute of Mining and Metallurgy and at the release date of the Resource Statement was contracted by Xstract Mining Consultants. Dr Clark has sufficient experience relevant to the style of mineralisation and the type of deposits under consideration and to the activity which she is undertaking to qualify as a Competent Person as defined in the 2004 Edition of the “Australasian Code for Reporting of Exploration Results, Mineral Resources and Ore Reserves”. Dr Clark consents to the inclusion in the report of the matters based on the information in the form and context in which it appears.
The information in this report that relates to Mine Reserves estimated for Murphy South / Rob Roy (MSRR) is based on and fairly represents information and supporting documentation compiled by Mr Harry Warries, a Fellow of the Australasian Institute of Mining and Metallurgy, and at the release date of the Reserve Statement was a full time employee of Coffey Mining. Mr Warries has sufficient experience relevant to the style of mineralisation and the type of deposits under consideration and to the activity which he is undertaking to qualify as a Competent Person as defined in the 2012 Edition of the “Australasian Code for Reporting of Exploration Results, Mineral Resources and Ore Reserves”. Mr Warries consents to the inclusion in the report of the matters based on his information in the form and context in which it appears.
Exploration Potential It is common practice for a company to comment on and discuss its exploration in terms of target size and type. The information in this presentation relating to exploration targets should not be misunderstood or misconstrued as an estimate of Mineral Resources or Ore Reserves. Hence the terms Resource(s) or Reserve(s) have not been used in this context. Any potential quantity and grade is conceptual in nature, since there has been insufficient work completed to define them beyond exploration targets and that it is uncertain if further exploration will result in the determination of a Mineral Resource.
Cautionary Statements
2
www.ironroadlimited.com.au
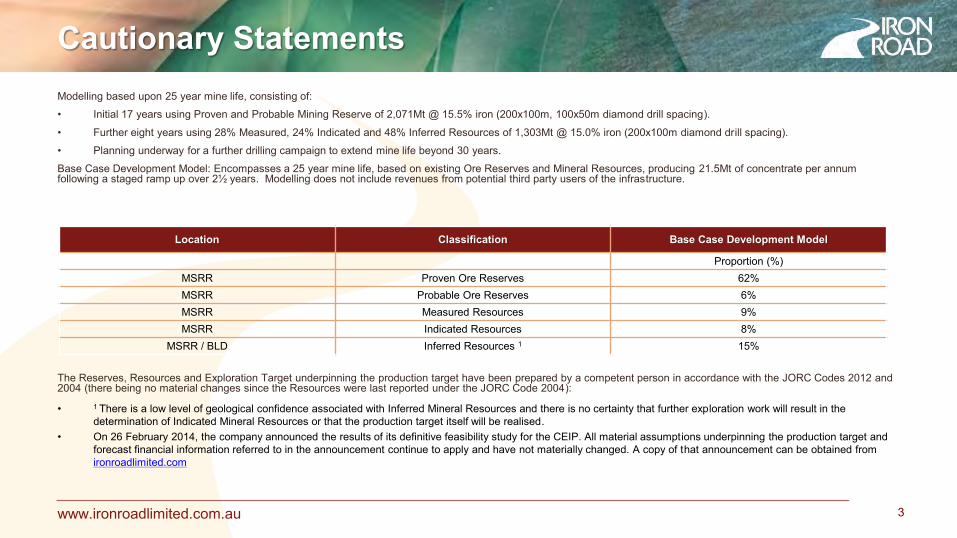
Modelling based upon 25 year mine life, consisting of:
• Initial 17 years using Proven and Probable Mining Reserve of 2,071Mt @ 15.5% iron (200x100m, 100x50m diamond drill spacing).
• Further eight years using 28% Measured, 24% Indicated and 48% Inferred Resources of 1,303Mt @ 15.0% iron (200x100m diamond drill spacing).
• Planning underway for a further drilling campaign to extend mine life beyond 30 years.
Base Case Development Model: Encompasses a 25 year mine life, based on existing Ore Reserves and Mineral Resources, producing 21.5Mt of concentrate per annum following a staged ramp up over 2½ years. Modelling does not include revenues from potential third party users of the infrastructure.
The Reserves, Resources and Exploration Target underpinning the production target have been prepared by a competent person in accordance with the JORC Codes 2012 and 2004 (there being no material changes since the Resources were last reported under the JORC Code 2004):
• 1 There is a low level of geological confidence associated with Inferred Mineral Resources and there is no certainty that further exploration work will result in the determination of Indicated Mineral Resources or that the production target itself will be realised.
• On 26 February 2014, the company announced the results of its definitive feasibility study for the CEIP. All material assumptions underpinning the production target and forecast financial information referred to in the announcement continue to apply and have not materially changed. A copy of that announcement can be obtained from ironroadlimited.com
Cautionary Statements
3
Location Classification Base Case Development Model
Proportion (%) MSRR Proven Ore Reserves 62% MSRR Probable Ore Reserves 6% MSRR Measured Resources 9% MSRR Indicated Resources 8%
MSRR / BLD Inferred Resources 1 15%
www.ironroadlimited.com.au
Summary
Mining • Understanding the CEIP orebody. • Transition from owner mining operating
traditional truck & shovel, to contract mining managing in-pit crushing & conveying (IPCC).
Ore Beneficiation • Developing a thorough understanding of the
metallurgical behaviour of the CEIP ore. • Innovative materials handling and the
elimination of a conventional tailings storage facility.
• Optimisation and the inclusion of a regrind circuit.
Infrastructure Design Philosophy • Rotary versus bottom dump rail discharge
systems. • Port facility and high speed ship loading. • Access and use by third parties.
Protecting the Schedule • High density, vertically stacked modularisation. • Parallel process design. • Wet commissioning off-site in construction
yards.
4
This presentation summarises some thought-provoking aspects of our technical journey, challenging the status quo and how these aspects influence the overall design.
www.ironroadlimited.com.au
Contents
• Introduction
• Benchmarking aspects of CEIP
• CEIP Detail
– Mining
– Beneficiation
– Waste, Tailings and Water
– Rail Facility
– Modularisation
– Port
5

www.ironroadlimited.com.au
Iron Road is proud after six years and over $125M spend, to present a robust and credible business case for the Central Eyre Iron Project (CEIP).
2008 June – Exploration Licence 3699 acquired and exploratory drilling commenced. 2011 June – Prefeasibility study released.
• 12.4Mtpa, slurry pipeline, third party port. 2014 February – Definitive feasibility study findings released.
• 21.5Mtpa, new rail and port infrastructure. 2015 February – Positive post-DFS optimised case anticipated.
• Operating cost model and financial parameters have been evaluated by a leading industry consultant, including a customer focused review.
• Stage IX drilling programme complete and expected to identify additional tonnage to maintain 25 year mine life at increased production of 24Mtpa of premium iron concentrate.
• IPCC optimisation study underway and expected to deliver new pit shell and lower cost mining schedule that sustains 24Mtpa output over a 25 year mine life.
• Indicative concentrate specifications* @ 24Mtpa, ≥66.5% Fe, ≤3.5% SiO2, ≤2.0% Al2O3, ≤0.005% P, ≤ 0.005% S.
* see Appendix 1 for full specifications
Introduction
6

www.ironroadlimited.com.au
Iron Road is advancing the development of Australia’s next major integrated iron supply business on the Eyre Peninsula in South Australia. The CEIP offers: • Robust financial metrics for both the DFS and
optimised case, with debt service and loan life cover ratios supported at current iron ore prices.
• A manufactured concentrate, producing consistent high quality for life of mine, during a period of forecast declining quality.
• High quality concentrate with advantageous value-in-use characteristics for customers.
• Tangible benefits for local and regional communities.
Introduction – Development Phase Ready
7
www.ironroadlimited.com.au
Experience with large magnetite operations in Australia indicates inefficient and problematic processing, leading to high capital and operating cost outcomes and unsatisfactory production levels. The CEIP offers a simple process supported by a very large simplified mine. To achieve this:
• Iron Road has pursued proven, off-the-shelf technologies, applied in innovative ways to provide straightforward solutions.
• Our studies define a 25 year mine life, high quality, low cost operation producing a coarse magnetite concentrate ideally suited to the sinter market and our customers’ needs.
• Sound economics enable the project to support world-class infrastructure assets, including rail and a deep water port.
Introduction – The Journey
8
www.ironroadlimited.com.au 9
Benchmarking and Comparisons
www.ironroadlimited.com.au
Benchmarking – The 2020 Market
10
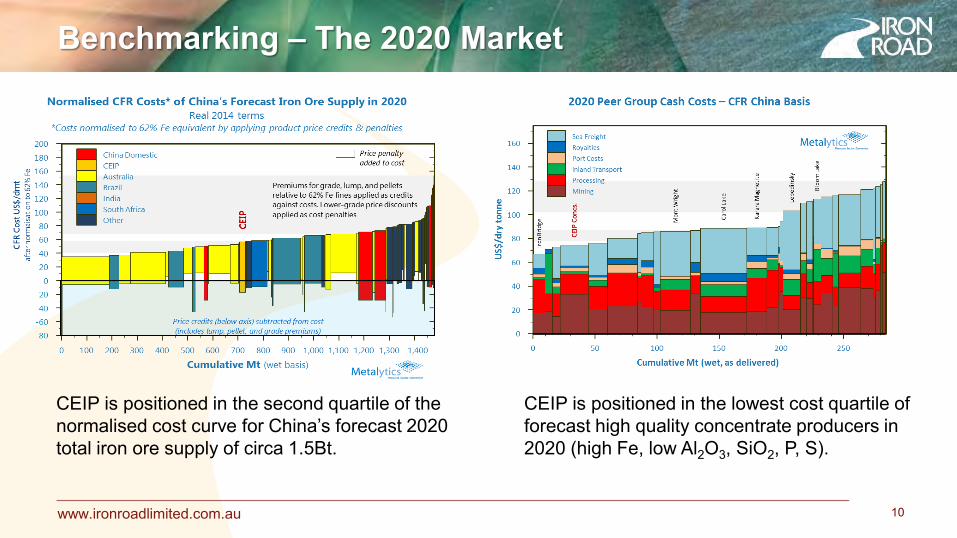
CEIP is positioned in the second quartile of the normalised cost curve for China’s forecast 2020 total iron ore supply of circa 1.5Bt.
CEIP is positioned in the lowest cost quartile of forecast high quality concentrate producers in 2020 (high Fe, low Al2O3, SiO2, P, S).
www.ironroadlimited.com.au
Benchmarking – Measured + Indicated Mineral
Resource
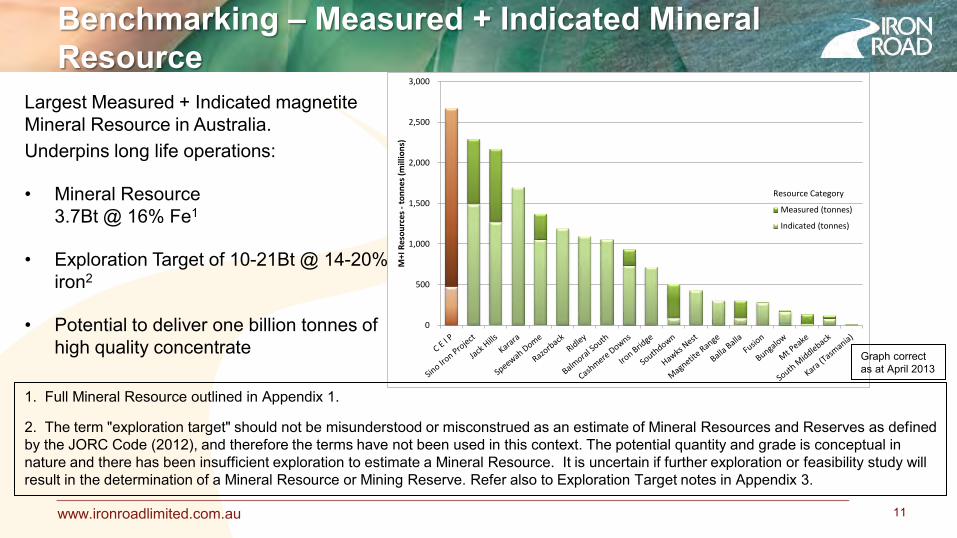
Largest Measured + Indicated magnetite Mineral Resource in Australia. Underpins long life operations:
• Mineral Resource 3.7Bt @ 16% Fe1
• Exploration Target of 10-21Bt @ 14-20% iron2
• Potential to deliver one billion tonnes of high quality concentrate
11
0
500
1,000
1,500
2,000
2,500
3,000
M+I
Re
sou
rce
s -
ton
ne
s (m
illio
ns)
Measured (tonnes)
Indicated (tonnes)
Resource Category
1. Full Mineral Resource outlined in Appendix 1. 2. The term "exploration target" should not be misunderstood or misconstrued as an estimate of Mineral Resources and Reserves as defined by the JORC Code (2012), and therefore the terms have not been used in this context. The potential quantity and grade is conceptual in nature and there has been insufficient exploration to estimate a Mineral Resource. It is uncertain if further exploration or feasibility study will result in the determination of a Mineral Resource or Mining Reserve. Refer also to Exploration Target notes in Appendix 3.
Graph correct as at April 2013
www.ironroadlimited.com.au
Comparison – Transition to Optimised Mining
Method
12
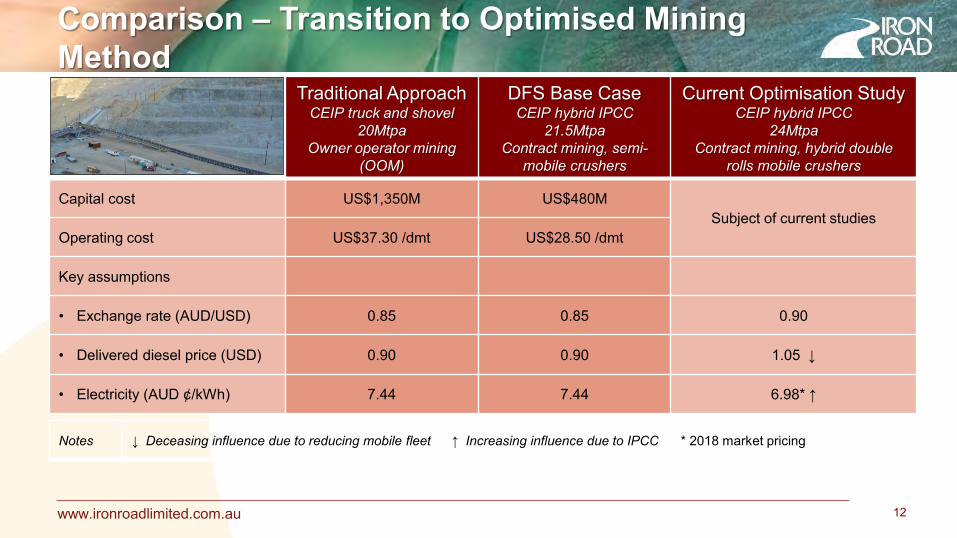
Traditional Approach CEIP truck and shovel
20Mtpa Owner operator mining
(OOM)
DFS Base Case CEIP hybrid IPCC
21.5Mtpa Contract mining, semi-
mobile crushers
Current Optimisation Study CEIP hybrid IPCC
24Mtpa Contract mining, hybrid double
rolls mobile crushers
Capital cost US$1,350M US$480M Subject of current studies
Operating cost US$37.30 /dmt US$28.50 /dmt
Key assumptions
• Exchange rate (AUD/USD) 0.85 0.85 0.90
• Delivered diesel price (USD) 0.90 0.90 1.05 ↓
• Electricity (AUD ¢/kWh) 7.44 7.44 6.98* ↑
Notes ↓ Deceasing influence due to reducing mobile fleet ↑ Increasing influence due to IPCC * 2018 market pricing

www.ironroadlimited.com.au
Comparison – Transition to Optimised Mining
Method
13
Truck & shovel IPCC, semi-mobile crushers IPCC, mobile crushers

www.ironroadlimited.com.au 14
Comparison – Optimised Mining Method
Traditional Approach CEIP truck and shovel
20Mtpa Owner operator mining (OOM)
DFS Base Case CEIP hybrid IPCC
21.5Mtpa Contract mining, semi-mobile
crushers
Current Optimisation Study CEIP hybrid IPCC
24Mtpa Contract mining, hybrid double rolls
mobile crushers
Number of 797F trucks – 350t capacity 93 32
Subject of current studies
Shovels 7 7
Mining employees 1150 390
Impact to surrounding traffic 15 ‘A’ double road trains daily 3 ‘A’ double road trains daily
Fuel consumption daily 800kL 150kL
CO2 Diesel fuel burn – t/y (000’s) 797 149
CO2 Electricity – t/y (000’s) 20 265
CO2 annual – t/y (000’s) 817 415
www.ironroadlimited.com.au 15
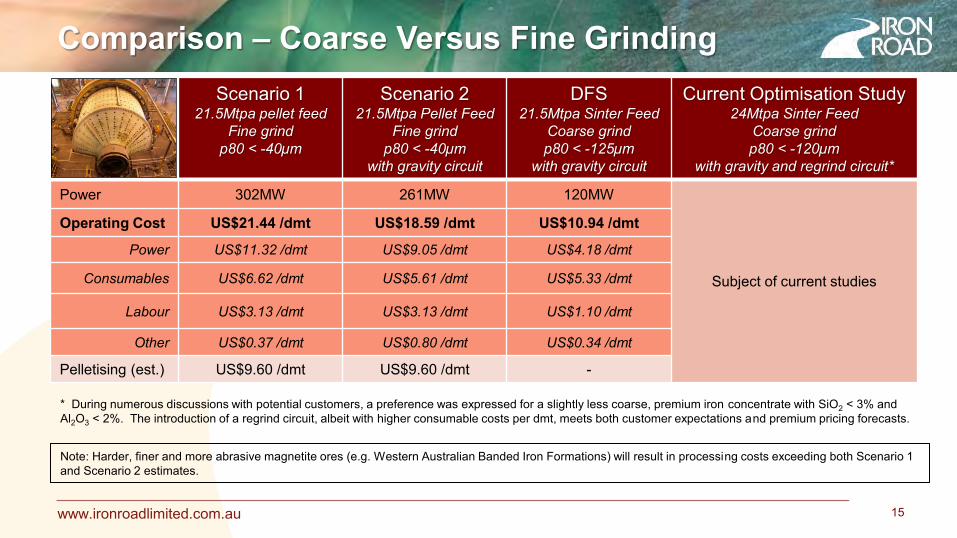
Scenario 1 21.5Mtpa pellet feed
Fine grind p80 < -40µm
Scenario 2 21.5Mtpa Pellet Feed
Fine grind p80 < -40µm
with gravity circuit
DFS 21.5Mtpa Sinter Feed
Coarse grind p80 < -125µm
with gravity circuit
Current Optimisation Study 24Mtpa Sinter Feed
Coarse grind p80 < -120µm
with gravity and regrind circuit*
Power 302MW 261MW 120MW
Subject of current studies
Operating Cost US$21.44 /dmt US$18.59 /dmt US$10.94 /dmt
Power US$11.32 /dmt US$9.05 /dmt US$4.18 /dmt
Consumables US$6.62 /dmt US$5.61 /dmt US$5.33 /dmt
Labour US$3.13 /dmt US$3.13 /dmt US$1.10 /dmt
Other US$0.37 /dmt US$0.80 /dmt US$0.34 /dmt
Pelletising (est.) US$9.60 /dmt US$9.60 /dmt -
Note: Harder, finer and more abrasive magnetite ores (e.g. Western Australian Banded Iron Formations) will result in processing costs exceeding both Scenario 1 and Scenario 2 estimates.
Comparison – Coarse Versus Fine Grinding
* During numerous discussions with potential customers, a preference was expressed for a slightly less coarse, premium iron concentrate with SiO2 < 3% and Al2O3 < 2%. The introduction of a regrind circuit, albeit with higher consumable costs per dmt, meets both customer expectations and premium pricing forecasts.

www.ironroadlimited.com.au
Comparison – Waste Handling Optimisation
16
Scenario 1 Mine waste rock
trucking Slurry tails circuit, wet coarse tails
Scenario 2 Mine waste rock
trucking Dry tails stacking
DFS Conveyed mine waste
Conveyed dry tails Co-located mine waste
and tails facility
Current Optimisation Study Conveyed mine waste
Conveyed dry tails Co-located mine waste
and tails facility
Land Required Process (tails) 4000
hectares + Mine (waste rock) 2000 hectares
Process (tails) 2000 hectares + Mine (waste
rock) 2000 hectares 2000 hectares (combined)
Subject of current studies
Water volume (pa) 45GL 14GL 14GL
Heavy Moving Equipment (trucks)
CAT 797F Haul Truck x 10 + 11 (coarse tails) + 45
(waste rock) 45 CAT 797F (waste rock) 0
Power (MW) 35 28 34
Labour 285 157 32
Fuel litres day (kL) 186 91 0
CO2 Diesel tpa (000’s) 355 250 0
C02 Electricity tpa (000’s) 116 93 112
CO2 Total tpa (000’s) 471 343 112

www.ironroadlimited.com.au 17
Comparison – Water Source, Filtering & Recycling
The original studies envisaged supplying water to the process plant by means of a buried 148km long, 1300mm diameter CSCL seawater pipeline from the port. The system would require an intake structure mounted on the jetty, an algaecide dosing facility, pump station and two in line booster pump stations with total pump power drawing approximately 55MW. The adoption of filtered tailings from the process plant has improved process water recycling, reducing the requirement for ‘top up’ water. The nett impact is a reduction in water required from 45GL to 14GL per annum. This allowed the DFS to model and cost the development of a borefield to extract water from a saline aquifer only 56kms from the mine site. Study work, supported by a drilling and test programme, indicates that supplying the process plant from this aquifer is feasible over the life of mine, with minimal impact on the aquifer (less than 0.5% draw down over 25 years of operation).
Scenario 1 CEIP Seawater Pipeline & TSF 20Mtpa Owner Operator Mining
(OOM)
DFS CEIP Filtered Tails, contract
mining 21.5Mtpa
Current Optimisation Study CEIP Filtered Tails, contract mining
24Mtpa
Water Consumption (pa) 45GL 14GL Subject of current studies
Source Seawater Borefield Borefield
Pipeline Diameter Nom. 1300 diameter Nom. 630 diameter Nom. 630 diameter
Pipeline Construction Buried CSCL Overland HDPE/CS Overland HDPE/CS
Water Storage 10 days 10 days
Subject of current studies Capital Cost US$506M US$101M
OPEX Cost (/ct) US$0.73 US$0.15
www.ironroadlimited.com.au 18
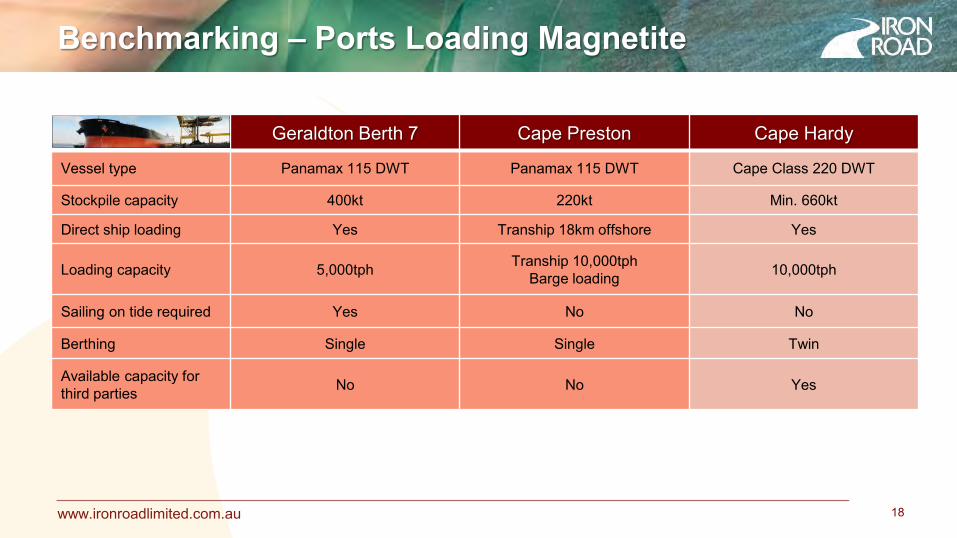
Geraldton Berth 7 Cape Preston Cape Hardy
Vessel type Panamax 115 DWT Panamax 115 DWT Cape Class 220 DWT
Stockpile capacity 400kt 220kt Min. 660kt
Direct ship loading Yes Tranship 18km offshore Yes
Loading capacity 5,000tph Tranship 10,000tph Barge loading 10,000tph
Sailing on tide required Yes No No
Berthing Single Single Twin
Available capacity for third parties No No Yes
Benchmarking – Ports Loading Magnetite
www.ironroadlimited.com.au 19
CEIP Mining
www.ironroadlimited.com.au
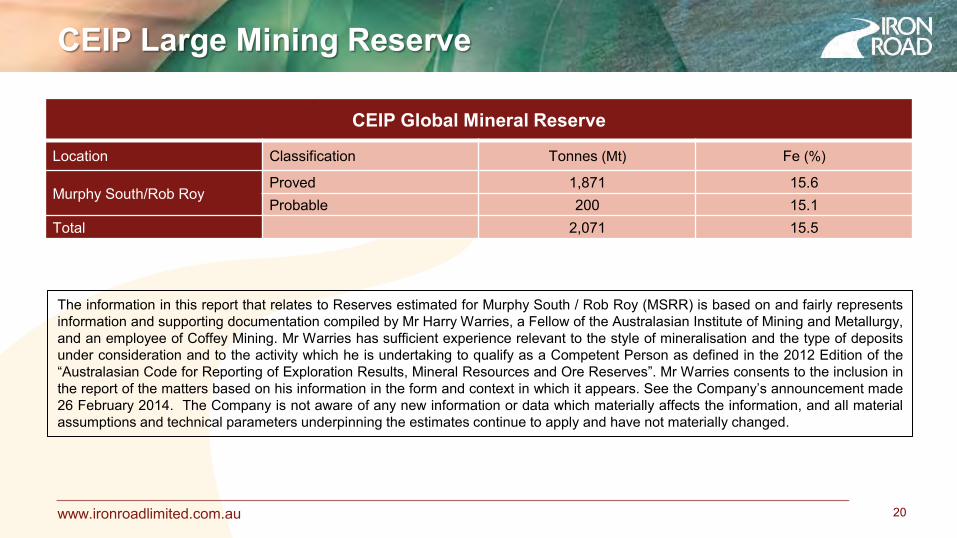
CEIP Global Mineral Reserve
Location Classification Tonnes (Mt) Fe (%)
Murphy South/Rob Roy Proved 1,871 15.6 Probable 200 15.1
Total 2,071 15.5
The information in this report that relates to Reserves estimated for Murphy South / Rob Roy (MSRR) is based on and fairly represents information and supporting documentation compiled by Mr Harry Warries, a Fellow of the Australasian Institute of Mining and Metallurgy, and an employee of Coffey Mining. Mr Warries has sufficient experience relevant to the style of mineralisation and the type of deposits under consideration and to the activity which he is undertaking to qualify as a Competent Person as defined in the 2012 Edition of the “Australasian Code for Reporting of Exploration Results, Mineral Resources and Ore Reserves”. Mr Warries consents to the inclusion in the report of the matters based on his information in the form and context in which it appears. See the Company’s announcement made 26 February 2014. The Company is not aware of any new information or data which materially affects the information, and all material assumptions and technical parameters underpinning the estimates continue to apply and have not materially changed.
20
CEIP Large Mining Reserve
www.ironroadlimited.com.au
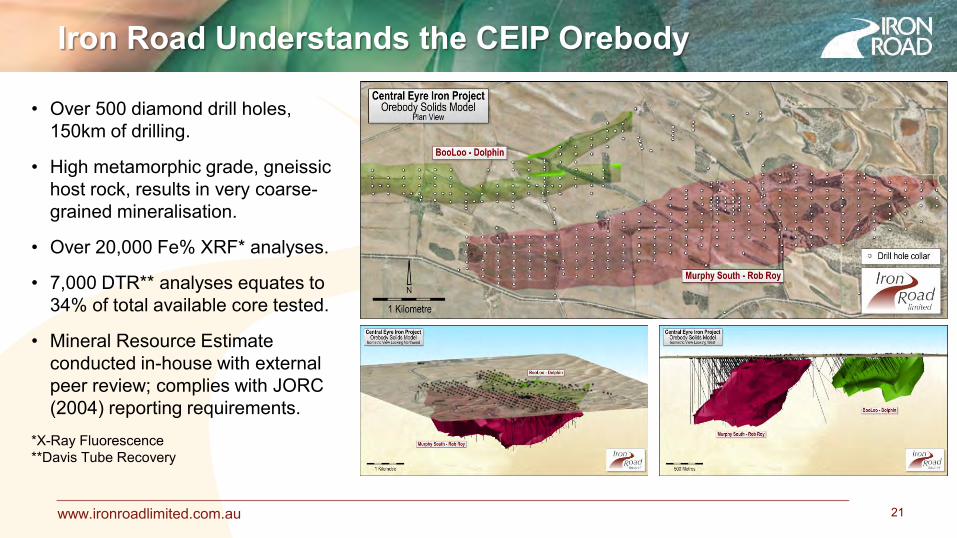
• Over 500 diamond drill holes, 150km of drilling.
• High metamorphic grade, gneissic host rock, results in very coarse-grained mineralisation.
• Over 20,000 Fe% XRF* analyses.
• 7,000 DTR** analyses equates to 34% of total available core tested.
• Mineral Resource Estimate conducted in-house with external peer review; complies with JORC (2004) reporting requirements.
*X-Ray Fluorescence **Davis Tube Recovery
21
Iron Road Understands the CEIP Orebody
www.ironroadlimited.com.au
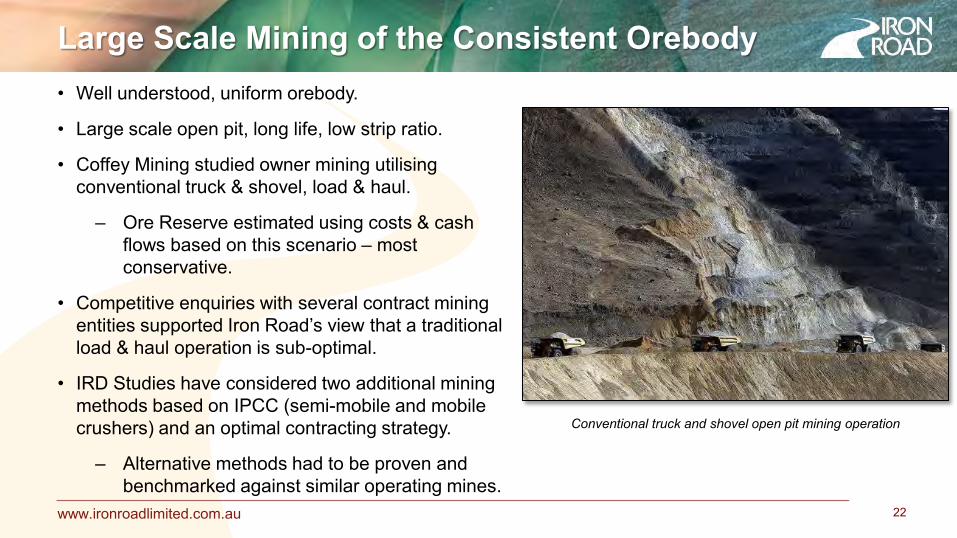
• Well understood, uniform orebody.
• Large scale open pit, long life, low strip ratio.
• Coffey Mining studied owner mining utilising conventional truck & shovel, load & haul.
– Ore Reserve estimated using costs & cash flows based on this scenario – most conservative.
• Competitive enquiries with several contract mining entities supported Iron Road’s view that a traditional load & haul operation is sub-optimal.
• IRD Studies have considered two additional mining methods based on IPCC (semi-mobile and mobile crushers) and an optimal contracting strategy.
– Alternative methods had to be proven and benchmarked against similar operating mines.
22
Conventional truck and shovel open pit mining operation
Large Scale Mining of the Consistent Orebody

www.ironroadlimited.com.au
Semi-mobile IPCC selected: • Ideally suited to CEIP. • Open pit optimised for electrically powered Hybrid-IPCC. • Conventional truck & shovel operation for first three years of
operation. • Significantly reduced mining fleet (32 cf 93 Cat 797s). • Reduced operational manning requirements. • Significantly lower diesel and consumables. • Optimised waste rock co-disposal with filtered tailings
eliminates the requirement for a dedicated tailings facility. • Infrastructure and logistical support requirements reduced. • Savings continue over life of mine. • Semi-mobile gyratory crusher stations located in pit, moved
every two years (14 day relocation). • Conveyor system reconfigured each quarter (36 hour
process). 23 Top: Semi-mobile gyratory crusher station in Sweden, similar to capacity required
at CEIP. Above: Transport crawler undertakes conveyor system reconfiguration
Definitive Feasibility Study Scenario
– Hybrid-IPCC with Semi-Mobile Crushers
www.ironroadlimited.com.au 24
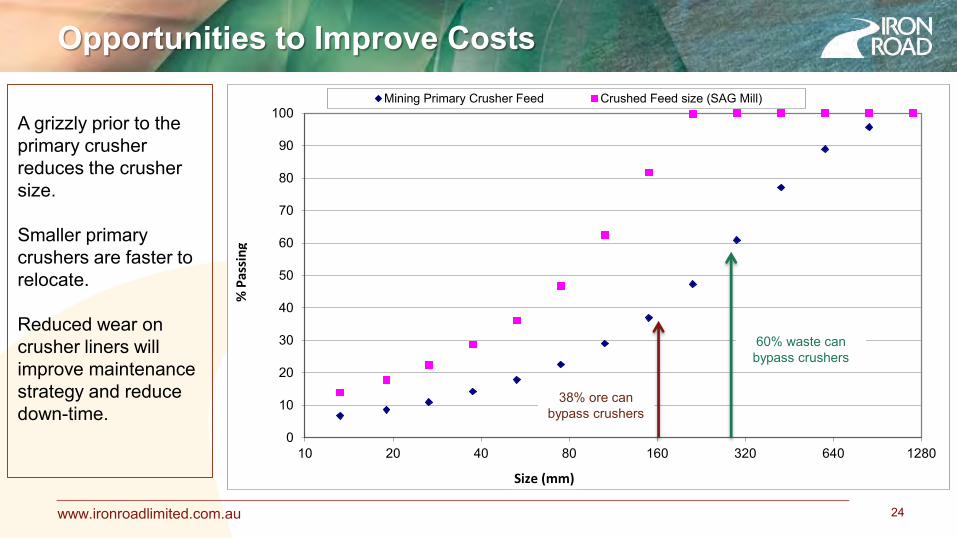
A grizzly prior to the primary crusher reduces the crusher size. Smaller primary crushers are faster to relocate. Reduced wear on crusher liners will improve maintenance strategy and reduce down-time.
0
10
20
30
40
50
60
70
80
90
100
10 20 40 80 160 320 640 1280
Mining Primary Crusher Feed Crushed Feed size (SAG Mill)
% P
assi
ng
Size (mm)
60% waste can bypass crushers
38% ore can bypass crushers
Opportunities to Improve Costs
www.ironroadlimited.com.au
Current Optimisation Study – IPCC with Mobile
Crushers
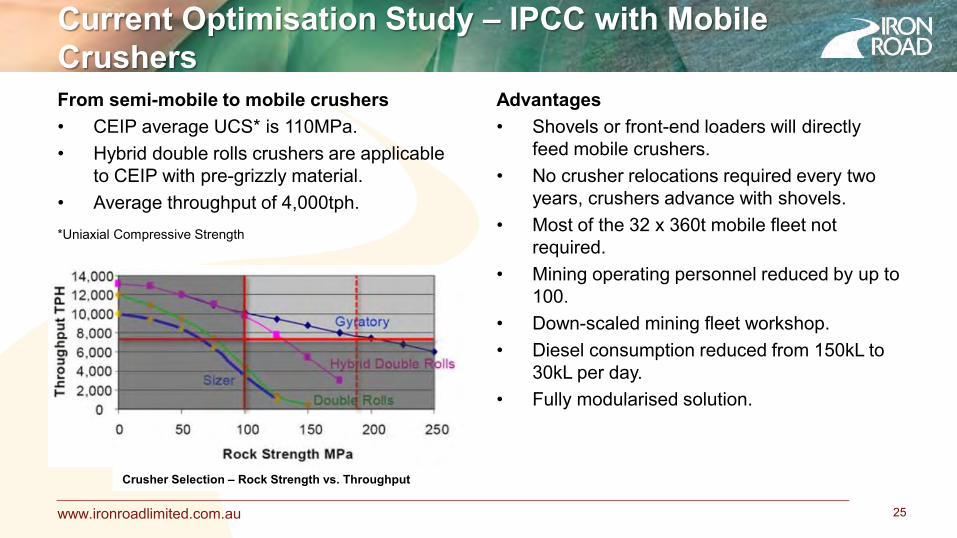
From semi-mobile to mobile crushers • CEIP average UCS* is 110MPa. • Hybrid double rolls crushers are applicable
to CEIP with pre-grizzly material. • Average throughput of 4,000tph. *Uniaxial Compressive Strength
Advantages • Shovels or front-end loaders will directly
feed mobile crushers. • No crusher relocations required every two
years, crushers advance with shovels. • Most of the 32 x 360t mobile fleet not
required. • Mining operating personnel reduced by up to
100. • Down-scaled mining fleet workshop. • Diesel consumption reduced from 150kL to
30kL per day. • Fully modularised solution.
25
Crusher Selection – Rock Strength vs. Throughput

www.ironroadlimited.com.au
Mobile Crushers
26

www.ironroadlimited.com.au 27
Evolution of the Optimised Mining Method
Traditional Approach CEIP truck and shovel
20Mtpa Owner operator mining (OOM)
DFS Base Case CEIP hybrid IPCC
21.5Mtpa Contract mining,
semi-mobile crushers
Current Optimisation Study CEIP hybrid IPCC
24Mtpa Contract mining,
hybrid double rolls mobile crushers
Number of 797F trucks – 350t capacity 93 32
Subject of current studies
Shovels 7 7
Mining employees 1150 390
Impact to surrounding traffic 15 ‘A’ double road trains daily 3 ‘A’ double road trains daily
Fuel consumption daily 800kL 150kL
CO2 Diesel fuel burn – t/y (000’s) 797 149
CO2 Electricity – t/y (000’s) 20 265
CO2 annual – t/y (000’s) 817 415
www.ironroadlimited.com.au
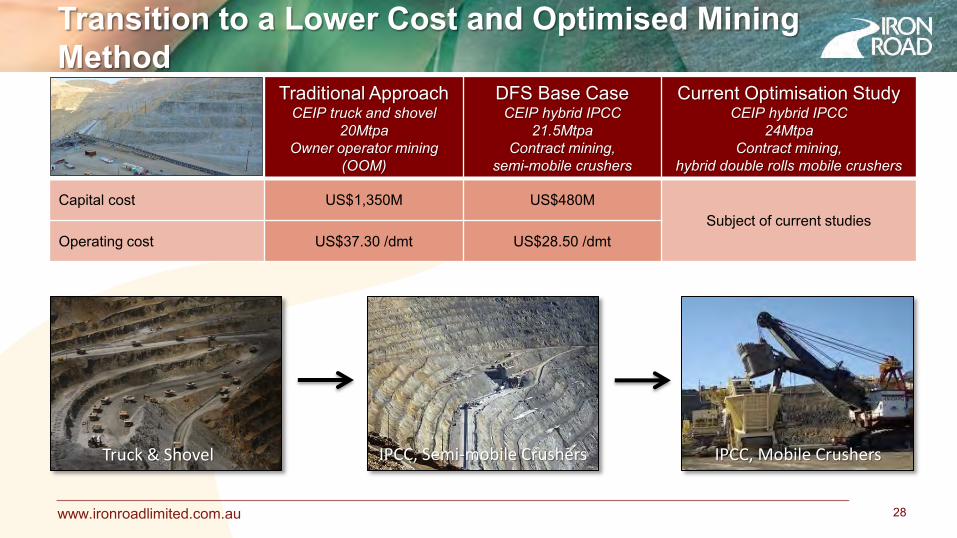
Transition to a Lower Cost and Optimised Mining
Method
28
Traditional Approach CEIP truck and shovel
20Mtpa Owner operator mining
(OOM)
DFS Base Case CEIP hybrid IPCC
21.5Mtpa Contract mining,
semi-mobile crushers
Current Optimisation Study CEIP hybrid IPCC
24Mtpa Contract mining,
hybrid double rolls mobile crushers
Capital cost US$1,350M US$480M Subject of current studies
Operating cost US$37.30 /dmt US$28.50 /dmt
Truck & Shovel IPCC, Semi-mobile Crushers IPCC, Mobile Crushers
www.ironroadlimited.com.au
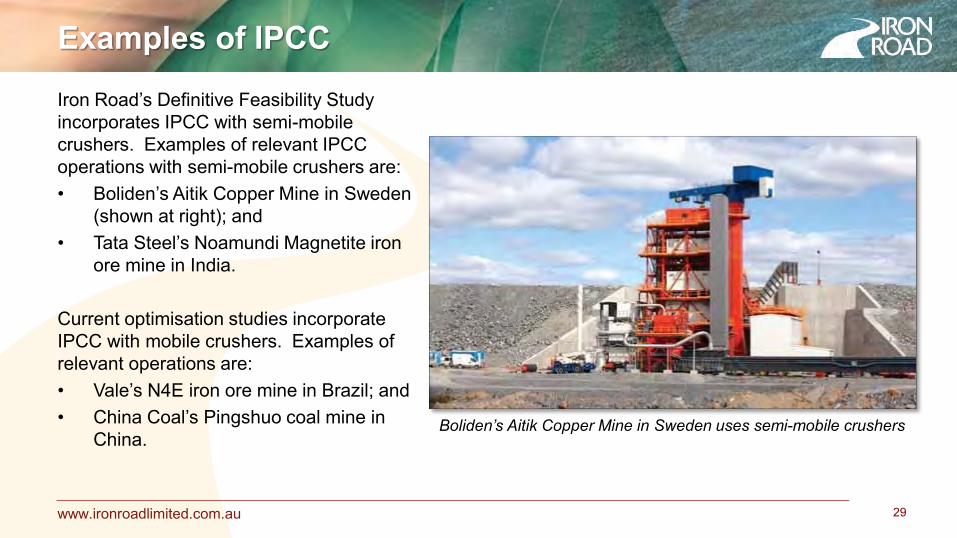
Examples of IPCC
Iron Road’s Definitive Feasibility Study incorporates IPCC with semi-mobile crushers. Examples of relevant IPCC operations with semi-mobile crushers are: • Boliden’s Aitik Copper Mine in Sweden
(shown at right); and • Tata Steel’s Noamundi Magnetite iron
ore mine in India.
Current optimisation studies incorporate IPCC with mobile crushers. Examples of relevant operations are: • Vale’s N4E iron ore mine in Brazil; and • China Coal’s Pingshuo coal mine in
China.
29
Boliden’s Aitik Copper Mine in Sweden uses semi-mobile crushers

www.ironroadlimited.com.au 30
CEIP Beneficiation
www.ironroadlimited.com.au
Thorough Process Knowledge
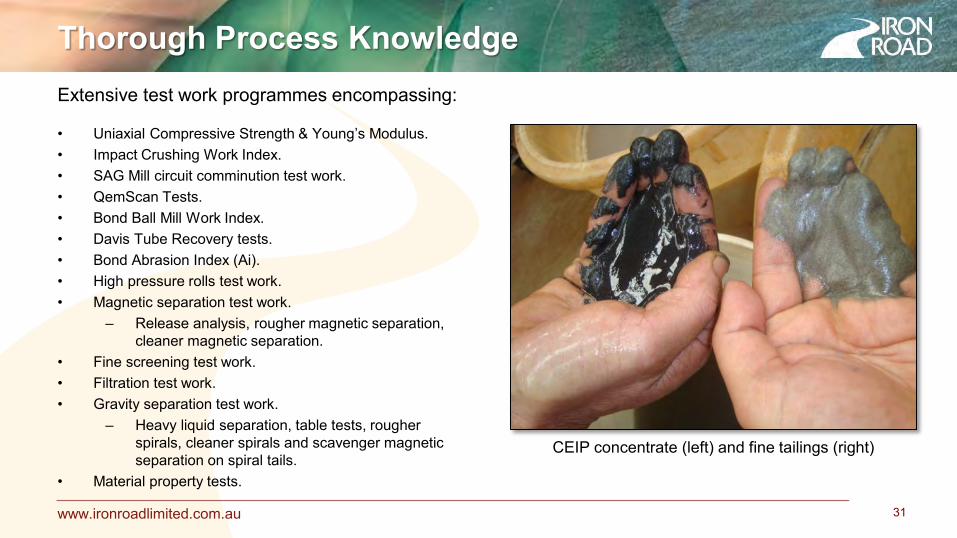
Extensive test work programmes encompassing:
• Uniaxial Compressive Strength & Young’s Modulus. • Impact Crushing Work Index. • SAG Mill circuit comminution test work. • QemScan Tests. • Bond Ball Mill Work Index. • Davis Tube Recovery tests. • Bond Abrasion Index (Ai). • High pressure rolls test work. • Magnetic separation test work.
– Release analysis, rougher magnetic separation, cleaner magnetic separation.
• Fine screening test work. • Filtration test work. • Gravity separation test work.
– Heavy liquid separation, table tests, rougher spirals, cleaner spirals and scavenger magnetic separation on spiral tails.
• Material property tests.
31
CEIP concentrate (left) and fine tailings (right)
www.ironroadlimited.com.au 32
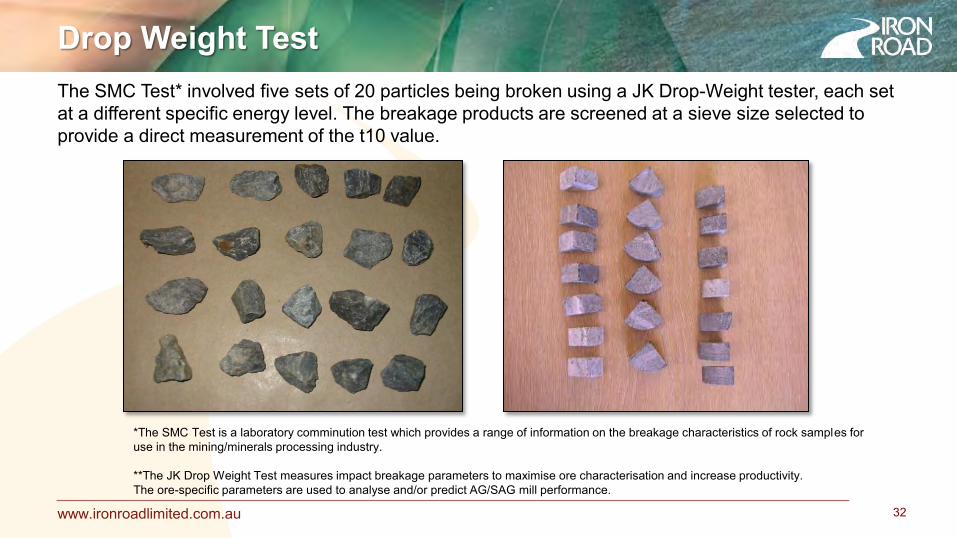
The SMC Test* involved five sets of 20 particles being broken using a JK Drop-Weight tester, each set at a different specific energy level. The breakage products are screened at a sieve size selected to provide a direct measurement of the t10 value.
Drop Weight Test
*The SMC Test is a laboratory comminution test which provides a range of information on the breakage characteristics of rock samples for use in the mining/minerals processing industry. **The JK Drop Weight Test measures impact breakage parameters to maximise ore characterisation and increase productivity. The ore-specific parameters are used to analyse and/or predict AG/SAG mill performance.

www.ironroadlimited.com.au 33
t10 Results on Predicted Ore Hardness
CEIP Ore Hardness consistently ranks around the medium category, as opposed to the WA Banded Iron Formation magnetite ores that are ranked as very hard.
www.ironroadlimited.com.au
Autogenous Grinding • Historically, the lowest operating cost has been achieved through multistage, fully autogenous grinding
with integrated magnetic separation steps between the stages. • The major benefit of fully autogenous grinding is the elimination of steel grinding media costs. • The separation of waste between grinding stages progressively reduces the amount of material to be
ground. Recent Alternatives • Application of more efficient grinding technologies developed in the last 20 years, including high
pressure grinding rolls (HPGR) and stirred milling for fine grinding, has provided opportunities to reduce operating costs associated with comminution.
Both technologies are already implemented in some magnetite processing operations, although in a limited capacity. It was recognised during the early stages of the DFS that use of HPGR technology resulted in high maintenance and operating costs.
Conventional Crushing
34
The CEIP study demonstrates the significant advantages of applying more efficient semi-autogenous grinding technology when dealing with brittle, gneissic host rock of high metamorphic grade.
www.ironroadlimited.com.au
SAG Milling Benefits
35
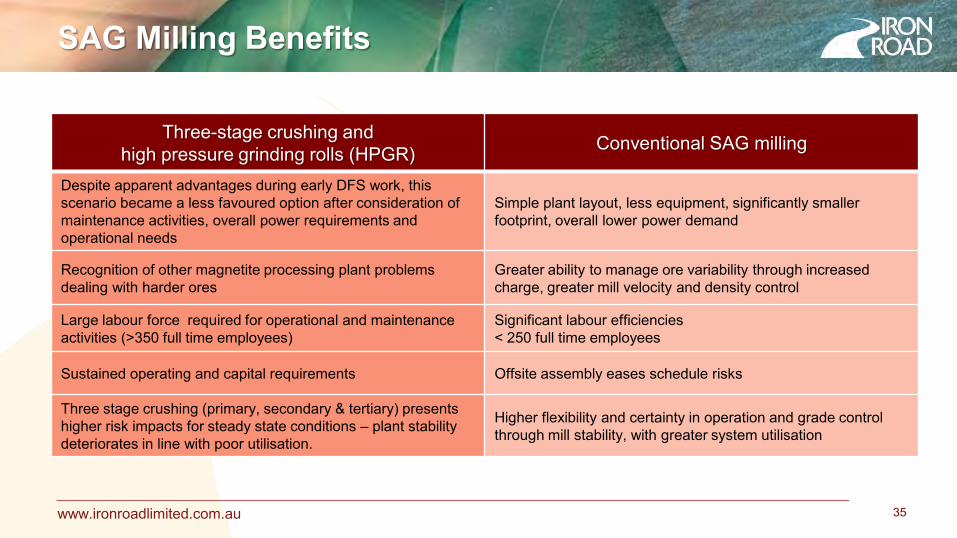
Three-stage crushing and high pressure grinding rolls (HPGR) Conventional SAG milling
Despite apparent advantages during early DFS work, this scenario became a less favoured option after consideration of maintenance activities, overall power requirements and operational needs
Simple plant layout, less equipment, significantly smaller footprint, overall lower power demand
Recognition of other magnetite processing plant problems dealing with harder ores
Greater ability to manage ore variability through increased charge, greater mill velocity and density control
Large labour force required for operational and maintenance activities (>350 full time employees)
Significant labour efficiencies < 250 full time employees
Sustained operating and capital requirements Offsite assembly eases schedule risks
Three stage crushing (primary, secondary & tertiary) presents higher risk impacts for steady state conditions – plant stability deteriorates in line with poor utilisation.
Higher flexibility and certainty in operation and grade control through mill stability, with greater system utilisation
www.ironroadlimited.com.au
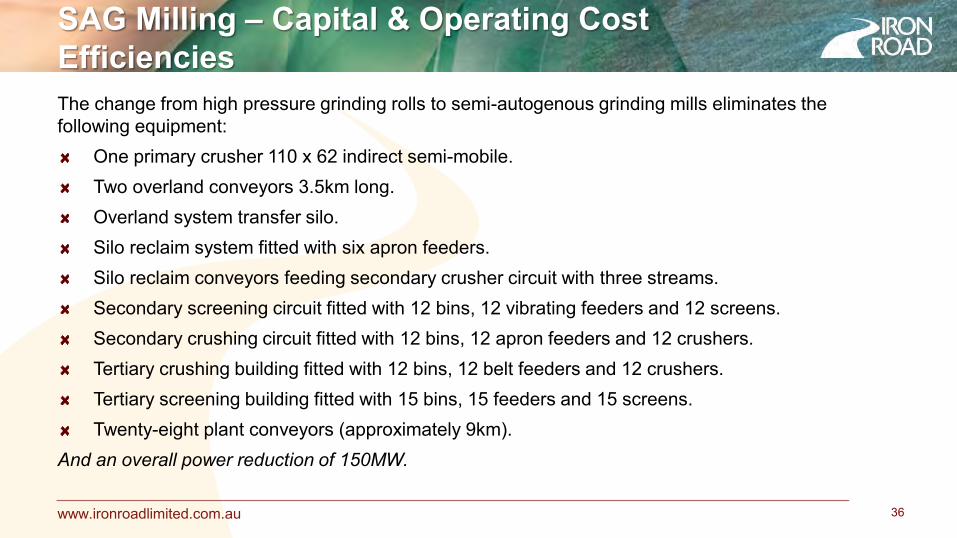
The change from high pressure grinding rolls to semi-autogenous grinding mills eliminates the following equipment:
One primary crusher 110 x 62 indirect semi-mobile. Two overland conveyors 3.5km long. Overland system transfer silo. Silo reclaim system fitted with six apron feeders. Silo reclaim conveyors feeding secondary crusher circuit with three streams. Secondary screening circuit fitted with 12 bins, 12 vibrating feeders and 12 screens. Secondary crushing circuit fitted with 12 bins, 12 apron feeders and 12 crushers. Tertiary crushing building fitted with 12 bins, 12 belt feeders and 12 crushers. Tertiary screening building fitted with 15 bins, 15 feeders and 15 screens. Twenty-eight plant conveyors (approximately 9km).
And an overall power reduction of 150MW.
SAG Milling – Capital & Operating Cost
Efficiencies
36

www.ironroadlimited.com.au 37
CEIP Schematic (DFS 21.5Mtpa)
www.ironroadlimited.com.au 38
Mine Waste Crushing
Mine WasteCo-Locate Waste/
Tails
Primary Crushing SAG Mill CircuitRougher Magnetic
CircuitCyclones
Multi Deck Screens Circuit
Cleaner Magnetic Circuit
Final Product
Rougher Magnetic Tails
Gravity Circuit
Cleaner Magnetic Tails
Ball Mill Circuit
Regrind
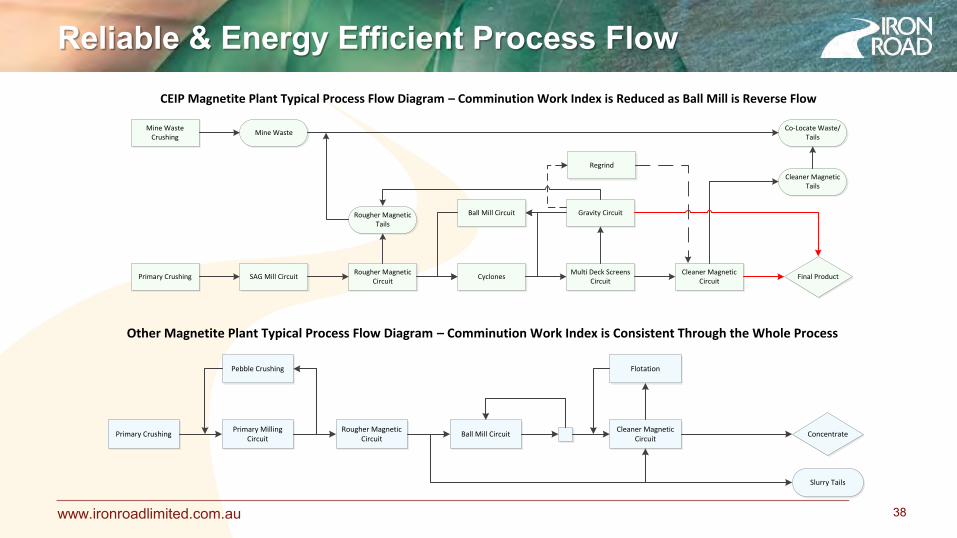
CEIP Magnetite Plant Typical Process Flow Diagram – Comminution Work Index is Reduced as Ball Mill is Reverse Flow
Primary CrushingPrimary Milling
CircuitRougher Magnetic
CircuitBall Mill Circuit
Cleaner Magnetic Circuit
Concentrate
Slurry Tails
Other Magnetite Plant Typical Process Flow Diagram – Comminution Work Index is Consistent Through the Whole Process
Pebble Crushing Flotation
Reliable & Energy Efficient Process Flow
www.ironroadlimited.com.au 39
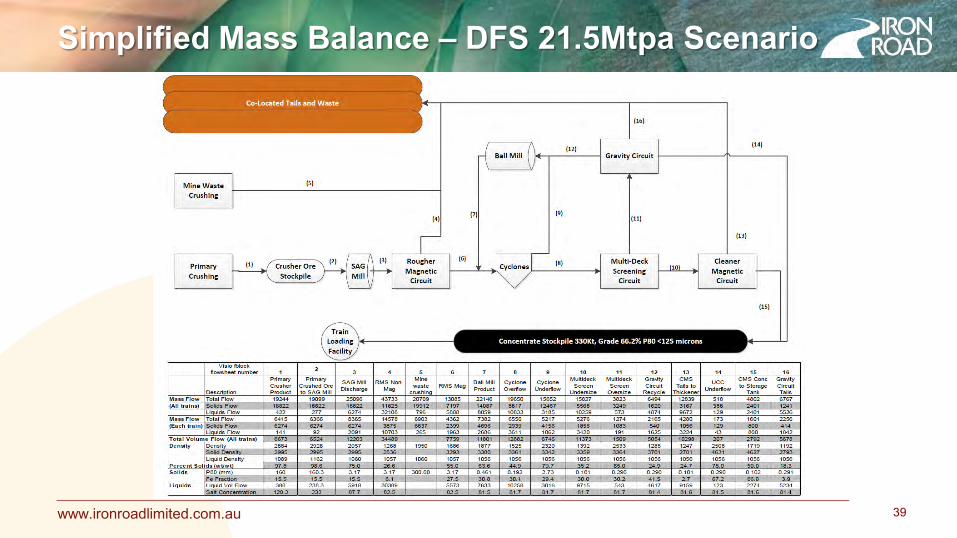
Simplified Mass Balance – DFS 21.5Mtpa Scenario
www.ironroadlimited.com.au 40
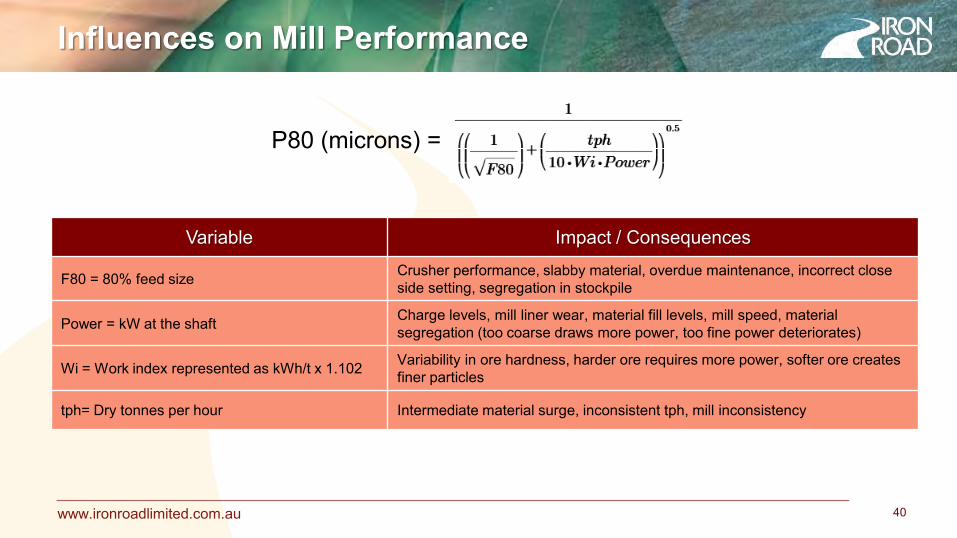
Variable Impact / Consequences
F80 = 80% feed size Crusher performance, slabby material, overdue maintenance, incorrect close side setting, segregation in stockpile
Power = kW at the shaft Charge levels, mill liner wear, material fill levels, mill speed, material segregation (too coarse draws more power, too fine power deteriorates)
Wi = Work index represented as kWh/t x 1.102 Variability in ore hardness, harder ore requires more power, softer ore creates finer particles
tph= Dry tonnes per hour Intermediate material surge, inconsistent tph, mill inconsistency
P80 (microns) =
Influences on Mill Performance

www.ironroadlimited.com.au 41
Milling Characteristics
Three actions occur in any mill and the portion of work by each action depends upon the mill type.
1. Impact Impacting particles move perpendicular to the plane of contact. Amount of resulting breakage is directly related to the specific energy (energy per unit mass) that the target particle receives.
2. Attrition A small particle is trapped between two larger particles. The small particle is subsequently broken in preference to the larger ones.
3. Abrasion Abrasion is seen as a surface phenomenon which results when two particles move parallel to their plane of contact. Small pieces of each are broken or torn out of the surface leaving the parent particles largely intact.
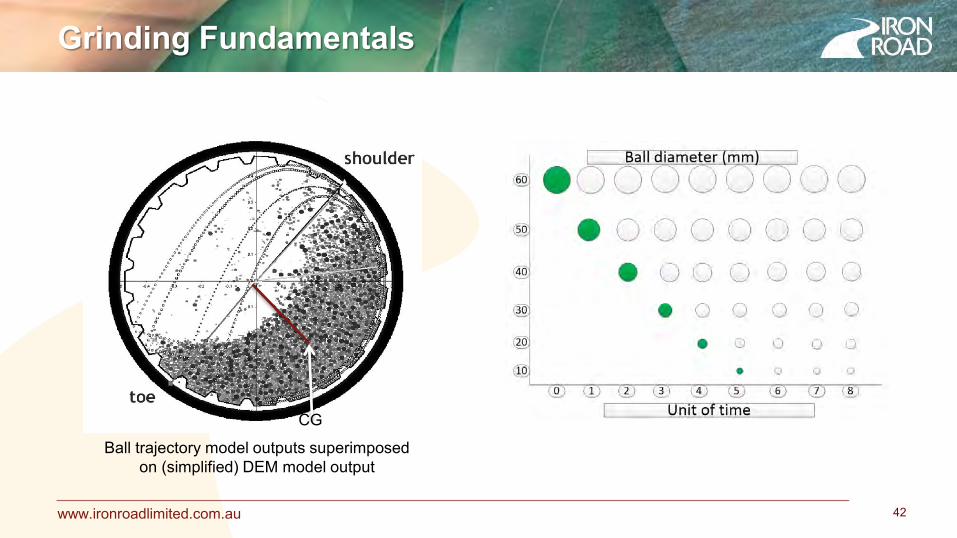
www.ironroadlimited.com.au 42
CG
Ball trajectory model outputs superimposed on (simplified) DEM model output
Grinding Fundamentals

www.ironroadlimited.com.au 43
The Bond Abrasion test determines the Abrasion Index (Ai), which is used to determine steel media and liner wear in crushers and milling circuits.
Iron Road carried out numerous Bond Abrasion tests across the orebody to validate the grinding circuit ball and wear material consumption.
An Ai value of 0.44 was incorporated in OPEX calculations, which is higher than the maximum value recorded of 0.39.
Understanding our Ore Abrasion Index
www.ironroadlimited.com.au 44
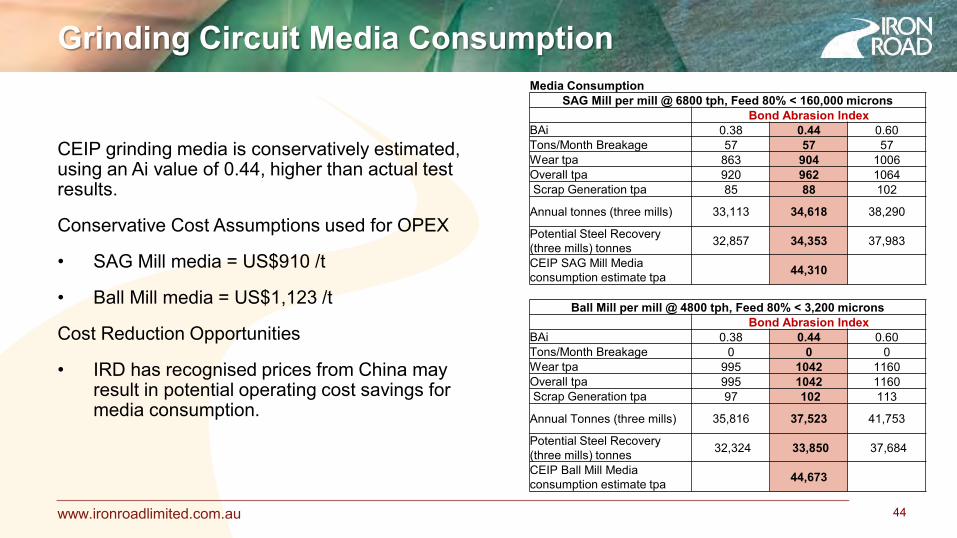
Media Consumption SAG Mill per mill @ 6800 tph, Feed 80% < 160,000 microns
Bond Abrasion Index BAi 0.38 0.44 0.60 Tons/Month Breakage 57 57 57 Wear tpa 863 904 1006 Overall tpa 920 962 1064 Scrap Generation tpa 85 88 102
Annual tonnes (three mills) 33,113 34,618 38,290
Potential Steel Recovery (three mills) tonnes 32,857 34,353 37,983
CEIP SAG Mill Media consumption estimate tpa 44,310
Ball Mill per mill @ 4800 tph, Feed 80% < 3,200 microns Bond Abrasion Index BAi 0.38 0.44 0.60 Tons/Month Breakage 0 0 0 Wear tpa 995 1042 1160 Overall tpa 995 1042 1160 Scrap Generation tpa 97 102 113
Annual Tonnes (three mills) 35,816 37,523 41,753
Potential Steel Recovery (three mills) tonnes 32,324 33,850 37,684
CEIP Ball Mill Media consumption estimate tpa 44,673
CEIP grinding media is conservatively estimated, using an Ai value of 0.44, higher than actual test results.
Conservative Cost Assumptions used for OPEX
• SAG Mill media = US$910 /t
• Ball Mill media = US$1,123 /t
Cost Reduction Opportunities
• IRD has recognised prices from China may result in potential operating cost savings for media consumption.
Grinding Circuit Media Consumption
www.ironroadlimited.com.au 45
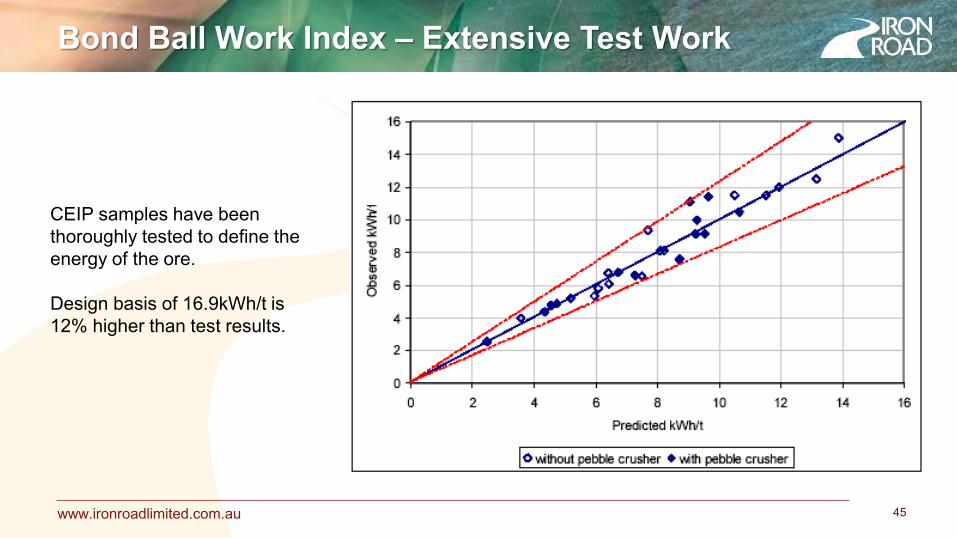
Bond Ball Work Index – Extensive Test Work
CEIP samples have been thoroughly tested to define the energy of the ore. Design basis of 16.9kWh/t is 12% higher than test results.
www.ironroadlimited.com.au 46
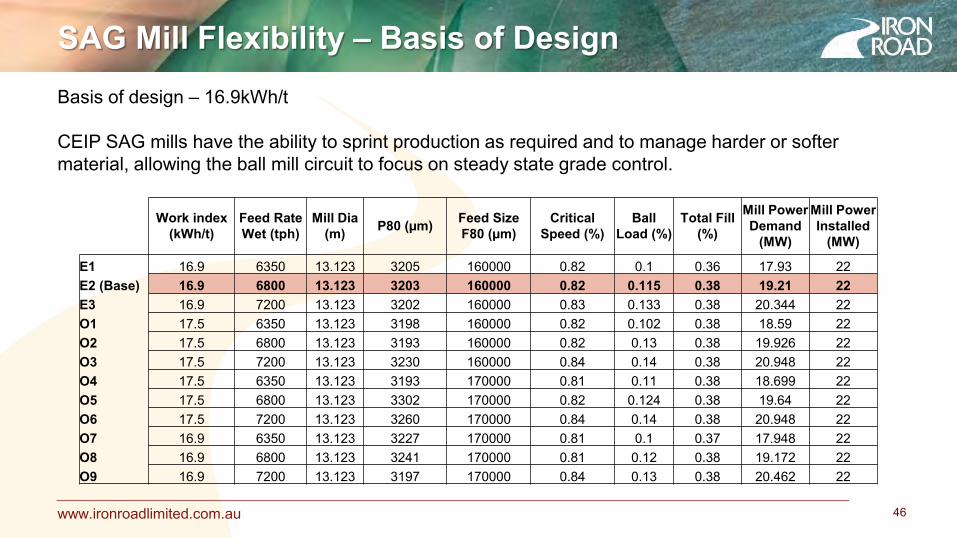
Work index (kWh/t)
Feed Rate Wet (tph)
Mill Dia (m) P80 (µm) Feed Size
F80 (µm) Critical
Speed (%) Ball
Load (%) Total Fill
(%)
Mill Power Demand
(MW)
Mill Power Installed
(MW)
E1 16.9 6350 13.123 3205 160000 0.82 0.1 0.36 17.93 22 E2 (Base) 16.9 6800 13.123 3203 160000 0.82 0.115 0.38 19.21 22 E3 16.9 7200 13.123 3202 160000 0.83 0.133 0.38 20.344 22 O1 17.5 6350 13.123 3198 160000 0.82 0.102 0.38 18.59 22 O2 17.5 6800 13.123 3193 160000 0.82 0.13 0.38 19.926 22 O3 17.5 7200 13.123 3230 160000 0.84 0.14 0.38 20.948 22 O4 17.5 6350 13.123 3193 170000 0.81 0.11 0.38 18.699 22 O5 17.5 6800 13.123 3302 170000 0.82 0.124 0.38 19.64 22 O6 17.5 7200 13.123 3260 170000 0.84 0.14 0.38 20.948 22 O7 16.9 6350 13.123 3227 170000 0.81 0.1 0.37 17.948 22 O8 16.9 6800 13.123 3241 170000 0.81 0.12 0.38 19.172 22 O9 16.9 7200 13.123 3197 170000 0.84 0.13 0.38 20.462 22
Basis of design – 16.9kWh/t CEIP SAG mills have the ability to sprint production as required and to manage harder or softer material, allowing the ball mill circuit to focus on steady state grade control.
SAG Mill Flexibility – Basis of Design

www.ironroadlimited.com.au
Conservative Bond Ball Work Index Used
47
8
10
12
14
16
18
20
50 150 250 350 450
BB
WI k
Wh
/t
AMDEL Mineral Test Result - Closing Screen Size µm
BBMWI variation with closing screen size
RMSFeed
RMSConc
CEIP Target P80 <460 microns
BALL MILL F80 - mm 3.2 Mill Feed tph 4805 Product
P80 Microns 460
Mill Power Install 22MW Power MW Wi kW/t 15.33 10 3.19
Ore has been tested as being
much softer than the design value
16.09 10.5 3.35 16.86 11 3.51 17.63 11.5 3.67 18.39 12 3.83 19.16 12.5 3.99 Current Designs 19.93 13 4.15
Test work has not indicated harder ore in this range
20.69 13.5 4.31 21.46 14 4.47
The ball mills are designed with operational and process flexibility in mind, utilising a higher BBWI. Grade may be managed, if/when required, by finer grinding.
www.ironroadlimited.com.au 48
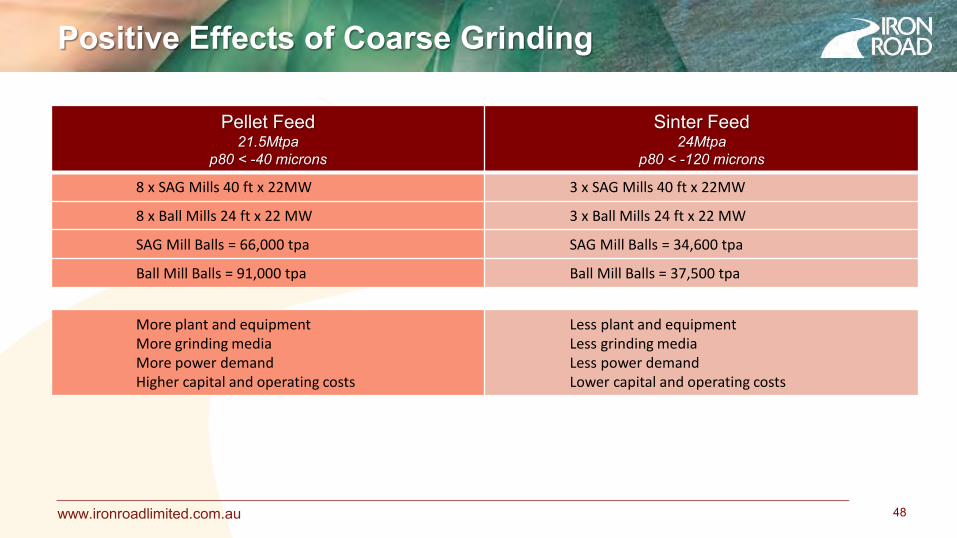
Pellet Feed 21.5Mtpa
p80 < -40 microns
Sinter Feed 24Mtpa
p80 < -120 microns
8 x SAG Mills 40 ft x 22MW 3 x SAG Mills 40 ft x 22MW
8 x Ball Mills 24 ft x 22 MW 3 x Ball Mills 24 ft x 22 MW
SAG Mill Balls = 66,000 tpa SAG Mill Balls = 34,600 tpa
Ball Mill Balls = 91,000 tpa Ball Mill Balls = 37,500 tpa
More plant and equipment More grinding media More power demand Higher capital and operating costs
Less plant and equipment Less grinding media Less power demand Lower capital and operating costs
Positive Effects of Coarse Grinding
www.ironroadlimited.com.au 49
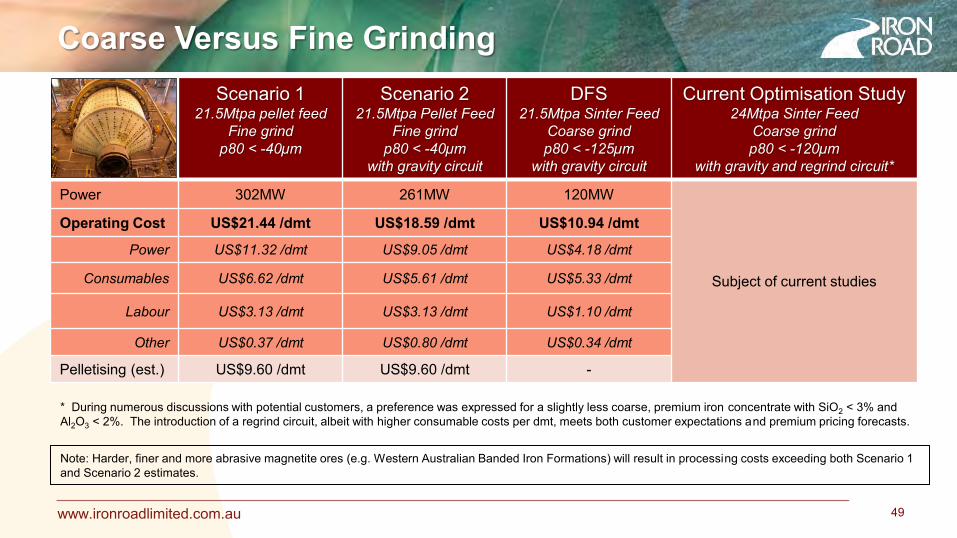
Scenario 1 21.5Mtpa pellet feed
Fine grind p80 < -40µm
Scenario 2 21.5Mtpa Pellet Feed
Fine grind p80 < -40µm
with gravity circuit
DFS 21.5Mtpa Sinter Feed
Coarse grind p80 < -125µm
with gravity circuit
Current Optimisation Study 24Mtpa Sinter Feed
Coarse grind p80 < -120µm
with gravity and regrind circuit*
Power 302MW 261MW 120MW
Subject of current studies
Operating Cost US$21.44 /dmt US$18.59 /dmt US$10.94 /dmt
Power US$11.32 /dmt US$9.05 /dmt US$4.18 /dmt
Consumables US$6.62 /dmt US$5.61 /dmt US$5.33 /dmt
Labour US$3.13 /dmt US$3.13 /dmt US$1.10 /dmt
Other US$0.37 /dmt US$0.80 /dmt US$0.34 /dmt
Pelletising (est.) US$9.60 /dmt US$9.60 /dmt -
Note: Harder, finer and more abrasive magnetite ores (e.g. Western Australian Banded Iron Formations) will result in processing costs exceeding both Scenario 1 and Scenario 2 estimates.
Coarse Versus Fine Grinding
* During numerous discussions with potential customers, a preference was expressed for a slightly less coarse, premium iron concentrate with SiO2 < 3% and Al2O3 < 2%. The introduction of a regrind circuit, albeit with higher consumable costs per dmt, meets both customer expectations and premium pricing forecasts.

www.ironroadlimited.com.au 50
CEIP Waste & Tailings
www.ironroadlimited.com.au
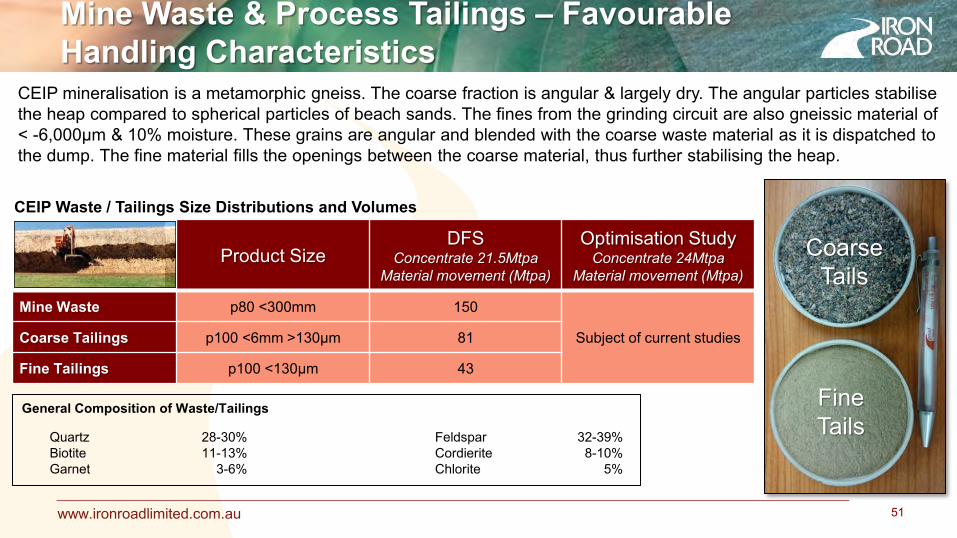
CEIP mineralisation is a metamorphic gneiss. The coarse fraction is angular & largely dry. The angular particles stabilise the heap compared to spherical particles of beach sands. The fines from the grinding circuit are also gneissic material of < -6,000µm & 10% moisture. These grains are angular and blended with the coarse waste material as it is dispatched to the dump. The fine material fills the openings between the coarse material, thus further stabilising the heap.
Mine Waste & Process Tailings – Favourable
Handling Characteristics
51
Product Size DFS
Concentrate 21.5Mtpa Material movement (Mtpa)
Optimisation Study Concentrate 24Mtpa
Material movement (Mtpa)
Mine Waste p80 <300mm 150
Subject of current studies Coarse Tailings p100 <6mm >130µm 81
Fine Tailings p100 <130µm 43
CEIP Waste / Tailings Size Distributions and Volumes
General Composition of Waste/Tailings Quartz 28-30% Feldspar 32-39% Biotite 11-13% Cordierite 8-10% Garnet 3-6% Chlorite 5%
Coarse Tails
Fine Tails

www.ironroadlimited.com.au
In mining and mineral processing, materials are separated according to their particle size and mineralogy. The wastes produced fall into two categories 1. Coarse mine waste/rejects; and 2. Fine-grained tailings Conventionally these two streams are disposed of separately.
Waste / Tailings Definition
52
Co-disposal involves combining these waste streams
www.ironroadlimited.com.au
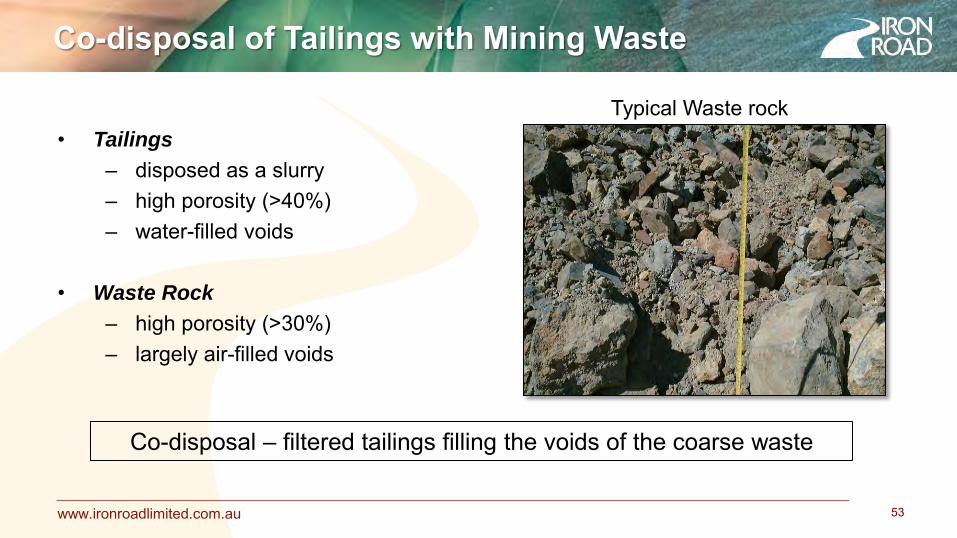
Typical Waste rock • Tailings
– disposed as a slurry – high porosity (>40%) – water-filled voids
• Waste Rock
– high porosity (>30%) – largely air-filled voids
Co-disposal of Tailings with Mining Waste
53
Co-disposal – filtered tailings filling the voids of the coarse waste
www.ironroadlimited.com.au 54
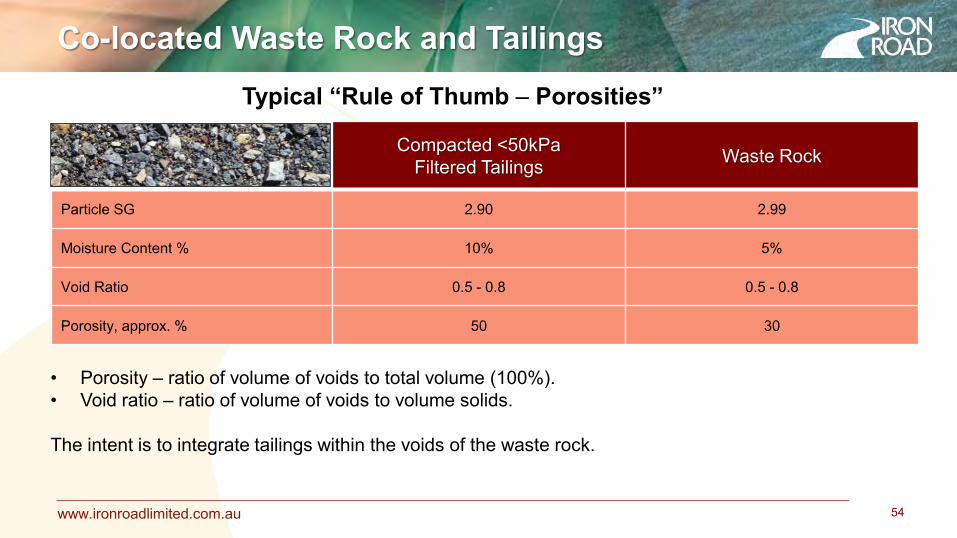
Compacted <50kPa Filtered Tailings Waste Rock
Particle SG 2.90 2.99
Moisture Content % 10% 5%
Void Ratio 0.5 - 0.8 0.5 - 0.8
Porosity, approx. % 50 30
Typical “Rule of Thumb – Porosities”
• Porosity – ratio of volume of voids to total volume (100%). • Void ratio – ratio of volume of voids to volume solids. The intent is to integrate tailings within the voids of the waste rock.
Co-located Waste Rock and Tailings
www.ironroadlimited.com.au
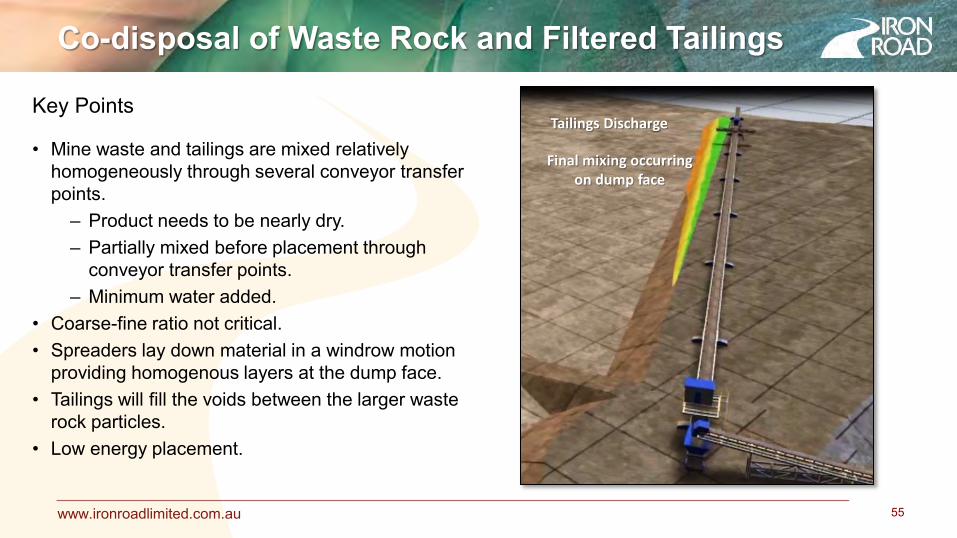
Key Points
• Mine waste and tailings are mixed relatively homogeneously through several conveyor transfer points.
– Product needs to be nearly dry. – Partially mixed before placement through
conveyor transfer points. – Minimum water added.
• Coarse-fine ratio not critical. • Spreaders lay down material in a windrow motion
providing homogenous layers at the dump face. • Tailings will fill the voids between the larger waste
rock particles. • Low energy placement.
55
Tailings Discharge
Final mixing occurring on dump face
Co-disposal of Waste Rock and Filtered Tailings
www.ironroadlimited.com.au
Benefits
No surface fleet required for managing waste and tails material. Significantly reduced footprint. Shear strength similar to waste rock with high compaction levels. Permeability similar to tailings. Low oxygen diffusion rates. Improved closure opportunities with rehabilitation carried out progressively during the mine life. Reduced water consumption; water is recovered and recycled in the process plant. No ground water seepage or acid rock drainage concerns. Improved approvals timeline. Better community acceptance.
Co-disposal Benefits
56
www.ironroadlimited.com.au
Tailings Facility Journey
57
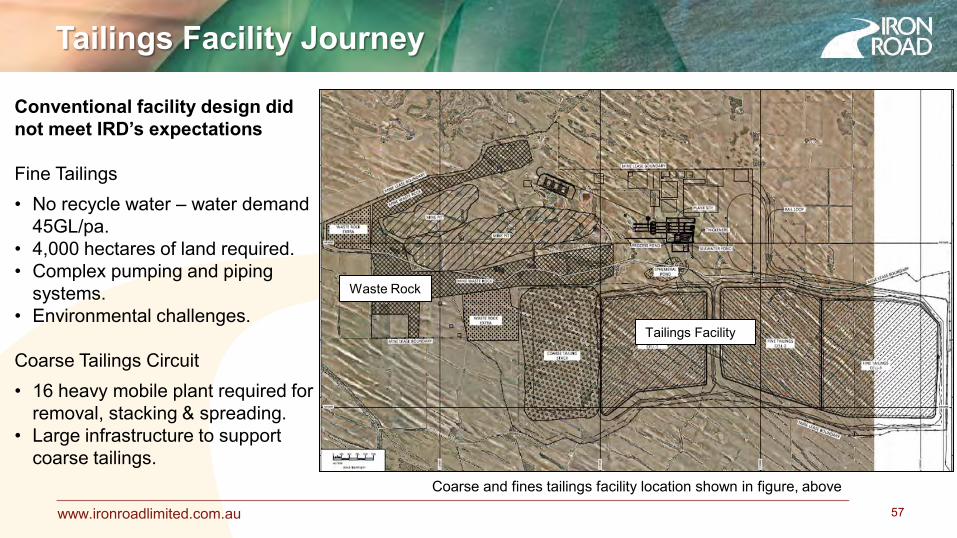
Conventional facility design did not meet IRD’s expectations Fine Tailings • No recycle water – water demand
45GL/pa. • 4,000 hectares of land required. • Complex pumping and piping
systems. • Environmental challenges. Coarse Tailings Circuit • 16 heavy mobile plant required for
removal, stacking & spreading. • Large infrastructure to support
coarse tailings.
Tailings Facility
Waste Rock
Coarse and fines tailings facility location shown in figure, above

www.ironroadlimited.com.au
Co-location Waste-Tailings Facility
58
Waste Rock & Process Tailings
Current facility design optimised
Waste rock and process tailings combined as shown in figure.
• Process water recycled – water
demand reduced from 45GL/pa to 14GL/pa.
• Waste and tailings areas reduced from 6,000 to 2,000 hectares in total.
• Removal of heavy mobile plant fleet to support coarse tails.
www.ironroadlimited.com.au
Co-Locate Waste-Tailings – Homogenous Mix
59
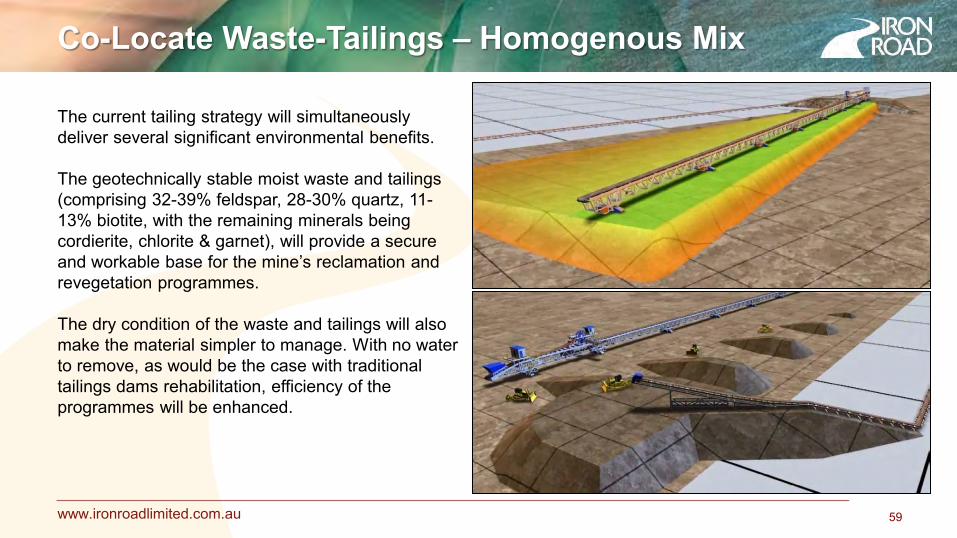
The current tailing strategy will simultaneously deliver several significant environmental benefits. The geotechnically stable moist waste and tailings (comprising 32-39% feldspar, 28-30% quartz, 11-13% biotite, with the remaining minerals being cordierite, chlorite & garnet), will provide a secure and workable base for the mine’s reclamation and revegetation programmes. The dry condition of the waste and tailings will also make the material simpler to manage. With no water to remove, as would be the case with traditional tailings dams rehabilitation, efficiency of the programmes will be enhanced.
www.ironroadlimited.com.au
Waste Handling Optimisation – Low Capital and
Operating Costs
60
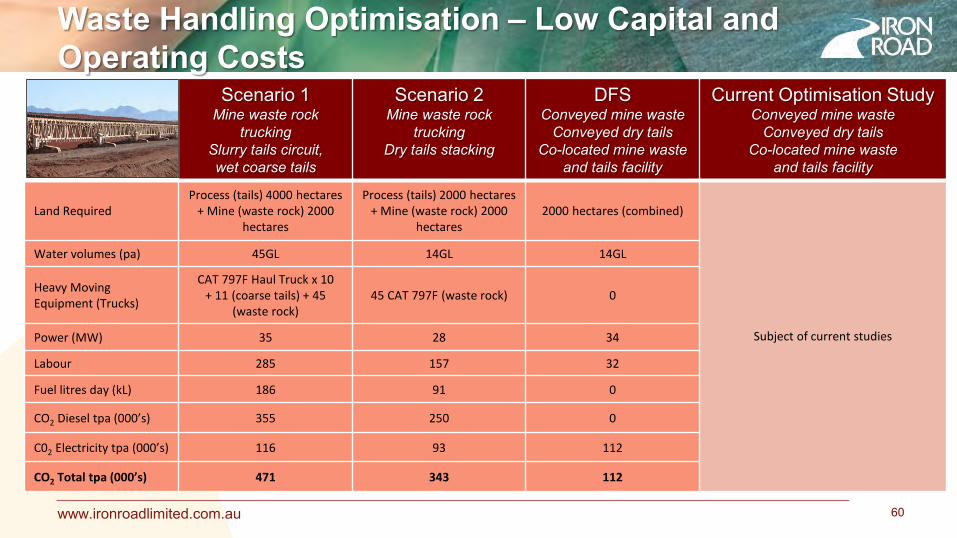
Scenario 1 Mine waste rock
trucking Slurry tails circuit, wet coarse tails
Scenario 2 Mine waste rock
trucking Dry tails stacking
DFS Conveyed mine waste
Conveyed dry tails Co-located mine waste
and tails facility
Current Optimisation Study Conveyed mine waste
Conveyed dry tails Co-located mine waste
and tails facility
Land Required Process (tails) 4000 hectares
+ Mine (waste rock) 2000 hectares
Process (tails) 2000 hectares + Mine (waste rock) 2000
hectares 2000 hectares (combined)
Subject of current studies
Water volumes (pa) 45GL 14GL 14GL
Heavy Moving Equipment (Trucks)
CAT 797F Haul Truck x 10 + 11 (coarse tails) + 45
(waste rock) 45 CAT 797F (waste rock) 0
Power (MW) 35 28 34
Labour 285 157 32
Fuel litres day (kL) 186 91 0
CO2 Diesel tpa (000’s) 355 250 0
C02 Electricity tpa (000’s) 116 93 112
CO2 Total tpa (000’s) 471 343 112
www.ironroadlimited.com.au
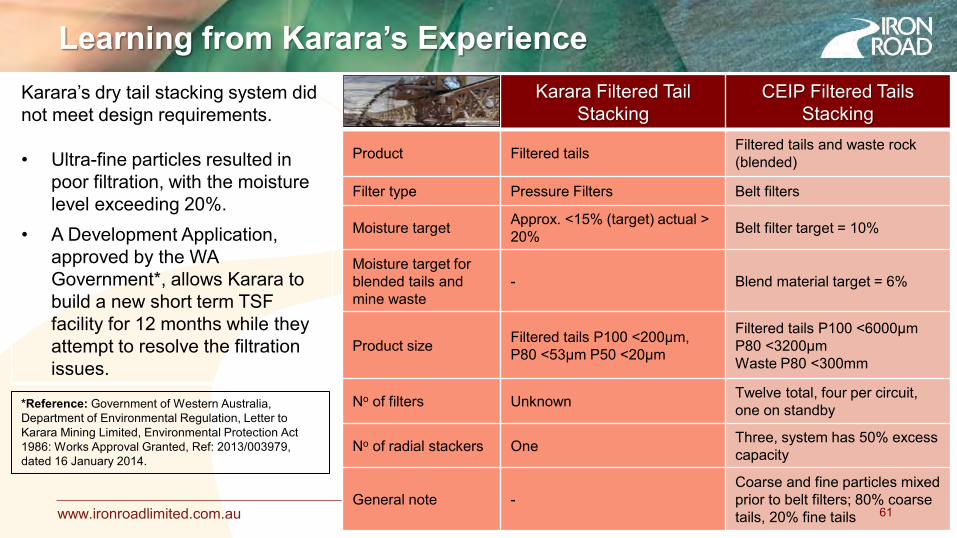
Karara Filtered Tail Stacking
CEIP Filtered Tails Stacking
Product Filtered tails Filtered tails and waste rock (blended)
Filter type Pressure Filters Belt filters
Moisture target Approx. <15% (target) actual > 20% Belt filter target = 10%
Moisture target for blended tails and mine waste
- Blend material target = 6%
Product size Filtered tails P100 <200µm, P80 <53µm P50 <20µm
Filtered tails P100 <6000µm P80 <3200µm Waste P80 <300mm
No of filters Unknown Twelve total, four per circuit, one on standby
No of radial stackers One Three, system has 50% excess capacity
General note - Coarse and fine particles mixed prior to belt filters; 80% coarse tails, 20% fine tails
Learning from Karara’s Experience
61
Karara’s dry tail stacking system did not meet design requirements. • Ultra-fine particles resulted in
poor filtration, with the moisture level exceeding 20%.
• A Development Application, approved by the WA Government*, allows Karara to build a new short term TSF facility for 12 months while they attempt to resolve the filtration issues.
*Reference: Government of Western Australia, Department of Environmental Regulation, Letter to Karara Mining Limited, Environmental Protection Act 1986: Works Approval Granted, Ref: 2013/003979, dated 16 January 2014.
www.ironroadlimited.com.au 62
Water Source, Filtering & Recycling
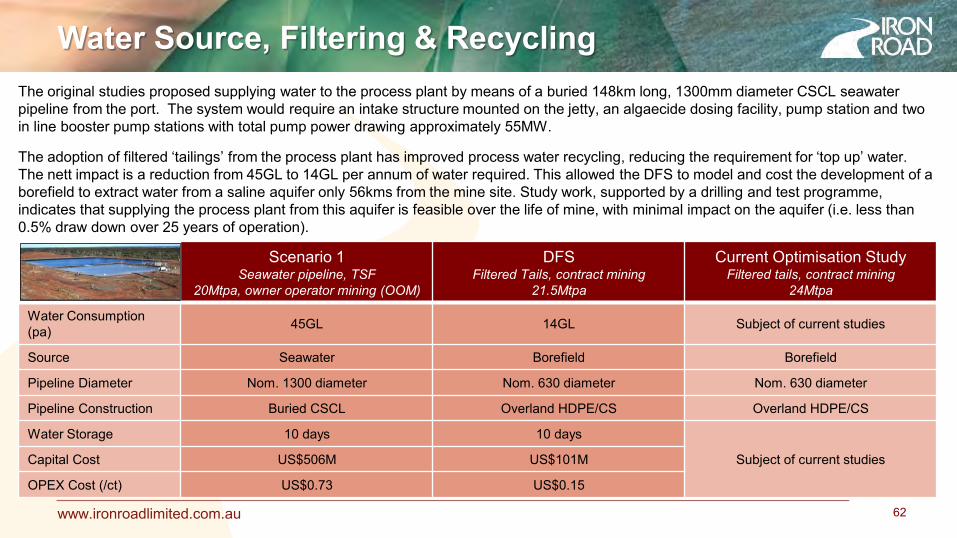
The original studies proposed supplying water to the process plant by means of a buried 148km long, 1300mm diameter CSCL seawater pipeline from the port. The system would require an intake structure mounted on the jetty, an algaecide dosing facility, pump station and two in line booster pump stations with total pump power drawing approximately 55MW. The adoption of filtered ‘tailings’ from the process plant has improved process water recycling, reducing the requirement for ‘top up’ water. The nett impact is a reduction from 45GL to 14GL per annum of water required. This allowed the DFS to model and cost the development of a borefield to extract water from a saline aquifer only 56kms from the mine site. Study work, supported by a drilling and test programme, indicates that supplying the process plant from this aquifer is feasible over the life of mine, with minimal impact on the aquifer (i.e. less than 0.5% draw down over 25 years of operation).
Scenario 1 Seawater pipeline, TSF
20Mtpa, owner operator mining (OOM)
DFS Filtered Tails, contract mining
21.5Mtpa
Current Optimisation Study Filtered tails, contract mining
24Mtpa
Water Consumption (pa) 45GL 14GL Subject of current studies
Source Seawater Borefield Borefield
Pipeline Diameter Nom. 1300 diameter Nom. 630 diameter Nom. 630 diameter
Pipeline Construction Buried CSCL Overland HDPE/CS Overland HDPE/CS
Water Storage 10 days 10 days
Subject of current studies Capital Cost US$506M US$101M
OPEX Cost (/ct) US$0.73 US$0.15
www.ironroadlimited.com.au 63
CEIP Rail Facility
www.ironroadlimited.com.au
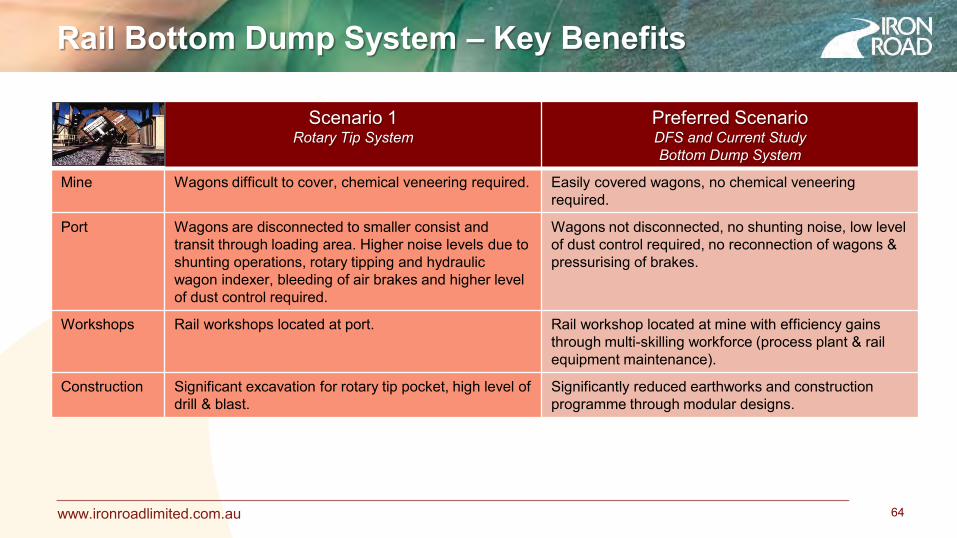
Rail Bottom Dump System – Key Benefits
64
Scenario 1 Rotary Tip System
Preferred Scenario DFS and Current Study Bottom Dump System
Mine Wagons difficult to cover, chemical veneering required. Easily covered wagons, no chemical veneering required.
Port Wagons are disconnected to smaller consist and transit through loading area. Higher noise levels due to shunting operations, rotary tipping and hydraulic wagon indexer, bleeding of air brakes and higher level of dust control required.
Wagons not disconnected, no shunting noise, low level of dust control required, no reconnection of wagons & pressurising of brakes.
Workshops Rail workshops located at port. Rail workshop located at mine with efficiency gains through multi-skilling workforce (process plant & rail equipment maintenance).
Construction Significant excavation for rotary tip pocket, high level of drill & blast.
Significantly reduced earthworks and construction programme through modular designs.

www.ironroadlimited.com.au
Rotary Tip Versus Bottom Dump
65
Rotary Tip • Rotary dump system requires extensive
earthworks & reinforced walls. • Large dust extraction system to control airborne
dust. • Dewatering pumps required for wall seepage. • Difficult to modularise, constructed in sections. • Construction programme full three years.
Bottom Dump • Bottom dump system installed at grade, no
excavation. • Minimal requirements for dust control. • No dewatering pumping system. • Fully modularised & stage 3 commissioned
offshore. • Wing wall installed onsite & backfilled. • Construction programme ~16 weeks.
65
Bottom Dump Rotary Tip Excavation Fill to rail
formation
www.ironroadlimited.com.au
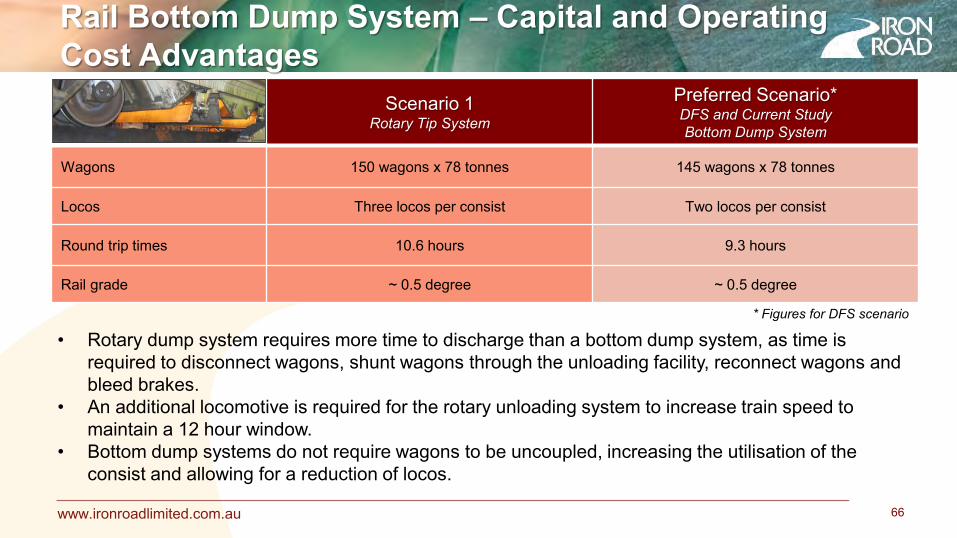
Rail Bottom Dump System – Capital and Operating
Cost Advantages
66
Scenario 1
Rotary Tip System
Preferred Scenario* DFS and Current Study Bottom Dump System
Wagons 150 wagons x 78 tonnes 145 wagons x 78 tonnes
Locos Three locos per consist Two locos per consist
Round trip times 10.6 hours 9.3 hours
Rail grade ~ 0.5 degree ~ 0.5 degree
• Rotary dump system requires more time to discharge than a bottom dump system, as time is required to disconnect wagons, shunt wagons through the unloading facility, reconnect wagons and bleed brakes.
• An additional locomotive is required for the rotary unloading system to increase train speed to maintain a 12 hour window.
• Bottom dump systems do not require wagons to be uncoupled, increasing the utilisation of the consist and allowing for a reduction of locos.
* Figures for DFS scenario

www.ironroadlimited.com.au 67
CEIP Modularisation

www.ironroadlimited.com.au 68
Successful logistical planning for remote locations is a direct contributor to the overall success of the project and has a material impact on schedule and cost. Developing a successful modularisation strategy therefore plays an important role in delivering the project on time and on budget.
Modularisation
www.ironroadlimited.com.au
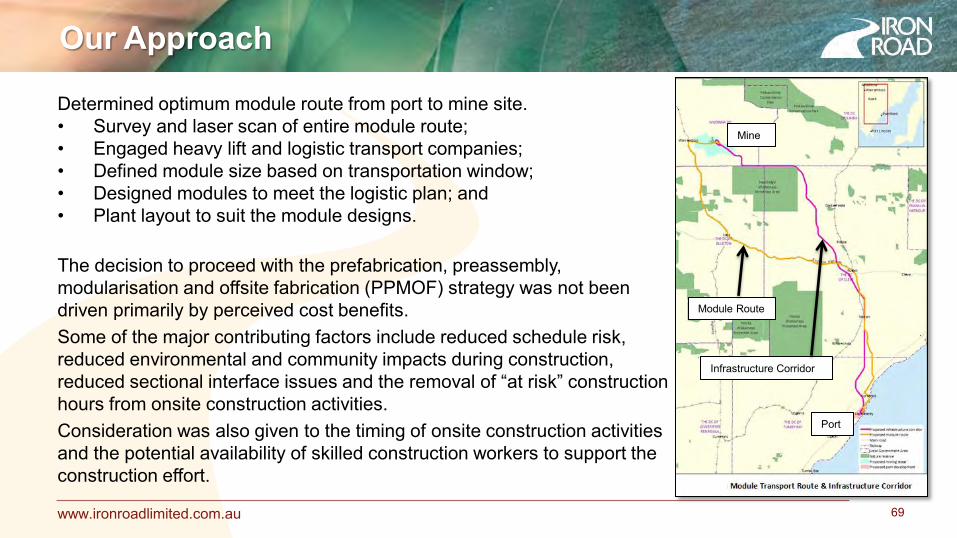
Determined optimum module route from port to mine site. • Survey and laser scan of entire module route; • Engaged heavy lift and logistic transport companies; • Defined module size based on transportation window; • Designed modules to meet the logistic plan; and • Plant layout to suit the module designs.
The decision to proceed with the prefabrication, preassembly, modularisation and offsite fabrication (PPMOF) strategy was not been driven primarily by perceived cost benefits. Some of the major contributing factors include reduced schedule risk, reduced environmental and community impacts during construction, reduced sectional interface issues and the removal of “at risk” construction hours from onsite construction activities. Consideration was also given to the timing of onsite construction activities and the potential availability of skilled construction workers to support the construction effort.
Our Approach
69
Module Route
Infrastructure Corridor
Mine
Port
www.ironroadlimited.com.au 70
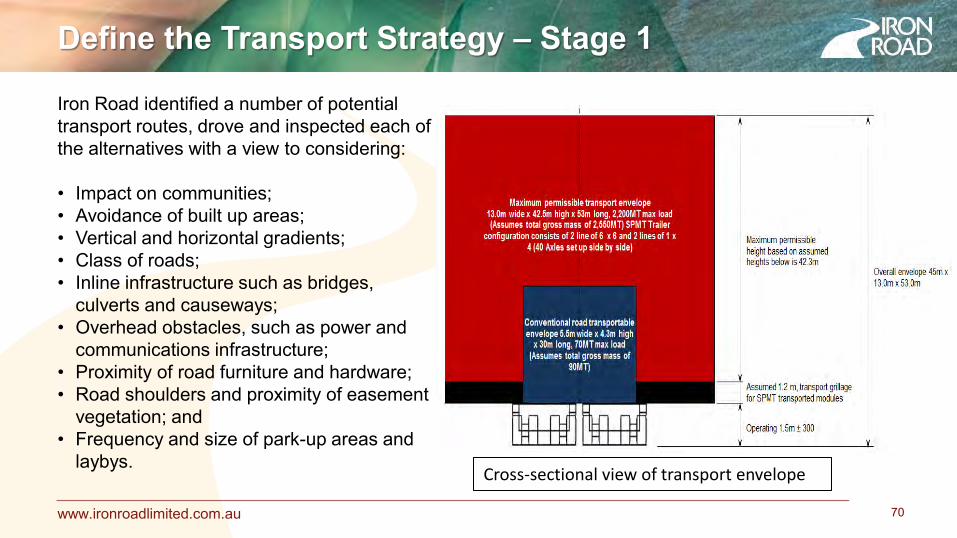
Iron Road identified a number of potential transport routes, drove and inspected each of the alternatives with a view to considering: • Impact on communities; • Avoidance of built up areas; • Vertical and horizontal gradients; • Class of roads; • Inline infrastructure such as bridges,
culverts and causeways; • Overhead obstacles, such as power and
communications infrastructure; • Proximity of road furniture and hardware; • Road shoulders and proximity of easement
vegetation; and • Frequency and size of park-up areas and
laybys. Cross-sectional view of transport envelope
Define the Transport Strategy – Stage 1
www.ironroadlimited.com.au
Define the Transport Strategy – Stage 2
71
Stage 2 of route identification involved the engagement of the Sarens Group to assess preliminary transport and logistics challenges associated with the module dimensions envisaged. Sarens Group provided potential SPT trailer and SPMT configurations and associated operational constraints in relation to travel speed, maximum grades, maximum mass, wheel and axle loadings, etc. Fugro Spatial Solutions were also engaged to undertake a terrestrial 3D laser scan of the nominated transport route from Iron Road’s port location at Cape Hardy to the proposed mine site. The road corridor is approximately 200km in length from port to mine. The purpose of the terrestrial 3D laser scan was to provide a detailed survey of the road corridor and to understand any limiting factors that may be an impediment to SPT and SPMT transporters proposed to transport the large modules.

www.ironroadlimited.com.au
Having completed the terrestrial 3D laser scan, Sarens Group undertook a final review to confirm the SPT and SPMT transporter configurations most likely to be used. A detailed analysis of the digital survey data was undertaken using 12D platforms to identify potential grade (sag and crest) and horizontal turning path issues. On the preferred route, 11 intersections were reviewed and infrastructure improvements and upgrades identified.
Define the Transport Strategy – Stage 3
72

www.ironroadlimited.com.au
Develop Module Plan
73
MODULE DESCRIPTION UNIQUE
ID MODULE TYPE
QTY LENGTH
(M) WIDTH
(M) HEIGHT
(M) MASS (MT)
PLANT LOC
CONSOLIDATED PROCESS BUILDING MODULE > 500MT
4450CMS001SP1 SPAM 1 53 12.8 42 2,001 TRAIN 1
CONSOLIDATED ROOF, FLOOR &/OR WALL FLAT PACK MODULE > 50MT
4450CMS002PA1 PAM 1 53 12.8 9 86 TRAIN 1
CONSOLIDATED STAIR TOWER &/OR PLATFORM MODULE > 50MT
4450CMS003PA1 PAM 1 3.2 7.5 45 76 TRAIN 1
CONSOLIDATED PROCESS BUILDING MODULE > 500MT
4450CMS001SP2 SPAM 1 53.0 12.8 42 2,001 TRAIN 2
CONSOLIDATED ROOF, FLOOR &/OR WALL FLAT PACK MODULE > 50MT
4450CMS002PA2 PAM 1 53 12.8 9 86 TRAIN 2
CONSOLIDATED STAIR TOWER &/OR PLATFORM MODULE > 50MT
4450CMS003PA2 PAM 1 3.2 7.5 45 76 TRAIN 2
CONSOLIDATED PROCESS BUILDING MODULE > 500MT
4450CMS001SP3 SPAM 1 53 12.8 42 2,001 TRAIN 3
CONSOLIDATED ROOF, FLOOR &/OR WALL FLAT PACK MODULE > 50MT
4450CMS002PA3 PAM 1 53.0 12.8 9 86 TRAIN 3
CONSOLIDATED STAIR TOWER &/OR PLATFORM MODULE > 50MT
4450CMS003PA3 PAM 1 3.2 7.5 45 76 TRAIN 3
www.ironroadlimited.com.au
Design to Meet the Module Route
74
45m

www.ironroadlimited.com.au
Nested Modules to Meet Plant Designs
75
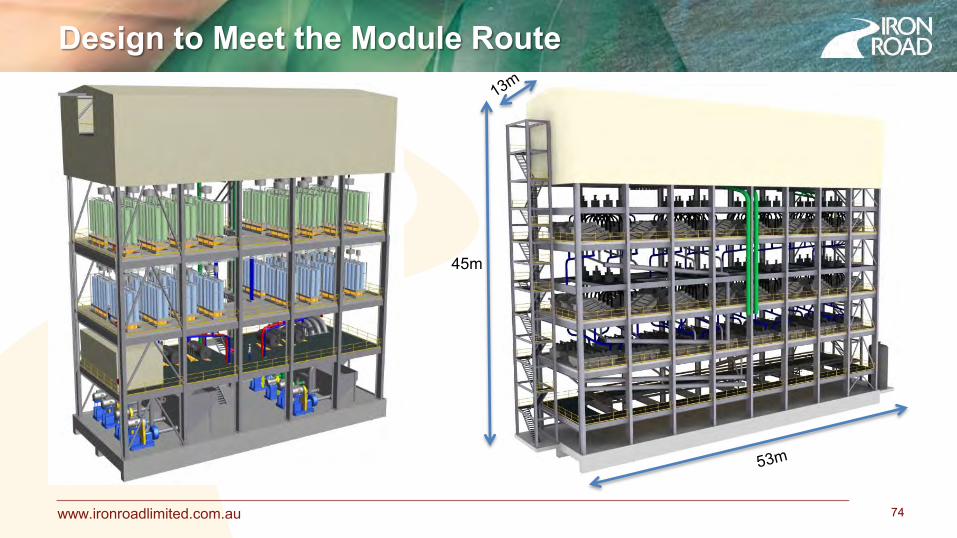
The assured transport envelope to accommodate modules as large as 13m wide, 53m long and 45m in height (from top of carriageway) with a maximum module mass (including grillage and transport steel) of ~2,200Mt. • Opportunity to ‘nest’ the process buildings to
move away from the disbursed lineal nature of the original plant and facilities layout.
• Reduce the overall pumping requirements by vertically integrating process buildings and employ gravity to move material product through the process.
• Constructability reviews revealed that as the large modules will be installed using SPMT’s and a “drive-in” methodology, the construction work space is much reduced from the conventional “stick build” alternative.
CMS BUILDING MODULE GRAVITY SPIRAL BUILDING MODULE
COARSE TAILS TANK MODULE
TAILS FILTER BUILDING MODULE(S)
TAILS FILTER SERVICES MODULE
TAILS THICKENER MODULE(S)
RMS BUILDING MODULE
www.ironroadlimited.com.au 76
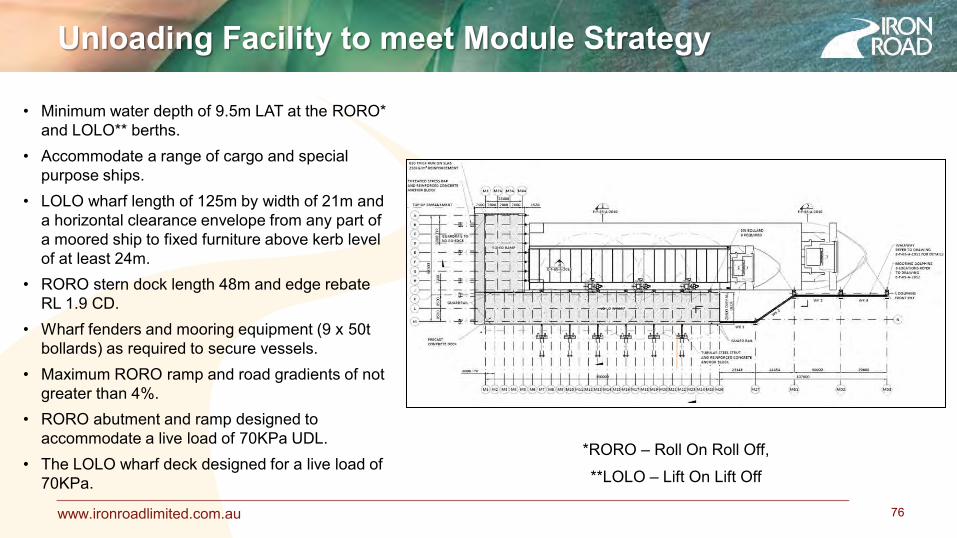
• Minimum water depth of 9.5m LAT at the RORO* and LOLO** berths.
• Accommodate a range of cargo and special purpose ships.
• LOLO wharf length of 125m by width of 21m and a horizontal clearance envelope from any part of a moored ship to fixed furniture above kerb level of at least 24m.
• RORO stern dock length 48m and edge rebate RL 1.9 CD.
• Wharf fenders and mooring equipment (9 x 50t bollards) as required to secure vessels.
• Maximum RORO ramp and road gradients of not greater than 4%.
• RORO abutment and ramp designed to accommodate a live load of 70KPa UDL.
• The LOLO wharf deck designed for a live load of 70KPa.
*RORO – Roll On Roll Off,
**LOLO – Lift On Lift Off
Unloading Facility to meet Module Strategy
www.ironroadlimited.com.au
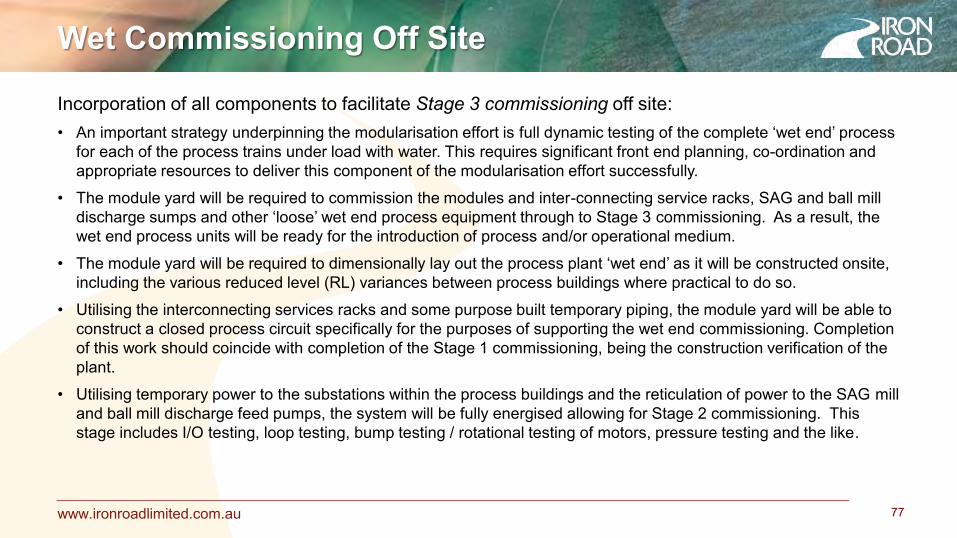
Incorporation of all components to facilitate Stage 3 commissioning off site: • An important strategy underpinning the modularisation effort is full dynamic testing of the complete ‘wet end’ process
for each of the process trains under load with water. This requires significant front end planning, co-ordination and appropriate resources to deliver this component of the modularisation effort successfully.
• The module yard will be required to commission the modules and inter-connecting service racks, SAG and ball mill discharge sumps and other ‘loose’ wet end process equipment through to Stage 3 commissioning. As a result, the wet end process units will be ready for the introduction of process and/or operational medium.
• The module yard will be required to dimensionally lay out the process plant ‘wet end’ as it will be constructed onsite, including the various reduced level (RL) variances between process buildings where practical to do so.
• Utilising the interconnecting services racks and some purpose built temporary piping, the module yard will be able to construct a closed process circuit specifically for the purposes of supporting the wet end commissioning. Completion of this work should coincide with completion of the Stage 1 commissioning, being the construction verification of the plant.
• Utilising temporary power to the substations within the process buildings and the reticulation of power to the SAG mill and ball mill discharge feed pumps, the system will be fully energised allowing for Stage 2 commissioning. This stage includes I/O testing, loop testing, bump testing / rotational testing of motors, pressure testing and the like.
Wet Commissioning Off Site
77
www.ironroadlimited.com.au
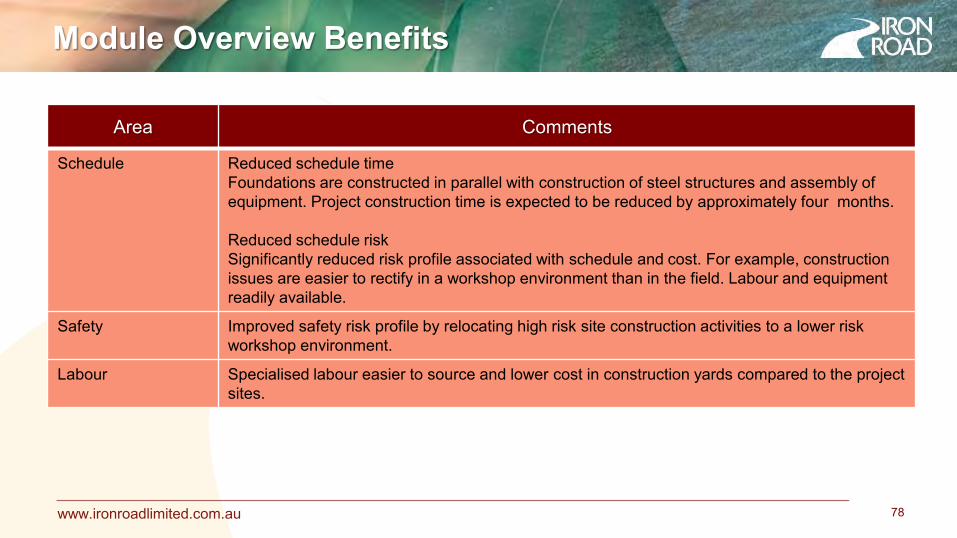
Module Overview Benefits
78
Area Comments
Schedule Reduced schedule time Foundations are constructed in parallel with construction of steel structures and assembly of equipment. Project construction time is expected to be reduced by approximately four months. Reduced schedule risk Significantly reduced risk profile associated with schedule and cost. For example, construction issues are easier to rectify in a workshop environment than in the field. Labour and equipment readily available.
Safety Improved safety risk profile by relocating high risk site construction activities to a lower risk workshop environment.
Labour Specialised labour easier to source and lower cost in construction yards compared to the project sites.
www.ironroadlimited.com.au 79
CEIP Port

www.ironroadlimited.com.au
• Deep water port facility with 22m draft. • No dredging or breakwater required. • Berth for two Capesize vessels, 24/7
in most weather conditions. • Shiploader capacity 10,000tph. • Ship loading time of approximately 24
hours. • 1,100 hectares of land secured, readily
supports third party users.
CEIP Port Facility – Fact Sheet
80
www.ironroadlimited.com.au
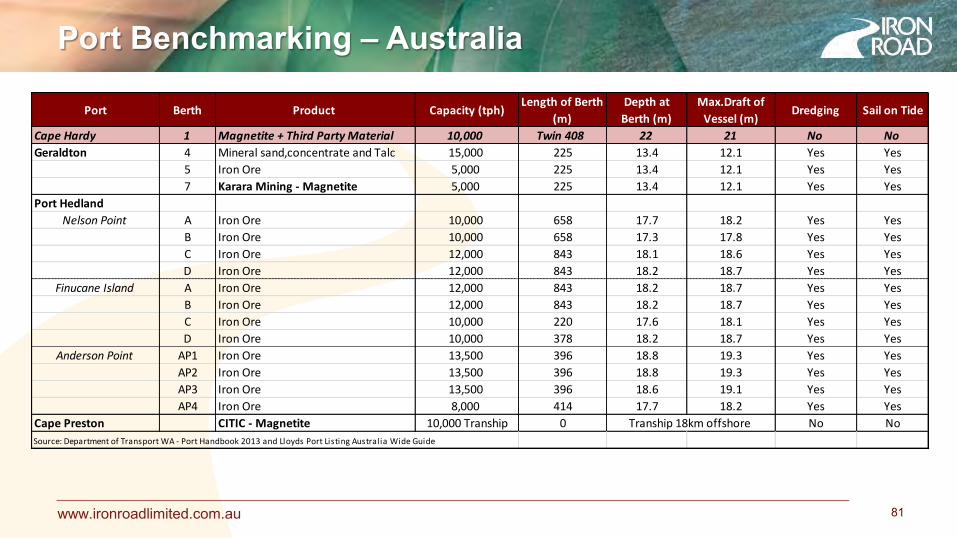
Port Benchmarking – Australia
81
Port Berth Product Capacity (tph)Length of Berth
(m)
Depth at
Berth (m)
Max.Draft of
Vessel (m)Dredging Sail on Tide
Cape Hardy 1 Magnetite + Third Party Material 10,000 Twin 408 22 21 No No
Geraldton 4 Mineral sand,concentrate and Talc 15,000 225 13.4 12.1 Yes Yes
5 Iron Ore 5,000 225 13.4 12.1 Yes Yes
7 Karara Mining - Magnetite 5,000 225 13.4 12.1 Yes Yes
Port Hedland
Nelson Point A Iron Ore 10,000 658 17.7 18.2 Yes Yes
B Iron Ore 10,000 658 17.3 17.8 Yes Yes
C Iron Ore 12,000 843 18.1 18.6 Yes Yes
D Iron Ore 12,000 843 18.2 18.7 Yes Yes
Finucane Island A Iron Ore 12,000 843 18.2 18.7 Yes Yes
B Iron Ore 12,000 843 18.2 18.7 Yes Yes
C Iron Ore 10,000 220 17.6 18.1 Yes Yes
D Iron Ore 10,000 378 18.2 18.7 Yes Yes
Anderson Point AP1 Iron Ore 13,500 396 18.8 19.3 Yes Yes
AP2 Iron Ore 13,500 396 18.8 19.3 Yes Yes
AP3 Iron Ore 13,500 396 18.6 19.1 Yes Yes
AP4 Iron Ore 8,000 414 17.7 18.2 Yes Yes
Cape Preston CITIC - Magnetite 10,000 Tranship 0 No No
Source: Department of Transport WA - Port Handbook 2013 and Lloyds Port Listing Australia Wide Guide
Tranship 18km offshore

www.ironroadlimited.com.au 82
Geraldton Berth 7 Cape Preston Cape Hardy
Vessel Panamax 115 DWT Panamax 115 DWT Cape Class 220 DWT
Stockpile capacity 400kt 220kt Min. 660kt
Direct ship loading Yes Tranship 18km offshore Yes
Loading capacity 5,000tph Tranship 10,000tph, barge loading 10,000tph
Sailing on tide required Yes No No
Berthing Single Single Twin
Available capacity for third parties No No Yes
Ports – Magnetite Loading Comparison

www.ironroadlimited.com.au 83
Questions

www.ironroadlimited.com.au
Appendix 1 – CEIP Resource Statement &
Indicative Concentrate Specifications
84
CEIP Global Mineral Resource
Location Classification Tonnes (Mt)
Fe (%)
SiO2 (%)
Al2O3 (%)
P (%)
Murphy South/Rob Roy Measured 2,222 15.69 53.70 12.84 0.08 Indicated 474 15.6 53.7 12.8 0.08 Inferred 667 16 53 12 0.08
Boo Loo Inferred 328 17 52 12 0.09 Total 3,691 16 53 13 0.08
CEIP Indicative Concentrate Specification – 120 micron (p80)
Iron (Fe) SiO2 Al2O3 CaO MgO TiO2 Mn Na2O K2O S P LOI
>66.5% <3.5% <2.0% 0.10% 0.5% 0.3% 0.6% 0.085% 0.125% <0.005% <0.005% -2.6
The Murphy South/Rob Roy mineral resource estimate was carried out following the guidelines of the JORC Code (2004) by Iron Road Limited and peer reviewed by Xstract Mining Consultants (Rob Roy). The Boo Loo mineral resource estimate was carried out following the guidelines of the JORC Code (2004) by Coffey Mining Ltd. It has not been updated since to comply with the JORC Code 2012 on the basis that the information has not materially changed since it was last reported.
www.ironroadlimited.com.au
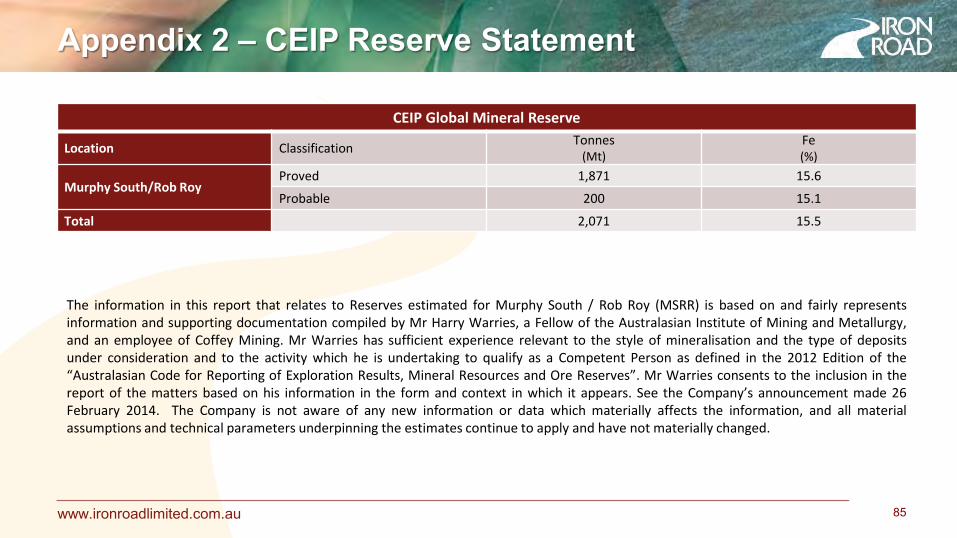
CEIP Global Mineral Reserve
Location Classification Tonnes (Mt)
Fe (%)
Murphy South/Rob Roy Proved 1,871 15.6 Probable 200 15.1
Total 2,071 15.5
The information in this report that relates to Reserves estimated for Murphy South / Rob Roy (MSRR) is based on and fairly represents information and supporting documentation compiled by Mr Harry Warries, a Fellow of the Australasian Institute of Mining and Metallurgy, and an employee of Coffey Mining. Mr Warries has sufficient experience relevant to the style of mineralisation and the type of deposits under consideration and to the activity which he is undertaking to qualify as a Competent Person as defined in the 2012 Edition of the “Australasian Code for Reporting of Exploration Results, Mineral Resources and Ore Reserves”. Mr Warries consents to the inclusion in the report of the matters based on his information in the form and context in which it appears. See the Company’s announcement made 26 February 2014. The Company is not aware of any new information or data which materially affects the information, and all material assumptions and technical parameters underpinning the estimates continue to apply and have not materially changed.
85
Appendix 2 – CEIP Reserve Statement
www.ironroadlimited.com.au 86
Appendix 3 – CEIP Exploration Target
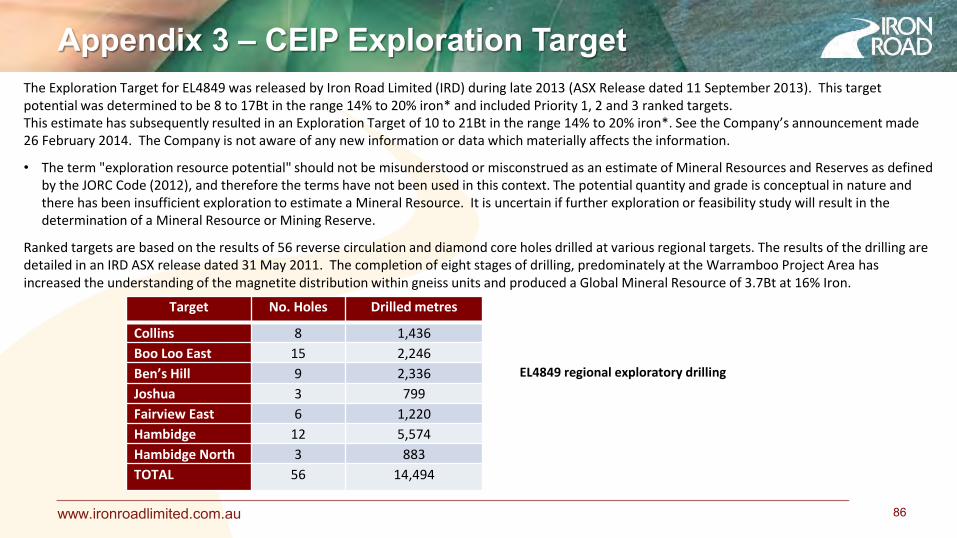
Target No. Holes Drilled metres
Collins 8 1,436 Boo Loo East 15 2,246 Ben’s Hill 9 2,336 Joshua 3 799 Fairview East 6 1,220 Hambidge 12 5,574 Hambidge North 3 883 TOTAL 56 14,494
The Exploration Target for EL4849 was released by Iron Road Limited (IRD) during late 2013 (ASX Release dated 11 September 2013). This target potential was determined to be 8 to 17Bt in the range 14% to 20% iron* and included Priority 1, 2 and 3 ranked targets. This estimate has subsequently resulted in an Exploration Target of 10 to 21Bt in the range 14% to 20% iron*. See the Company’s announcement made 26 February 2014. The Company is not aware of any new information or data which materially affects the information.
• The term "exploration resource potential" should not be misunderstood or misconstrued as an estimate of Mineral Resources and Reserves as defined by the JORC Code (2012), and therefore the terms have not been used in this context. The potential quantity and grade is conceptual in nature and there has been insufficient exploration to estimate a Mineral Resource. It is uncertain if further exploration or feasibility study will result in the determination of a Mineral Resource or Mining Reserve.
Ranked targets are based on the results of 56 reverse circulation and diamond core holes drilled at various regional targets. The results of the drilling are detailed in an IRD ASX release dated 31 May 2011. The completion of eight stages of drilling, predominately at the Warramboo Project Area has increased the understanding of the magnetite distribution within gneiss units and produced a Global Mineral Resource of 3.7Bt at 16% Iron.
EL4849 regional exploratory drilling
www.ironroadlimited.com.au 87
Appendix 3 – CEIP Exploration Target (continued)
The potential of the Hambidge Project Area has been further enhanced by the recent completion of inversion modelling of the detailed geophysical survey over Hambidge and immediate surrounds (Hawke, 2014). A reassessment of the Exploration Target for the Hambidge Prospect has indicated that the mineralisation is wide and deep, increasing the potential depth of the mineralisation to at least 600m. This is consistent with projections from drilling, geophysical inversion modelling and actual depth of mineralisation at the Murphy South prospect. It is envisaged that, subject to project funding, exploratory and resource definition, drilling will be undertaken at the highest priority targets, notably Boo Loo East, Boo Loo Gap, South Deeps and Hambidge, within the next 24 months. Lower priority targets will be assessed in the future. The assumptions used to estimate the conceptual tonnages are: • The Murphy South - Rob Roy Measured and Indicated Resource yielded 400Mt/km; assuming 50% conversion for geophysical anomalies then an
expectation of 200Mt/km was used for ranked targets. • The mineralisation is projected to between -200m and -600m below the surface. • An average depth to the fresh rock is 50m. • The dip of the mineralisation is in a range of -40⁰ to -70⁰. • Thicknesses with a true width of 40 – 200m. • An average density of the fresh rock of 3.1g/cm2. • Head Grades range from 14%-20% Fe.
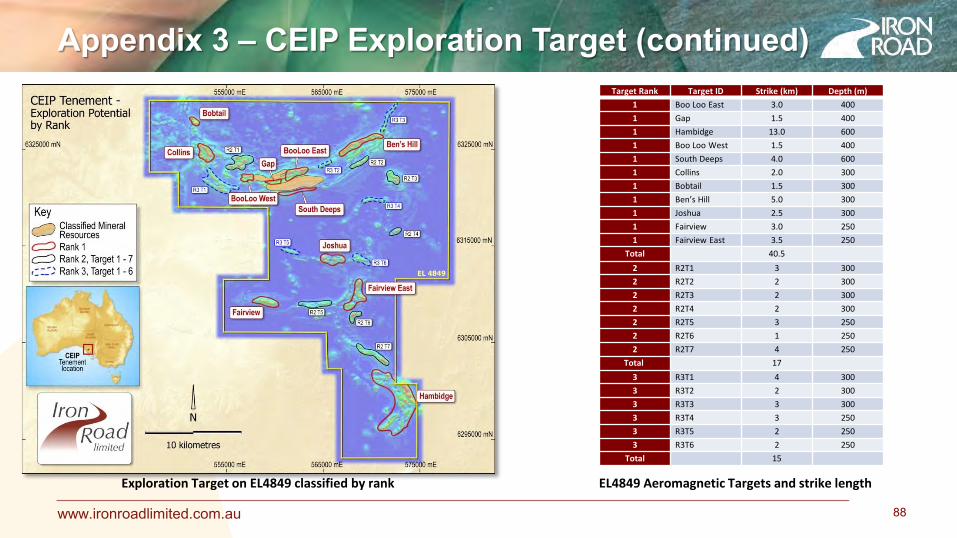
Based on the above assumptions, the interpreted exploration tonnage for the Ranked 1 & 2 targets is 9Bt to 17Bt. These targets account for 57.5km in strike length. The lower magnetic intensity targets were ranked 3 with a strike length of 15km and suggest a possible tonnage potential of 1Bt to 4Bt.
www.ironroadlimited.com.au 88
Exploration Target on EL4849 classified by rank
Target Rank Target ID Strike (km) Depth (m) 1 Boo Loo East 3.0 400 1 Gap 1.5 400 1 Hambidge 13.0 600 1 Boo Loo West 1.5 400 1 South Deeps 4.0 600 1 Collins 2.0 300 1 Bobtail 1.5 300 1 Ben’s Hill 5.0 300 1 Joshua 2.5 300 1 Fairview 3.0 250 1 Fairview East 3.5 250
Total 40.5 2 R2T1 3 300 2 R2T2 2 300 2 R2T3 2 300 2 R2T4 2 300 2 R2T5 3 250 2 R2T6 1 250 2 R2T7 4 250
Total 17 3 R3T1 4 300 3 R3T2 2 300 3 R3T3 3 300 3 R3T4 3 250 3 R3T5 2 250 3 R3T6 2 250
Total 15
EL4849 Aeromagnetic Targets and strike length
Appendix 3 – CEIP Exploration Target (continued)