census 2011
TRANSCRIPT
CENSUS OF INDIA 2011
Dr Harjot KaurAIMSR, Bathinda.
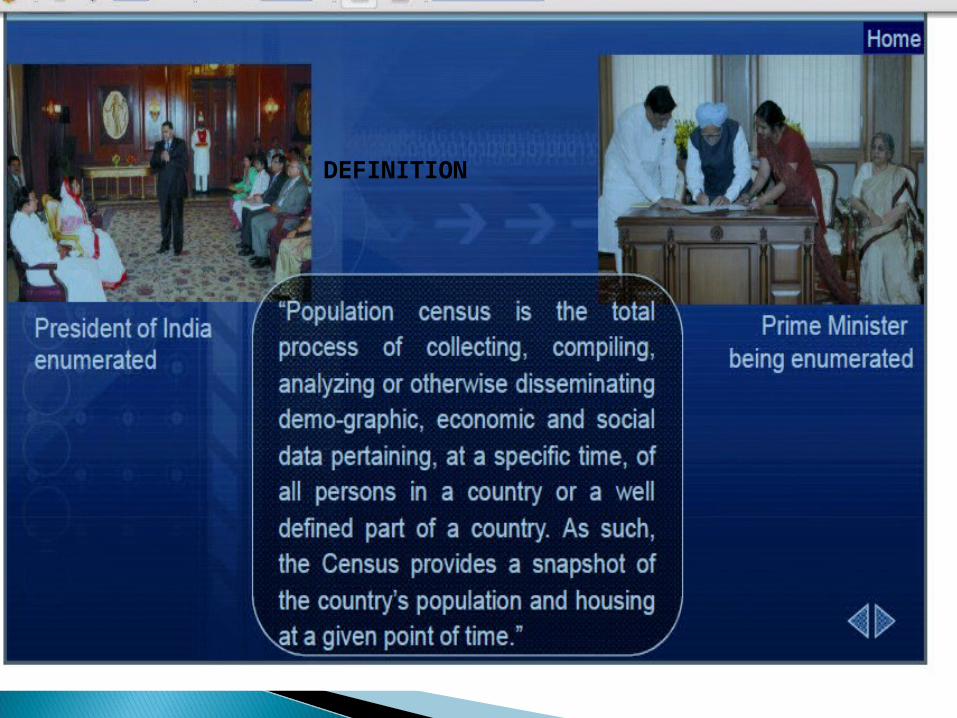
DEFINITION
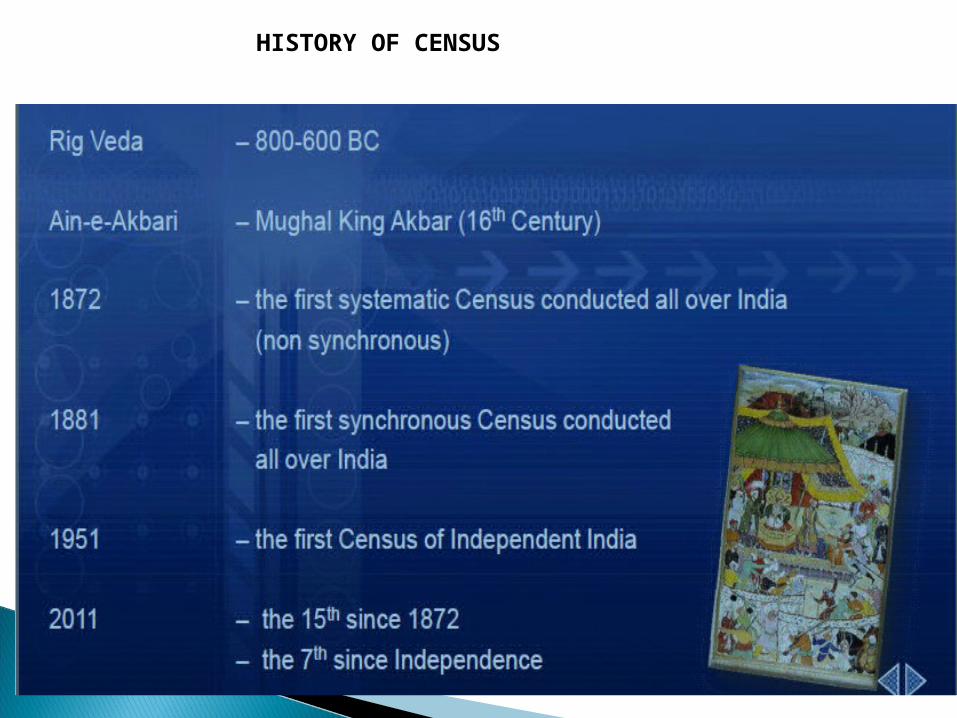
HISTORY OF CENSUS
04/18/23census4
WHY CENSUS NECESSARY?
Revising country’s progress in the past decade Monitoring ongoing scheme Plan for future Reservation of seats in constituencies –
parliament/assembly/panchayat and other local bodies
To make decisions regarding public welfare Census data is also used by international
agencies,scholars,business people,industrialist s etc.
04/18/23census7
Who conducts census?
04/18/23census9
04/18/23census10
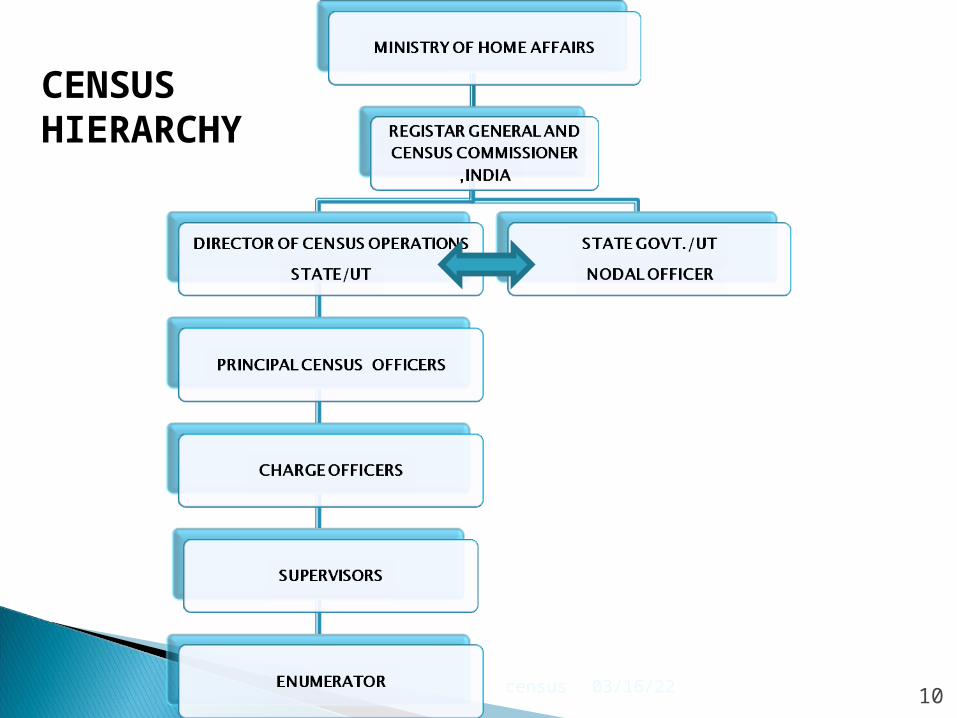
CENSUS HIERARCHY
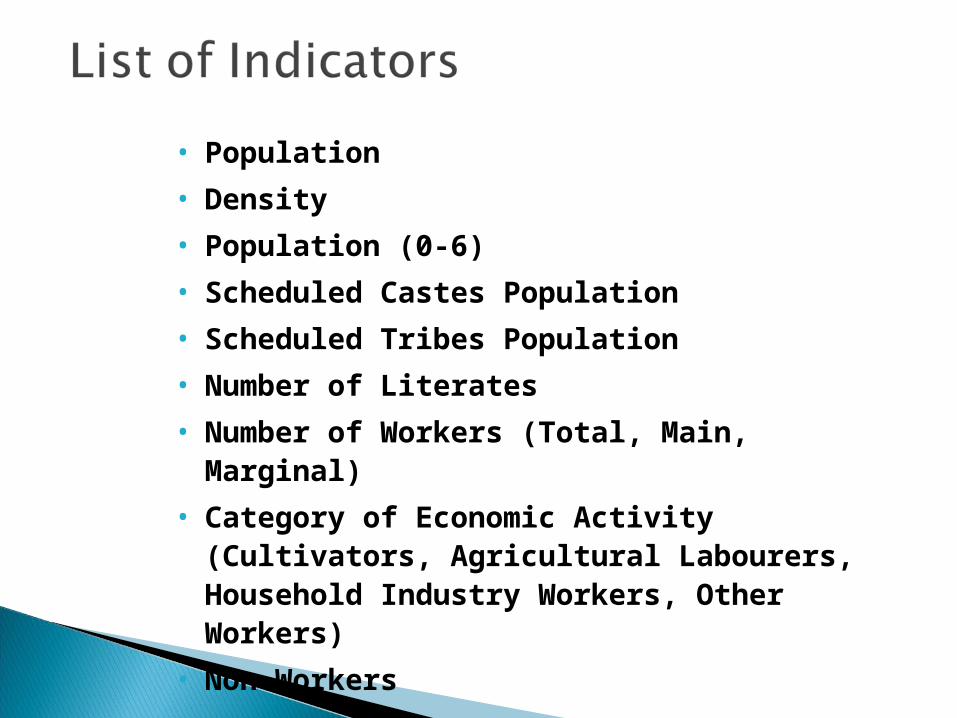
• Population
• Density
• Population (0-6)
• Scheduled Castes Population
• Scheduled Tribes Population
• Number of Literates
• Number of Workers (Total, Main, Marginal)
• Category of Economic Activity (Cultivators, Agricultural Labourers, Household Industry Workers, Other Workers)
• Non Workers
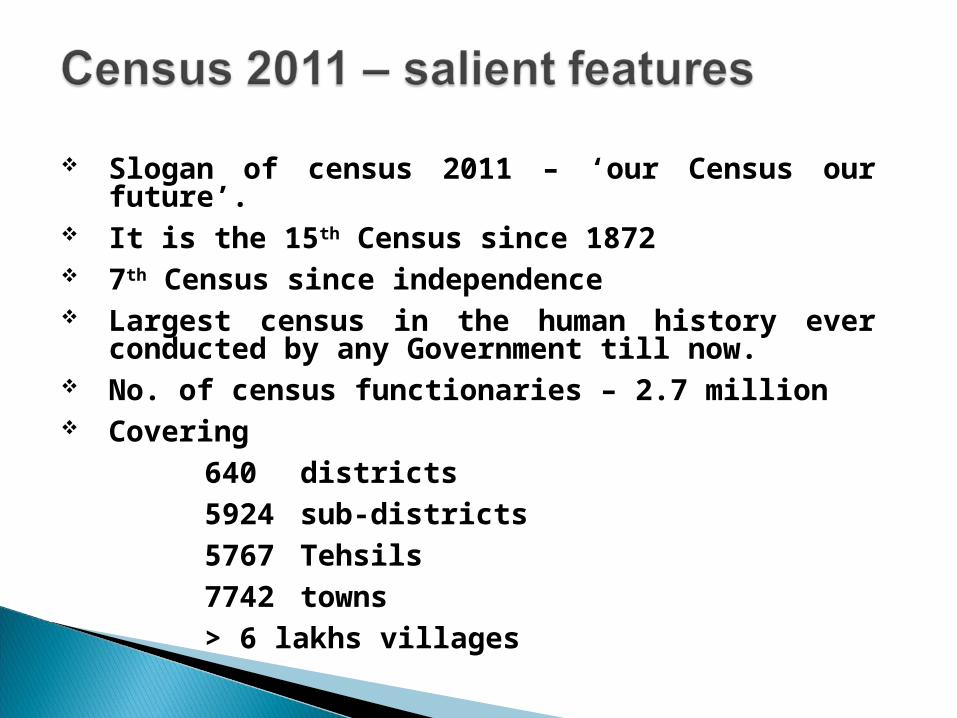
Slogan of census 2011 – ‘our Census our future’. It is the 15th Census since 1872 7th Census since independence Largest census in the human history ever conducted
by any Government till now. No. of census functionaries – 2.7 million Covering
640 districts
5924 sub-districts
5767 Tehsils
7742 towns
> 6 lakhs villages
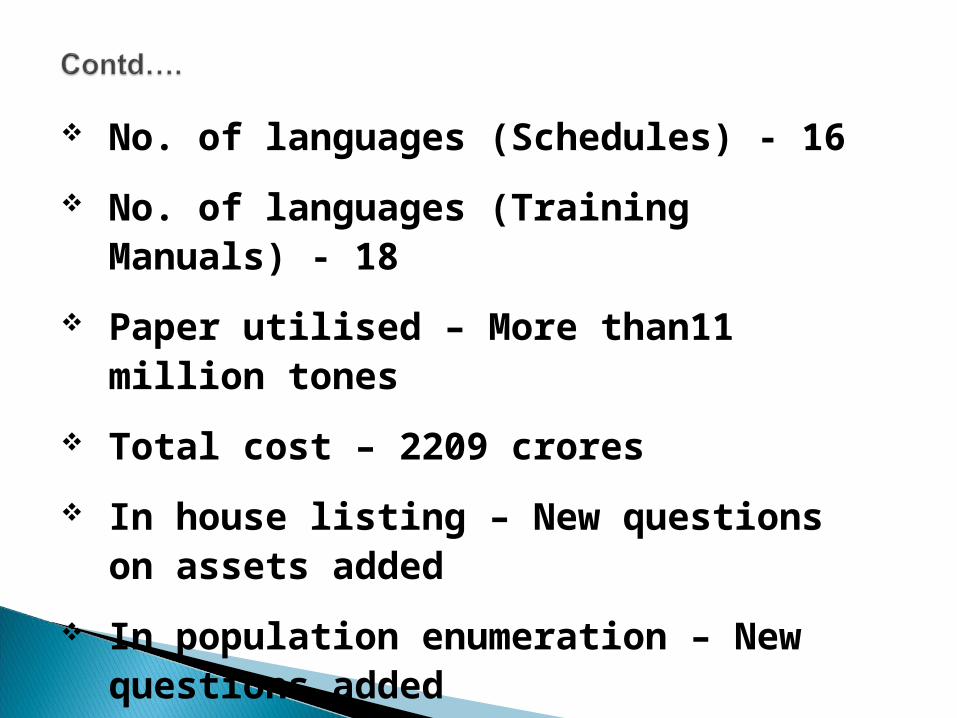
No. of languages (Schedules) - 16
No. of languages (Training Manuals) - 18
Paper utilised – More than11 million tones
Total cost – 2209 crores
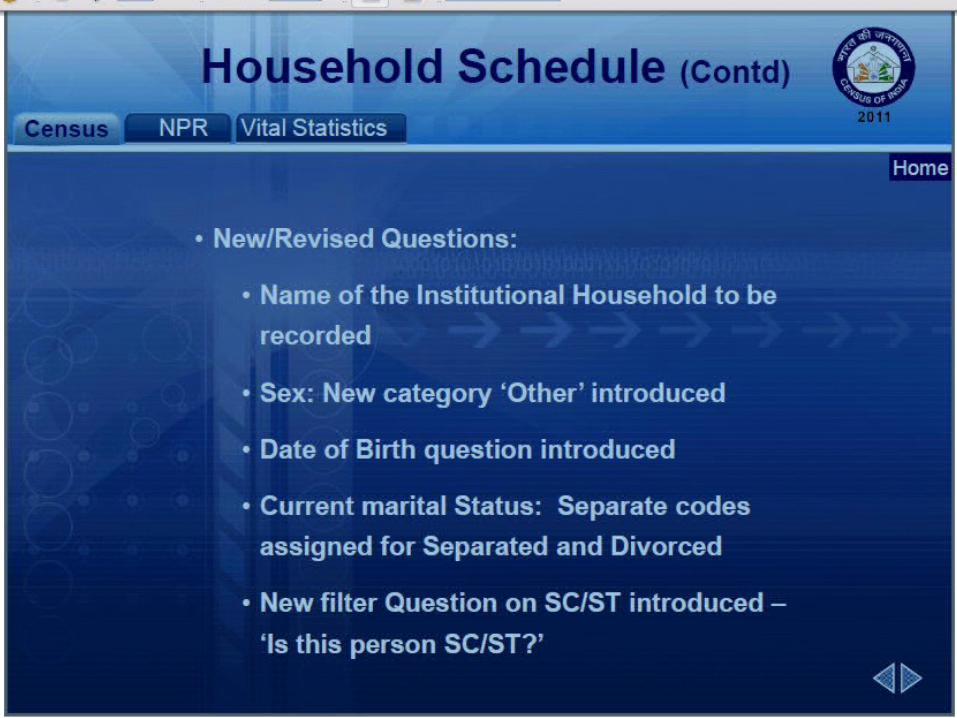
In house listing – New questions on assets added
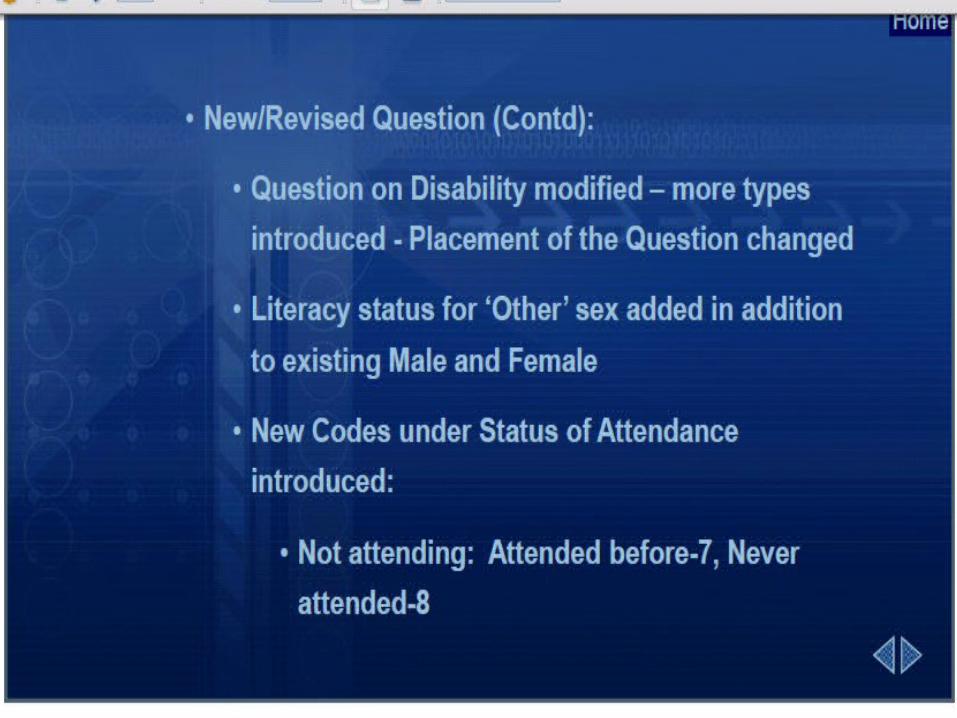
In population enumeration – New questions added
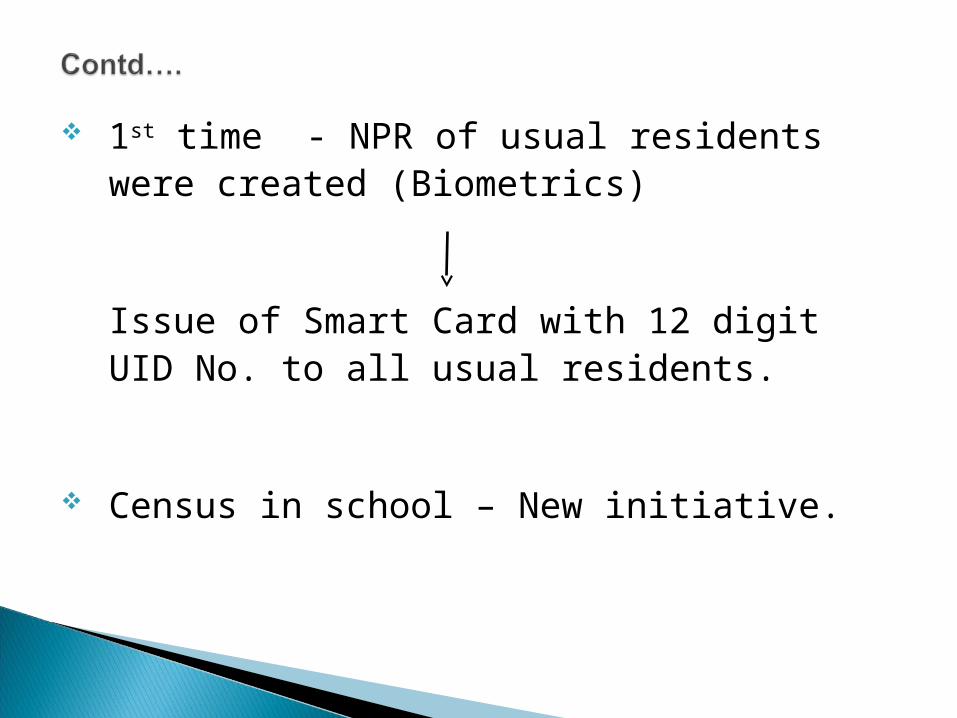
1st time - NPR of usual residents were created (Biometrics)
Issue of Smart Card with 12 digit UID No. to all usual residents.
Census in school – New initiative.
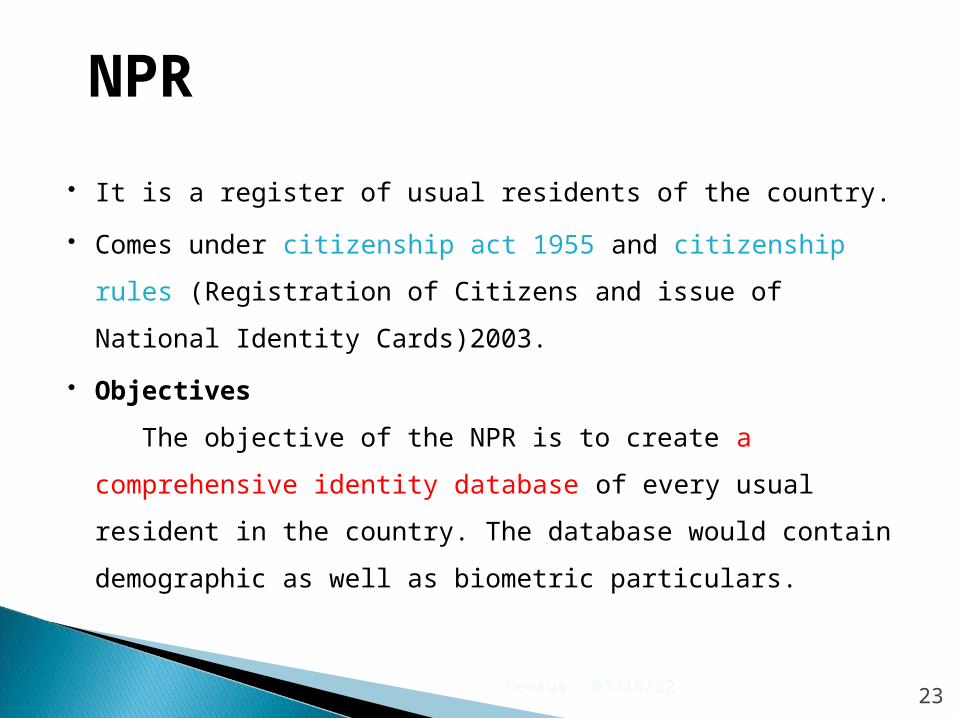
It is a register of usual residents of the country.
Comes under citizenship act 1955 and citizenship rules
(Registration of Citizens and issue of National Identity
Cards)2003.
Objectives
The objective of the NPR is to create a comprehensive
identity database of every usual resident in the country.
The database would contain demographic as well as
biometric particulars.
04/18/23census23
NPR
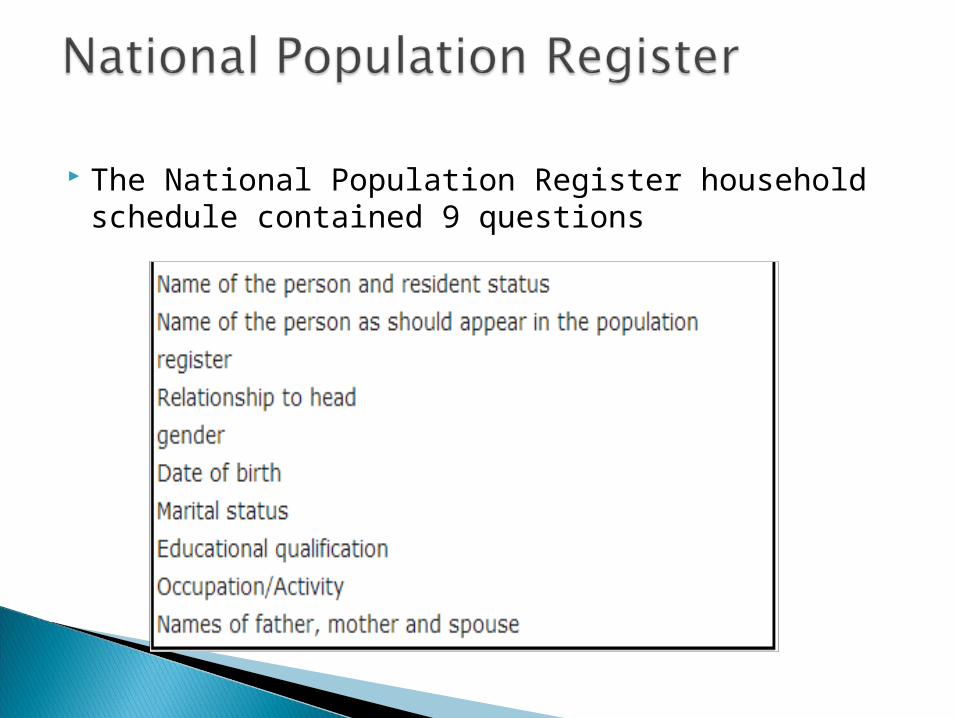
The National Population Register household schedule contained 9 questions
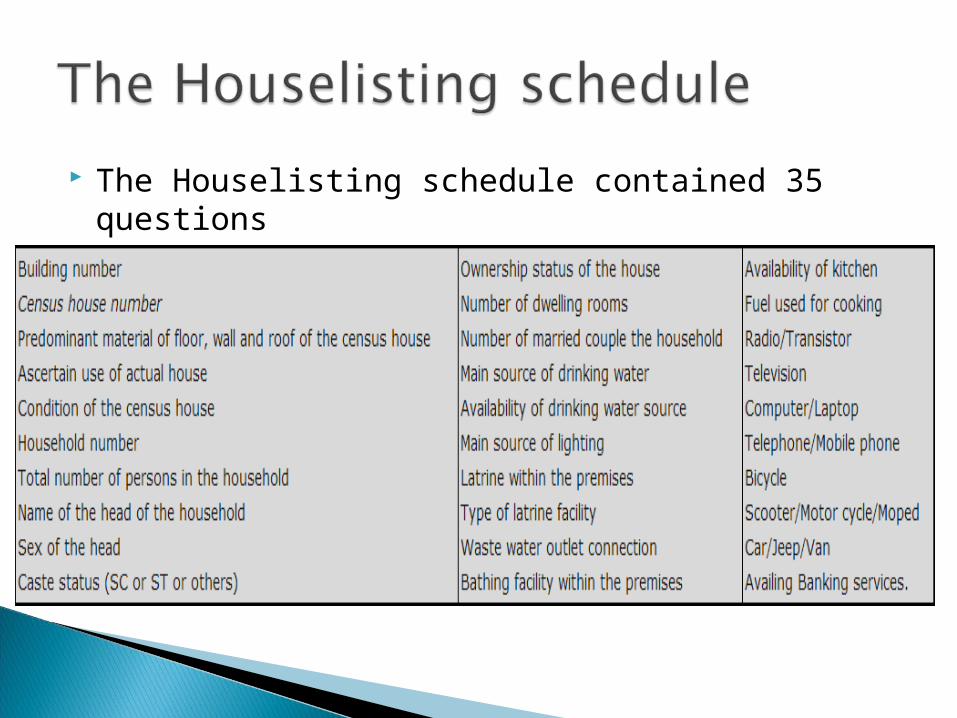
The Houselisting schedule contained 35 questions
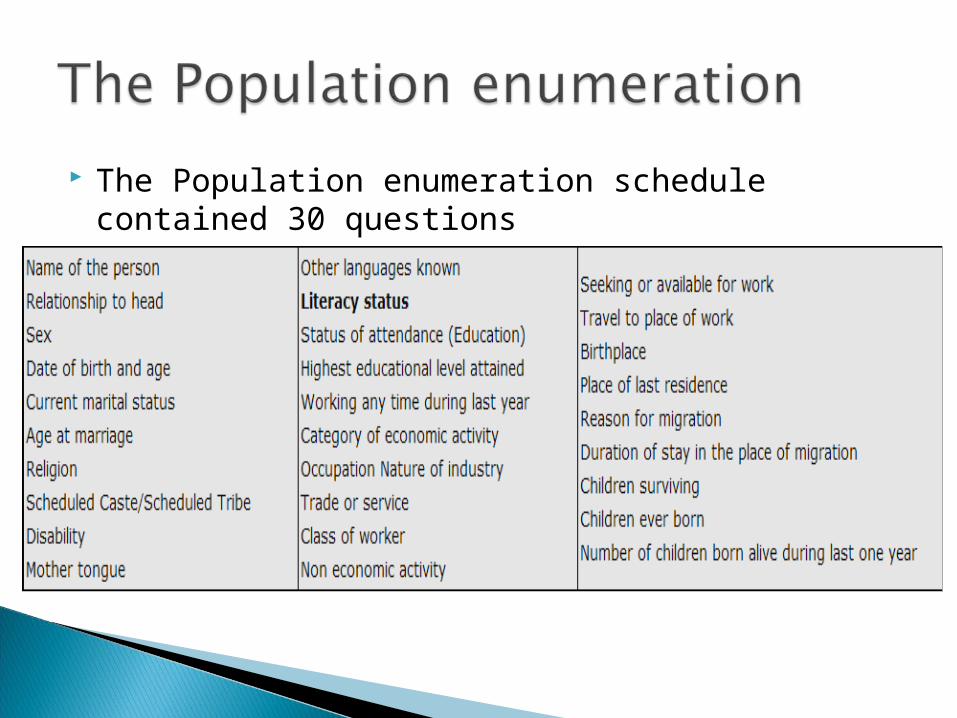
The Population enumeration schedule contained 30 questions

DATA HIGHLIGHTS
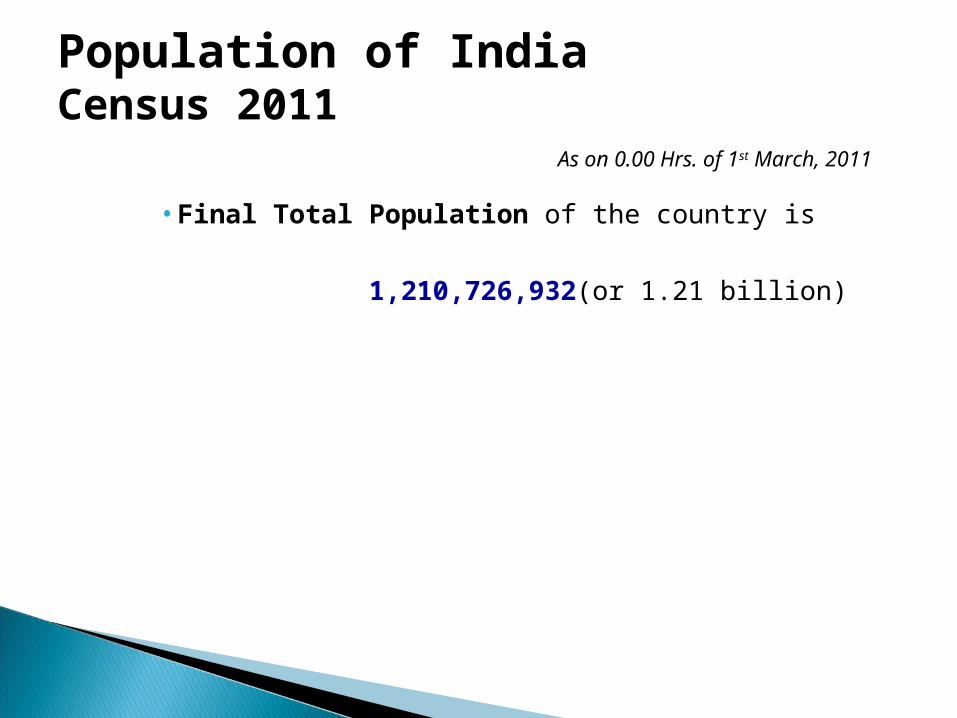
Population of IndiaCensus 2011
• Final Total Population of the country is
1,210,726,932(or 1.21 billion)
As on 0.00 Hrs. of 1st March, 2011
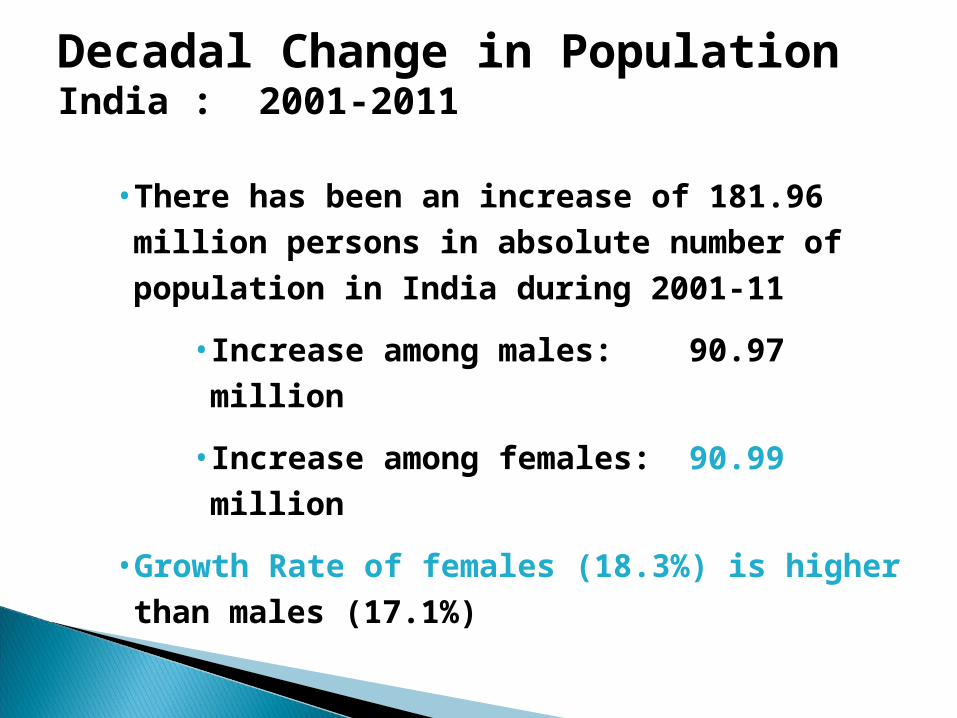
Decadal Change in PopulationIndia : 2001-2011
• There has been an increase of 181.96 million persons in absolute number of population in India during 2001-11
• Increase among males: 90.97 million
• Increase among females: 90.99 million
• Growth Rate of females (18.3%) is higher than males (17.1%)
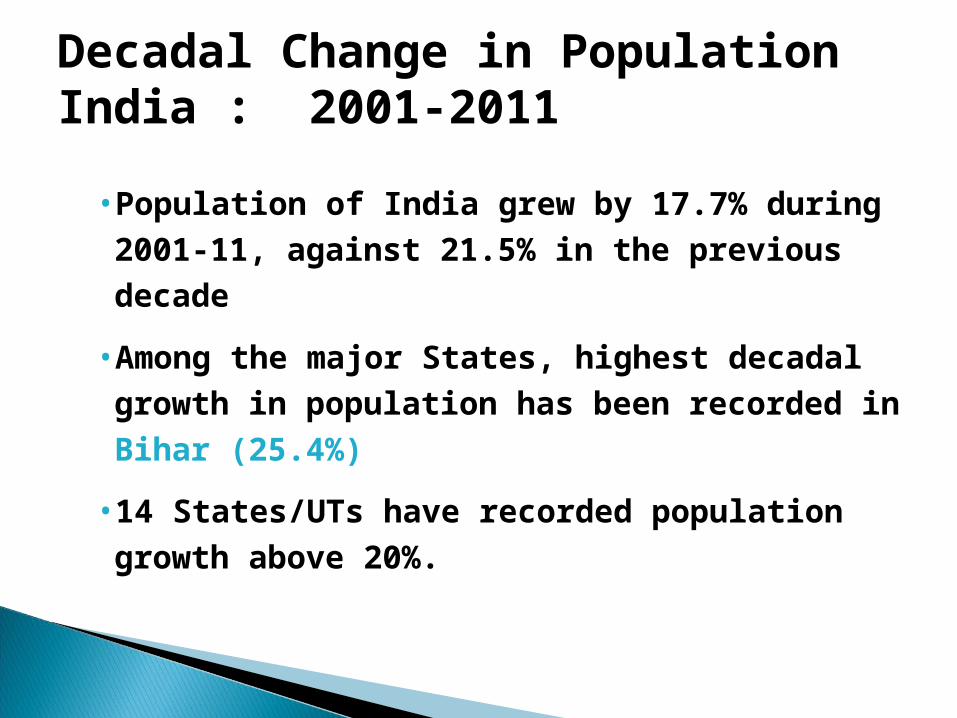
Decadal Change in PopulationIndia : 2001-2011
• Population of India grew by 17.7% during 2001-11, against 21.5% in the previous decade
• Among the major States, highest decadal growth in population has been recorded in Bihar (25.4%)
• 14 States/UTs have recorded population growth above 20%.
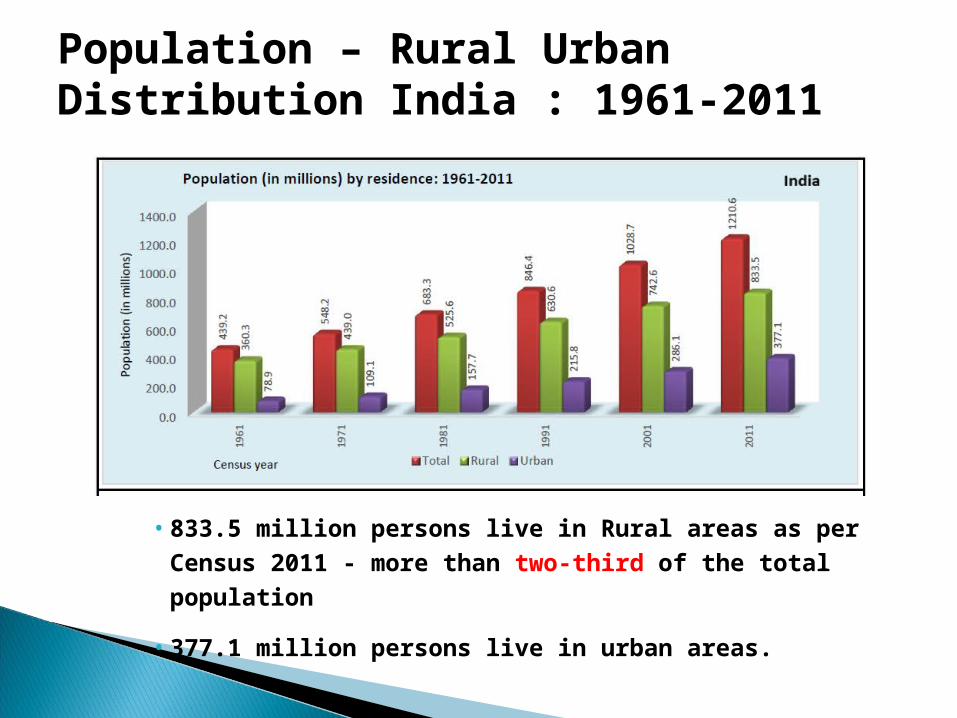
• 833.5 million persons live in Rural areas as per Census 2011 - more than two-third of the total population
• 377.1 million persons live in urban areas.
Population – Rural Urban Distribution India : 1961-2011
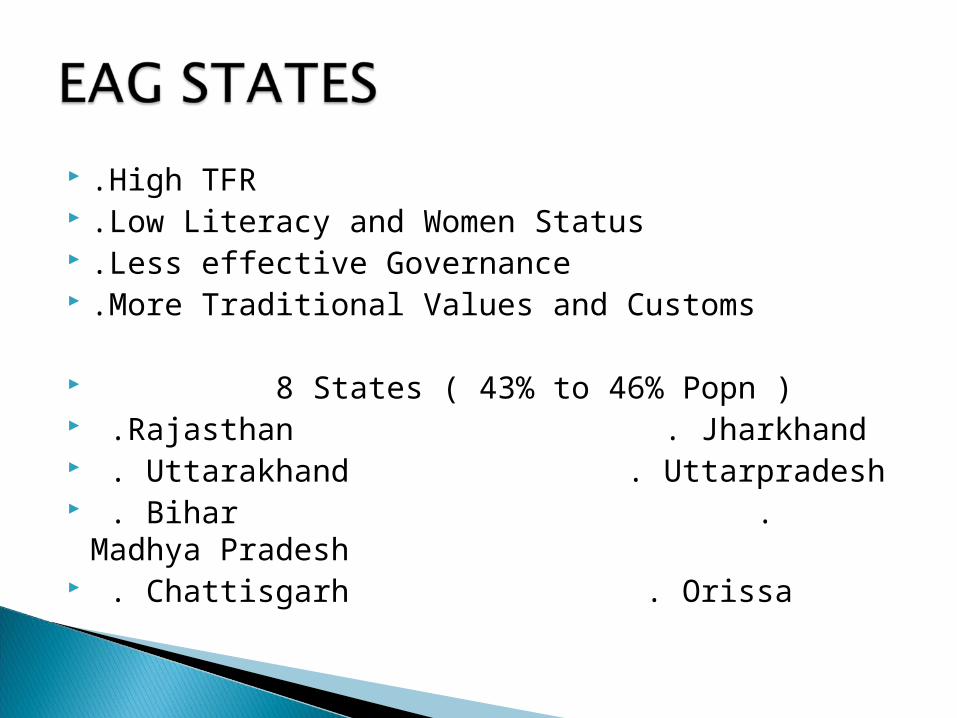
.High TFR .Low Literacy and Women Status .Less effective Governance .More Traditional Values and Customs
8 States ( 43% to 46% Popn ) .Rajasthan . Jharkhand . Uttarakhand . Uttarpradesh . Bihar . Madhya Pradesh . Chattisgarh . Orissa
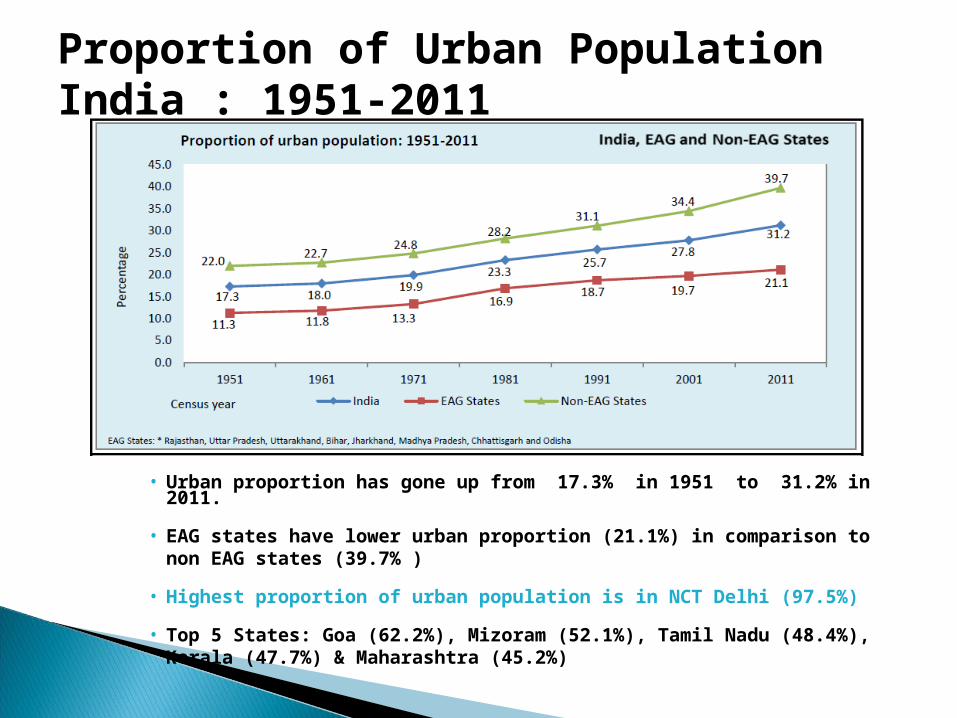
Proportion of Urban PopulationIndia : 1951-2011
• Urban proportion has gone up from 17.3% in 1951 to 31.2% in 2011.
• EAG states have lower urban proportion (21.1%) in comparison to non EAG states (39.7% )
• Highest proportion of urban population is in NCT Delhi (97.5%)
• Top 5 States: Goa (62.2%), Mizoram (52.1%), Tamil Nadu (48.4%), Kerala (47.7%) & Maharashtra (45.2%)
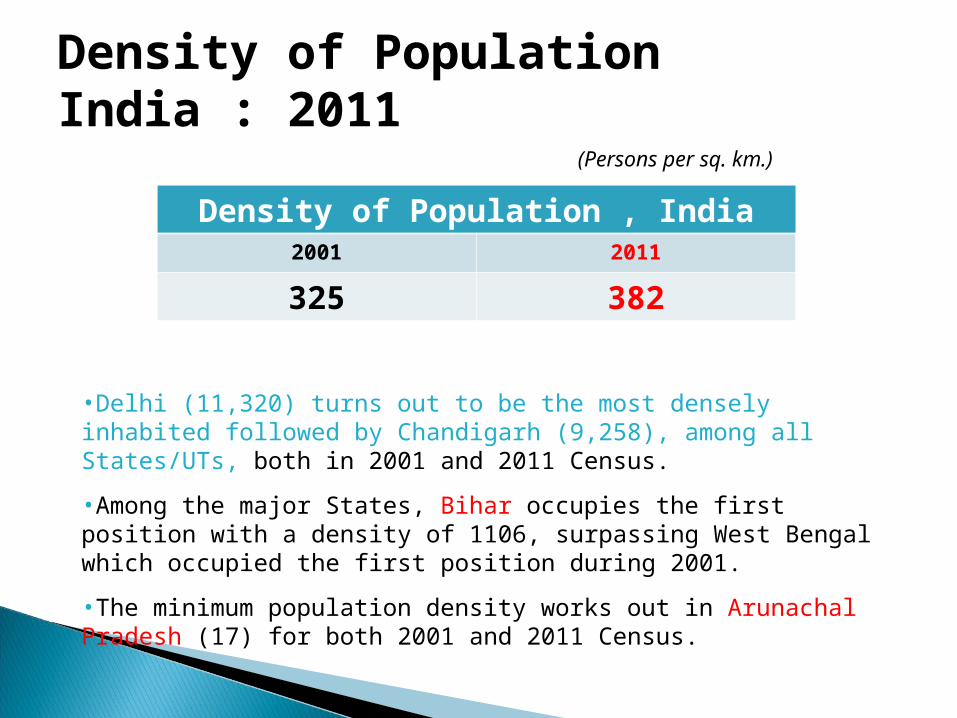
Density of PopulationIndia : 2011
•Delhi (11,320) turns out to be the most densely inhabited followed by Chandigarh (9,258), among all States/UTs, both in 2001 and 2011 Census.
•Among the major States, Bihar occupies the first position with a density of 1106, surpassing West Bengal which occupied the first position during 2001.
•The minimum population density works out in Arunachal Pradesh (17) for both 2001 and 2011 Census.
Density of Population , India2001 2011
325 382
(Persons per sq. km.)
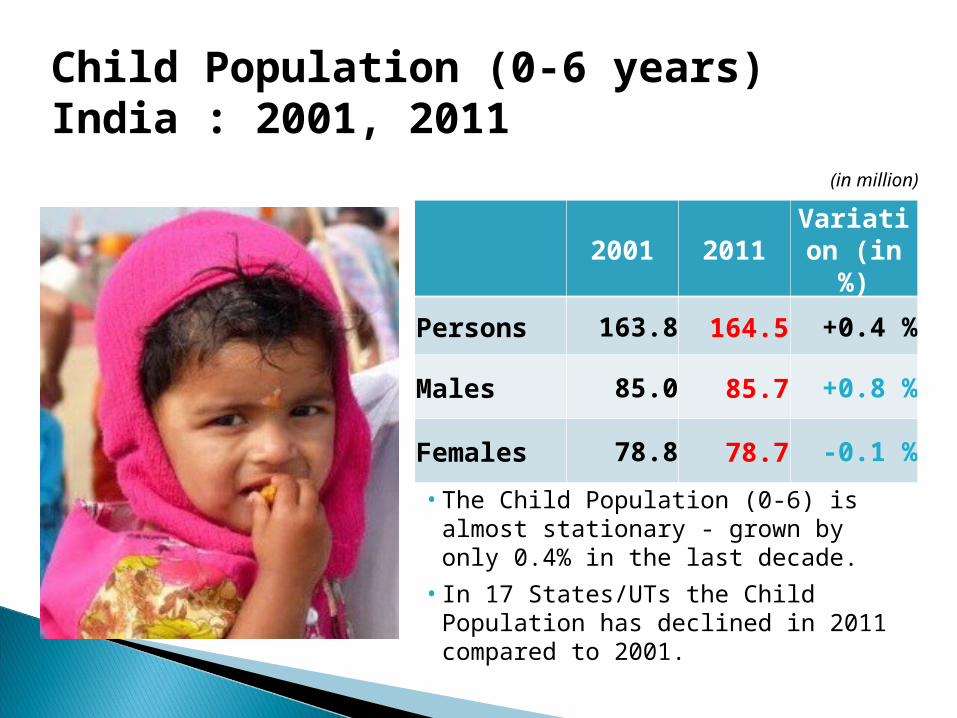
Child Population (0-6 years)India : 2001, 2011
2001 2011Variation (in %)
Persons 163.8 164.5 +0.4 %
Males 85.0 85.7 +0.8 %
Females 78.8 78.7 -0.1 %
• The Child Population (0-6) is almost stationary - grown by only 0.4% in the last decade.
• In 17 States/UTs the Child Population has declined in 2011 compared to 2001.
(in million)
Sex Composition of Child Population(0-6) – India 2011
• The total number of children in India is 164.5 millions, about 660 thousand more than the number recorded in 2001
• Male Child (0-6) population has increased whereas Female Child population has decreased marginally during 2001-11
• 8 States, viz. Jammu & Kashmir, Rajasthan, Uttar Pradesh, Bihar, Jharkhand, Arunachal Pradesh, Mizoram, Meghalaya have proportion of child population more than 15 percent.
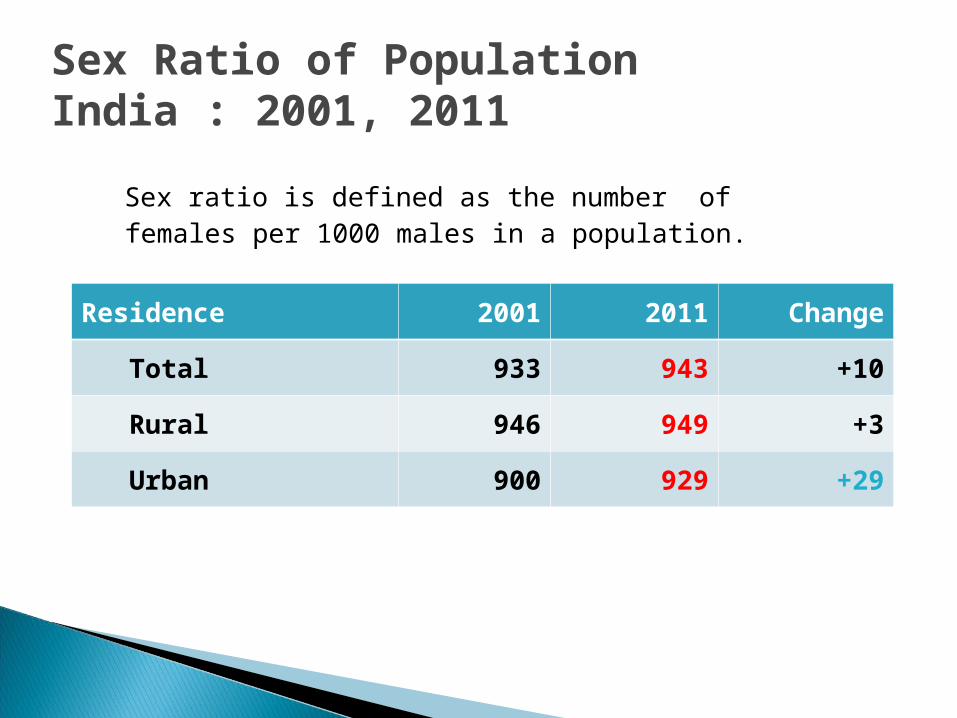
Sex Ratio of PopulationIndia : 2001, 2011
Sex ratio is defined as the number of females per 1000 males in a population.
Residence 2001 2011 Change
Total 933 943 +10
Rural 946 949 +3
Urban 900 929 +29
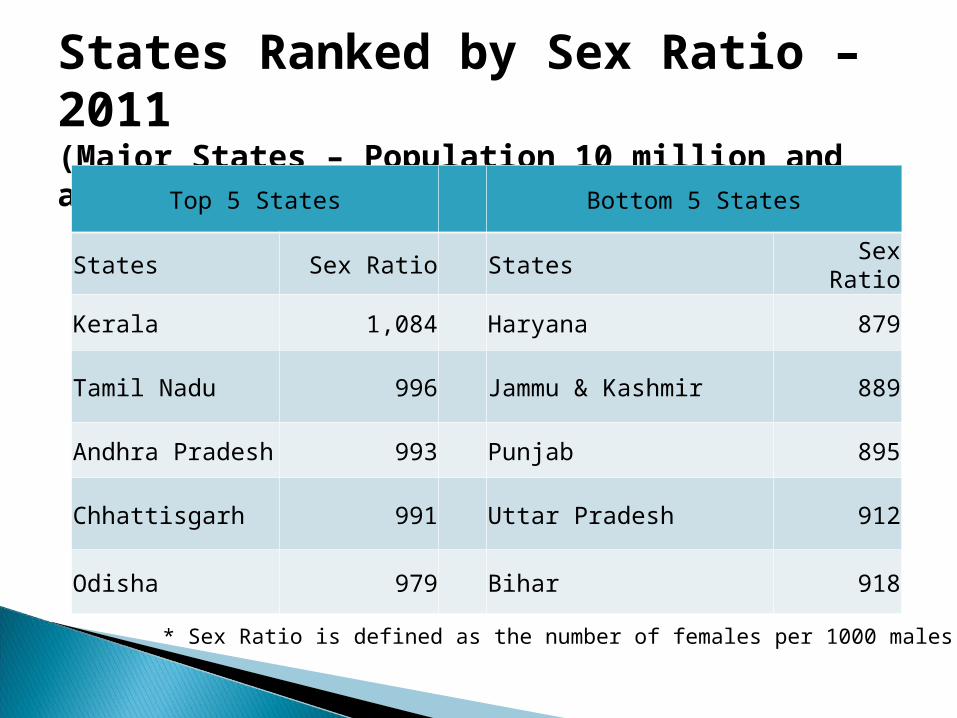
States Ranked by Sex Ratio – 2011(Major States – Population 10 million and above)Top 5 States Bottom 5 States
States Sex Ratio States Sex Ratio
Kerala 1,084 Haryana 879
Tamil Nadu 996 Jammu & Kashmir 889
Andhra Pradesh 993 Punjab 895
Chhattisgarh 991 Uttar Pradesh 912
Odisha 979 Bihar 918
* Sex Ratio is defined as the number of females per 1000 males
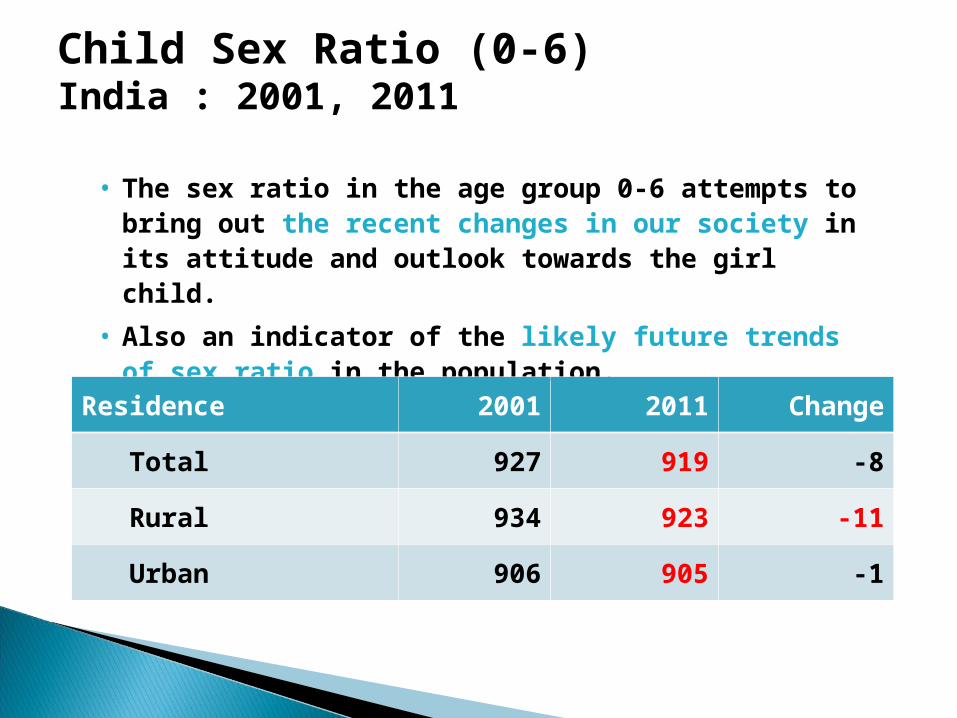
Child Sex Ratio (0-6)India : 2001, 2011
• The sex ratio in the age group 0-6 attempts to bring out the recent changes in our society in its attitude and outlook towards the girl child.
• Also an indicator of the likely future trends of sex ratio in the population.
Residence 2001 2011 Change
Total 927 919 -8
Rural 934 923 -11
Urban 906 905 -1
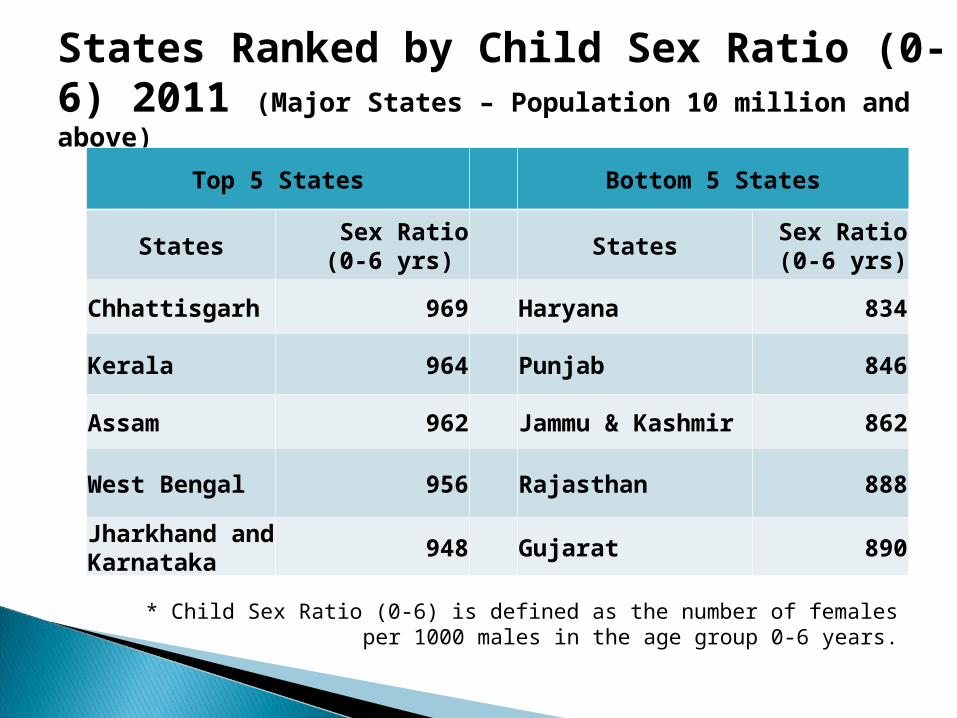
States Ranked by Child Sex Ratio (0-6) 2011 (Major States – Population 10 million and above)
Top 5 States Bottom 5 States
StatesSex Ratio(0-6 yrs)
StatesSex Ratio(0-6 yrs)
Chhattisgarh 969 Haryana 834
Kerala 964 Punjab 846
Assam 962Jammu & Kashmir
862
West Bengal 956 Rajasthan 888
Jharkhand and Karnataka
948 Gujarat 890
* Child Sex Ratio (0-6) is defined as the number of femalesper 1000 males in the age group 0-6 years.
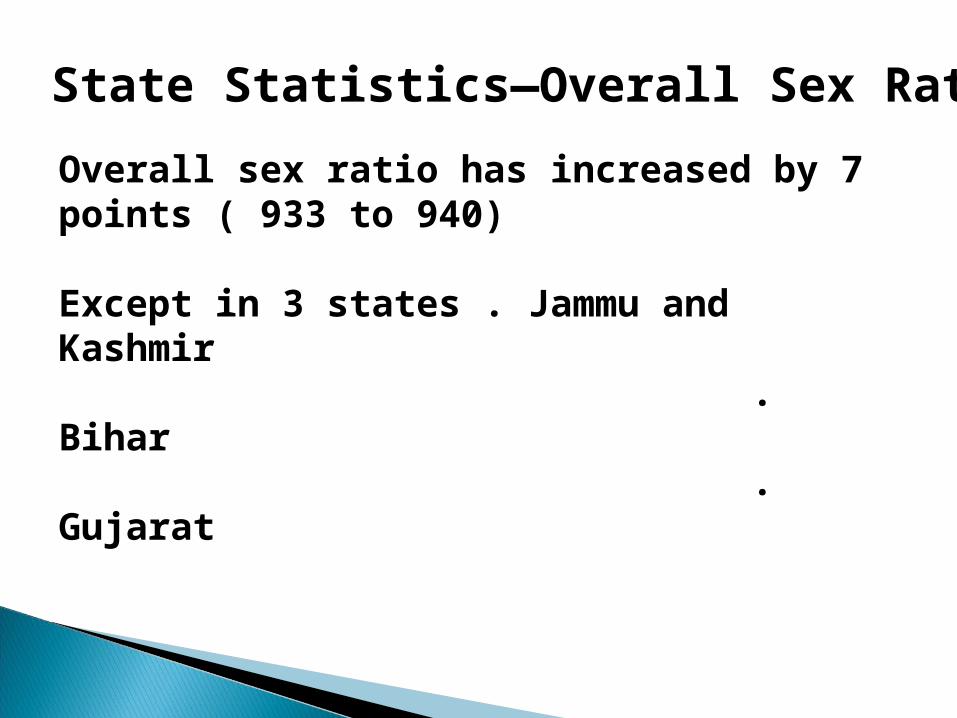
Overall sex ratio has increased by 7 points ( 933 to 940) Except in 3 states . Jammu and Kashmir . Bihar . Gujarat
State Statistics—Overall Sex Ratio
Scheduled Caste Scheduled Caste (SC)(SC) & &
Scheduled Tribe Scheduled Tribe (ST)(ST)
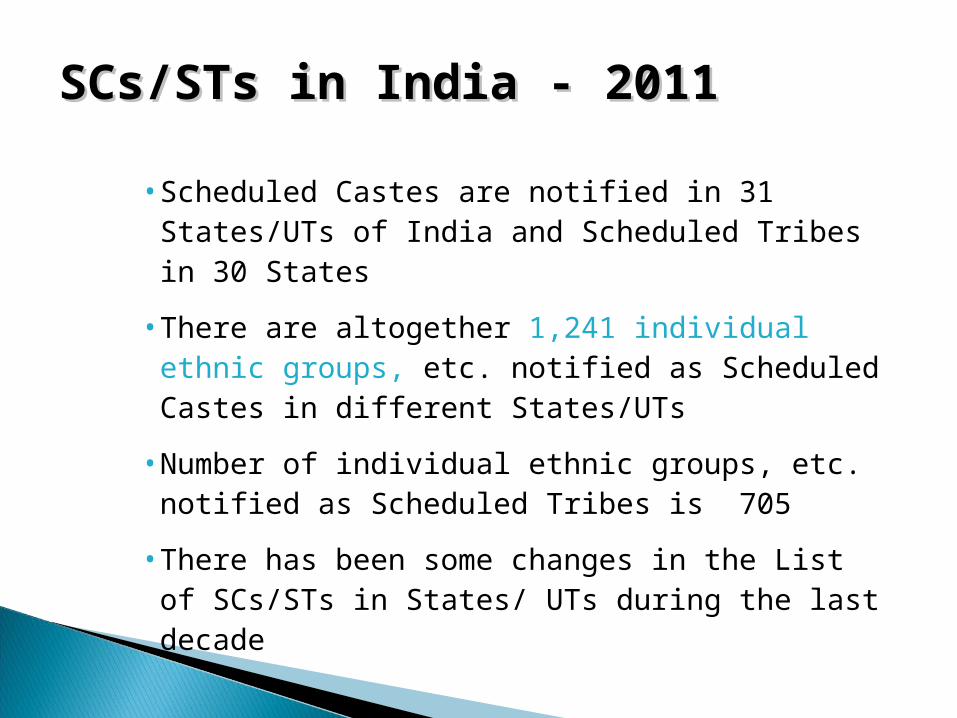
SCs/STs in India - 2011SCs/STs in India - 2011
• Scheduled Castes are notified in 31 States/UTs of India and Scheduled Tribes in 30 States
• There are altogether 1,241 individual ethnic groups, etc. notified as Scheduled Castes in different States/UTs
• Number of individual ethnic groups, etc. notified as Scheduled Tribes is 705
• There has been some changes in the List of SCs/STs in States/ UTs during the last decade
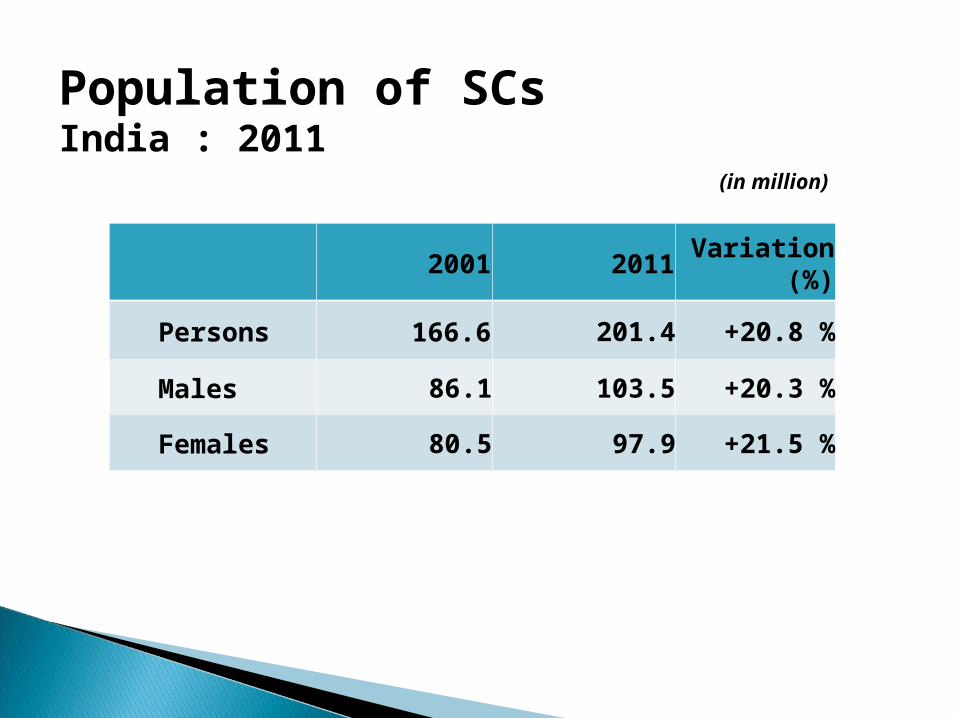
Population of SCsIndia : 2011
2001 2011Variation
(%)
Persons 166.6 201.4 +20.8 %
Males 86.1 103.5 +20.3 %
Females 80.5 97.9 +21.5 %
(in million)
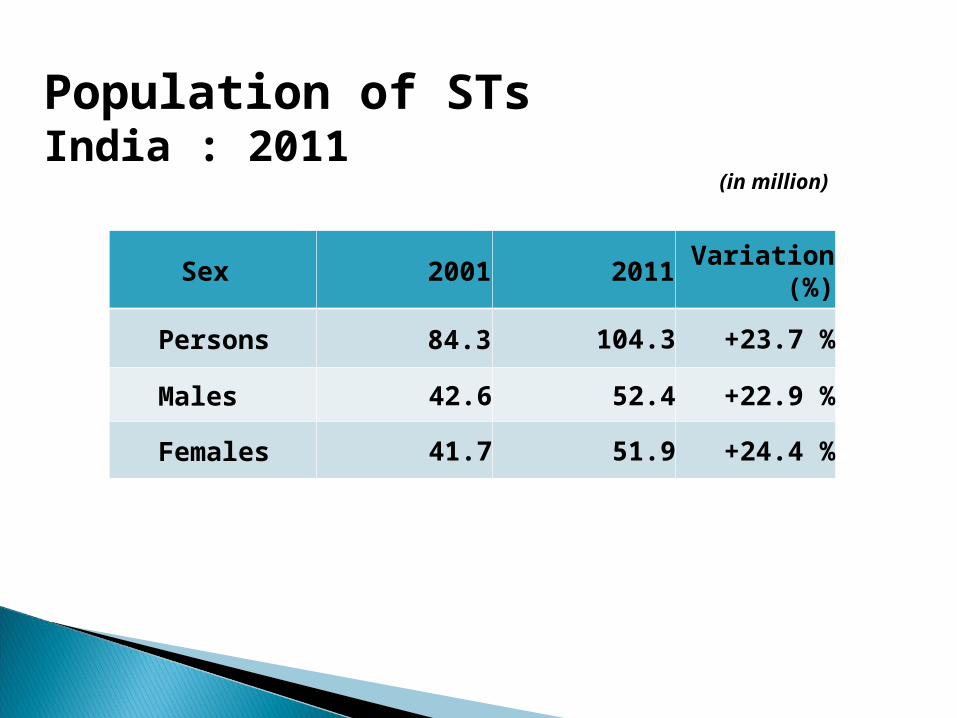
Population of STsIndia : 2011
Sex 2001 2011Variation
(%)
Persons 84.3 104.3 +23.7 %
Males 42.6 52.4 +22.9 %
Females 41.7 51.9 +24.4 %
(in million)
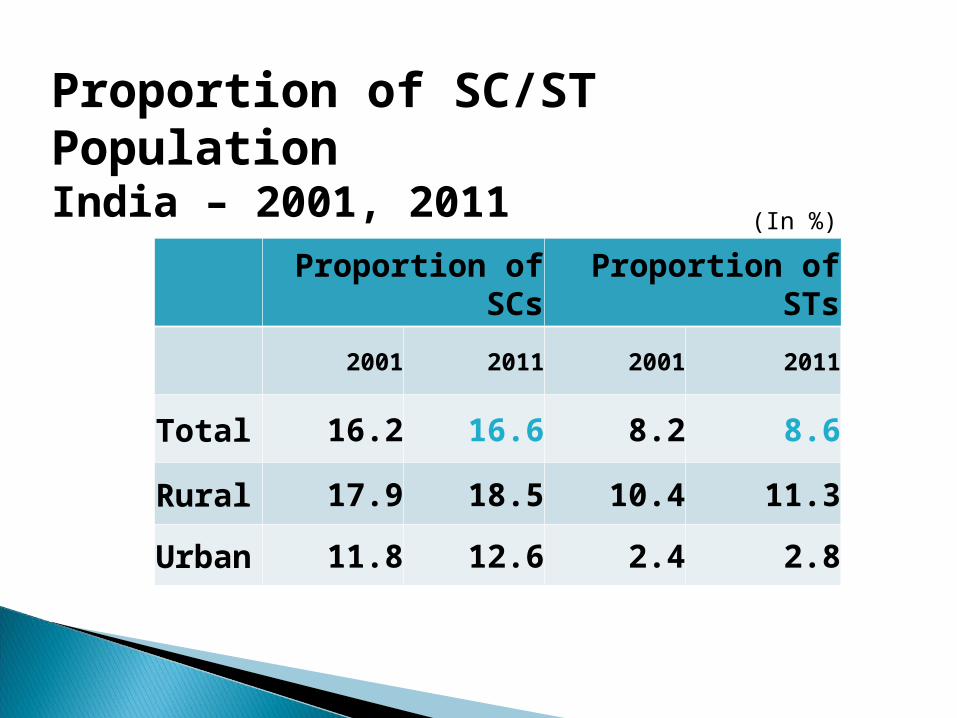
Proportion of SC/ST PopulationIndia – 2001, 2011
Proportion of
SCsProportion of
STs
2001 2011 2001 2011
Total 16.2 16.6 8.2 8.6
Rural 17.9 18.5 10.4 11.3
Urban
11.8 12.6 2.4 2.8
(In %)
(In %)
(In %)

States/UTs Ranked by Proportion of SCs - 2011
Top 5 States/UTs Bottom 5 States/UTs
Punjab 31.9% Mizoram 0.1%
Himachal Pradesh 25.2% Meghalaya 0.6%
West Bengal 23.5% Goa 1.7%
Uttar Pradesh 20.7%Dadra & Nagar Haveli
1.8%
Haryana 20.2% Daman & Diu 2.5%
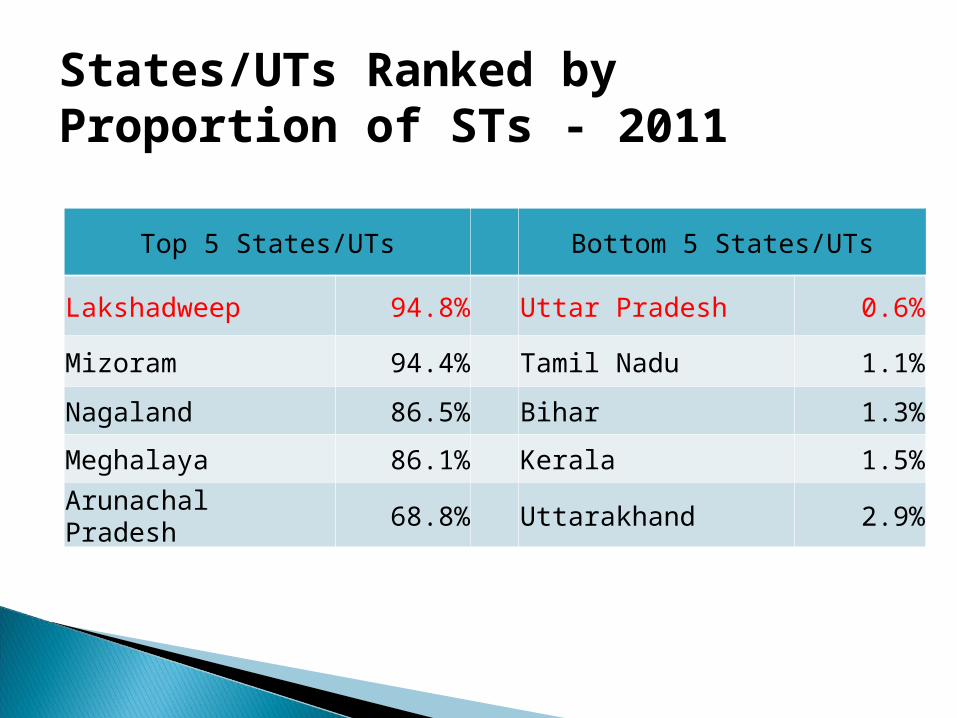
Top 5 States/UTs Bottom 5 States/UTs
Lakshadweep 94.8% Uttar Pradesh 0.6%
Mizoram 94.4% Tamil Nadu 1.1%
Nagaland 86.5% Bihar 1.3%
Meghalaya 86.1% Kerala 1.5%
Arunachal Pradesh 68.8% Uttarakhand 2.9%
States/UTs Ranked by Proportion of STs - 2011
LiteratesLiterates & &
Literacy RatesLiteracy Rates
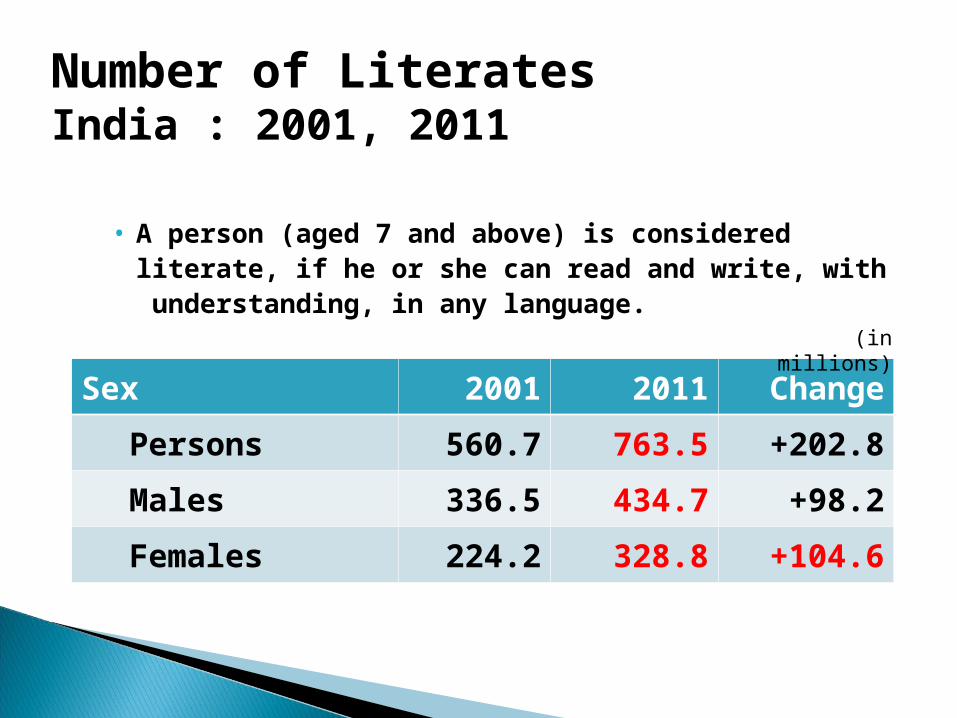
Number of LiteratesIndia : 2001, 2011
• A person (aged 7 and above) is considered literate, if he or she can read and write, with understanding, in any language.
Sex 2001 2011 Change
Persons 560.7 763.5 +202.8
Males 336.5 434.7 +98.2
Females 224.2 328.8 +104.6
(in millions)
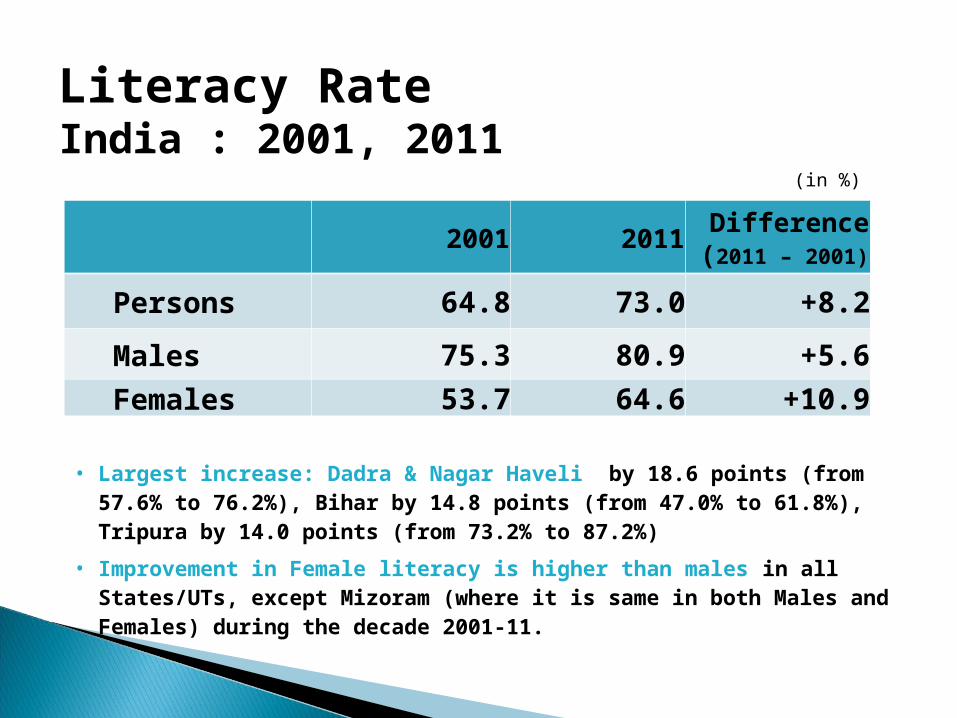
Literacy Rate India : 2001, 2011
2001 2011Difference
(2011 – 2001)
Persons 64.8 73.0 +8.2
Males 75.3 80.9 +5.6
Females 53.7 64.6 +10.9
(in %)
• Largest increase: Dadra & Nagar Haveli by 18.6 points (from 57.6% to 76.2%), Bihar by 14.8 points (from 47.0% to 61.8%), Tripura by 14.0 points (from 73.2% to 87.2%)
• Improvement in Female literacy is higher than males in all States/UTs, except Mizoram (where it is same in both Males and Females) during the decade 2001-11.
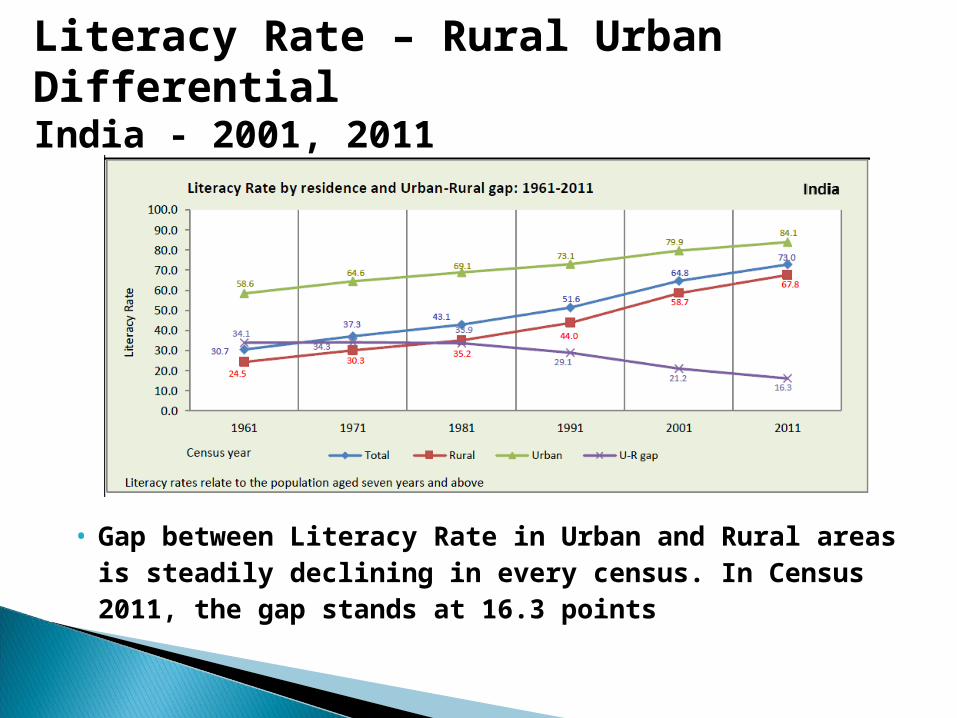
Literacy Rate – Rural Urban DifferentialIndia - 2001, 2011
• Gap between Literacy Rate in Urban and Rural areas is steadily declining in every census. In Census 2011, the gap stands at 16.3 points
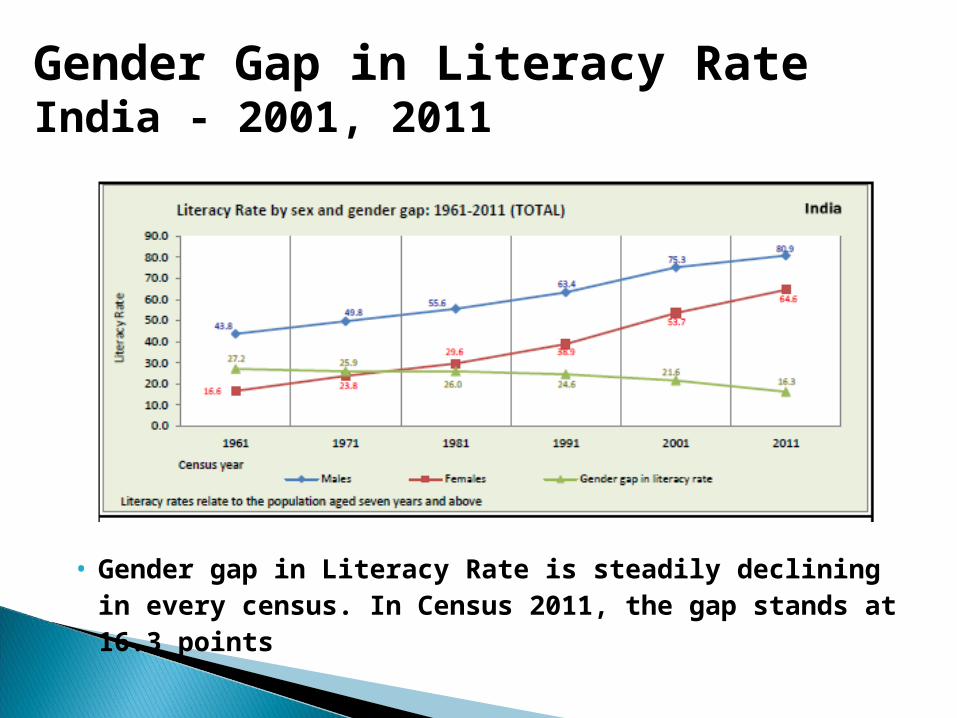
Gender Gap in Literacy Rate India - 2001, 2011
• Gender gap in Literacy Rate is steadily declining in every census. In Census 2011, the gap stands at 16.3 points
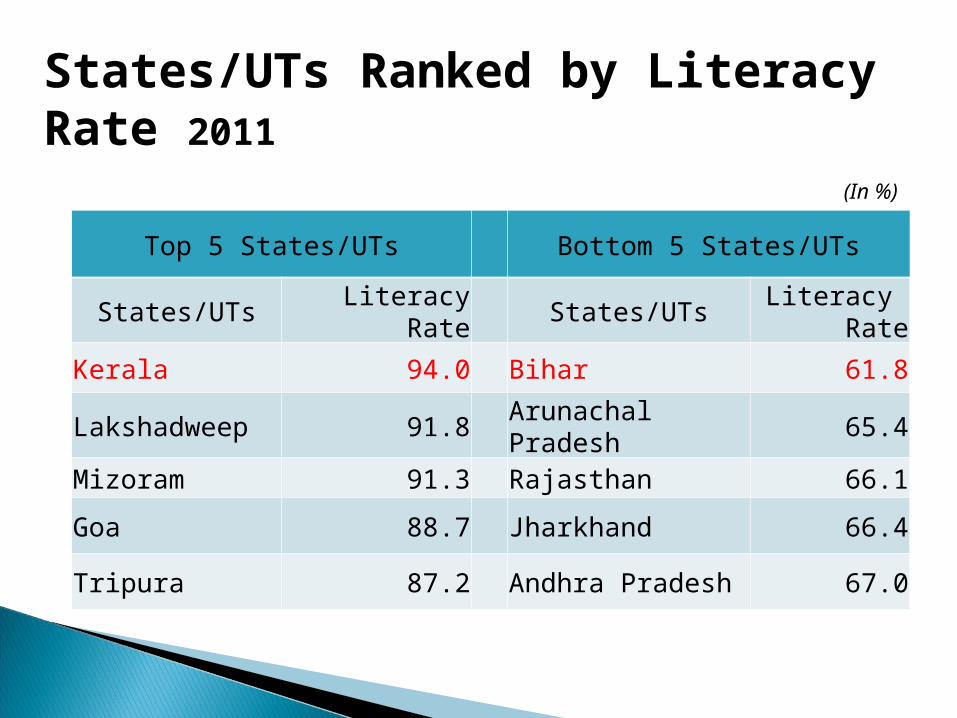
States/UTs Ranked by Literacy Rate 2011
Top 5 States/UTs Bottom 5 States/UTs
States/UTsLiteracy
RateStates/UTs
Literacy Rate
Kerala 94.0 Bihar 61.8
Lakshadweep 91.8Arunachal Pradesh
65.4
Mizoram 91.3 Rajasthan 66.1
Goa 88.7 Jharkhand 66.4
Tripura 87.2 Andhra Pradesh 67.0
(In %)
Workers, Workers, Work Participation Work Participation
Rate (WPR) Rate (WPR) & &
Categories of Categories of Economic ActivityEconomic Activity
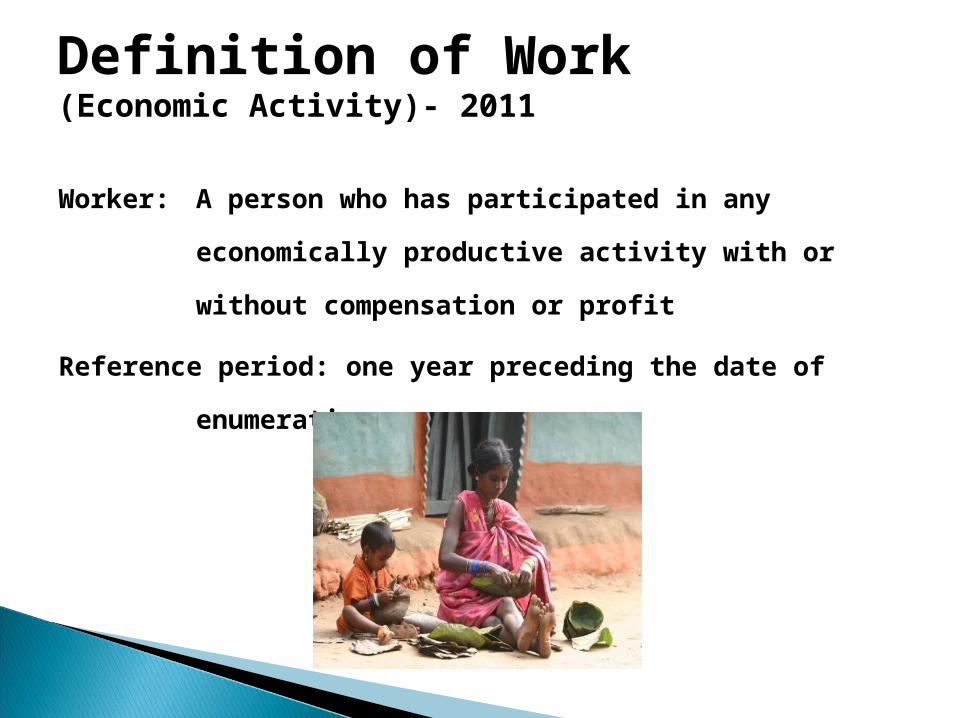
Definition of Work(Economic Activity)- 2011
Worker: A person who has participated in any
economically productive activity with or without
compensation or profit
Reference period: one year preceding the date of
enumeration
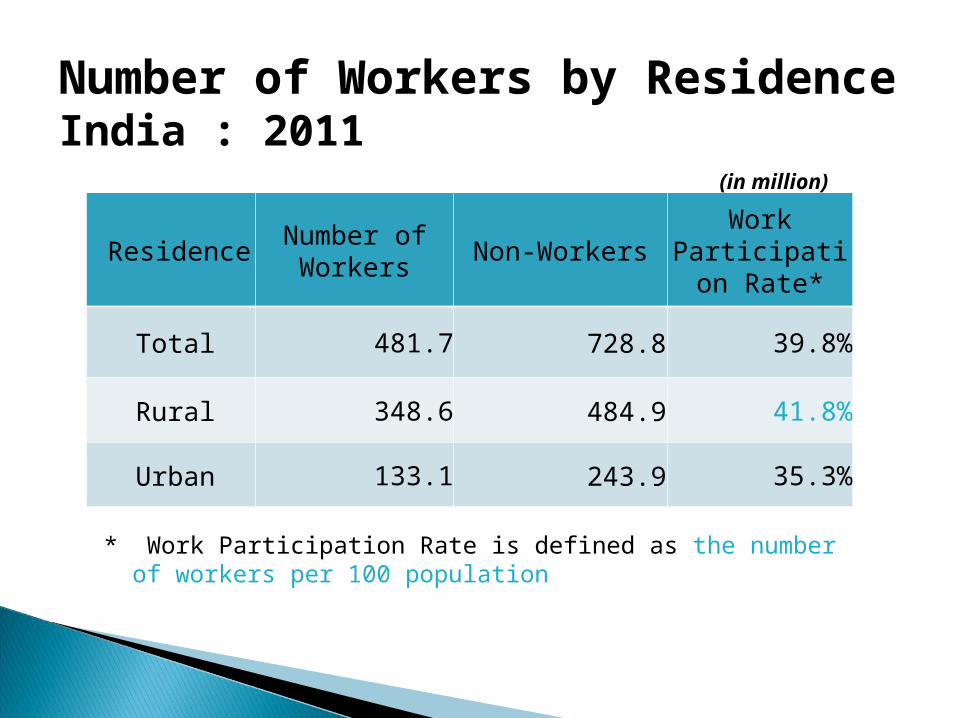
Number of Workers by ResidenceIndia : 2011
ResidenceNumber of Workers
Non-WorkersWork
Participation Rate*
Total 481.7 728.8 39.8%
Rural 348.6 484.9 41.8%
Urban 133.1 243.9 35.3%
* Work Participation Rate is defined as the number of workers per 100 population
(in million)
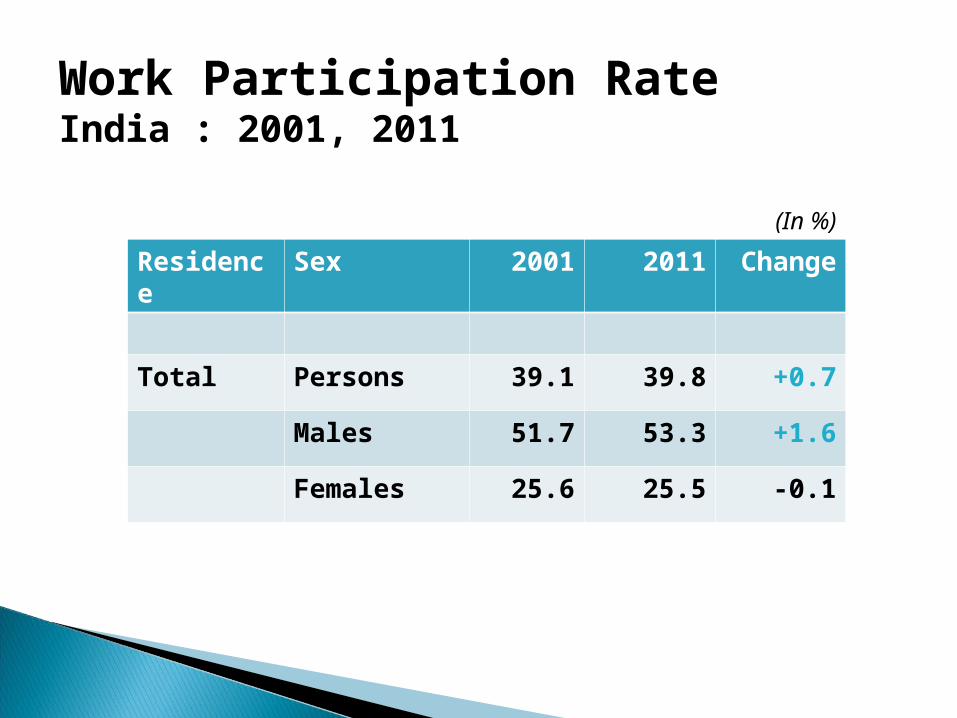
Work Participation RateIndia : 2001, 2011
Residence
Sex 2001 2011 Change
Total Persons 39.1 39.8 +0.7
Males 51.7 53.3 +1.6
Females 25.6 25.5 -0.1
(In %)
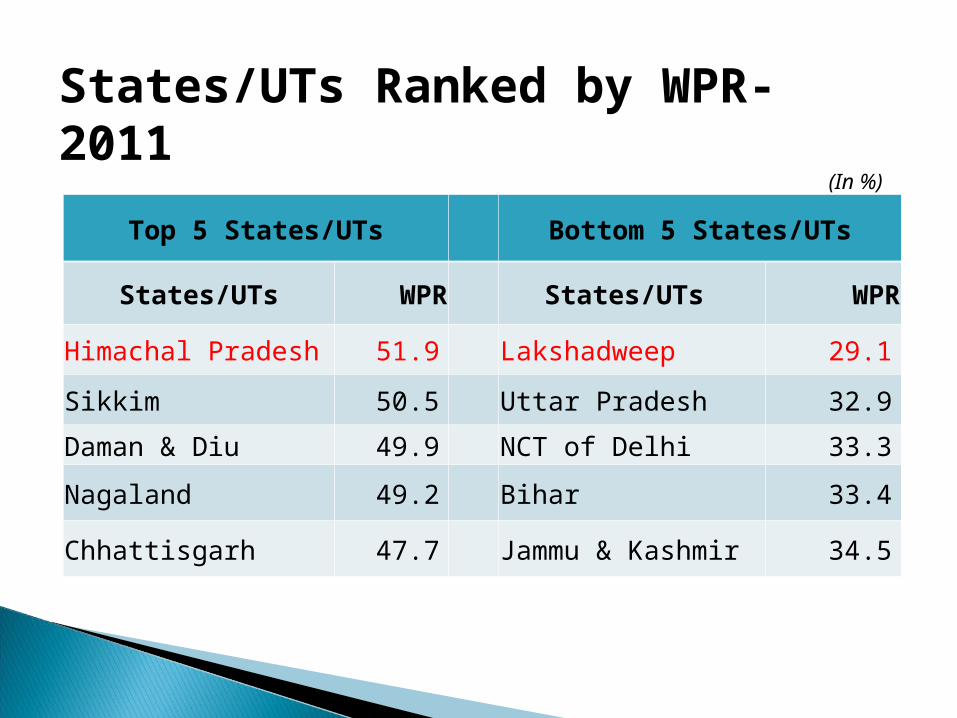
States/UTs Ranked by WPR- 2011
Top 5 States/UTs Bottom 5 States/UTs
States/UTs WPR States/UTs WPR
Himachal Pradesh 51.9 Lakshadweep 29.1
Sikkim 50.5 Uttar Pradesh 32.9
Daman & Diu 49.9 NCT of Delhi 33.3
Nagaland 49.2 Bihar 33.4
Chhattisgarh 47.7 Jammu & Kashmir 34.5
(In %)
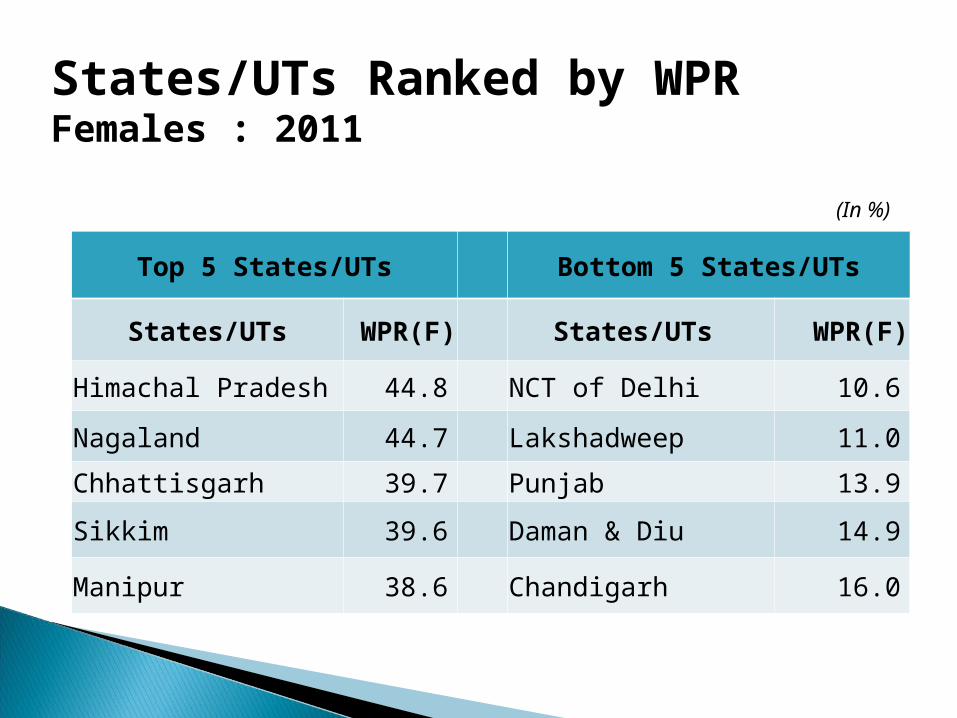
States/UTs Ranked by WPR Females : 2011
Top 5 States/UTs Bottom 5 States/UTs
States/UTs WPR(F) States/UTs WPR(F)
Himachal Pradesh 44.8 NCT of Delhi 10.6
Nagaland 44.7 Lakshadweep 11.0
Chhattisgarh 39.7 Punjab 13.9
Sikkim 39.6 Daman & Diu 14.9
Manipur 38.6 Chandigarh 16.0
(In %)
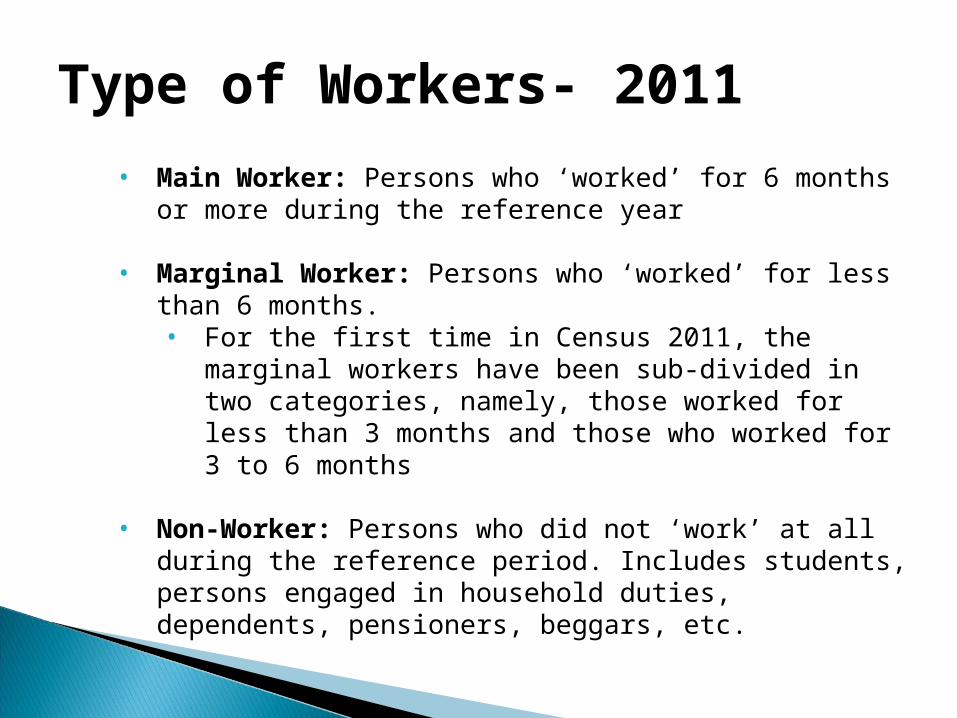
Type of Workers- 2011
• Main Worker: Persons who ‘worked’ for 6 months or more during the reference year
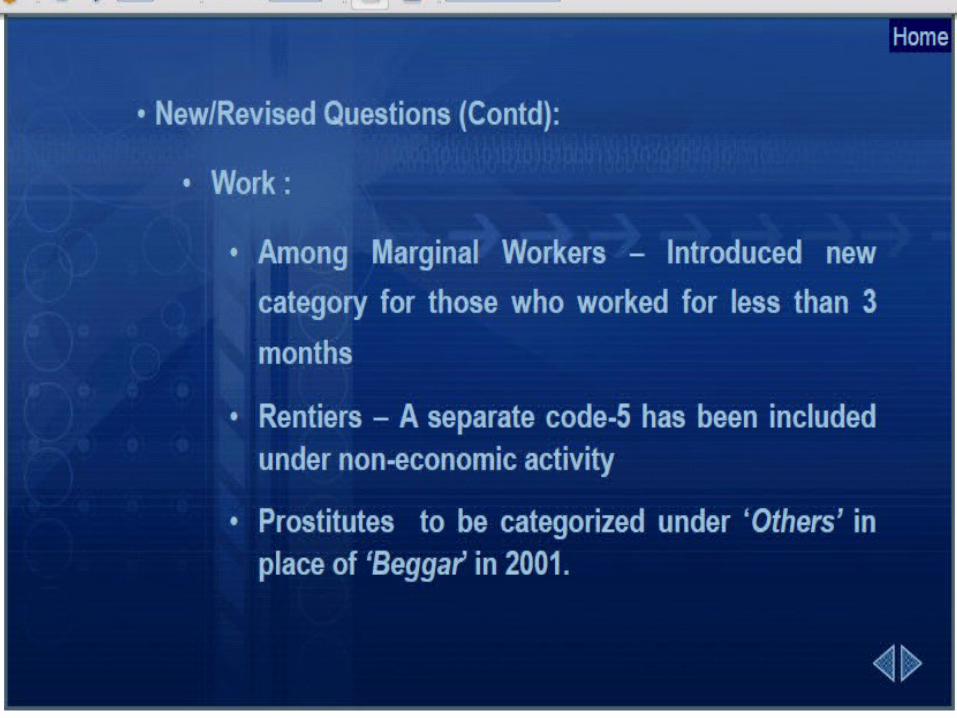
• Marginal Worker: Persons who ‘worked’ for less than 6 months. • For the first time in Census 2011, the marginal
workers have been sub-divided in two categories, namely, those worked for less than 3 months and those who worked for 3 to 6 months
• Non-Worker: Persons who did not ‘work’ at all during the reference period. Includes students, persons engaged in household duties, dependents, pensioners, beggars, etc.
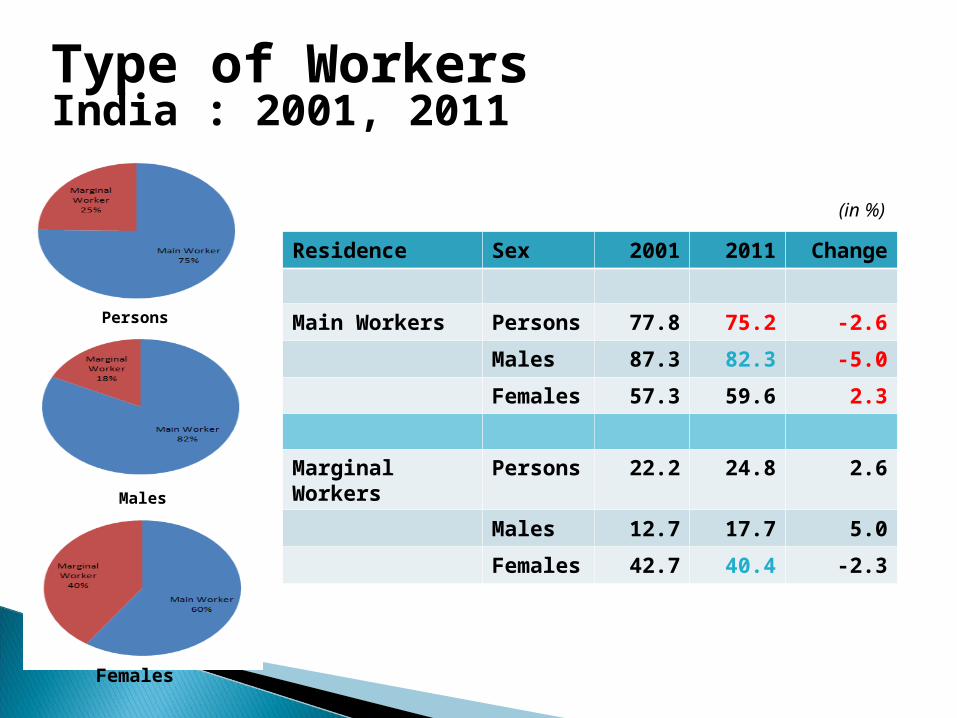
Type of WorkersIndia : 2001, 2011
Residence Sex 2001 2011 Change
Main Workers Persons
77.8 75.2 -2.6
Males 87.3 82.3 -5.0
Females
57.3 59.6 2.3
Marginal Workers
Persons
22.2 24.8 2.6
Males 12.7 17.7 5.0
Females
42.7 40.4 -2.3
(in %)
Persons
Males
Females
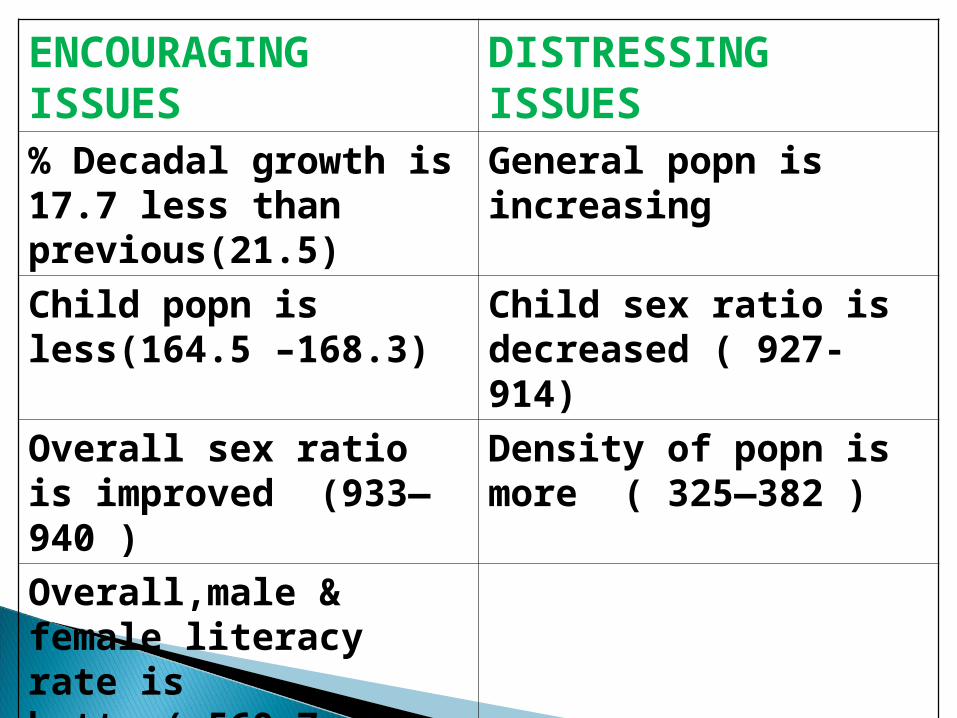
ENCOURAGING ISSUES
DISTRESSING ISSUES
% Decadal growth is 17.7 less than previous(21.5)
General popn is increasing
Child popn is less(164.5 –168.3)
Child sex ratio is decreased ( 927-914)
Overall sex ratio is improved (933—940 )
Density of popn is more ( 325—382 )
Overall,male & female literacy rate is better( 560.7–763.5)
% improvement in Literacy rate is more in females
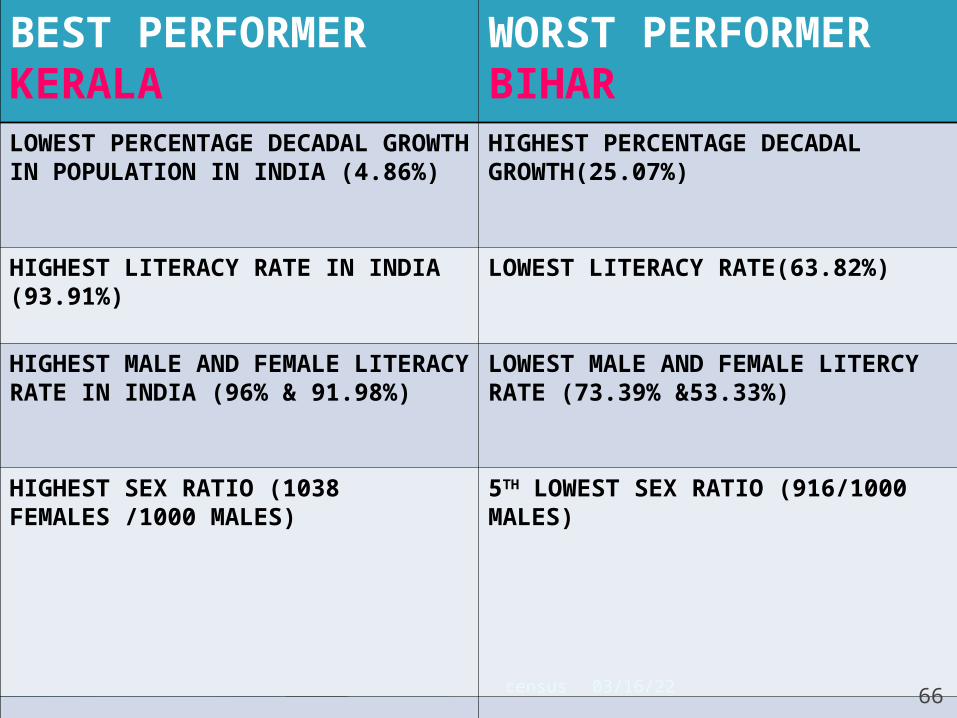
BEST PERFORMER KERALA
WORST PERFORMER BIHAR
LOWEST PERCENTAGE DECADAL GROWTH IN POPULATION IN INDIA (4.86%)
HIGHEST PERCENTAGE DECADAL GROWTH(25.07%)
HIGHEST LITERACY RATE IN INDIA (93.91%)
LOWEST LITERACY RATE(63.82%)
HIGHEST MALE AND FEMALE LITERACY RATE IN INDIA (96% & 91.98%)
LOWEST MALE AND FEMALE LITERCY RATE (73.39% &53.33%)
HIGHEST SEX RATIO (1038 FEMALES /1000 MALES)
5TH LOWEST SEX RATIO (916/1000 MALES)
04/18/23census66