ceap/swpi in the upper big walnut creek watershed
DESCRIPTION
CEAP/SWPI in the Upper Big Walnut Creek Watershed. Kevin W. King and Norman R. Fausey USDA-ARS Soil Drainage Research Unit. CEAP from a National Perspective. Why CEAP?. - PowerPoint PPT PresentationTRANSCRIPT
CEAP/SWPI in theUpper Big Walnut Creek Watershed
Kevin W. King and
Norman R. FauseyUSDA-ARS
Soil Drainage Research Unit

CEAP from a National Perspective

The Federal Government’s single largest The Federal Government’s single largest environmental improvement program in environmental improvement program in agriculture is the Conservation Reserve agriculture is the Conservation Reserve Program which had 34 million acres enrolled at Program which had 34 million acres enrolled at an annual cost of $1.6 billion in 2002.an annual cost of $1.6 billion in 2002.
The Environmental Quality Incentive Program The Environmental Quality Incentive Program may provide as much as $6 billion over the life may provide as much as $6 billion over the life of the Farm Bill (2002 to 2007).of the Farm Bill (2002 to 2007).
New programs like the Conservation Security New programs like the Conservation Security Program need tools that document Program need tools that document environmental benefits to justify payment on environmental benefits to justify payment on existing conservation management practices.existing conservation management practices.
Why CEAP?Why CEAP?

Congress and OMB directed USDA to conduct an assessment of the effects of conservation practices.
NRCS was identified as the lead agency.
NRCS requested assistance from ARS in quantifying the environmental effects of conservation practices at the watershed scale.
Congressional Directive

The purpose of CEAP is to quantify the environmental benefits of conservation practices implemented under the 2002 Farm Bill.
The initial focus is on cropland.
Future plans include assessments for wildlife, grazing lands, and wetlands.
The Focus of CEAP

The NRCS-led The NRCS-led National National AssessmentAssessment provides estimates of provides estimates of conservation benefits at the conservation benefits at the national scale.national scale.
The ARS and NRCS-ledThe ARS and NRCS-led Watershed Assessment StudiesWatershed Assessment Studies provide for more detailed provide for more detailed information on conservation information on conservation effects/benefits in selected effects/benefits in selected benchmark watersheds.benchmark watersheds.
CEAP Has Two MajorCEAP Has Two MajorComponents Components

Agricultural Research Service Agricultural Research Service (ARS) Benchmark Watersheds(ARS) Benchmark Watersheds
Special Emphasis Watersheds Special Emphasis Watersheds (NRCS)(NRCS)
Competitive Grants Watersheds Competitive Grants Watersheds (CSREES)(CSREES)
The Watershed Assessment Study Categories

City of Columbus Data
Month
Jan Feb Mar Apr May Jun Jul Aug Sep Oct Nov Dec
Atr
azi
ne
Co
nc
en
tra
tio
n ( g
L-1
)
0
1
2
3
4
5
1995-1998Atrazine MCL
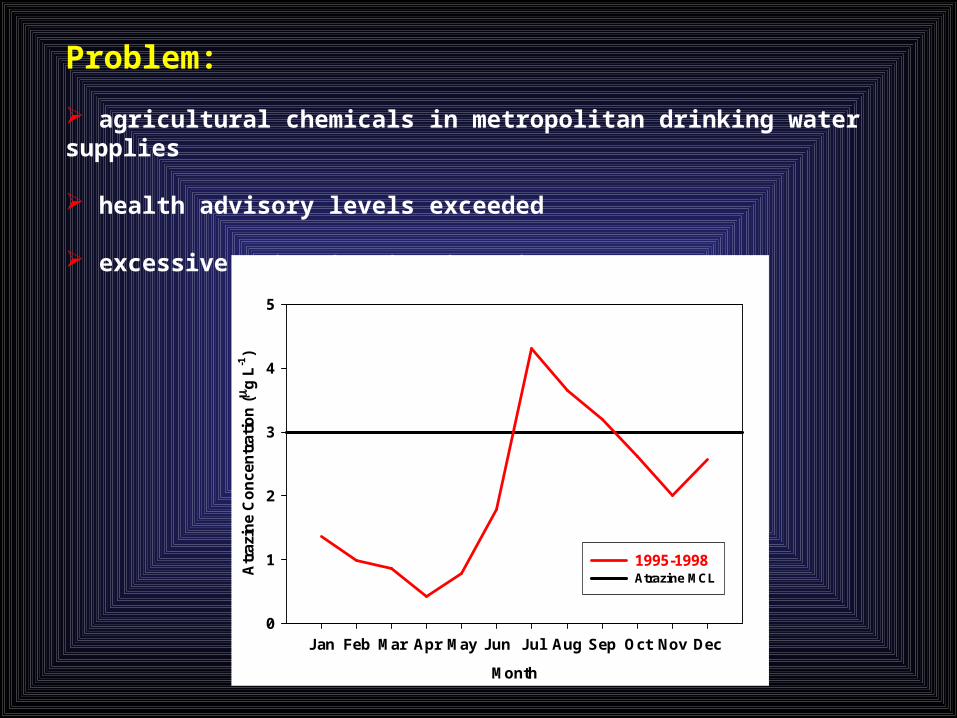
Problem:
agricultural chemicals in metropolitan drinking water supplies health advisory levels exceeded excessive water treatment costs

Solution:
1) Use of PAC to scrub water 2) Address source of problem
EQIP (595 pest mgt.) practices - incorporation - reduced rate - alternative herbicide

Average monthly atrazine concentration in the water received at a Columbus, OH drinking water treatment facility coming from the Hoover Reservoir before (1995-1998) and after (1999-2005) EQIP implementation.
Month
Jan Feb Mar Apr May Jun Jul Aug Sep Oct Nov Dec
Atr
azin
e C
on
ce
ntr
ati
on
( g
L-1
)
0
1
2
3
4
5
1995-19981999-2005Atrazine MCL

Impact:
Economic: Investment $1.2 mil.Savings $3.1 mil.$2.58 return on every $ invested in the practice
Safe, lower cost drinking water supplyReduced atrazine levels in Hoover Reservoir
Voluntary environmental stewardship

USDA-ARS-SDRU CEAP Efforts

• 2002 – SDRU initiates research in Upper Big Walnut Creek watershed as part of the Source Water Protection Initiative (SWPI)
– focus is on hydrology and water chemistry
– development of best management practices to ensure drinkable water
Background (SWPI)

2003 – Upper Big Walnut Creek watershed selected as one of 14 benchmark watersheds in ARS watershed assessment study as part of the Conservation Effects Assessment Project (CEAP)
- focus is on determining the environmental benefits of USDA conservation practices funded through the Farm Bill
- SDRU research efforts expand into ecology and soil quality
- OSU economic assessments begin
Background (CEAP)

SWPI/CEAP Research
Objective: Measure and quantify the effects of innovative conservation practices, source water protection practices, and land use management on 1) water quality and quantity, and 2) lotic ecosystems at the field, farm, and watershed scales in the Upper Big Walnut Creek watershed

• EQIP (Environmental Quality Incentive Program) – USDA conservation program provides technical and financial assistance to treat identified natural resource concerns on crop land
– $1.2 million dollars in EQIP contracts between 1999 to 2005 to reduce atrazine use
– 5 year enrollment
• Upper Big Walnut Creek CREP (Conservation Reserve Enhancement Program)– state and federal program within watershed provides financial incentives to implement practices designed to reduce agricultural nonpoint pollution, particularly atrazine
– Focus on establishment of riparian buffers within cropland
– Enrollment 14 to 15 years
Conservation Programs

Water Quality and Quantity Concern:
Atrazine levels within the Hoover Reservoir
- Hoover Reservoir serves as source of drinking water for Columbus, Ohio
- Atrazine levels have periodically exceeded human advisory level of 3 g/L
July to Sept. 1997 - atrazine levels ranged from 5.2 to 5.8 g/L
Urbanization of watershed
Objective:
- Evaluate the influence of conservation practices and land use on the water chemistry and hydrology of streams in the Upper Big Walnut Creek watershed
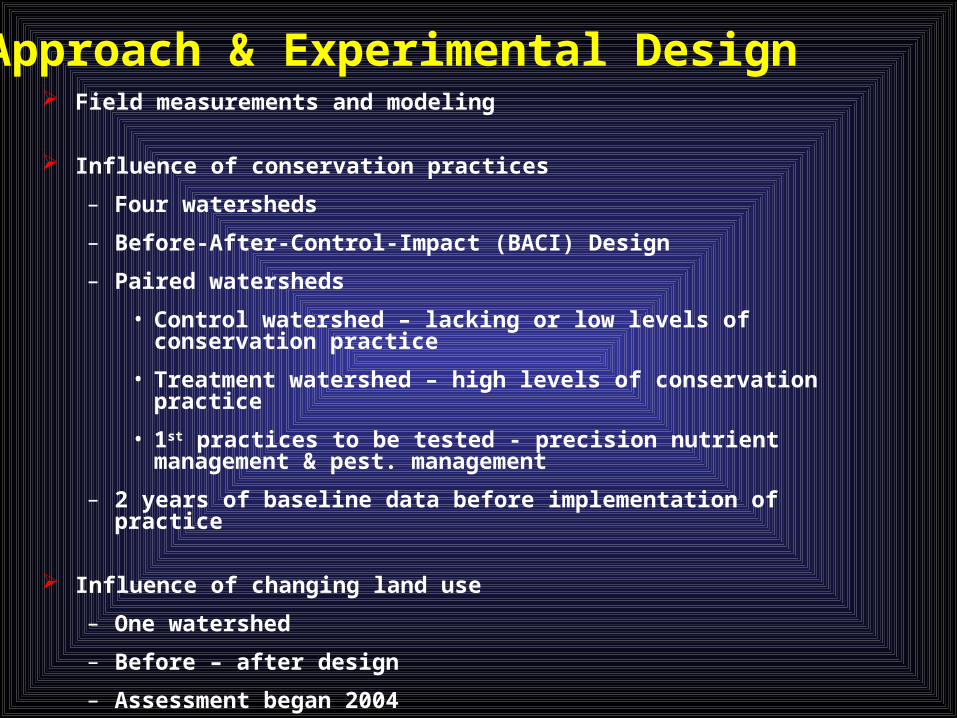
Field measurements and modeling
Influence of conservation practices
– Four watersheds
– Before-After-Control-Impact (BACI) Design
– Paired watersheds
• Control watershed – lacking or low levels of conservation practice
• Treatment watershed – high levels of conservation practice
• 1st practices to be tested - precision nutrient management & pest. management
– 2 years of baseline data before implementation of practice
Influence of changing land use
– One watershed
– Before – after design
– Assessment began 2004
Approach & Experimental Design

Paired Streams
Paired Ditches
Urbanizing watershed

##
#
#
#
##
####
##
Drainage area 960 ac.Watershed slope 1-2 %
Urban 0.1 %Agriculture/open 88.9 %Shrub/scrub 0.1 %Wooded 10.4 %Wetlands 0.3 %
A-1
B-1
Drainage area 1121 ac.Watershed slope 1-2 %
Urban 0.1 %Agriculture/open 95.3 %Shrub/scrub 0.0 %Wooded 4.5 %Wetlands 0.1 %
Paired Drainage Ditches

#
#
C-1
D-1
Drainage area 1085 ac.Watershed slope 3-5 %
Urban 0.2 %Agriculture/open 72.3 %Shrub/scrub 0.4 %Wooded 26.6 %Wetlands 0.4 %
Drainage area 1058 ac.Watershed slope 3-5 %
Urban 0.1 %Agriculture/open 64.9 %Shrub/scrub 0.8 %Wooded 33.3 %Wetlands 0.9 %
Paired Streams

Flow and time based sampling
Discrete and weekly composites
Subsurface and surface discharge
Precipitation and other climate variables
Nutrients
Nitrogen (TN, NO3, NH4)
Phosphorus (TP, PO4)
Total Suspended Solids
Herbicides
Atrazine, Alachlor, Metolachlor, Simazine
Water Chemistry & Hydrology Measurements

Preliminary Findings from 2005
Water Chemistry

A1 B1 C1 D1
Precipitation (inches) 32.7 35.8 38.1 38.1
NO3-N Load (lb/ac) 39.0 23.9 9.9 18.5
DRP Load (lb/ac) 0.8 0.7 0.2 0.3
Atrazine Loss (lbs) 27.1 0.6 0.3 2.7
NO3-N, DRP, and Atrazine load from four small watersheds in UBWC.

Monthly NO3-N load (kg/ha)
y = 0.3782x + 0.859
R2 = 0.9575
0
1
2
3
4
5
6
0 2 4 6 8 10 12
A1
B1
##
#
#
#
##
####
##
A-1: Control watershed
B-1: Treatment watershed

Monthly NO3-N load (kg/ha)
y = 0.5713x - 0.0621
R2 = 0.95
-1
0
1
2
3
4
5
6
0 2 4 6 8 10
D1
C1
#
#
C-1: Treatment watershed
D-1: Control watershed

NO
3-N
co
nce
ntr
atio
n (
mg
L-1
)
0
1
2
3
4
5
DR
P c
on
cen
trat
ion
(m
g L
-1)
0.0
0.2
0.4
0.6
Location
MS1 MS2 MS3 MS4
atra
zin
e co
nce
ntr
atio
n ( g
L-1
)
0
1
2
3
4
Concentrations of NO3-N, DRP, and atrazine on the main stem of UBWC.
Urbanization Issues

Ecology Research
Concern:
- Habitat degradation of streams - Ohio EPA identified watershed as priority impaired watershed in 1998, 2002, and 2003 303 (d) lists
- 2000 Ohio EPA monitoring results - 56% of streams sampled in watershed are not meeting aquatic life use designations set by EPA
Objective:
- Evaluate the influence of herbaceous riparian buffers on the physical habitat and stream communities in agricultural drainage ditches in the Upper Big Walnut Creek watershed

Geomorphology
Riparian habitat
Instream habitat
Water chemistry
Fishes
Invertebrates
Riparian Buffers

• Nine streams
• Space For Time Design
– Three ditches without herbaceous riparian buffer
– Three ditches with herbaceous riparian buffers (CREP buffers)
– Three streams with forested riparian zones (best case scenario)
Experimental Design
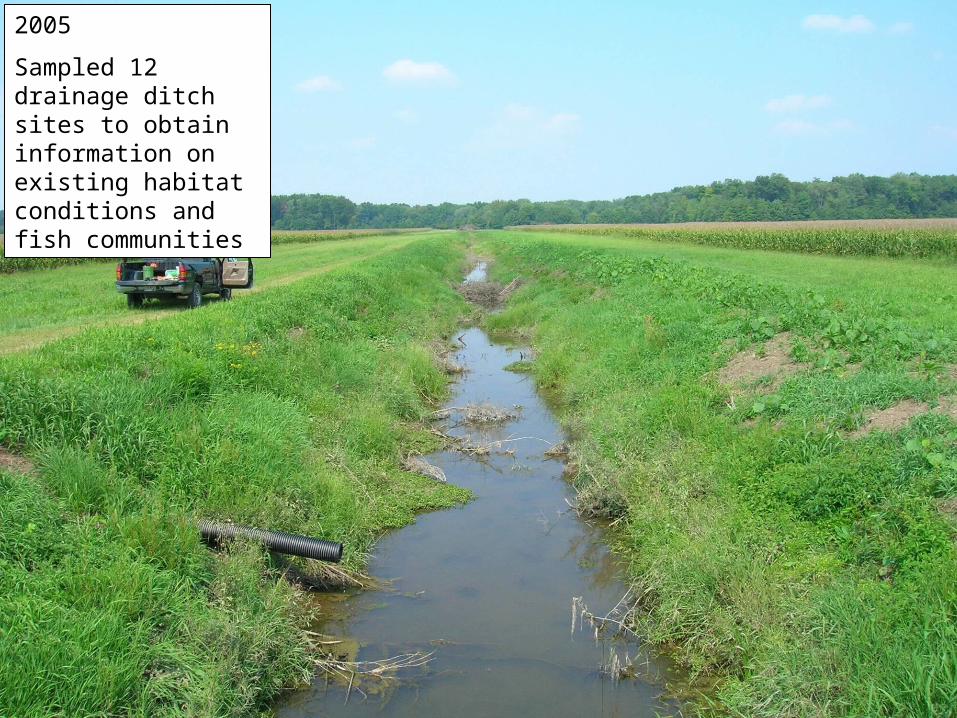
2005
Sampled 12 drainage ditch sites to obtain information on existing habitat conditions and fish communities

What are the Habitat Characteristics of Agricultural
Drainage Ditches?

Habitat Characteristic Mean Minimum Maximum
Sinuosity 1.04 1.0 1.3
Gradient (m/m) -0.1 0.2 -0.2
Top bank width (m) 9.0 6.2 12.1
Thalweg depth (m) 1.8 1.5 2.5
Wet width (m) 1.8 0.17 3.6
Water depth (m) 0.11 0.01 0.3
Water velocity (m/s) 0.02 -0.01 0.1
Habitat Characteristics of Drainage Ditches
- shallow slow flowing water within low gradient, straight, enlarged channels

B5 one of the smallest channels
Top bank width - 6.2 m
Thalweg depth – 1.8 m

What Fishes Live in Agricultural Drainage Ditches?

• Documented 24 species from 6904 captures
• 7 most abundant species are also expected to occur in headwater streams
Fathead Minnow
Creek Chub
Bluntnose Minnow
Johnny Darter
Green Sunfish
Orangethroat Darter
White sucker
Other - 17 spp 1.4%
Fishes Within Agricultural Drainage Ditches

Fathead Minnow Creek Chub
Bluntnose Minnow Johnny Darter

• Majority of the fishes are small, but some larger individuals are present
White Sucker
Bluegill

Future Plans
Precision nutrient management
Pest management
Water table management
Surface amendments (gypsum)

Summary
Upper Big Walnut Creek watershed one of 14 benchmark watersheds in the ARS Watershed Assessment Study – one component of CEAP
Research within watershed expanded from a focus on source water protection to broad assessment of conservation practices
Ongoing research in the watershed involves assessment of water quality, ecology, soil quality, and economics Initial results will be provided to NRCS to use in their report to Congress on the 2007 Farm Bill

• We thank the following for their help with field and laboratory work: J. Allen, S. Boone, E. Fischer, A. Kemble, C. Nixon, V. Orlick, P. Levison, P. Morgan, G. Roberts, C. Stevens, L. Wilson, D. Woner, A. Houser, B. Baker, and E. Zwierschke
• L. Ufferman, E. Miller, L. Mather, and Delaware Soil and Water Conservation District for GIS data, landowner information, and site information
• R. Dunn, L. Winters, and City of Columbus provided water chemistry information from selected streams and the Hoover Reservoir
• America’s Clean Water Foundation
• T. Edwards, J. Hunter, and NRCS for landowner and site information
• A. Brate and T. Shaw for allowing us the use of a RTK unit, and L. Brown and E. Desmond for allowing us the use of a total station
• L. Williams, J. Bigham, D. Shields, S. Knight, and C. Richardson provided support during the planning stages of the UBWC ecology research
• We also are grateful to those landowners within the Upper Big Walnut Creek watershed who gave us permission to work on their property
• D. Binder, T. Terawaki, A. Houser, D. Lantz, W. Beery, P. DeArman, and 16 others from university, state, federal, and non-profit organizations contributed to the OSU Economic Assessment
Acknowledgements