cdp workshop environmental disclosure in 2018 · | @cdp page 1 cdp workshop environmental...
TRANSCRIPT
www.cdp.net | @CDP Page 1
CDP workshop
Environmental disclosure
in 2018
Dr Tony Rooke, Technical Director
www.cdp.net | @CDP
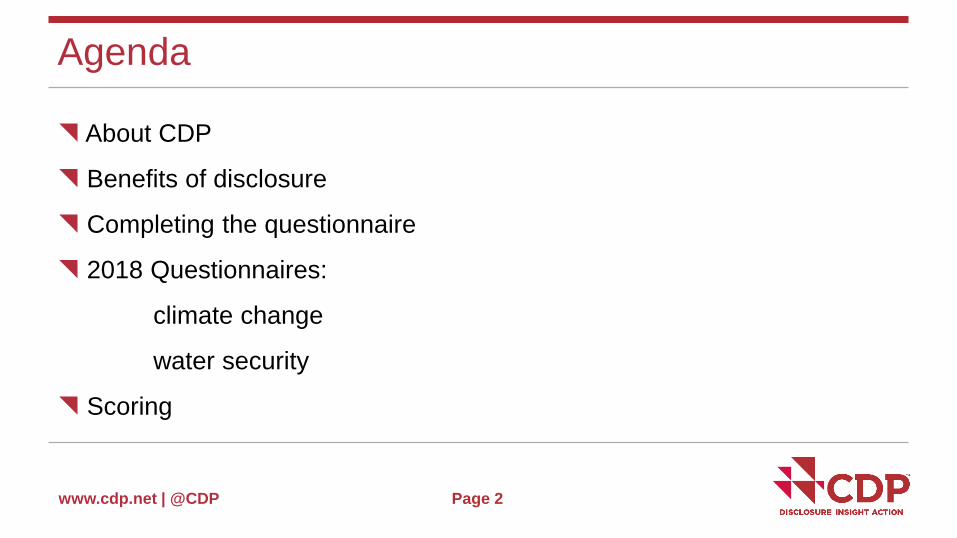
Agenda
About CDP
Benefits of disclosure
Completing the questionnaire
2018 Questionnaires:
climate change
water security
Scoring
Page 2
www.cdp.net | @CDP
About CDP
Page 3
www.cdp.net | @CDP
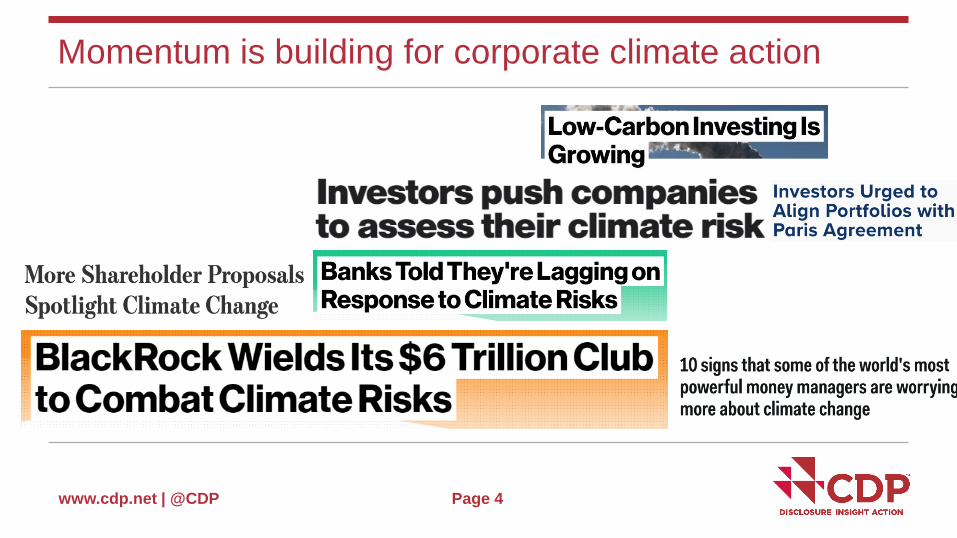
Momentum is building for corporate climate action
Page 4
www.cdp.net | @CDP
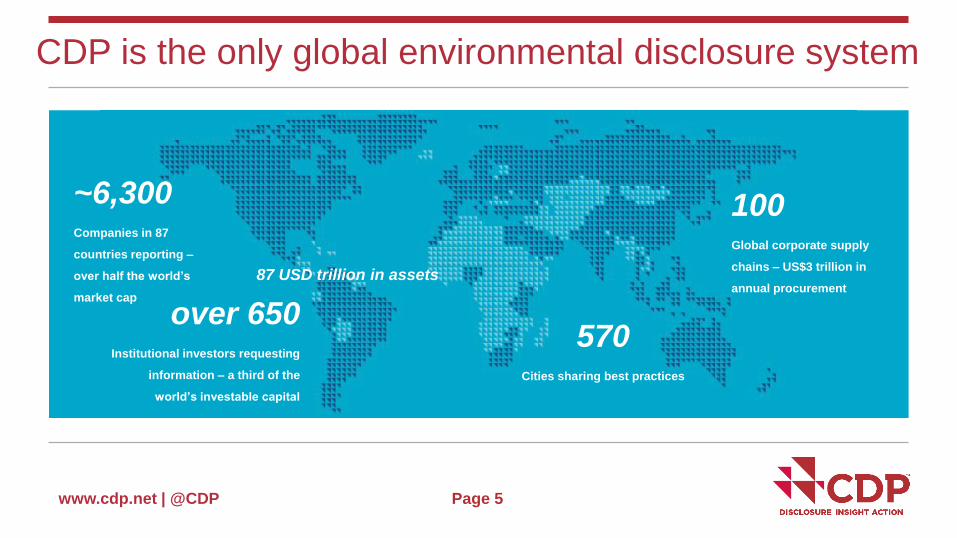
CDP is the only global environmental disclosure system
Page 5
~6,300Companies in 87
countries reporting –
over half the world’s
market cap
570Cities sharing best practices
100Global corporate supply
chains – US$3 trillion in
annual procurement
over 650Institutional investors requesting
information – a third of the
world’s investable capital
87 USD trillion in assets
www.cdp.net | @CDP
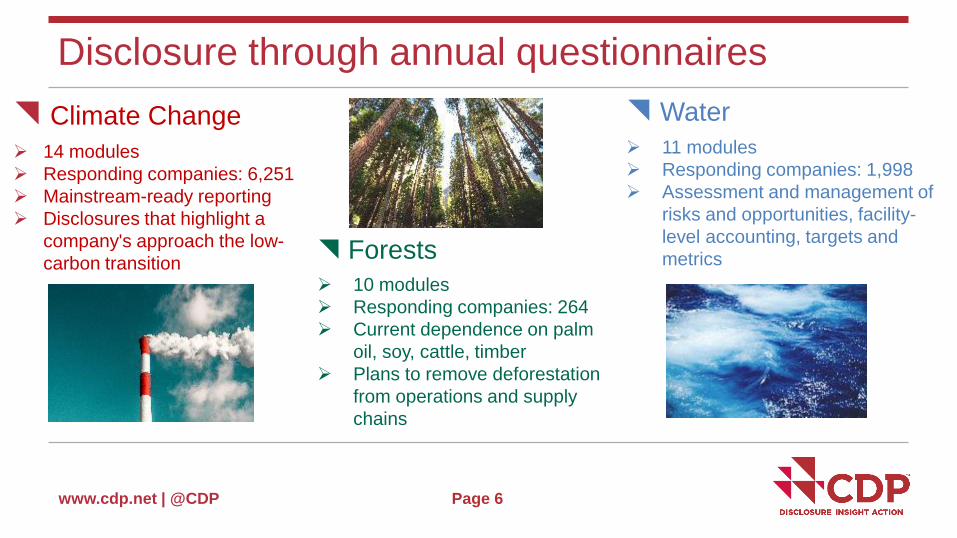
Disclosure through annual questionnaires
Climate Change
14 modules
Responding companies: 6,251
Mainstream-ready reporting
Disclosures that highlight a
company's approach the low-
carbon transition
Water
11 modules
Responding companies: 1,998
Assessment and management of
risks and opportunities, facility-
level accounting, targets and
metrics
Page 6
Forests
10 modules
Responding companies: 264
Current dependence on palm
oil, soy, cattle, timber
Plans to remove deforestation
from operations and supply
chains
www.cdp.net | @CDP
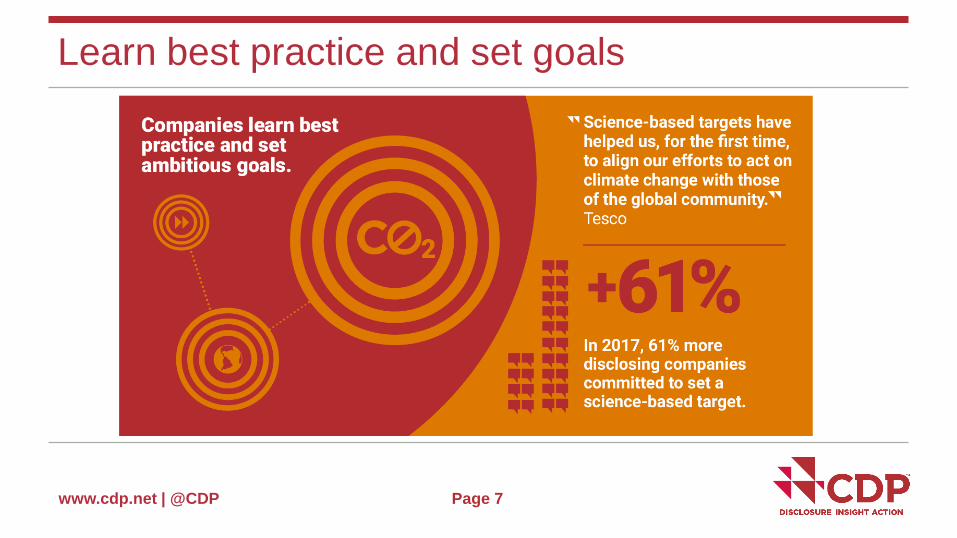
Learn best practice and set goals
Page 7
www.cdp.net | @CDP
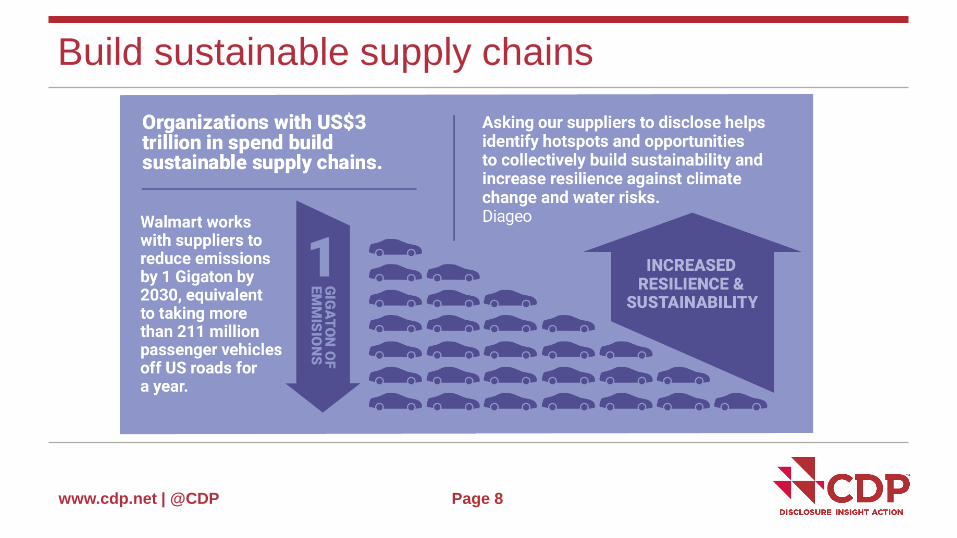
Build sustainable supply chains
Page 8
www.cdp.net | @CDP
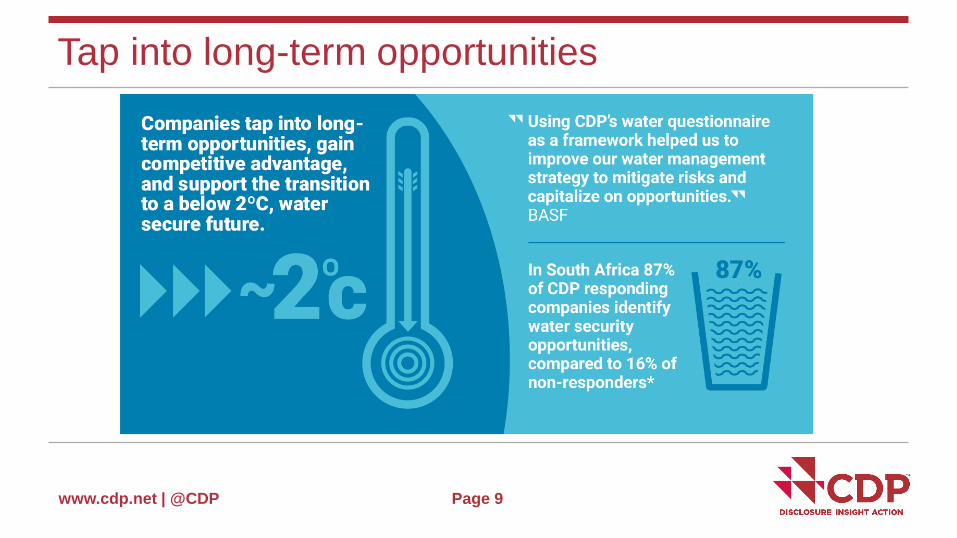
Tap into long-term opportunities
Page 9
www.cdp.net | @CDP
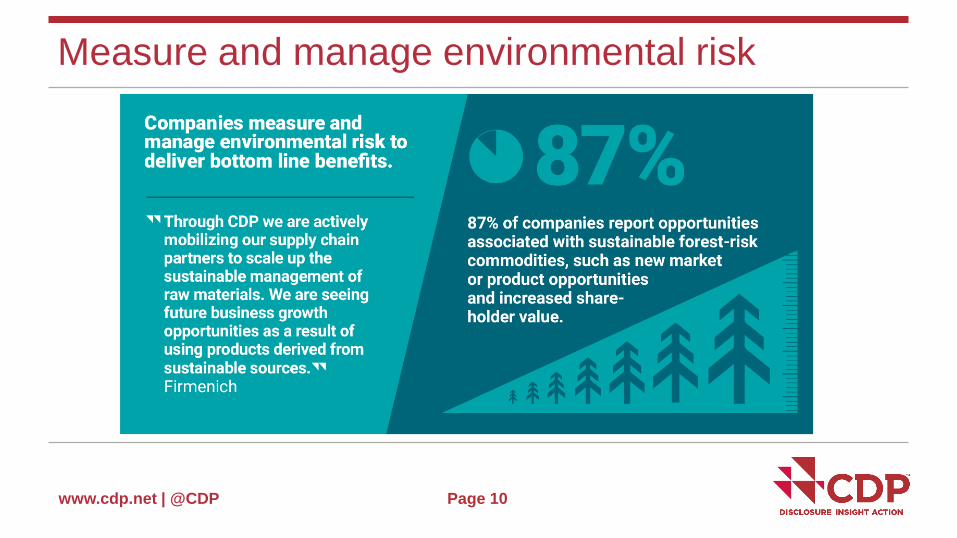
Measure and manage environmental risk
Page 10
www.cdp.net | @CDP
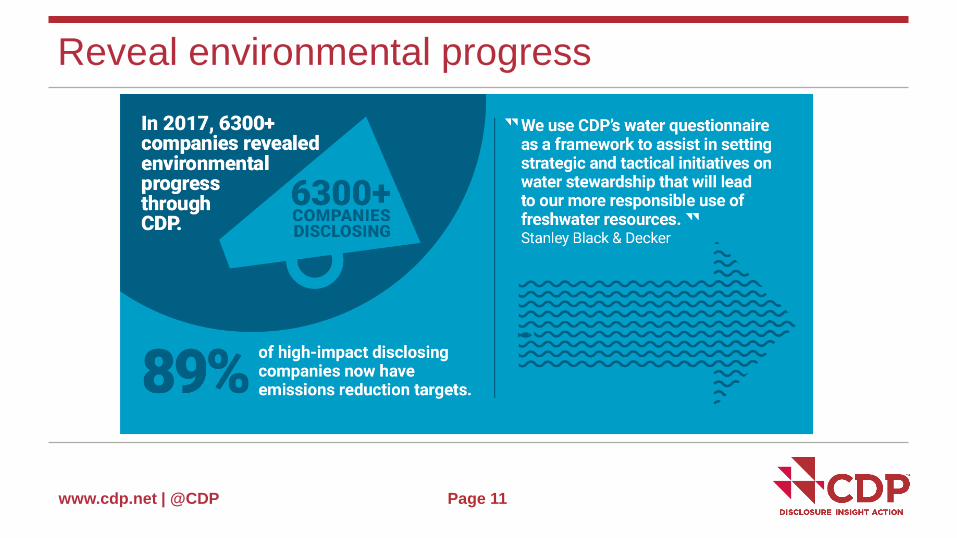
Reveal environmental progress
Page 11
www.cdp.net | @CDP
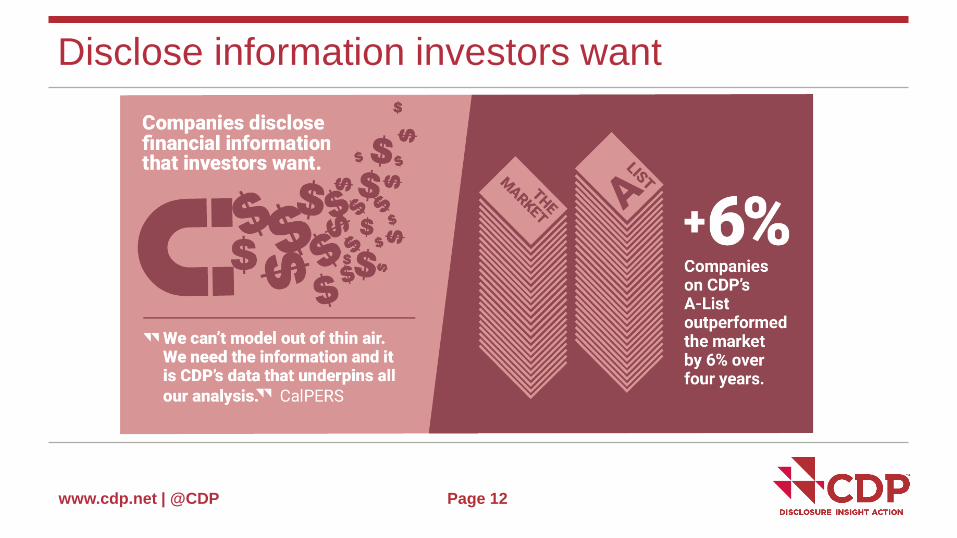
Disclose information investors want
Page 12
www.cdp.net | @CDP
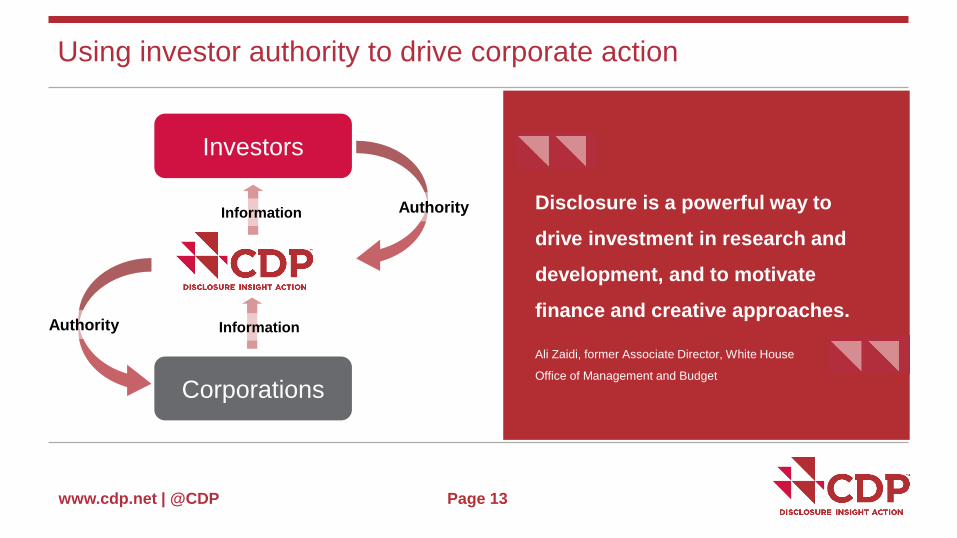
Using investor authority to drive corporate action
Page 13
Investors
Corporations
Authority
Information
Information
Authority
Disclosure is a powerful way to
drive investment in research and
development, and to motivate
finance and creative approaches.
Ali Zaidi, former Associate Director, White House
Office of Management and Budget
www.cdp.net | @CDP
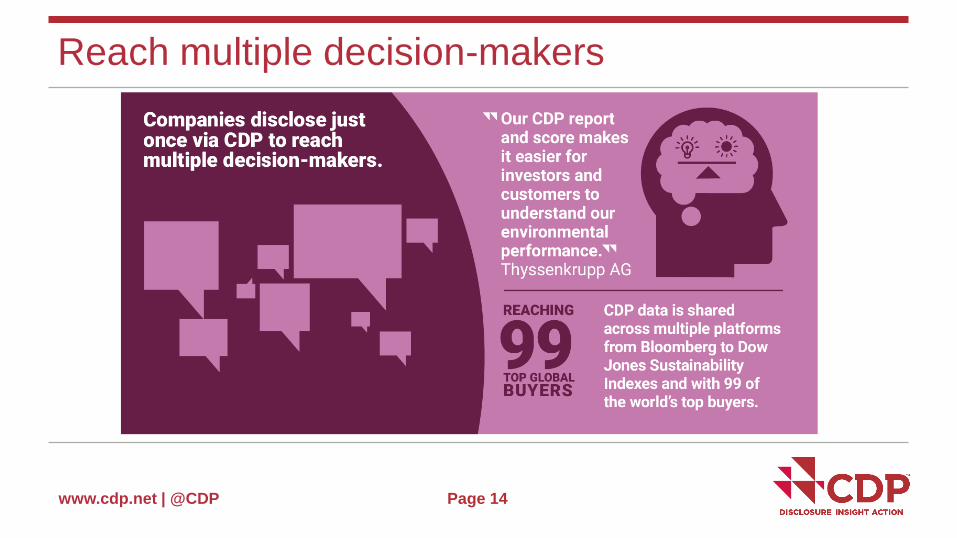
Reach multiple decision-makers
Page 14
www.cdp.net | @CDP
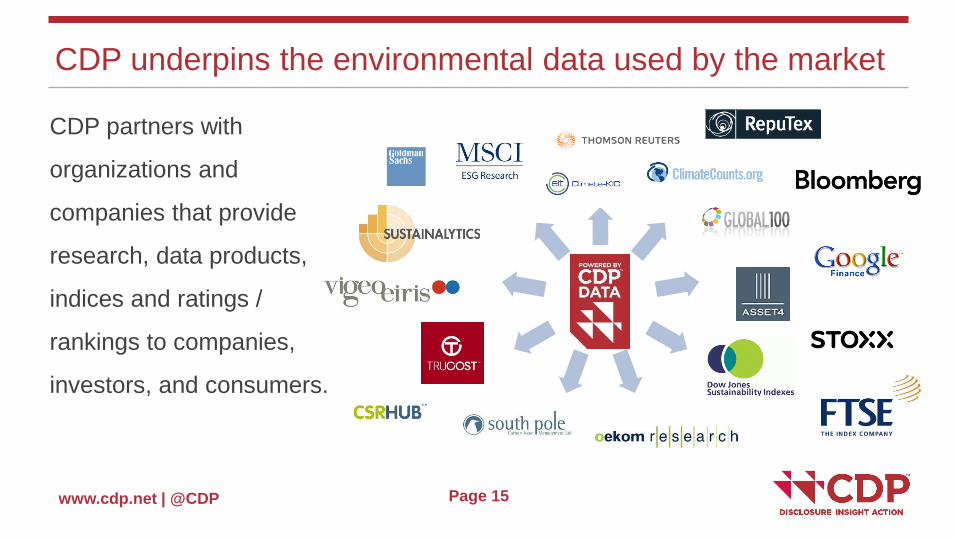
CDP underpins the environmental data used by the market
CDP
Corporate Knights Global
100CRO’s 100 Best
Corporate Citizens
DJSI
FTSE4Good Index Series
GS SustainMSCI ESG
Indices
OekomCorporate Rankings
SustainalyticsCompany Rankings
Trucost
CDP partners with
organizations and
companies that provide
research, data products,
indices and ratings /
rankings to companies,
investors, and consumers.
Page 15
www.cdp.net | @CDP
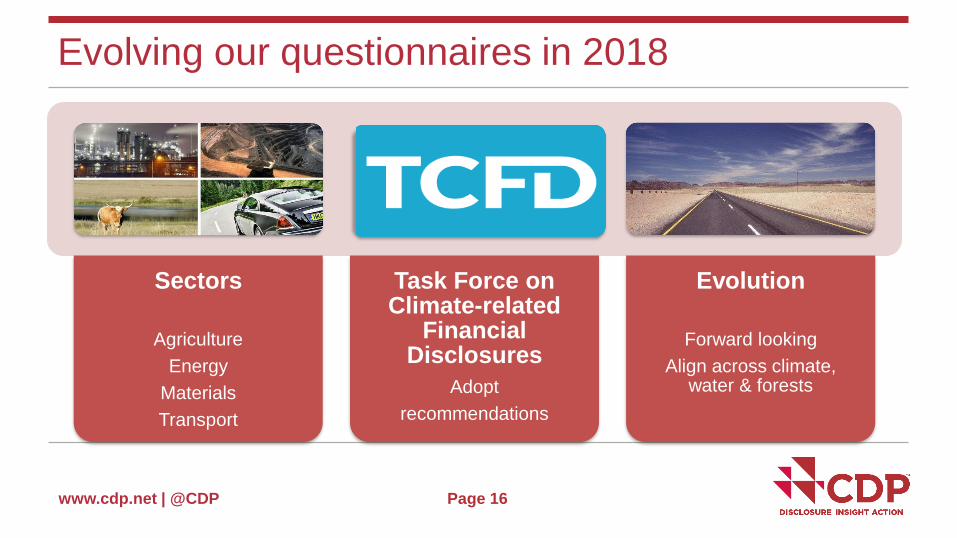
Evolving our questionnaires in 2018
Page 16
Sectors
Agriculture
Energy
Materials
Transport
Task Force on Climate-related
Financial Disclosures
Adopt
recommendations
Evolution
Forward looking
Align across climate, water & forests
www.cdp.net | @CDP
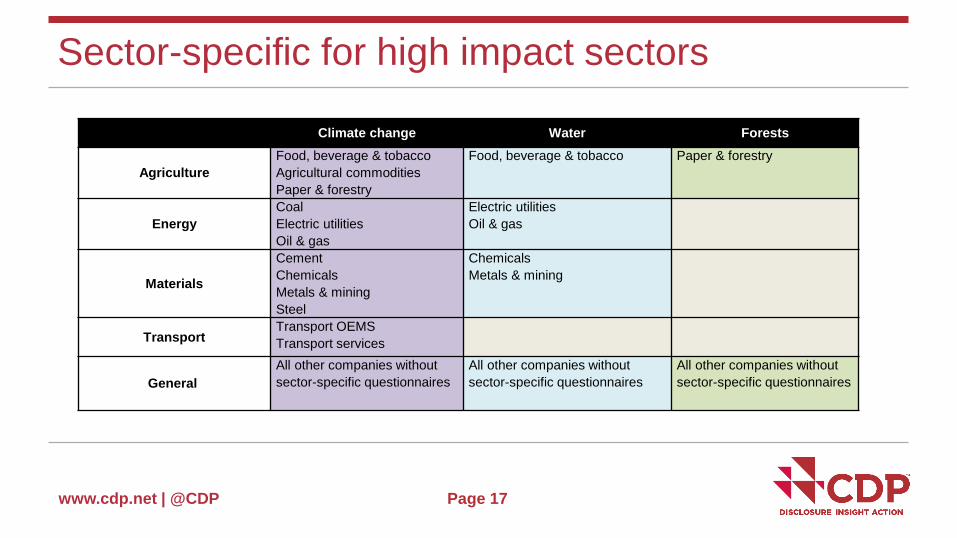
Sector-specific for high impact sectors
Page 17
Climate change Water Forests
Agriculture
Food, beverage & tobacco
Agricultural commodities
Paper & forestry
Food, beverage & tobacco Paper & forestry
Energy
Coal
Electric utilities
Oil & gas
Electric utilities
Oil & gas
Materials
Cement
Chemicals
Metals & mining
Steel
Chemicals
Metals & mining
TransportTransport OEMS
Transport services
General
All other companies without
sector-specific questionnaires
All other companies without
sector-specific questionnaires
All other companies without
sector-specific questionnaires
www.cdp.net | @CDP
Completing the questionnaire(s)
Page 18
www.cdp.net | @CDP
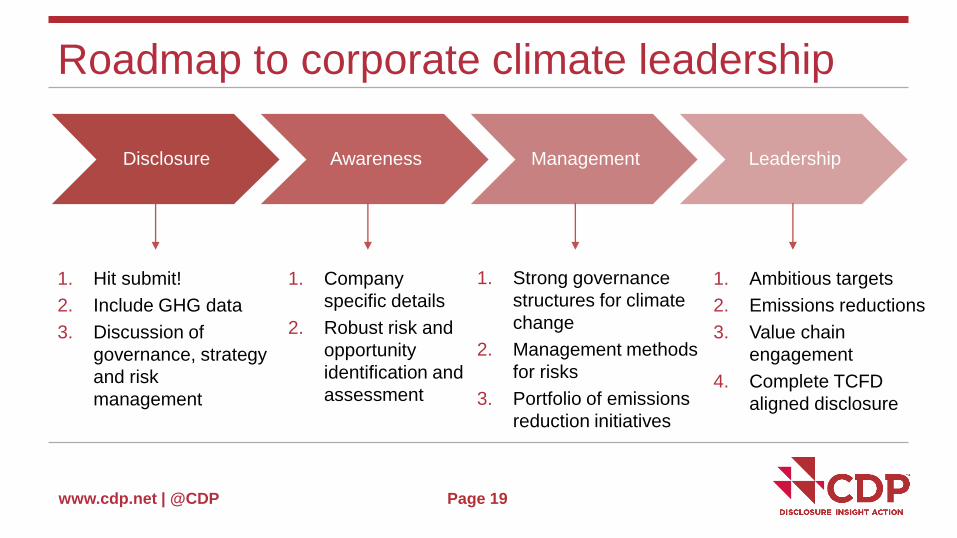
Roadmap to corporate climate leadership
Page 19
Disclosure Awareness Management Leadership
1. Hit submit!
2. Include GHG data
3. Discussion of
governance, strategy
and risk
management
1. Company
specific details
2. Robust risk and
opportunity
identification and
assessment
1. Strong governance
structures for climate
change
2. Management methods
for risks
3. Portfolio of emissions
reduction initiatives
1. Ambitious targets
2. Emissions reductions
3. Value chain
engagement
4. Complete TCFD
aligned disclosure
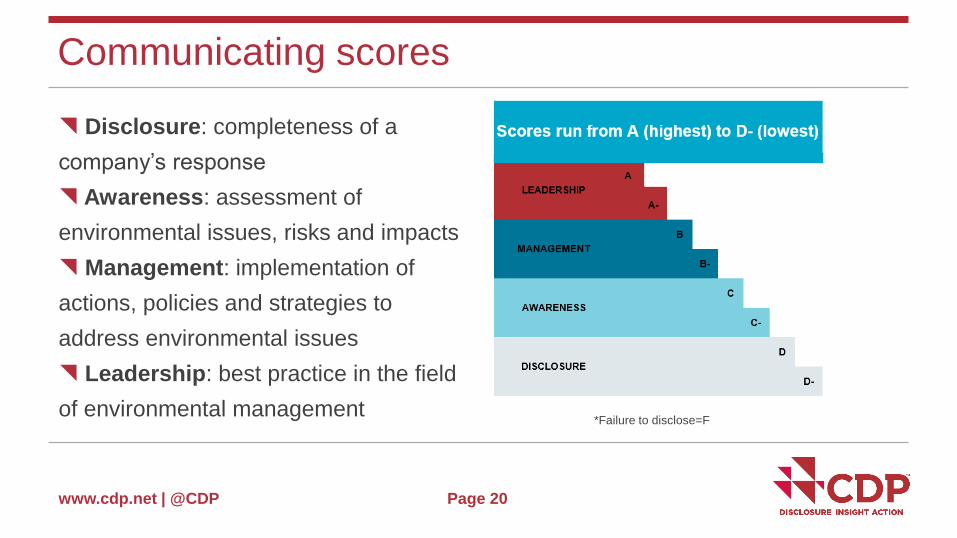
www.cdp.net | @CDP Page 20
Disclosure: completeness of a
company’s response
Awareness: assessment of
environmental issues, risks and impacts
Management: implementation of
actions, policies and strategies to
address environmental issues
Leadership: best practice in the field
of environmental management
Communicating scores
*Failure to disclose=F
www.cdp.net | @CDP
Common questions
Page 21
www.cdp.net | @CDP
Common questions
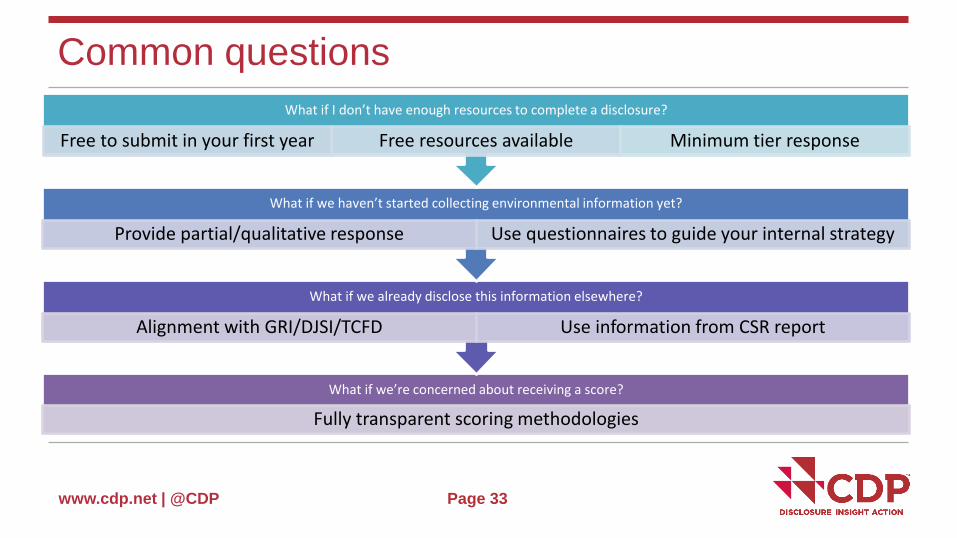
What if I don’t have enough resources to complete a disclosure?
Page 22
www.cdp.net | @CDP
Common questions
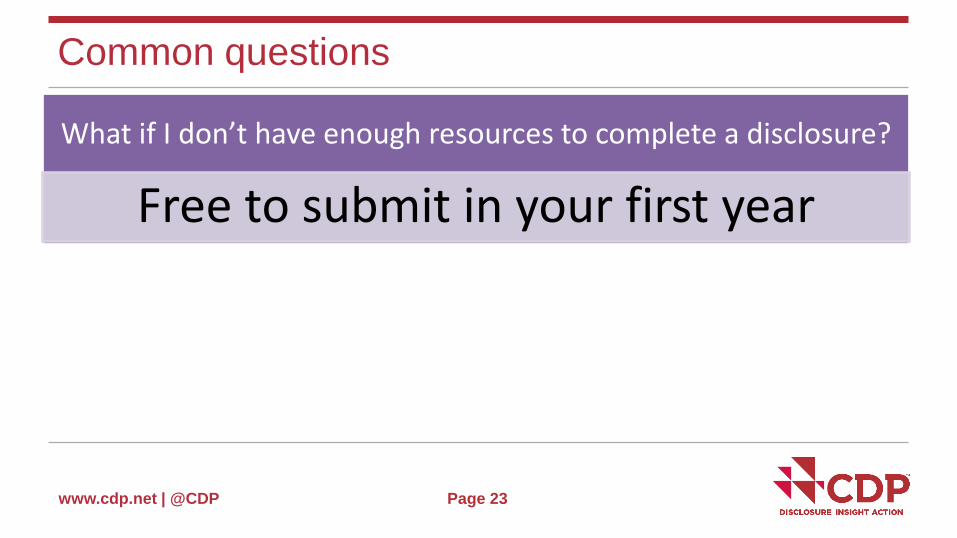
What if I don’t have enough resources to complete a disclosure?
Free to submit in your first year
Page 23
www.cdp.net | @CDP
Common questions
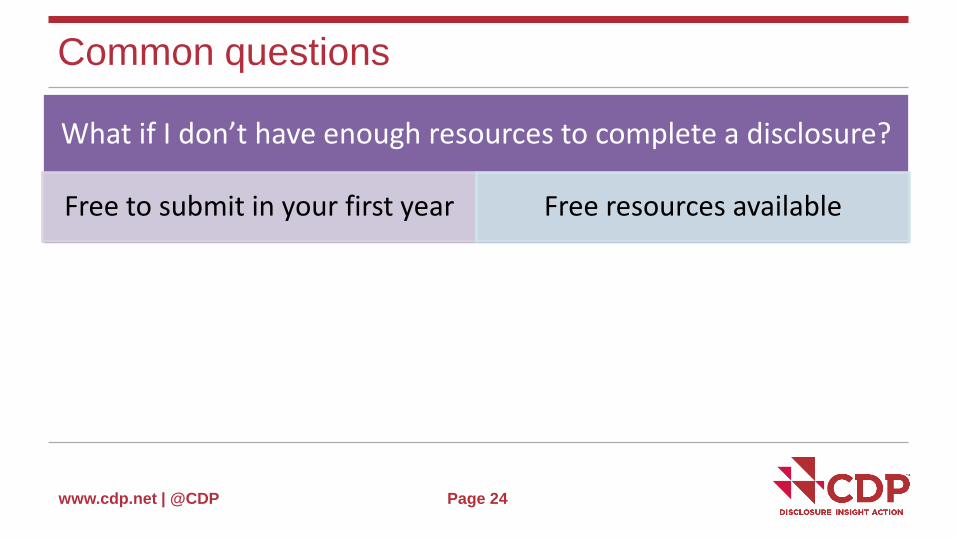
What if I don’t have enough resources to complete a disclosure?
Free to submit in your first year Free resources available
Page 24
www.cdp.net | @CDP
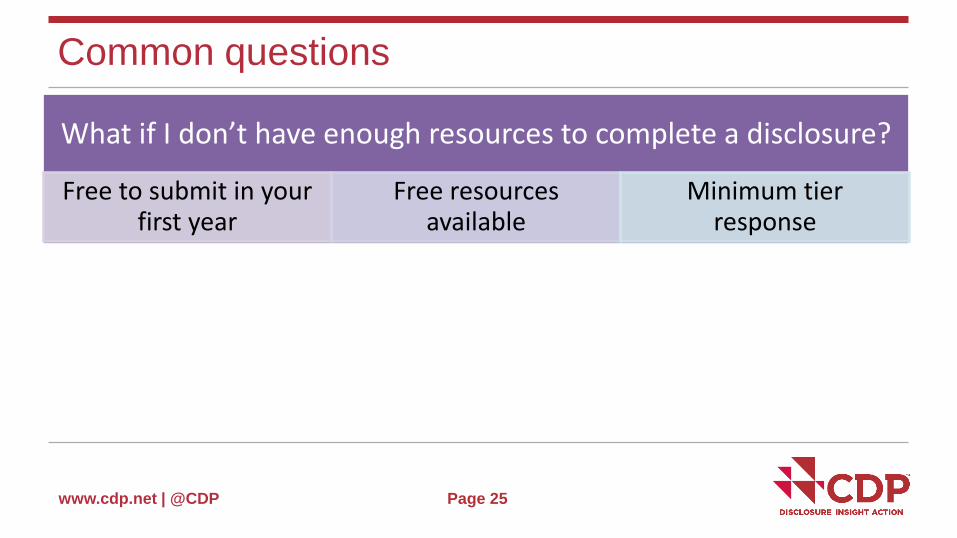
Common questions
What if I don’t have enough resources to complete a disclosure?
Free to submit in your first year
Free resources available
Minimum tier response
Page 25
www.cdp.net | @CDP
Common questions
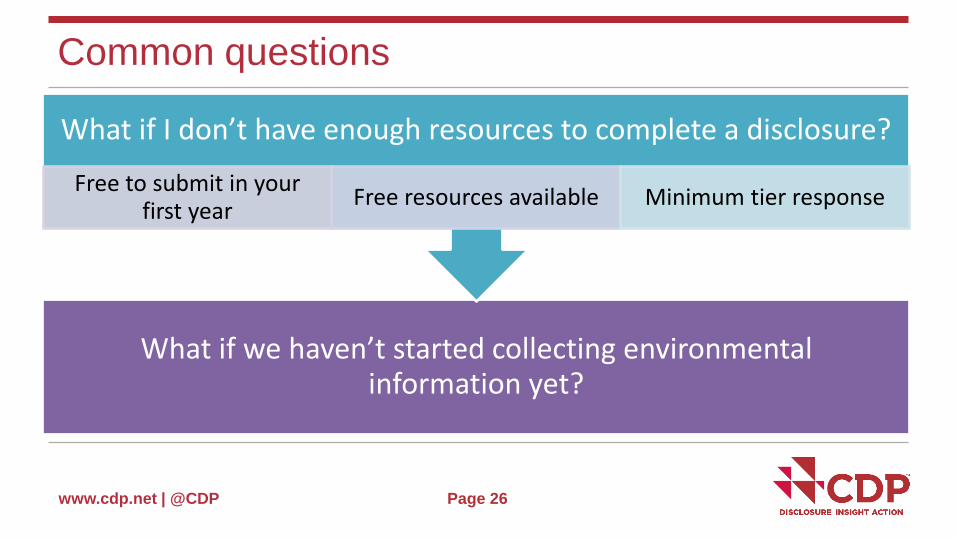
What if we haven’t started collecting environmental information yet?
What if I don’t have enough resources to complete a disclosure?
Free to submit in your first year
Free resources available Minimum tier response
Page 26
www.cdp.net | @CDP
Common questions
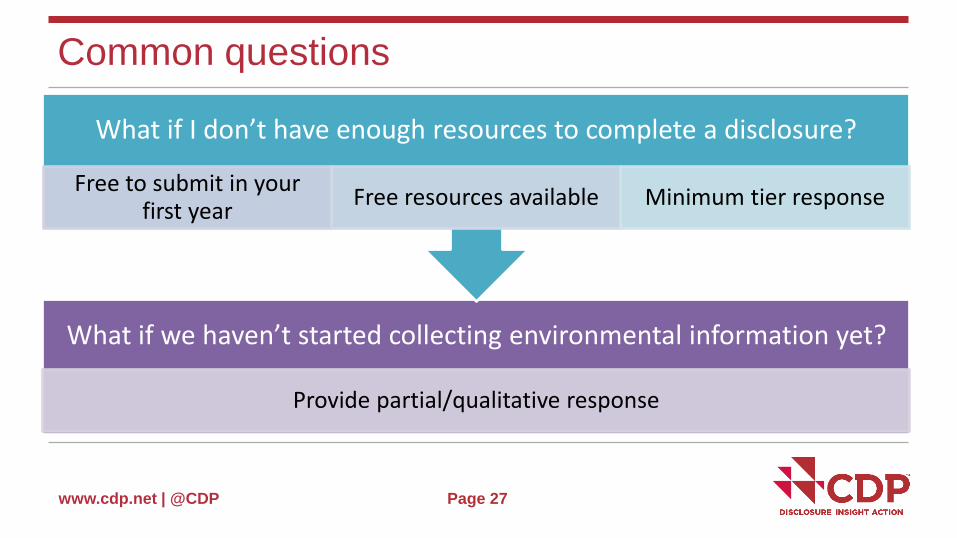
What if we haven’t started collecting environmental information yet?
Provide partial/qualitative response
What if I don’t have enough resources to complete a disclosure?
Free to submit in your first year
Free resources available Minimum tier response
Page 27
www.cdp.net | @CDP
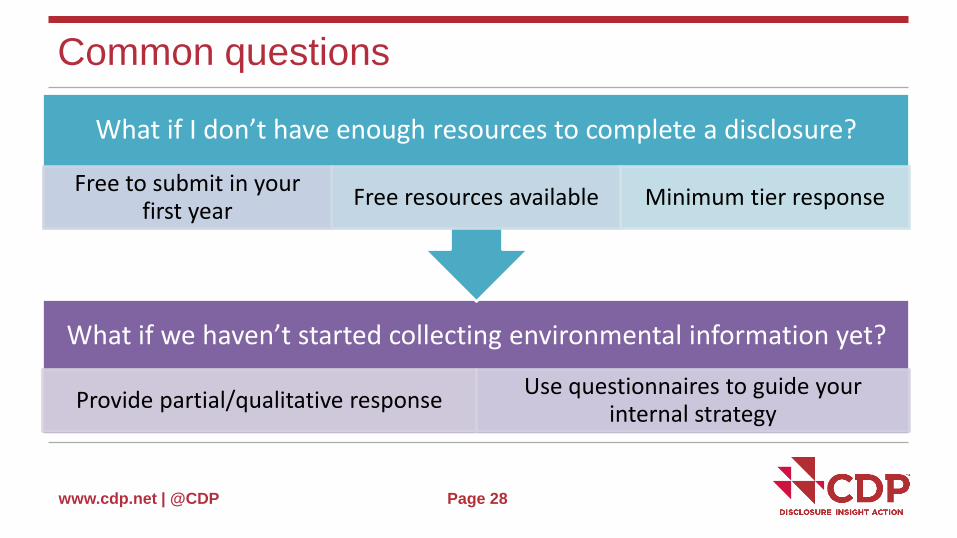
Common questions
What if we haven’t started collecting environmental information yet?
Provide partial/qualitative responseUse questionnaires to guide your
internal strategy
What if I don’t have enough resources to complete a disclosure?
Free to submit in your first year
Free resources available Minimum tier response
Page 28
www.cdp.net | @CDP
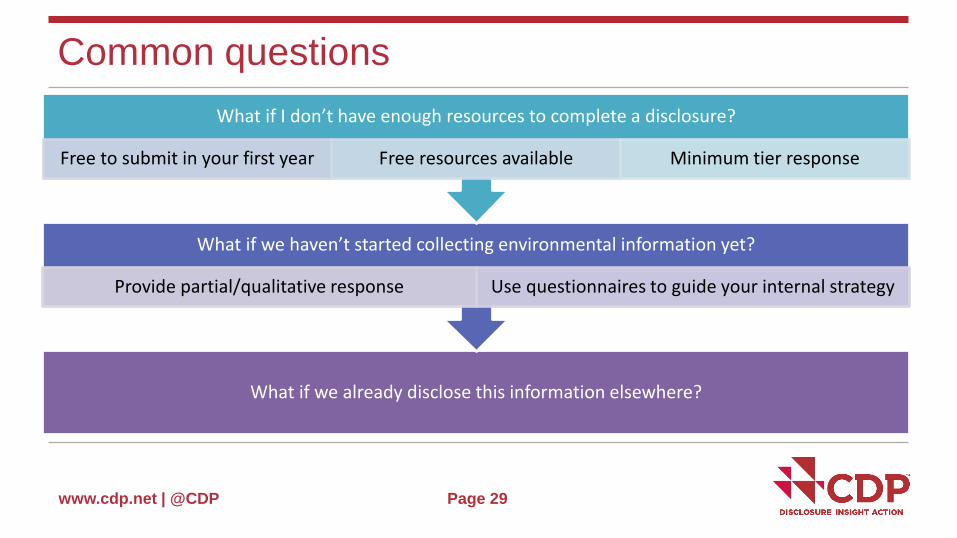
Common questions
What if we already disclose this information elsewhere?
What if we haven’t started collecting environmental information yet?
Provide partial/qualitative response Use questionnaires to guide your internal strategy
What if I don’t have enough resources to complete a disclosure?
Free to submit in your first year Free resources available Minimum tier response
Page 29
www.cdp.net | @CDP
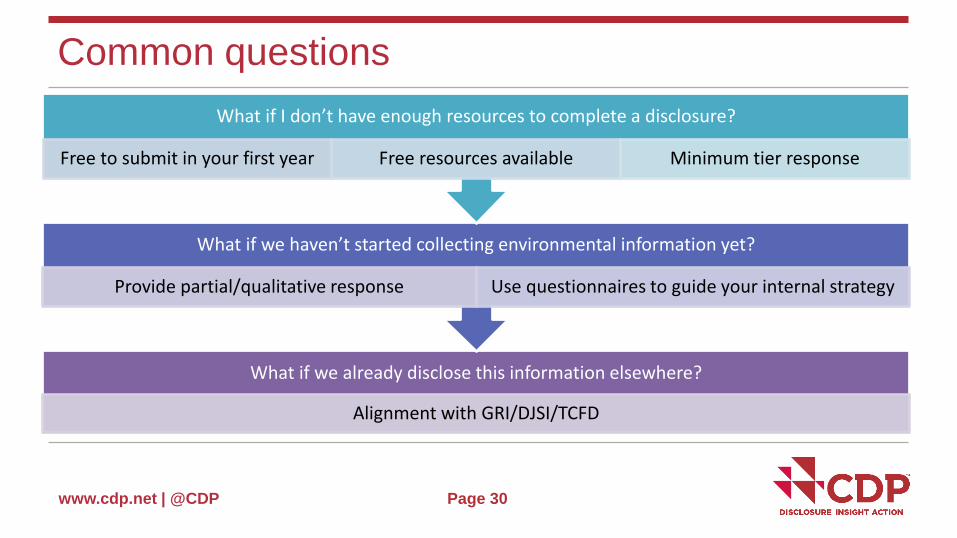
Common questions
What if we already disclose this information elsewhere?
Alignment with GRI/DJSI/TCFD
What if we haven’t started collecting environmental information yet?
Provide partial/qualitative response Use questionnaires to guide your internal strategy
What if I don’t have enough resources to complete a disclosure?
Free to submit in your first year Free resources available Minimum tier response
Page 30
www.cdp.net | @CDP
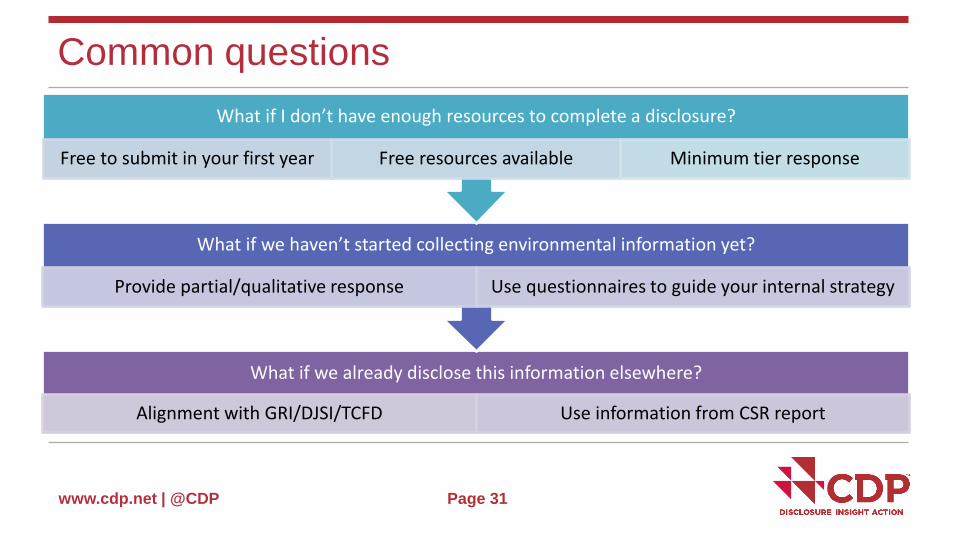
Common questions
What if we already disclose this information elsewhere?
Alignment with GRI/DJSI/TCFD Use information from CSR report
What if we haven’t started collecting environmental information yet?
Provide partial/qualitative response Use questionnaires to guide your internal strategy
What if I don’t have enough resources to complete a disclosure?
Free to submit in your first year Free resources available Minimum tier response
Page 31
www.cdp.net | @CDP
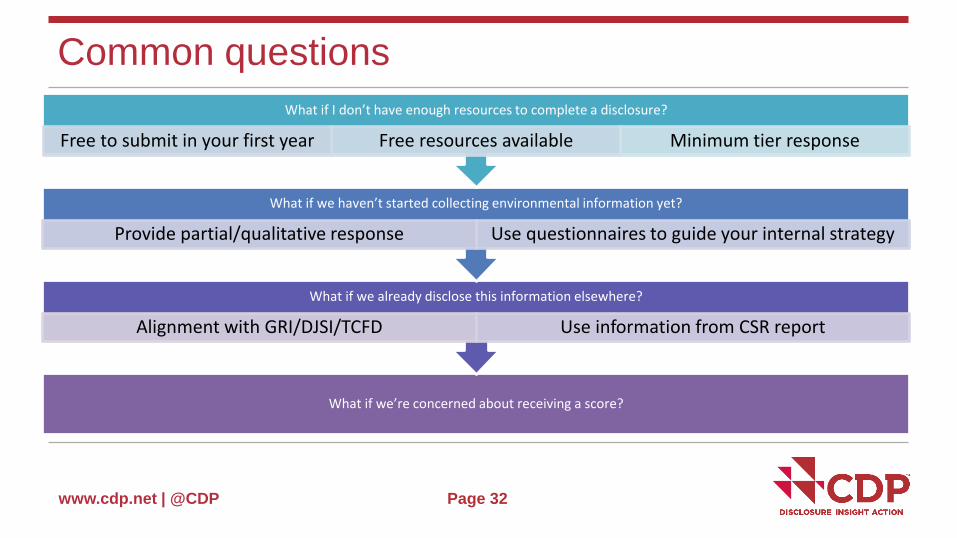
Common questions
What if we’re concerned about receiving a score?
What if we already disclose this information elsewhere?
Alignment with GRI/DJSI/TCFD Use information from CSR report
What if we haven’t started collecting environmental information yet?
Provide partial/qualitative response Use questionnaires to guide your internal strategy
What if I don’t have enough resources to complete a disclosure?
Free to submit in your first year Free resources available Minimum tier response
Page 32
www.cdp.net | @CDP
Common questions
What if we’re concerned about receiving a score?
Fully transparent scoring methodologies
What if we already disclose this information elsewhere?
Alignment with GRI/DJSI/TCFD Use information from CSR report
What if we haven’t started collecting environmental information yet?
Provide partial/qualitative response Use questionnaires to guide your internal strategy
What if I don’t have enough resources to complete a disclosure?
Free to submit in your first year Free resources available Minimum tier response
Page 33
www.cdp.net | @CDP
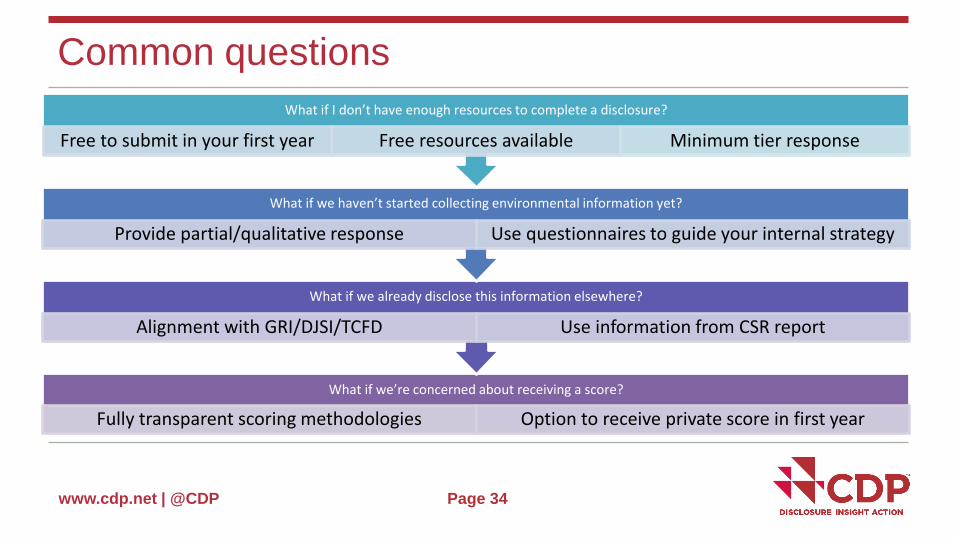
Common questions
What if we’re concerned about receiving a score?
Fully transparent scoring methodologies Option to receive private score in first year
What if we already disclose this information elsewhere?
Alignment with GRI/DJSI/TCFD Use information from CSR report
What if we haven’t started collecting environmental information yet?
Provide partial/qualitative response Use questionnaires to guide your internal strategy
What if I don’t have enough resources to complete a disclosure?
Free to submit in your first year Free resources available Minimum tier response
Page 34
www.cdp.net | @CDP
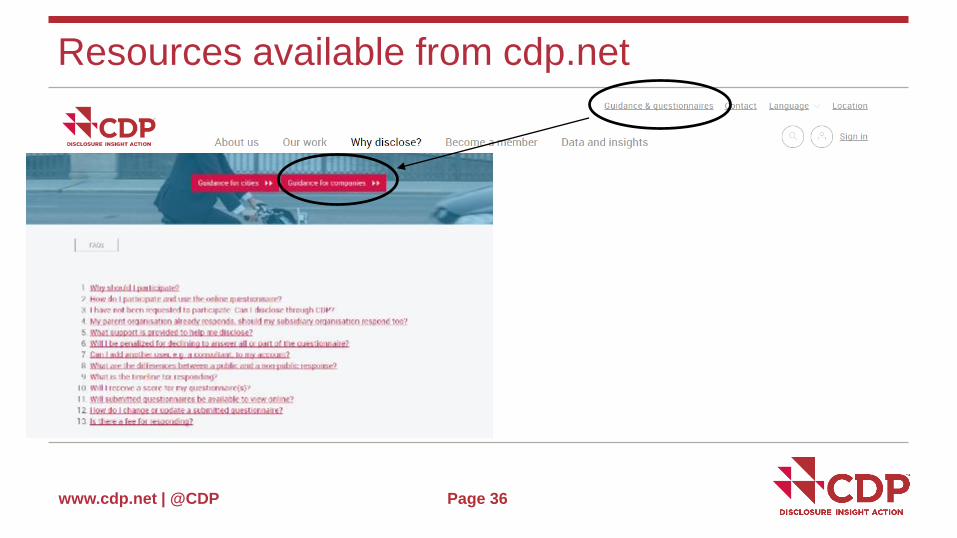
Resources available from cdp.net
Page 35
www.cdp.net | @CDP
Resources available from cdp.net
Page 36
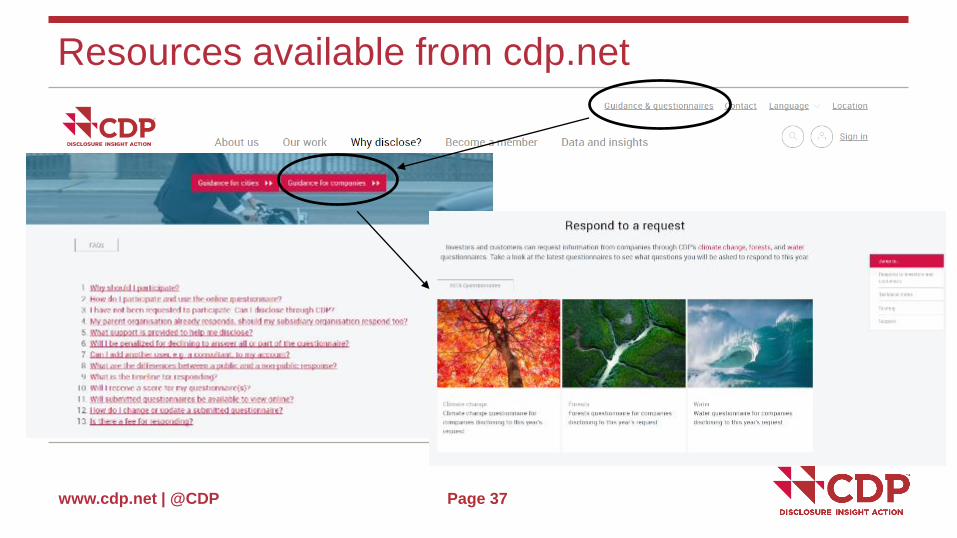
www.cdp.net | @CDP
Resources available from cdp.net
Page 37
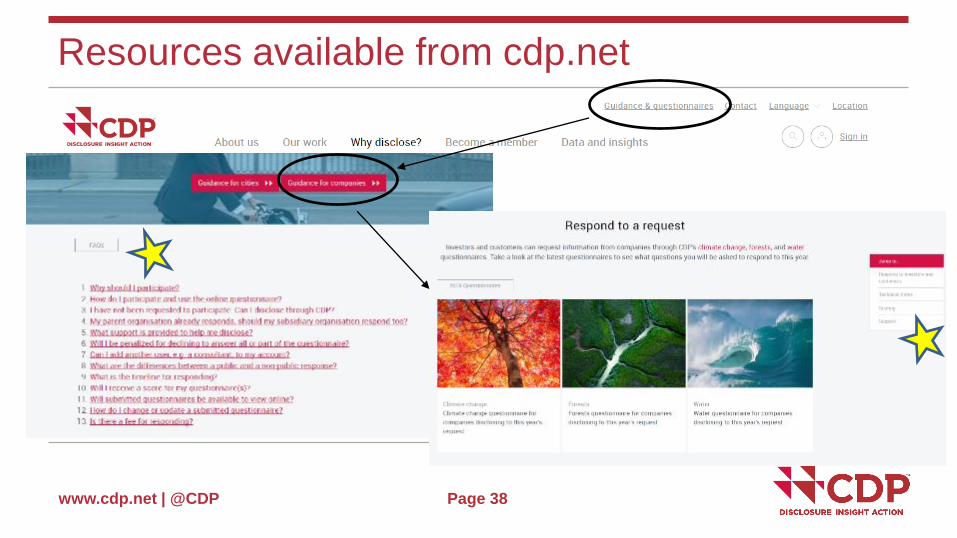
www.cdp.net | @CDP
Resources available from cdp.net
Page 38
www.cdp.net | @CDP Page 39
2018 Technical Overview
www.cdp.net | @CDP
What will you hear about?
Context
Overview of what’s changed for 2018 disclosure
Cross-theme developments (C, W, F)
Company sector classification
Revised general climate questionnaire
New climate sector questionnaires
Page 40
www.cdp.net | @CDP
Context:
CDP is evolving its approach to disclosure
Page 41
www.cdp.net | @CDP
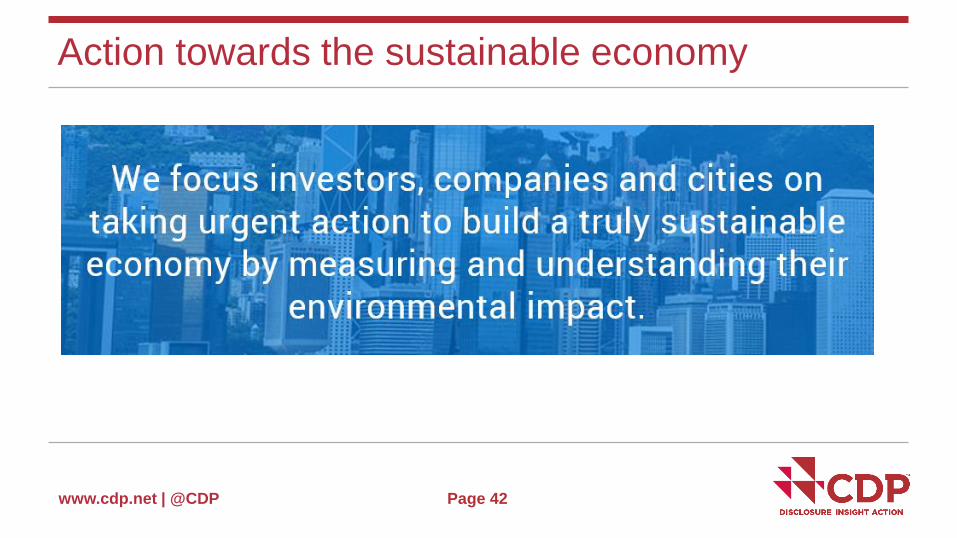
Action towards the sustainable economy
Page 42
www.cdp.net | @CDP
Aims and benefits in 2018
The evolution is in response to growing market needs and the rising urgency
of the environmental challenges that the world faces
We are introducing more sector-focused, forward-looking disclosures while
retaining the majority of data points requested in previous years
We will deliver more relevant and higher-quality data to inform investment,
procurement, management and other strategic decisions via an improved and
more valuable disclosure experience for an increasing number of companies.
Page 43
www.cdp.net | @CDP
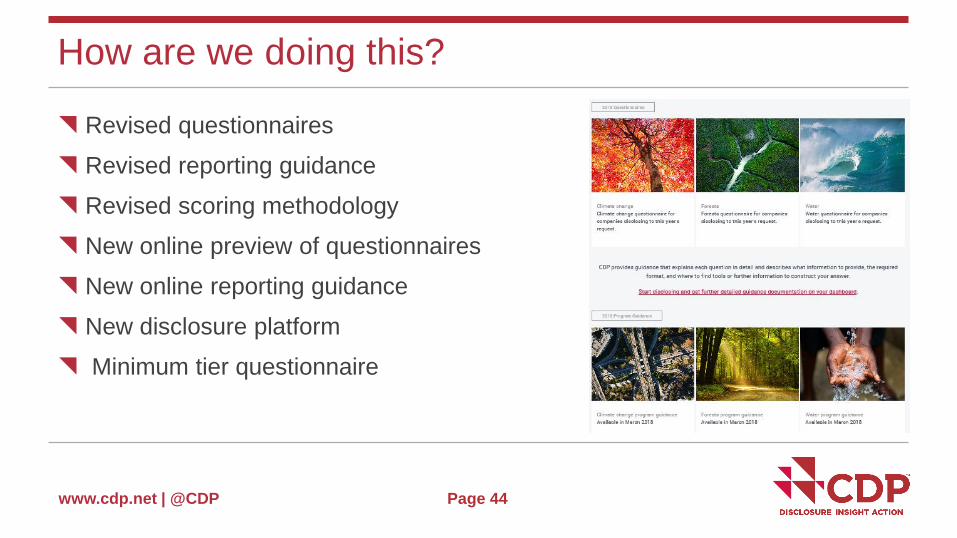
How are we doing this?
Revised questionnaires
Revised reporting guidance
Revised scoring methodology
New online preview of questionnaires
New online reporting guidance
New disclosure platform
Minimum tier questionnaire
Page 44
www.cdp.net | @CDP
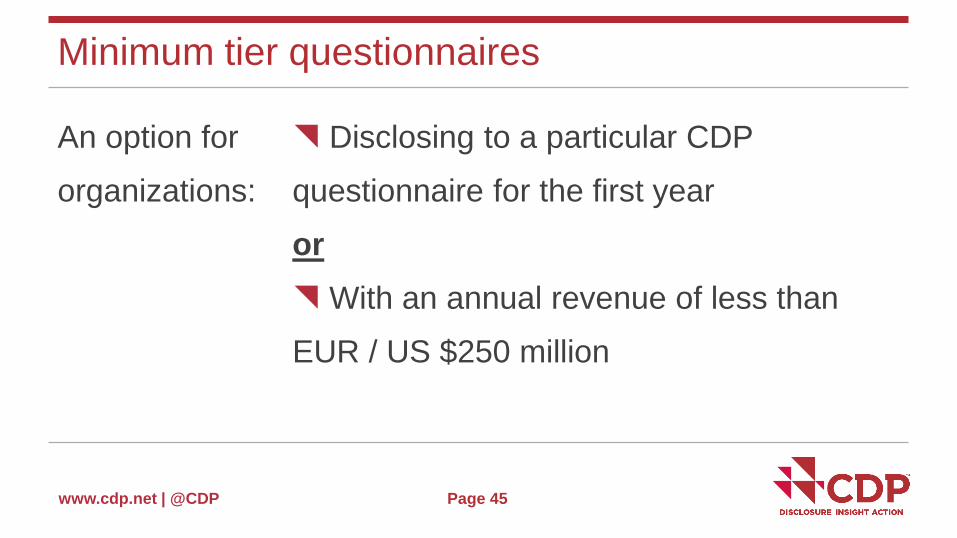
Minimum tier questionnaires
An option for
organizations:
Disclosing to a particular CDP
questionnaire for the first year
or
With an annual revenue of less than
EUR / US $250 million
Page 45
www.cdp.net | @CDP
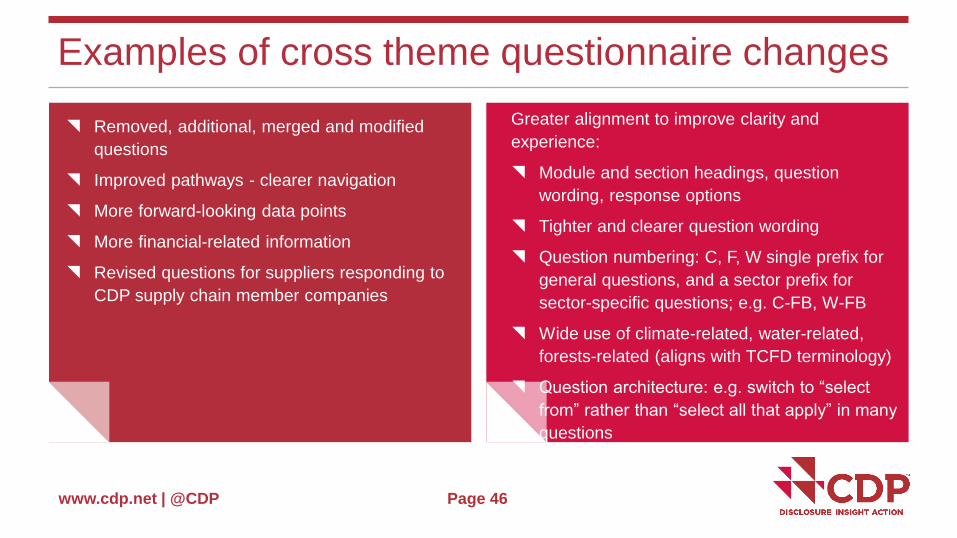
Examples of cross theme questionnaire changes
Removed, additional, merged and modified
questions
Improved pathways - clearer navigation
More forward-looking data points
More financial-related information
Revised questions for suppliers responding to
CDP supply chain member companies
Greater alignment to improve clarity and
experience:
Module and section headings, question
wording, response options
Tighter and clearer question wording
Question numbering: C, F, W single prefix for
general questions, and a sector prefix for
sector-specific questions; e.g. C-FB, W-FB
Wide use of climate-related, water-related,
forests-related (aligns with TCFD terminology)
Question architecture: e.g. switch to “select
from” rather than “select all that apply” in many
questions
Page 46
www.cdp.net | @CDP
Company sector classification
Page 47
www.cdp.net | @CDP
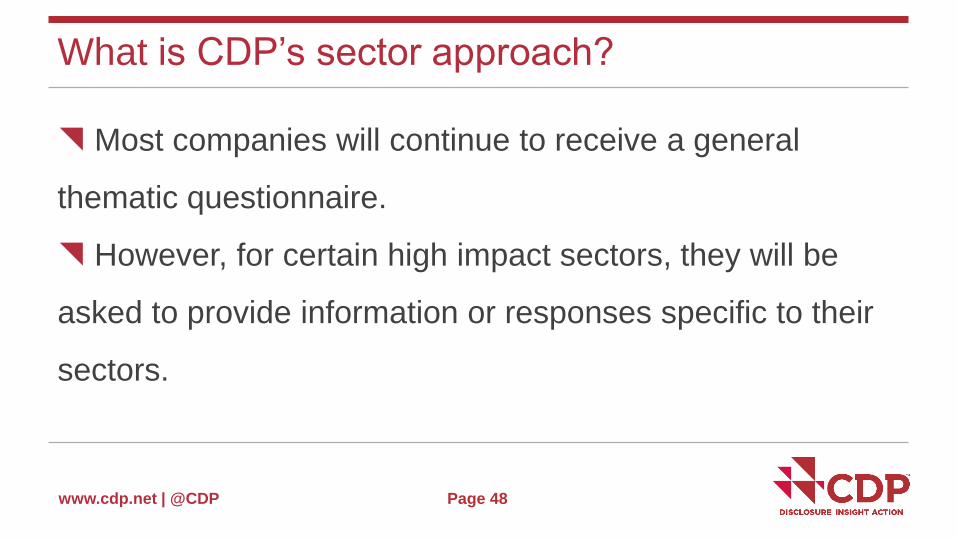
What is CDP’s sector approach?
Most companies will continue to receive a general
thematic questionnaire.
However, for certain high impact sectors, they will be
asked to provide information or responses specific to their
sectors.
Page 48
www.cdp.net | @CDP
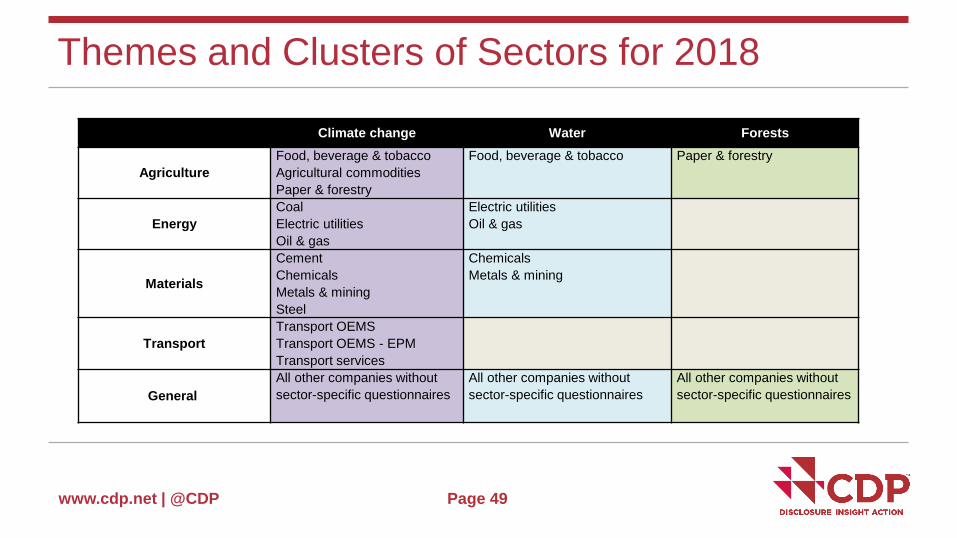
Themes and Clusters of Sectors for 2018
Page 49
Climate change Water Forests
Agriculture
Food, beverage & tobacco
Agricultural commodities
Paper & forestry
Food, beverage & tobacco Paper & forestry
Energy
Coal
Electric utilities
Oil & gas
Electric utilities
Oil & gas
Materials
Cement
Chemicals
Metals & mining
Steel
Chemicals
Metals & mining
Transport
Transport OEMS
Transport OEMS - EPM
Transport services
General
All other companies without
sector-specific questionnaires
All other companies without
sector-specific questionnaires
All other companies without
sector-specific questionnaires
www.cdp.net | @CDP
CDP’s new classification system (CDP-ACS)
Framework developed by CDP to categorize companies by the most
relevant sectors.
CDP-ACS focuses on the diverse activities from which companies
derive revenue and associates these with the impacts to their business
from climate change, deforestation, and water security.
New approach ensures a better understanding of company actions
according to their environmental risk, opportunity, and impact.
Page 50
www.cdp.net | @CDP
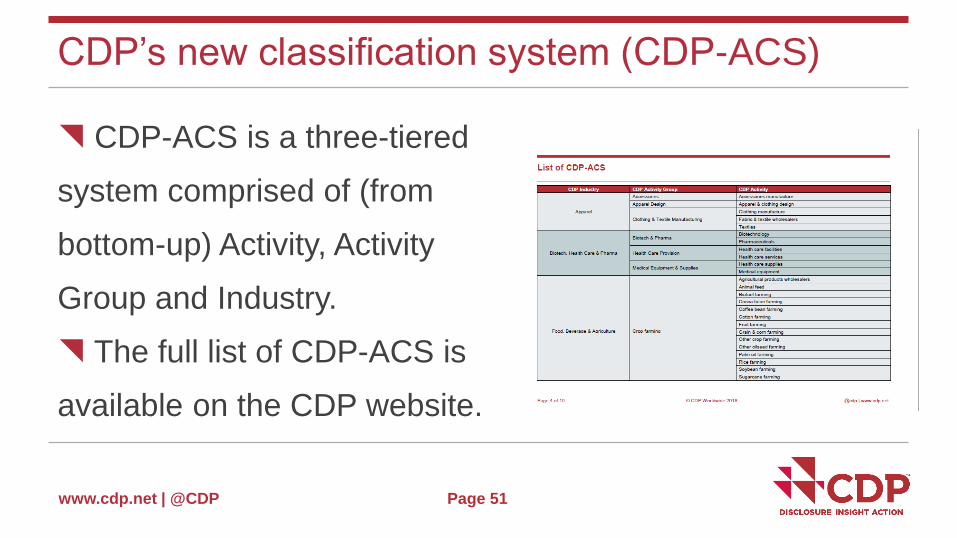
CDP’s new classification system (CDP-ACS)
CDP-ACS is a three-tiered
system comprised of (from
bottom-up) Activity, Activity
Group and Industry.
The full list of CDP-ACS is
available on the CDP website.
Page 51

www.cdp.net | @CDP Page 52
Introduction to the 2018
Climate Change
Questionnaire
www.cdp.net | @CDP
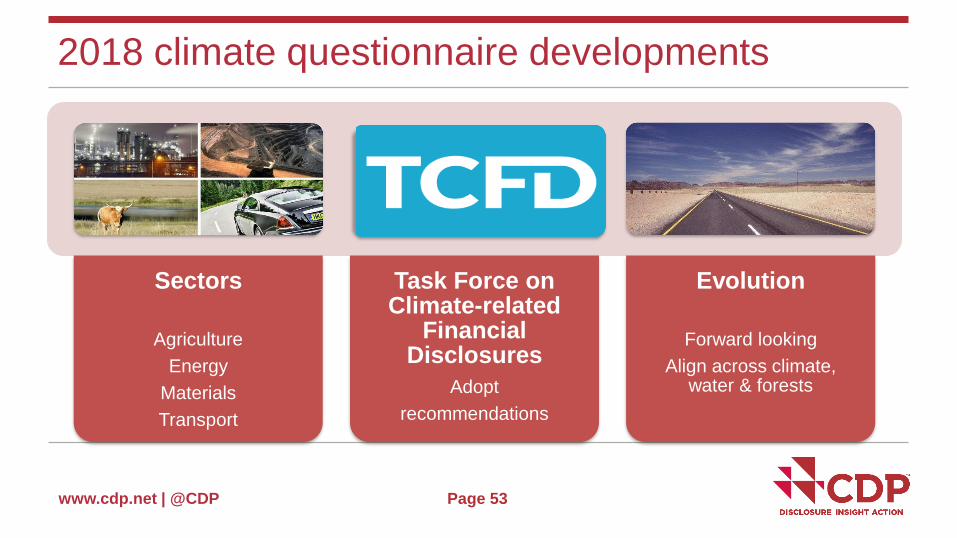
2018 climate questionnaire developments
Page 53
Sectors
Agriculture
Energy
Materials
Transport
Task Force on Climate-related
Financial Disclosures
Adopt
recommendations
Evolution
Forward looking
Align across climate, water & forests
www.cdp.net | @CDP Page 54
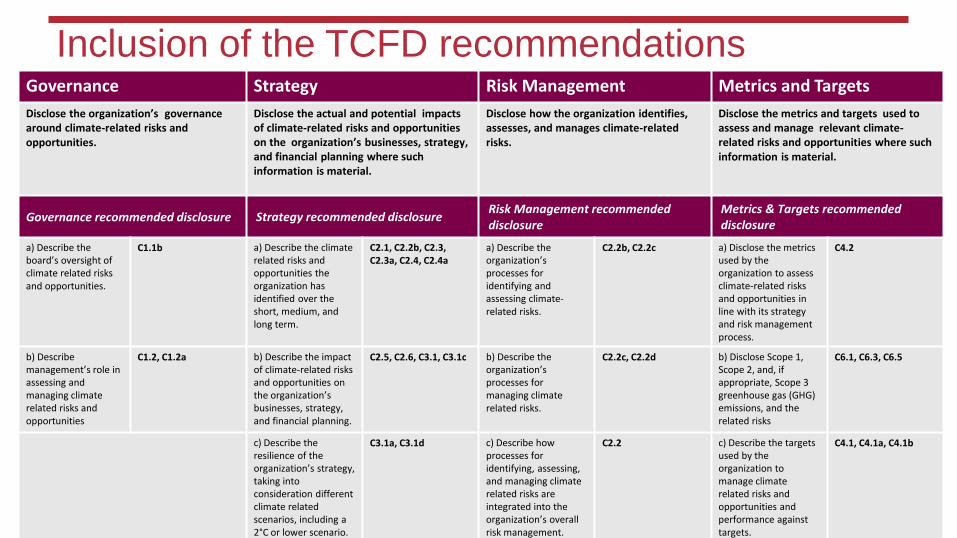
Inclusion of the TCFD recommendationsGovernance Strategy Risk Management Metrics and Targets
Disclose the organization’s governance around climate-related risks and opportunities.
Disclose the actual and potential impacts of climate-related risks and opportunities on the organization’s businesses, strategy, and financial planning where such information is material.
Disclose how the organization identifies, assesses, and manages climate-related risks.
Disclose the metrics and targets used to assess and manage relevant climate-related risks and opportunities where such information is material.
Governance recommended disclosure Strategy recommended disclosureRisk Management recommended disclosure
Metrics & Targets recommended disclosure
a) Describe the board’s oversight of climate related risks and opportunities.
C1.1b a) Describe the climate related risks and opportunities the organization has identified over the short, medium, and long term.
C2.1, C2.2b, C2.3, C2.3a, C2.4, C2.4a
a) Describe the organization’s processes for identifying and assessing climate-related risks.
C2.2b, C2.2c a) Disclose the metrics used by the organization to assess climate-related risks and opportunities in line with its strategy and risk management process.
C4.2
b) Describe management’s role in assessing and managing climate related risks and opportunities
C1.2, C1.2a b) Describe the impact of climate-related risks and opportunities on the organization’s businesses, strategy, and financial planning.
C2.5, C2.6, C3.1, C3.1c b) Describe the organization’s processes for managing climate related risks.
C2.2c, C2.2d b) Disclose Scope 1, Scope 2, and, if appropriate, Scope 3 greenhouse gas (GHG) emissions, and the related risks
C6.1, C6.3, C6.5
c) Describe the resilience of the organization’s strategy, taking into consideration different climate related scenarios, including a 2°C or lower scenario.
C3.1a, C3.1d c) Describe how processes for identifying, assessing, and managing climate related risks are integrated into the organization’s overall risk management.
C2.2 c) Describe the targets used by the organization to manage climate related risks and opportunities and performance against targets.
C4.1, C4.1a, C4.1b
www.cdp.net | @CDP
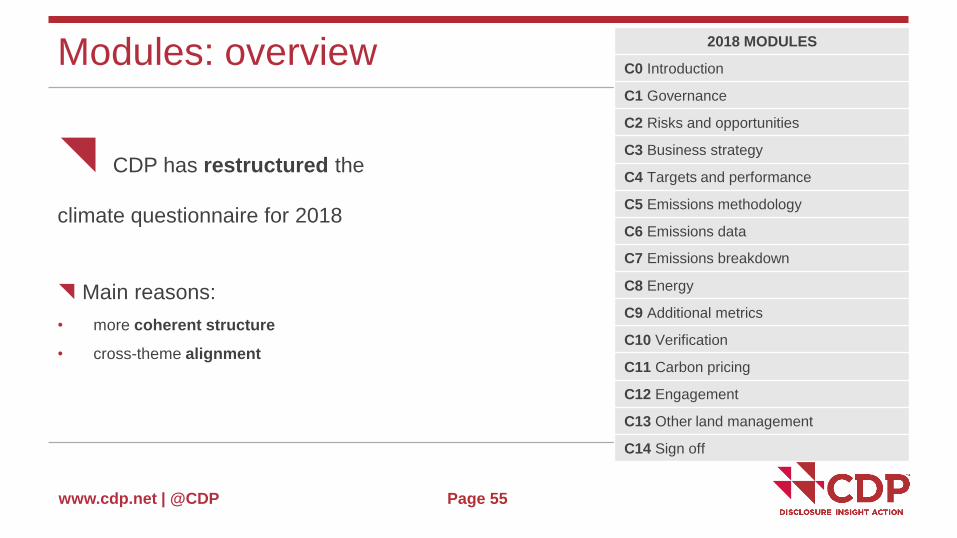
Modules: overview
CDP has restructured the
climate questionnaire for 2018
Main reasons:
• more coherent structure
• cross-theme alignment
Page 55
2018 MODULES
C0 Introduction
C1 Governance
C2 Risks and opportunities
C3 Business strategy
C4 Targets and performance
C5 Emissions methodology
C6 Emissions data
C7 Emissions breakdown
C8 Energy
C9 Additional metrics
C10 Verification
C11 Carbon pricing
C12 Engagement
C13 Other land management
C14 Sign off
www.cdp.net | @CDP
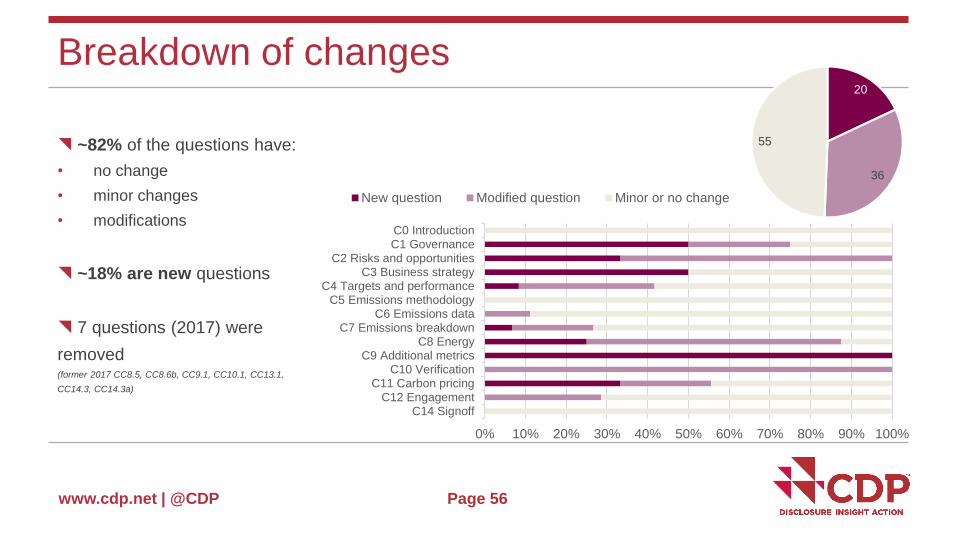
Breakdown of changes
Page 56
~82% of the questions have:
• no change
• minor changes
• modifications
~18% are new questions
7 questions (2017) were
removed(former 2017 CC8.5, CC8.6b, CC9.1, CC10.1, CC13.1,
CC14.3, CC14.3a)
0% 10% 20% 30% 40% 50% 60% 70% 80% 90% 100%
C14 SignoffC12 Engagement
C11 Carbon pricingC10 Verification
C9 Additional metricsC8 Energy
C7 Emissions breakdownC6 Emissions data
C5 Emissions methodologyC4 Targets and performance
C3 Business strategyC2 Risks and opportunities
C1 GovernanceC0 Introduction
New question Modified question Minor or no change
20
36
55
www.cdp.net | @CDP
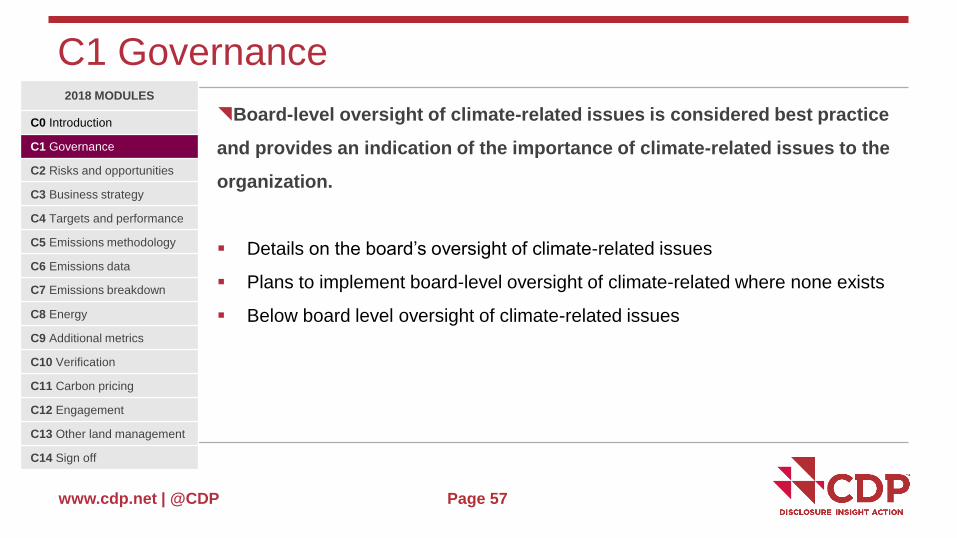
C1 Governance
Page 57
Board-level oversight of climate-related issues is considered best practice
and provides an indication of the importance of climate-related issues to the
organization.
Details on the board’s oversight of climate-related issues
Plans to implement board-level oversight of climate-related where none exists
Below board level oversight of climate-related issues
2018 MODULES
C0 Introduction
C1 Governance
C2 Risks and opportunities
C3 Business strategy
C4 Targets and performance
C5 Emissions methodology
C6 Emissions data
C7 Emissions breakdown
C8 Energy
C9 Additional metrics
C10 Verification
C11 Carbon pricing
C12 Engagement
C13 Other land management
C14 Sign off
www.cdp.net | @CDP
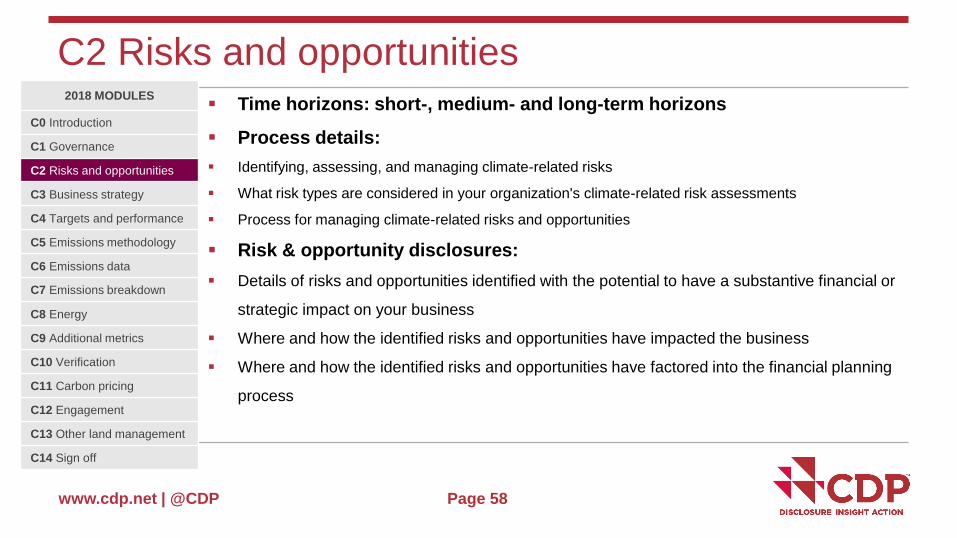
C2 Risks and opportunities
Page 58
2018 MODULES
C0 Introduction
C1 Governance
C2 Risks and opportunities
C3 Business strategy
C4 Targets and performance
C5 Emissions methodology
C6 Emissions data
C7 Emissions breakdown
C8 Energy
C9 Additional metrics
C10 Verification
C11 Carbon pricing
C12 Engagement
C13 Other land management
C14 Sign off
Time horizons: short-, medium- and long-term horizons
Process details:
Identifying, assessing, and managing climate-related risks
What risk types are considered in your organization's climate-related risk assessments
Process for managing climate-related risks and opportunities
Risk & opportunity disclosures:
Details of risks and opportunities identified with the potential to have a substantive financial or
strategic impact on your business
Where and how the identified risks and opportunities have impacted the business
Where and how the identified risks and opportunities have factored into the financial planning
process
www.cdp.net | @CDP
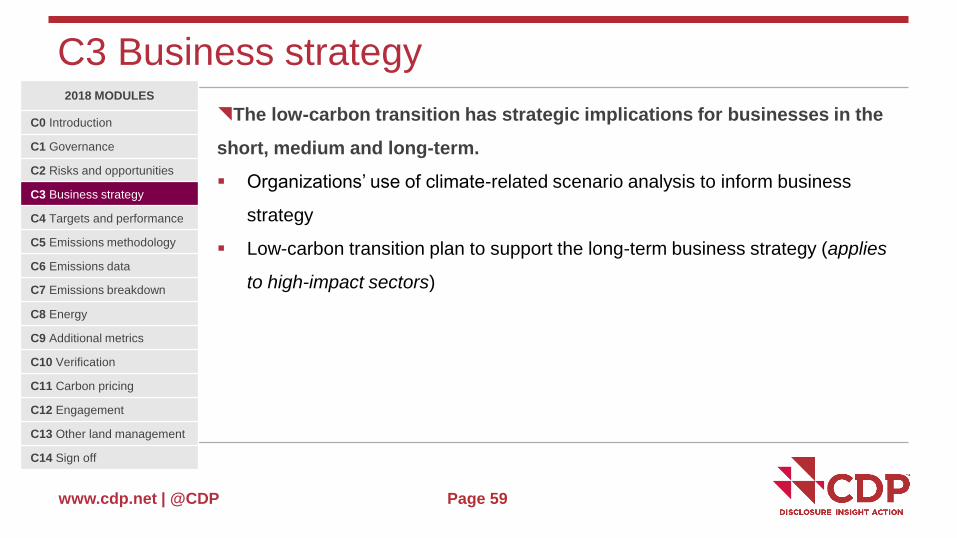
C3 Business strategy
Page 59
2018 MODULES
C0 Introduction
C1 Governance
C2 Risks and opportunities
C3 Business strategy
C4 Targets and performance
C5 Emissions methodology
C6 Emissions data
C7 Emissions breakdown
C8 Energy
C9 Additional metrics
C10 Verification
C11 Carbon pricing
C12 Engagement
C13 Other land management
C14 Sign off
The low-carbon transition has strategic implications for businesses in the
short, medium and long-term.
Organizations’ use of climate-related scenario analysis to inform business
strategy
Low-carbon transition plan to support the long-term business strategy (applies
to high-impact sectors)
www.cdp.net | @CDP Page 60
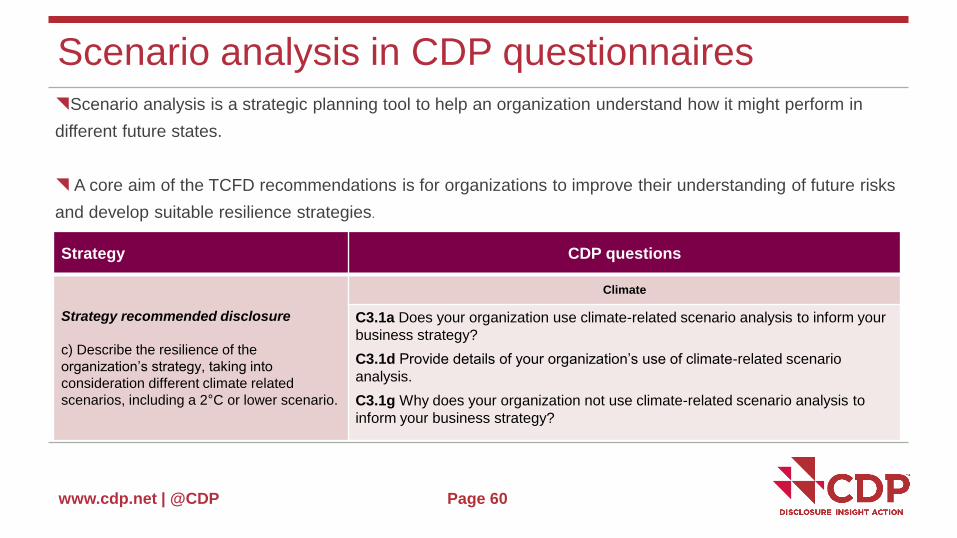
Scenario analysis in CDP questionnaires
Strategy CDP questions
Strategy recommended disclosure
c) Describe the resilience of the
organization’s strategy, taking into
consideration different climate related
scenarios, including a 2°C or lower scenario.
Climate
C3.1a Does your organization use climate-related scenario analysis to inform your
business strategy?
C3.1d Provide details of your organization’s use of climate-related scenario
analysis.
C3.1g Why does your organization not use climate-related scenario analysis to
inform your business strategy?
Scenario analysis is a strategic planning tool to help an organization understand how it might perform in
different future states.
A core aim of the TCFD recommendations is for organizations to improve their understanding of future risks
and develop suitable resilience strategies.
www.cdp.net | @CDP
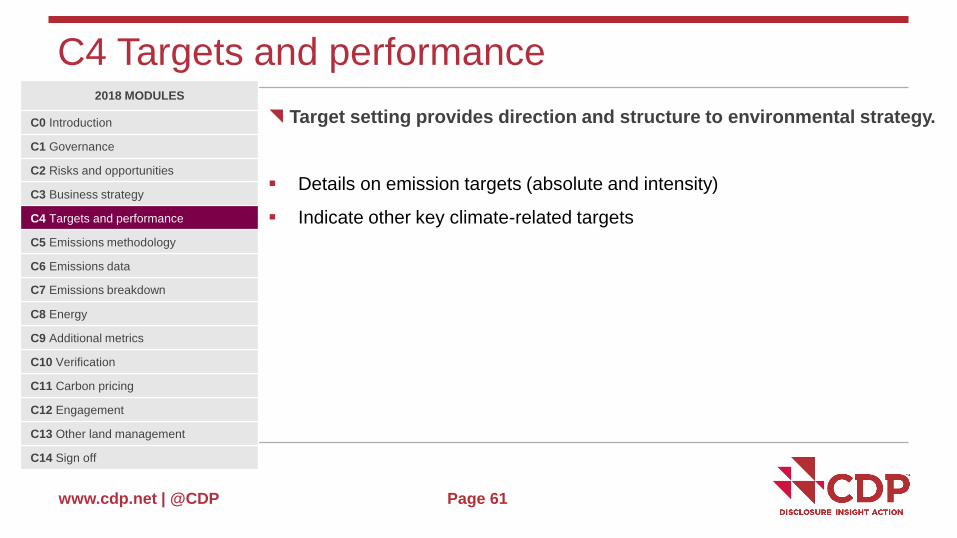
C4 Targets and performance
Page 61
2018 MODULES
C0 Introduction
C1 Governance
C2 Risks and opportunities
C3 Business strategy
C4 Targets and performance
C5 Emissions methodology
C6 Emissions data
C7 Emissions breakdown
C8 Energy
C9 Additional metrics
C10 Verification
C11 Carbon pricing
C12 Engagement
C13 Other land management
C14 Sign off
Target setting provides direction and structure to environmental strategy.
Details on emission targets (absolute and intensity)
Indicate other key climate-related targets
www.cdp.net | @CDP
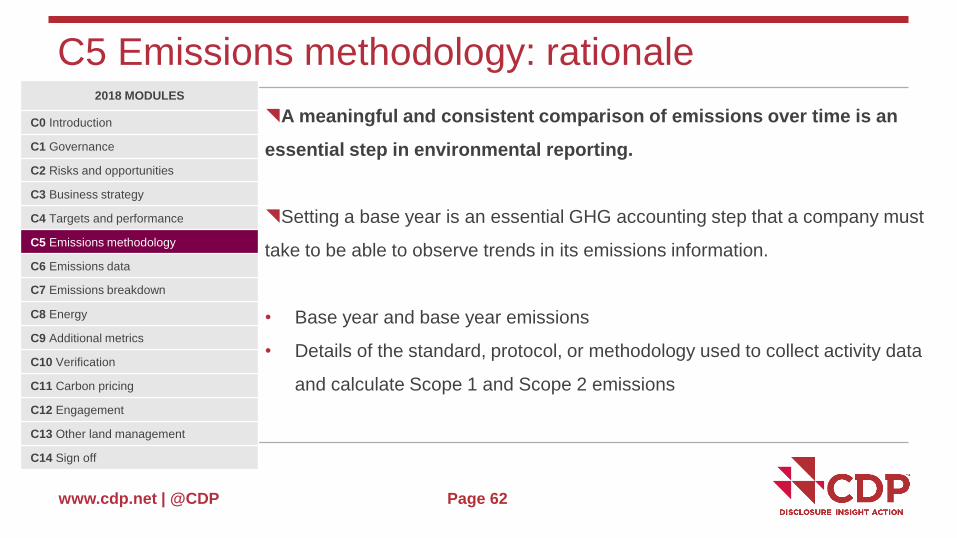
C5 Emissions methodology: rationale
Page 62
2018 MODULES
C0 Introduction
C1 Governance
C2 Risks and opportunities
C3 Business strategy
C4 Targets and performance
C5 Emissions methodology
C6 Emissions data
C7 Emissions breakdown
C8 Energy
C9 Additional metrics
C10 Verification
C11 Carbon pricing
C12 Engagement
C13 Other land management
C14 Sign off
A meaningful and consistent comparison of emissions over time is an
essential step in environmental reporting.
Setting a base year is an essential GHG accounting step that a company must
take to be able to observe trends in its emissions information.
• Base year and base year emissions
• Details of the standard, protocol, or methodology used to collect activity data
and calculate Scope 1 and Scope 2 emissions
www.cdp.net | @CDP
C6 Emissions data
Page 63
2018 MODULES
C0 Introduction
C1 Governance
C2 Risks and opportunities
C3 Business strategy
C4 Targets and performance
C5 Emissions methodology
C6 Emissions data
C7 Emissions breakdown
C8 Energy
C9 Additional metrics
C10 Verification
C11 Carbon pricing
C12 Engagement
C13 Other land management
C14 Sign off
Reporting emissions is best practice and a pre-requisite to understanding
and reducing negative environmental impacts.
Emissions intensity metrics
www.cdp.net | @CDP
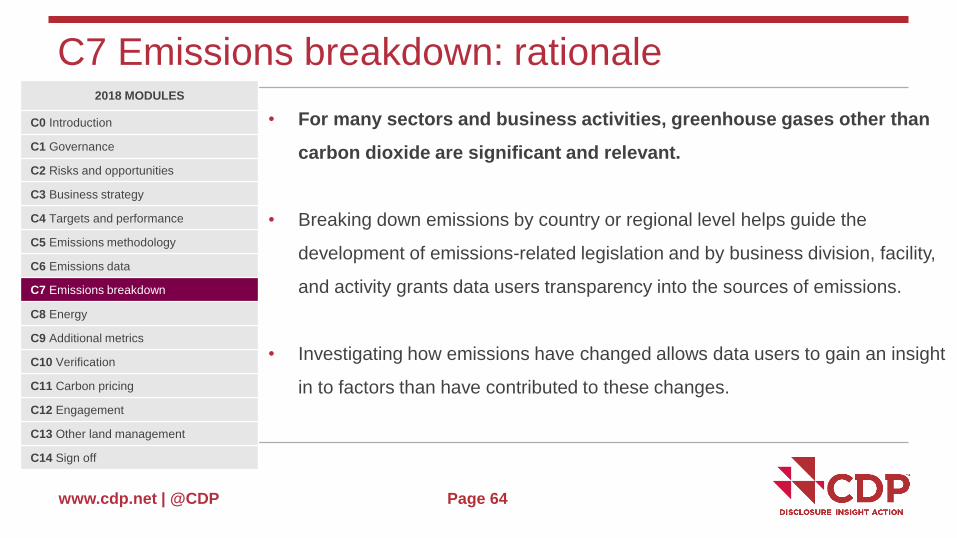
C7 Emissions breakdown: rationale
Page 64
2018 MODULES
C0 Introduction
C1 Governance
C2 Risks and opportunities
C3 Business strategy
C4 Targets and performance
C5 Emissions methodology
C6 Emissions data
C7 Emissions breakdown
C8 Energy
C9 Additional metrics
C10 Verification
C11 Carbon pricing
C12 Engagement
C13 Other land management
C14 Sign off
• For many sectors and business activities, greenhouse gases other than
carbon dioxide are significant and relevant.
• Breaking down emissions by country or regional level helps guide the
development of emissions-related legislation and by business division, facility,
and activity grants data users transparency into the sources of emissions.
• Investigating how emissions have changed allows data users to gain an insight
in to factors than have contributed to these changes.
www.cdp.net | @CDP
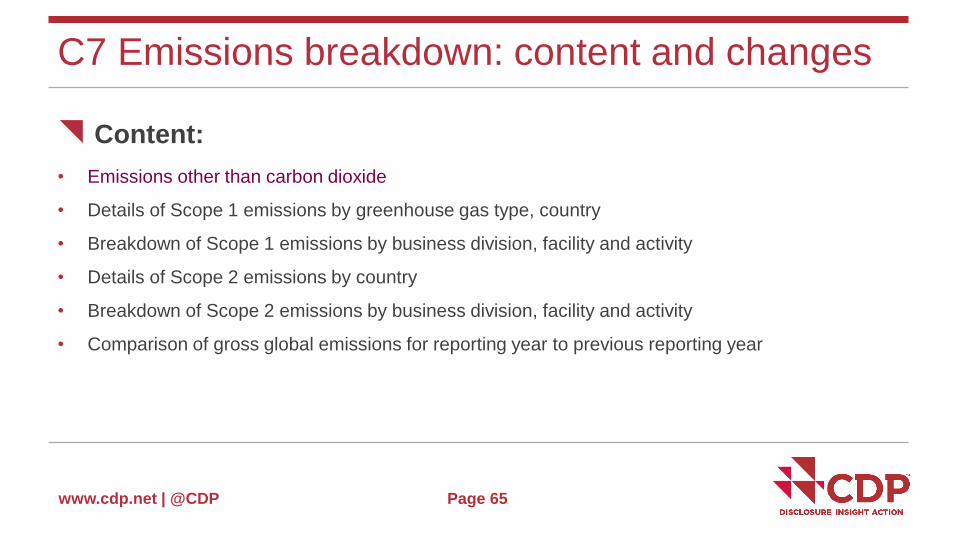
C7 Emissions breakdown: content and changes
Page 65
Content:
• Emissions other than carbon dioxide
• Details of Scope 1 emissions by greenhouse gas type, country
• Breakdown of Scope 1 emissions by business division, facility and activity
• Details of Scope 2 emissions by country
• Breakdown of Scope 2 emissions by business division, facility and activity
• Comparison of gross global emissions for reporting year to previous reporting year
www.cdp.net | @CDP
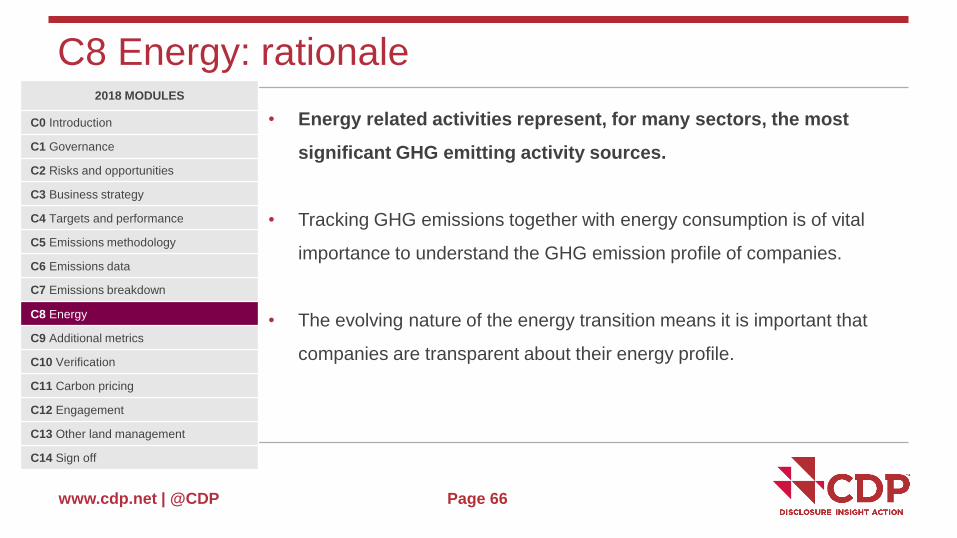
C8 Energy: rationale
Page 66
2018 MODULES
C0 Introduction
C1 Governance
C2 Risks and opportunities
C3 Business strategy
C4 Targets and performance
C5 Emissions methodology
C6 Emissions data
C7 Emissions breakdown
C8 Energy
C9 Additional metrics
C10 Verification
C11 Carbon pricing
C12 Engagement
C13 Other land management
C14 Sign off
• Energy related activities represent, for many sectors, the most
significant GHG emitting activity sources.
• Tracking GHG emissions together with energy consumption is of vital
importance to understand the GHG emission profile of companies.
• The evolving nature of the energy transition means it is important that
companies are transparent about their energy profile.
www.cdp.net | @CDP
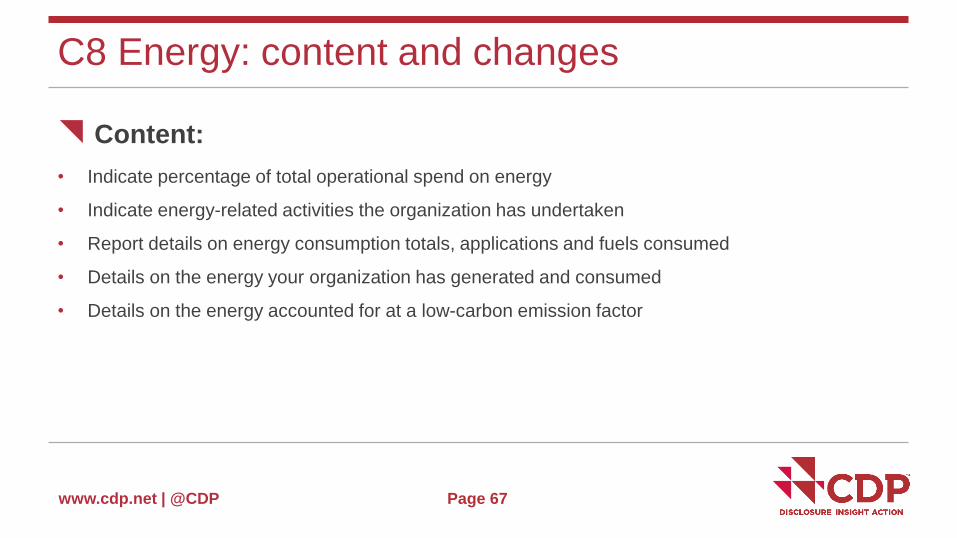
C8 Energy: content and changes
Page 67
Content:
• Indicate percentage of total operational spend on energy
• Indicate energy-related activities the organization has undertaken
• Report details on energy consumption totals, applications and fuels consumed
• Details on the energy your organization has generated and consumed
• Details on the energy accounted for at a low-carbon emission factor
www.cdp.net | @CDP
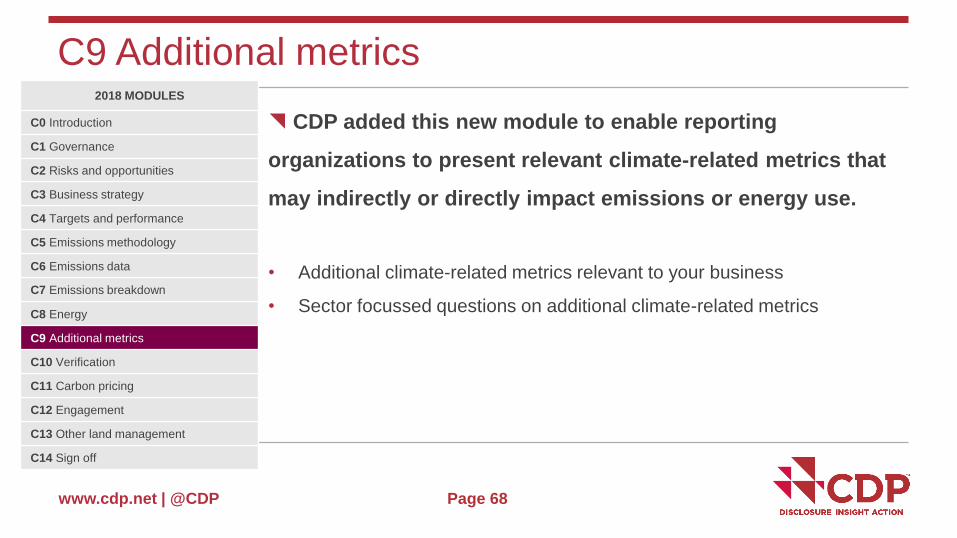
C9 Additional metrics
Page 68
2018 MODULES
C0 Introduction
C1 Governance
C2 Risks and opportunities
C3 Business strategy
C4 Targets and performance
C5 Emissions methodology
C6 Emissions data
C7 Emissions breakdown
C8 Energy
C9 Additional metrics
C10 Verification
C11 Carbon pricing
C12 Engagement
C13 Other land management
C14 Sign off
CDP added this new module to enable reporting
organizations to present relevant climate-related metrics that
may indirectly or directly impact emissions or energy use.
• Additional climate-related metrics relevant to your business
• Sector focussed questions on additional climate-related metrics
www.cdp.net | @CDP
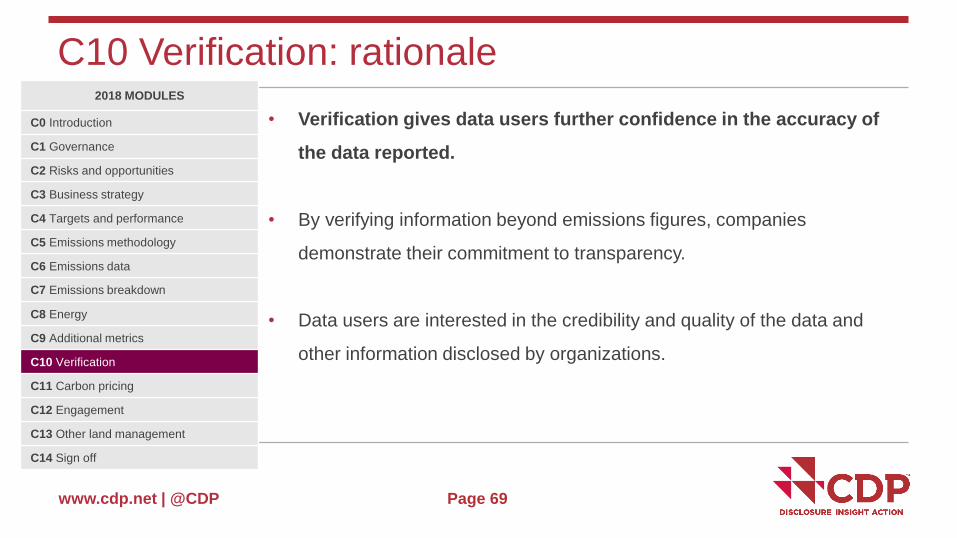
C10 Verification: rationale
Page 69
2018 MODULES
C0 Introduction
C1 Governance
C2 Risks and opportunities
C3 Business strategy
C4 Targets and performance
C5 Emissions methodology
C6 Emissions data
C7 Emissions breakdown
C8 Energy
C9 Additional metrics
C10 Verification
C11 Carbon pricing
C12 Engagement
C13 Other land management
C14 Sign off
• Verification gives data users further confidence in the accuracy of
the data reported.
• By verifying information beyond emissions figures, companies
demonstrate their commitment to transparency.
• Data users are interested in the credibility and quality of the data and
other information disclosed by organizations.
www.cdp.net | @CDP
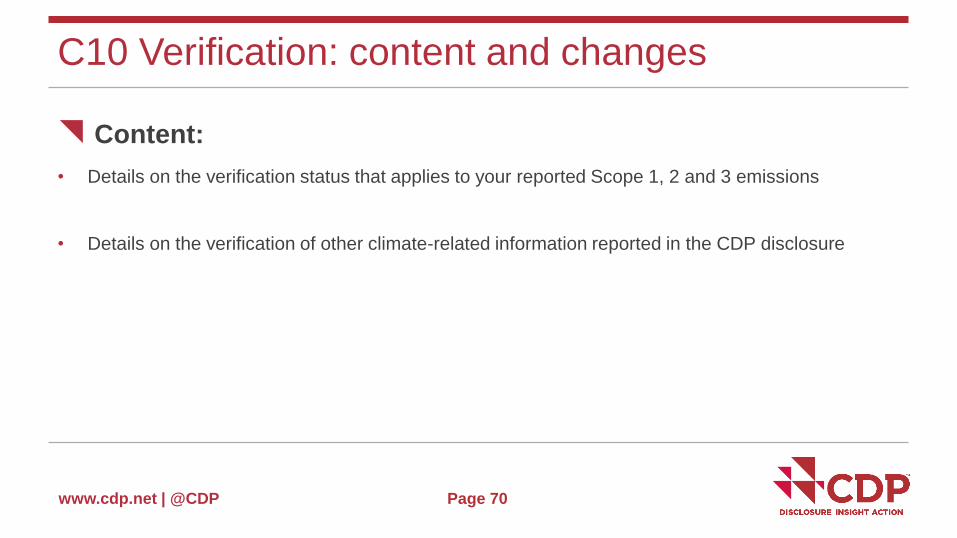
C10 Verification: content and changes
Page 70
Content:
• Details on the verification status that applies to your reported Scope 1, 2 and 3 emissions
• Details on the verification of other climate-related information reported in the CDP disclosure
www.cdp.net | @CDP
C11 Carbon pricing
Page 71
2018 MODULES
C0 Introduction
C1 Governance
C2 Risks and opportunities
C3 Business strategy
C4 Targets and performance
C5 Emissions methodology
C6 Emissions data
C7 Emissions breakdown
C8 Energy
C9 Additional metrics
C10 Verification
C11 Carbon pricing
C12 Engagement
C13 Other land management
C14 Sign off
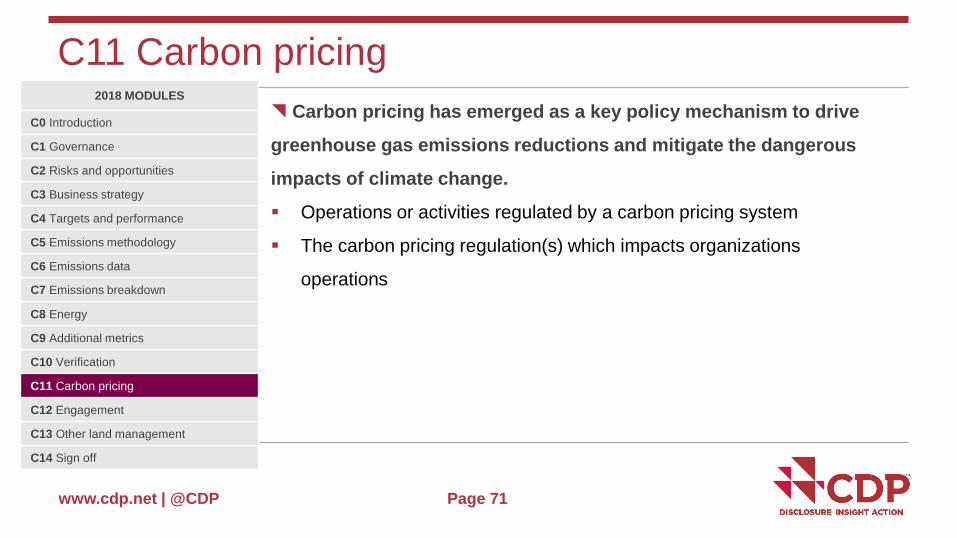
Carbon pricing has emerged as a key policy mechanism to drive
greenhouse gas emissions reductions and mitigate the dangerous
impacts of climate change.
Operations or activities regulated by a carbon pricing system
The carbon pricing regulation(s) which impacts organizations
operations
www.cdp.net | @CDP
C12 Engagement
Page 72
2018 MODULES
C0 Introduction
C1 Governance
C2 Risks and opportunities
C3 Business strategy
C4 Targets and performance
C5 Emissions methodology
C6 Emissions data
C7 Emissions breakdown
C8 Energy
C9 Additional metrics
C10 Verification
C11 Carbon pricing
C12 Engagement
C13 Other land management
C14 Sign off
Provide details of climate-related engagement with suppliers, customers
and other partners
www.cdp.net | @CDP
C13 Other land management
Page 73
2018 MODULES
C0 Introduction
C1 Governance
C2 Risks and opportunities
C3 Business strategy
C4 Targets and performance
C5 Emissions methodology
C6 Emissions data
C7 Emissions breakdown
C8 Energy
C9 Additional metrics
C10 Verification
C11 Carbon pricing
C12 Engagement
C13 Other land management
C14 Sign off
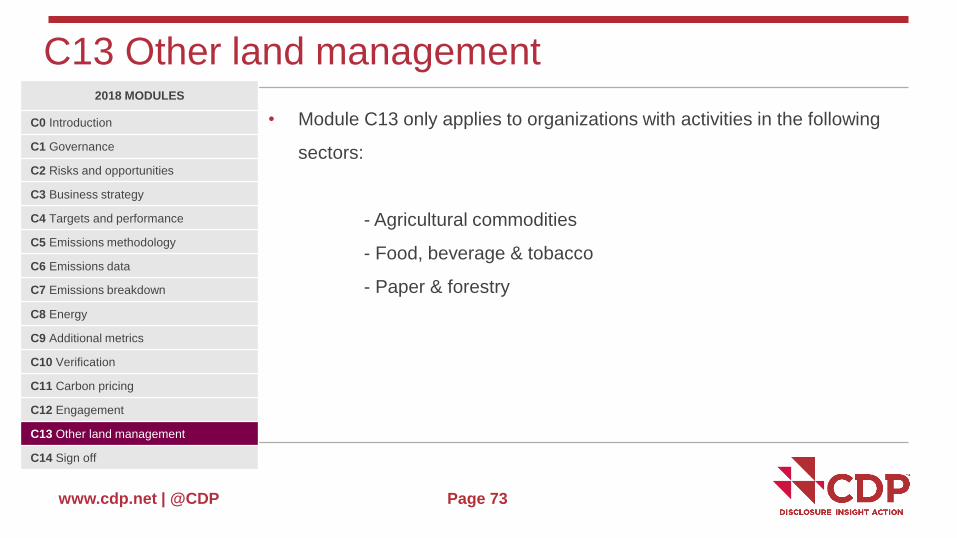
• Module C13 only applies to organizations with activities in the following
sectors:
- Agricultural commodities
- Food, beverage & tobacco
- Paper & forestry
www.cdp.net | @CDP
C14 Sign off
Page 74
2018 MODULES
C0 Introduction
C1 Governance
C2 Risks and opportunities
C3 Business strategy
C4 Targets and performance
C5 Emissions methodology
C6 Emissions data
C7 Emissions breakdown
C8 Energy
C9 Additional metrics
C10 Verification
C11 Carbon pricing
C12 Engagement
C13 Other land management
C14 Sign off
CDP asks companies to identify the job title of the person
signing off (approving) the CDP response
This information signals to data users where in the corporate structure direct
responsibility is being taken for the response and the information contained
therein
www.cdp.net | @CDP
New sector questionnaires
2018 sector questionnaires
overview
Page 75
www.cdp.net | @CDP
Agriculture & land use sectors: rationale
Page 76
Food, beverage &
tobacco
Agricultural commodities
Paper & forestry
• Activities: Producing and processing raw materials
• Risks: Deforestation and forest degradation risks and farm
management practices
• Activities: Processing, manufacture, or trade of food, drinks, and
tobacco consumer goods
• Risks: Emissions from machinery, facilities and transportation
• Activities: Production and/or sourcing of timber and timber-based
products
• Risks: Unsustainable forest management activities
www.cdp.net | @CDP
Agriculture & land use sectors: content
Page 77
Agricultural commodities
Food, beverage &
tobacco
Paper & forestry
• Based on the questions from the 2017 climate change FBT
module. Questionnaires examine:
Scope 1 emissions breakdown by commodities
Land management practices
Emissions intensity data associated with commodities
Scope 1 and 3 emissions disclosure by relevant business
activities
www.cdp.net | @CDP Page 78
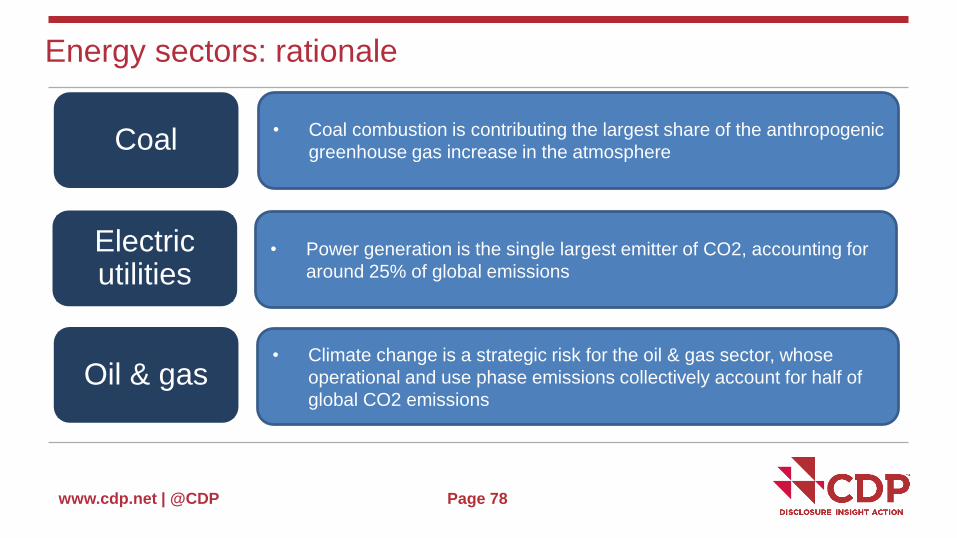
Energy sectors: rationale
Coal
Electric utilities
Oil & gas
• Coal combustion is contributing the largest share of the anthropogenic
greenhouse gas increase in the atmosphere
• Power generation is the single largest emitter of CO2, accounting for
around 25% of global emissions
• Climate change is a strategic risk for the oil & gas sector, whose
operational and use phase emissions collectively account for half of
global CO2 emissions
www.cdp.net | @CDP Page 79
Energy sectors: content
Coal
Electric utilities
Oil & gas
• Specific methane targets, methane leak detection and repair and flaring
• Scope 1 breakdown for coal mining by emission sources
• Coal reserves and production, investment in low-carbon R&D
• Power generation capacity
• CAPEX plans for power generation and products and services
• Investments in low carbon research and development and equipment
• Emissions breakdowns by oil and gas divisions, methane emissions
• Hydrocarbon reserves, production, refining data
• Transfers & sequestration of CO2 emissions
www.cdp.net | @CDP Page 80
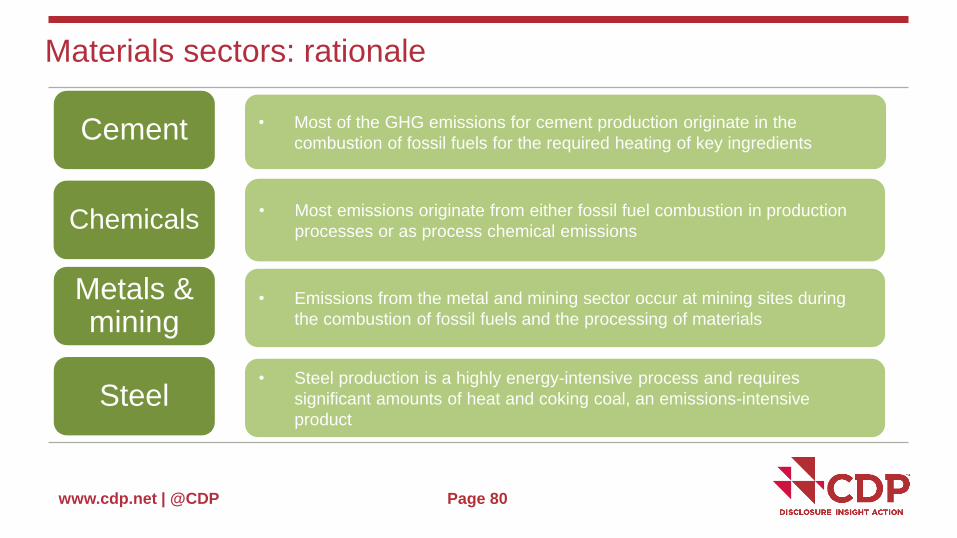
Materials sectors: rationale
Cement
Chemicals
Metals & mining
Steel
• Most of the GHG emissions for cement production originate in the
combustion of fossil fuels for the required heating of key ingredients
• Most emissions originate from either fossil fuel combustion in production
processes or as process chemical emissions
• Emissions from the metal and mining sector occur at mining sites during
the combustion of fossil fuels and the processing of materials
• Steel production is a highly energy-intensive process and requires
significant amounts of heat and coking coal, an emissions-intensive
product
www.cdp.net | @CDP Page 81
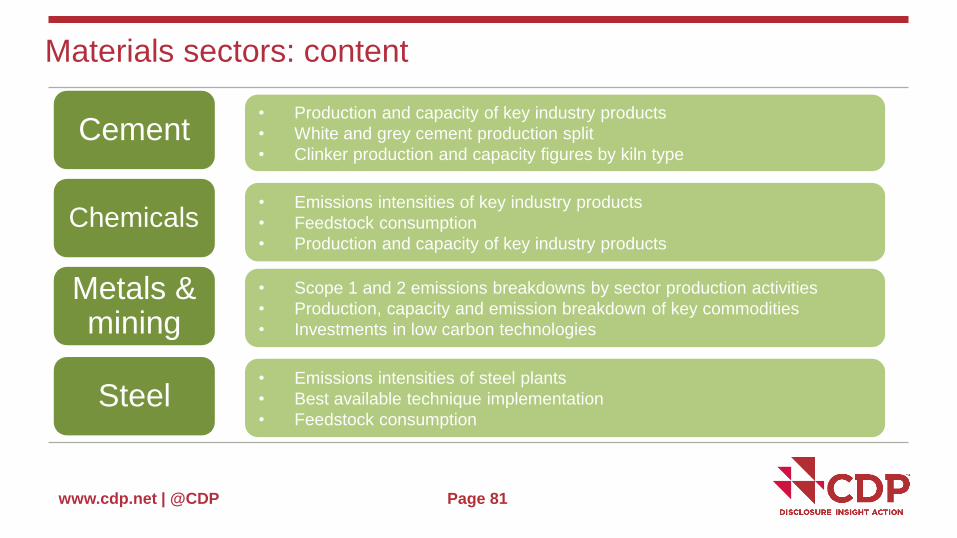
Materials sectors: content
Cement
Chemicals
Metals & mining
Steel
• Production and capacity of key industry products
• White and grey cement production split
• Clinker production and capacity figures by kiln type
• Emissions intensities of key industry products
• Feedstock consumption
• Production and capacity of key industry products
• Scope 1 and 2 emissions breakdowns by sector production activities
• Production, capacity and emission breakdown of key commodities
• Investments in low carbon technologies
• Emissions intensities of steel plants
• Best available technique implementation
• Feedstock consumption
www.cdp.net | @CDP Page 82
Transport sectors: rationale
• The transport sector is responsible for almost a quarter of global
energy-related emissions
• Designed by identifying the different sub-sectors based on
transport mode and transport subject
• Five distinct transport modes were identified for study Aviation,
LDV, HDV, Shipping and Rail
• Two transport subjects identified were freight and passengers
• Questionnaire based on questions from previous climate change
auto module, investor reports and ACT pilot project
Transport OEMs
Transport services
www.cdp.net | @CDP Page 83
Transport sectors: content
Transport OEMs
Transport services
• Activity-based accounting of downstream Scope 3 emissions in
category 11: use of sold products
• Efficiency metrics appropriate for the organization’s transport
products and/or services
• Implementation metrics for the production of, and investment in, low-
carbon transportation technologies
• Primary intensity (activity-based) metrics that are appropriate to
your emissions from transport activities
• Average emissions factor used for all transport movements per
mode that source energy from grid
• Tracking metrics for the implementation of low-carbon transport
technology
www.cdp.net | @CDP
2018 Supply chain
climate module
Page 84
www.cdp.net | @CDP
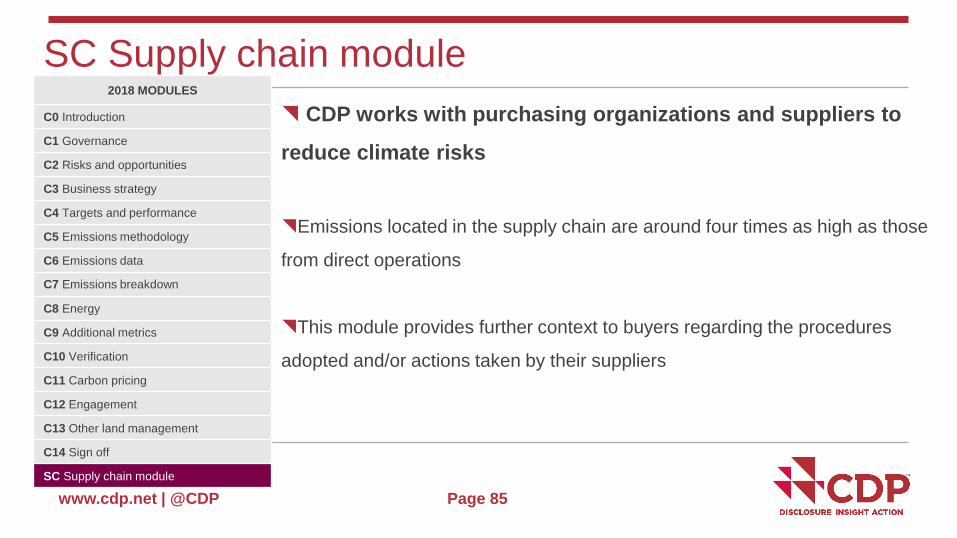
SC Supply chain module
Page 85
2018 MODULES
C0 Introduction
C1 Governance
C2 Risks and opportunities
C3 Business strategy
C4 Targets and performance
C5 Emissions methodology
C6 Emissions data
C7 Emissions breakdown
C8 Energy
C9 Additional metrics
C10 Verification
C11 Carbon pricing
C12 Engagement
C13 Other land management
C14 Sign off
SC Supply chain module
CDP works with purchasing organizations and suppliers to
reduce climate risks
Emissions located in the supply chain are around four times as high as those
from direct operations
This module provides further context to buyers regarding the procedures
adopted and/or actions taken by their suppliers
www.cdp.net | @CDP
SC Supply chain module
Page 86
Introduction: annual revenue, ISIN numeric identifier
Allocating your emissions to your customers:
• Allocating emissions based on the goods or services sold
• Challenges in allocating emissions to different customers
• Develop capabilities to allocate emissions to customers in the future
Collaborative opportunities: Mutually beneficial climate-related projects organizations could
collaborate on with specific CDP supply chain members
www.cdp.net | @CDP
SC Supply chain module
Page 87
Action Exchange:
• The 2017-2018 CDP Action Exchange initiative
• Emissions reduction activities companies would like support
Product (goods and services) level data:
• Product level data for your organization’s goods or services and total emissions covered
• Data for lifecycle stages of goods/services
• Emissions reduction initiatives completed or planned for product
www.cdp.net | @CDP Page 88
Introduction to the 2018
Water Security
Questionnaire
www.cdp.net | @CDP
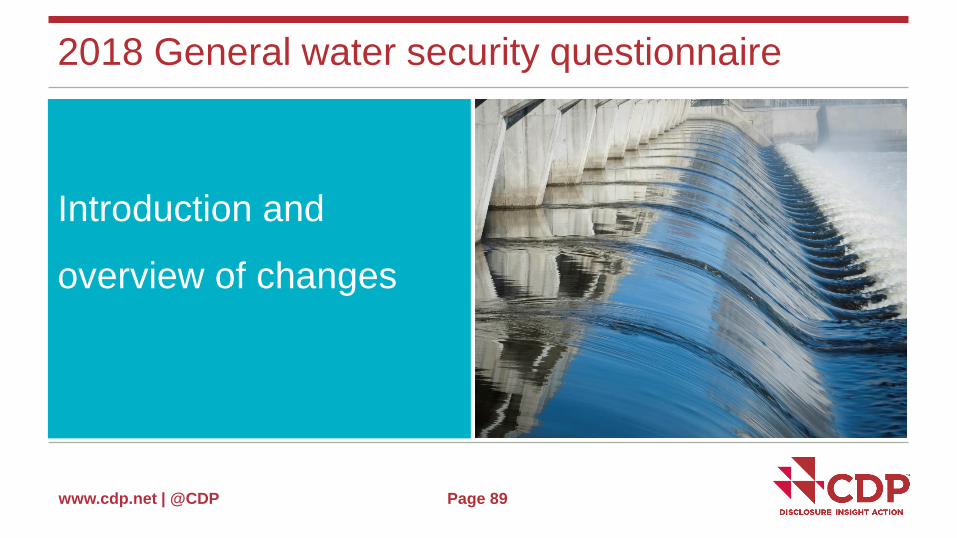
2018 General water security questionnaire
Introduction and
overview of changes
Page 89
www.cdp.net | @CDP
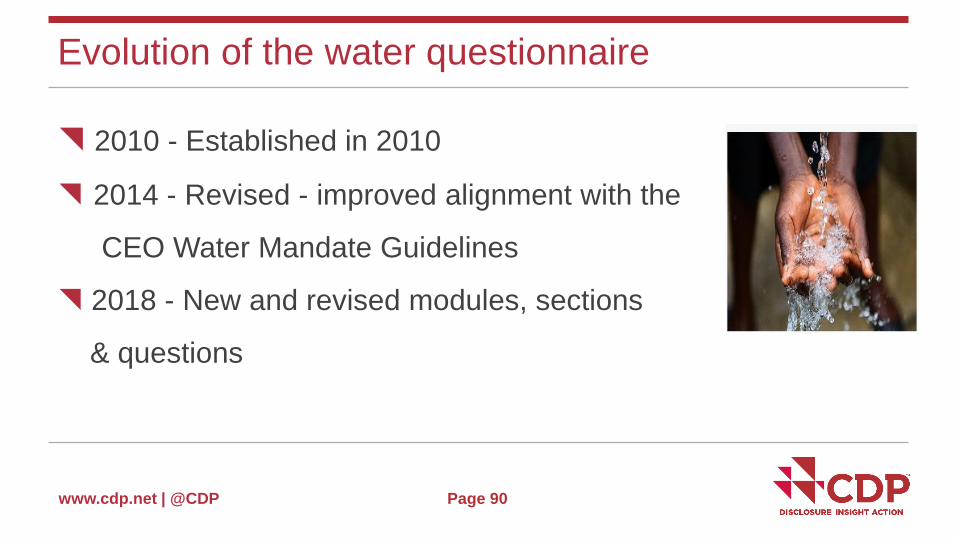
Evolution of the water questionnaire
2010 - Established in 2010
2014 - Revised - improved alignment with the
CEO Water Mandate Guidelines
2018 - New and revised modules, sections
& questions
Page 90
www.cdp.net | @CDP
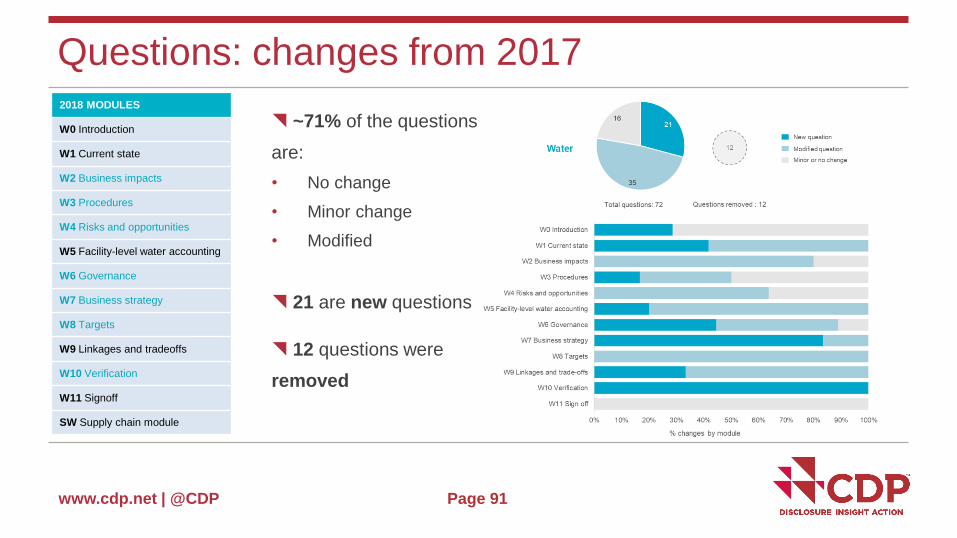
Questions: changes from 2017
~71% of the questions
are:
• No change
• Minor change
• Modified
21 are new questions
12 questions were
removed
Page 91
2018 MODULES
W0 Introduction
W1 Current state
W2 Business impacts
W3 Procedures
W4 Risks and opportunities
W5 Facility-level water accounting
W6 Governance
W7 Business strategy
W8 Targets
W9 Linkages and tradeoffs
W10 Verification
W11 Signoff
SW Supply chain module
www.cdp.net | @CDP
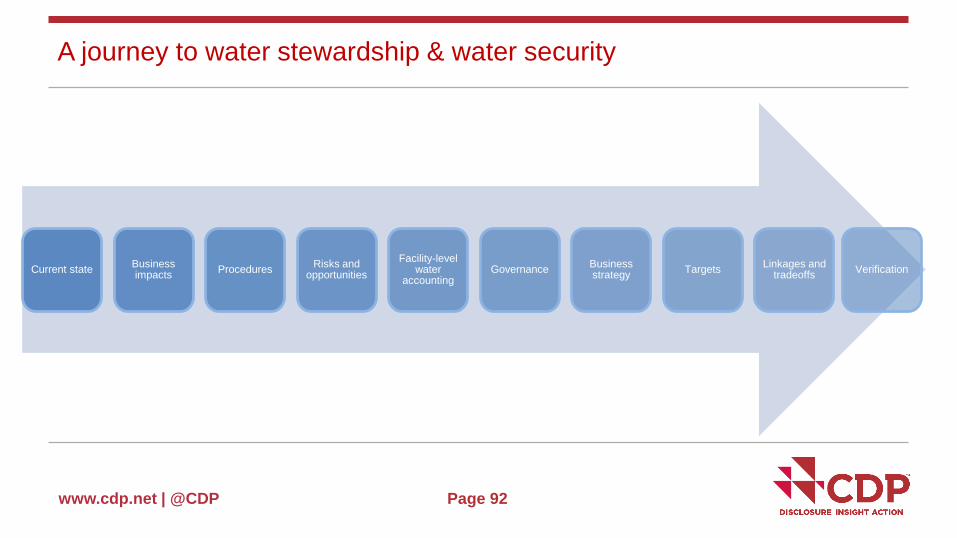
A journey to water stewardship & water security
Page 92
Current stateBusiness impacts
ProceduresRisks and
opportunities
Facility-level water
accountingGovernance
Business strategy
TargetsLinkages and
tradeoffsVerification
www.cdp.net | @CDP
2018 General water security questionnaire
Modules and changes
Page 93
www.cdp.net | @CDP
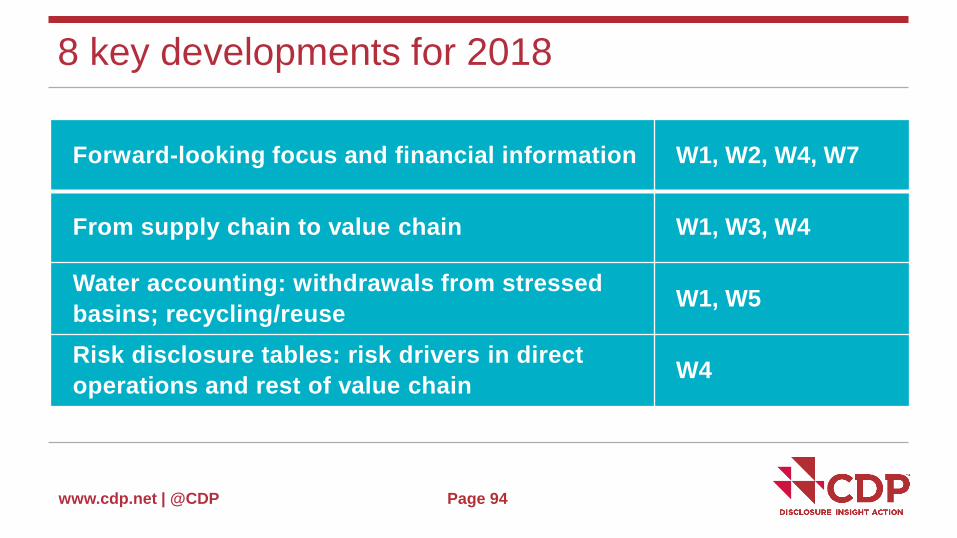
8 key developments for 2018
Page 94
Forward-looking focus and financial information W1, W2, W4, W7
From supply chain to value chain W1, W3, W4
Water accounting: withdrawals from stressed
basins; recycling/reuseW1, W5
Risk disclosure tables: risk drivers in direct
operations and rest of value chainW4
www.cdp.net | @CDP
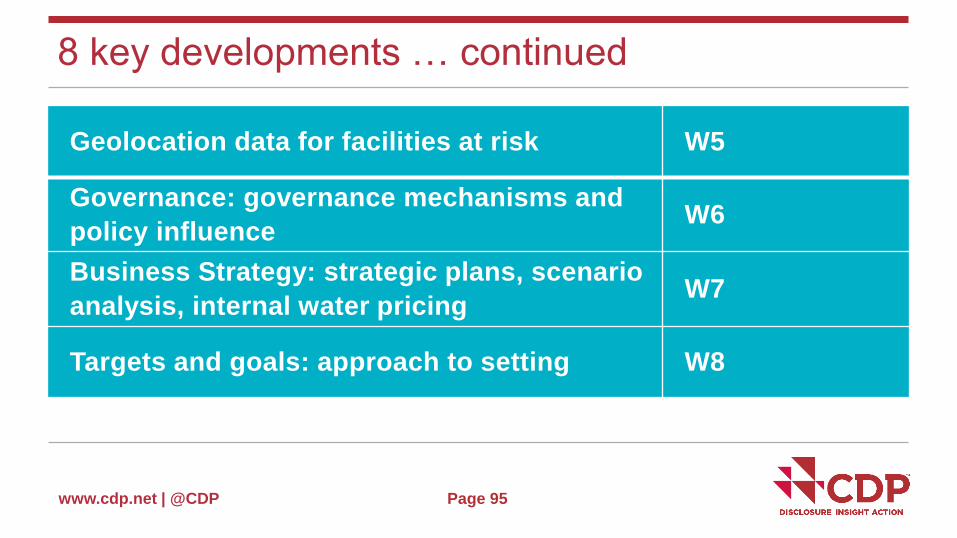
8 key developments … continued
Page 95
Geolocation data for facilities at risk W5
Governance: governance mechanisms and
policy influenceW6
Business Strategy: strategic plans, scenario
analysis, internal water pricingW7
Targets and goals: approach to setting W8
www.cdp.net | @CDP
2018 supply chain request
Overview and changes
Page 96
www.cdp.net | @CDP
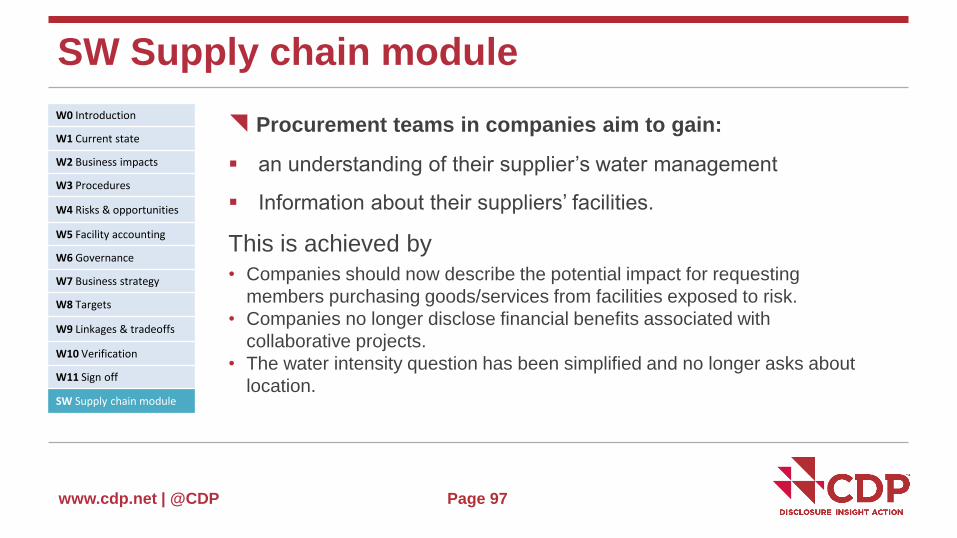
SW Supply chain module
Page 97
W0 Introduction
W1 Current state
W2 Business impacts
W3 Procedures
W4 Risks & opportunities
W5 Facility accounting
W6 Governance
W7 Business strategy
W8 Targets
W9 Linkages & tradeoffs
W10 Verification
W11 Sign off
SW Supply chain module
Procurement teams in companies aim to gain:
an understanding of their supplier’s water management
Information about their suppliers’ facilities.
This is achieved by
• Companies should now describe the potential impact for requesting
members purchasing goods/services from facilities exposed to risk.
• Companies no longer disclose financial benefits associated with
collaborative projects.
• The water intensity question has been simplified and no longer asks about
location.
www.cdp.net | @CDP
2018 sector water questionnaires
Overview
Page 98
www.cdp.net | @CDP
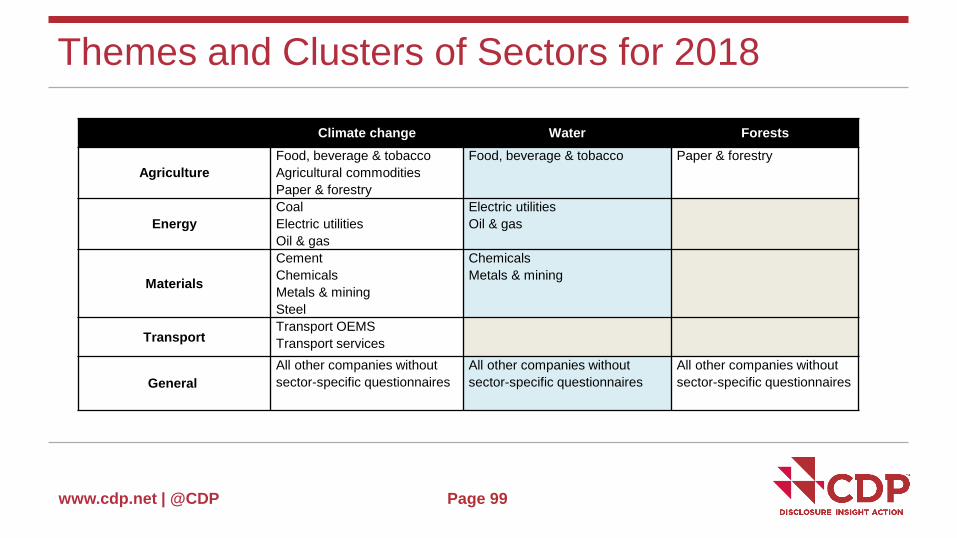
Themes and Clusters of Sectors for 2018
Page 99
Climate change Water Forests
Agriculture
Food, beverage & tobacco
Agricultural commodities
Paper & forestry
Food, beverage & tobacco Paper & forestry
Energy
Coal
Electric utilities
Oil & gas
Electric utilities
Oil & gas
Materials
Cement
Chemicals
Metals & mining
Steel
Chemicals
Metals & mining
TransportTransport OEMS
Transport services
General
All other companies without
sector-specific questionnaires
All other companies without
sector-specific questionnaires
All other companies without
sector-specific questionnaires
www.cdp.net | @CDP Page 100
Core questions that apply over all high impact sectors
Water intensity (water withdrawal or consumption per unit of product)
Management procedures for potential water pollutants
Incentives to senior management for water-related issues
www.cdp.net | @CDP
Food, beverage & tobacco sector
CDP water questionnaire focus: Food production and processing and their related
value chain agricultural activities
Question asks for:
Use of produced or source products from high water stress areas
Page 101
www.cdp.net | @CDP Page 102
Electric utilities sector
CDP water questionnaire focus: Power generation
Questions ask for
Generation by primary power source
Monitoring of hydroelectric metrics: e.g. fulfillment of environmental flows and the
sediment loadings
www.cdp.net | @CDP
Oil & gas sector
Page 103
CDP water questionnaire focus: extraction, refining of oil & gas, petrochemical
production
Questions ask for:
Total water withdrawals, discharge and consumption by business division
(upstream, refining and chemicals)
Water reuse and recycling practices by business division
Proportion of the production volume exposed to water risks
www.cdp.net | @CDP
Chemicals sector
CDP water questionnaire focus: production and processing of chemical products
No other additional chemicals sector questions than the “all high impact questions”
Page 104
www.cdp.net | @CDP
Metals & mining sector
CDP water questionnaire focus: mining and processing of minerals
Questions ask for:
The monitoring of produced water
Water reuse and recycling practice
Production value exposed to water risks
Management procedures for tailings dams
Page 105
www.cdp.net | @CDP
Introduction to Scoring
2018

www.cdp.net | @CDP
Overview of scoring
www.cdp.net | @CDP
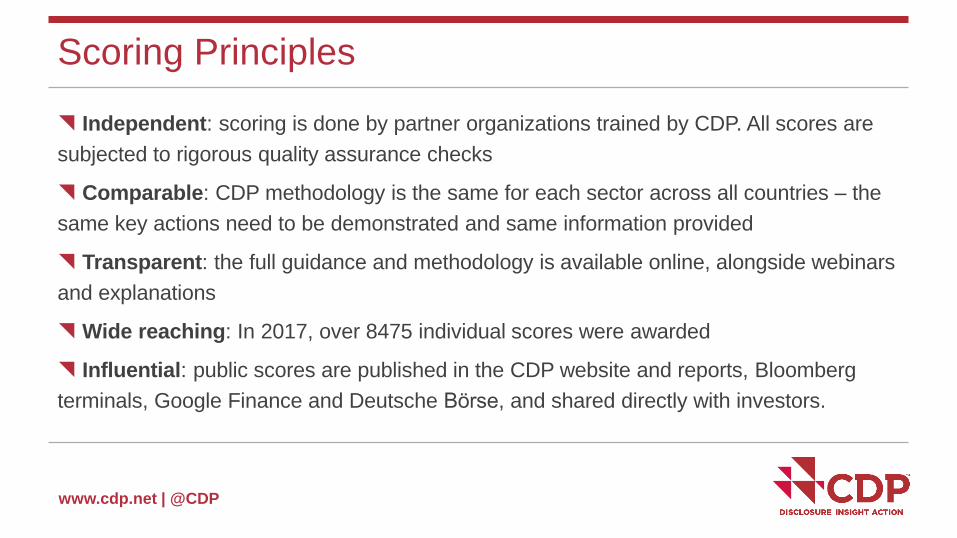
Scoring Principles
Independent: scoring is done by partner organizations trained by CDP. All scores are
subjected to rigorous quality assurance checks
Comparable: CDP methodology is the same for each sector across all countries – the
same key actions need to be demonstrated and same information provided
Transparent: the full guidance and methodology is available online, alongside webinars
and explanations
Wide reaching: In 2017, over 8475 individual scores were awarded
Influential: public scores are published in the CDP website and reports, Bloomberg
terminals, Google Finance and Deutsche Börse, and shared directly with investors.
www.cdp.net | @CDP
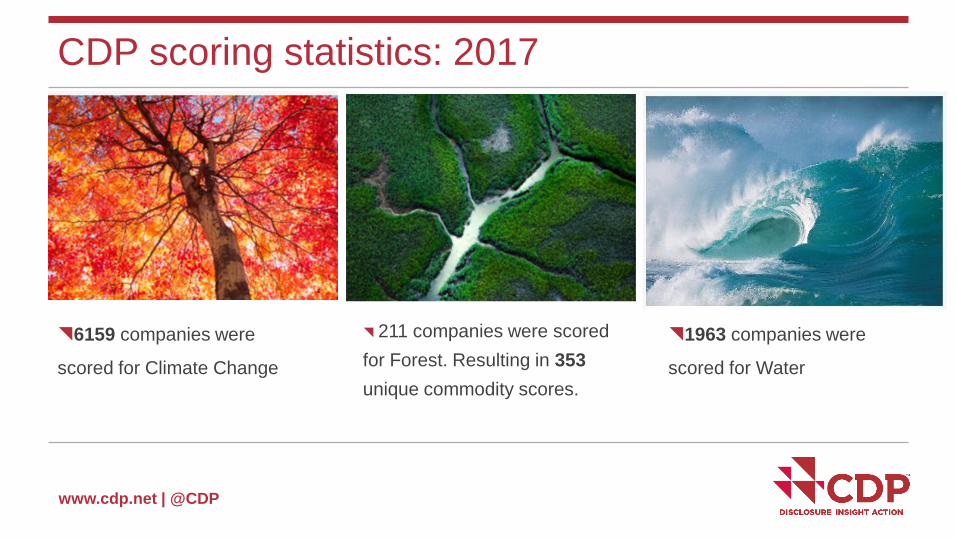
CDP scoring statistics: 2017
6159 companies were
scored for Climate Change
1963 companies were
scored for Water
211 companies were scored
for Forest. Resulting in 353
unique commodity scores.
www.cdp.net | @CDP

www.cdp.net | @CDP
Scoring approach in 2018
www.cdp.net | @CDP
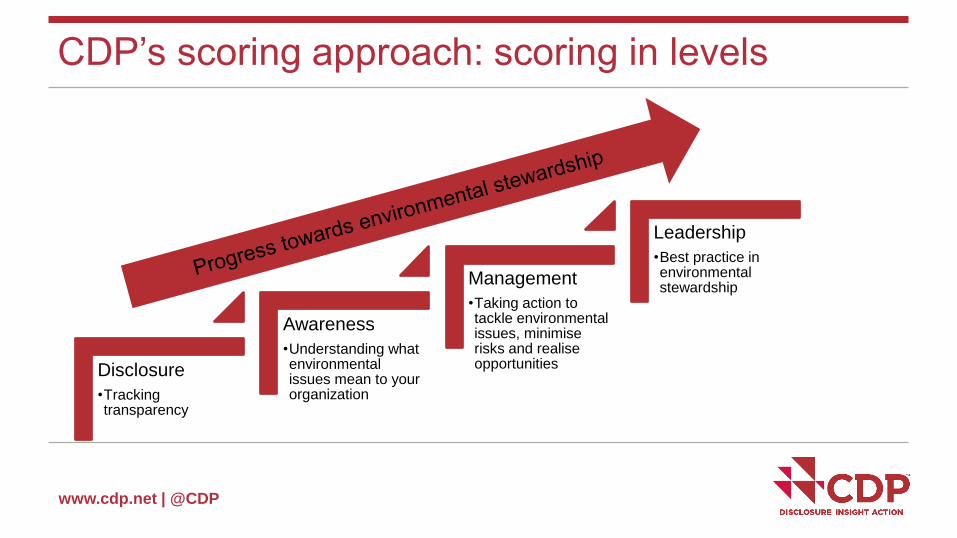
CDP’s scoring approach: scoring in levels
Disclosure
•Tracking transparency
Awareness
•Understanding what environmental issues mean to your organization
Management
•Taking action to tackle environmental issues, minimise risks and realise opportunities
Leadership
•Best practice in environmental stewardship
www.cdp.net | @CDP
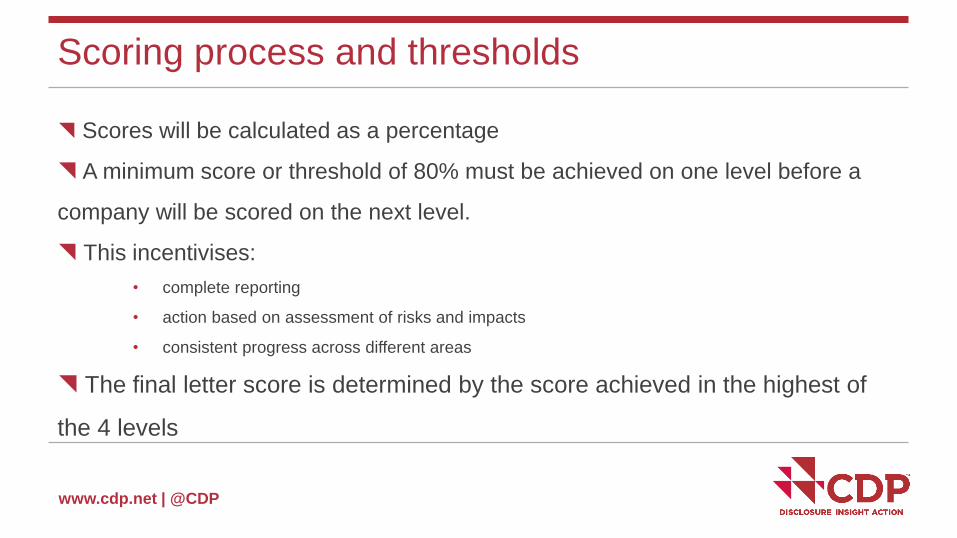
Scoring process and thresholds
Scores will be calculated as a percentage
A minimum score or threshold of 80% must be achieved on one level before a
company will be scored on the next level.
This incentivises:
• complete reporting
• action based on assessment of risks and impacts
• consistent progress across different areas
The final letter score is determined by the score achieved in the highest of
the 4 levels
www.cdp.net | @CDP
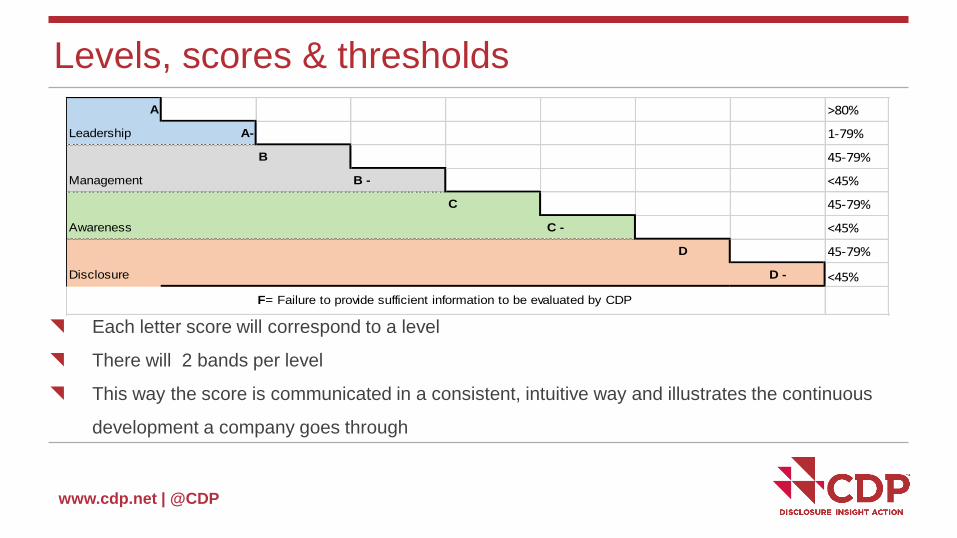
Levels, scores & thresholds
Each letter score will correspond to a level
There will 2 bands per level
This way the score is communicated in a consistent, intuitive way and illustrates the continuous
development a company goes through
A >80%
Leadership A- 1-79%
B 45-79%
Management B - <45%
C 45-79%
Awareness C - <45%
D 45-79%
Disclosure D - <45%
F= Failure to provide sufficient information to be evaluated by CDP
www.cdp.net | @CDP
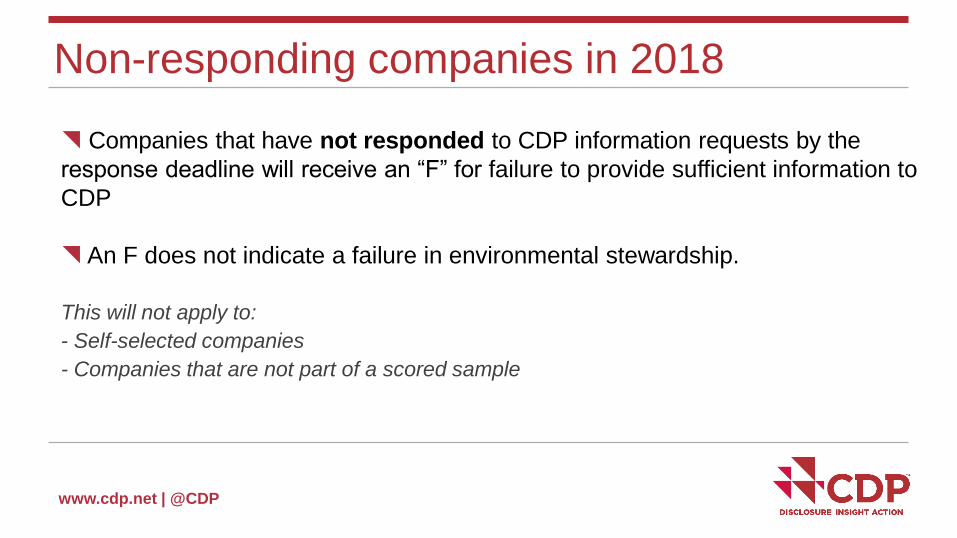
Non-responding companies in 2018
Companies that have not responded to CDP information requests by the
response deadline will receive an “F” for failure to provide sufficient information to
CDP
An F does not indicate a failure in environmental stewardship.
This will not apply to:
- Self-selected companies
- Companies that are not part of a scored sample
www.cdp.net | @CDP
Scoring in 2018 – what’s different
www.cdp.net | @CDP
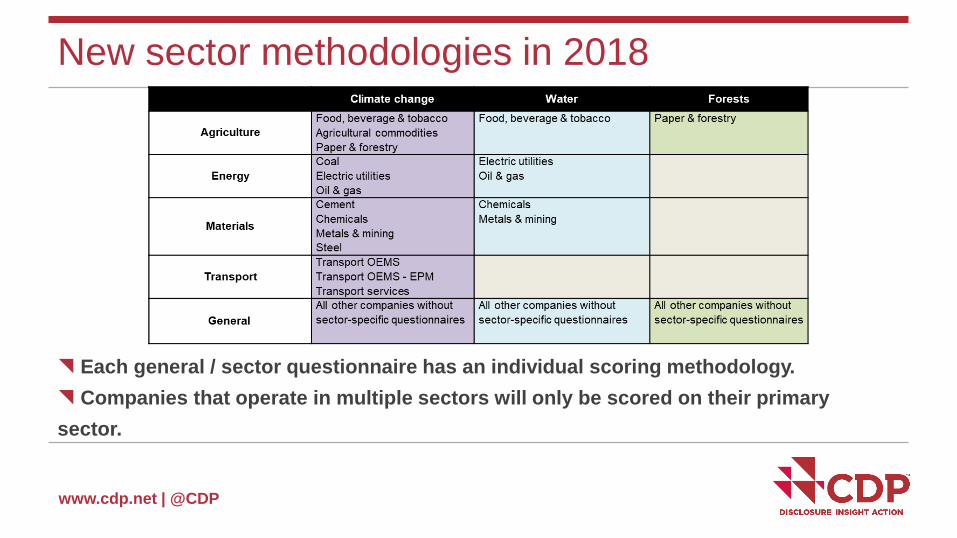
New sector methodologies in 2018
Each general / sector questionnaire has an individual scoring methodology.
Companies that operate in multiple sectors will only be scored on their primary
sector.
www.cdp.net | @CDP
2018 methodologies focus on sector-specific issues
Enabling investors and responders to
compare and benchmark peers within a sector
compare which sectors are high/low exposure to environmental risks and
opportunities
www.cdp.net | @CDP
2018 scoring categories
Scoring categories are sub-groups of the 2018 questionnaire modules and are
unique to each theme, similar to categories in the previous feedback charts
The number of categories per theme has increased from 2017, in order to:
• Focus on key data points
• Provide a more detailed breakdown of a company’s score
• Better indicate areas of strength and weakness
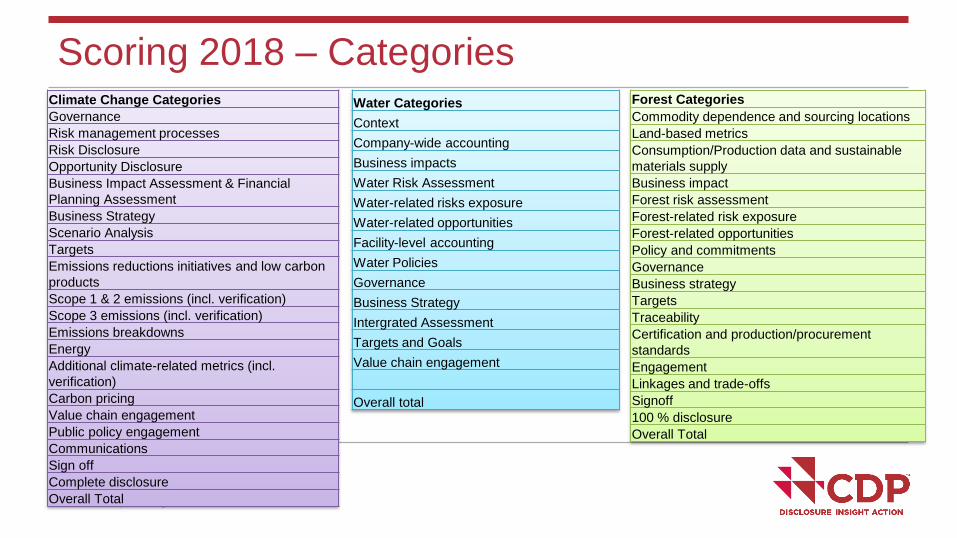
www.cdp.net | @CDP
Scoring 2018 – CategoriesForest Categories
Commodity dependence and sourcing locations
Land-based metrics
Consumption/Production data and sustainable
materials supply
Business impact
Forest risk assessment
Forest-related risk exposure
Forest-related opportunities
Policy and commitments
Governance
Business strategy
Targets
Traceability
Certification and production/procurement
standards
Engagement
Linkages and trade-offs
Signoff
100 % disclosure
Overall Total
Water Categories
Context
Company-wide accounting
Business impacts
Water Risk Assessment
Water-related risks exposure
Water-related opportunities
Facility-level accounting
Water Policies
Governance
Business Strategy
Intergrated Assessment
Targets and Goals
Value chain engagement
Overall total
Climate Change Categories
Governance
Risk management processes
Risk Disclosure
Opportunity Disclosure
Business Impact Assessment & Financial
Planning Assessment
Business Strategy
Scenario Analysis
Targets
Emissions reductions initiatives and low carbon
products
Scope 1 & 2 emissions (incl. verification)
Scope 3 emissions (incl. verification)
Emissions breakdowns
Energy
Additional climate-related metrics (incl.
verification)
Carbon pricing
Value chain engagement
Public policy engagement
Communications
Sign off
Complete disclosure
Overall Total
www.cdp.net | @CDP
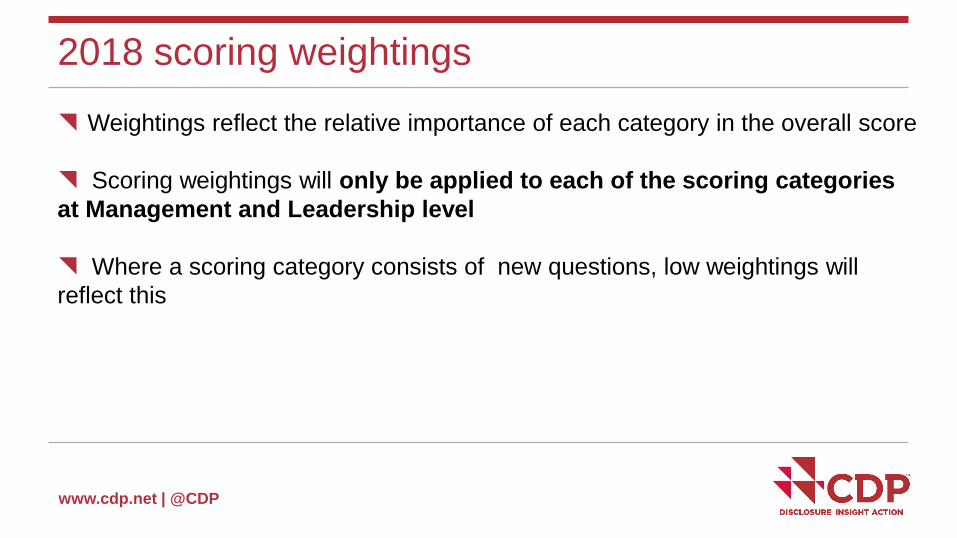
2018 scoring weightings
Weightings reflect the relative importance of each category in the overall score
Scoring weightings will only be applied to each of the scoring categories
at Management and Leadership level
Where a scoring category consists of new questions, low weightings will
reflect this
www.cdp.net | @CDP
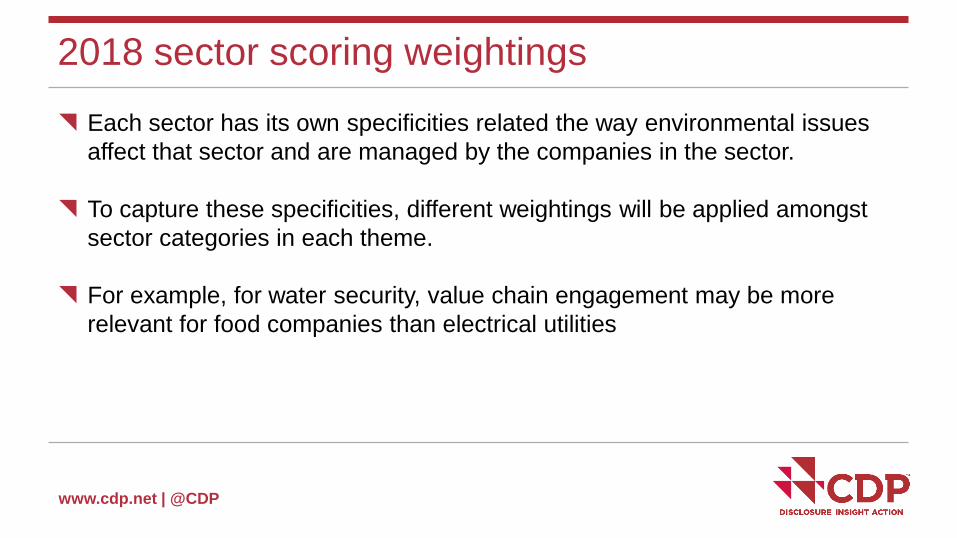
2018 sector scoring weightings
Each sector has its own specificities related the way environmental issues
affect that sector and are managed by the companies in the sector.
To capture these specificities, different weightings will be applied amongst
sector categories in each theme.
For example, for water security, value chain engagement may be more
relevant for food companies than electrical utilities
www.cdp.net | @CDP
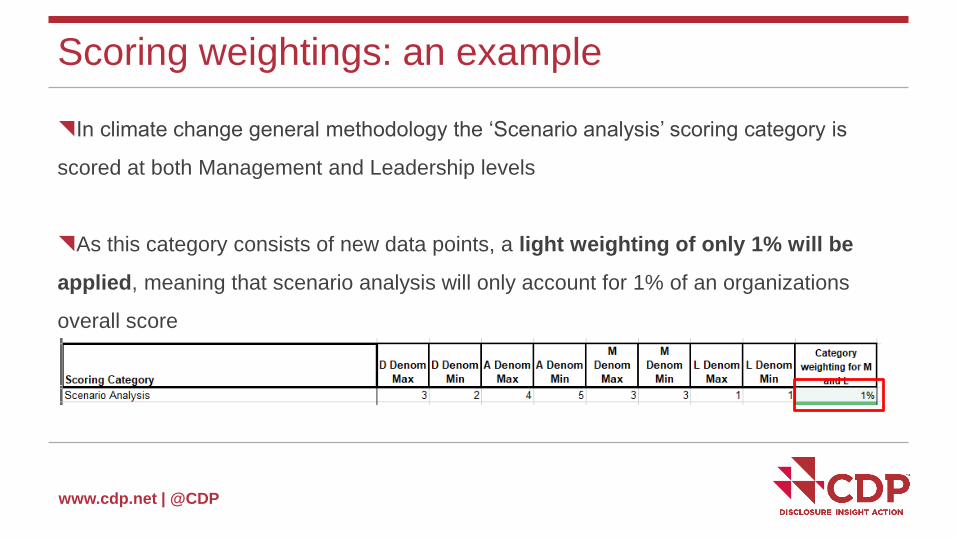
Scoring weightings: an example
In climate change general methodology the ‘Scenario analysis’ scoring category is
scored at both Management and Leadership levels
As this category consists of new data points, a light weighting of only 1% will be
applied, meaning that scenario analysis will only account for 1% of an organizations
overall score
www.cdp.net | @CDP
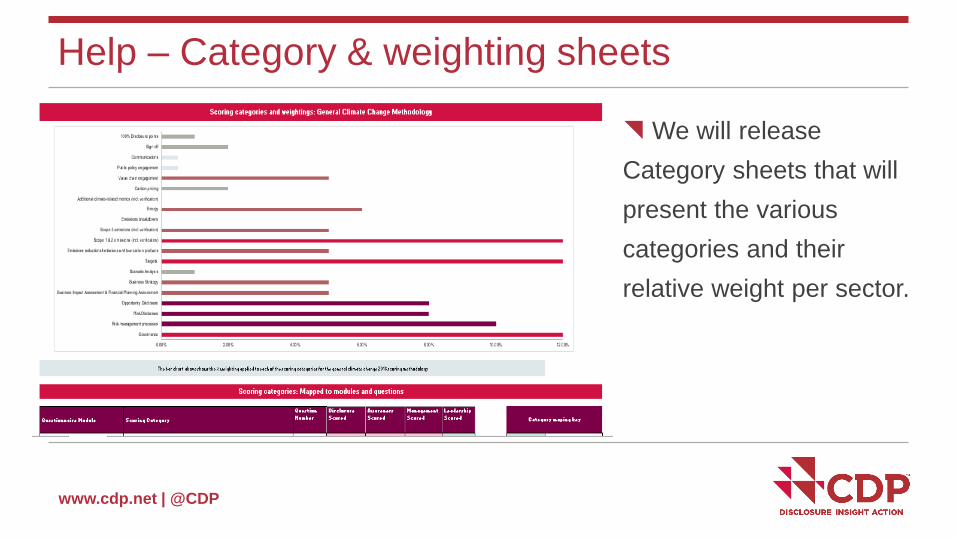
Help – Category & weighting sheets
We will release
Category sheets that will
present the various
categories and their
relative weight per sector.
www.cdp.net | @CDP
Rewarding Leadership: the A list
www.cdp.net | @CDP
A List Requirements
To get into the A list, a company’s response must
achieve at top score (at least 80% in Leadership),
be publicly available submitted via CDP's ORS
Pass CDP reputational checks, and
meet the following, theme specific requirements:
www.cdp.net | @CDP
A List Theme Requirements
Climate Change
Scope 1 & 2 figures disclosed (C6.1 & C6.3) and full points for verification/assurance of Scopes 1 & 2 (C10.1a)
No significant relevant exclusions in their emissions (C6.4 & 6.4a)
Water
A top score (at least 80% in Leadership)
Forests
Provide data on all relevant operations and supply chains, making no significant exclusions (F0.6a, F0.7a);
Undertake a comprehensive and thorough risk assessment of all operations and supply chains (F2.1/F2.1a);
Commit to zero deforestation in all operations and supply chains by 2020, or sooner (F6.1b or F4.1b)
www.cdp.net | @CDP
Methodology tips and help
www.cdp.net | @CDP
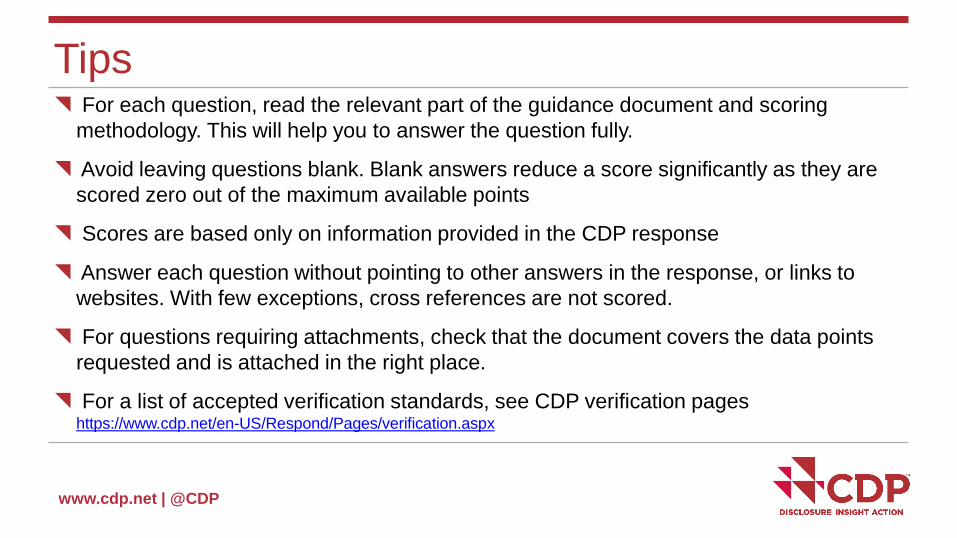
For each question, read the relevant part of the guidance document and scoring
methodology. This will help you to answer the question fully.
Avoid leaving questions blank. Blank answers reduce a score significantly as they are
scored zero out of the maximum available points
Scores are based only on information provided in the CDP response
Answer each question without pointing to other answers in the response, or links to
websites. With few exceptions, cross references are not scored.
For questions requiring attachments, check that the document covers the data points
requested and is attached in the right place.
For a list of accepted verification standards, see CDP verification pages https://www.cdp.net/en-US/Respond/Pages/verification.aspx
Tips
www.cdp.net | @CDP
Scoring myths: examples
www.cdp.net | @CDP
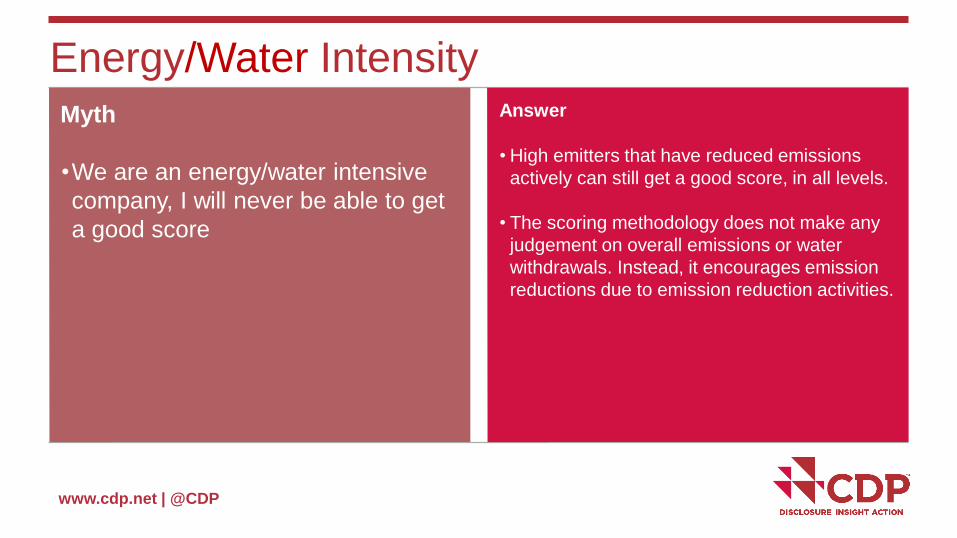
Myth
•We are an energy/water intensive
company, I will never be able to get
a good score
Answer
• High emitters that have reduced emissions
actively can still get a good score, in all levels.
• The scoring methodology does not make any
judgement on overall emissions or water
withdrawals. Instead, it encourages emission
reductions due to emission reduction activities.
Energy/Water Intensity
www.cdp.net | @CDP
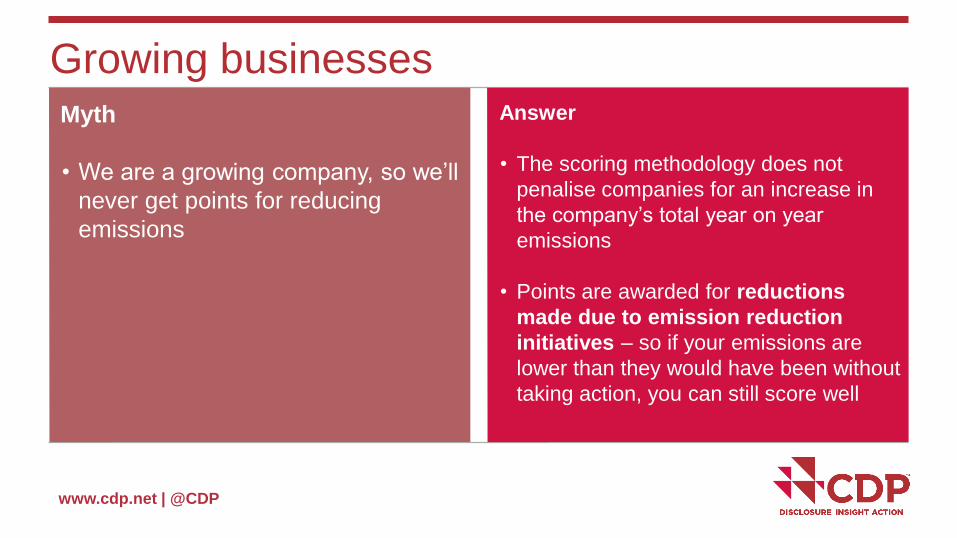
Myth
• We are a growing company, so we’ll
never get points for reducing
emissions
Answer
• The scoring methodology does not
penalise companies for an increase in
the company’s total year on year
emissions
• Points are awarded for reductions
made due to emission reduction
initiatives – so if your emissions are
lower than they would have been without
taking action, you can still score well
Growing businesses
www.cdp.net | @CDP
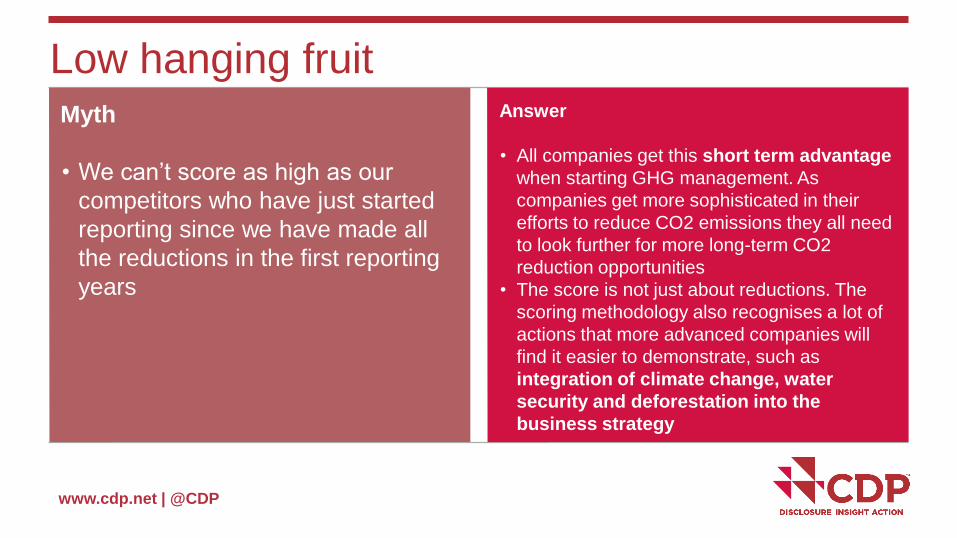
Myth
• We can’t score as high as our
competitors who have just started
reporting since we have made all
the reductions in the first reporting
years
Answer
• All companies get this short term advantage
when starting GHG management. As
companies get more sophisticated in their
efforts to reduce CO2 emissions they all need
to look further for more long-term CO2
reduction opportunities
• The score is not just about reductions. The
scoring methodology also recognises a lot of
actions that more advanced companies will
find it easier to demonstrate, such as
integration of climate change, water
security and deforestation into the
business strategy
Low hanging fruit
www.cdp.net | @CDP
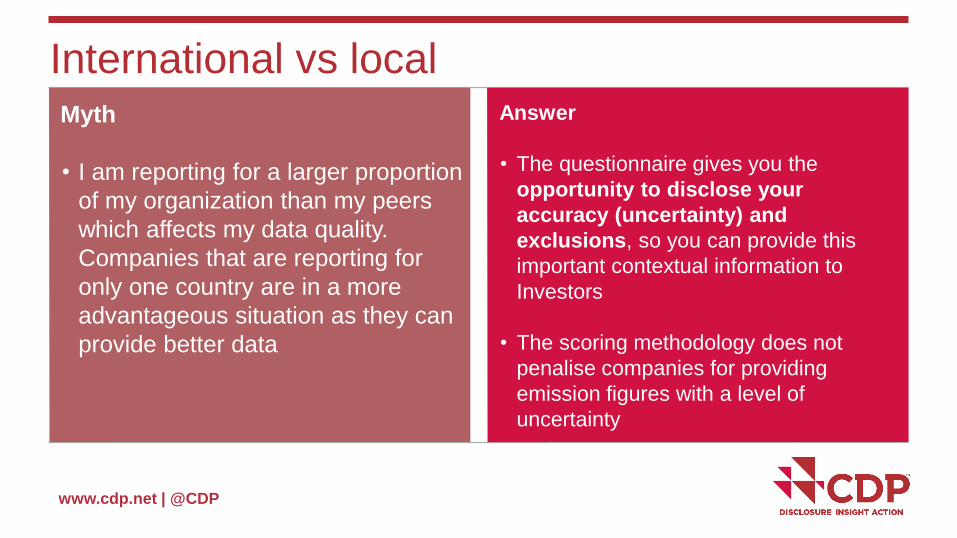
Myth
• I am reporting for a larger proportion
of my organization than my peers
which affects my data quality.
Companies that are reporting for
only one country are in a more
advantageous situation as they can
provide better data
Answer
• The questionnaire gives you the
opportunity to disclose your
accuracy (uncertainty) and
exclusions, so you can provide this
important contextual information to
Investors
• The scoring methodology does not
penalise companies for providing
emission figures with a level of
uncertainty
International vs local
www.cdp.net | @CDP
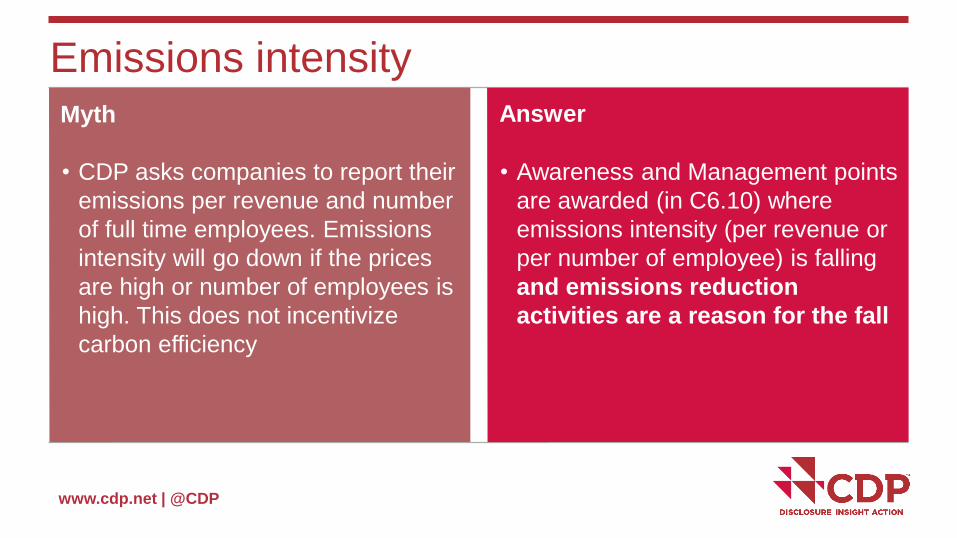
Myth
• CDP asks companies to report their
emissions per revenue and number
of full time employees. Emissions
intensity will go down if the prices
are high or number of employees is
high. This does not incentivize
carbon efficiency
Answer
• Awareness and Management points
are awarded (in C6.10) where
emissions intensity (per revenue or
per number of employee) is falling
and emissions reduction
activities are a reason for the fall
Emissions intensity
www.cdp.net | @CDP Page 136
Thank you