cb consumer spending project 5-11
TRANSCRIPT
P a g e | 2
TABLE OF CONTENTS
I: Executive Summary 3
II: Introduction 3
III: Review of Concepts 4
IV: Method 7
V: Descriptive Results and Findings 10
VI: Organization Specific Analysis 15
VII: Overall Conclusions and Recommendations 16
Bibliography 19
P a g e | 3
I: Executive Summary
Our group is examining a survey that describes the demographic makeup of the College of
Business students at the University of Wisconsin – Oshkosh. The survey gathered mostly metric
data in the form of natural integers and one large synthetic scale. The survey was conducted in
January – February 2013, and was specifically delivered in the Essentials of Marketing class. We
will be utilizing the results from this data to conduct a business analysis for Molly McGuire’s
This report includes insight based off a survey of approximately 150 UW Oshkosh students,
primarily juniors and seniors. The survey helped gather key information on student income,
expenses, debt, and interests. Based on the data that has been collected from these surveys we
hope to be able to discover and come up with possible marketing solutions to help bring more
customers through Molly’s doors. We utilized basic descriptive statistics to get a simple
understanding of the market. We also conducted three primary analyses. The results of these
more in depth analyses should help give Molly’s some ideas to help with their marketing
efforts.
II: Introduction
Molly McGuire’s is a local campus tavern located at 539 Campus Pl. in Oshkosh, Wisconsin.
They are a main stay for UW-Oshkosh students looking for a place to socialize and a have a
good time. Offering a dance floor, pool tables, dart boards, VIP areas, and great deals on both
alcohol and food Molly’s is a well-known tavern that has a history of tradition here in Oshkosh.
Molly’s is one of four closely located campus bars. Kelly’s, French Quarter, and Dark Horse are
the other campus bars located near the UW Oshkosh campus. It should be noted that the
owner of Molly’s is also the primary owner of French Quarter.
Molly McGuire’s has shown interest in trying to establish new promotional ideas in order to
gain more market share. In order to increase its share Molly’s is looking to widen its knowledge
of its target market; students at the University of Wisconsin – Oshkosh. Due to the rivalry and
competitive nature of their market they must implement unique and imitation resistant
opportunities to maintain a loyal customer base as well as attract new customers.
P a g e | 4
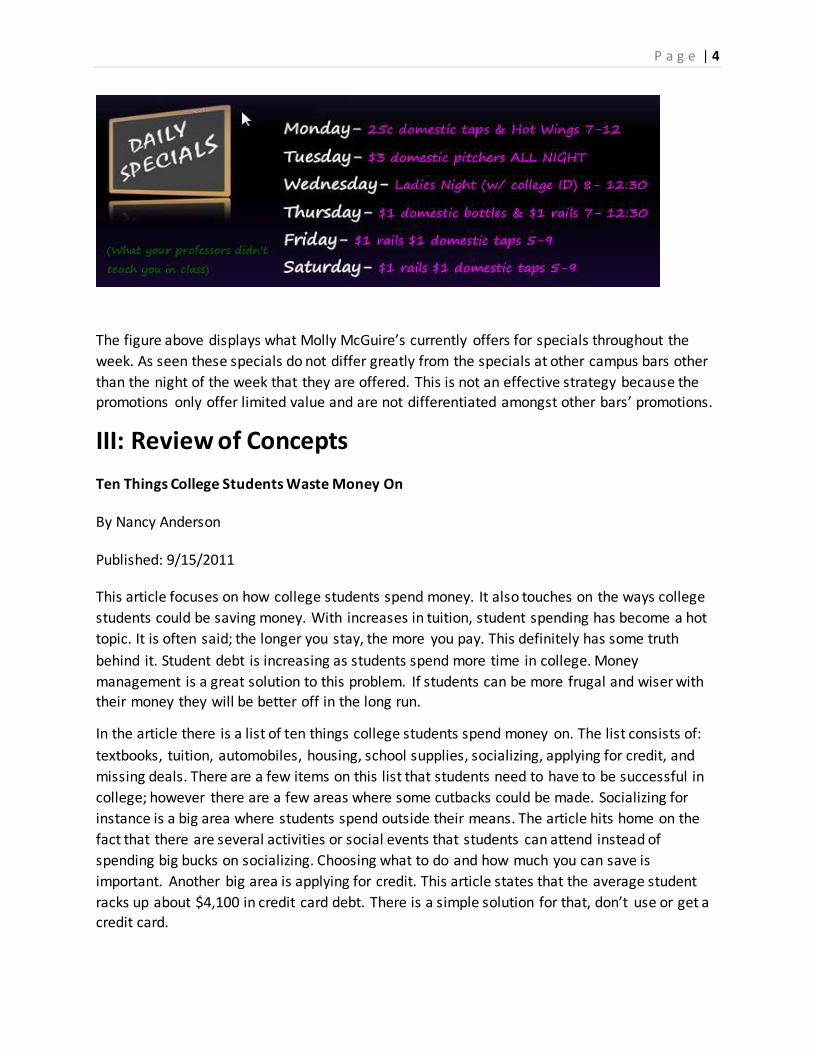
The figure above displays what Molly McGuire’s currently offers for specials throughout the
week. As seen these specials do not differ greatly from the specials at other campus bars other
than the night of the week that they are offered. This is not an effective strategy because the
promotions only offer limited value and are not differentiated amongst other bars’ promotions.
III: Review of Concepts
Ten Things College Students Waste Money On
By Nancy Anderson
Published: 9/15/2011
This article focuses on how college students spend money. It also touches on the ways college
students could be saving money. With increases in tuition, student spending has become a hot
topic. It is often said; the longer you stay, the more you pay. This definitely has some truth
behind it. Student debt is increasing as students spend more time in college. Money
management is a great solution to this problem. If students can be more frugal and wiser with
their money they will be better off in the long run.
In the article there is a list of ten things college students spend money on. The list consists of:
textbooks, tuition, automobiles, housing, school supplies, socializing, applying for credit, and
missing deals. There are a few items on this list that students need to have to be successful in
college; however there are a few areas where some cutbacks could be made. Socializing for
instance is a big area where students spend outside their means. The article hits home on the
fact that there are several activities or social events that students can attend instead of
spending big bucks on socializing. Choosing what to do and how much you can save is
important. Another big area is applying for credit. This article states that the average student
racks up about $4,100 in credit card debt. There is a simple solution for that, don’t use or get a credit card.
P a g e | 5
The main point of this article is to illustrate that student spending can be reduced if it is done
the right way. Prioritizing spending is one great way to save money, yet still enjoy the college experience.
SPENDING PRACTICES OF COLLEGE STUDENTS: ALCOHOL
By: Jeffrey Zilberman
Published: 2009
This article examined the outcome of a study done on college students and their spending
habits and attitudes toward spending. With more and more college students obtaining part
time or work study based jobs while in school, discretionary income in college is increasing. This
study showed that after college students pay for the necessities the next purchase on their
mind is alcohol. Several students were surveyed and admitted that they spend too much on
alcohol and that the main reason for having a part time job is to pay for expenses like this.
The study also looked at the students’ attitude toward their spending habits. In the conclusion
it stated that a majority of the students surveyed are confident in their purchases. This just
shows that students have a different way of prioritizing what they spend their money on.
THE SNACKER GENERATION
BY: LUCY PERKINS
Published: Nov. 12, 2012
This article takes a look at the difference in spending by college aged students in their 20’s and
adults who are out of college. It also examines the flow of students’ money and how fast it
burns a hole in their pocket. Students in college spend the most money on food and alcohol.
People who have been out of college for some time still spend money on both of these,
however the percentage they spend on each is way different than that of a college student. The
college lifestyle is often to blame for this according to the article. Col lege students spend their money as it comes in, and they are quick to spend outside their means.
The article talked a lot about how students in college are often still on “life-support” from
student loans and parental support. This bubble shelters them from the reality that money is
not infinite and that eventually there won’t be any financial support to fall back on. This is
exemplified in the article when they talk about recent college graduates who spend outside of
their means because that is what they are used to doing while in school. Eating out and getting
drinks on a consistent basis over a long period of time adds up even though it doesn’t seem
that way it is true. Spending habits formed while in college carry over and they aren’t always
the best habits. The moral of this article is that practicing frugality in college will only help after
graduation.
P a g e | 6
The Role of Monthly Spending Money in College Student Drinking Behaviors and Their
Consequences.
By: Barbara Alvarez Martin, MPH; Thomas P. McCoy, MS; Heather Champion, PhD;
Maria T. Parries; Robert H. DuRant, PhD; Ananda Mitra, PhD; Scott D. Rhodes, PhD
This article talked took a look at how certain factors affect alcohol consumption. The factors
they looked at were spending money available to students; the amount of drinks the student
consumes on a night out; and the consequences caused from over consuming alcohol. They
conducted a survey online that they sent to 3,634 students from 2 large universities. What the
survey showed was that those students with very low income levels drank much less than those
with middle to higher income levels. They found that when income level exceeded $399 per
month, alcohol related incidents increased compared to the incidents reported from students
who made under $399 per month. Another trend was that those students who indicated they
lived with 3 or more roommates or had Greek affiliation tended to drink more per week.
Fraternities and sororities are stereotyped with being big drinkers, but this study showed that
to be true more often than not. Using a survey from the Harvard College Alcohol Survey
conducted by Powell et al they saw that when the price of alcohol increased however so slightly
student spending towards drinking decreased significantly. They concluded that this study could
be used by universities as a way to decrease drinking among their students. They also think that
marketers could use this data collected to find different ways to target students. The groups
defined as heavy drinkers were defined by race, gender, and spending money, and by using
these groups alcohol beverage companies could market to these groups specifically.
Alcohol drinking among college students: college responsibility for personal troubles
By: Vincent Lorant, Pablo Nicaise, Victoria Eugenia Soto and William d’Hoore
The authors in this article took a look at the factors that influence college students to drink.
They conducted a survey looking at drinking behavior, social involvement, college
environmental factors, drinking norms, and positive drinking consequences. What they found is
that the average student consumed 1.7 drinks a day and had 2.8 violent acts a month. This
number seems high but if you go out on the weekend and have a lot to drink this will affect the
average. They also found that the amount spent on alcohol and the amount consumed
increased when living in a group environment (dorm, frat, roommates). The students
rationalized this amount of alcohol consumption by associating it with socializing. They said
they were using this as a way to come out of their shell and experience college life. Some of the
students felt pressured into drinking more than they normally would in order to “fit in” and be
accepted. These drinking influencers are things universities can control in some way. The
authors stated that universities have a responsibility to inform the incoming students that there
are other things to do besides drinking. Unless universities get out in front of this pattern money spent on alcohol will increase along with the number of alcohol related incidents.
P a g e | 7
IV: Method
Sample Size
The data in this report was obtained from a survey distributed to students in the Essentials of
Marketing course at the University of Wisconsin Oshkosh during January and February 2013.
The College of Business typically requires full admission before a student can take the course, so the sample is heavily weighted towards juniors and seniors.
Because some responses resulted in unreliable or incomplete data, the number of responses on
each question varies. Most questions received between 140 and 155 responses.
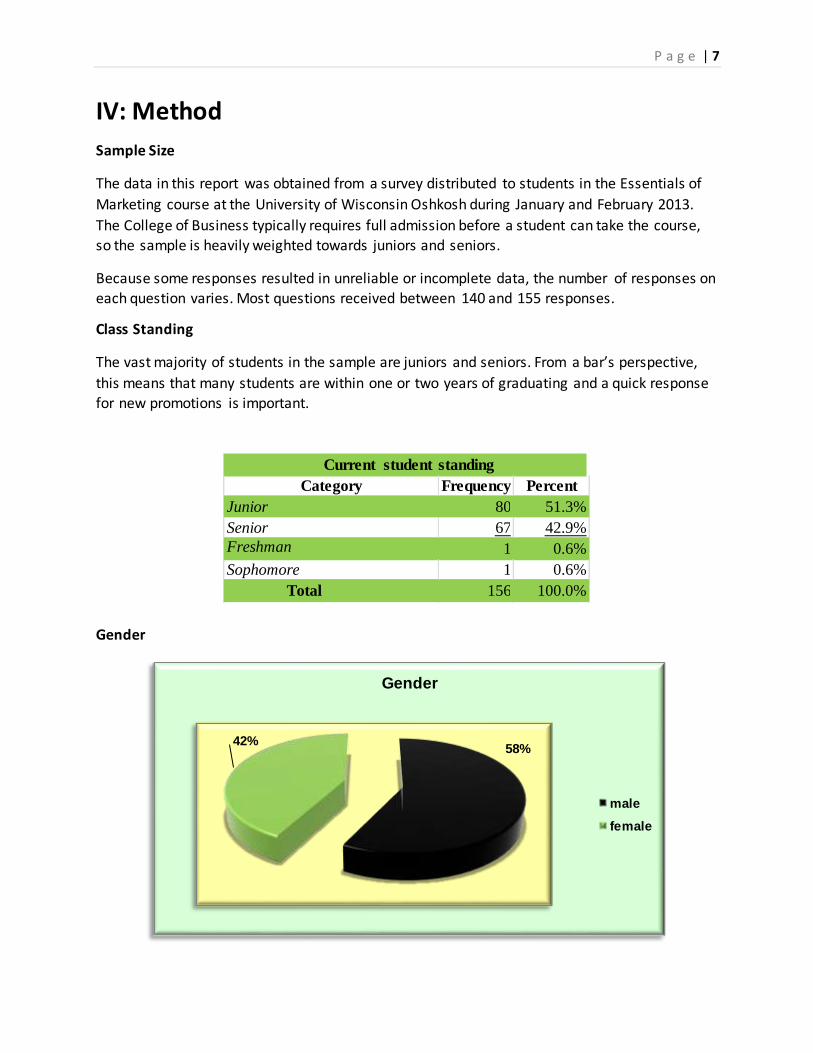
Class Standing
The vast majority of students in the sample are juniors and seniors. From a bar’s perspective,
this means that many students are within one or two years of graduating and a quick response
for new promotions is important.
Gender
58%42%
Gender
male
female
Current student standing
Category Frequency Percent
Junior 80 51.3%
Senior 67 42.9%
Freshman 1 0.6%
Sophomore 1 0.6%
Total 156 100.0%
P a g e | 8
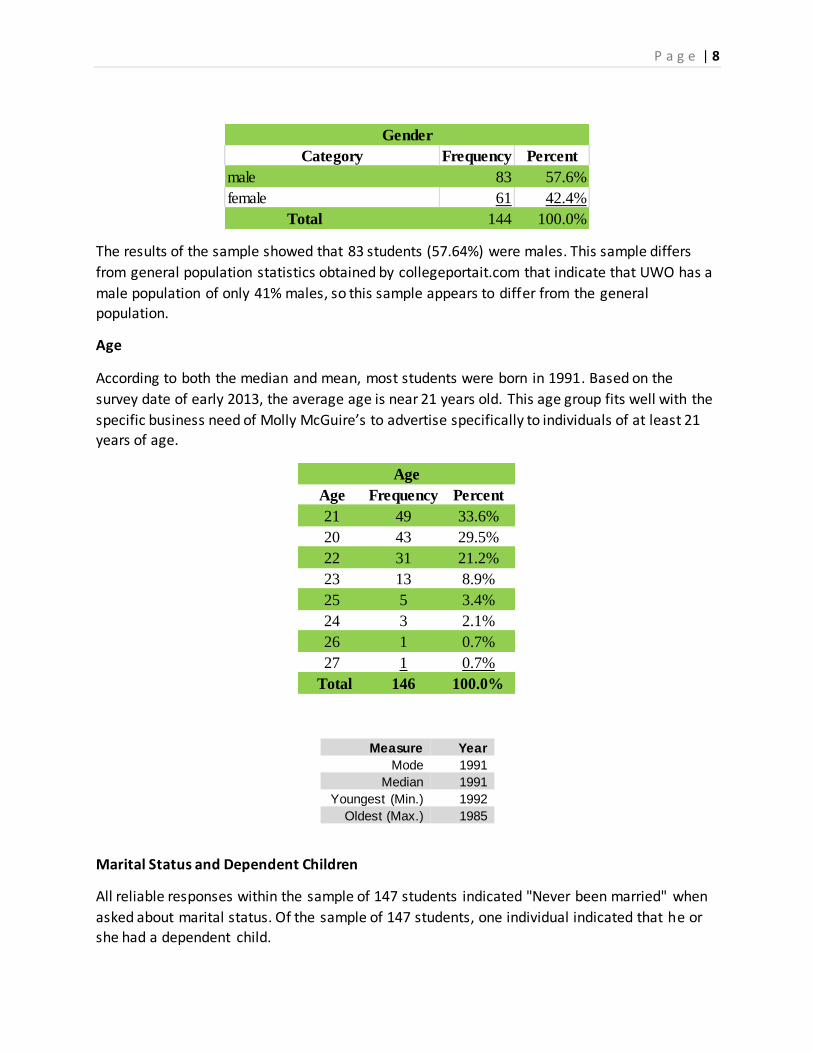
The results of the sample showed that 83 students (57.64%) were males. This sample differs
from general population statistics obtained by collegeportait.com that indicate that UWO has a
male population of only 41% males, so this sample appears to differ from the general
population.
Age
According to both the median and mean, most students were born in 1991. Based on the
survey date of early 2013, the average age is near 21 years old. This age group fits well with the
specific business need of Molly McGuire’s to advertise specifically to individuals of at least 21
years of age.
Measure Year
Mode 1991
Median 1991
Youngest (Min.) 1992
Oldest (Max.) 1985
Marital Status and Dependent Children
All reliable responses within the sample of 147 students indicated "Never been married" when
asked about marital status. Of the sample of 147 students, one individual indicated that he or
she had a dependent child.
Gender
Category Frequency Percent
male 83 57.6%
female 61 42.4%
Total 144 100.0%
Age Frequency Percent
21 49 33.6%
20 43 29.5%
22 31 21.2%
23 13 8.9%
25 5 3.4%
24 3 2.1%
26 1 0.7%
27 1 0.7%
Total 146 100.0%
Age
P a g e | 9
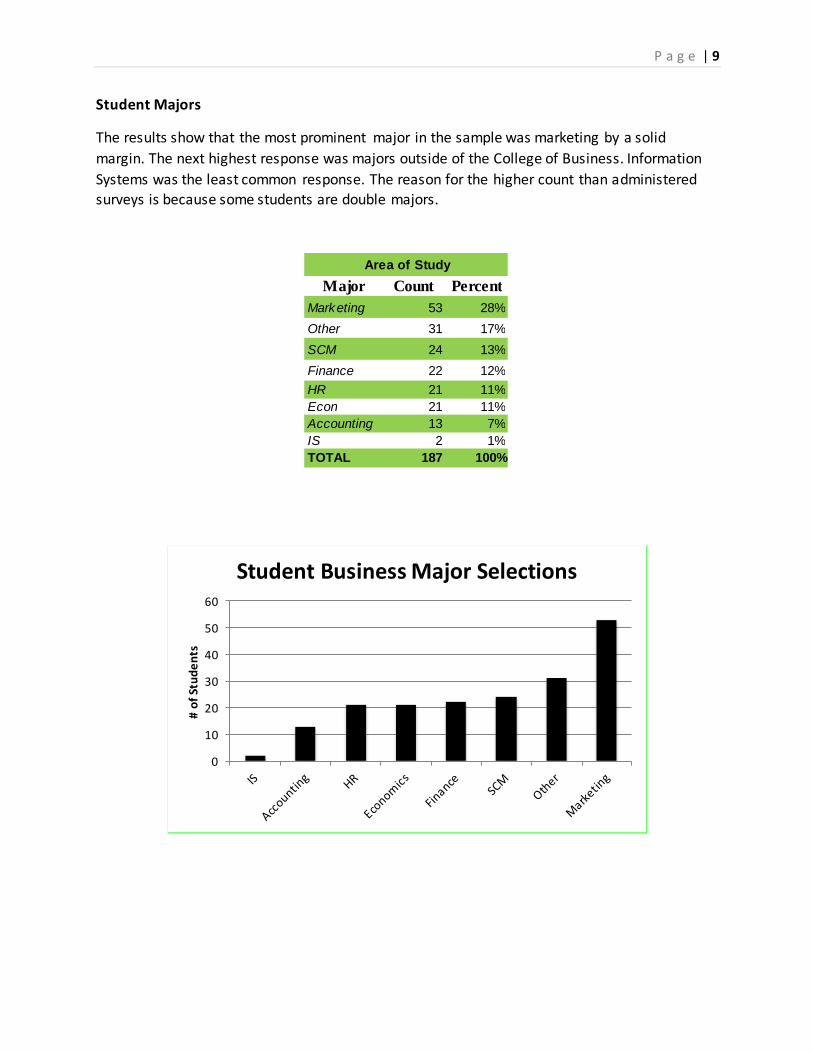
Student Majors
The results show that the most prominent major in the sample was marketing by a solid
margin. The next highest response was majors outside of the College of Business. Information
Systems was the least common response. The reason for the higher count than administered
surveys is because some students are double majors.
0
10
20
30
40
50
60
# o
f St
ud
en
ts
Student Business Major Selections
Major Count Percent
Marketing 53 28%
Other 31 17%
SCM 24 13%
Finance 22 12%
HR 21 11% Econ 21 11% Accounting 13 7% IS 2 1% TOTAL 187 100%
Area of Study
P a g e | 10
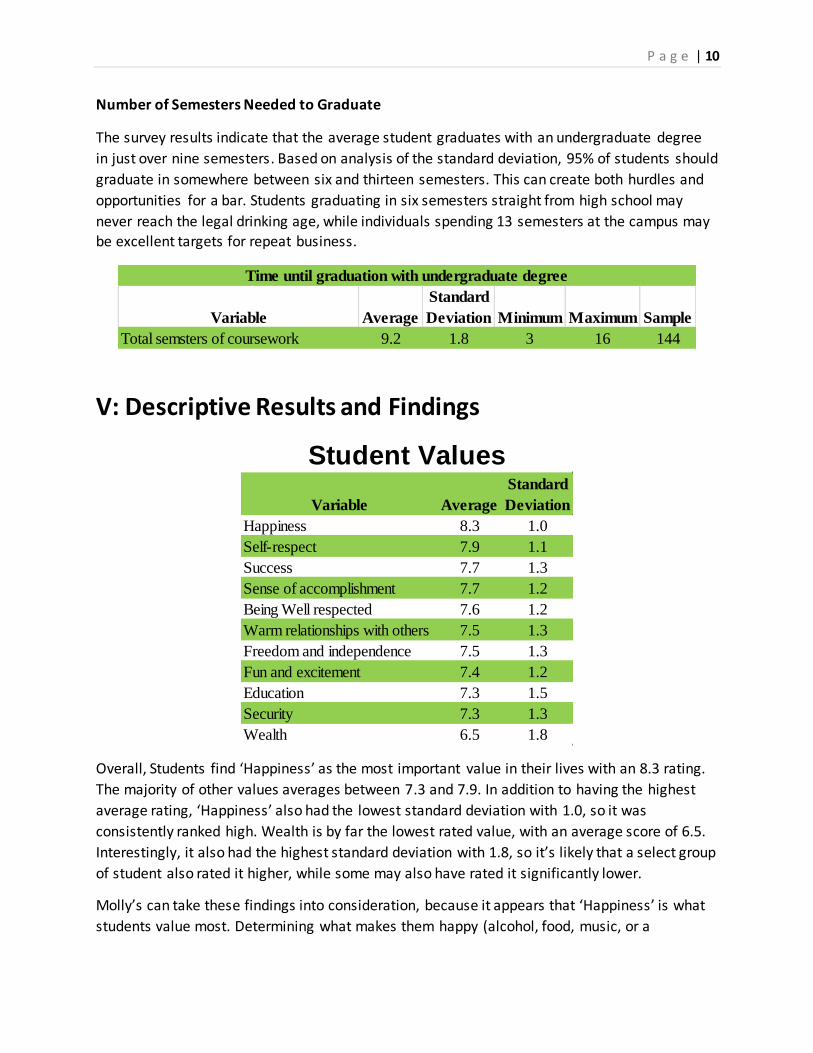
Number of Semesters Needed to Graduate
The survey results indicate that the average student graduates with an undergraduate degree
in just over nine semesters. Based on analysis of the standard deviation, 95% of students should
graduate in somewhere between six and thirteen semesters. This can create both hurdles and
opportunities for a bar. Students graduating in six semesters straight from high school may
never reach the legal drinking age, while individuals spending 13 semesters at the campus may
be excellent targets for repeat business.
V: Descriptive Results and Findings
Overall, Students find ‘Happiness’ as the most important value in their lives with an 8.3 rating.
The majority of other values averages between 7.3 and 7.9. In addition to having the highest
average rating, ‘Happiness’ also had the lowest standard deviation with 1.0, so it was
consistently ranked high. Wealth is by far the lowest rated value, with an average score of 6.5.
Interestingly, it also had the highest standard deviation with 1.8, so it’s likely that a select group
of student also rated it higher, while some may also have rated it significantly lower.
Molly’s can take these findings into consideration, because it appears that ‘Happiness’ is what
students value most. Determining what makes them happy (alcohol, food, music, or a
Variable Average
Standard
Deviation Minimum Maximum Sample
Total semsters of coursework 9.2 1.8 3 16 144
Time until graduation with undergraduate degree
Variable Average
Standard
Deviation
Happiness 8.3 1.0
Self-respect 7.9 1.1
Success 7.7 1.3
Sense of accomplishment 7.7 1.2
Being Well respected 7.6 1.2
Warm relationships with others 7.5 1.3
Freedom and independence 7.5 1.3
Fun and excitement 7.4 1.2
Education 7.3 1.5
Security 7.3 1.3
Wealth 6.5 1.8
Student Values
P a g e | 11
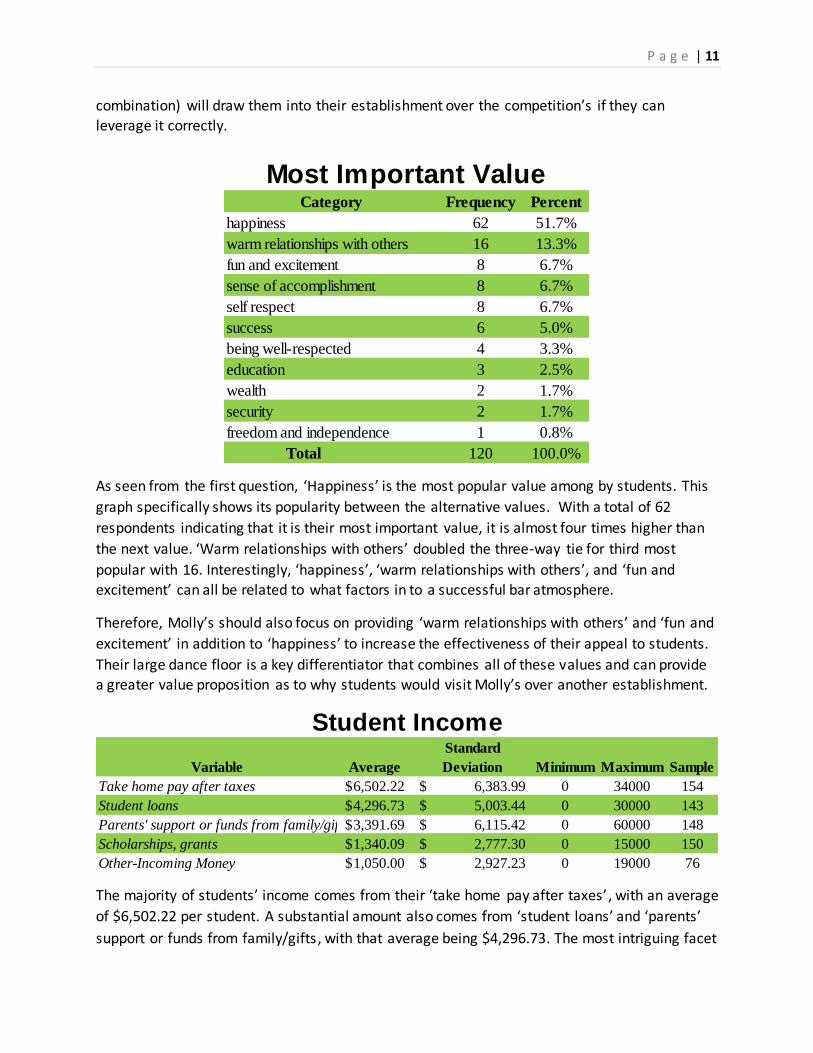
combination) will draw them into their establishment over the competition’s if they can
leverage it correctly.
As seen from the first question, ‘Happiness’ is the most popular value among by students. This
graph specifically shows its popularity between the alternative values. With a total of 62
respondents indicating that it is their most important value, it is almost four times higher than
the next value. ‘Warm relationships with others’ doubled the three-way tie for third most
popular with 16. Interestingly, ‘happiness’, ‘warm relationships with others’, and ‘fun and
excitement’ can all be related to what factors in to a successful bar atmosphere.
Therefore, Molly’s should also focus on providing ‘warm relationships with others’ and ‘fun and
excitement’ in addition to ‘happiness’ to increase the effectiveness of their appeal to students.
Their large dance floor is a key differentiator that combines all of these values and can provide
a greater value proposition as to why students would visit Molly’s over another establishment.
The majority of students’ income comes from their ‘take home pay after taxes’ , with an average
of $6,502.22 per student. A substantial amount also comes from ‘student loans’ and ‘parents’
support or funds from family/gifts, with that average being $4,296.73. The most intriguing facet
Category Frequency Percent
happiness 62 51.7%
warm relationships with others 16 13.3%
fun and excitement 8 6.7%
sense of accomplishment 8 6.7%
self respect 8 6.7%
success 6 5.0%
being well-respected 4 3.3%
education 3 2.5%
wealth 2 1.7%
security 2 1.7%
freedom and independence 1 0.8%
Total 120 100.0%
Most Important Value
Variable Average
Standard
Deviation Minimum Maximum Sample
Take home pay after taxes 6,502.22$ 6,383.99$ 0 34000 154
Student loans 4,296.73$ 5,003.44$ 0 30000 143
Parents' support or funds from family/gifts 3,391.69$ 6,115.42$ 0 60000 148
Scholarships, grants 1,340.09$ 2,777.30$ 0 15000 150
Other-Incoming Money 1,050.00$ 2,927.23$ 0 19000 76
Student Income
P a g e | 12
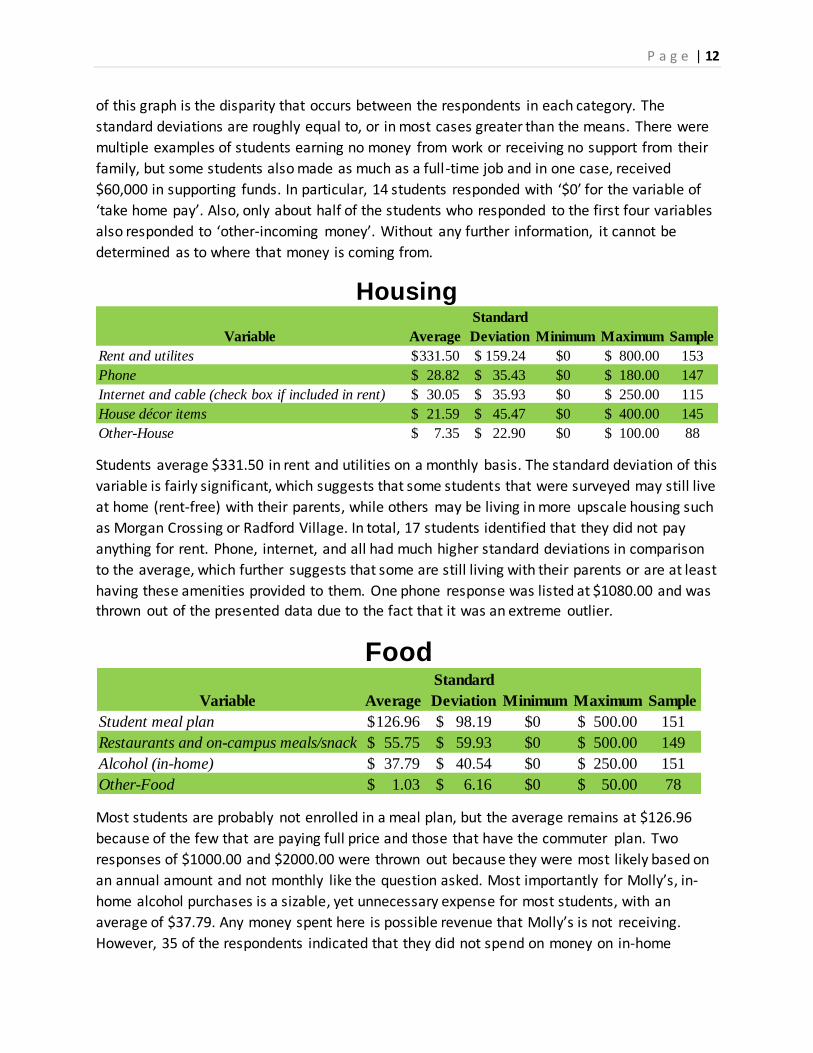
of this graph is the disparity that occurs between the respondents in each category. The
standard deviations are roughly equal to, or in most cases greater than the means. There were
multiple examples of students earning no money from work or receiving no support from their
family, but some students also made as much as a full-time job and in one case, received
$60,000 in supporting funds. In particular, 14 students responded with ‘$0’ for the variable of
‘take home pay’. Also, only about half of the students who responded to the first four variables
also responded to ‘other-incoming money’. Without any further information, it cannot be
determined as to where that money is coming from.
Students average $331.50 in rent and utilities on a monthly basis. The standard deviation of this
variable is fairly significant, which suggests that some students that were surveyed may still live
at home (rent-free) with their parents, while others may be living in more upscale housing such
as Morgan Crossing or Radford Village. In total, 17 students identified that they did not pay
anything for rent. Phone, internet, and all had much higher standard deviations in comparison
to the average, which further suggests that some are still living with their parents or are at least
having these amenities provided to them. One phone response was listed at $1080.00 and was
thrown out of the presented data due to the fact that it was an extreme outlier.
Most students are probably not enrolled in a meal plan, but the average remains at $126.96
because of the few that are paying full price and those that have the commuter plan. Two
responses of $1000.00 and $2000.00 were thrown out because they were most likely based on
an annual amount and not monthly like the question asked. Most importantly for Molly’s, in-
home alcohol purchases is a sizable, yet unnecessary expense for most students, with an
average of $37.79. Any money spent here is possible revenue that Molly’s is not receiving.
However, 35 of the respondents indicated that they did not spend on money on in-home
Variable Average
Standard
Deviation Minimum Maximum Sample
Rent and utilites 331.50$ 159.24$ $0 800.00$ 153
Phone 28.82$ 35.43$ $0 180.00$ 147
Internet and cable (check box if included in rent) 30.05$ 35.93$ $0 250.00$ 115
House décor items 21.59$ 45.47$ $0 400.00$ 145
Other-House 7.35$ 22.90$ $0 100.00$ 88
Housing
Variable Average
Standard
Deviation Minimum Maximum Sample
Student meal plan 126.96$ 98.19$ $0 500.00$ 151
Restaurants and on-campus meals/snacks 55.75$ 59.93$ $0 500.00$ 149
Alcohol (in-home) 37.79$ 40.54$ $0 250.00$ 151
Other-Food 1.03$ 6.16$ $0 50.00$ 78
Food
P a g e | 13
alcohol purchases. This more likely corresponds to non-drinkers than it does to those who only
consume alcohol at parties or bars.
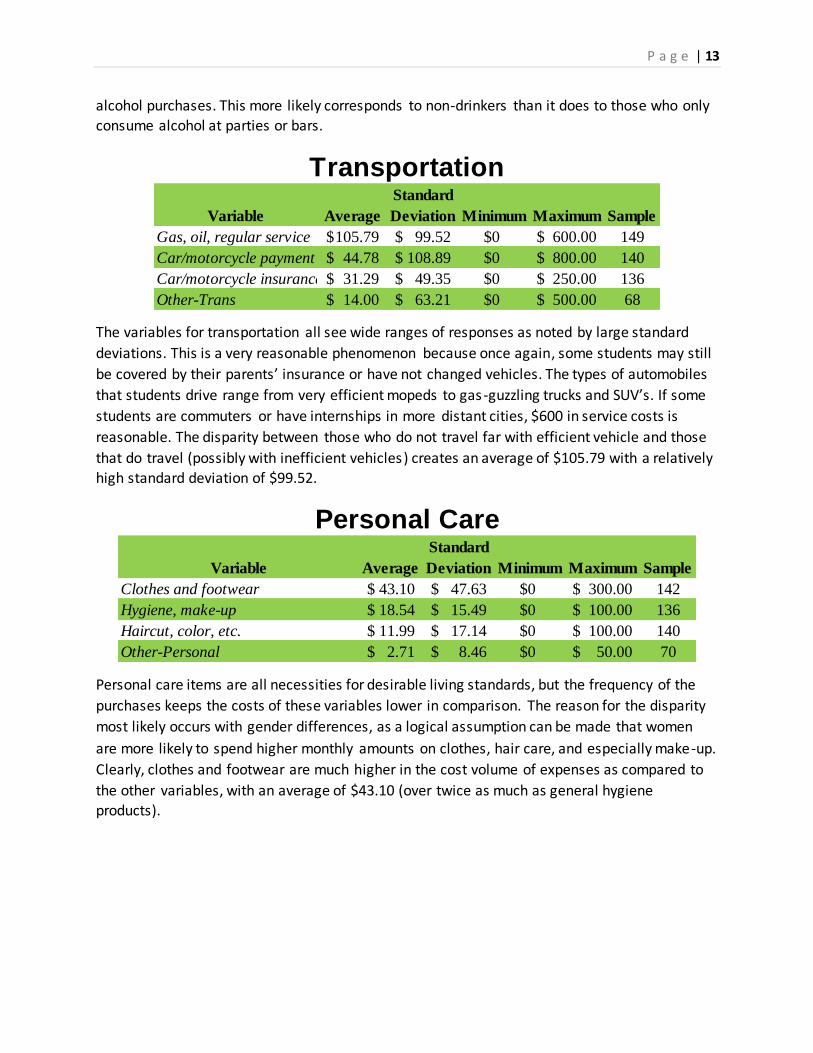
The variables for transportation all see wide ranges of responses as noted by large standard
deviations. This is a very reasonable phenomenon because once again, some students may still
be covered by their parents’ insurance or have not changed vehicles. The types of automobiles
that students drive range from very efficient mopeds to gas-guzzling trucks and SUV’s. If some
students are commuters or have internships in more distant cities, $600 in service costs is
reasonable. The disparity between those who do not travel far with efficient vehicle and those
that do travel (possibly with inefficient vehicles) creates an average of $105.79 with a relatively
high standard deviation of $99.52.
Personal care items are all necessities for desirable living standards, but the frequency of the
purchases keeps the costs of these variables lower in comparison. The reason for the disparity
most likely occurs with gender differences, as a logical assumption can be made that women
are more likely to spend higher monthly amounts on clothes, hair care, and especially make-up.
Clearly, clothes and footwear are much higher in the cost volume of expenses as compared to
the other variables, with an average of $43.10 (over twice as much as general hygiene
products).
Variable Average
Standard
Deviation Minimum Maximum Sample
Gas, oil, regular service 105.79$ 99.52$ $0 600.00$ 149
Car/motorcycle payment 44.78$ 108.89$ $0 800.00$ 140
Car/motorcycle insurance 31.29$ 49.35$ $0 250.00$ 136
Other-Trans 14.00$ 63.21$ $0 500.00$ 68
Transportation
Variable Average
Standard
Deviation Minimum Maximum Sample
Clothes and footwear 43.10$ 47.63$ $0 300.00$ 142
Hygiene, make-up 18.54$ 15.49$ $0 100.00$ 136
Haircut, color, etc. 11.99$ 17.14$ $0 100.00$ 140
Other-Personal 2.71$ 8.46$ $0 50.00$ 70
Personal Care
P a g e | 14
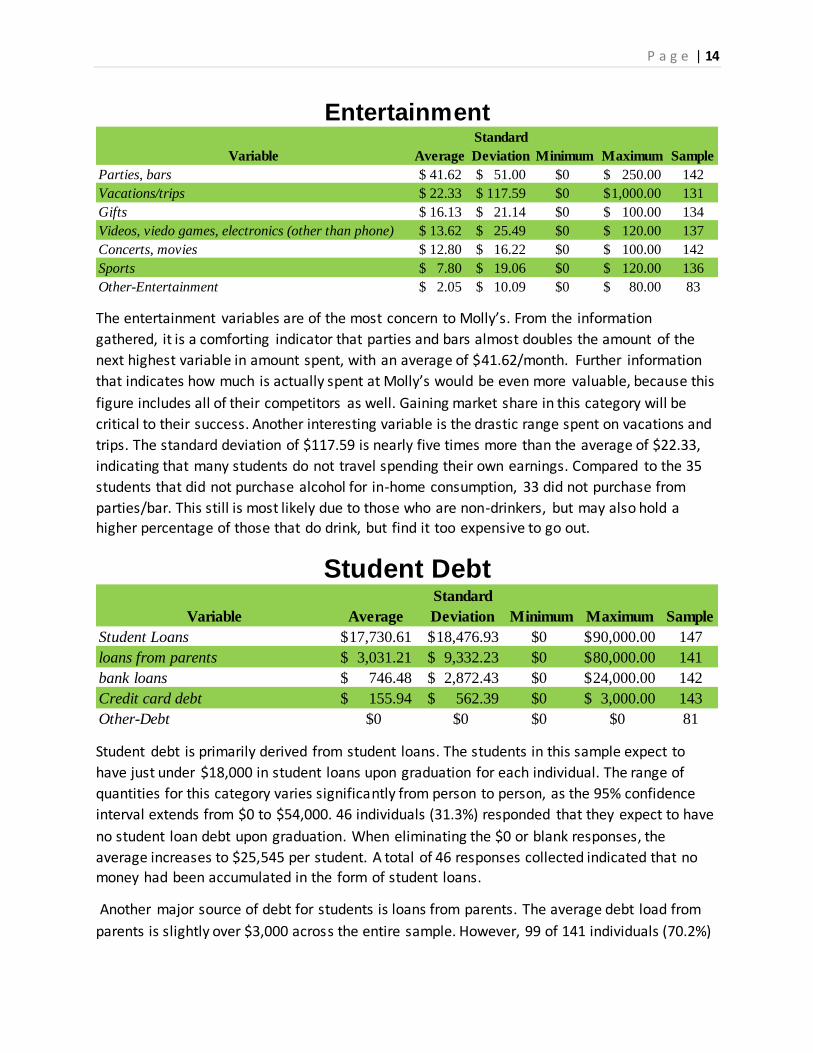
The entertainment variables are of the most concern to Molly’s. From the information
gathered, it is a comforting indicator that parties and bars almost doubles the amount of the
next highest variable in amount spent, with an average of $41.62/month. Further information
that indicates how much is actually spent at Molly’s would be even more valuable, because this
figure includes all of their competitors as well. Gaining market share in this category will be
critical to their success. Another interesting variable is the drastic range spent on vacations and
trips. The standard deviation of $117.59 is nearly five times more than the average of $22.33,
indicating that many students do not travel spending their own earnings. Compared to the 35
students that did not purchase alcohol for in-home consumption, 33 did not purchase from
parties/bar. This still is most likely due to those who are non-drinkers, but may also hold a higher percentage of those that do drink, but find it too expensive to go out.
Student debt is primarily derived from student loans. The students in this sample expect to
have just under $18,000 in student loans upon graduation for each individual. The range of
quantities for this category varies significantly from person to person, as the 95% confidence
interval extends from $0 to $54,000. 46 individuals (31.3%) responded that they expect to have
no student loan debt upon graduation. When eliminating the $0 or blank responses, the
average increases to $25,545 per student. A total of 46 responses collected indicated that no
money had been accumulated in the form of student loans.
Another major source of debt for students is loans from parents. The average debt load from
parents is slightly over $3,000 across the entire sample. However, 99 of 141 individuals (70.2%)
Variable Average
Standard
Deviation Minimum Maximum Sample
Parties, bars 41.62$ 51.00$ $0 250.00$ 142
Vacations/trips 22.33$ 117.59$ $0 1,000.00$ 131
Gifts 16.13$ 21.14$ $0 100.00$ 134
Videos, viedo games, electronics (other than phone) 13.62$ 25.49$ $0 120.00$ 137
Concerts, movies 12.80$ 16.22$ $0 100.00$ 142
Sports 7.80$ 19.06$ $0 120.00$ 136
Other-Entertainment 2.05$ 10.09$ $0 80.00$ 83
Entertainment
Variable Average
Standard
Deviation Minimum Maximum Sample
Student Loans 17,730.61$ 18,476.93$ $0 90,000.00$ 147
loans from parents 3,031.21$ 9,332.23$ $0 80,000.00$ 141
bank loans 746.48$ 2,872.43$ $0 24,000.00$ 142
Credit card debt 155.94$ 562.39$ $0 3,000.00$ 143
Other-Debt $0 $0 $0 $0 81
Student Debt
P a g e | 15
do not expect to owe any debt to their parents, so we also adjusted the numbers to examine
how much a student with some debt to his or her parents will owe upon graduation. This
resulted in an adjusted average debt of $10,176. Interestingly, all 81 responses to the ‘other
debt’ variable indicated $0.
Because of the high debt students are facing on average, Molly’s should focus on providing
students with greater value. This becomes a double-edged sword because as seen, credit does
not stop students from spending and they do not see themselves in any additional debt. If it is
directly pointed out to them, they may either be more enticed to participate in finding the best
deal. Or, they may come to the realization that even though their debt is not entirely
comprehensible because most of it is credit based and they may want to start saving more.
VI: Organization Specific Analysis
Questions to pose for further analysis
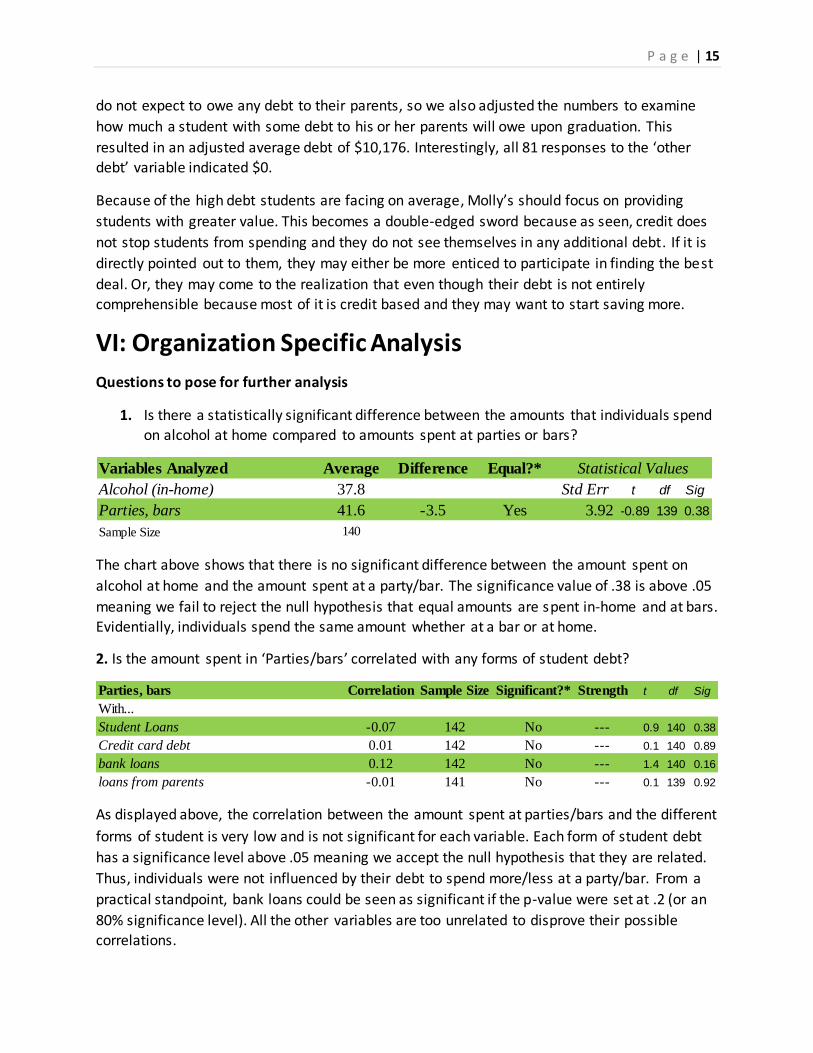
1. Is there a statistically significant difference between the amounts that individuals spend on alcohol at home compared to amounts spent at parties or bars?
The chart above shows that there is no significant difference between the amount spent on
alcohol at home and the amount spent at a party/bar. The significance value of .38 is above .05
meaning we fail to reject the null hypothesis that equal amounts are spent in-home and at bars.
Evidentially, individuals spend the same amount whether at a bar or at home.
2. Is the amount spent in ‘Parties/bars’ correlated with any forms of student debt?
As displayed above, the correlation between the amount spent at parties/bars and the different
forms of student is very low and is not significant for each variable. Each form of student debt
has a significance level above .05 meaning we accept the null hypothesis that they are related.
Thus, individuals were not influenced by their debt to spend more/less at a party/bar. From a
practical standpoint, bank loans could be seen as significant if the p-value were set at .2 (or an
80% significance level). All the other variables are too unrelated to disprove their possible
correlations.
Variables Analyzed Average Difference Equal?* Statistical Values
Alcohol (in-home) 37.8 Std Err t df Sig
Parties, bars 41.6 -3.5 Yes 3.92 -0.89 139 0.38
Sample Size 140
Parties, bars Correlation Sample Size Significant?* Strength t df Sig
With...
Student Loans -0.07 142 No --- 0.9 140 0.38
Credit card debt 0.01 142 No --- 0.1 140 0.89
bank loans 0.12 142 No --- 1.4 140 0.16
loans from parents -0.01 141 No --- 0.1 139 0.92
P a g e | 16
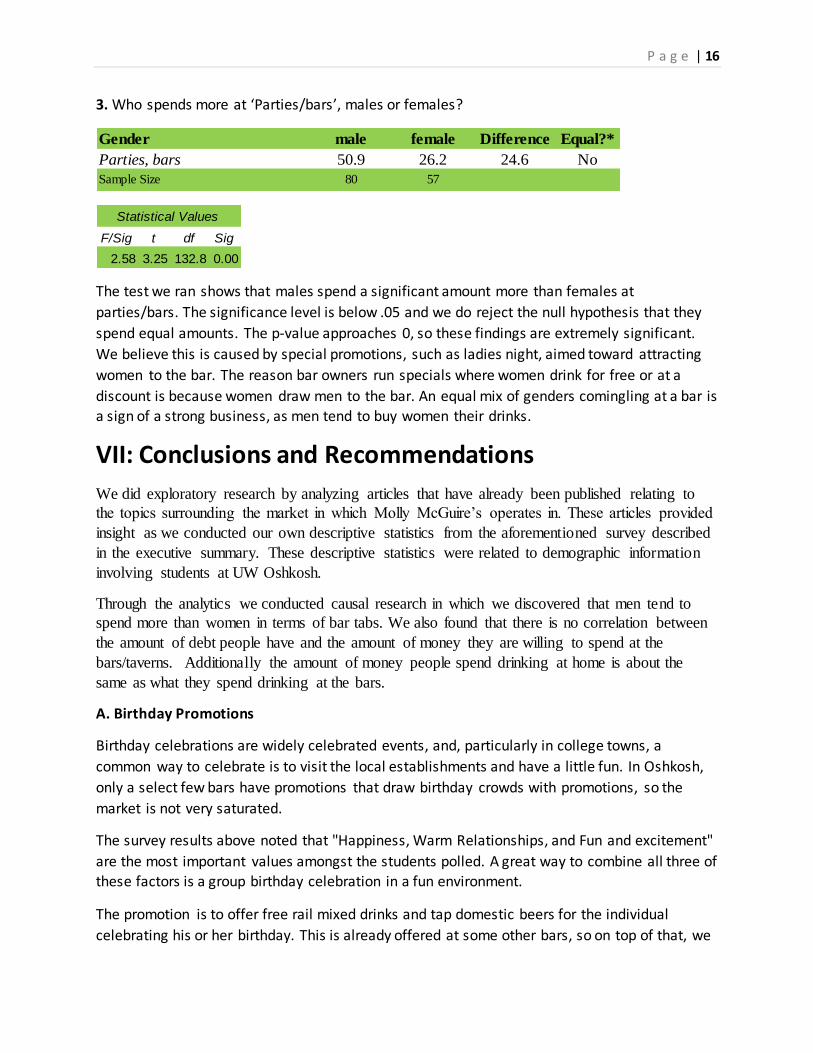
3. Who spends more at ‘Parties/bars’, males or females?
The test we ran shows that males spend a significant amount more than females at
parties/bars. The significance level is below .05 and we do reject the null hypothesis that they
spend equal amounts. The p-value approaches 0, so these findings are extremely significant.
We believe this is caused by special promotions, such as ladies night, aimed toward attracting
women to the bar. The reason bar owners run specials where women drink for free or at a
discount is because women draw men to the bar. An equal mix of genders comingling at a bar is
a sign of a strong business, as men tend to buy women their drinks.
VII: Conclusions and Recommendations
We did exploratory research by analyzing articles that have already been published relating to
the topics surrounding the market in which Molly McGuire’s operates in. These articles provided
insight as we conducted our own descriptive statistics from the aforementioned survey described
in the executive summary. These descriptive statistics were related to demographic information
involving students at UW Oshkosh.
Through the analytics we conducted causal research in which we discovered that men tend to
spend more than women in terms of bar tabs. We also found that there is no correlation between
the amount of debt people have and the amount of money they are willing to spend at the
bars/taverns. Additionally the amount of money people spend drinking at home is about the
same as what they spend drinking at the bars.
A. Birthday Promotions
Birthday celebrations are widely celebrated events, and, particularly in college towns, a
common way to celebrate is to visit the local establishments and have a little fun. In Oshkosh,
only a select few bars have promotions that draw birthday crowds with promotions, so the
market is not very saturated.
The survey results above noted that "Happiness, Warm Relationships, and Fun and excitement"
are the most important values amongst the students polled. A great way to combine all three of
these factors is a group birthday celebration in a fun environment.
The promotion is to offer free rail mixed drinks and tap domestic beers for the individual
celebrating his or her birthday. This is already offered at some other bars, so on top of that, we
Gender male female Difference Equal?*
Parties, bars 50.9 26.2 24.6 No
Sample Size 80 57
Statistical Values
F/Sig t df Sig
2.58 3.25 132.8 0.00
P a g e | 17
propose to offer a special for the group of friends also participating in the celebration. Our
vision is a deal to offer 10 pitchers of domestic tap beer for $50 total. The group can pay for
tickets upon entering the bar and redeem them throughout the night. The benefit to the bar is
this commits the group to a longer period of time in the bar where there could be extra
spending on shots or games like pool and darts.
B. Celebrate Payday with Molly McGuire's
Some of the articles above mention that college students are impulsive with their spending,
especially when sources of debt such as student loans or credit cards are readily available.
Several students in the Zilberman article even admitted that funding their entertainment habits
was the primary reason for holding a part-time job. As marketers, we can leverage this into a
promotion geared towards these working individuals.
Of students in the sample, only 14 of 150 responded that they had no income from jobs. While
some may only work while at home during the summer, this means that a majority of students
probably have jobs during the school year. The idea behind this promotion is to offer a free tap
beer or rail mixer to students who show their Titan ID (or FVTC ID) and bring in a pay stub for
that particular date proving employment. This promotion provides a direct outlet to celebrate
payday, whether it be with co-workers who get paid on the same date or other friends.
C. Gender Specific Marketing
The survey results show a significant difference between the spending levels at bars and parties
of men and women. This would imply that a bar should simply gear its marketing efforts strictly
to men. However, the gender mix in a bar is an important contributor to the atmosphere, so a
room full of men who are willing to spend more based on statistics may not be the most
profitable option, as some male customers will stop going as well.
The key for Molly's is to direct purchasing promotions towards gender-specific ideas in order to
keep a good mix of customers, while trying to bring in more men who statistically-speaking
should spend more. Molly's currently only offers one major drink special each night. Instead,
they could continue a beer special such as a discounted pitcher, but also couple it with a
specialty cocktail aimed at women that may not come in for a beer special.
D. Draw People Out
The survey results show that there is not a significant difference between student spending at
parties and bars when compared to spending for consumption of alcohol at home. While not
perfect substitutes, these two spending categories are certainly similar, so there may be sales
opportunities for the bars if they can pull some of this monthly spending from the in-home
consumption pool, they will be better off.
For Molly's specifically, they have some differentiating assets in terms of the interior structure
that could be utilized to separate the bar from drinking at home. Their large dance floor is
P a g e | 18
unlike any other bar near the Oshkosh campus, so a way to utilize it could be to offer themed
parties. Having a "Country Night" or "80s Night" offer patrons an opportunity to experience
something different from the typical Friday night and give them a specific reason to go to
Molly's instead of staying home or going to another bar.
P a g e | 19
Bibliography
Anderson, Nancy. "Ten Things College Students Waste Money On." Forbes. Forbes Magazine, 15 Sept.
2011. Web. 11 Apr. 2014. <http://www.forbes.com/sites/financialfinesse/2011/09/15/ten-things-college-students-waste-money-on/>.
Zilberman, Jeffrey. SPENDING PRACTICES OF COLLEGE STUDENTS: ALCOHOL. Roger Williams University,
2009. Web. <http://www.nedsi.org/proc/2009/proc/p081019011.pdf>.
Perkins, Lucy. "The Snacker Generation." The Michigan Daily. University of Michigan, 12 Nov. 2012.
Web. 16 Apr. 2014. <http://www.michigandaily.com/article/college-student-spending-luxury?page=0,0>.
Lorant, Vincent, et al. "Alcohol Drinking Among College Students: College Responsibility For Personal
Troubles." BMC Public Health 13.1 (2013): 1-9. Academic Search Complete. Web. 16 Apr. 2014.
Martin, Barbara Alvarez, et al. "The Role Of Monthly Spending Money In College Student Drinking
Behaviors And Their Consequences." Journal Of American College Health 57.6 (2009): 587-596. SPORTDiscus with Full Text. Web. 20 Mar. 2014.