cavern background
DESCRIPTION
Cavern background. Charlie Young (SLAC). Outline. Reminder of what is cavern background Simulation of cavern background Physics event generation Tracks at scoring volume surface Detector hits for pile-up digitization Estimated hit rates without detector hits Status and outlook. - PowerPoint PPT PresentationTRANSCRIPT
1
CAVERN BACKGROUNDCharlie Young (SLAC)
2
Outline Reminder of what is cavern background Simulation of cavern background
Physics event generation Tracks at scoring volume surface Detector hits for pile-up digitization Estimated hit rates without detector hits
Status and outlook
3
What Is Cavern Background?
4
Cavern Background
Cavern Background refers to the typically low energy (MeV and below) predominantly neutral (g and n) long lived (compared with LHC bunch
spacing of 25 nsec and revolution time of ~0.1 msec)
background in the ATLAS cavern coming from p-p collisions.
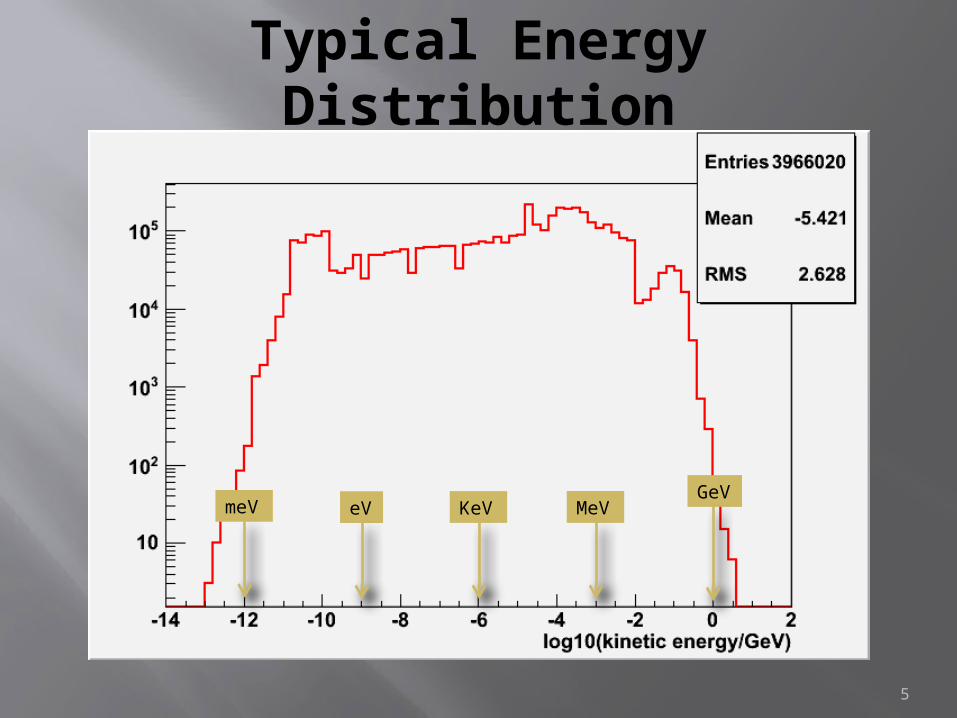
5
Typical Energy Distribution
GeVMe
VKeVeVme
V
6
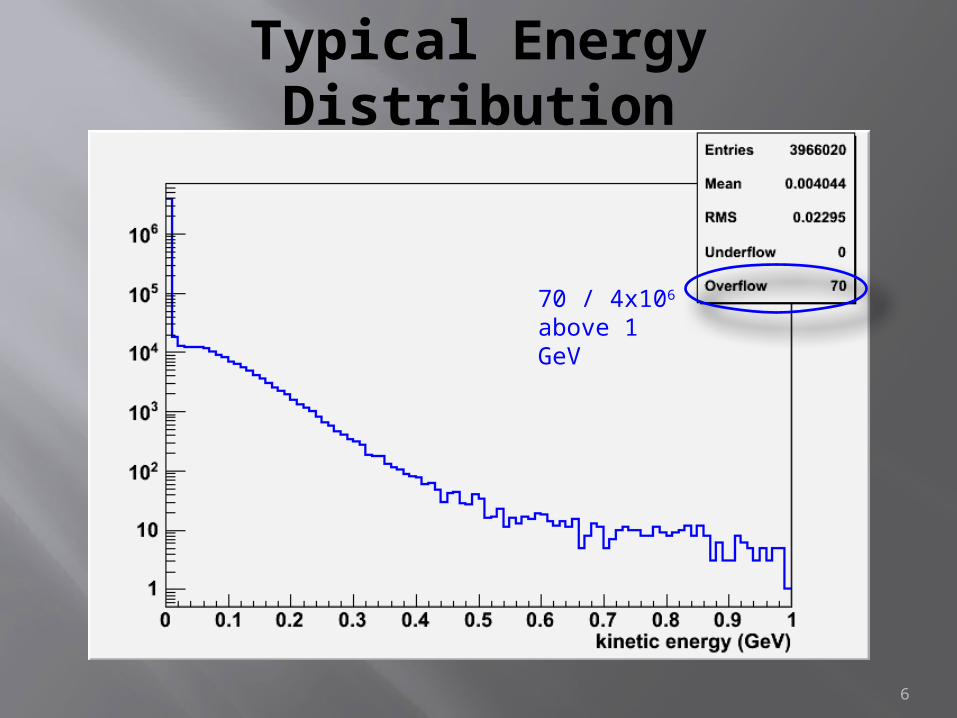
Typical Energy Distribution
70 / 4x10⁶ above 1 GeV

7
Particle Type Distribution
Photo
nN
eu
tron
Posi
tronEle
ctro
n
Pro
ton
Muon +
Muon -
Pio
n +
Pio
n -
See http://www.fluka.org/fluka.php?id=man_onl&sub=7 for all FLUKA particle codes

8
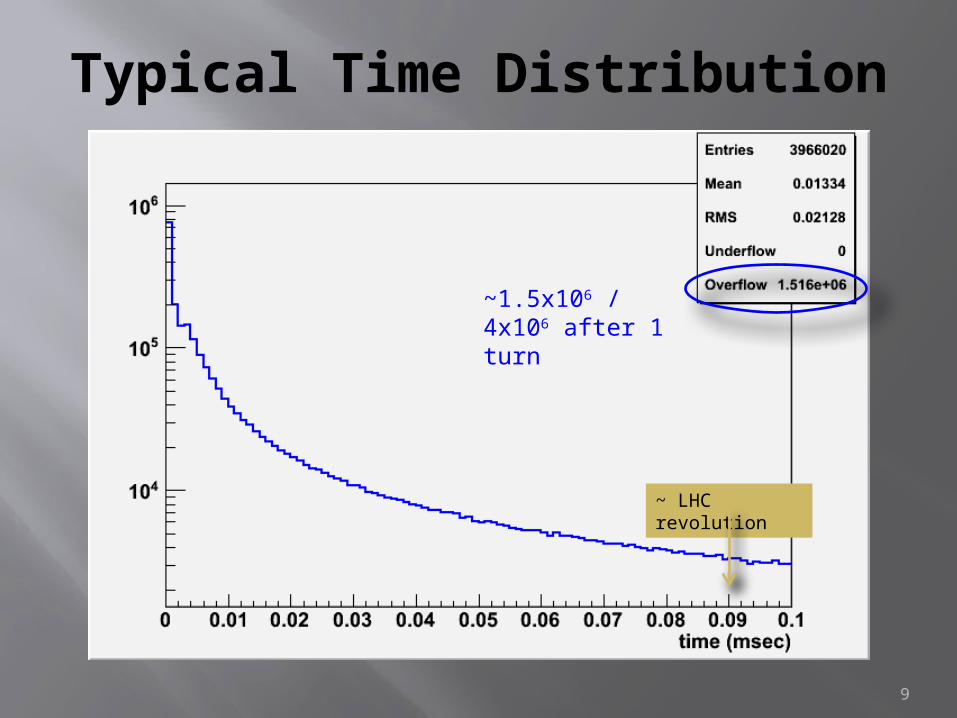
Typical Time Distribution
~ LHC revolution
25nsec BC
9
Typical Time Distribution
~1.5x10⁶ / 4x10⁶ after 1 turn
~ LHC revolution
10
Uncertainty in Hit Rate Estimated by Radiation Background Task
Force Three major factors in muon detector hit
rate uncertainty: 1.3x for p-p cross section 2.5x for calculation of background particle flux 1.5x for detector response
Overall uncertainty ~5x
11
Simulation of Cavern Background
12
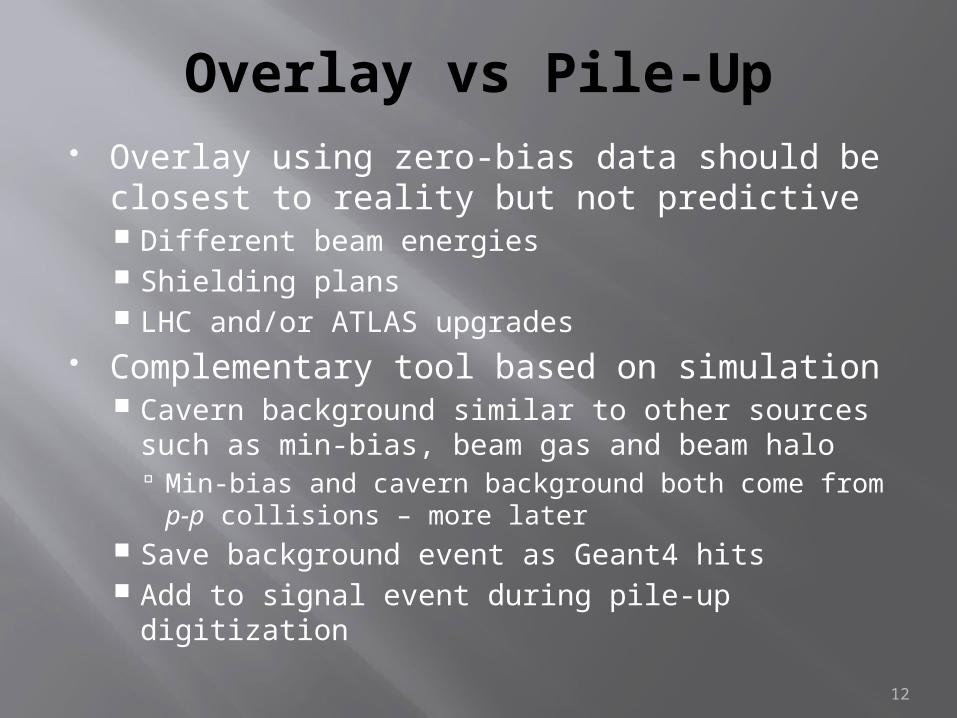
Overlay vs Pile-Up Overlay using zero-bias data should be
closest to reality but not predictive Different beam energies Shielding plans LHC and/or ATLAS upgrades
Complementary tool based on simulation Cavern background similar to other sources
such as min-bias, beam gas and beam halo Min-bias and cavern background both come from p-p collisions – more later
Save background event as Geant4 hits Add to signal event during pile-up digitization
13
Steps
14
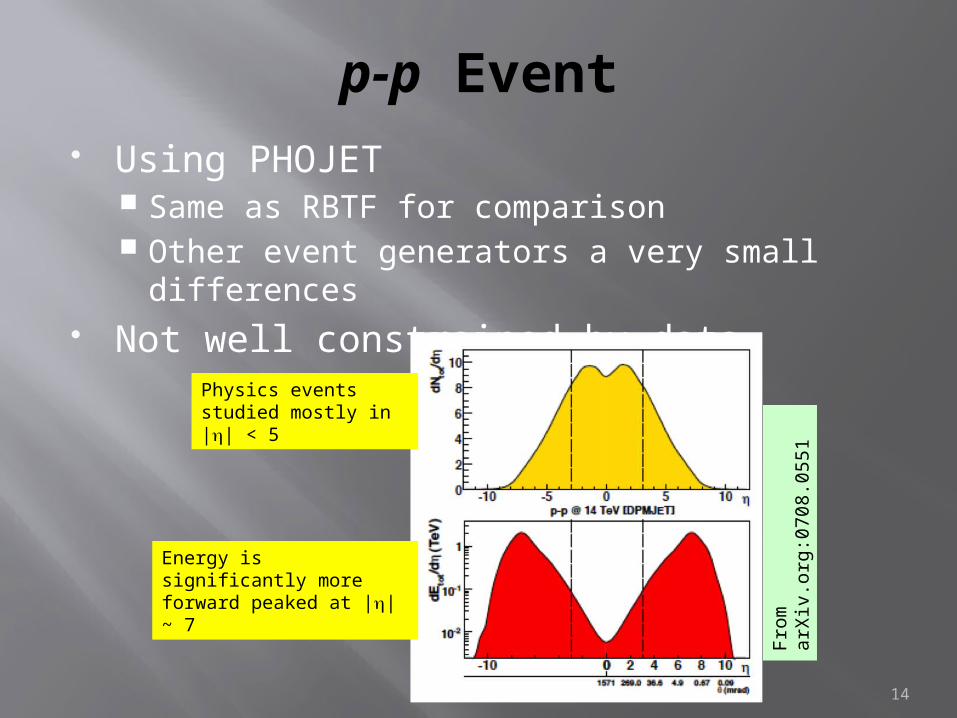
p-p Event Using PHOJET
Same as RBTF for comparison Other event generators a very small
differences Not well constrained by data
From
arX
iv.o
rg:0
70
8.0
551
Energy is significantly more forward peaked at |h| ~ 7
Physics events studied mostly in |h| < 5
15
FLUGG: Background Calculation
FLUGG combines Geant4 and FLUKA Geant4 description of detector
Detector simplified from Athena description for speed E.g. no internal structure in calorimeters
More realistic compared with RBTF Shielding and cavern description more important
than in physics simulation, e.g. curved end walls Release-to-release changes unimportant
FLUKA physics Low energy n and g exiting shielding and
calorimeter just like shielding calculations where FLUKA is the standard
16
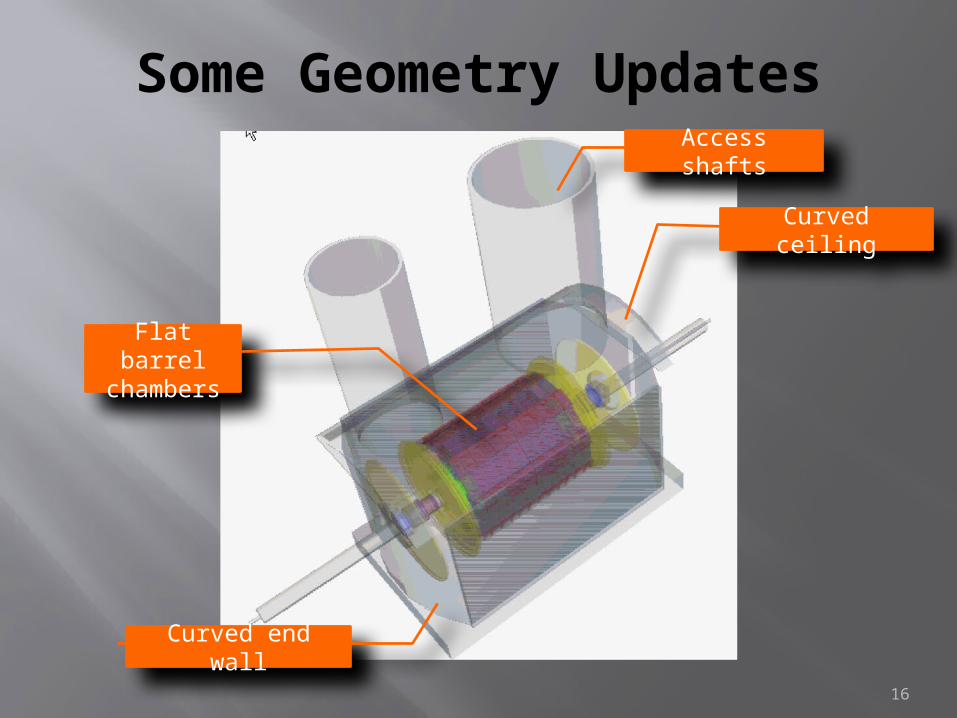
Some Geometry Updates
Curved end wall
Curved ceiling
Access shafts
Flat barrel chambers
17
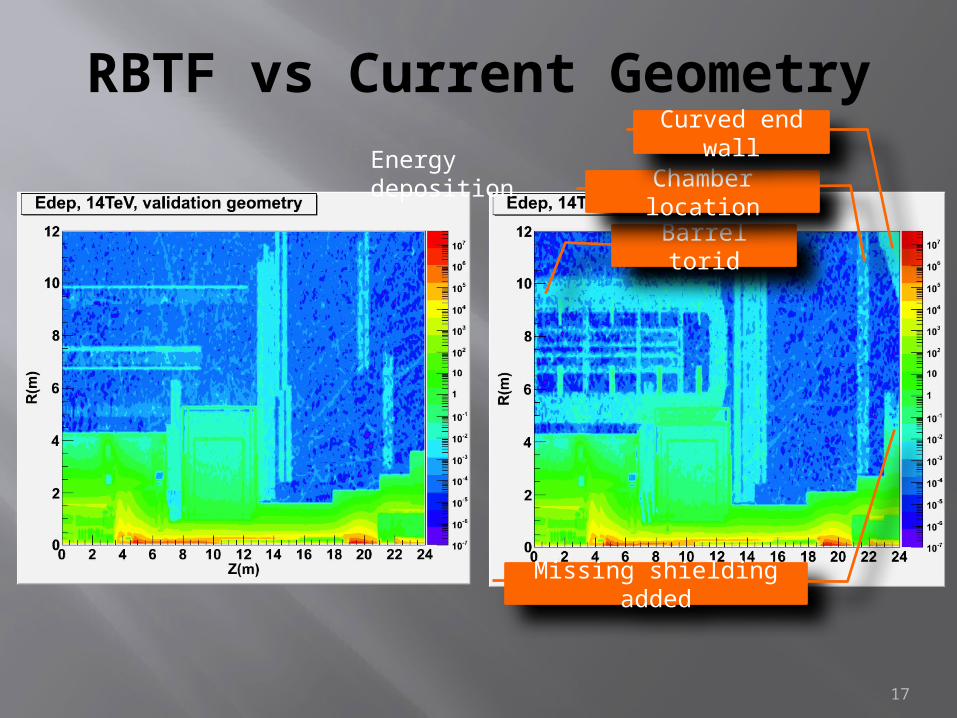
RBTF vs Current Geometry
Barrel torid
Chamber location
Curved end wall
Missing shielding added
Energy deposition
18
FLUGG Output Fluence maps in (r,z) space – see examples later Track every particle, including decay and
interaction products, until it falls below (very low) energy cut.
Define scoring volumes Imaginary surfaces surrounding each region of
interest, e.g. muon station, MBTS and MPX Implemented as cylinders
Record “4-vector” when entering any scoring volume (x,y,z,t) and (px,py,pz,E) Note: a particle may have more than one record
because of multiple crossings into scoring volumes
In practice, direction cosines and kinetic energy
19
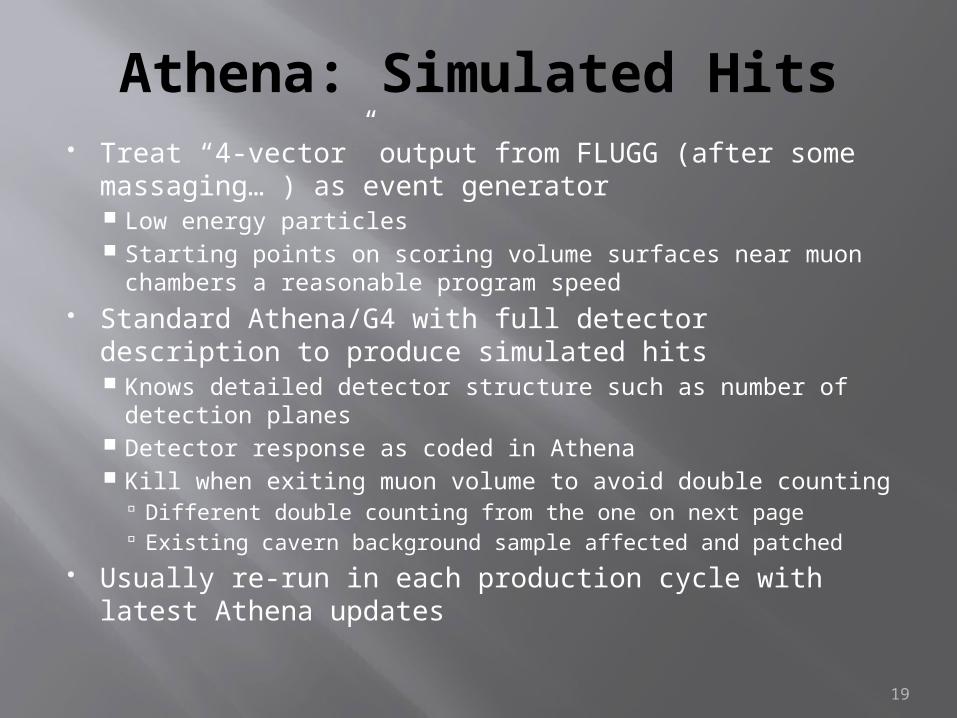
Athena: Simulated Hits Treat “4-vector” output from FLUGG (after some
massaging… ) as event generator Low energy particles Starting points on scoring volume surfaces near muon
chambers a reasonable program speed Standard Athena/G4 with full detector description to
produce simulated hits Knows detailed detector structure such as number of
detection planes Detector response as coded in Athena Kill when exiting muon volume to avoid double counting
Different double counting from the one on next page Existing cavern background sample affected and patched
Usually re-run in each production cycle with latest Athena updates
20
Massaging Kill prompt charged particles
Logically identical particles also present in minimum-bias events – both come from p-p collision
Existing cavern background sample did not do this, leading to double counting of prompt muons and artificially high trigger rates in pile-up samples
Modify hit times to be within 25 nsec of a particle traveling at speed of light Athena/G4 has time cut that would otherwise
remove most hits Effect identical to bunch train with 25-nsec
separation
21
Shortcut for Hit Rate Convolute 4-vectors produced by FLUGG with detector
response curves Different responses for CSC, MDT, RPC and TGC Different responses for n and g Taken from RBTF Report – examples on next pages Account for path length due to incident angle
Benefits Much faster Higher statistics from artificially boosted response
Global boost factor a no change in relative numbers Drawbacks
No knowledge of detector structure or granularity Overlap between sectors Number of detection planes
Response curve in general different from Athena implementation Comparisons to date have used this result
22
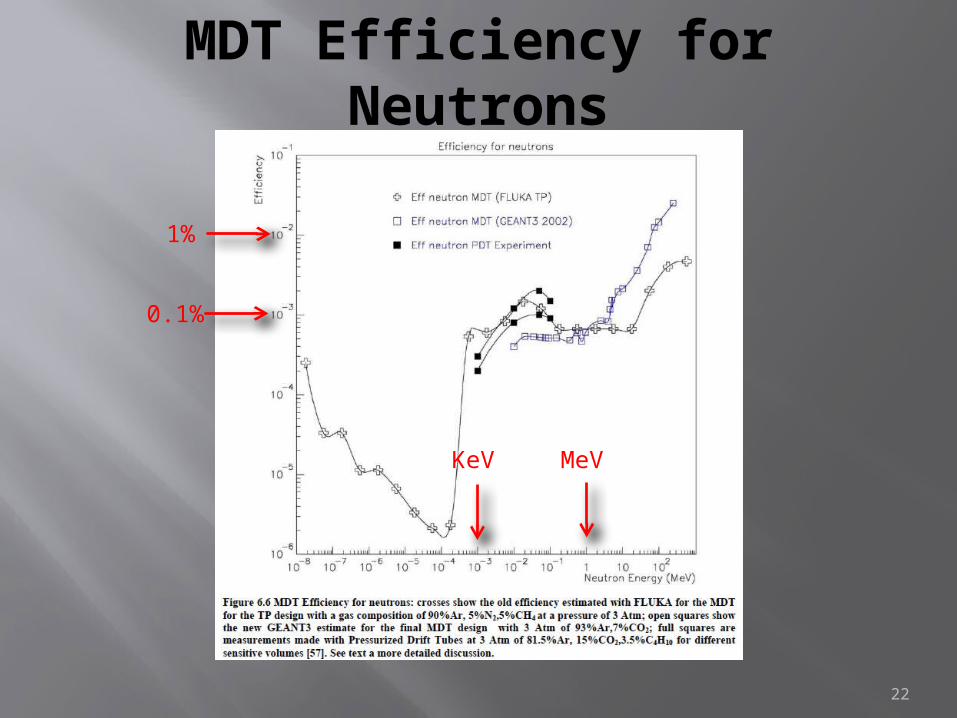
MDT Efficiency for Neutrons
1%
0.1%
MeVKeV
23
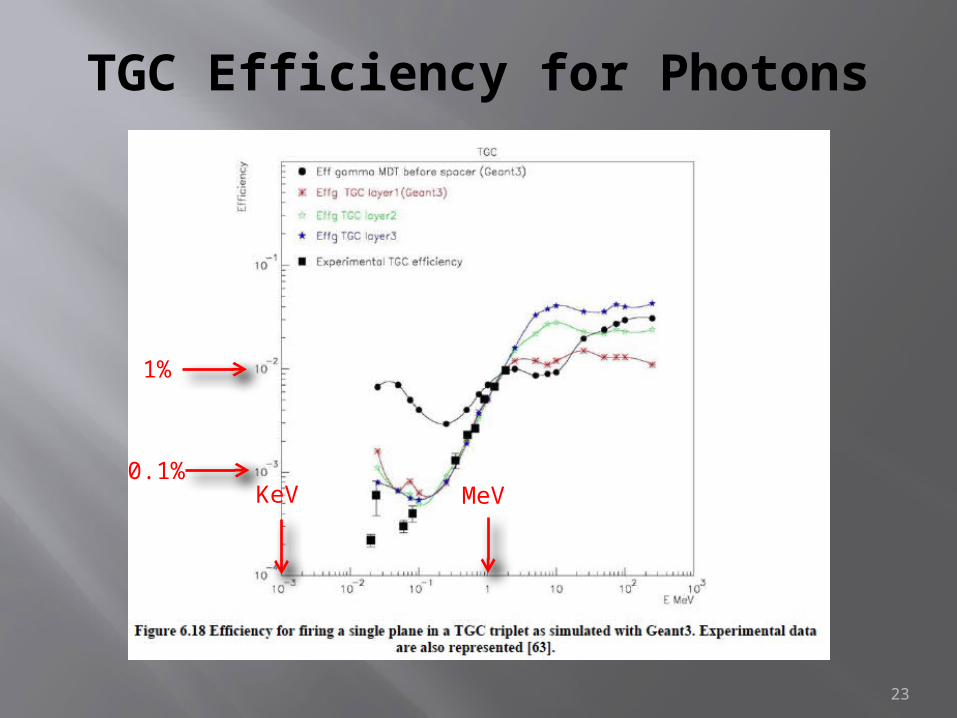
TGC Efficiency for Photons
1%
0.1%MeVKeV
24
Changes from RBTF Geometry
No longer cylindrically symmetric Improved detector and cavern description Many cross-checks with Mike Shupe! Flux incident on muon chambers ~75% of before
Beam energy 7 TeV ~75% of 14 TeV
Overall change roughly factor of two Depends on location
No double counting of prompt muons in pile-up Correlated hits directly affecting trigger rates
No need to patch double counting of low-energy particles Uncorrelated hits
25
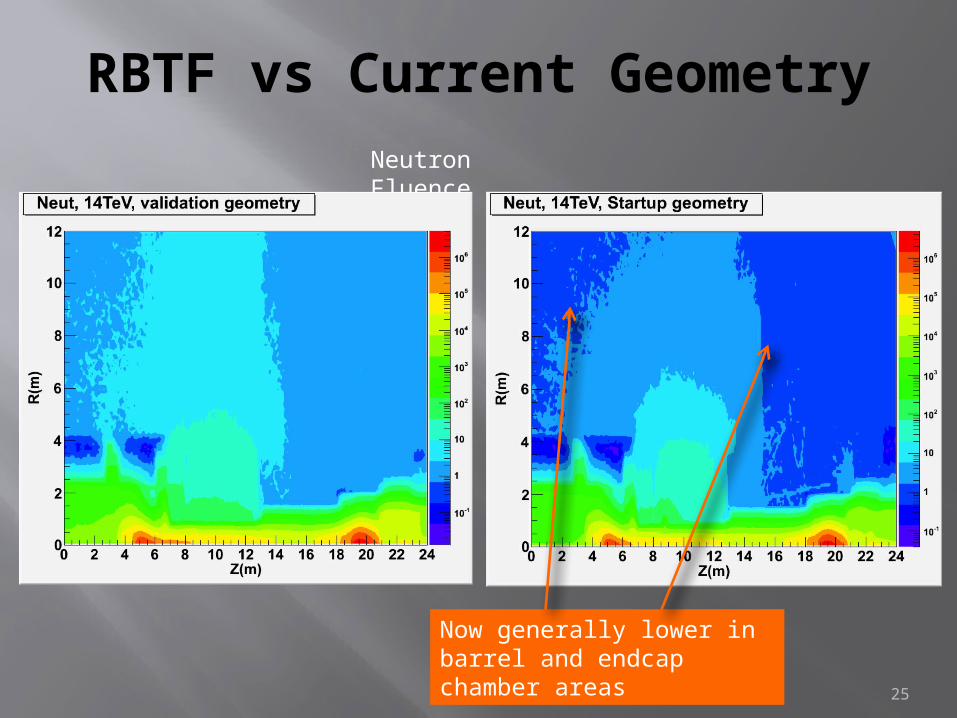
RBTF vs Current GeometryNeutron Fluence
Now generally lower in barrel and endcap chamber areas
26
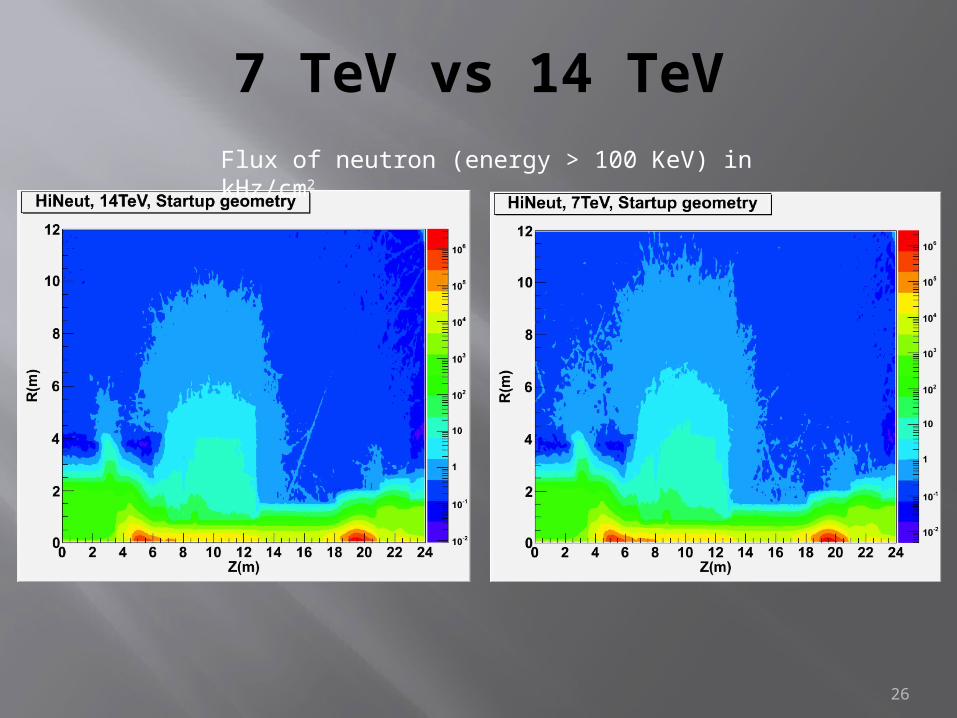
7 TeV vs 14 TeVFlux of neutron (energy > 100 KeV) in kHz/cm2
27
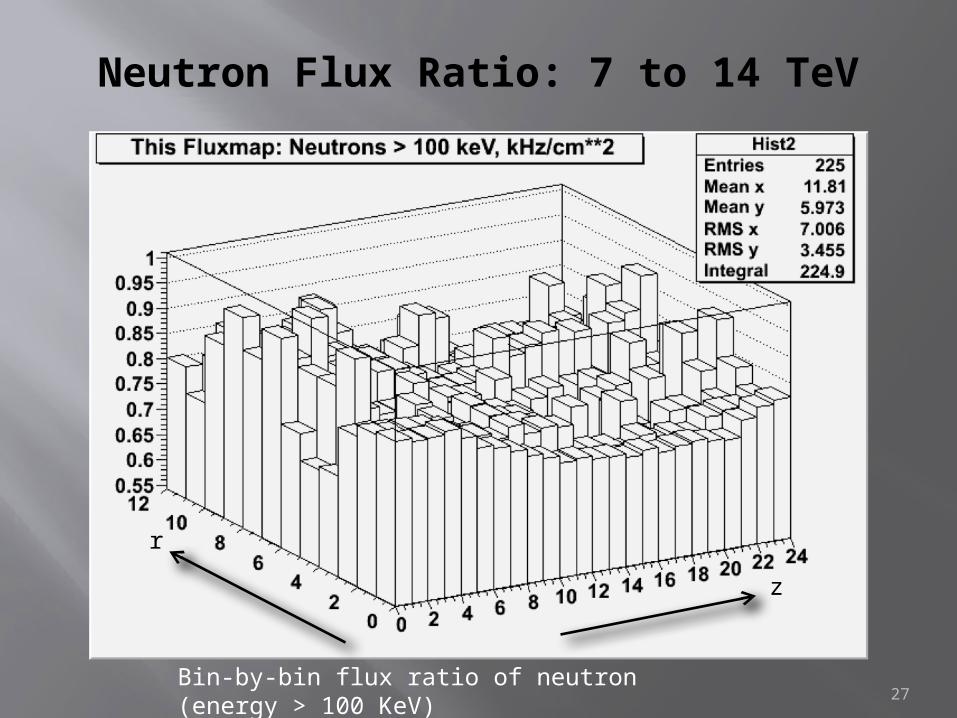
Neutron Flux Ratio: 7 to 14 TeV
Bin-by-bin flux ratio of neutron (energy > 100 KeV)
z
r
28
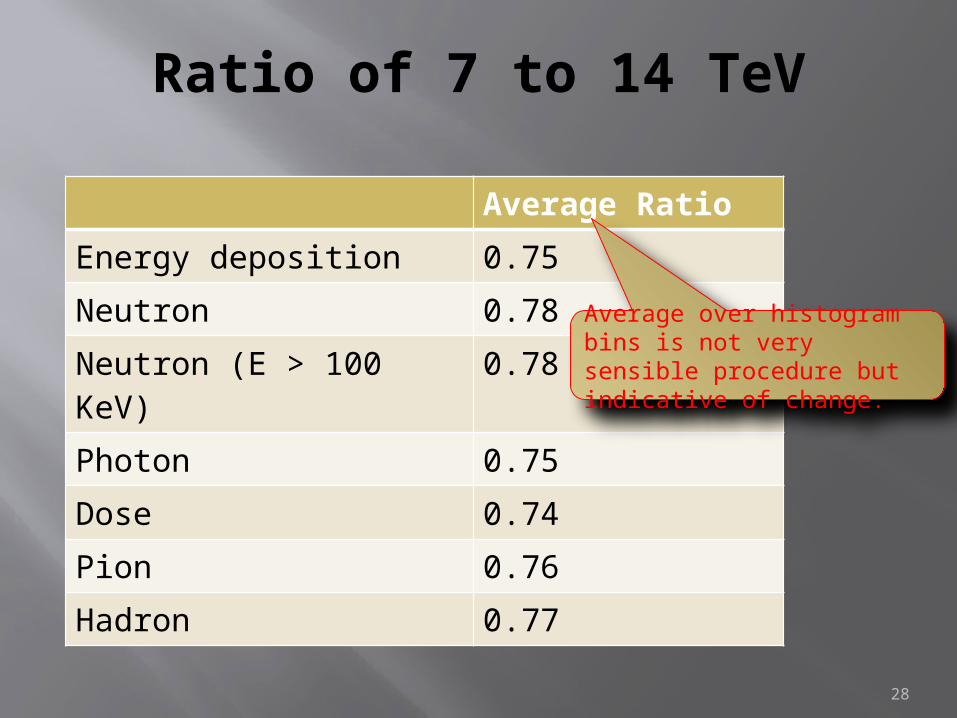
Ratio of 7 to 14 TeV
Average Ratio
Energy deposition 0.75
Neutron 0.78
Neutron (E > 100 KeV) 0.78
Photon 0.75
Dose 0.74
Pion 0.76
Hadron 0.77
Average over histogram bins is not very sensible procedure but indicative of change.
29
Status and Outlook
30
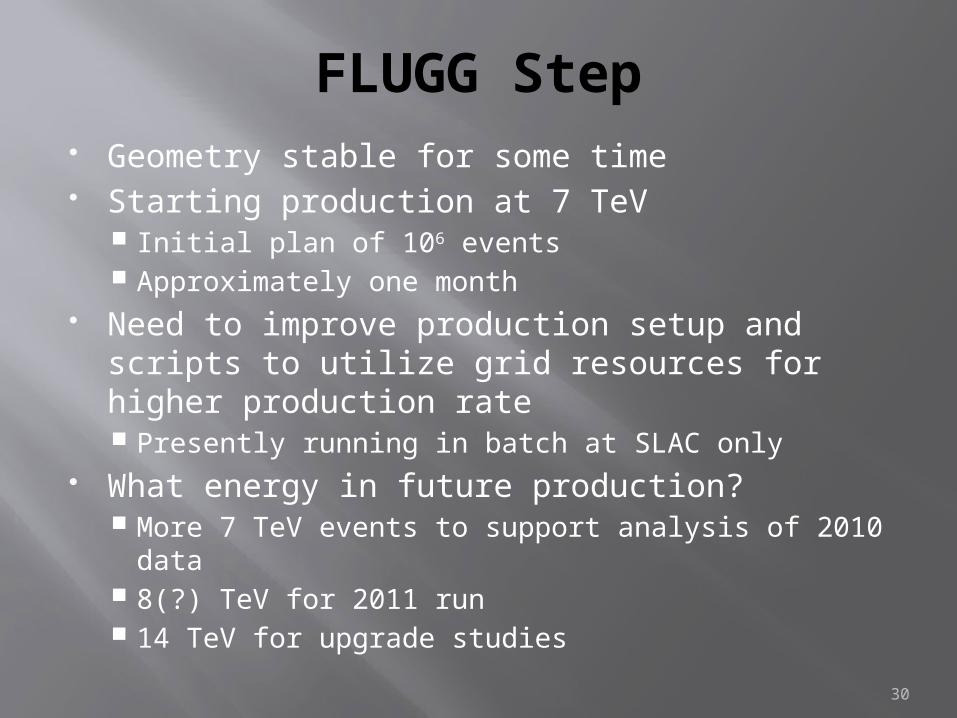
FLUGG Step Geometry stable for some time Starting production at 7 TeV
Initial plan of 106 events Approximately one month
Need to improve production setup and scripts to utilize grid resources for higher production rate Presently running in batch at SLAC only
What energy in future production? More 7 TeV events to support analysis of 2010 data 8(?) TeV for 2011 run 14 TeV for upgrade studies
31
Comparison with Data Started in summer 2010
Identifying “cavern background” in data Bunch structure
See next talk for CSC photon hit rate MDT hit rate in data and simulation RPC HV current vs simulated hit rate MIP rate in MPX
Lots more to be done!
32
Other Items Earlier study found ~2x improvement in
background with Beryllium beam pipe (already Be for |z| < 3.5 m) Confirmed in our study Beam pipe made of vacuum is even better, but
would be an engineering challenge Simulation predicted background coming out
of barrel endcap gap region Improving description with an eye to proposing
changes High background for small wheel
Check simulation geometry some more! Possible shielding improvements for the future

33
Effect of Beam Pipe Material
0.1
1
10
100
fluen
ces
[kH
z/cm
2 ]
Fluences in the muon chamber locations (RBTF fig.3)
VAug10 neutron
VAug10 photon
new neutron
new photon
muon chamber locations
From
htt
p:/
/indic
o.c
ern
.ch/c
onfe
rence
Dis
pla
y.py?
confI
d=
67
28
6
Change
in n
fluence
Change
in
gfluence

34
Gap Region
Information extracted from CATIA by Georgian Team.
35
Upgrade Detector coverage and shielding are
correlated Need to break deadlock to move ahead Iterations
Detector technology not important to estimating incident rate because of use of scoring volumes
Manpower limited