cationic polymerization of glycidyl ethers and furans ... · cationic polymerization of glycidyl...
TRANSCRIPT
Cationic Polymerization of Glycidyl Ethers and Furans: Improved Electron Beam
and UV Cured Epoxy Networks
A Thesis
Submitted to the Faculty
of Drexel University
by
Jihean Lee
in partial fulfillment of the
requirements for the degree
of
Doctor of Philosophy
July 2007

© Copyright 2007
Jihean Lee. All Rights Reserved.

ii
DEDICATIONS
To my family
iii
ACKNOWLEDGEMENTS
This thesis is dedicated to my father (Intae), mother (Ae Young), and brother
(Young) for their love and support. Throughout my life they have encouraged me to
pursuit my goals.
I would like to thank my advisor Dr. Giuseppe Palmese who gave me the
opportunity to participate in a new area of research. His guidance has let me achieve
more than I ever imagined. I would also like to thank Dr. Mun Choi and Dr. Selcuk
Guceri for their guidance thoughout my Ph.D. I would like to express my appreciation to
my committee Dr. Antony Loman, Dr. Yossef Elabd, and Dr. Steven Wrenn, and Janis
Brown for their suggestions for my research. The assistance I received at University of
Dayton Research Institute with Dr. Don Klosterman and Anish Desai allowed me to EB
irradiate my samples. Additionally, I would also like to acknowledge my fellow lab
mates in the Palmese Research Group especially Jason, Vijay, and John. I would like to
express appreciation to Dorothy Porter her administrative help and Dan Luu for his
technical assistance. I would like to thank my friends through these years Josh, Che, Sid,
Wendolene, Mike, Kris, Angela, Julia, Amy, Felix, Pete, Anish, and Andrew.
I am grateful to several sources that provided funding for me during my graduate
research. First, the Airforce R AFOSR under grant F49620-02-1-0360 with Dr. Charles
Lee as program monitor. Support for Drexel University through the Dean’s Fellowship.
Lastly, I received further support from the Koerner family in the form of the Koerner
Family Fellowship and guidance on issues in both my career and life.
iv
TABLE OF CONTENTS
LIST OF TABLES............................................................................................................. xi
LIST OF FIGURES..........................................................................................................xiii
ABSTRACT.....................................................................................................................xix
Chapter 1: INTRODUCTION .......................................................................................1
1.1. Thermal Curing versus Radiation Curing ....................................................1
1.2. Objective ......................................................................................................2
1.3. Methodology................................................................................................2
1.4. Thesis Outline ..............................................................................................4
1.5. References....................................................................................................5
Chapter 2: BACKGROUND .........................................................................................6
2.1. Epoxies.........................................................................................................6
2.2. Curing of Epoxy Resins ...............................................................................8
2.3. Thermal Curing..........................................................................................10
2.4. Radiation Curing........................................................................................12
2.5. UV Curing..................................................................................................13
2.6. Electron beam curing of composites..........................................................15
2.7. References..................................................................................................20
v
Chapter 3: EXPERIMENTAL.....................................................................................22
3.1. Experimental apparatus – In situ real time NIR.........................................22
3.2. Near Infrared Spectroscopy (NIR).............................................................23
3.3. Size exclusion chromatography (SEC)......................................................29
3.4. Dynamic Mechanical Analysis (DMA) .....................................................29
3.5. Fracture Toughness Testing.......................................................................29
3.6. Flexural Testing .........................................................................................30
3.7. Short Beam Shear (SBS) Testing...............................................................30
3.8. Reference ...................................................................................................30
Chapter 4: INFLUENCE OF WATER ON THE KINETICS OF CATIONICALLY
PHOTO-INITIATED POLYMERIZATION OF EPOXY GROUPS VIA
ULTRA-VIOLET AND ELECTRON BEAM IRRADIATION ...............31
4.1. Introduction................................................................................................31
4.2. Experimental ..............................................................................................34
4.2.1. Materials ..................................................................................................34
4.2.2. Fiber Optic Near IR Spectroscopy ..........................................................34
4.2.3. Sample Preparation and Irradiation .........................................................38
4.3. Results and Discussion ..............................................................................39
4.3.1. Measurement of water concentration ......................................................39
4.3.2. Influence of water on PGE cationic polymerization via UV and EB
radiation...................................................................................................42
4.3.3. Influence of water on DGEBA cationic polymerization via UV and EB
radiation...................................................................................................60
vi
4.4. Influence of water on cured DGEBA properties (Tg and fracture
toughness) ..................................................................................................68
4.5. Conclusion .................................................................................................71
4.6. References..................................................................................................72
Chapter 5: DARK AND LIGHT RADIATION CURE KINETICS OF EPOXIES VIA
UV AND EB..............................................................................................74
5.1. Introduction................................................................................................74
5.2. Experimental ..............................................................................................77
5.2.1. Materials ..................................................................................................77
5.2.2. Fiber Optic Near IR Spectroscopy ..........................................................79
5.2.3. Calorimetry..............................................................................................79
5.2.4. Sample Preparation and Irradiation .........................................................80
5.3. Results and discussion ...............................................................................83
5.3.1. Interrupted EB Irradiation .......................................................................84
5.4. Analysis of Dark Reactions .......................................................................93
5.5. Reassessment of Previous Calorimetry Experiments ................................96
5.6. Conclusion ...............................................................................................100
5.7. Reference .................................................................................................102
Chapter 6: PROPERTIES OF TRIGLYCIDYL ETHER OF TRISPHENOL-
METHANE (TACTIX 742).....................................................................103
6.1. Introduction..............................................................................................103
6.2. Materials ..................................................................................................103
6.3. Procedure .................................................................................................105
vii
6.3.1. Preparation of DGEBA and Tactix 742.................................................105
6.4. Results......................................................................................................105
6.4.1. Synthesis and Application of Tactix 742 and DGEBA .........................105
6.5. Conclusion ...............................................................................................108
6.6. Reference .................................................................................................108
Chapter 7: IMPROVED EB CURED DGEBA SYSTEMS BY
COPOLYMERIZATION WITH NOVEL TETRAHYDROFURAN
FUNCTIONAL COMONOMERS ..........................................................109
7.1. Introduction..............................................................................................109
7.2. Experimental ............................................................................................112
7.2.1. Materials ................................................................................................112
7.3. Procedure .................................................................................................114
7.3.1. Preparation of DGEBA and PGE or CHO Systems ..............................114
7.3.2. Preparation of DGEBA and THF Systems............................................114
7.3.3. Preparation of DGEBA and Tetrahydro-2-furoic Acid Systems...........118
7.3.4. Preparation of DGEBA and Coumaran Systems...................................123
7.3.5. Preparation of DGEBA and Phthalan Systems .....................................123
7.3.6. Preparation of Tactix 742 and Tetrahydro-2-furoic Acid Systems .......125
7.3.7. Composites Processing..........................................................................125
7.3.8. Sample Irradiation .................................................................................127
7.4. Results......................................................................................................127
7.4.1. Monofunctional chain extenders ...........................................................128
7.4.1.1. Chain Extension with Phenyl Glycidyl Ethers (PGE) .................128
viii
7.4.1.2. Chain Extension with Cyclohexene Oxide (CHO)......................128
7.4.1.3. Chain Extension with Tetrahydrofuran (THF) ............................131
7.4.2. Difunctional chain extenders.................................................................133
7.4.2.1. Synthesis and Application of Chain Extenders by Esterification of
DGEBA and Tetrahydro-2-furoic acid ........................................133
7.4.2.2. Synthesis and Application of Chain Extenders by Esterification of
DGEBA and Tetrahydro-3-furoic acid ........................................135
7.4.3. Trifunctional chain extenders ................................................................137
7.4.3.1. Synthesis and Application of Chain Extenders by Esterification of
Trifunctional Epoxies (Tactix 742) with Tetrahydro-2-furoic acid
.....................................................................................................137
7.4.3.2. Synthesis and Application of Chain Extenders by Esterification of
Trifunctional Epoxies (Tactix 742) with Tetrahydro-3-furoic acid
.....................................................................................................140
7.4.4. Cyclic chain extenders...........................................................................142
7.4.4.1. Synthesis and Application of Chain Extenders of DGEBA and
Coumaran.....................................................................................142
7.4.4.2. Synthesis and Application of Chain Extenders of Epoxies and
Phthalan........................................................................................145
7.4.5. Composite Properties.............................................................................147
7.5. Conclusions..............................................................................................148
7.6. References................................................................................................149
Chapter 8: CONCLUSIONS......................................................................................151

ix
8.1. Summary ..................................................................................................151
8.2. Water Reactions .......................................................................................151
8.3. Dark Reactions.........................................................................................152
8.4. Co-monomers for Chain Extension .........................................................153
x
LIST OF TABLES
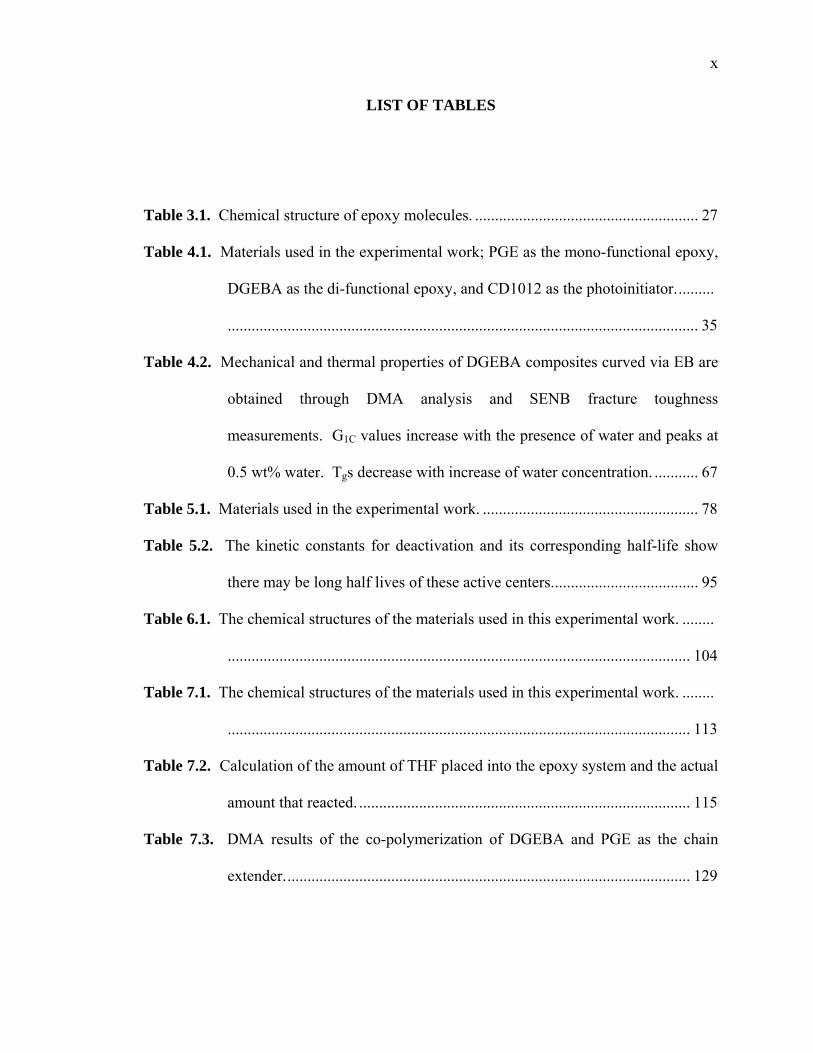
Table 3.1. Chemical structure of epoxy molecules. ........................................................ 27
Table 4.1. Materials used in the experimental work; PGE as the mono-functional epoxy,
DGEBA as the di-functional epoxy, and CD1012 as the photoinitiator..........
...................................................................................................................... 35
Table 4.2. Mechanical and thermal properties of DGEBA composites curved via EB are
obtained through DMA analysis and SENB fracture toughness
measurements. G1C values increase with the presence of water and peaks at
0.5 wt% water. Tgs decrease with increase of water concentration. ........... 67
Table 5.1. Materials used in the experimental work. ...................................................... 78
Table 5.2. The kinetic constants for deactivation and its corresponding half-life show
there may be long half lives of these active centers..................................... 95
Table 6.1. The chemical structures of the materials used in this experimental work. ........
.................................................................................................................... 104
Table 7.1. The chemical structures of the materials used in this experimental work. ........
.................................................................................................................... 113
Table 7.2. Calculation of the amount of THF placed into the epoxy system and the actual
amount that reacted. ................................................................................... 115
Table 7.3. DMA results of the co-polymerization of DGEBA and PGE as the chain
extender...................................................................................................... 129
xi
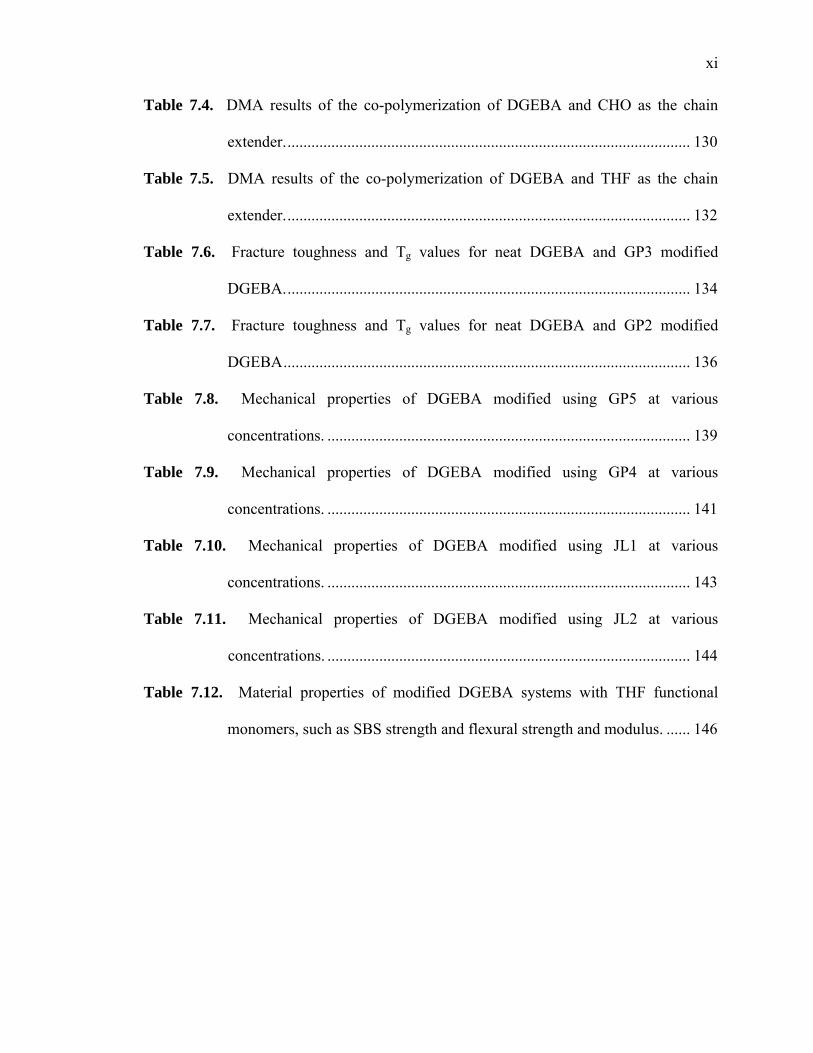
Table 7.4. DMA results of the co-polymerization of DGEBA and CHO as the chain
extender...................................................................................................... 130
Table 7.5. DMA results of the co-polymerization of DGEBA and THF as the chain
extender...................................................................................................... 132
Table 7.6. Fracture toughness and Tg values for neat DGEBA and GP3 modified
DGEBA...................................................................................................... 134
Table 7.7. Fracture toughness and Tg values for neat DGEBA and GP2 modified
DGEBA...................................................................................................... 136
Table 7.8. Mechanical properties of DGEBA modified using GP5 at various
concentrations. ........................................................................................... 139
Table 7.9. Mechanical properties of DGEBA modified using GP4 at various
concentrations. ........................................................................................... 141
Table 7.10. Mechanical properties of DGEBA modified using JL1 at various
concentrations. ........................................................................................... 143
Table 7.11. Mechanical properties of DGEBA modified using JL2 at various
concentrations. ........................................................................................... 144
Table 7.12. Material properties of modified DGEBA systems with THF functional
monomers, such as SBS strength and flexural strength and modulus. ...... 146
xii
LIST OF FIGURES
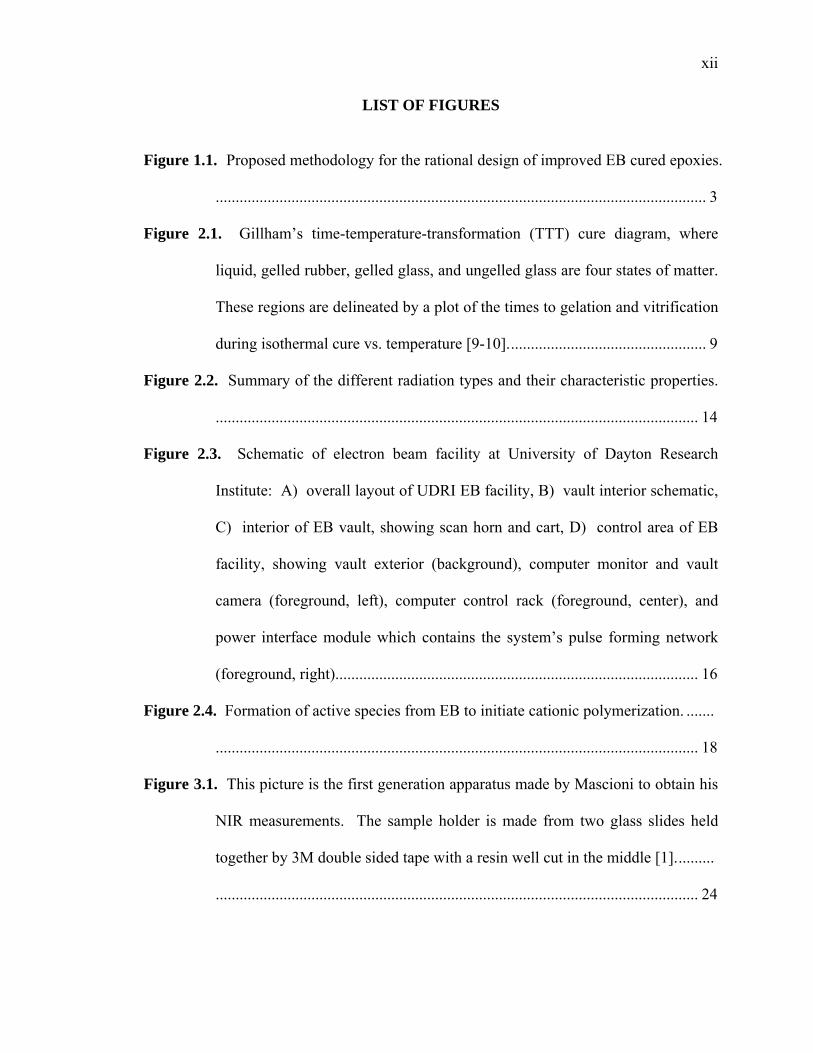
Figure 1.1. Proposed methodology for the rational design of improved EB cured epoxies.
........................................................................................................................... 3
Figure 2.1. Gillham’s time-temperature-transformation (TTT) cure diagram, where
liquid, gelled rubber, gelled glass, and ungelled glass are four states of matter.
These regions are delineated by a plot of the times to gelation and vitrification
during isothermal cure vs. temperature [9-10].................................................. 9
Figure 2.2. Summary of the different radiation types and their characteristic properties.
......................................................................................................................... 14
Figure 2.3. Schematic of electron beam facility at University of Dayton Research
Institute: A) overall layout of UDRI EB facility, B) vault interior schematic,
C) interior of EB vault, showing scan horn and cart, D) control area of EB
facility, showing vault exterior (background), computer monitor and vault
camera (foreground, left), computer control rack (foreground, center), and
power interface module which contains the system’s pulse forming network
(foreground, right)........................................................................................... 16
Figure 2.4. Formation of active species from EB to initiate cationic polymerization. .......
......................................................................................................................... 18
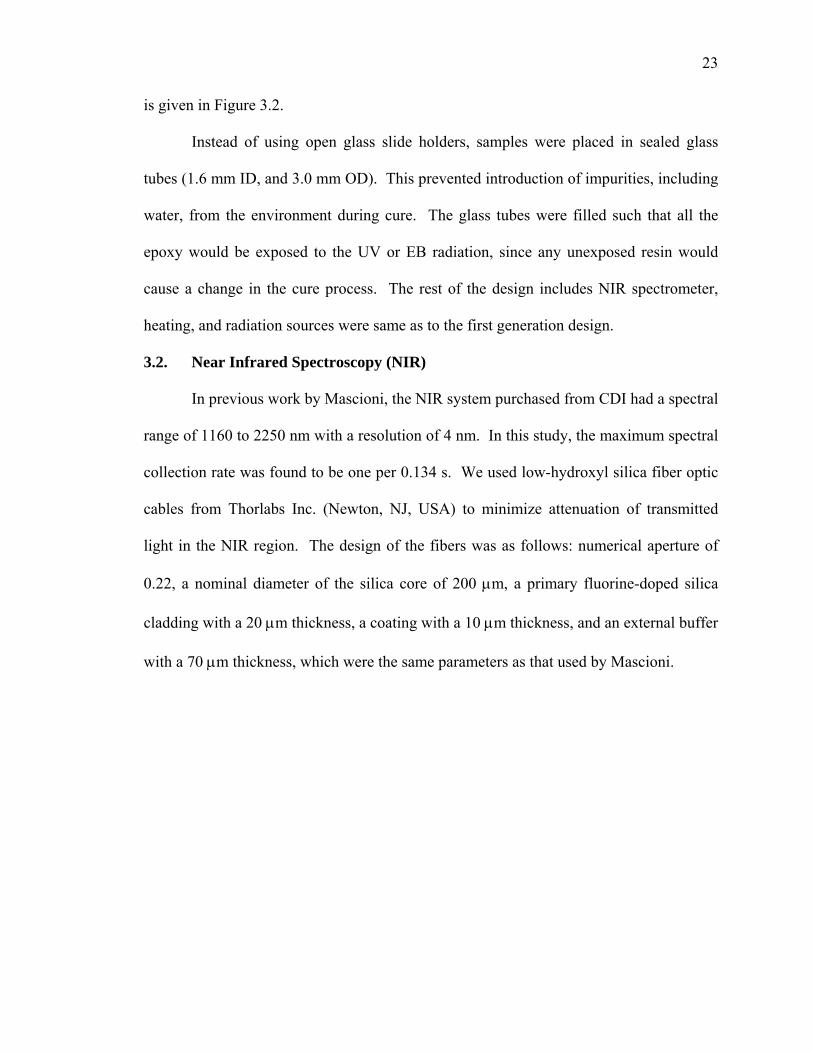
Figure 3.1. This picture is the first generation apparatus made by Mascioni to obtain his
NIR measurements. The sample holder is made from two glass slides held
together by 3M double sided tape with a resin well cut in the middle [1]..........
......................................................................................................................... 24
xiii
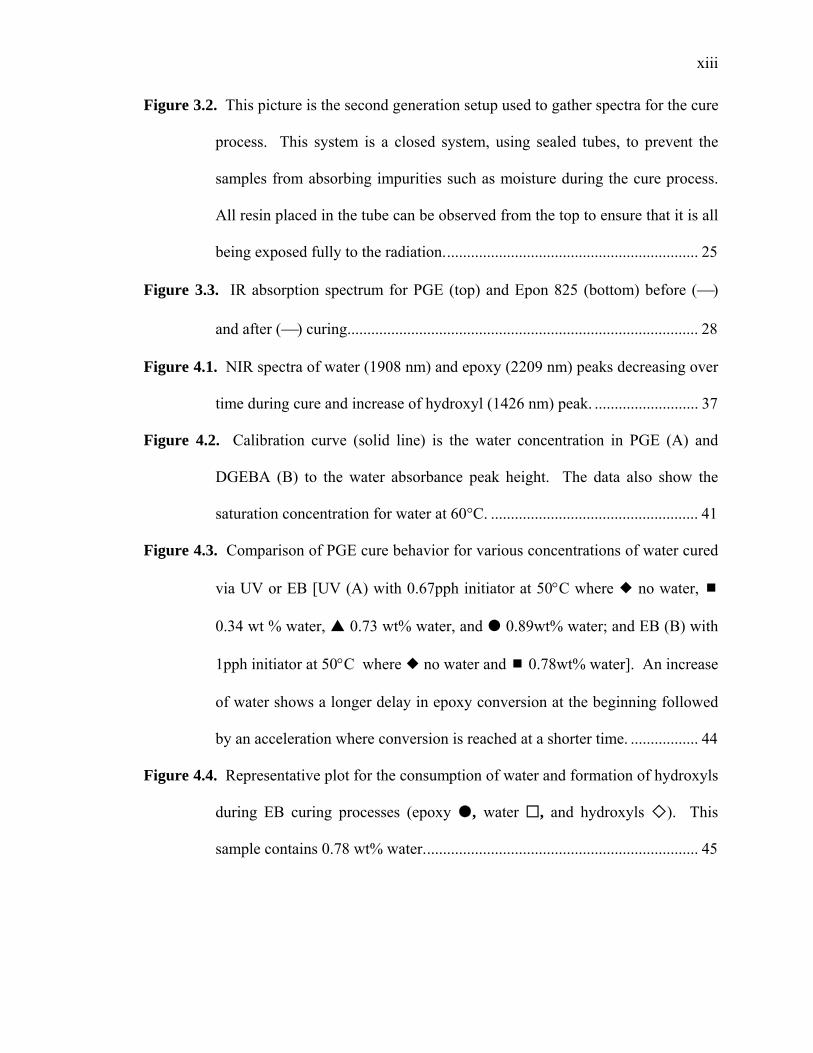
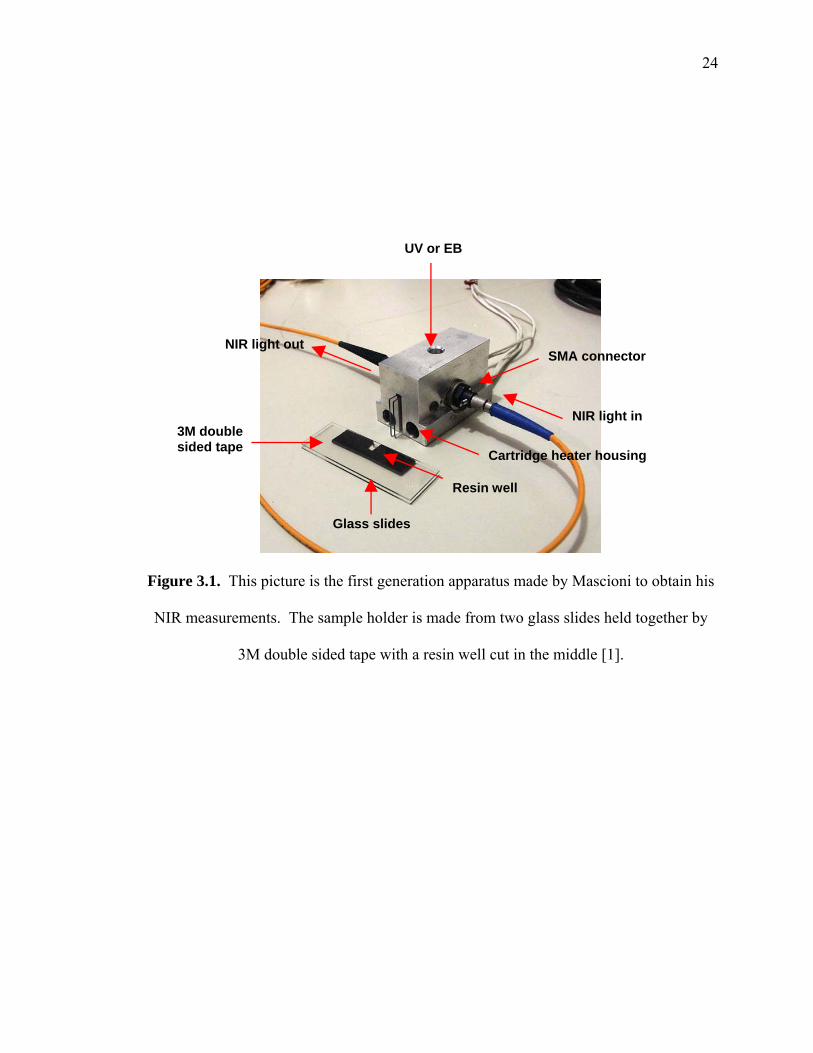
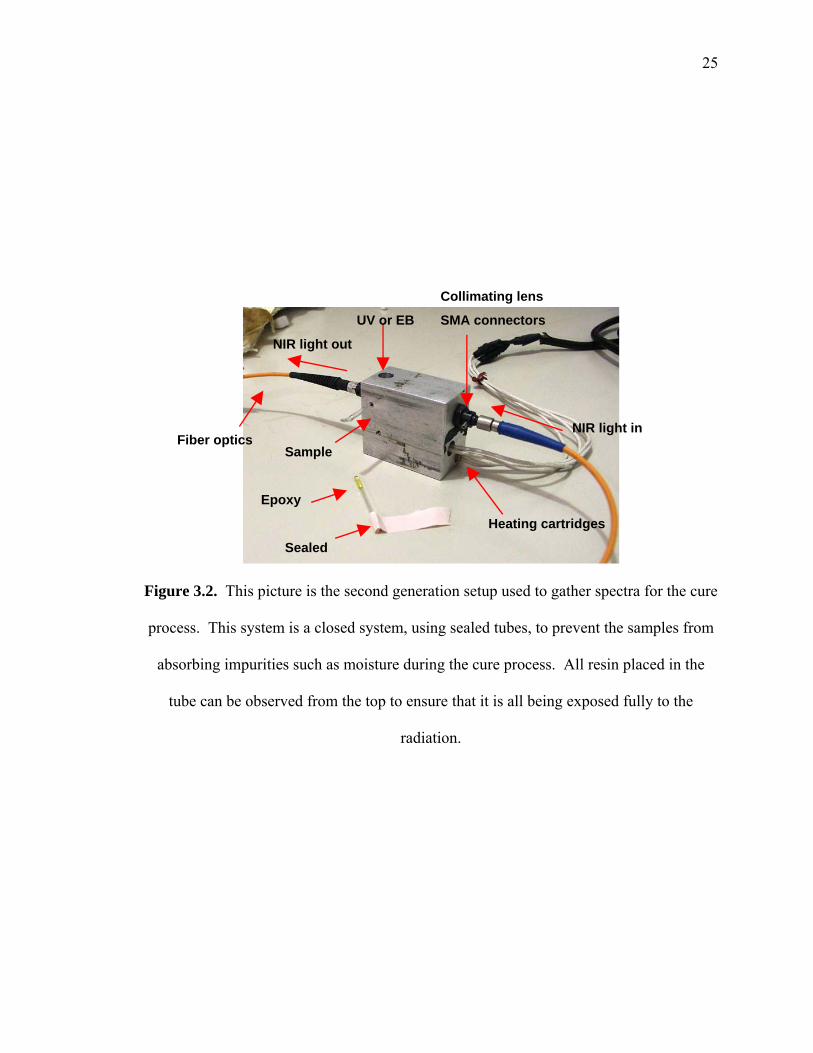
Figure 3.2. This picture is the second generation setup used to gather spectra for the cure
process. This system is a closed system, using sealed tubes, to prevent the
samples from absorbing impurities such as moisture during the cure process.
All resin placed in the tube can be observed from the top to ensure that it is all
being exposed fully to the radiation................................................................ 25
Figure 3.3. IR absorption spectrum for PGE (top) and Epon 825 (bottom) before (⎯)
and after (⎯) curing........................................................................................ 28
Figure 4.1. NIR spectra of water (1908 nm) and epoxy (2209 nm) peaks decreasing over
time during cure and increase of hydroxyl (1426 nm) peak. .......................... 37
Figure 4.2. Calibration curve (solid line) is the water concentration in PGE (A) and
DGEBA (B) to the water absorbance peak height. The data also show the
saturation concentration for water at 60°C. .................................................... 41
Figure 4.3. Comparison of PGE cure behavior for various concentrations of water cured
via UV or EB [UV (A) with 0.67pph initiator at 50°C where no water,
0.34 wt % water, 0.73 wt% water, and 0.89wt% water; and EB (B) with
1pph initiator at 50°C where no water and 0.78wt% water]. An increase
of water shows a longer delay in epoxy conversion at the beginning followed
by an acceleration where conversion is reached at a shorter time. ................. 44
Figure 4.4. Representative plot for the consumption of water and formation of hydroxyls
during EB curing processes (epoxy , water , and hydroxyls ). This
sample contains 0.78 wt% water..................................................................... 45
xiv
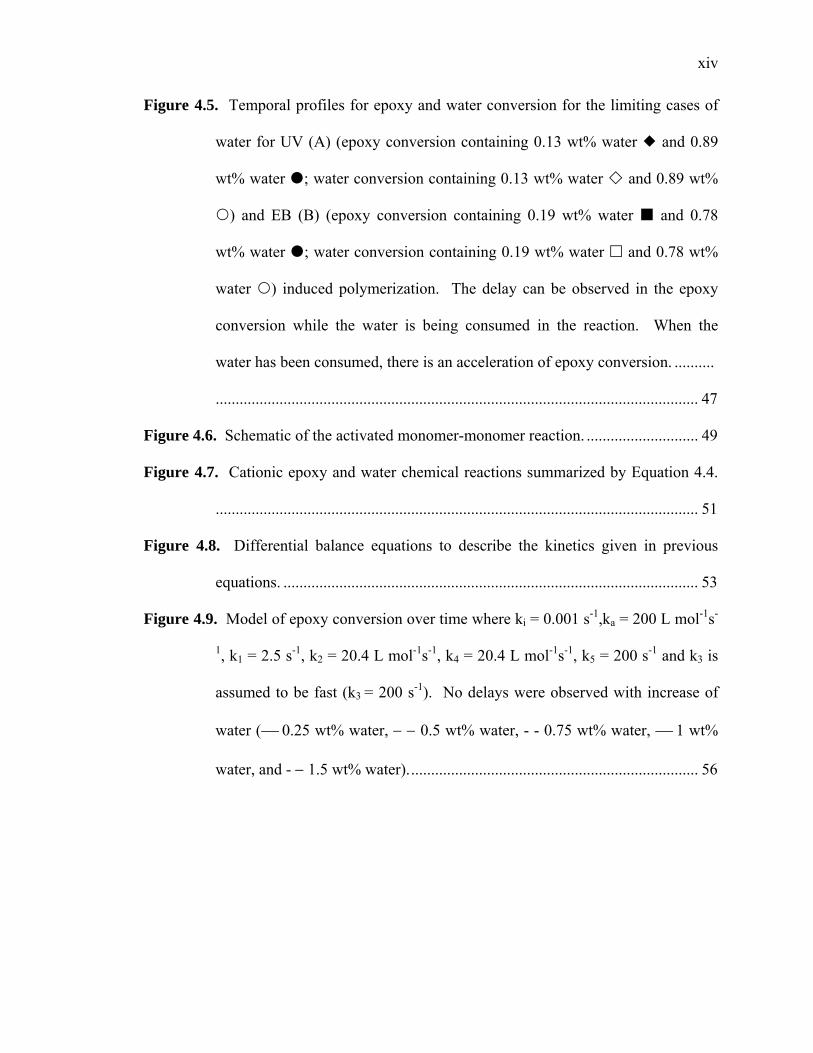
Figure 4.5. Temporal profiles for epoxy and water conversion for the limiting cases of
water for UV (A) (epoxy conversion containing 0.13 wt% water and 0.89
wt% water ; water conversion containing 0.13 wt% water and 0.89 wt%
) and EB (B) (epoxy conversion containing 0.19 wt% water and 0.78
wt% water ; water conversion containing 0.19 wt% water and 0.78 wt%
water ) induced polymerization. The delay can be observed in the epoxy
conversion while the water is being consumed in the reaction. When the
water has been consumed, there is an acceleration of epoxy conversion. ..........
......................................................................................................................... 47
Figure 4.6. Schematic of the activated monomer-monomer reaction. ............................ 49
Figure 4.7. Cationic epoxy and water chemical reactions summarized by Equation 4.4.
......................................................................................................................... 51
Figure 4.8. Differential balance equations to describe the kinetics given in previous
equations. ........................................................................................................ 53
Figure 4.9. Model of epoxy conversion over time where ki = 0.001 s-1,ka = 200 L mol-1s-
1, k1 = 2.5 s-1, k2 = 20.4 L mol-1s-1, k4 = 20.4 L mol-1s-1, k5 = 200 s-1 and k3 is
assumed to be fast (k3 = 200 s-1). No delays were observed with increase of
water (⎯ 0.25 wt% water, − − 0.5 wt% water, - - 0.75 wt% water, ⎯ 1 wt%
water, and - − 1.5 wt% water)......................................................................... 56
xv
Figure 4.10. Model of epoxy conversion over time where ki = 0.001 s-1,ka = 200 L mol-
1s-1, k1 = 2.5 s-1, k2 = 20.4 L mol-1s-1, k4 = 20.4 L mol-1s-1, k5 = 200 s-1 and rate
of reaction of k3 is varied to observe the delays in initial epoxy conversion.
Slower the rate of reaction k3 the more pronounced the delay where water
concentration was held constant 1wt% where ⎯ k3 = 0.1 s-1, ⎯ k3 = 0.5 s-1, −
− k3 = 1 s-1, − − k3 = 5 s-1, - - k3 = 10 s-1. Note that when k3 ≥ 10 s-1 the epoxy
conversion does not increase over time. ......................................................... 57
Figure 4.11. Implementing the rates of reaction into the model to show the epoxy and
water conversion and the formation of hydroxyls, which correspond with the
experimental data. ........................................................................................... 58
Figure 4.12. The model shows the delay of epoxy conversion with increase of water
where ki = 0.001 s-1,ka = 200 L mol-1s-1, k1 = 2.5 s-1, k2 = 20.4 L mol-1s-1, k4 =
20.4 L mol-1s-1, k5 = 200 s-1 and k3 = 1 s-1, where the conversion is reached at
shorter times (⎯ 0 wt% water, - - 0.25 wt% water, - − 0.5 wt% water, ⎯ 1.5
wt% water. ...................................................................................................... 59
Figure 4.13. Comparison of DGEBA cure kinetics with various water concentration (UV
(A) at 0.67pph initiator at 60°C-0.014 wt% water , 0.265 wt% water ,
0.701 wt% water , and 0.947 wt% water; and EB (B) at 1pph initiator at
60°C-0.12 wt% water and 0.86 wt% water ).. ........................................ 62
xvi
Figure 4.14. Temporal profiles for epoxy (closed symbols) and water (open symbols)
conversion for high and low initial water concentration for UV (A) where
epoxy conversion 0.014 wt% water and 0.947 wt% water ; water
conversion 0.014 wt% water and 0.947 wt% water and EB (B) -induced
polymerization where epoxy conversion 0.12 wt% water and 0.86 wt%
water and 0.12 wt% water 0.86 wt% water . Similar delays can be
observed in the DGEBA data as seen in PGE as the epoxy is being consumed.
The final conversion is greater with increase of water concentration. ........... 64
Figure 4.15. Influence of initial water concentration on the final epoxy conversion for
isothermal UV cure at 60°C highlighting the significant effect of water on
polymer structure formed................................................................................ 66
Figure 4.16. Second run DMA (ramped to 250°C twice) testing of EB cured DGEBA
with and without water following post cure where - - storage modulus of 1.0
wt% water, - - storage modulus of DGEBA, ⎯ loss modulus 1.0 wt% water,
⎯ loss modulus of DGEBA. .......................................................................... 69
Figure 4.17. Tg of DGEBA at 1 pph photo-initiator with varying wt% of water in the
system EB with a total dosage of 54 kGy. Increase of water concentration
causes a decrease in the final Tg. .................................................................... 70
Figure 5.1. DMA of DGEBA depicting the influence of step irradiation on material
behavior, where the single peak line (⎯) represents continuous irradiation and
the double peak line (⎯) represents discontinuous irradiation. ..................... 76
Figure 5.2. Schematic of the EB calorimeter (not to scale) [1]. ..................................... 81
xvii
Figure 5.3. PGE with 1pph photo-initiator concentration at 50°C with varying EB
exposure times: 500s EB exposure ( ), 250sEB exposure ( ), 200s EB
exposure ( ), 150s EB exposure ( ), 100s exposure ( ). ............................ 85
Figure 5.4. 500 s experimental data ( ) fitted to the Mascioni model (⎯) for fully cured
continuous irradiated EB materials. ................................................................ 87
Figure 5.5. Deviation from theoretical model, for 200s EB exposure: data ( ),
theoretical model (⎯) accounting for the EB exposure time, and Mascioni
model (⎯) for continuous irradiation. ............................................................ 89
Figure 5.6. Model to fit experimental data using Equations 5.7 and 5.8: 100 s ( ),150 s
( ), 200 s( ), 250 s( ), and 500 s( ) from top to bottom respectively. ........ 92
Figure 5.7. Natural log of the rate of polymerization divided by monomer concentration
versus time used to obtain active center deactivation rate: 250 s ( ), 200 s ( ),
150 s ( ), and 100 s ( ). ................................................................................ 95
Figure 5.8. Measured temperature of the specimen (⎯) and calculated dose ( ) during a
multi-step irradiation [1]. ................................................................................ 97
Figure 5.9. Measured ( ) and predicted (⎯) cure rates during a multi-step irradiation –
single active center assumed (Masconi model) [1]......................................... 98
Figure 5.10. Measured ( ) and predicted (⎯) cure rates during a multi-step irradiation
– dual active center [1].................................................................................... 99
Figure 6.1. Various ratios of Tactix 742 and DGEBA were made and cured via EB and
tested for fracture toughness ( ) and Tg ( ). With increasing amounts of
Tactix 742 fracture toughness decreases, the glass transition temperature
increases........................................................................................................ 106
xviii
Figure 6.2. Various ratios of Tactix 742 and DGEBA were made and cured via EB and
tested for strength ( ), modulus (•). With increasing amounts of Tactix 742
strength decreases, and modulus increases. .................................................. 107
Figure 7.1. Schematic representation of a highly crosslinked network (A) and
homogeneously modified by copolymerization with a chain extender (B). . 110
Figure 7.2. The theoretical % of THF (gray) versus the actual % of THF (black) was
reacted into the epoxy system. ...................................................................... 116
Figure 7.3. GPC of 0wt% to 90 wt% of THF in PGE cured via UV light, where pure
PGE (⎯), 10 wt% THF (- - -), 30 wt% THF (····), 50 wt% THF (·· ─ ─), 70
wt% THF (· · ·), and 90 wt% THF (─ ─). ..................................................... 117
Figure 7.4. Proposed ring opening reaction of DGEBA and THF resulting in the
insertion of a flexible chain........................................................................... 117
Figure 7.5. The chain extender was synthesized using an esterfication reaction of
tetrahydro-2-furoic acid and PGE with AMC-2 catalyst. ............................. 119
Figure 7.6. GPC of 20 wt% THF2PGE in PGE cured via UV light were taken at various
cure times to show the reaction progression where uncured PGE (⎯), cured
PGE (- - -), uncured THF2PGE (− −), 2 min (· · ·), 4 min (·· − −), 6 min (⎯).
....................................................................................................................... 119
Figure 7.7. GPC of 0wt% to 90 wt% of THF2PGE in PGE cured via UV light where
uncured THF2PGE (⎯), cured PGE (⎯), 10 wt% (- ─), 30 wt% (─ ─), 50
wt% (· · ·), 70 wt% (- - -), 90wt % (·· ─ ─)................................................... 120
Figure 7.8. The chain extender was synthesized using an esterification of tetrahydro-2-
furoic acid and DGEBA using AMC-2 catalyst (GP3)................................. 122
xix
Figure 7.9. The chain extender was synthesized using an esterification of tetrahydro-2-
furoic acid and DGEBA using AMC-2 catalyst (GP2)................................. 122
Figure 7.10. Ring opening reaction of DGEBA and Coumaran (JL1). ........................ 124
Figure 7.11. Ring opening reaction of DGEBA and Phthalan (JL2). ........................... 124
Figure 7.12. GPC of 0wt% to 90 wt% of phthalan in PGE cured via UV light where
uncured PGE (⎯), cured PGE (··− −), uncured phthalan (− ─), cured phthalan
(─ ─), 50 wt% phthalan (· · ·), 90wt % phthalan (- -). ................................. 124
Figure 7.13. The chain extender was synthesized using an esterification of tetrahydro-2-
furoic acid and Tactix 742 with AMC-2 catalyst to produce chain extender
(GP5)............................................................................................................. 126
Figure 7.14. The chain extender was synthesized using an esterification of tetrahydro-3-
furoic acid and Tactix 742 with AMC-2 catalyst to produce chain extender
(GP4)............................................................................................................. 126
Figure 7.15. DMA (2nd run) of DGEBA with PGE as a chain extender, where 1 wt%
PGE storage modulus (⎯),1 wt% PGE loss modulus (··− −), 5 wt% PGE
storage modulus (· − · −), and 5 wt% PGE loss modulus (- - -), and 10 wt%
PGE storage modulus (····),10 wt% PGE loss modulus (− ─) are shown. ..........
....................................................................................................................... 129
Figure 7.16. DMA (2nd run) of DGEBA with CHO as a chain extender, where 1 wt%
CHO storage modulus (⎯),1 wt% CHO loss modulus (··− −), 5 wt% CHO
storage modulus (· − · −), and 5 wt% CHO loss modulus (- - -), and 10 wt%
CHO storage modulus (····),10 wt% CHO loss modulus (− ─) are shown. ........
....................................................................................................................... 130
xx
Figure 7.17. DMA (2nd run) of DGEBA with THF as a chain extender, where 1 wt%
THF storage modulus (⎯),1 wt% THF loss modulus (··− −), 5 wt% THF
storage modulus (· − · −), and 5 wt% THF loss modulus (- - -), and 10 wt%
THF storage modulus (····),10 wt% THF loss modulus (− ─) are shown. ..........
....................................................................................................................... 132
Figure 7.18. DMA (2nd run) of DGEBA with GP3 as a chain extender, where 20 wt%
GP3 storage modulus (⎯), 20 wt% GP3 loss modulus (− −), 35% wt % GP3
storage modulus (····), and 35% wt % GP3 loss modulus (− ─) are shown.. 134
Figure 7.19. DMA (2nd run) of DGEBA with GP2 as a chain extender, where 20 wt%
GP2 storage modulus (⎯), 20 wt% GP2 loss modulus (− −), 35% wt % GP2
storage modulus (····), and 35% wt % GP2 loss modulus (− ─) are shown........
....................................................................................................................... 136
Figure 7.20. DMA (2nd run) of DGEBA with GP5 as a chain extender, where 1 wt%
GP5 storage modulus (⎯),1 wt% GP5 loss modulus (··− −), 5 wt% GP5
storage modulus (· − · −), and 5 wt% GP5 loss modulus (- - -), and 10 wt%
GP5 storage modulus (····),10 wt% GP5 loss modulus (− ─) are shown............
....................................................................................................................... 139
Figure 7.21. DMA (2nd run) of DGEBA with GP4 as a chain extender, where 1 wt%
GP4 storage modulus (⎯),1 wt% GP4 loss modulus (··− −), 5 wt% GP4
storage modulus (· − · −), and 5 wt% GP4 loss modulus (- - -), and 10 wt%
GP4 storage modulus (····),10 wt% GP4 loss modulus (− ─) are shown............
....................................................................................................................... 141
xxi
Figure 7.22. DMA (2nd run) of DGEBA with JL1 as a chain extender, where 1 wt% JL1
storage modulus (⎯),1 wt% JL1 loss modulus (··− −), 5 wt% JL1 storage
modulus (· − · −), and 5 wt% JL1 loss modulus (- - -), and 10 wt% JL1 storage
modulus (····),10 wt% JL1 loss modulus (− ─) are shown............................ 143
Figure 7.23. DMA (2nd run) of DGEBA with JL2 as a chain extender, where 1 wt% JL2
storage modulus (⎯),1 wt% JL2 loss modulus (··− −), 5 wt% JL2 storage
modulus (· − · −), and 5 wt% JL2 loss modulus (- - -), and 10 wt% JL2 storage
modulus (····),10 wt% JL2 loss modulus (− ─) are shown............................ 144
Figure 7.24. Improving the fracture toughness while maintaining a high Tg, where neat
DGEBA ( ), water ( ), THF ( ), GP2 ( ), GP3 ( ), GP4 (Δ), GP5 ( ),
JL1 ( ), JL2 ( ), JL3 (x). ............................................................................ 146
xxii
ABSTRACT Cationic Polymerization of Glycidyl Ethers and Furans: Improved Electron Beam and
UV Cured Epoxy Networks
Jihean Lee
Giuseppe R. Palmese, Ph.D.
Curing composites using electron-beam radiation (EB) offers significant
advantages over traditional thermal curing but is limited by poor mechanical
characteristics of the resulting polymers and their composites. Commercially, EB has
advantages over thermal processing, for a number of reasons. Among these are rapid
curing times, reduced energy requirements, curing at lower temperature, reduced
shrinkage and residual stresses, the ability to co-cure dissimilar materials, and long shelf
life as well as reduced volatile organic compounds (VOC) emissions. These
characteristics allow for the manufacture of complex composite structures using low cost
tooling and staged operations. However, composites made from such polymer systems
suffer from low compressive strength, poor interlaminar shear strength, and low fracture
toughness when compared to incumbent thermally cured systems. Thus, while
possessing great processing benefits, EB cured polymers’ poor mechanical performance
prevents them from being adopted.
The objective of this work is to develop a fundamental understanding of the
physical and chemical processes underlying EB and ultra-violet (UV) polymerization of
epoxy systems that will enable the design of improved systems. Specific goals include (i)
xxiii
obtaining a detailed understanding of the influence of process parameters, particularly
water concentration and discontinuous application of EB dose on polymerization
behavior, (ii) developing an understanding of relationships among cure process variables
with network structure/morphology and properties, and (iii) designing new systems with
improved properties based in part on the understanding developed in i and ii.
EB and UV curing processes were monitored in-situ using near infrared (NIR)
fiber optic spectroscopy. Based on such data, a detailed kinetic model was developed
that elucidates the influence of water on EB induced polymerization of glycidyl ethers.
Moreover, the influence of initial water concentration on final polymer behavioral
characteristics were assessed quantifying the potentially deleterious effects of not
controlling humidity during EB processing.
Previous studies of epoxy cure behavior have been conducted under continuous
irradiation. The processing of parts via EB generally occurs in a step-wise fashion. The
transient behavior upon stopping irradiation, “dark reaction,” was examined and revealed
that while pronounced initial reductions in reaction rates occur, active centers responsible
for polymerization persist for many thousands of hours. Therefore for practical purposes
this is a living polymerization. It was found that traditional deactivation models do not
capture the observed behavior suggesting that the combination of diffusion limitations
and chain transfer reactions need to be considered as a possible explanation.
A novel class of comonomers for improving the fracture toughness of EB and UV
cured epoxy systems was discovered and studied. These monomers are based on the
five-member furan ring that was shown to ring open and copolymerize with glycidyl
ethers. By using tetrahydrofuran, a string of four methylene units is inserted in the
xxiv
network providing chain extension and greatly increased fracture toughness.
Multifunctional monomers based on this chemistry were developed that increase the
fracture toughness of the base epoxy resin five fold while maintaining the glass transition
temperature. This is a remarkable achievement because it is an enabling technology that
solves the major deficiency of EB and UV cured epoxies.
1
CHAPTER 1: INTRODUCTION
Polymers can generally be divided into two main families: thermosets and
thermoplastics. Thermoplastics are linear or branched macromolecules that can be made
to flow upon heating. Thermosets are crosslinked polymers possessing a three-
dimensional network structure. This structure is formed by the reaction of
multifunctional monomers generally induced by heating. Thermosetting materials, like
epoxies, are useful because they do not flow or melt upon heating. Yet the crosslink
structure results in brittle systems generally used below their glass transition temperature.
Moreover, processing conditions are known to affect the final properties of thermosets
and the process-structure-property relationship must be well understood for such systems
in order to exploit the high performance characteristics of these systems.
1.1. Thermal Curing versus Radiation Curing
Generally, high performance epoxies require high temperatures during thermal
curing. This results in a product with excellent chemical and heat resistance, high
adhesive strength, low shrinkage, good impact resistance, high strength and hardness, and
high electrical insulation. Most importantly, the kinetics of this process are well known.
Radiation curing by electron beam (EB) offers advantages over thermal curing. These
advantages include greater energy efficiency, shorter curing time, lower energy
requirements, lower temperatures which result in reduced residual stresses, reduced
material shrinkage, the ability to co-cure dissimilar materials, reduced VOC emissions,
and a longer shelf life [1-3]. Despite these benefits the epoxy system materials cured by
radiation have poor mechanical properties. Moreover, the cure processes and their
relation to processing parameters such as temperature, time, dose and dose rate are not
2
understood.
1.2. Objective
The objective of this work is to develop a fundamental understanding of the
physical and chemical processes underlying EB polymerization of epoxy systems that
will enable the design of improved systems. Specific goals include (i) obtaining a
detailed understanding of the influence of process parameters, particularly water
concentration and discontinuous application of dose, on polymerization behavior; (ii)
developing an understanding of relationships among cure process variables and network
structure, morphology, and properties; and (iii) designing new systems with improved
properties based in part on the understanding developed in i and ii.
1.3. Methodology
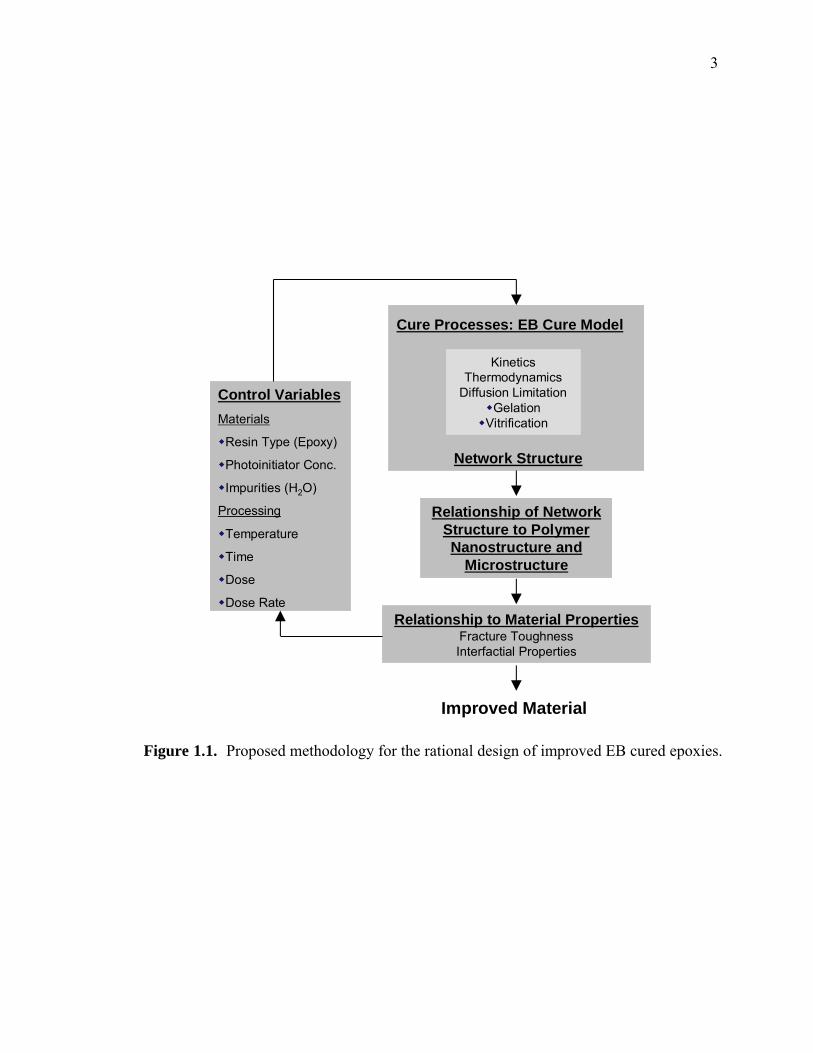
The approach followed for designing improved EB cured epoxies is summarized
schematically in Figure 1.1. This methodology allows a logical progression in
understanding the underlying process of EB curing of epoxies. A number of control
variables must be considered that can influence the properties of the cured epoxy resin.
These include traditional process variables such as time and temperature and ones
specific to EB curing like dose and dose rate. Additionally, material variables such as
photoinitiator concentration, use of co-monomers and the presence of impurities such as
water must be considered. The first step is to investigate how these variables affect the
curing processes. Second, a link between these chemical and physical processes and
network formation needs to be established. Finally, the link is made to mechanical
properties so that a loop is formed that can be used to design improved materials.
3
Control VariablesMaterials
Resin Type (Epoxy)
Photoinitiator Conc.
Impurities (H2O)
Processing
Temperature
Time
Dose
Dose Rate
Cure Processes: EB Cure Model
KineticsThermodynamics
Diffusion LimitationGelation
Vitrification
Network Structure
Relationship of NetworkStructure to PolymerNanostructure and
Microstructure
Relationship to Material PropertiesFracture ToughnessInterfactial Properties
Improved Material
Figure 1.1. Proposed methodology for the rational design of improved EB cured epoxies.
4
1.4. Thesis Outline
Three main topics are discussed in this work. These are listed below in the order in
which they will be presented.
1. An investigation of the influence of water on the polymerization kinetics of glycidyl
ethers induced by UV and EB irradiation.
2. A a study of epoxy cure behavior following periods of UV and EB irradiation (dark
reactions).
3. The design of Improved EB cured diglycidyl ether bisphenol A (DGEBA) systems by
copolymerization with novel tetrahydrofuran functional comonomers.
In Chapter 2 background is discussed regarding the polymerization of epoxy systems.
The importance of understanding thermal curing is discussed in this chapter. There are other
curing techniques that must be considered to show why the method of curing was chosen for
this work. Chapter 3 describes the experimental techniques developed in this study, which
were used to monitor the reactions of interest, material characterization techniques, and the
principal materials used. Chapter 4 reports the results of the investigation into the influence
of water on the polymerization kinetics of glycidyl ethers induced by UV and EB irradiation
This includes the development of a kinetic model as well as a discussion of the influence of
water on the resulting network structure and material properties. In previous work, the In
Chapter 5 the effects of discontinuous irradiation are discussed. In previous studies dark
reactions had not been considered. Chapters 6 and 7 summarize work conducted to tailor
material properties via the incorporation of comonomers. Chapter 6 presents results of
experiments using a trifunctional epoxy to improve Tg without decreasing other properties.
Chapter 7 describes the use of tetrahydrofuran functional monomers as chain extenders to
5
improve fracture toughness. Chapter 8 is a summary of the main achievements of this project.
1.5. References
1. Dake KD. Adhesives Age, 12, 12 (2002).
2. Sands JM, Fink BK, McKnight SH, Newton CH, Gillespie JW, Palmese GR.
Clean Products and Processes, 2, 228-235 (2001).
3. Kulshreshtha A, Vasile C. Handbook of Polymer Blends and Composites, 1,
Chapter 11 (2002).
6
CHAPTER 2: BACKGROUND
2.1. Epoxies
In the early 1900s, Prileschajew, a Russian chemist, discovered that olefins
reacted with peroxybenzoic acid to form epoxides. However, Schlack is known as the
inventor of epoxy resins in 1934. His patent details the preparation of high molecular
weight polyamines by reacting amines with epoxide compounds, produced by the
reaction of epiclorohydrin and bisphenol-A [1]. Epoxy resins were commercialized in
1946 by Ciba Specialty Chemicals. The chemistry of epoxies and the range of
commercially available variations allow cured polymers to be produced with a very broad
range of properties.
Thermosetting epoxy products are used for paints and surface coatings, molded
and reinforced plastics, electronic components, adhesives, spray foams, and dental
cements. As a coating, epoxy is used as a primer to improve adhesion of paints to metal
surfaces and to prevent corrosion. Adhesives that are used for high strength bonding
needed in the construction of airplanes, automobiles, and bicycles are often epoxy based.
These adhesives can be used for wood, metal, glass, stone, and plastic products.
Composites can also be produced with epoxies which produce stronger and more
temperature resistant parts than polyester resins and vinyl ester resins. For example,
circuit boards can be bonded together into a composite by an epoxy resin. Also, fiber
reinforced composites can be produced for parts used in aerospace, automotive, and
recreation industries.
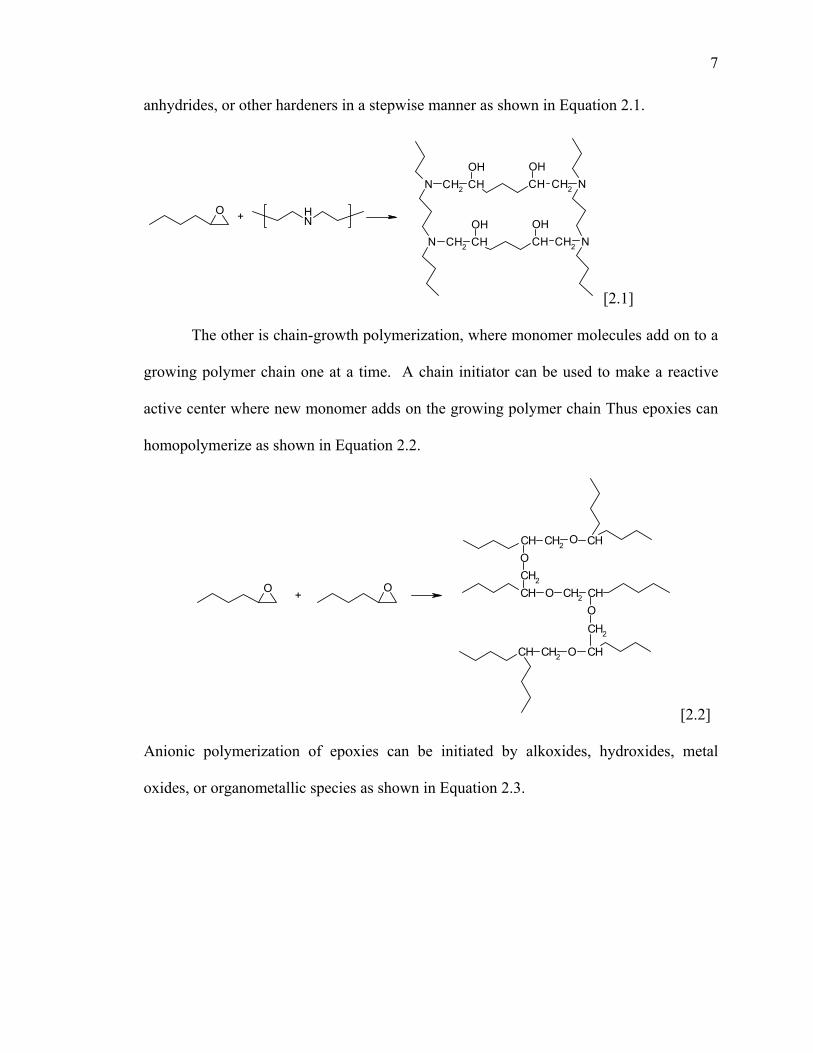
There is a wide range of epoxy formulations. Epoxies can polymerize by two
methods. One is step-growth polymerization, where epoxy reacts with amines,
7
anhydrides, or other hardeners in a stepwise manner as shown in Equation 2.1.
ONH
N CH2 CHOH
CH CH2 NOH
N CH2 CHOH
CHOH
CH2 N
+
[2.1]
The other is chain-growth polymerization, where monomer molecules add on to a
growing polymer chain one at a time. A chain initiator can be used to make a reactive
active center where new monomer adds on the growing polymer chain Thus epoxies can
homopolymerize as shown in Equation 2.2.
O O
CHOCH2
CH O CH2 CH
CH2 O CH
OCH2
CHOCH2CH
+
[2.2]
Anionic polymerization of epoxies can be initiated by alkoxides, hydroxides, metal
oxides, or organometallic species as shown in Equation 2.3.
8
CH2
O
CHR CH2
O
CHR Y
X+
CH2 OCH
R
Y X+
CH2
O
CH2
CH2 CH
R
Y O CH2 CH2 O X
+ X+Y-
+
_
_ _
[2.3]
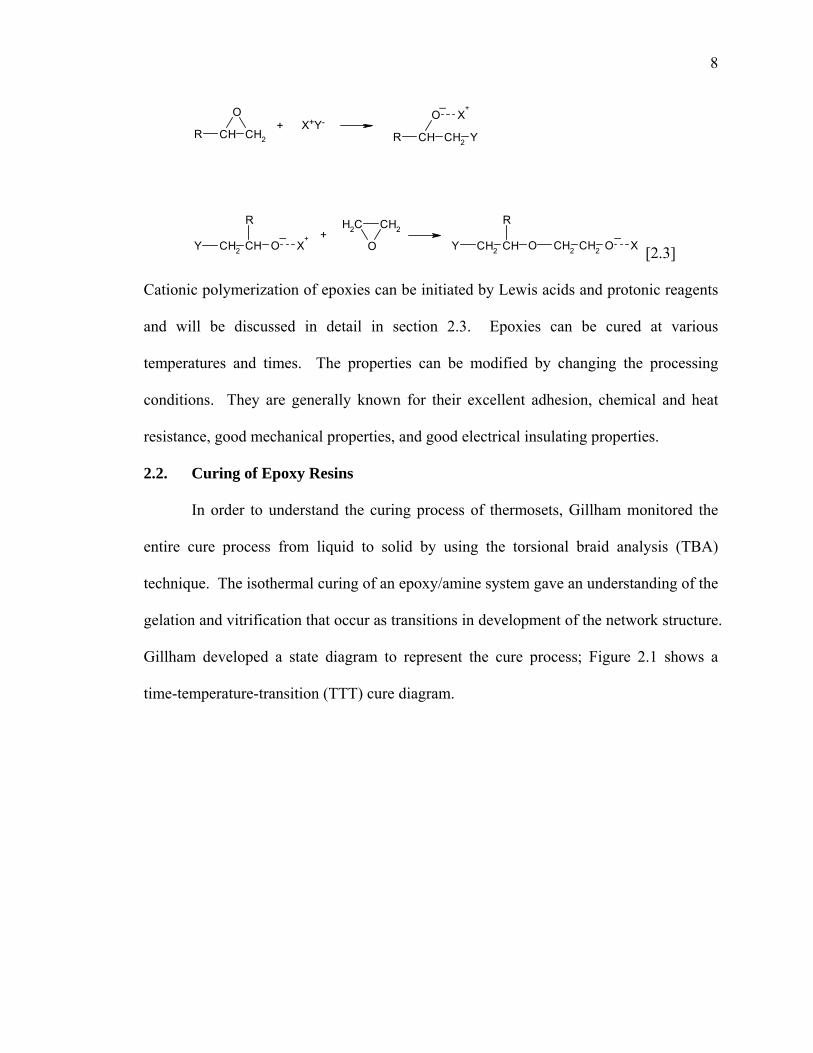
Cationic polymerization of epoxies can be initiated by Lewis acids and protonic reagents
and will be discussed in detail in section 2.3. Epoxies can be cured at various
temperatures and times. The properties can be modified by changing the processing
conditions. They are generally known for their excellent adhesion, chemical and heat
resistance, good mechanical properties, and good electrical insulating properties.
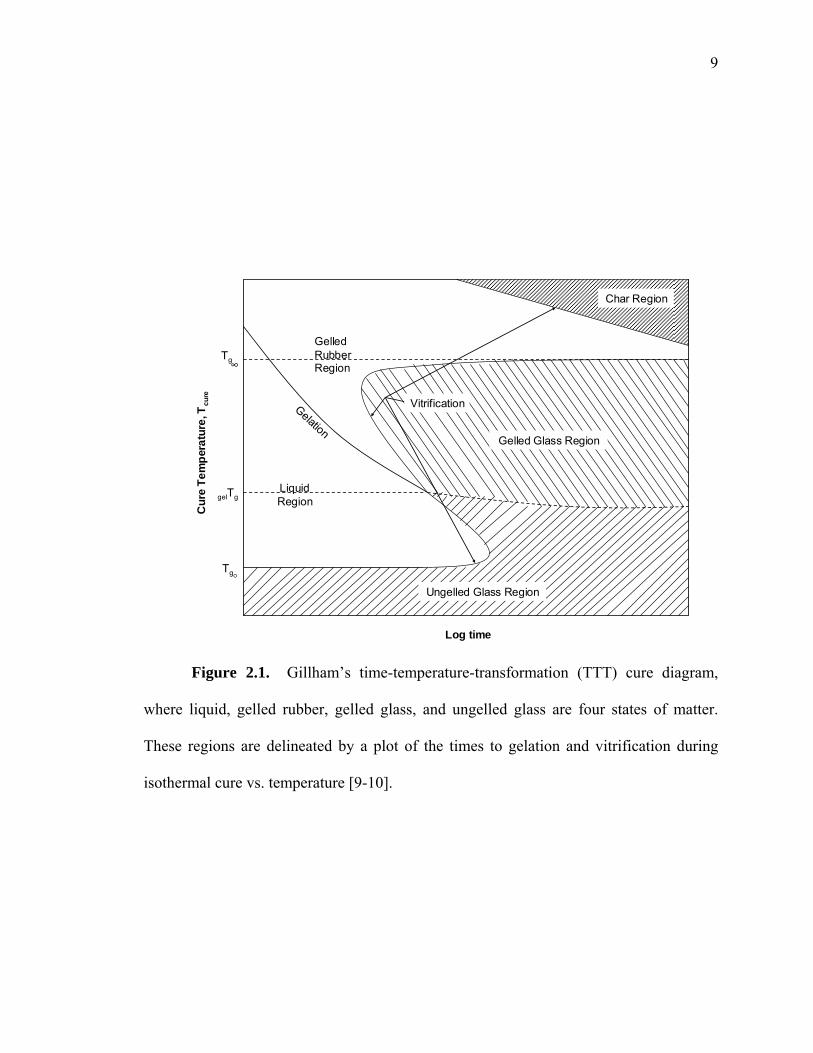
2.2. Curing of Epoxy Resins
In order to understand the curing process of thermosets, Gillham monitored the
entire cure process from liquid to solid by using the torsional braid analysis (TBA)
technique. The isothermal curing of an epoxy/amine system gave an understanding of the
gelation and vitrification that occur as transitions in development of the network structure.
Gillham developed a state diagram to represent the cure process; Figure 2.1 shows a
time-temperature-transition (TTT) cure diagram.
9
Log time
Cur
e Te
mpe
ratu
re, T
cure
Char Region
Tg
gelTg
∞
Tg°
Gelation
LiquidRegion
GelledRubberRegion
Ungelled Glass Region
Gelled Glass Region
Vitrification
Figure 2.1. Gillham’s time-temperature-transformation (TTT) cure diagram,
where liquid, gelled rubber, gelled glass, and ungelled glass are four states of matter.
These regions are delineated by a plot of the times to gelation and vitrification during
isothermal cure vs. temperature [9-10].
10
Gelation is defined as the formation of an infinite molecular network and gives
long range elastic behavior in the macroscopic fluid. Vitrification is defined as
transformation from a liquid or rubbery state to a glassy state as a result of an increase in
molecular weight. When Tg rises to the cure temperature (Tcure), vitrification occurs. The
material is considered glassy when Tcure<Tg, whereas it is liquid or rubbery when Tcure>Tg.
In the vitrified state, the rate of cure is drastically decreased, since diffusion will control
the reaction rather than the intrinsic chemical kinetics. However it is possible to continue
curing by heating the partly cured material above its Tg. During isothermal cure above
the ultimate glass transition temperature (Tg∞) of the polymer, only gelation will occur [9-
10]. Although this diagram was developed for thermally induced step growth epoxy
polymerization, similar phenomena are encountered in cationic chain polymerization of
epoxies. Only cationic polymerization of glycidyl ethers will be considered in this work.
2.3. Thermal Curing
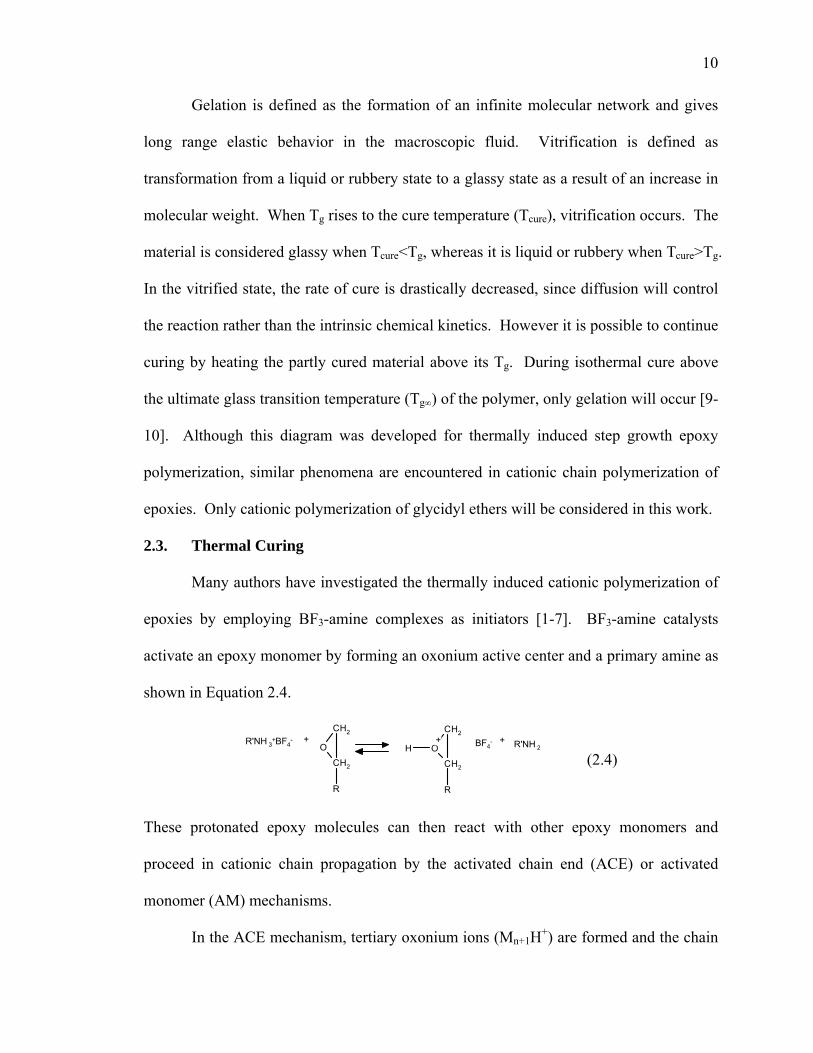
Many authors have investigated the thermally induced cationic polymerization of
epoxies by employing BF3-amine complexes as initiators [1-7]. BF3-amine catalysts
activate an epoxy monomer by forming an oxonium active center and a primary amine as
shown in Equation 2.4.
CH2
O
CH2
R
CH2
O
CH2
R
HR'NH 3
+BF4- + BF4
- + R'NH 2+
(2.4)
These protonated epoxy molecules can then react with other epoxy monomers and
proceed in cationic chain propagation by the activated chain end (ACE) or activated
monomer (AM) mechanisms.
In the ACE mechanism, tertiary oxonium ions (Mn+1H+) are formed and the chain
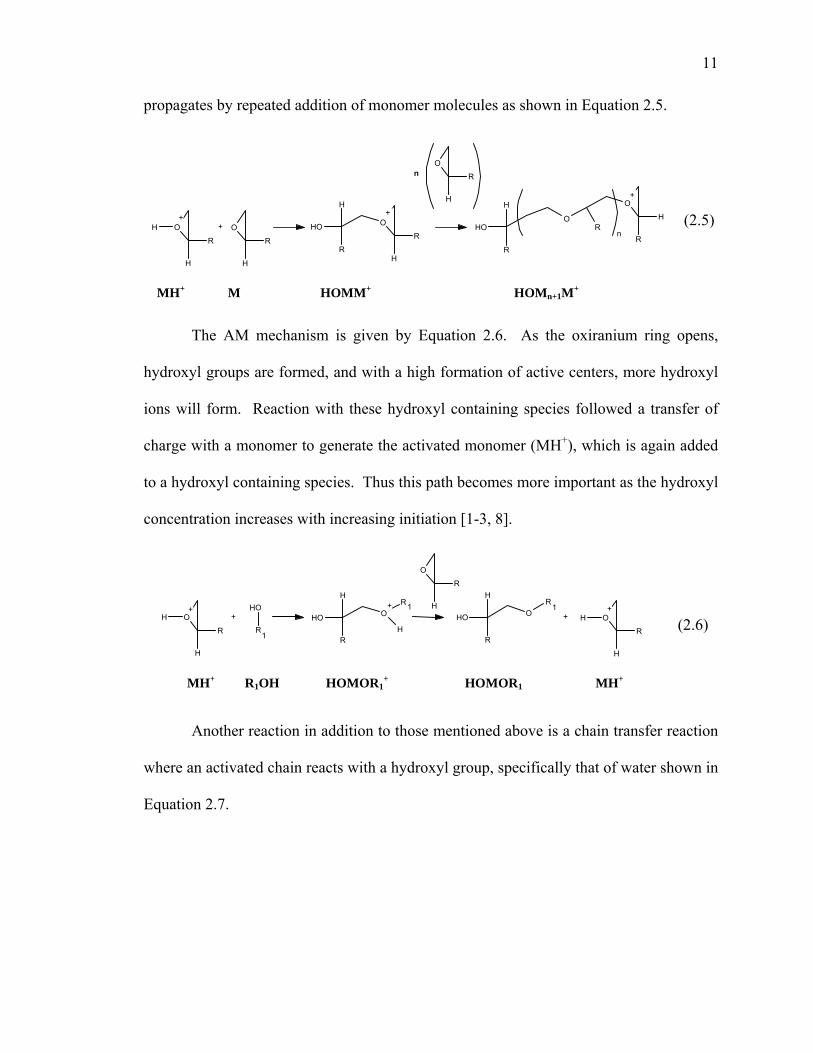
11
propagates by repeated addition of monomer molecules as shown in Equation 2.5.
O
H
H
R
O+
R
OROH
H
R
H
n
O+
H
ROH
H
R
O
H
R
O
H
R
++ +
+
n
(2.5)
The AM mechanism is given by Equation 2.6. As the oxiranium ring opens,
hydroxyl groups are formed, and with a high formation of active centers, more hydroxyl
ions will form. Reaction with these hydroxyl containing species followed a transfer of
charge with a monomer to generate the activated monomer (MH+), which is again added
to a hydroxyl containing species. Thus this path becomes more important as the hydroxyl
concentration increases with increasing initiation [1-3, 8].
O+
H
H
R
OH
R
O+
OH
H
R
R
H
OOH
H
R
R
O+
H
H
R
O
H
R
+
1
1 1+
+ + +
(2.6)
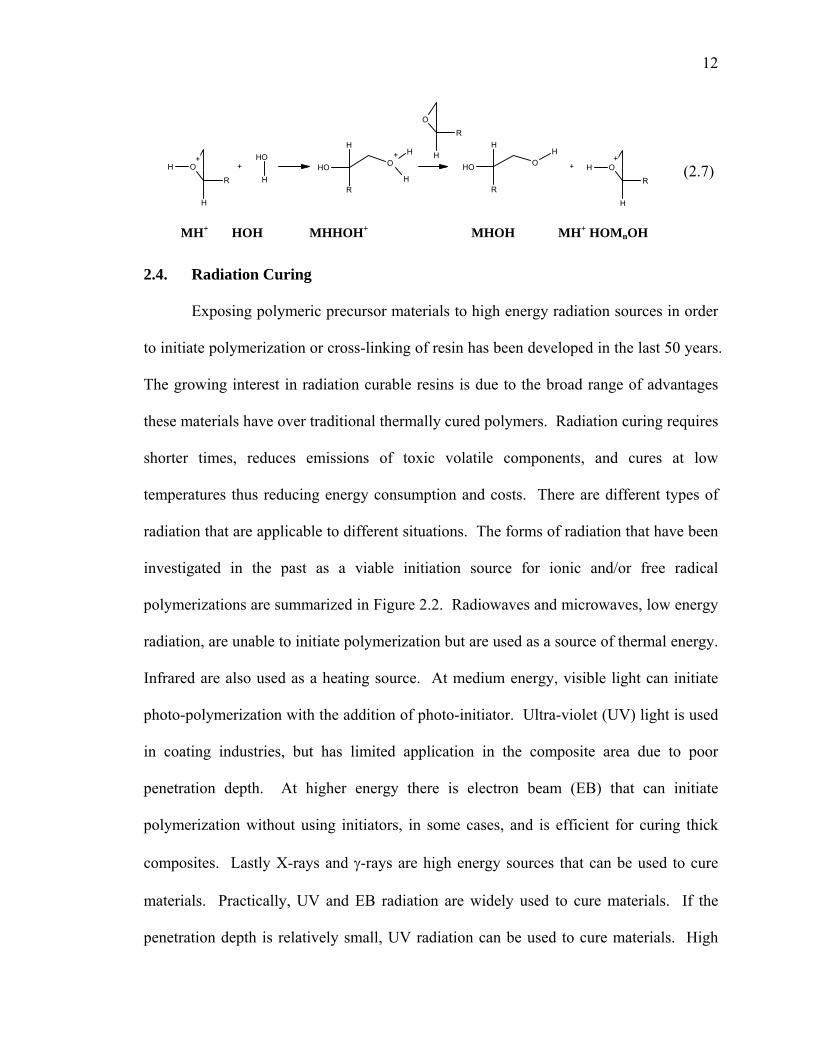
Another reaction in addition to those mentioned above is a chain transfer reaction
where an activated chain reacts with a hydroxyl group, specifically that of water shown in
Equation 2.7.
MH+ M HOMM+ HOMn+1M+
MH+ R1OH HOMOR1+ HOMOR1 MH+
12
O+
H
H
R
OH
H
O+
OH
H
R
H
H
OOH
H
R
H
O+
H
H
R
O
H
R
+ ++ + +
(2.7)
2.4. Radiation Curing
Exposing polymeric precursor materials to high energy radiation sources in order
to initiate polymerization or cross-linking of resin has been developed in the last 50 years.
The growing interest in radiation curable resins is due to the broad range of advantages
these materials have over traditional thermally cured polymers. Radiation curing requires
shorter times, reduces emissions of toxic volatile components, and cures at low
temperatures thus reducing energy consumption and costs. There are different types of
radiation that are applicable to different situations. The forms of radiation that have been
investigated in the past as a viable initiation source for ionic and/or free radical
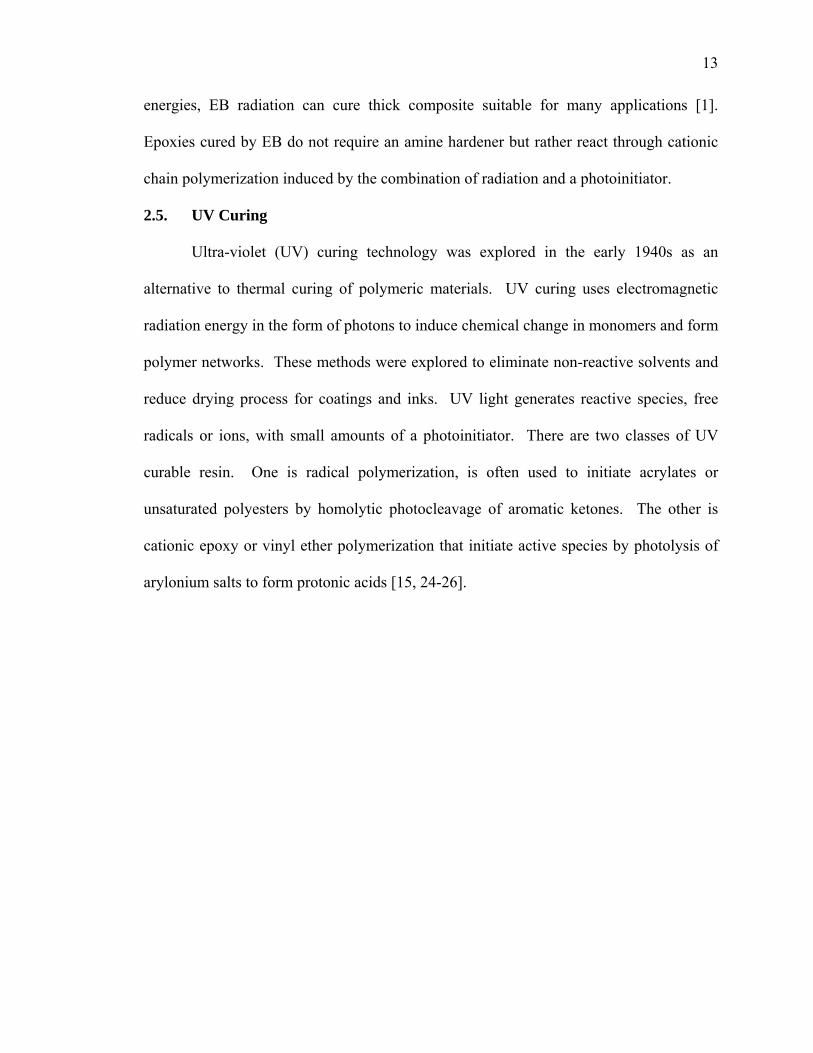
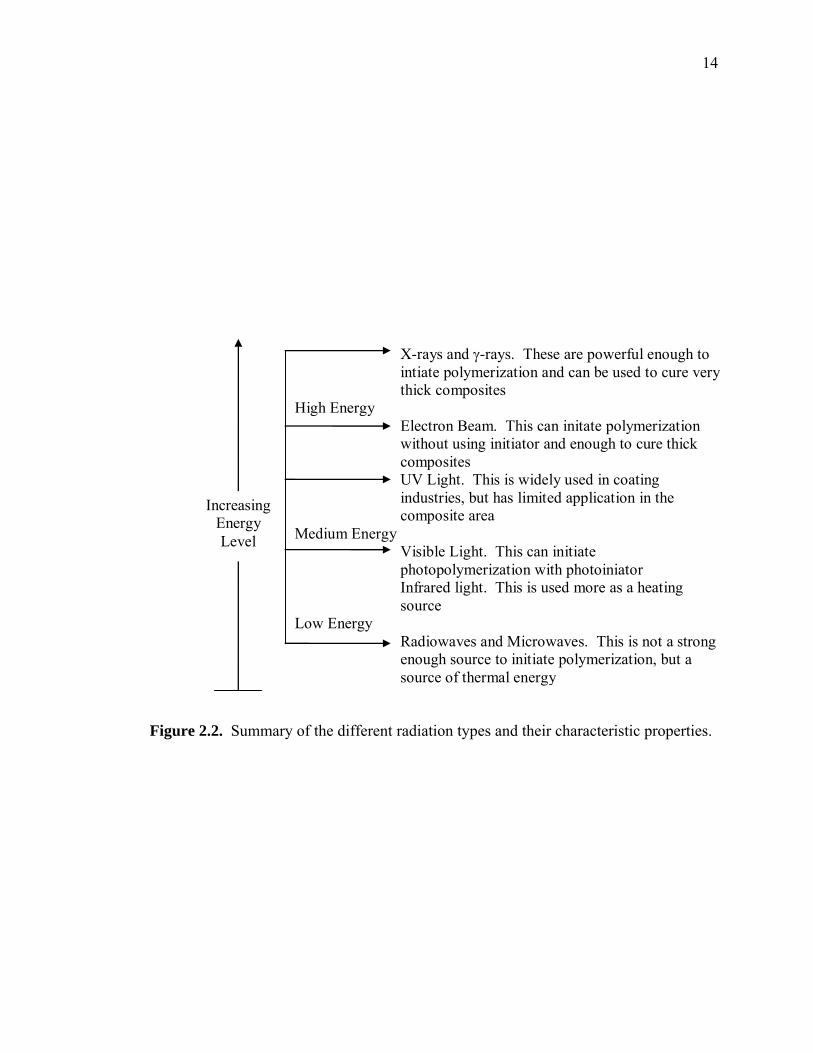
polymerizations are summarized in Figure 2.2. Radiowaves and microwaves, low energy
radiation, are unable to initiate polymerization but are used as a source of thermal energy.
Infrared are also used as a heating source. At medium energy, visible light can initiate
photo-polymerization with the addition of photo-initiator. Ultra-violet (UV) light is used
in coating industries, but has limited application in the composite area due to poor
penetration depth. At higher energy there is electron beam (EB) that can initiate
polymerization without using initiators, in some cases, and is efficient for curing thick
composites. Lastly X-rays and γ-rays are high energy sources that can be used to cure
materials. Practically, UV and EB radiation are widely used to cure materials. If the
penetration depth is relatively small, UV radiation can be used to cure materials. High
MH+ HOH MHHOH+ MHOH MH+ HOMnOH
13
energies, EB radiation can cure thick composite suitable for many applications [1].
Epoxies cured by EB do not require an amine hardener but rather react through cationic
chain polymerization induced by the combination of radiation and a photoinitiator.
2.5. UV Curing
Ultra-violet (UV) curing technology was explored in the early 1940s as an
alternative to thermal curing of polymeric materials. UV curing uses electromagnetic
radiation energy in the form of photons to induce chemical change in monomers and form
polymer networks. These methods were explored to eliminate non-reactive solvents and
reduce drying process for coatings and inks. UV light generates reactive species, free
radicals or ions, with small amounts of a photoinitiator. There are two classes of UV
curable resin. One is radical polymerization, is often used to initiate acrylates or
unsaturated polyesters by homolytic photocleavage of aromatic ketones. The other is
cationic epoxy or vinyl ether polymerization that initiate active species by photolysis of
arylonium salts to form protonic acids [15, 24-26].
14
X-rays and γ-rays. These are powerful enough to intiate polymerization and can be used to cure very thick composites
High Energy Electron Beam. This can initate polymerization without using initiator and enough to cure thick composites UV Light. This is widely used in coating industries, but has limited application in the composite area
Medium Energy Visible Light. This can initiate photopolymerization with photoiniator Infrared light. This is used more as a heating source
Low Energy Radiowaves and Microwaves. This is not a strong enough source to initiate polymerization, but a source of thermal energy
Increasing Energy Level
Figure 2.2. Summary of the different radiation types and their characteristic properties.
15
2.6. Electron beam curing of composites
Electron beams are able to penetrate thicker systems than UV light. A schematic
of the EB facility used in Dayton, Ohio is shown in Figure 2.3. The depth of penetration
of the electron beam is dependent on the beam energy and the density and geometry of
the irradiated material. The higher the electron energy the deeper the penetration will be.
The processing rate or throughput is directly proportional to the power of the accelerator.
EB curing can reduce fabrication and assembly costs and increase design
freedoms. EB process allows large integrated structures to be bonded and cured at low
temperature without the use of autoclaves. Using EB for curing can overcome the
disadvantages of heat curing processes such as limited throughouput, liberation of low
molecular weigh volatiles that cause voids or pollution, and residual stresses upon
cooling. In 1994, a Cooperative Research and Development Agreement (CRADA) was
established for the advancement in electron beam curing of Polymer Matrix Composites
(PMCs) technology. The goal of the CRADA program was to develop and optimize resin
systems and PMCs to meet the performance of thermally cured composites. Over the
years further development of environmentally friendly processes and EB curable cationic
resin systems were developed.
16
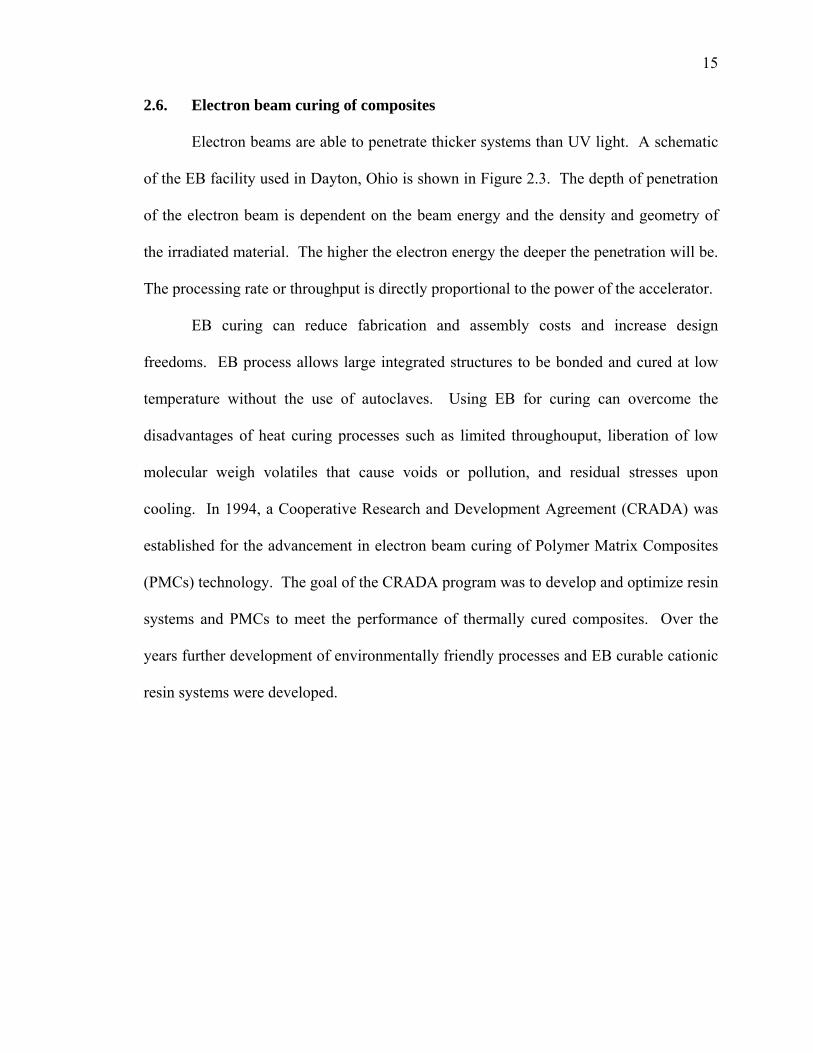
Figure 2.3. Schematic of electron beam facility at University of Dayton Research
Institute: A) overall layout of UDRI EB facility, B) vault interior schematic, C) interior
of EB vault, showing scan horn and cart, D) control area of EB facility, showing vault
exterior (background), computer monitor and vault camera (foreground, left), computer
control rack (foreground, center), and power interface module which contains the
system’s pulse forming network (foreground, right).
A B
C
D
17
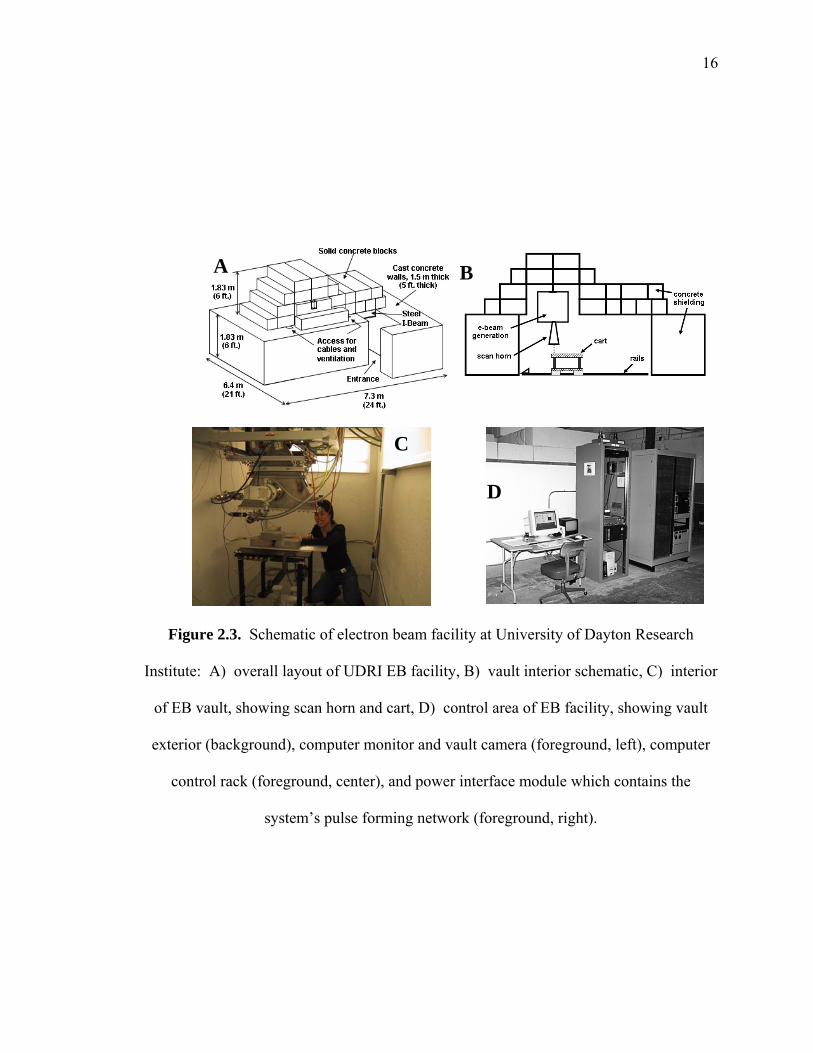
To obtain a fundamental understanding of the cationic polymerization of
radiation-induced cationic cure of epoxies, a basis can be provided by the thermally cured
systems. UV- and EB-induced polymerization should follow the same ACE and AM
mechanism after the active centers are formed. However the initiation of active centers
differs. For UV, Crivello et al. have studied the effect of onium salts that undergo
photolysis where a powerful Bronsted acid is released as a multi-step mechanism shown
in Equation 2.8 corresponds to the steps in Figure 2.4 [21-23].
(2.8)
A super acid is produced from UV photo-initiation, such that the H+ ion reacts
with the epoxy group of the monomer and produces an active species, MH+, similar to the
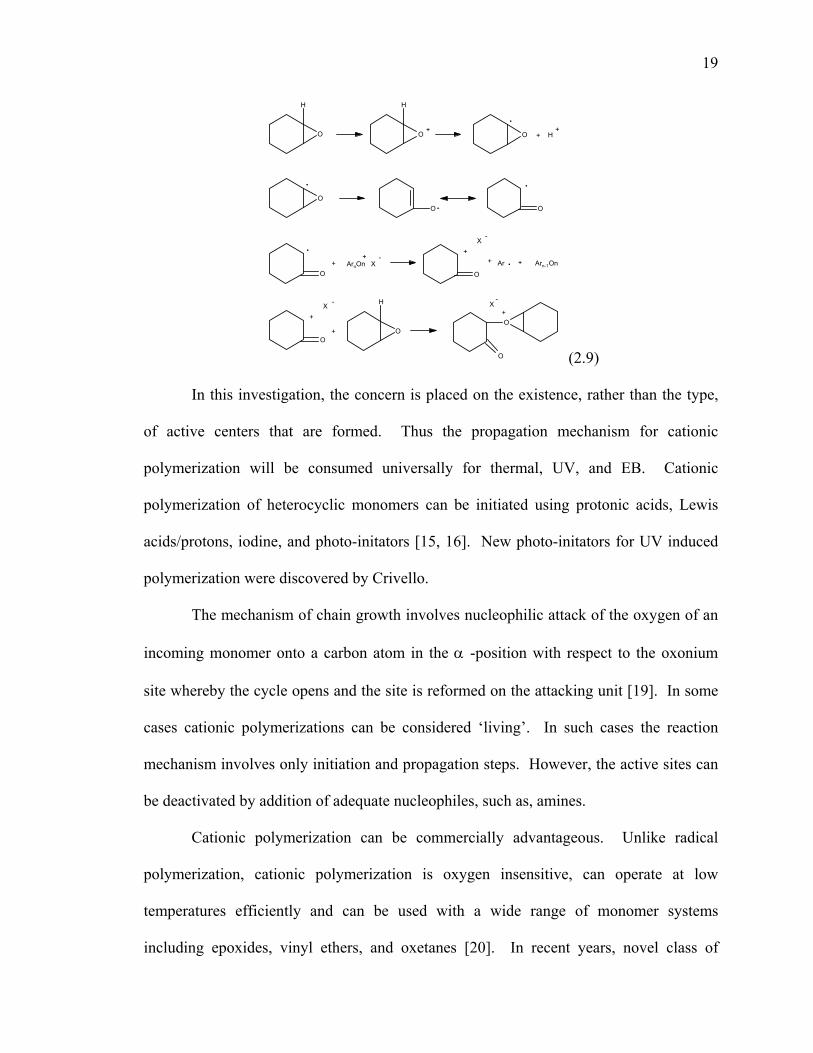
thermal system. With EB, Crivello et al. found through tests on cyclohexene oxide with
photo-initiator that two kinds of cationic species are formed. EB-induced initiation
causes radical species to form from the irradiation that reacts with an epoxy monomer.
This complex then rearranges to form a stable resonance structure of a carbon centered
radical. This can be reduced by the photo-initiator where the cation can directly attack
the epoxy or polymerize with the protonic acid formed if there is a trace amount of water
forming another cationic active center as shown in Equation 2.9 [23].
Ar2I+X- → [Ar2I+X-]* Ar2I+* + Ar* → X- Ar2I+* + SH → ArI+H + S* ArI+H → ArS + H+
hν
18
I+
Sb
F
F
F
F
FF
Sb
F
F
F
F
FF
I+
Sb
F
F
F
F
FF
I+
I+
S HI+
H
I+
H S
hv
*
+ +
+ + S
+ H+
. .
. .
Figure 2.4. Formation of active species from EB to initiate cationic polymerization.
19
O
H
O
H
O
OO O
O O
OO
H
O
O
+.
+ H+
.
.
.
.ArnOn X
+ -+
X-
++ Ar +. Arn-1On
X -
+
+
+X
-
(2.9)
In this investigation, the concern is placed on the existence, rather than the type,
of active centers that are formed. Thus the propagation mechanism for cationic
polymerization will be consumed universally for thermal, UV, and EB. Cationic
polymerization of heterocyclic monomers can be initiated using protonic acids, Lewis
acids/protons, iodine, and photo-initators [15, 16]. New photo-initators for UV induced
polymerization were discovered by Crivello.
The mechanism of chain growth involves nucleophilic attack of the oxygen of an
incoming monomer onto a carbon atom in the α -position with respect to the oxonium
site whereby the cycle opens and the site is reformed on the attacking unit [19]. In some
cases cationic polymerizations can be considered ‘living’. In such cases the reaction
mechanism involves only initiation and propagation steps. However, the active sites can
be deactivated by addition of adequate nucleophiles, such as, amines.
Cationic polymerization can be commercially advantageous. Unlike radical
polymerization, cationic polymerization is oxygen insensitive, can operate at low
temperatures efficiently and can be used with a wide range of monomer systems
including epoxides, vinyl ethers, and oxetanes [20]. In recent years, novel class of
20
epoxide and vinyl ether monomers have been investigated that display outstanding
reactivities. The resulting polymers also possessed excellent adhesion, chemical
resistance and mechanical properties. Cationic photopolymerization is applied practically
in a variety of areas, including photoresists, stereolithography, holography and highly
sensitive cationic coatings and adhesives [21-22].
2.7. References
1. Chabanne P, Tighzert L, Pascault J. J Appl Polym Sci, 53, 769 (1994).
2. Chabanne P, Tighzert L, Pascault J. J Appl Polym Sci, 53, 787 (1994).
3. Chabanne P, Tighzert L, Pascault J, Bonnetot B. J Appl Polym Sci, 53, 685
(1994).
4. Bouillon N, Pascault J, Tighzert L. Macromol Chem, 191, 1403 (1990).
5. Bouillon N, Pascault J, Tighzert L. Makromol Chem, 191, 1417 (1990).
6. Bouillon N, Pascault J, Tighzert L. Makromol Chem, 191, 1435 (1990).
7. Lunak S, Krejcar E. Die Angew Makol Chem, 10, 109 (1970).
8. Palmese GR, Ghosh NN, McKnight SH. SAMPE Int Symp, 45, 1874 (2000).
9. Enns JB, Gillham JK. J Appl Polym Sci, 28, 2567 (1983).
10. Manzione LT, Gillham JK. J Appl Polym Sci, 26, 889 (1981).
11. Crivello JV. Nucl Instr and Meth in Phys Res B, 151, 8-21 (1999).
12. Lecamp L, Lebaudy P, Yourssef B, Bunel C. Polymer, 42, 8541-8547 (2001).
13. Burdick JA, Peterson AJ, Anseth KS. Biomaterials, 22, 1779-1786 (2001).
14. Udagawa A, Yamamoto Y, Inoue Y, Chujo R. Polym J, 23, 1081 (1991).
15. Decker C, Bianchi C, Decker D, Morel F. Prog in Org Coatings, 42, 253-266
(2001).
21
16. Schrof W, Beck E, Koniger R, Reich W, Schwalm R. Prog of Org Coatings, 35,
197-204 (1999).
17. Palmese GR, Ghosh NN, McKnight SH. SAMPE Int Symp, 45,1874 (2000).
18. Hallpap P, Stadermann D, Bolke M, Heublein G. Acta Polym, 39, 350 (1988).
19. Hallpap P, Stadermann D, Bolke M, Heublein G. Acta Poly, 39, 211 (1988).
20. Crivello JV, Lam J. J Polym Sci: Polym Chem, 17, 977-999 (1979)
21. Crivello JV, Lockhart TP, Lee JL. J Polym Sci: Polym Chem, 21, 97-109 (1983).
22. Odian G. Principles of Polymerization, (1991).
23. Lazauskaite R, Grazulevicius JV. Poly for Adv Tech, 16, 571 (2005).
24. Decker C. J Polym Sci: Polym Chem, 30, 913 (1992).
25. Decker C. Prog in Polym Sci, 21, 593 (1996).
26. Decker C. Pigment and Resin Tech, 30, 278 (2001).
22
CHAPTER 3: EXPERIMENTAL
This chapter describes the basic experimental setup used in our kinetic studies as
well as other testing methods employed throughout this investigation. Section 3.1
describes the development of the apparatus design for intrinsic NIR monitoring. Section
3.2 describes real time infrared spectroscopy (RT-NIR) and how it is used to analyze the
kinetics of chemical reactions. Sections 3.3, 3.4, 3.5, 3.6 describe methods for dynamic
mechanical analysis (DMA), fracture toughness testing, flexural testing, and short beam
shear testing respectively.
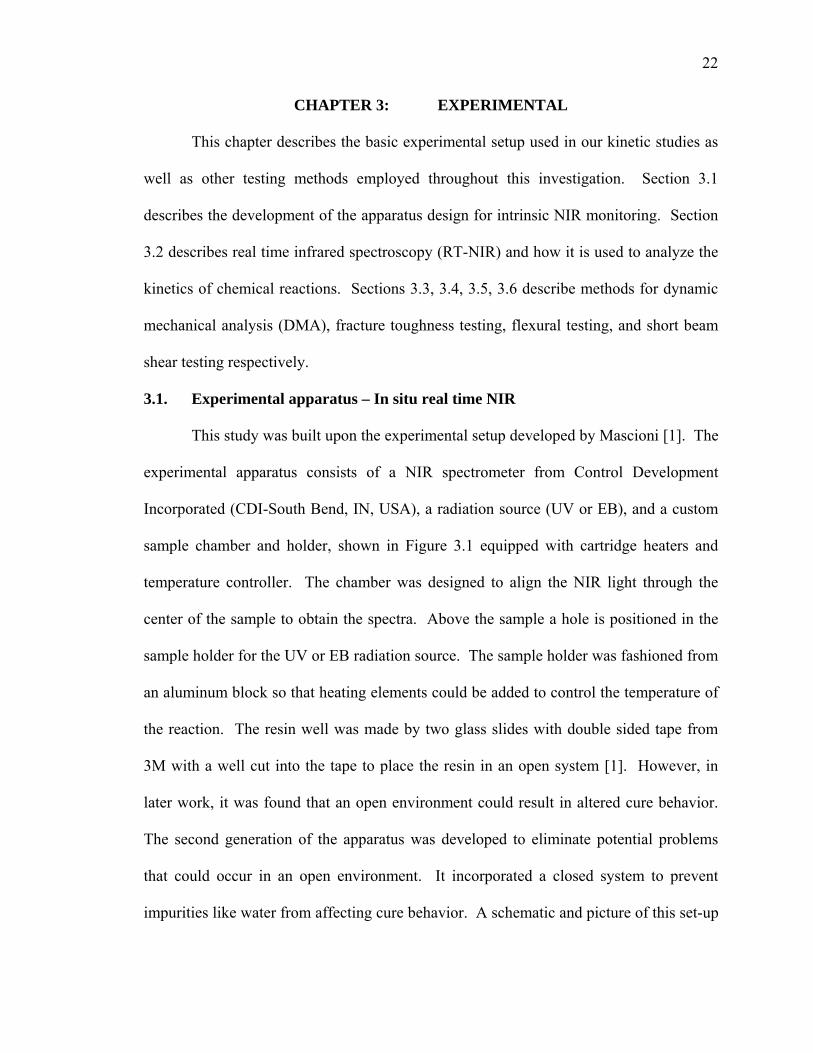
3.1. Experimental apparatus – In situ real time NIR
This study was built upon the experimental setup developed by Mascioni [1]. The
experimental apparatus consists of a NIR spectrometer from Control Development
Incorporated (CDI-South Bend, IN, USA), a radiation source (UV or EB), and a custom
sample chamber and holder, shown in Figure 3.1 equipped with cartridge heaters and
temperature controller. The chamber was designed to align the NIR light through the
center of the sample to obtain the spectra. Above the sample a hole is positioned in the
sample holder for the UV or EB radiation source. The sample holder was fashioned from
an aluminum block so that heating elements could be added to control the temperature of
the reaction. The resin well was made by two glass slides with double sided tape from
3M with a well cut into the tape to place the resin in an open system [1]. However, in
later work, it was found that an open environment could result in altered cure behavior.
The second generation of the apparatus was developed to eliminate potential problems
that could occur in an open environment. It incorporated a closed system to prevent
impurities like water from affecting cure behavior. A schematic and picture of this set-up
23
is given in Figure 3.2.
Instead of using open glass slide holders, samples were placed in sealed glass
tubes (1.6 mm ID, and 3.0 mm OD). This prevented introduction of impurities, including
water, from the environment during cure. The glass tubes were filled such that all the
epoxy would be exposed to the UV or EB radiation, since any unexposed resin would
cause a change in the cure process. The rest of the design includes NIR spectrometer,
heating, and radiation sources were same as to the first generation design.
3.2. Near Infrared Spectroscopy (NIR)
In previous work by Mascioni, the NIR system purchased from CDI had a spectral
range of 1160 to 2250 nm with a resolution of 4 nm. In this study, the maximum spectral
collection rate was found to be one per 0.134 s. We used low-hydroxyl silica fiber optic
cables from Thorlabs Inc. (Newton, NJ, USA) to minimize attenuation of transmitted
light in the NIR region. The design of the fibers was as follows: numerical aperture of
0.22, a nominal diameter of the silica core of 200 μm, a primary fluorine-doped silica
cladding with a 20 μm thickness, a coating with a 10 μm thickness, and an external buffer
with a 70 μm thickness, which were the same parameters as that used by Mascioni.
24
Figure 3.1. This picture is the first generation apparatus made by Mascioni to obtain his
NIR measurements. The sample holder is made from two glass slides held together by
3M double sided tape with a resin well cut in the middle [1].
UV or EB
NIR light in
NIR light out
3M double sided tape Cartridge heater housing
Resin well
Glass slides
SMA connector
25
Figure 3.2. This picture is the second generation setup used to gather spectra for the cure
process. This system is a closed system, using sealed tubes, to prevent the samples from
absorbing impurities such as moisture during the cure process. All resin placed in the
tube can be observed from the top to ensure that it is all being exposed fully to the
radiation.
Sealed
Epoxy
UV or EB
NIR light in
NIR light out
Collimating lens
SMA connectors
Sample Fiber optics
Heating cartridges
26
The light used in the fiber optic cables was produced by a white light source transmitted
through an optical link that collimated the light that passed through the sample, which
was then collected by a focusing lens that passes the light to the spectrometer [1]. When
using the system with EB, the entire sample holder except for the radiation hole on top
and fiber optics were then covered with lead bricks to protect the system from the harsh
radiation. Only the radiation hole on top of the aluminum sample holder was exposed.
This design allowed the collection of spectra in harsh conditions without exposing the
fiber optics to high EB radiation doses, which discolor the optics over time and
eventually distort the spectra. The CDI system was used to gather NIR absorption
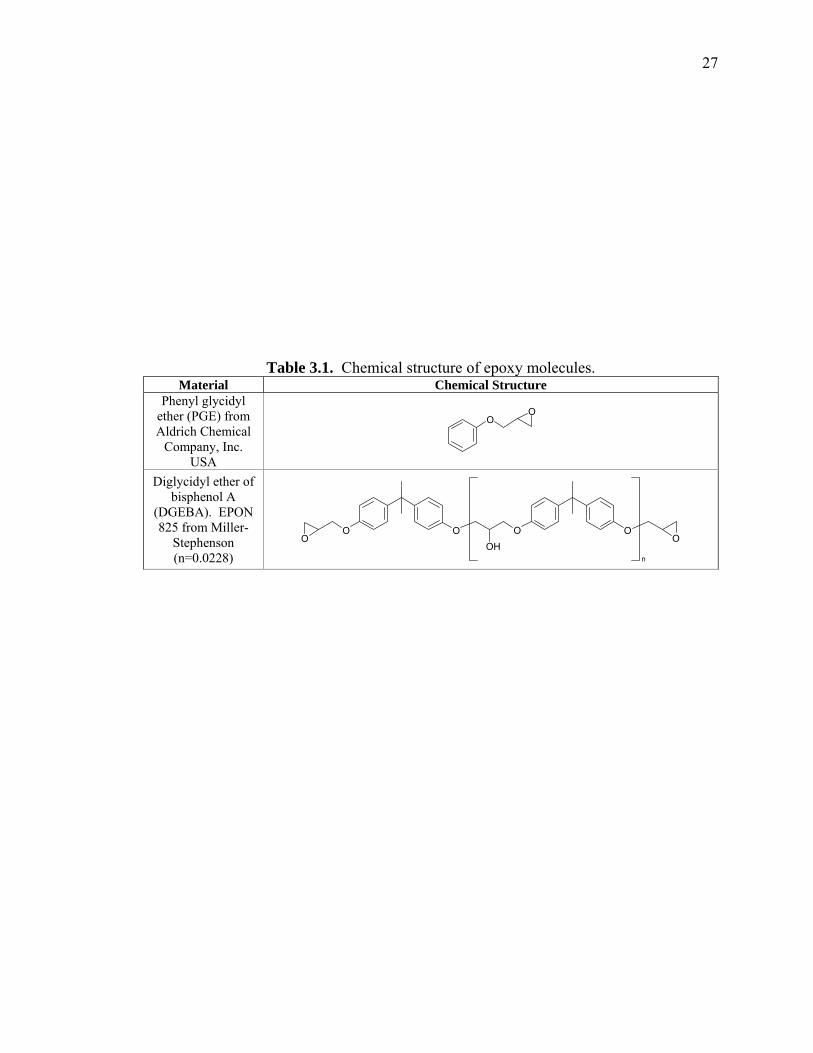
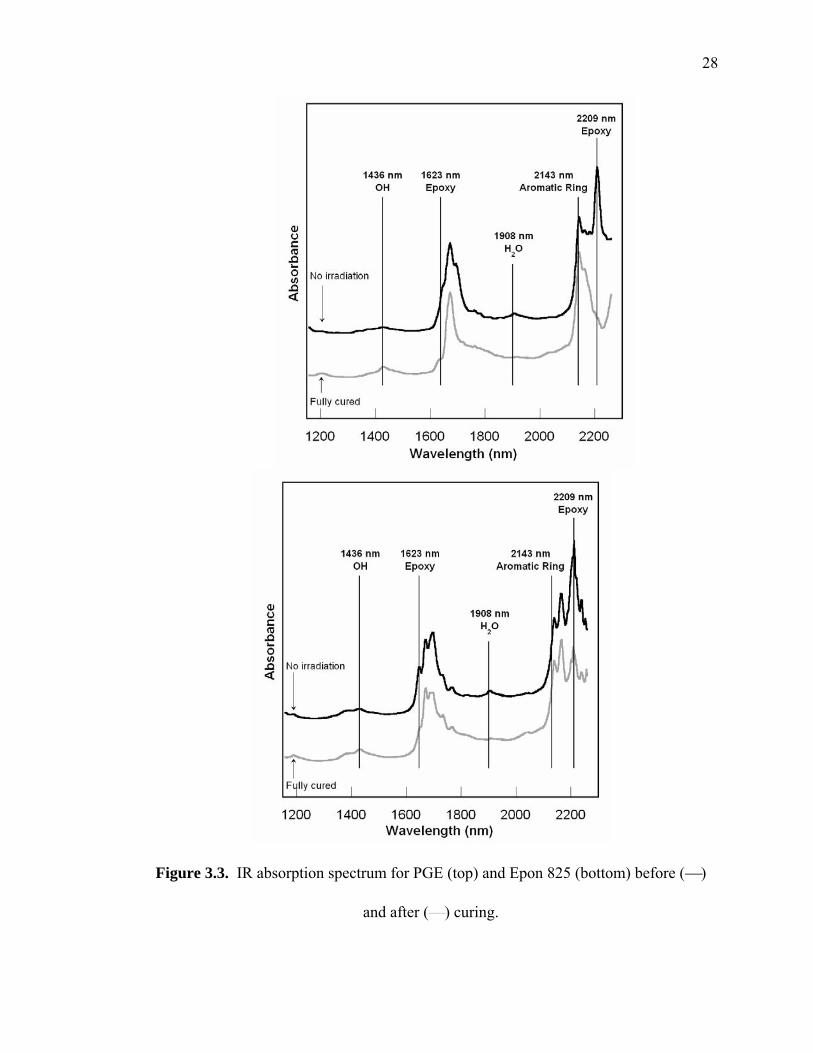
spectra. The structure and the characteristic spectra of “dry” phenyl glycidyl ether (PGE)
and diglycidyl ether bisphenol A (DGEBA) before and after cure are shown in Table 3.1
and Figure 3.3 respectively. The major peaks monitored included 1623 and 2209 nm for
the epoxy ring, 2143 nm for the aromatic ring, for water at 1908 nm, and 1436 nm for
−OH.
27
Table 3.1. Chemical structure of epoxy molecules. Material Chemical Structure
Phenyl glycidyl ether (PGE) from Aldrich Chemical
Company, Inc. USA
OO
Diglycidyl ether of bisphenol A
(DGEBA). EPON 825 from Miller-
Stephenson (n=0.0228)
OOO O
OHO O
n
28
Figure 3.3. IR absorption spectrum for PGE (top) and Epon 825 (bottom) before (⎯)
and after (⎯) curing.
29
3.3. Size exclusion chromatography (SEC)
Size exclusion chromatography (SEC) was run on the linear polymers PGE and
new synthesized comonomers. Molecules in solution must be linear, branched, or
globular so crosslinked systems cannot be tested with this method. A Waters 515 GPC
pump was used with two 30 cm long, 7.5 mm diameter, and 5.0 μm styrene-divinyl
benzene columns in series. The columns were equilibrated and run at 30°C using
tetrahydrofuran (THF) (Aldrich, Milwaukee, WI) as the elution solvent at a flow rate of
1.0 mL/min. The column effluent was monitored by two detectors operating at 30°C a
Waters 2410 refractive index detector and a Waters 2487 dual absorbance detector
operating at 270 and 254 nm (absorbed by phenyl rings). Samples were prepared by
dissolving a 1 mg sample of the material in 1 mL of THF. Since species of high
molecular weight do not diffuse as easily into the packing, they elute first, while species
of lower molecular weight elute later [3].
3.4. Dynamic Mechanical Analysis (DMA)
A TA Instruments DMA 2980 dynamic mechanical analysis (DMA) was used to
evaluate the loss and storage moduli as a function of temperature from 30°C to 250°C
and the Tg of each DGEBA system was measured. Temperature scans with a frequency
of oscillation of 1 Hz and amplitude of 15 μm were performed at a rate of 2°C/min.
Typical sample dimensions were 18 mm in length, 13 mm in width, and 2 mm in
thickness. The Tg was taken as the temperature corresponding to the peak of the loss
modulus curve.
3.5. Fracture Toughness Testing
Three-point single-edge notch bend (SENB) specimens were used for fracture
30
toughness measurements. ASTM 5045-93 specifies sample dimensions of 2.00 × 0.50 ×
0.25 in. to assure plain strain conditions. A notch was made that was half the sample
thickness and a sharp razor blade was used to initiate a crack at the base of the notches.
The samples were tested using an Instron 8872 in flexural mode at a crosshead speed of
0.05 in./min. All tests were performed at ambient conditions. When tests were completed,
the fracture surfaces of the specimens were examined for signs of plastic deformation. If
plastic deformation was apparent, the sample was not included in the reported results.
3.6. Flexural Testing
Three-point flexural testing in accordance with ASTM D 790-03 was used to
evaluate the flexural strength and modulus of the materials. Sample sizes and crosshead
speed varied dependent on the thickness of the material.
3.7. Short Beam Shear (SBS) Testing
Interlaminar shear strength testing was conducted on the composites in
accordance with ASTM D 2344/D 2344M. The samples were tested using a crosshead
speed of 0.05 in./min. where the force of breakage was recorded to calculate the shear
strength.
3.8. Reference
1. Mascioni M. Real Time In-Situ Spectroscopic Characterization and Modeling of
Radiation Induced Cationic Polymerizations of Glycidyl Ethers, Master Thesis,
(2002).
2. Jancovicova V. J of Photochem and Photobio A: Chem, 136, 195-202 (2002).
3. Garcia A, Bonen M, Ramirez-Vick J, Sadaka M. Biosep Process Sci. Malden:
Blackwell Sci, 181–183 (1999).
31
CHAPTER 4: INFLUENCE OF WATER ON THE KINETICS OF
CATIONICALLY PHOTO-INITIATED POLYMERIZATION OF EPOXY
GROUPS VIA ULTRA-VIOLET AND ELECTRON BEAM IRRADIATION
4.1. Introduction
There has been a growing interest in radiation curing of resins and composites due
to processing advantages over thermal curing. However, epoxy based composites cured
this way suffer from low compressive strength, poor interlaminar shear strength, and low
fracture toughness [1-11]. Furthermore, many aspects of the cure processes, including
chemical kinetics and the influence of processing conditions and impurities, such as
water, on behavioral kinetics are not fully understood. We have found that the presence
of water significantly alters the UV and EB cure behavior of such epoxies by initially
retarding the rate of polymerization and accelerating the rate relative to that of “dry”
systems in latter stages of the reaction [12-13].
The purpose of this investigation is to gain further understanding of the influence
of water on phenyl glycidyl ether (PGE) and diglycidyl ether of bisphenol A (DGEBA)
polymerization. UV- and EB-induced polymerization are assumed to follow the same
ACE and AM mechanism after the active centers are formed as described for thermal
curing in Chapter 2. However, the formation of active centers may differ substantially in
these cases. Crivello et al. have studied initiation of epoxy polymerization with UV light
using onium salts that undergo photolysis to form a powerful Bronsted acid through a
multi-step mechanism. Thus, a super acid is produced from UV photo-initiation, such
that the H+ ion reacts with the epoxy group of the monomer and produces an active
species, MH+, similar to that observed using BF3-amine complexes for thermally induced
32
reaction. For EB induced polymerization, Crivello et al. examined the cationic reaction
of cyclohexene oxide using similar onium salts as initiators. Initiation using EB was
found to be significantly more complex as a result of the generation of epoxy based free
radicals that reduce the onium salt to form the initiating cation that can react with an
epoxy moiety to form an oxonium active center. This mechanism results in polymer not
containing a hydroxyl functional end group. Alternatively Crivello et al. suggest that that
direct reduction of the onium salt by solvated electrons to form protonic acids could also
initiate polymerization. This mechanism is analogous to thermally induced as well as UV
photopolymerizations and would result in hydroxyl terminated polymers [21-25].
However, similar studies were not reported for glycidyl ethers and it is not clear that the
radical mechanism suggested by Crivello et al. would play the same role for glycidyl
ethers [26] since the pertinent radical would be a less stable secondary carbon radical
compared to the tertiary radical formed for cyclohexyl epoxy. In this investigation, the
emphasis is the propagation steps for cationic polymerization that should be independent
of the initiation mechanism whether thermal, UV, or EB.
A number of researchers have observed changes in reaction kinetics and final
material characteristics of cationically cured epoxies resulting from the presence of water.
There are numerous and sometimes contradictory observations. Past studies has shown
that chain transfer agents are known to induce a latency period in BF3- initiated cationic
cure of epoxies. Chabanne’s et al. study of the influence of water on cationic
polymerization via thermal curing resulted in the observation of a decrease in PGE
conversion with increasing water concentration and that the rate of epoxy polymerization
slowed down. Chabanne concluded this was due to water acting as a transfer agent and
33
completion of the AM and ACE mechanisms in PGE polymerization. Importantly a
latency period during the beginning of the reaction was not observed [14-16]. In the
study of the influence of water on epoxy polymerization via UV cure, Crivello observed
that the addition of OH containing groups to cycloaliphatic diepoxides resulted in an
increase in the rate of polymerization [24]. Hartwig et al. made similar observations for
cycloaliphatic diepoxides and with an increase of humidity, the rate of polymerization
increased. However, DGEBA epoxy systems reactivity decreased with the increase of
humidity. Hartwig concluded that the decrease in reactivity for DGEBA was due to the
formation of a stable five member intermediate. [28-29]. Our preliminary study with
UV- and EB- induced polymerization of glycidyl ethers has shown that the presence of
water caused an initial retardation in the polymerization of epoxies followed by a sharp
acceleration, and in the case of DGEBA, higher degrees of conversion for a given
isothermal cure temperature. The results suggest that care must be taken to control the
water content in cationically cured epoxy systems. This is a relatively simple proposition
for liquid molding applications where containers can be sealed and purged, however it is
more problematic for pre-preg applications where pre-pregs are subjected to moist
environments during the various stages of composite manufacture. In recent studies,
Riberio et al. found that the resin glass transition temperatures are considerably lower
than the thermally epoxies [30]. In our preliminary work, similar results were observed.
The objective of this work is to gain a fundamental understanding of the influence of
water on the kinetics of EB and UV induced polymerization of glycidyl ethers and the
relation to thermomechanical properties. A fiber optic based spectroscopic technique was
used to monitor epoxy and water concentration in situ for EB and UV-induced
34
polymerization of DGEBA and its monfunctional analog PGE. The results elucidate the
influence of water on the kinetics of epoxy cationic polymerization and resulting changes
in material behavior.
4.2. Experimental
4.2.1. Materials
Diglycidyl ether of bisphenol A (DGEBA) (Miller-Stephenson Epon-825) and
phenyl glycidyl ether (PGE) (Aldrich Chemical Company) were used with diphenyl
iodonium hexafluoroantimonate (CD1012) photo-initiator obtained from Applied
Poleramic Inc. (Benica, CA). The chemical structures of these compounds are shown in
Table 4.1. Epon-825 DGEBA has molecular weight of 354 g/mol. PGE is the mono-
functional analog of DGEBA with a molecular weight of 150.17 g/mol. Reactants were
dried using 4Å molecular sieves (Aldrich Chemical Company, Inc) to obtain “dry” epoxy.
The sieves were dried at 120°C for 12 hours prior to use. Such drying limits water
concentration to below 0.1% in the reactants.
Known quantities of de-ionized water were added to the “dry” epoxy to vary
initial “wet” epoxy water concentrations. Mixtures of de-ionized water with DGEBA or
PGE were used to evaluate the influence of water on epoxy cure behavior. A NIR
spectroscopic technique was used to obtain quantitative measurements of water
concentration throughout the reaction.
4.2.2. Fiber Optic Near IR Spectroscopy
The spectral analysis performed in this work was based on a near infrared
spectroscopy technique discussed in Chapter 3 [27-28].
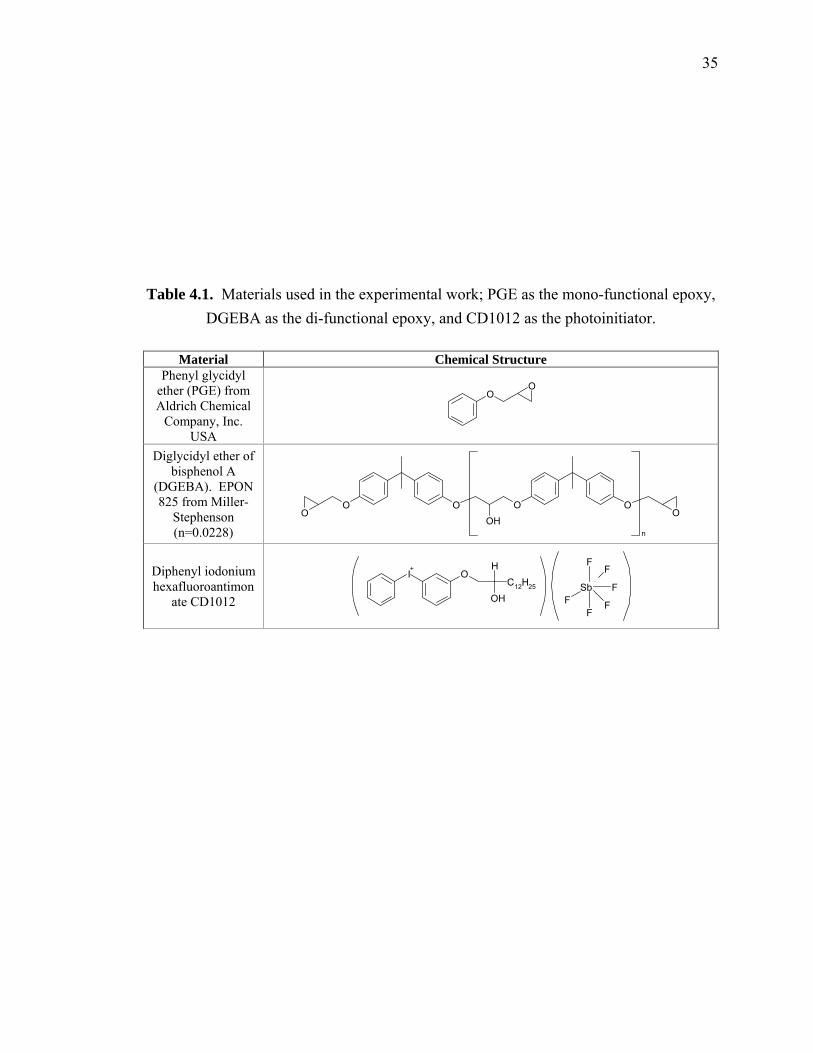
35
Table 4.1. Materials used in the experimental work; PGE as the mono-functional epoxy, DGEBA as the di-functional epoxy, and CD1012 as the photoinitiator.
Material Chemical Structure
Phenyl glycidyl ether (PGE) from Aldrich Chemical
Company, Inc. USA
OO
Diglycidyl ether of bisphenol A
(DGEBA). EPON 825 from Miller-
Stephenson (n=0.0228)
OOO O
OHO O
n
Diphenyl iodonium hexafluoroantimon
ate CD1012
I+
OH
OHC12H25
Sb
F
F
F
F
FF
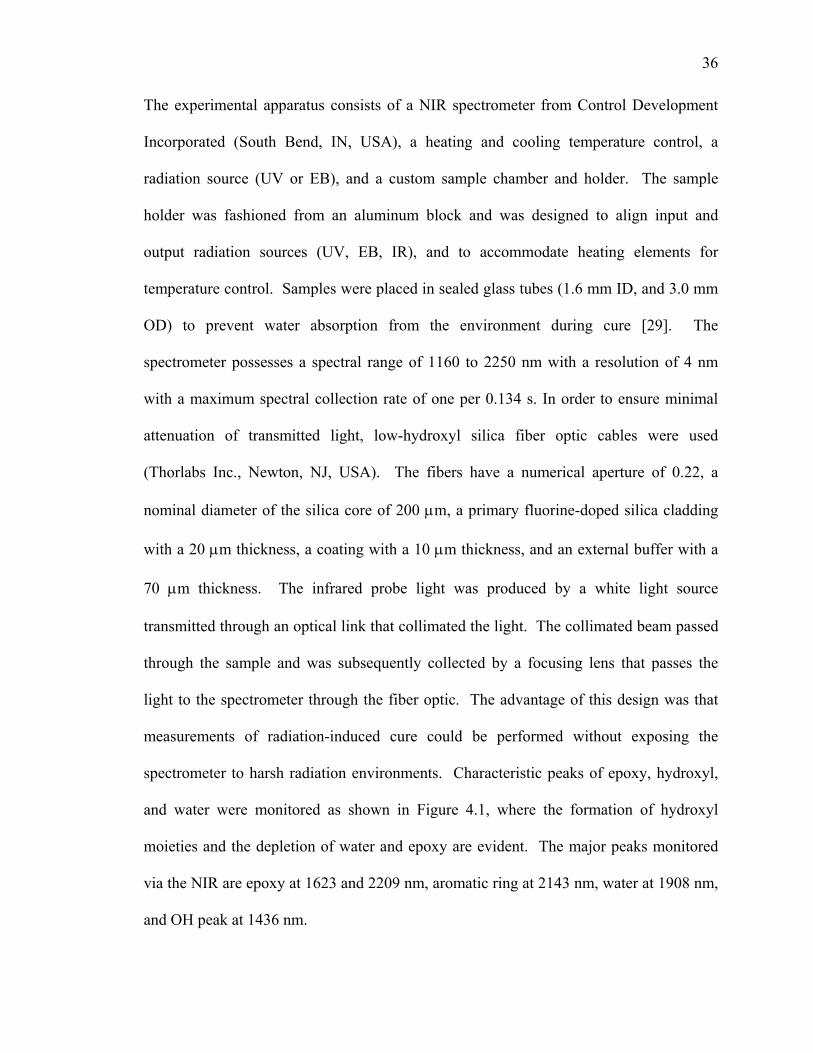
36
The experimental apparatus consists of a NIR spectrometer from Control Development
Incorporated (South Bend, IN, USA), a heating and cooling temperature control, a
radiation source (UV or EB), and a custom sample chamber and holder. The sample
holder was fashioned from an aluminum block and was designed to align input and
output radiation sources (UV, EB, IR), and to accommodate heating elements for
temperature control. Samples were placed in sealed glass tubes (1.6 mm ID, and 3.0 mm
OD) to prevent water absorption from the environment during cure [29]. The
spectrometer possesses a spectral range of 1160 to 2250 nm with a resolution of 4 nm
with a maximum spectral collection rate of one per 0.134 s. In order to ensure minimal
attenuation of transmitted light, low-hydroxyl silica fiber optic cables were used
(Thorlabs Inc., Newton, NJ, USA). The fibers have a numerical aperture of 0.22, a
nominal diameter of the silica core of 200 μm, a primary fluorine-doped silica cladding
with a 20 μm thickness, a coating with a 10 μm thickness, and an external buffer with a
70 μm thickness. The infrared probe light was produced by a white light source
transmitted through an optical link that collimated the light. The collimated beam passed
through the sample and was subsequently collected by a focusing lens that passes the
light to the spectrometer through the fiber optic. The advantage of this design was that
measurements of radiation-induced cure could be performed without exposing the
spectrometer to harsh radiation environments. Characteristic peaks of epoxy, hydroxyl,
and water were monitored as shown in Figure 4.1, where the formation of hydroxyl
moieties and the depletion of water and epoxy are evident. The major peaks monitored
via the NIR are epoxy at 1623 and 2209 nm, aromatic ring at 2143 nm, water at 1908 nm,
and OH peak at 1436 nm.
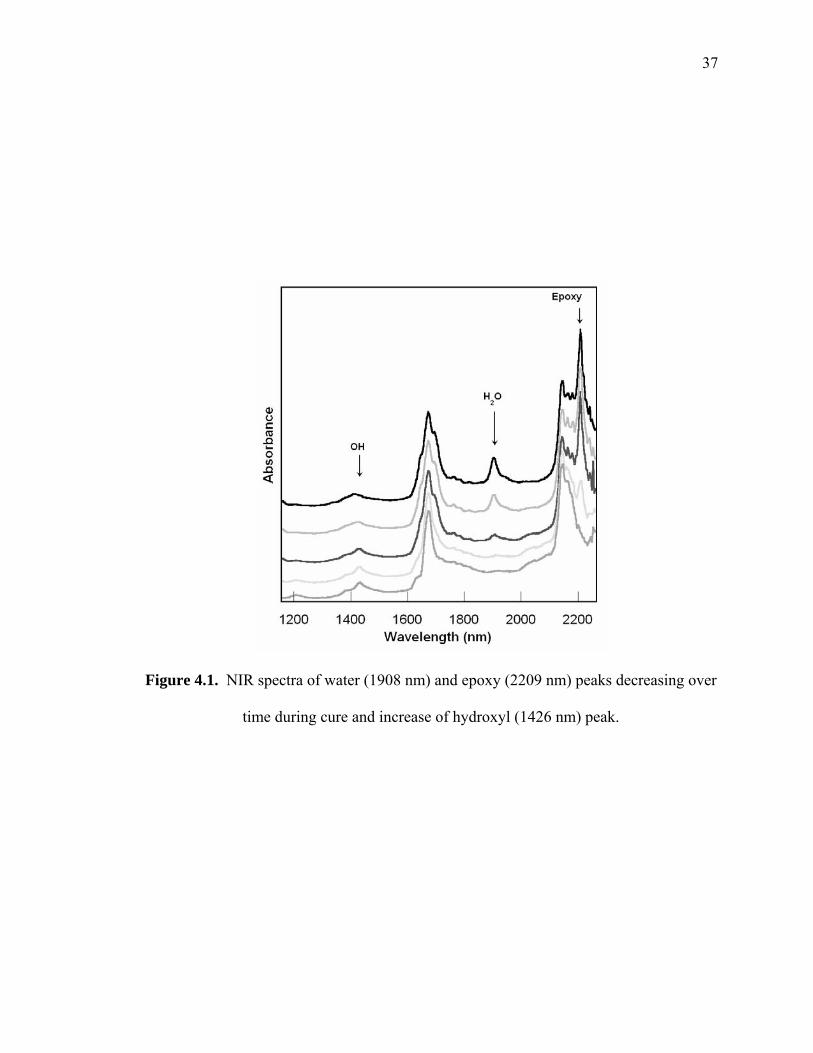
37
Figure 4.1. NIR spectra of water (1908 nm) and epoxy (2209 nm) peaks decreasing over
time during cure and increase of hydroxyl (1426 nm) peak.
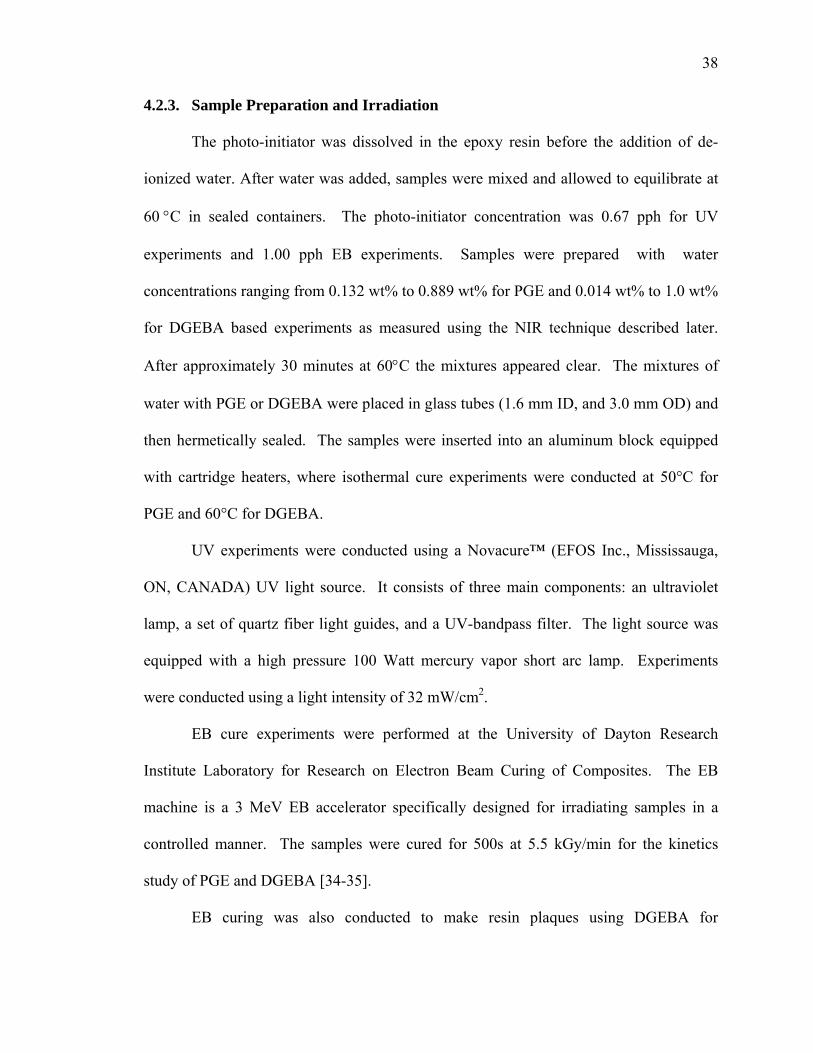
38
4.2.3. Sample Preparation and Irradiation
The photo-initiator was dissolved in the epoxy resin before the addition of de-
ionized water. After water was added, samples were mixed and allowed to equilibrate at
60 °C in sealed containers. The photo-initiator concentration was 0.67 pph for UV
experiments and 1.00 pph EB experiments. Samples were prepared with water
concentrations ranging from 0.132 wt% to 0.889 wt% for PGE and 0.014 wt% to 1.0 wt%
for DGEBA based experiments as measured using the NIR technique described later.
After approximately 30 minutes at 60°C the mixtures appeared clear. The mixtures of
water with PGE or DGEBA were placed in glass tubes (1.6 mm ID, and 3.0 mm OD) and
then hermetically sealed. The samples were inserted into an aluminum block equipped
with cartridge heaters, where isothermal cure experiments were conducted at 50°C for
PGE and 60°C for DGEBA.
UV experiments were conducted using a Novacure™ (EFOS Inc., Mississauga,
ON, CANADA) UV light source. It consists of three main components: an ultraviolet
lamp, a set of quartz fiber light guides, and a UV-bandpass filter. The light source was
equipped with a high pressure 100 Watt mercury vapor short arc lamp. Experiments
were conducted using a light intensity of 32 mW/cm2.
EB cure experiments were performed at the University of Dayton Research
Institute Laboratory for Research on Electron Beam Curing of Composites. The EB
machine is a 3 MeV EB accelerator specifically designed for irradiating samples in a
controlled manner. The samples were cured for 500s at 5.5 kGy/min for the kinetics
study of PGE and DGEBA [34-35].
EB curing was also conducted to make resin plaques using DGEBA for
39
mechanical property testing. DGEBA containing 1 pph photoinitiator was mixed with
water to produce samples containing approximately 0%, 0.25%, 0.5%, 0.75%, and 1.0
wt% water. Polymerization was carried out in 15 passes at 3.6 kGy/pass for a total dose
of 54 kGy. To control the reaction exotherm, the 2 mm thick samples were placed on an
aluminum plate and chilled by ice water. The resin plaques were then subjected to a 2-
hour thermal post-cure at 130°C.
4.3. Results and Discussion
This section addresses the influence of water on the cure kinetics and performance
of glycidyl ethers based systems. The first part of this investigation involves the in-situ
quantitative assessment of water concentration using a NIR technique. The second part
of this work focuses on evaluating the reaction kinetics of epoxy with water for mono-
and di-functional reactants. The final part addresses the influence of initial water
concentration on the mechanical properties of the cured DGEBA resin.
4.3.1. Measurement of water concentration
A spectroscopic technique was developed to quantitatively assess the influence of
water on the cationic polymerization of epoxies. Water shows a strong and distinct
absorbance in the NIR spectrum at a wavelength of 1908 nm. In order to quantify the
water concentration in the epoxy, calibration curves were constructed. “Wet” PGE and
DGEBA samples were prepared as described in the experimental section without using
photoinitiator. Subsequently the mixtures were placed in hermetically sealed glass tubes
and spectra were taken. In previous studies, the peak height at 1908 nm for a fixed
geometry was found to vary linearly with water concentration [12].
In this work the water peak height at 1908 nm was normalized by the epoxy peak height
40
at 2209 nm to obtain a calibration plot independent of path length. Plots of the
normalized water peak versus the weight fraction of water added are given in Figure 4.2
for PGE (A) and DGEBA (B). The dashed line shows the linear relationship expected
based on the Beer-Lambert Law. The data also show that a significant peak for water is
present for the “dry” epoxy, indicating that the water content for the “dry” epoxies is not
zero. The true water concentration can be obtained by shifting the dashed line so that it
passes through the origin. This shift is shown in Figure 4.2 by the solid line, which
represents an absolute calibration curve relating relative water peak height to weight
fraction of water in PGE (A) and DBEGA (B). The equations for these lines are given by
Equation 4.1 for PGE and Equation 4.2 for DGEBA:
Abs1908nm/Abs2209nm = 40.1(xwater) ± 0.0166 (4.1)
Abs1908nm/Abs2209nm = 39.5(xwater) ± 0.00532 (4.2)
This analysis suggests that the “dry” samples used to prepare the “wet” samples
actually contained 0.25 wt% water. Moreover a saturation limit of 1.3 wt% for PGE and
1.0 wt% for DGEBA is observed for the temperatures evaluated. It should be noted that
if proper care is taken to maintain the samples under a water-free environment after
drying, the water content of the epoxy resin can be kept well below 0.1 wt%. However,
once the resin is removed from the molecular sieves and comes into contact with
moisture in the environment, significant levels of water can be transferred to the sample
in a short period of time.
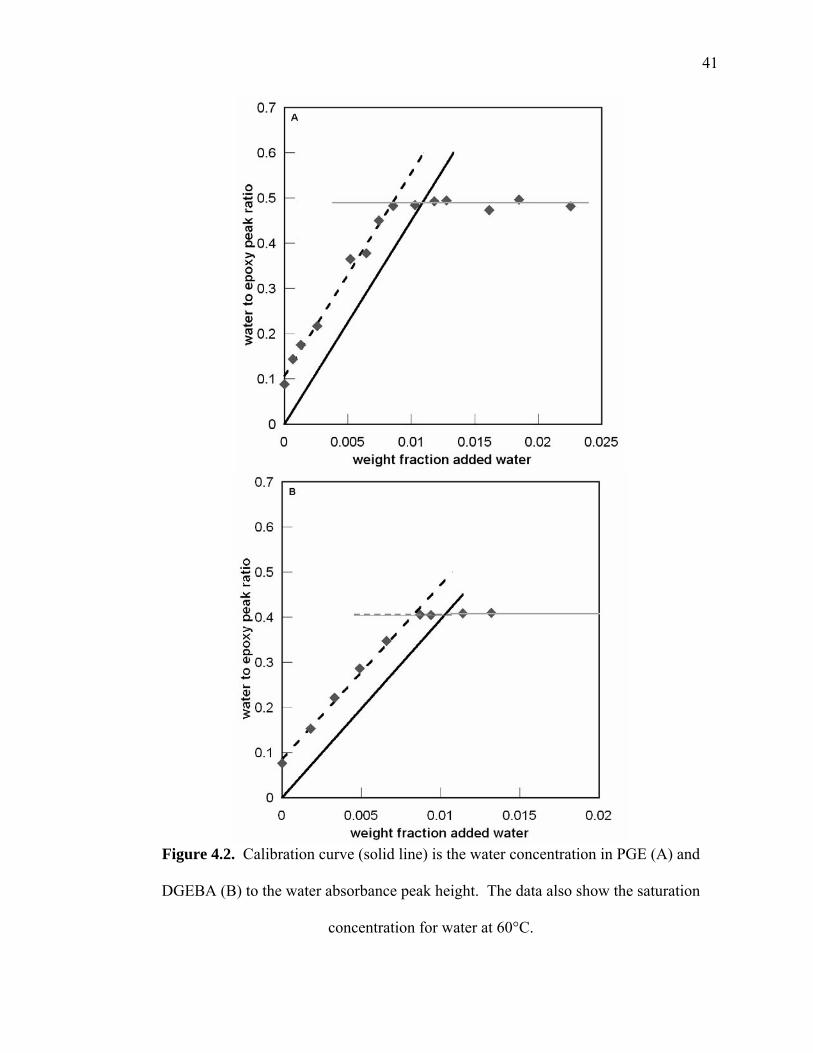
41
Figure 4.2. Calibration curve (solid line) is the water concentration in PGE (A) and
DGEBA (B) to the water absorbance peak height. The data also show the saturation
concentration for water at 60°C.
42
4.3.2. Influence of water on PGE cationic polymerization via UV and EB radiation
The initial water concentration in PGE was measured using calibration curve A in
Figure 4.2 and showed initial water concentration values ranging from 0.18 wt% to 0.78
wt% for the samples cured by EB and from 0.13 wt% to 0.89 wt% for UV cured samples.
The PGE samples were cured by UV and EB as described in the experimental section.
The resulting spectra were analyzed by measuring water and epoxy peak heights as a
function of time and assuming a linear dependence of peak heights with concentration.
Epoxy peak heights were normalized by the initial peak height and the resulting values
are dimensionless concentration. Representative plots of PGE epoxy concentration as a
function of time for a number of initial water concentrations are given in Figure 4.3 for
UV and EB studies.
These plots show that the addition of water greatly influences the chemical
kinetics of polymerization. The presence of water leads to an initial retardation of epoxy
conversion that is followed by an accelerated rate of epoxy conversion relative to that of
dry systems. Figure 4.4 shows the consumption of water ((peak height at 1908
nm)/(initial peak height at 1908 nm)) and the formation of hydroxyl groups ((peak height
at 1436 nm)−(initial peak height at 1436 nm)) for a representative experiment indicating
an inverse relationship between water consumption and hydroxyl group formation.
Figure 4.5 shows water and epoxy conversion data for “dry” and “wet” systems reacted
under UV and EB irradiation. These plots show the temporal variation of water
concentration where it is clear that the retardation in epoxy conversion occurs while the
water is being consumed. When most of the water has been consumed, there is an
apparent acceleration in epoxy reaction.
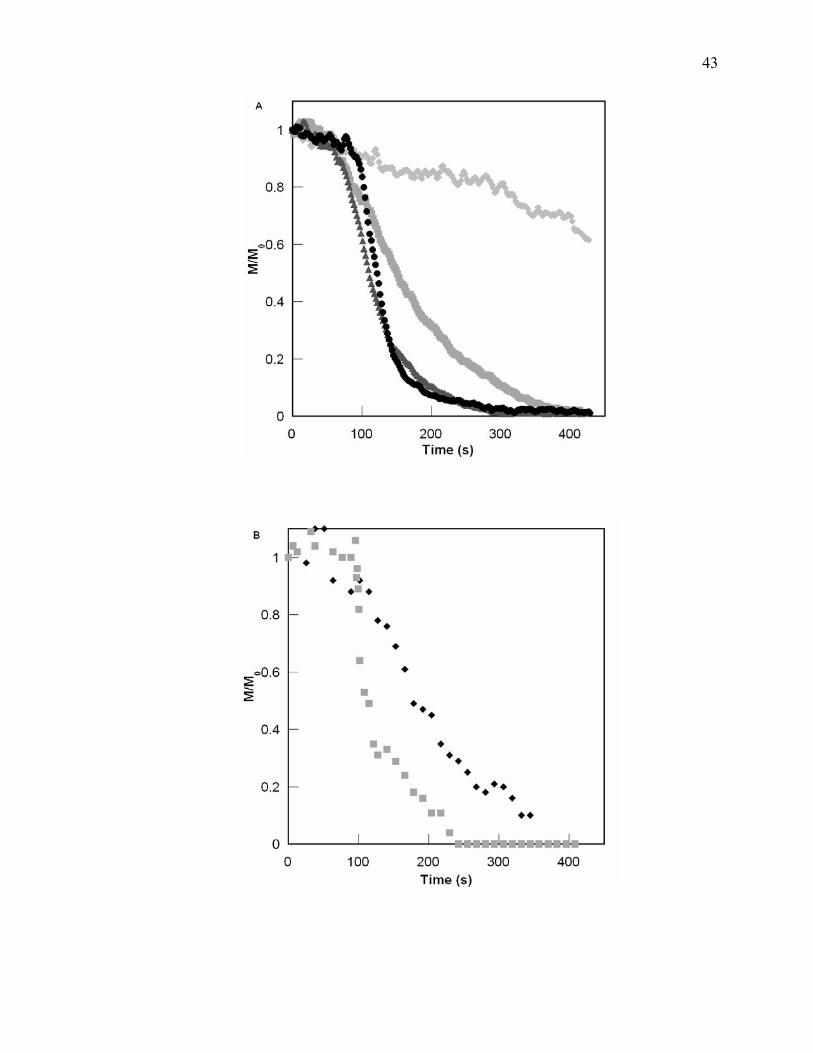
43
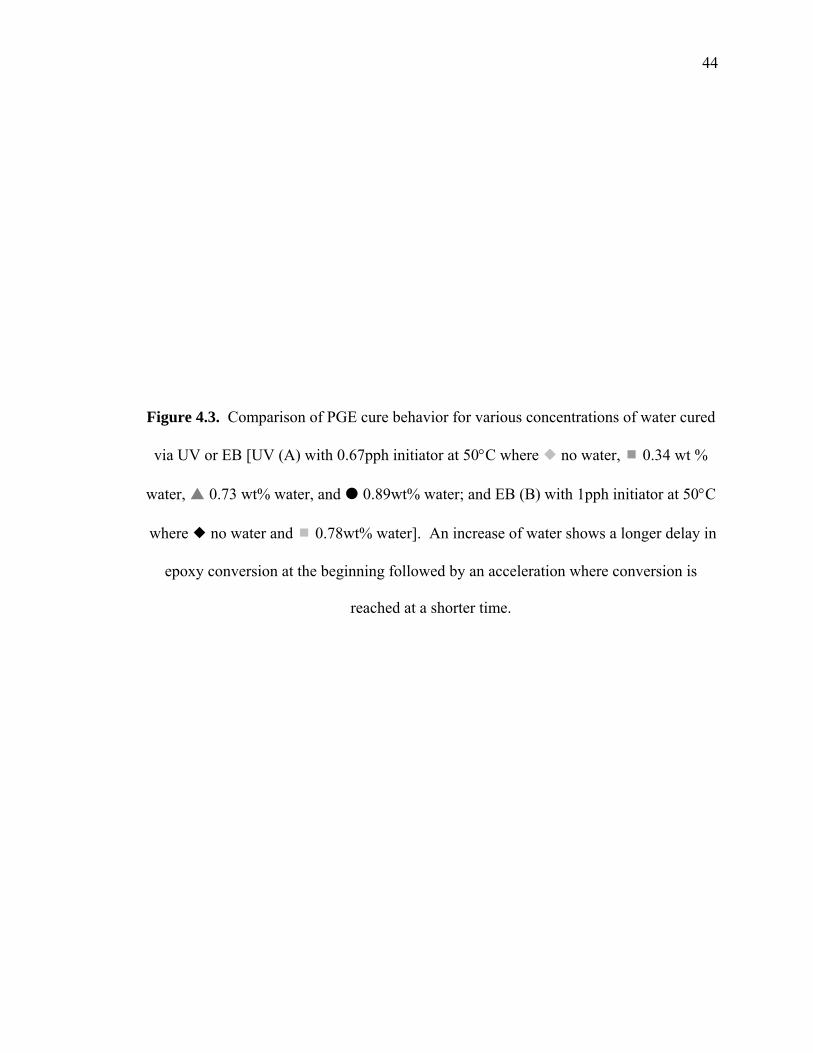
44
Figure 4.3. Comparison of PGE cure behavior for various concentrations of water cured
via UV or EB [UV (A) with 0.67pph initiator at 50°C where no water, 0.34 wt %
water, 0.73 wt% water, and 0.89wt% water; and EB (B) with 1pph initiator at 50°C
where no water and 0.78wt% water]. An increase of water shows a longer delay in
epoxy conversion at the beginning followed by an acceleration where conversion is
reached at a shorter time.
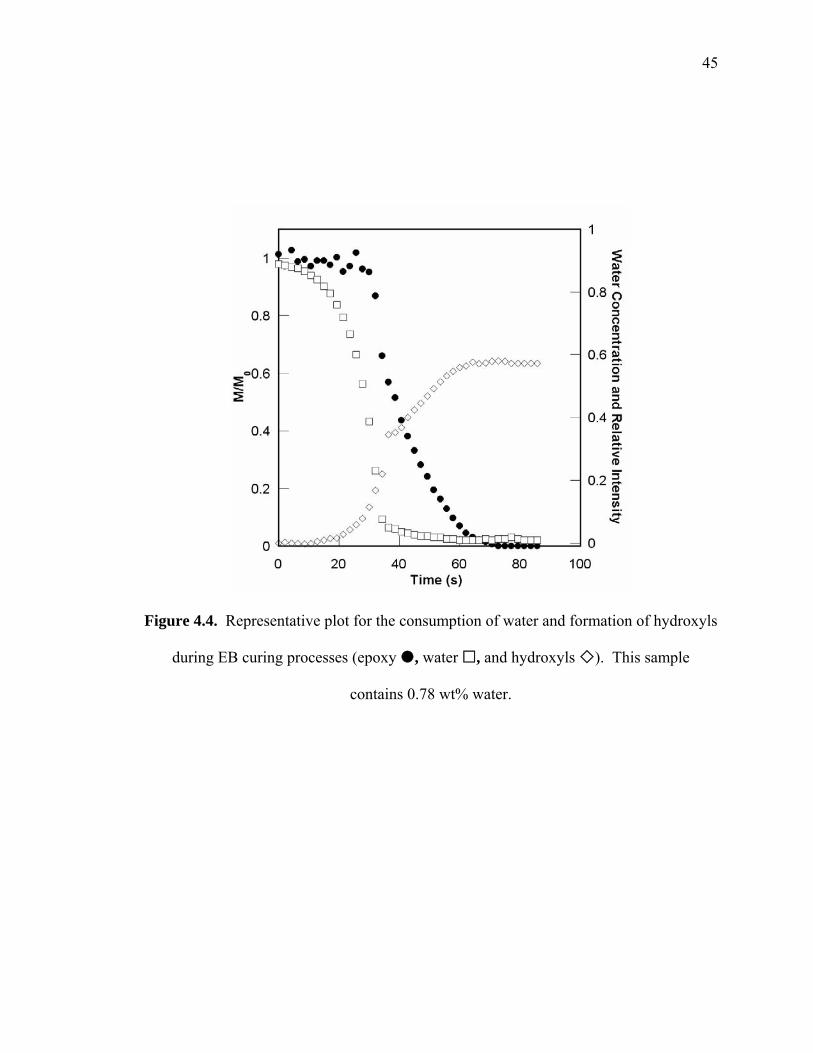
45
Figure 4.4. Representative plot for the consumption of water and formation of hydroxyls
during EB curing processes (epoxy , water , and hydroxyls ). This sample
contains 0.78 wt% water.
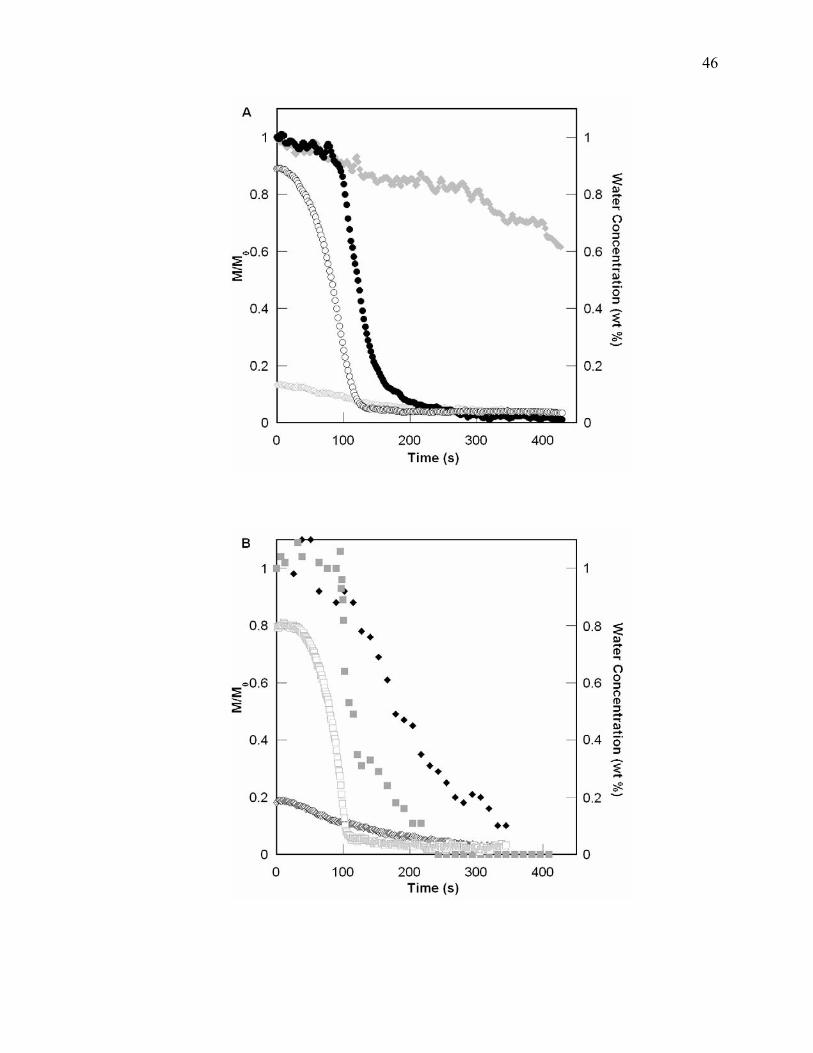
46
47
Figure 4.5. Temporal profiles for epoxy and water conversion for the limiting cases of
water for UV (A) (epoxy conversion containing 0.13 wt% water and 0.89 wt% water
; water conversion containing 0.13 wt% water and 0.89 wt% ) and EB (B) (epoxy
conversion containing 0.19 wt% water and 0.78 wt% water ; water conversion
containing 0.19 wt% water and 0.78 wt% water ) induced polymerization. The
delay can be observed in the epoxy conversion while the water is being consumed in the
reaction. When the water has been consumed, there is an acceleration of epoxy
conversion.
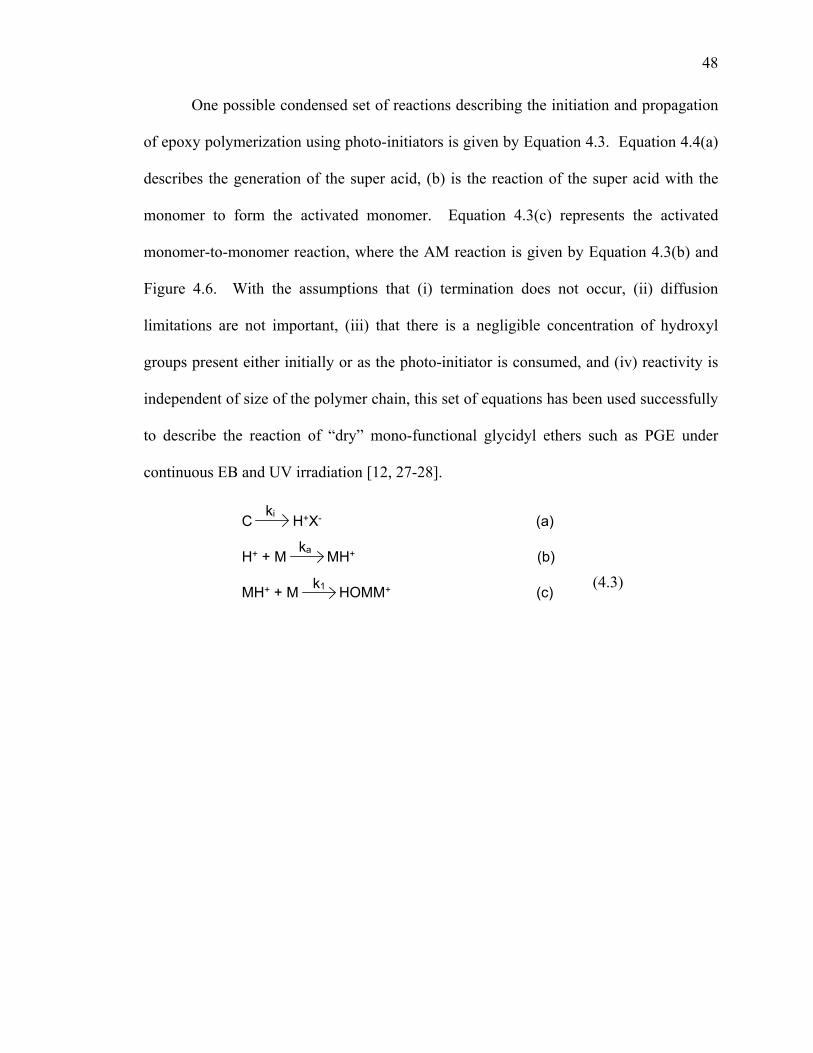
48
One possible condensed set of reactions describing the initiation and propagation
of epoxy polymerization using photo-initiators is given by Equation 4.3. Equation 4.4(a)
describes the generation of the super acid, (b) is the reaction of the super acid with the
monomer to form the activated monomer. Equation 4.3(c) represents the activated
monomer-to-monomer reaction, where the AM reaction is given by Equation 4.3(b) and
Figure 4.6. With the assumptions that (i) termination does not occur, (ii) diffusion
limitations are not important, (iii) that there is a negligible concentration of hydroxyl
groups present either initially or as the photo-initiator is consumed, and (iv) reactivity is
independent of size of the polymer chain, this set of equations has been used successfully
to describe the reaction of “dry” mono-functional glycidyl ethers such as PGE under
continuous EB and UV irradiation [12, 27-28].
C H+X- (a)
H+ + M MH+ (b)
MH+ + M HOMM+ (c)
ki
ka
k1
(4.3)
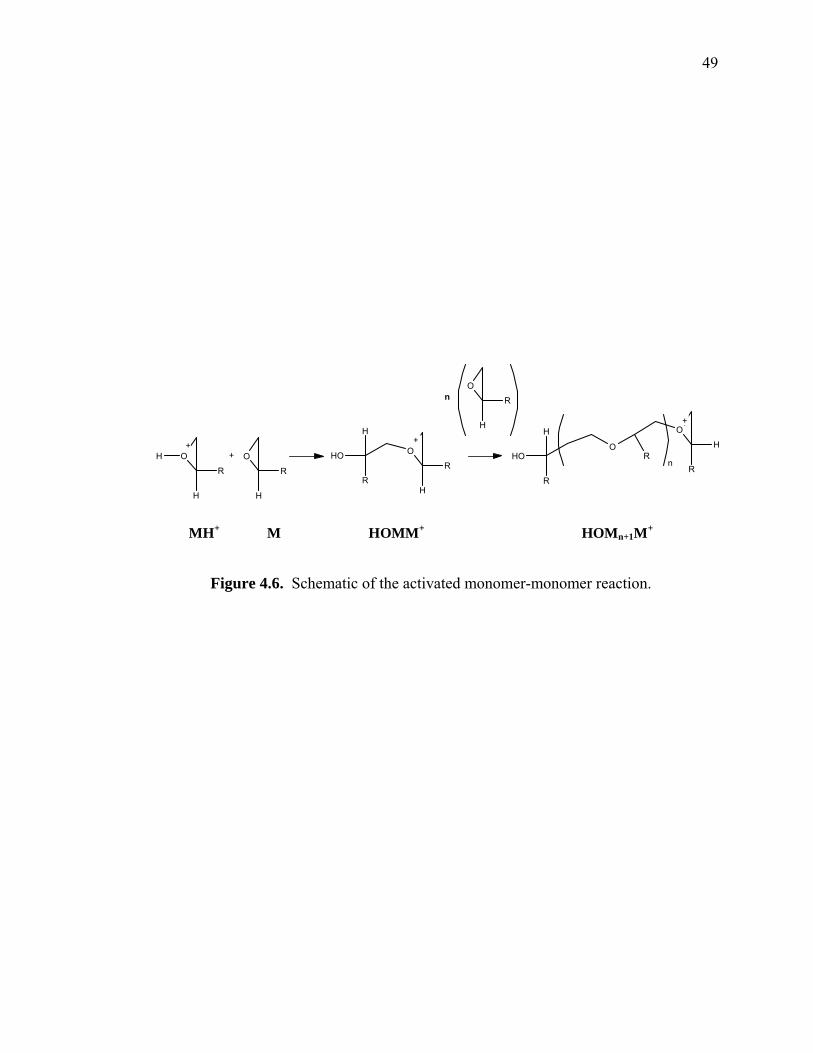
49
O
H
H
R
O+
R
OROH
H
R
H
n
O+
H
ROH
H
R
O
H
R
O
H
R
++ +
+
n
MH+ M HOMM+ HOMn+1M+
Figure 4.6. Schematic of the activated monomer-monomer reaction.
50
However, the results given in Figure 4.7 show that epoxy reaction changes dramatically
with the addition of water. The qualitative influence of water can be understood by the
set of reactions given in Equation 4.4 based on the explicit chemical expressions given by
equation 4.4(b) and 4.4(c) using the shorthand notation. These represent the reaction of
water with the initial activated monomer species (4.4(a)) and the formation of a new
alcohol moiety with the regeneration of an activated monomer (4.4(b)) followed by the
reaction of active species with such alcohols (4.4(c) and 4.4(d)). In writing these
reactions it is assumed that the concentration of hydroxyl groups formed from photo-
initiation is negligible. This is a valid simplification in that the concentration of hydroxyl
groups formed from the water reaction is much greater than that obtained by possible
initiation via direct reduction of the onium photo-initiator since the molar concentration
of photo-initiator is much lower than the molar concentration of water investigated in this
study. The ROH represents alcohol formed from the water reactions.
MH+ + HOH HOMOH+ (a)
HOMOH+ + M HOMOH + MH+ (b)
MH+ + ROH HOMOR+ (c)
HOMOR+ + M HOMOR + MH+ (d)
k2
k3
k4
k5
(4.4)
ROH represents the hydroxyl groups formed for the water reaction (MHOH) and other
hydroxyl containing polymers. The explicit chemical reactions summarized by Equation
4.4 are given Figure 4.7.
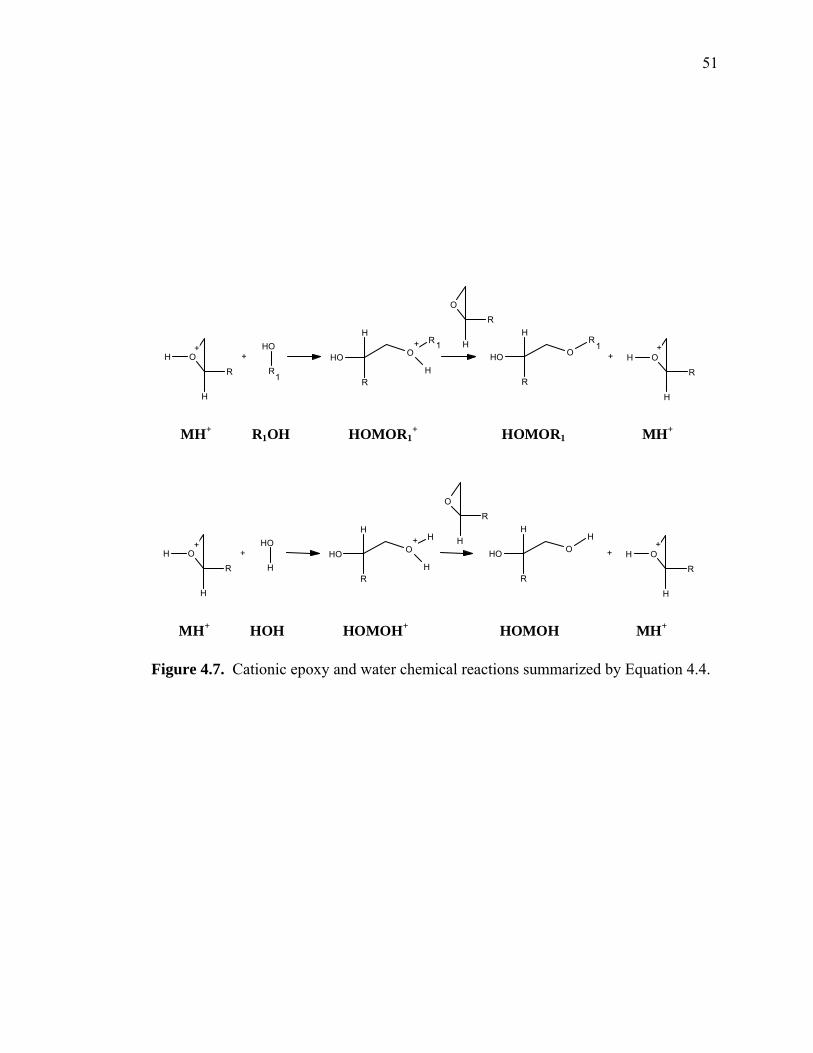
51
O+
H
H
R
OH
R
O+
OH
H
R
R
H
OOH
H
R
R
O+
H
H
R
O
H
R
+
1
1 1+
+ + +
MH+ R1OH HOMOR1+ HOMOR1 MH+
O+
H
H
R
OH
H
O+
OH
H
R
H
H
OOH
H
R
H
O+
H
H
R
O
H
R
+ ++ + +
MH+ HOH HOMOH+ HOMOH MH+
Figure 4.7. Cationic epoxy and water chemical reactions summarized by Equation 4.4.
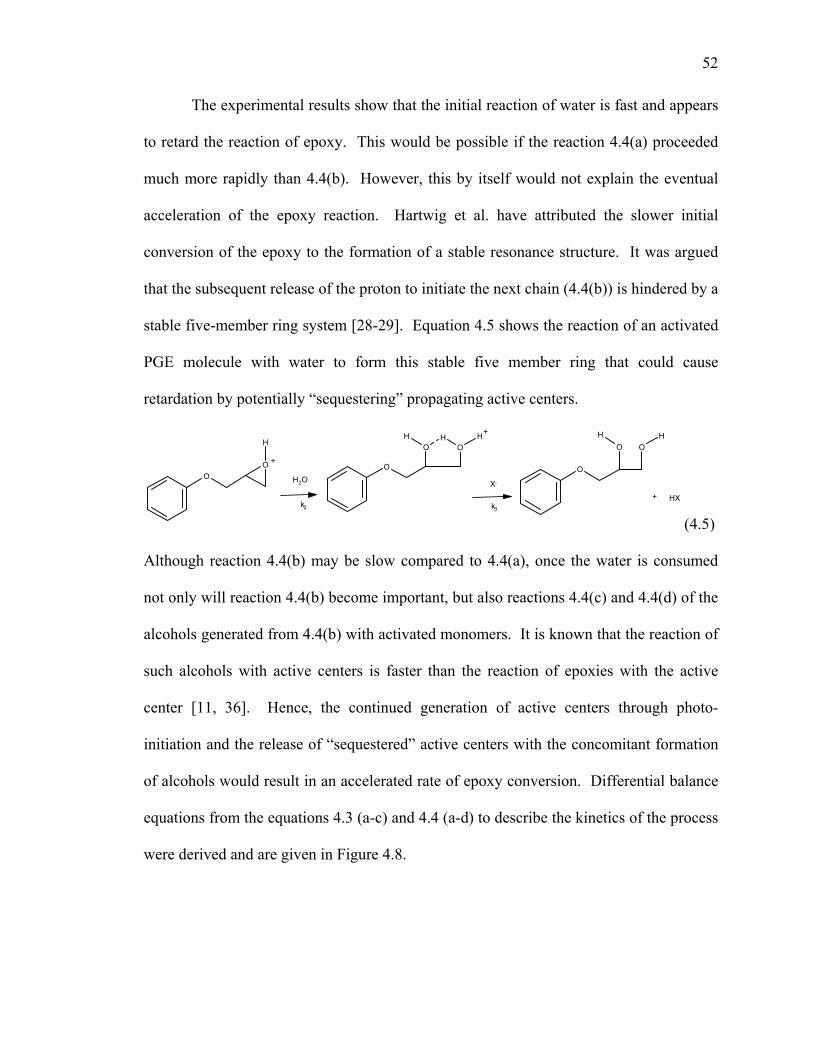
52
The experimental results show that the initial reaction of water is fast and appears
to retard the reaction of epoxy. This would be possible if the reaction 4.4(a) proceeded
much more rapidly than 4.4(b). However, this by itself would not explain the eventual
acceleration of the epoxy reaction. Hartwig et al. have attributed the slower initial
conversion of the epoxy to the formation of a stable resonance structure. It was argued
that the subsequent release of the proton to initiate the next chain (4.4(b)) is hindered by a
stable five-member ring system [28-29]. Equation 4.5 shows the reaction of an activated
PGE molecule with water to form this stable five member ring that could cause
retardation by potentially “sequestering” propagating active centers.
OO
H O OHH H
O
O OH H
O
+
+
H2O X-
+ HXk2 k3
(4.5)
Although reaction 4.4(b) may be slow compared to 4.4(a), once the water is consumed
not only will reaction 4.4(b) become important, but also reactions 4.4(c) and 4.4(d) of the
alcohols generated from 4.4(b) with activated monomers. It is known that the reaction of
such alcohols with active centers is faster than the reaction of epoxies with the active
center [11, 36]. Hence, the continued generation of active centers through photo-
initiation and the release of “sequestered” active centers with the concomitant formation
of alcohols would result in an accelerated rate of epoxy conversion. Differential balance
equations from the equations 4.3 (a-c) and 4.4 (a-d) to describe the kinetics of the process
were derived and are given in Figure 4.8.
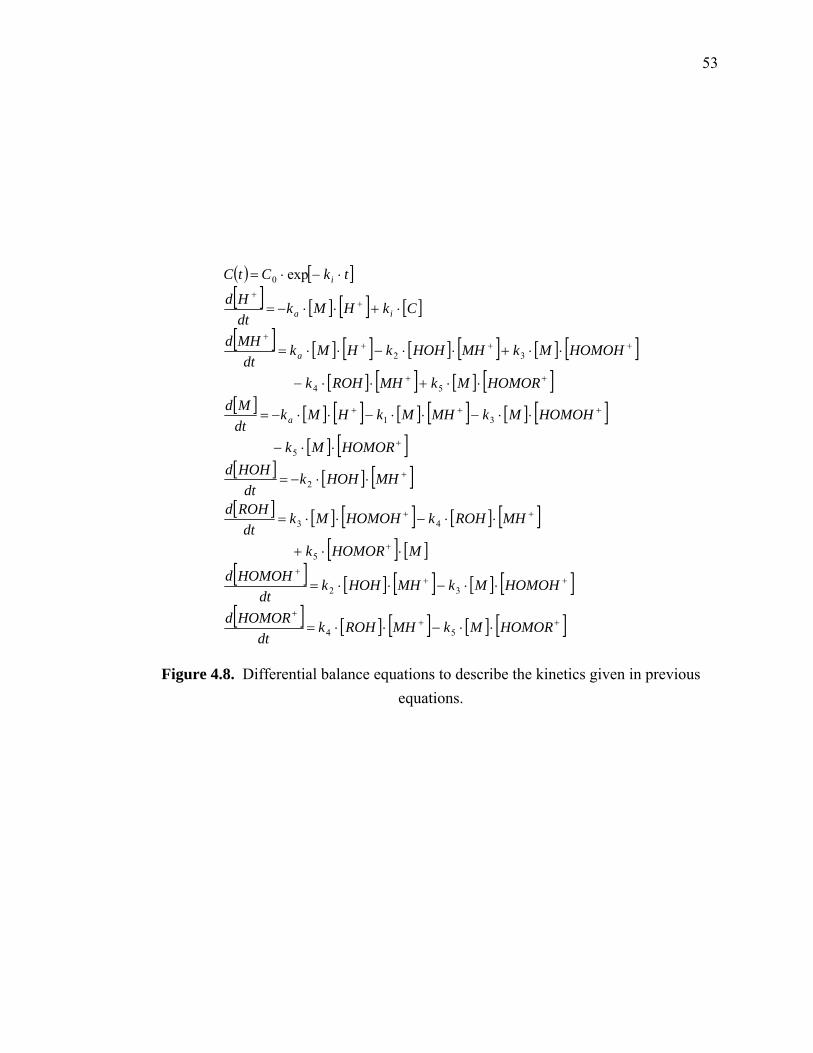
53
( ) [ ][ ] [ ] [ ] [ ]
[ ] [ ] [ ] [ ] [ ] [ ] [ ][ ] [ ] [ ] [ ]
[ ] [ ] [ ] [ ] [ ] [ ] [ ][ ] [ ]
[ ] [ ] [ ][ ] [ ] [ ] [ ] [ ]
[ ] [ ][ ] [ ] [ ] [ ] [ ][ ] [ ] [ ] [ ] [ ]++
+
+++
+
++
+
+
+++
++
++++
++
⋅⋅−⋅⋅=
⋅⋅−⋅⋅=
⋅⋅+
⋅⋅−⋅⋅=
⋅⋅−=
⋅⋅−
⋅⋅−⋅⋅−⋅⋅−=
⋅⋅+⋅⋅−
⋅⋅+⋅⋅−⋅⋅=
⋅+⋅⋅−=
⋅−⋅=
HOMORMkMHROHkdt
HOMORd
HOMOHMkMHHOHkdt
HOMOHd
MHOMORk
MHROHkHOMOHMkdt
ROHd
MHHOHkdt
HOHdHOMORMk
HOMOHMkMHMkHMkdtMd
HOMORMkMHROHk
HOMOHMkMHHOHkHMkdt
MHd
CkHMkdtHd
tkCtC
a
a
ia
i
54
32
5
43
2
5
31
54
32
0 exp
Figure 4.8. Differential balance equations to describe the kinetics given in previous equations.
54
From these differential equations, the rate of reaction of epoxy, hydroxyl moiety,
and water can be determined provided knowledge of the rate constants. To test the
reasoning presented in the preceding paragraph the differential equations resulting from
Equations 4.3 and 4.4 were solved numerically and a parametric study was conducted to
evaluate the importance of the relative values of the reaction rate constants. Previously
obtained values of k1 and ka were used (note that ki>ka) [31-32]. The water reaction data
at short times was used to determine that k2 is eight times greater than k1 [33]. The rate
of reaction of the activated monomer with an aliphatic alcohol has been found to be much
greater than that with another monomer so that k4>k1. Moreover it was assume k5>>k4
making the k4 the rate limiting step in the set of equations 4.4(c) and 4.4(d) [11, 14-16,
36]. Thus the following was assumed that k5>>k2 ≥k4>k1. However the relative rate of
reaction of 4.4(b) to 4.4 (a) (k3 to k2) is unknown. First it was assumed analogously that
in the alcohol reactions 4.4(c) and 4.4(d) k3>>k2. Values of the rate constants were
selected to satisfy these observations and were used as a basis of a parametric analysis
designed to probe the qualitative behavior of the set of equations given above. In
particular the influence of the value of k3 on the conversion of epoxy for varied water
concentration was examined. The following values of reaction rate constants were fixed
in the calculations: ki = 0.001 s-1,ka = 200 L mol-1s-1, k1 = 2.5 s-1, k2 = 20.4 L mol-1s-1, k4
= 20.4 L mol-1s-1, k5 = 200 s-1. Additionally, The initial concentration (t = 0 s) were: [M]
= 7.31 mol/L, [ROH] = 0, [C]0 = 0.0145 mol/L, and the concentration of all other species
was set to 0.
Plots of epoxy concentration as a function of time are given in Figure 4.9 for a
number of initial water concentrations ranging from 0 to 1 wt% using k3 = 200 s-1. This
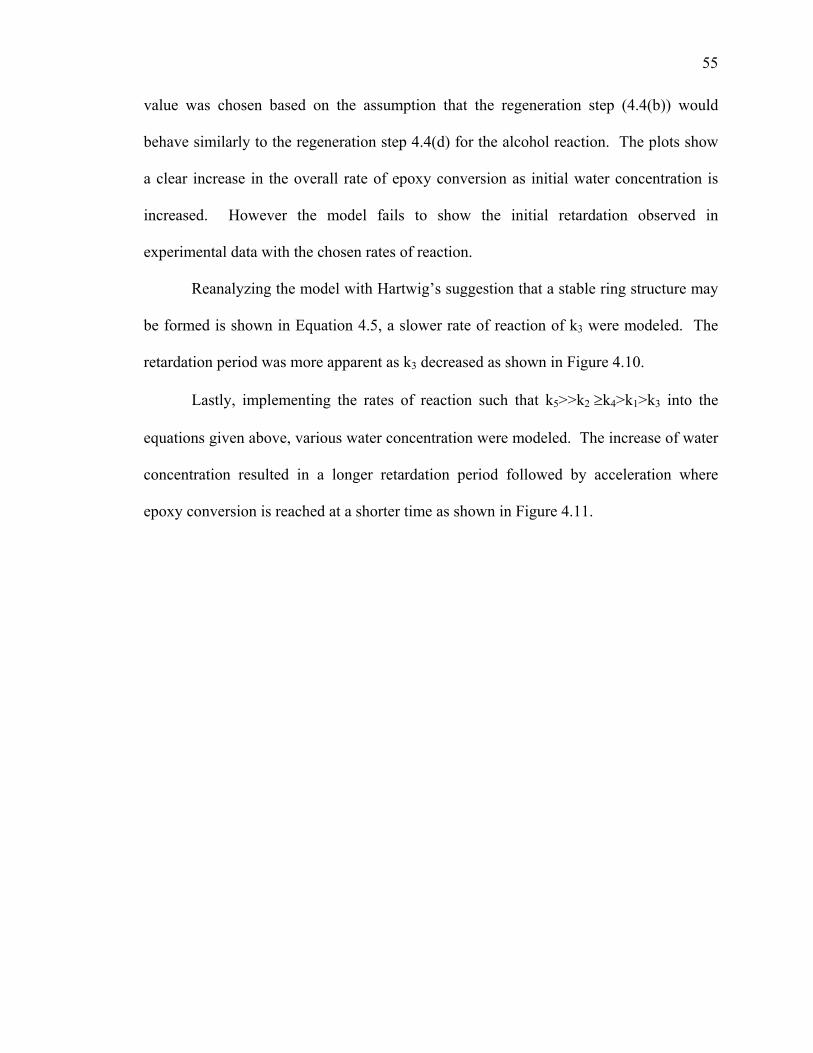
55
value was chosen based on the assumption that the regeneration step (4.4(b)) would
behave similarly to the regeneration step 4.4(d) for the alcohol reaction. The plots show
a clear increase in the overall rate of epoxy conversion as initial water concentration is
increased. However the model fails to show the initial retardation observed in
experimental data with the chosen rates of reaction.
Reanalyzing the model with Hartwig’s suggestion that a stable ring structure may
be formed is shown in Equation 4.5, a slower rate of reaction of k3 were modeled. The
retardation period was more apparent as k3 decreased as shown in Figure 4.10.
Lastly, implementing the rates of reaction such that k5>>k2 ≥k4>k1>k3 into the
equations given above, various water concentration were modeled. The increase of water
concentration resulted in a longer retardation period followed by acceleration where
epoxy conversion is reached at a shorter time as shown in Figure 4.11.
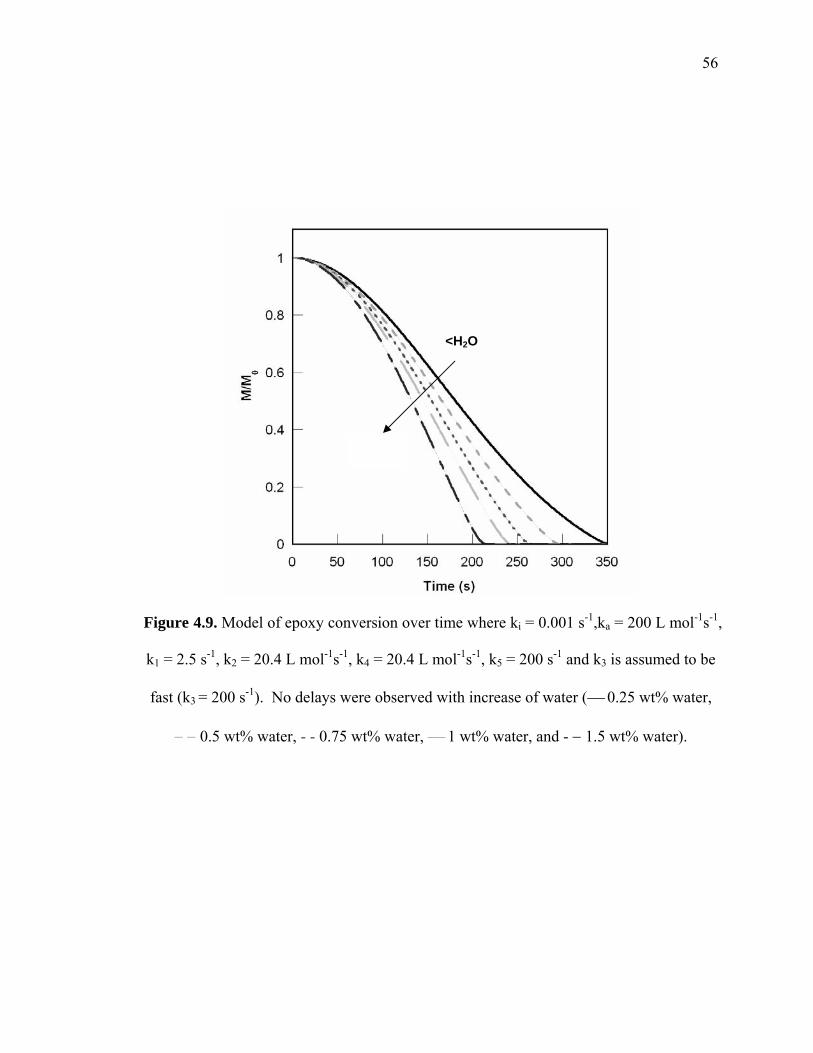
56
Figure 4.9. Model of epoxy conversion over time where ki = 0.001 s-1,ka = 200 L mol-1s-1,
k1 = 2.5 s-1, k2 = 20.4 L mol-1s-1, k4 = 20.4 L mol-1s-1, k5 = 200 s-1 and k3 is assumed to be
fast (k3 = 200 s-1). No delays were observed with increase of water (⎯ 0.25 wt% water,
− − 0.5 wt% water, - - 0.75 wt% water, ⎯ 1 wt% water, and - − 1.5 wt% water).
<H2O
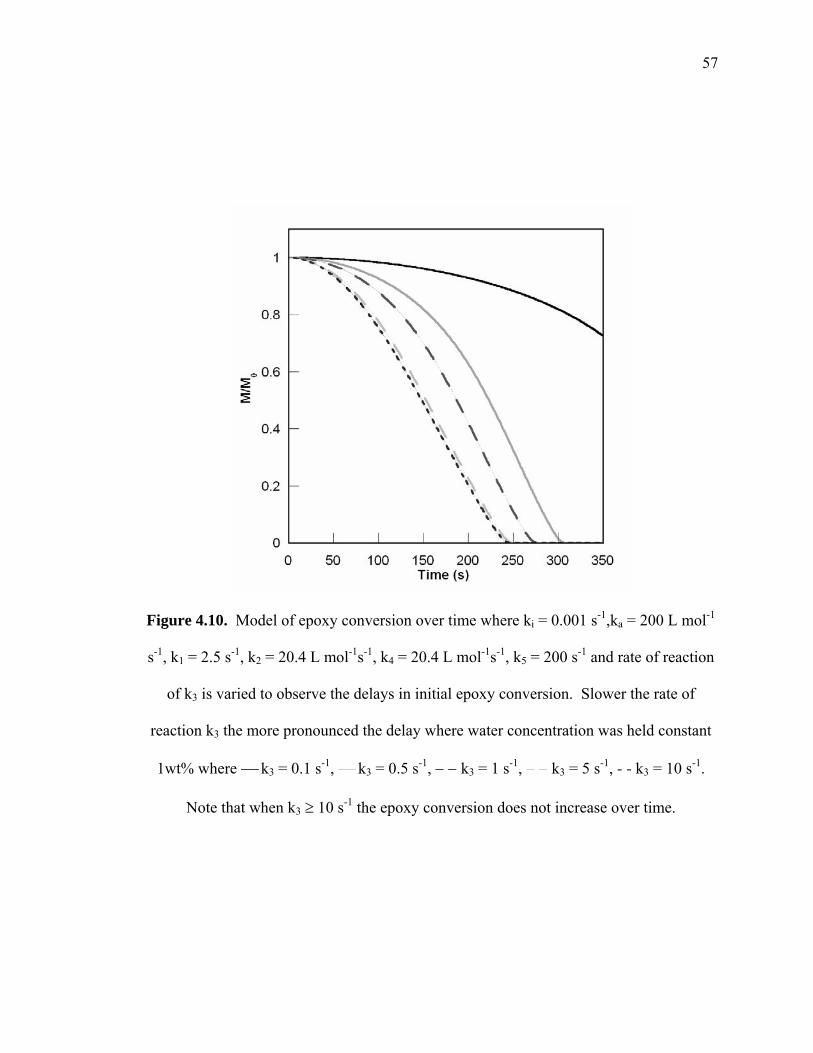
57
Figure 4.10. Model of epoxy conversion over time where ki = 0.001 s-1,ka = 200 L mol-1
s-1, k1 = 2.5 s-1, k2 = 20.4 L mol-1s-1, k4 = 20.4 L mol-1s-1, k5 = 200 s-1 and rate of reaction
of k3 is varied to observe the delays in initial epoxy conversion. Slower the rate of
reaction k3 the more pronounced the delay where water concentration was held constant
1wt% where ⎯ k3 = 0.1 s-1, ⎯ k3 = 0.5 s-1, − − k3 = 1 s-1, − − k3 = 5 s-1, - - k3 = 10 s-1.
Note that when k3 ≥ 10 s-1 the epoxy conversion does not increase over time.
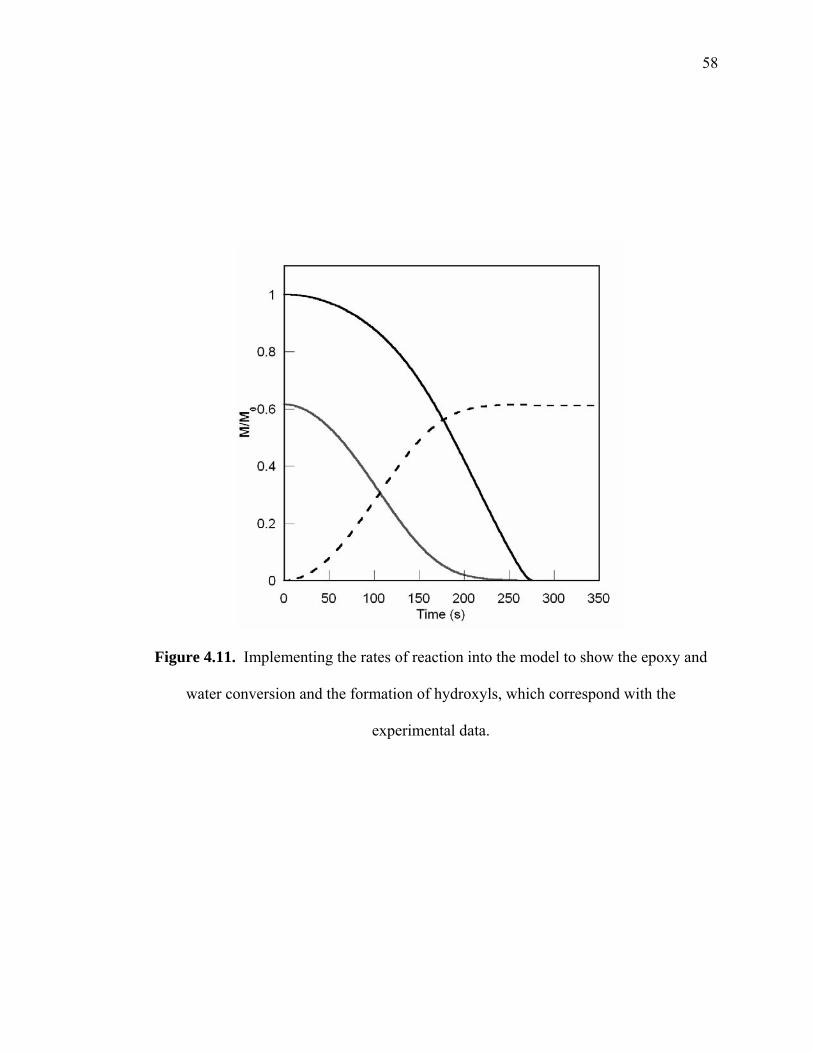
58
Figure 4.11. Implementing the rates of reaction into the model to show the epoxy and
water conversion and the formation of hydroxyls, which correspond with the
experimental data.
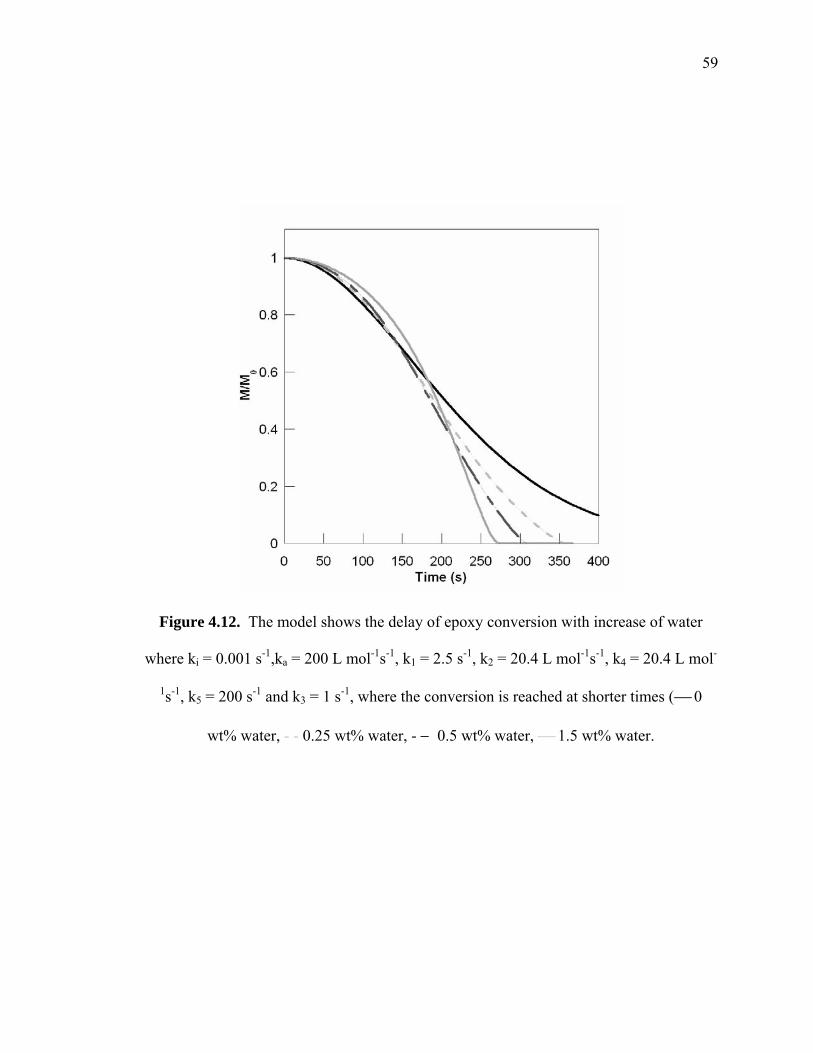
59
Figure 4.12. The model shows the delay of epoxy conversion with increase of water
where ki = 0.001 s-1,ka = 200 L mol-1s-1, k1 = 2.5 s-1, k2 = 20.4 L mol-1s-1, k4 = 20.4 L mol-
1s-1, k5 = 200 s-1 and k3 = 1 s-1, where the conversion is reached at shorter times (⎯ 0
wt% water, - - 0.25 wt% water, - − 0.5 wt% water, ⎯ 1.5 wt% water.
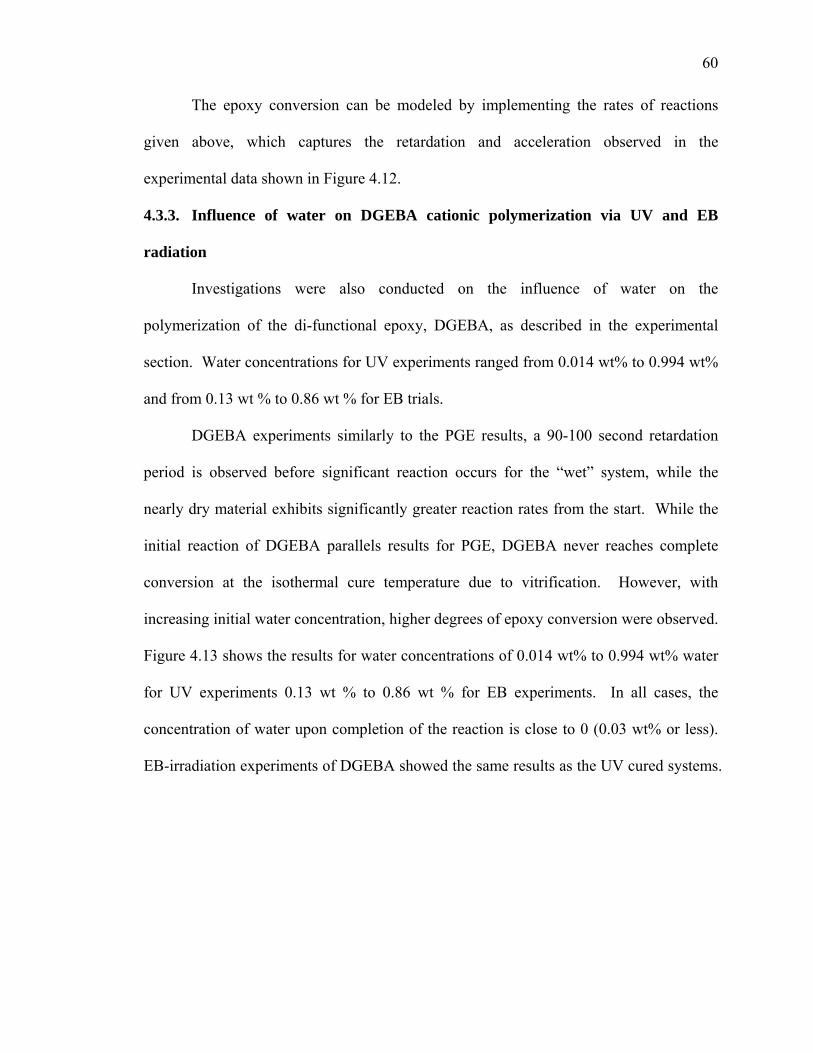
60
The epoxy conversion can be modeled by implementing the rates of reactions
given above, which captures the retardation and acceleration observed in the
experimental data shown in Figure 4.12.
4.3.3. Influence of water on DGEBA cationic polymerization via UV and EB
radiation
Investigations were also conducted on the influence of water on the
polymerization of the di-functional epoxy, DGEBA, as described in the experimental
section. Water concentrations for UV experiments ranged from 0.014 wt% to 0.994 wt%
and from 0.13 wt % to 0.86 wt % for EB trials.
DGEBA experiments similarly to the PGE results, a 90-100 second retardation
period is observed before significant reaction occurs for the “wet” system, while the
nearly dry material exhibits significantly greater reaction rates from the start. While the
initial reaction of DGEBA parallels results for PGE, DGEBA never reaches complete
conversion at the isothermal cure temperature due to vitrification. However, with
increasing initial water concentration, higher degrees of epoxy conversion were observed.
Figure 4.13 shows the results for water concentrations of 0.014 wt% to 0.994 wt% water
for UV experiments 0.13 wt % to 0.86 wt % for EB experiments. In all cases, the
concentration of water upon completion of the reaction is close to 0 (0.03 wt% or less).
EB-irradiation experiments of DGEBA showed the same results as the UV cured systems.
61
62
Figure 4.13. Comparison of DGEBA cure kinetics with various water concentration (UV
(A) at 0.67pph initiator at 60°C-0.014 wt% water , 0.265 wt% water , 0.701 wt%
water , and 0.947 wt% water; and EB (B) at 1pph initiator at 60°C-0.12 wt% water
and 0.86 wt% water ).
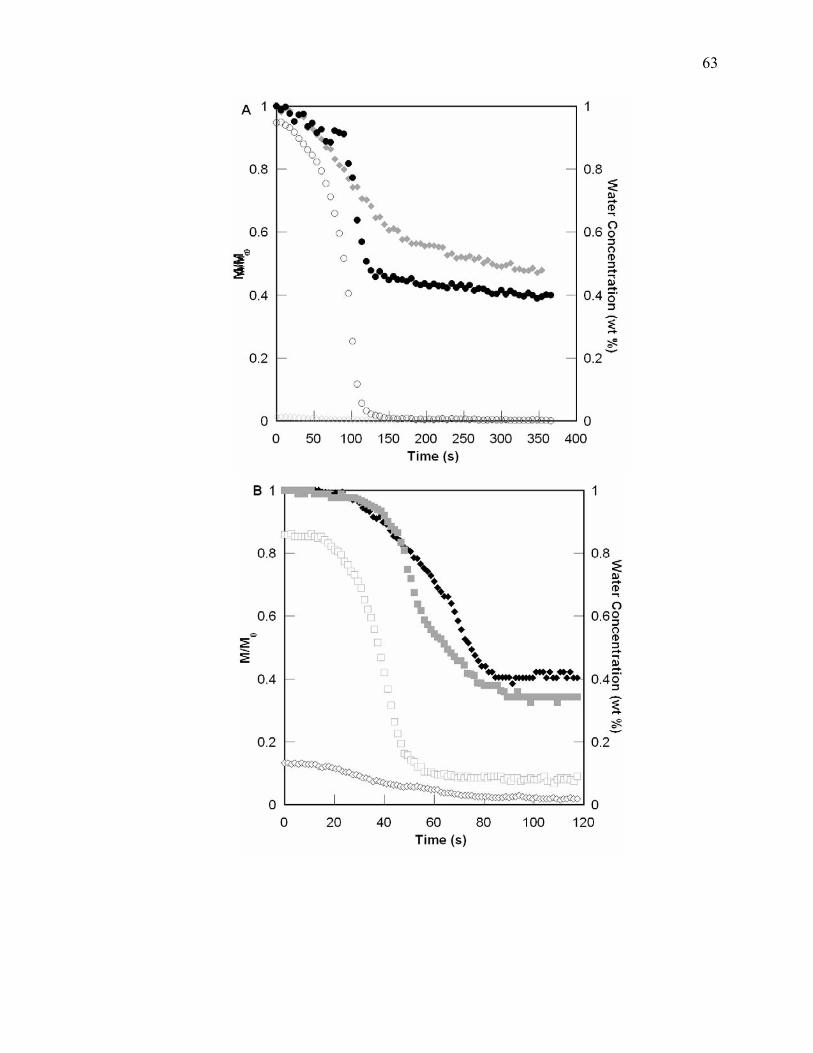
63
64
Figure 4.14. Temporal profiles for epoxy (closed symbols) and water (open symbols)
conversion for high and low initial water concentration for UV (A) where epoxy
conversion 0.014 wt% water and 0.947 wt% water ; water conversion 0.014 wt%
water and 0.947 wt% water and EB (B) -induced polymerization where epoxy
conversion 0.12 wt% water and 0.86 wt% water and 0.12 wt% water 0.86 wt%
water . Similar delays can be observed in the DGEBA data as seen in PGE as the
epoxy is being consumed. The final conversion is greater with increase of water
concentration.
65
Another point of discussion is the influence of water on the final conversion of
epoxy for a given isothermal temperature of cure. Figure 4.14 shows the relationship
between initial water content and final extent of epoxy conversion during isothermal cure
at 60°C for our series of UV experiments. The final extent of reaction was significantly
influenced by the presence of water. There is a general increase in final conversion as
water content is increased with values ranging from 50 to 60% as initial water content
approaches 1.0%. The reactions were allowed to proceed to cessation because the
temperature was held constant. Thus the conversion values shown in Figure 4.15
represent extents of reaction at vitrification for isothermal cure. This means that the Tg of
all these systems was 60°C yet their composition is very different. One possibility is that
water in the system plasticizes the network so that molecular mobility is significantly
enhanced allowing higher conversion for the given cure temperature. However, the
experimental data shows that water is completely consumed prior to vitrification.
Therefore this behavior is due to the water co-polymerizing into the network resulting in
a less cross-linked system that requires greater DGEBA conversion to attain the same Tg.
It is clear that not only does the presence of water alter processing behavior, but also the
structure of the polymer being formed. It is likely also that this will significantly
influence the behavioral characteristics of the polymer and its composites as discussed in
the following sections.
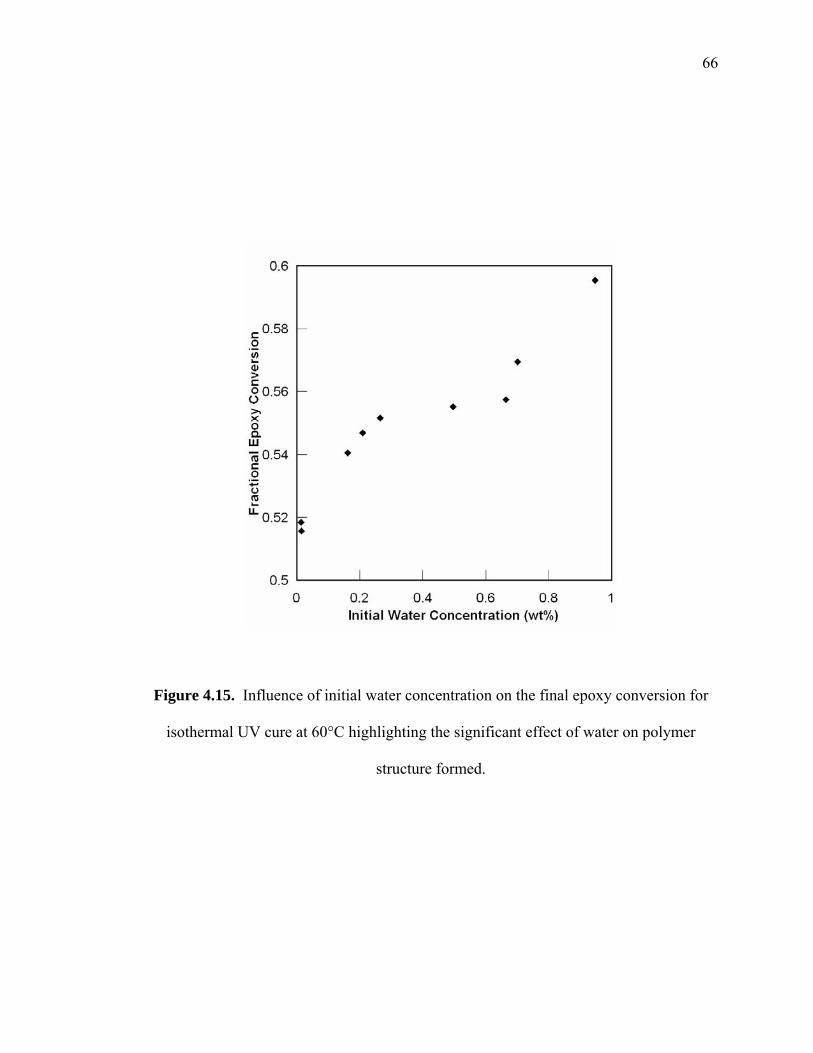
66
Figure 4.15. Influence of initial water concentration on the final epoxy conversion for
isothermal UV cure at 60°C highlighting the significant effect of water on polymer
structure formed.
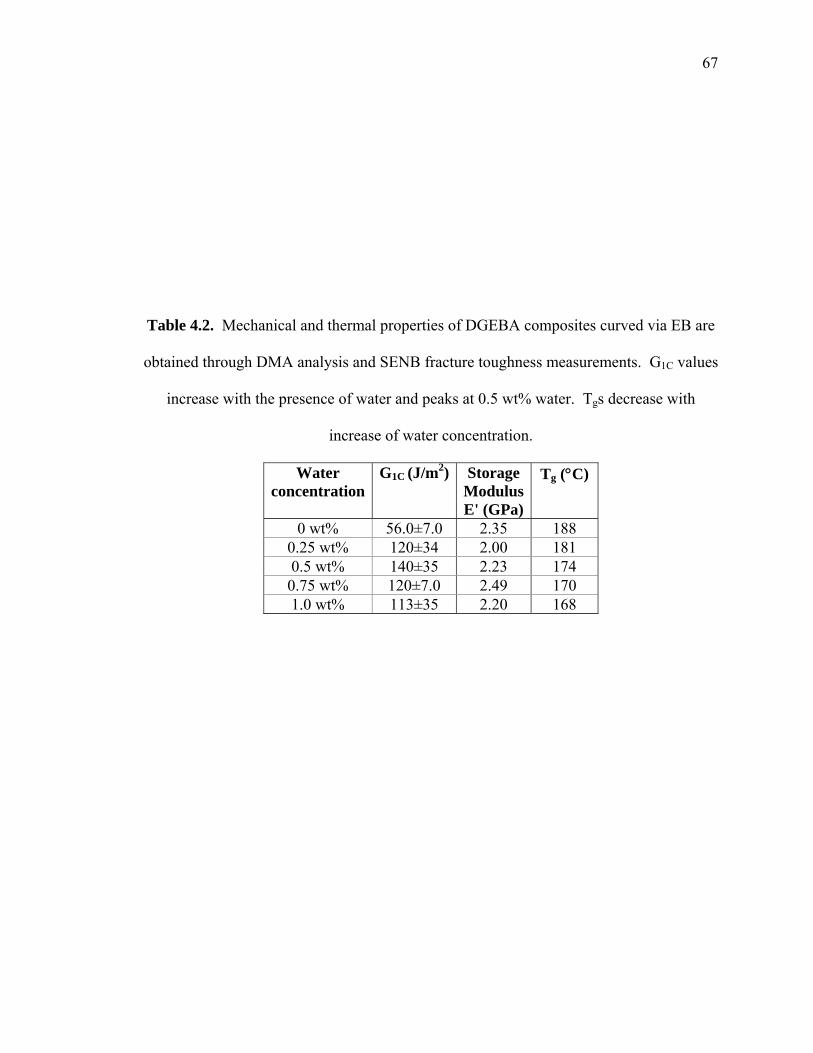
67
Table 4.2. Mechanical and thermal properties of DGEBA composites curved via EB are
obtained through DMA analysis and SENB fracture toughness measurements. G1C values
increase with the presence of water and peaks at 0.5 wt% water. Tgs decrease with
increase of water concentration.
Water concentration
G1C (J/m2) Storage Modulus E' (GPa)
Tg (°C)
0 wt% 56.0±7.0 2.35 188 0.25 wt% 120±34 2.00 181 0.5 wt% 140±35 2.23 174 0.75 wt% 120±7.0 2.49 170 1.0 wt% 113±35 2.20 168
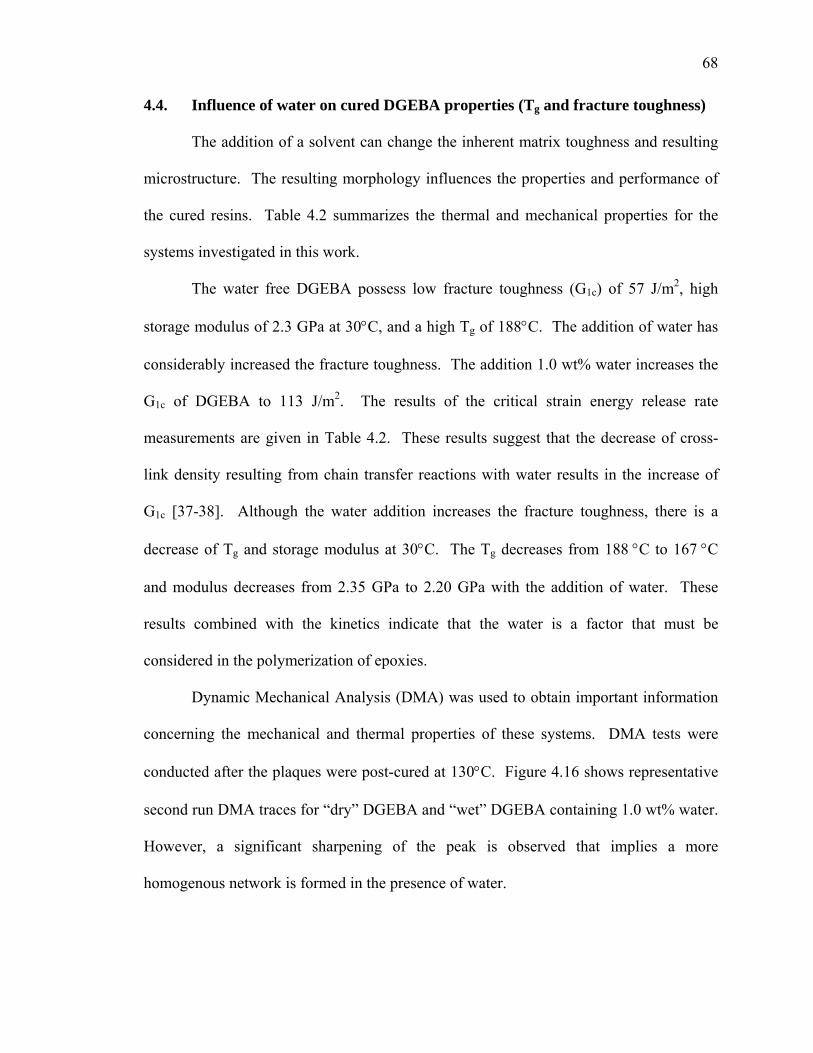
68
4.4. Influence of water on cured DGEBA properties (Tg and fracture toughness)
The addition of a solvent can change the inherent matrix toughness and resulting
microstructure. The resulting morphology influences the properties and performance of
the cured resins. Table 4.2 summarizes the thermal and mechanical properties for the
systems investigated in this work.
The water free DGEBA possess low fracture toughness (G1c) of 57 J/m2, high
storage modulus of 2.3 GPa at 30°C, and a high Tg of 188°C. The addition of water has
considerably increased the fracture toughness. The addition 1.0 wt% water increases the
G1c of DGEBA to 113 J/m2. The results of the critical strain energy release rate
measurements are given in Table 4.2. These results suggest that the decrease of cross-
link density resulting from chain transfer reactions with water results in the increase of
G1c [37-38]. Although the water addition increases the fracture toughness, there is a
decrease of Tg and storage modulus at 30°C. The Tg decreases from 188 °C to 167 °C
and modulus decreases from 2.35 GPa to 2.20 GPa with the addition of water. These
results combined with the kinetics indicate that the water is a factor that must be
considered in the polymerization of epoxies.
Dynamic Mechanical Analysis (DMA) was used to obtain important information
concerning the mechanical and thermal properties of these systems. DMA tests were
conducted after the plaques were post-cured at 130°C. Figure 4.16 shows representative
second run DMA traces for “dry” DGEBA and “wet” DGEBA containing 1.0 wt% water.
However, a significant sharpening of the peak is observed that implies a more
homogenous network is formed in the presence of water.
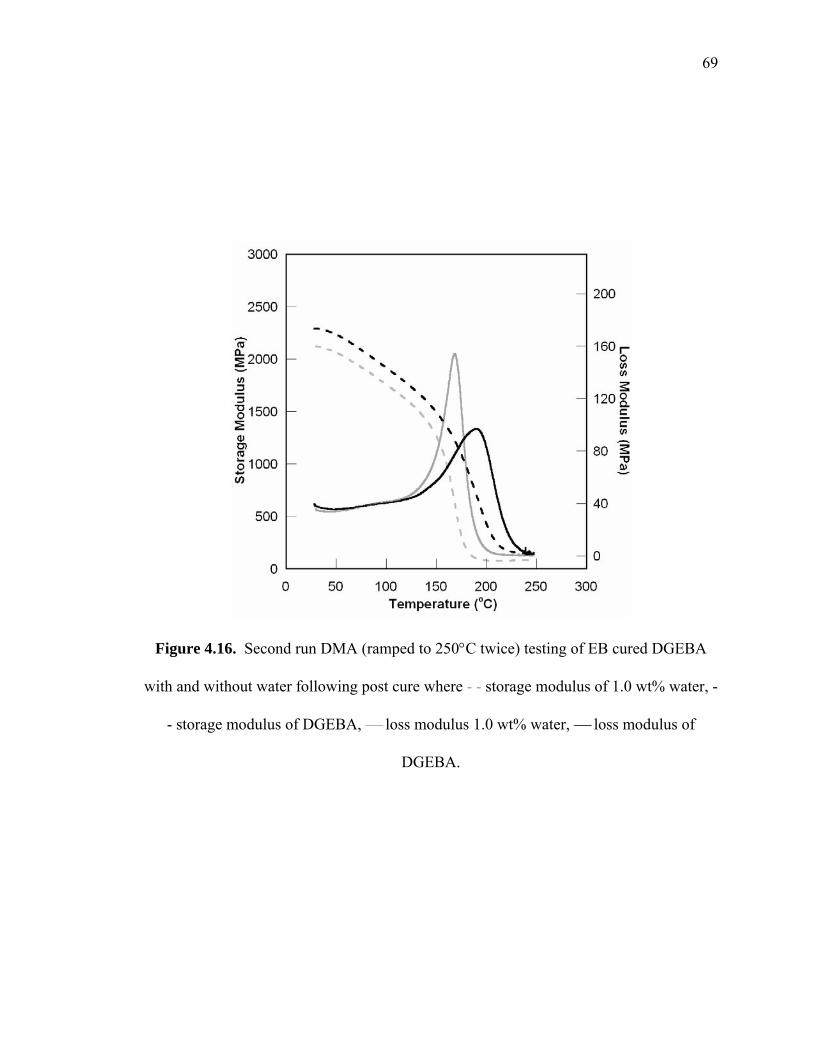
69
Figure 4.16. Second run DMA (ramped to 250°C twice) testing of EB cured DGEBA
with and without water following post cure where - - storage modulus of 1.0 wt% water, -
- storage modulus of DGEBA, ⎯ loss modulus 1.0 wt% water, ⎯ loss modulus of
DGEBA.
70
Figure 4.17. Tg of DGEBA at 1 pph photo-initiator with varying wt% of water in the
system EB with a total dosage of 54 kGy. Increase of water concentration causes a
decrease in the final Tg.
71
Thus the addition of water alters of the final polymer network structure and
reduces Tg with increasing water concentration, where Figure 4.17 shows this behavior
over a range of initial water concentration. In light of these results, it is clear that the
presence of water alters not only the kinetic behavior as discussed earlier, but also
behavioral characteristics of the epoxy materials.
4.5. Conclusion
An in situ fiber optic spectroscopic technique was used for quantifying water
concentrations in epoxy samples, and data was presented concerning the influence of
water on the UV- and EB-induced polymerization behavior of PGE and DGEBA. The
presence of water in PGE and DGEBA was observed to significantly alter the cure
behavior in important ways. There is a pronounced retardation period followed by an
accelerated reaction regime relative to that observed for “dry” systems. A mechanism
was proposed to explain this behavior. It is based on the relatively faster reaction of
water with an activated monomer to form a relatively stable five member ring system
compared to the reaction of epoxy with the activated monomer. The observed
acceleration is thought to result from the slow regeneration of active centers and the
generation of alcohol moieties from these ring structures as water reacts to completion.
A kinetic model was used to test the proposed mechanism and the results were found to
be in excellent qualitative agreement with the observed behavior. Because the water is
consumed during the polymerization, it must alter the resulting network structure. Water
was found to decrease the Tg of the epoxy network significantly and also to substantially
increase its fracture toughness.
72
4.6. References
1. Decker C, Moussa K. J Polym Sci: Part A, 28, 3429 (1990).
2. Benziers D, Capdepuy B. SAMPE Int Symp, 35, 1220 (1990).
3. Saunders CB, Lopata VJ, Kremers W, McDougall TE, Tateishi M, Singh A.
SAMPE Int Symp, 38, 1682 (1993).
4. Saunders CB, Lopata VJ, Kremers W, Chung M, Barnard JW. SAMPE Int Symp,
40, 112 (1995).
5. Janke CJ, Havens SJ, Dorsay GF, Lopata VJ. SAMPE Tech Conf, 41, 196 (1996).
6. Janke CJ, Havens SJ, Dorsay GF, Lopata VJ. SAMPE Tech Conf, 28, 901 (1996).
7. Janke CJ, Havens SJ, Lopata VJ, Chung M. SAMPE Tech Conf, 28, 901 (1996).
8. Goodman DL, Brix DL, Palmese GR, Chen A. SAMPE Tech Conf, 41, 207
(1996).
9. Janke CJ, Norris RE, Yarborough K, Havens SJ, Lopata VJ. SAMPE Intl Conf,
42, 477 (1997).
10. Dabestani R, Ivanov I. SAMPE Int Symp, 46, 2075 (2001).
11. Palmese GR, Ghosh NN, McKnight SH. SAMPE Int Symp, 45, 1874 (2000).
12. Palmese GR, Stein G. SAMPE Int Symp, 48 (2003).
13. Lee J, Palmese GR. SAMPE Int Symp, (2005).
14. Chabanne P, Tighzert L, Pascault J. J Appl Polym Sci, 53, 769 (1994).
15. Chabanne P, Tighzert L, Pascault J. J Appl Polym Sci, 53, 787 (1994).
16. Chabanne P, Tighzert L, Pascault J, Bonnetot B. J Appl Polym Sci, 53, 685 (1994).
17. Bouillon N, Pascault J, Tighzert L. Macromol Chem, 191, 1403 (1990).
18. Bouillon N, Pascault J, Tighzert L. Makromol Chem, 191, 1417 (1990).
73
19. Bouillon N, Pascault J, Tighzert L. Makromol Chem, 191, 1435 (1990).
20. Lunak S, Krejcar E. Die Angew Makol Chem, 10, 109 (1970).
21. Crivello JV, Liu S. J Polym Sci Part A: Poly Chem, 38, 389 (2000).
22. Crivello JV, Fan M, Bi D. J Polym Appl Sci, 44, 9 (1992).
23. Crivello JV, Mingxin F, Daoshen B. J Appl Polym Sci, 44, 9 (1992).
24. Crivello JV. Nucl Instr and Meth B, 151, 8 (1999).
25. Crivello JV. Macromol Symp, 183, 65 (2002).
26. Alessi S, Dispenza C, Spadaro G. Macromol. Symp, 247, v (2007).
27. Decker C, Nguyen T, Viet T, Decker D, Weber-Koehl E. Polymer, 42, 5531 (2001).
28. Hartwig A. Int J of Adhes Adhes, 22, 409 (2002).
29. Hartiwg A, Schneider B, Lühring A. Polymer, 43, 4243 (2002).
30. Riberio R, Morgan RJ, Bonnaud L, Lu J, Sue HJ, Choi J, Lopata V. J Comp Mat,
39, 1433 (2005).
31. Mascioni M, Sands JM, Palmese GR. SAMPE Int Symp, 47, 93 (2002).
32. Mascioni M, Sands JM, Palmese GR. Nucl Instr and Meth B, 208, 353 (2003).
33. Lee J, Johnston A, Palmese GR. SAMPE Int Symp, (2004).
34. Klosterman DA. SAMPE Int Symp, 48, (2003).
35. Goodman DL, Palmese GR. Handbook of Poly Blends and Comp, 1, 459 (2002).
36. Ghosh NN, Palmese GR. Bulletin of Mat Sci, 6, 603 (2005).
37. Palmese GR, McCullough RL. J Appl Polym Sci, 46, 1863 (1992).
38. Lee J, Yee AF. Polymer, 41, 8375 (2000).
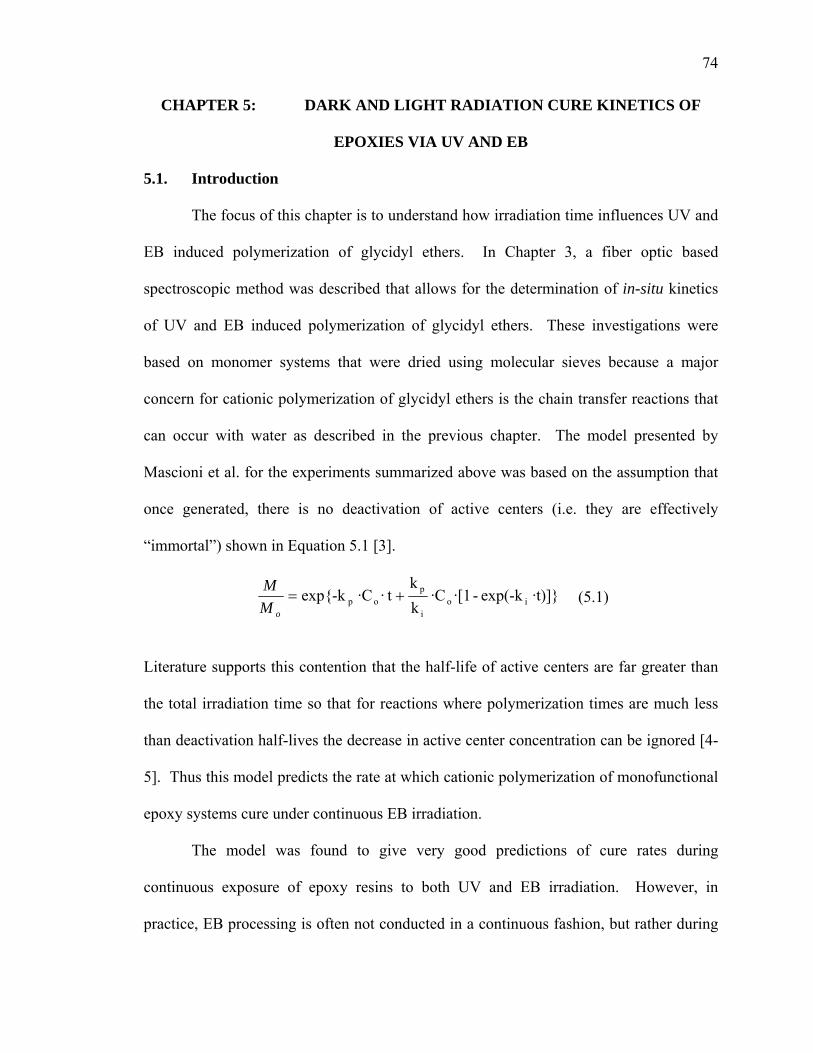
74
CHAPTER 5: DARK AND LIGHT RADIATION CURE KINETICS OF
EPOXIES VIA UV AND EB
5.1. Introduction
The focus of this chapter is to understand how irradiation time influences UV and
EB induced polymerization of glycidyl ethers. In Chapter 3, a fiber optic based
spectroscopic method was described that allows for the determination of in-situ kinetics
of UV and EB induced polymerization of glycidyl ethers. These investigations were
based on monomer systems that were dried using molecular sieves because a major
concern for cationic polymerization of glycidyl ethers is the chain transfer reactions that
can occur with water as described in the previous chapter. The model presented by
Mascioni et al. for the experiments summarized above was based on the assumption that
once generated, there is no deactivation of active centers (i.e. they are effectively
“immortal”) shown in Equation 5.1 [3].
·t)]} exp(-k-·[1·C kk
t ··C exp{-k ioi
pop +=
oMM
(5.1)
Literature supports this contention that the half-life of active centers are far greater than
the total irradiation time so that for reactions where polymerization times are much less
than deactivation half-lives the decrease in active center concentration can be ignored [4-
5]. Thus this model predicts the rate at which cationic polymerization of monofunctional
epoxy systems cure under continuous EB irradiation.
The model was found to give very good predictions of cure rates during
continuous exposure of epoxy resins to both UV and EB irradiation. However, in
practice, EB processing is often not conducted in a continuous fashion, but rather during
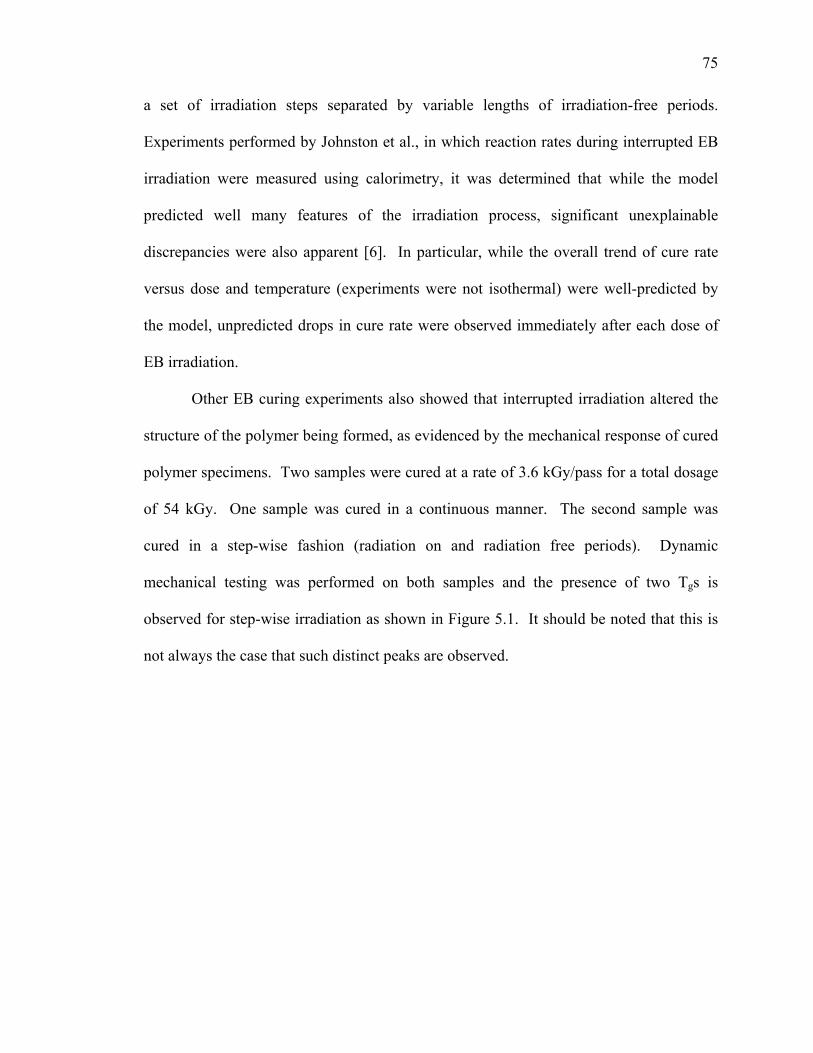
75
a set of irradiation steps separated by variable lengths of irradiation-free periods.
Experiments performed by Johnston et al., in which reaction rates during interrupted EB
irradiation were measured using calorimetry, it was determined that while the model
predicted well many features of the irradiation process, significant unexplainable
discrepancies were also apparent [6]. In particular, while the overall trend of cure rate
versus dose and temperature (experiments were not isothermal) were well-predicted by
the model, unpredicted drops in cure rate were observed immediately after each dose of
EB irradiation.
Other EB curing experiments also showed that interrupted irradiation altered the
structure of the polymer being formed, as evidenced by the mechanical response of cured
polymer specimens. Two samples were cured at a rate of 3.6 kGy/pass for a total dosage
of 54 kGy. One sample was cured in a continuous manner. The second sample was
cured in a step-wise fashion (radiation on and radiation free periods). Dynamic
mechanical testing was performed on both samples and the presence of two Tgs is
observed for step-wise irradiation as shown in Figure 5.1. It should be noted that this is
not always the case that such distinct peaks are observed.
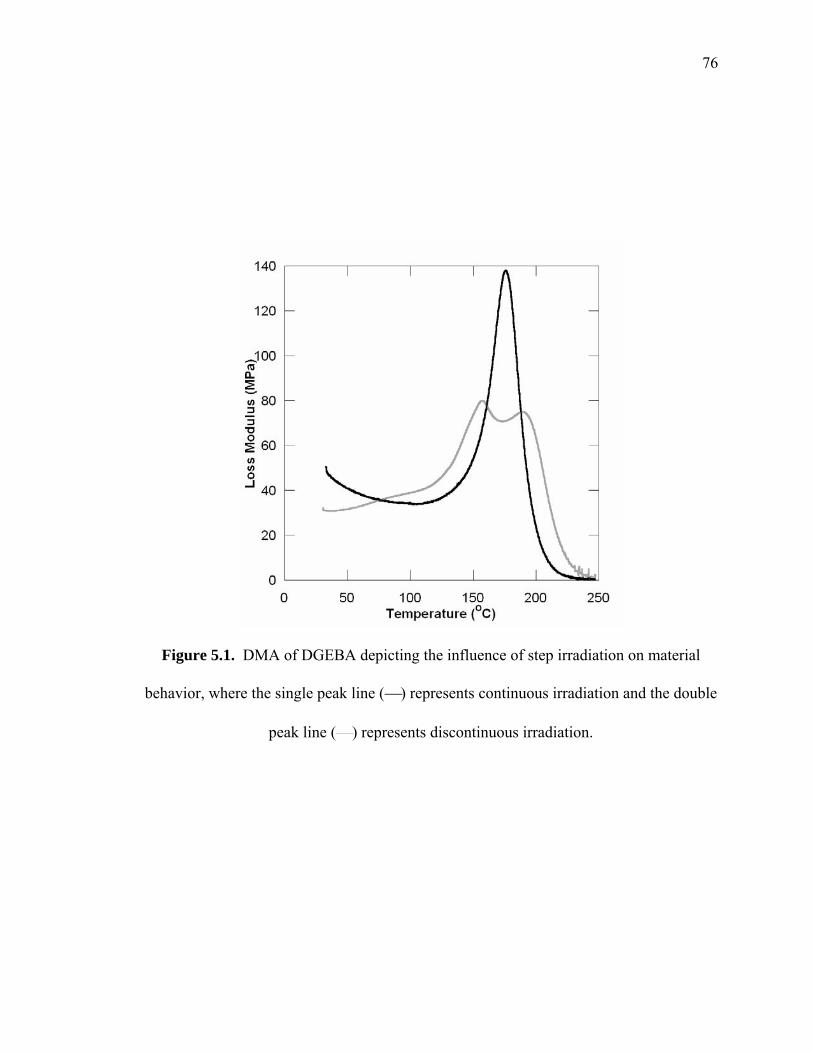
76
Figure 5.1. DMA of DGEBA depicting the influence of step irradiation on material
behavior, where the single peak line (⎯) represents continuous irradiation and the double
peak line (⎯) represents discontinuous irradiation.
77
The continuously irradiated sample showed a “typical” result obtained for such
curing, showing a single loss modulus peak with Tg of 180°C. The step-irradiation
sample resulted in a double peak with Tgs of 160°C and 190°C, which indicates the
possible formation of two different network structures and a phase separation of the resin
during the cure process. Since pre-preg composites would in practice typically is cured
in a step-wise fashion, the formation of several network structures is of concern. In this
study we investigate dark reactions (i.e. post-irradiation) using the developed NIR fiber
optic technique to evaluate the kinetics of active center deactivation and potential impacts
that this might have on typical cure processing of composite materials.
5.2. Experimental
5.2.1. Materials
Two different epoxy resins, Miller-Stephenson Epon-825 and Aldrich Chemical
Company phenyl glycidyl ether (PGE) epoxy resin, were cured using Applied Poleramic
Inc. CD1012 (diphenyl iodonium hexafluoroantimonate) photo-initiator in this
investigation. The chemical structures of these compounds are shown in Table 5.1.
Epon-825 is diglycidyl ether of bisphenol A (DGEBA) resin with an average molecular
weight of 354 g/mol. PGE is the mono-functional analog of DGEBA with a molecular
weight of 150 g/mol. Reactants were dried using 4Å molecular sieves (Aldrich Chemical
Company, Inc) to make “dry” epoxy. The sieves were dried at 120°C for 12 hours prior
to use. Such drying limits water concentration to below 0.1% in the reactants where
previous communications found water to alter cure behavior of epoxies [4, 10]. The ratio
of CD1012 photo-initiator to epoxy resin considered is 1 parts per hundred (1pph).
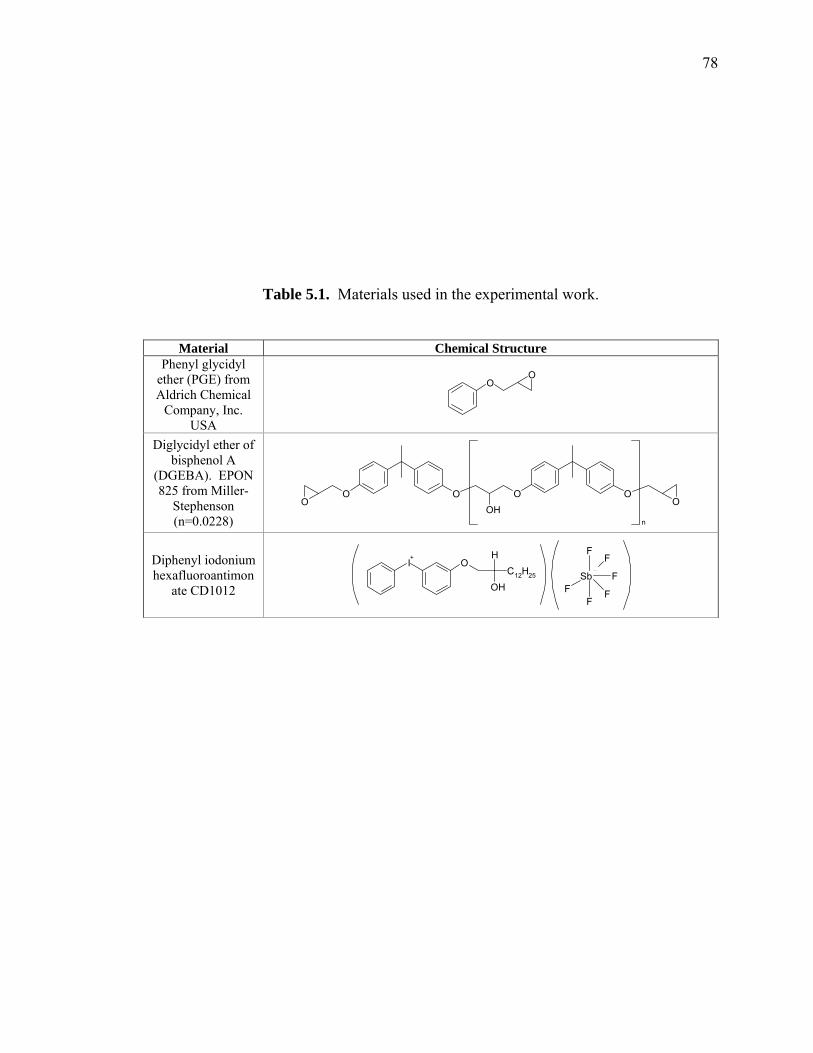
78
Table 5.1. Materials used in the experimental work.
Material Chemical Structure Phenyl glycidyl
ether (PGE) from Aldrich Chemical
Company, Inc. USA
OO
Diglycidyl ether of bisphenol A
(DGEBA). EPON 825 from Miller-
Stephenson (n=0.0228)
OOO O
OHO O
n
Diphenyl iodonium hexafluoroantimon
ate CD1012
I+
OH
OHC12H25
Sb
F
F
F
F
FF
79
5.2.2. Fiber Optic Near IR Spectroscopy
The spectral analysis performed in this work was based on a near infrared
spectroscopy technique described in Chapter 3. Samples were placed in sealed glass
tubes (1.6 mm ID, and 3.0 mm OD) to prevent water absorption from the environment
prior to and during cure [4]. The advantage of this design is that measurements of
radiation-induced cure could be performed without exposing the spectrometer to harsh
radiation environments.
5.2.3. Calorimetry
Epoxy cure rate data during irradiation was also collected using an in-situ
calorimetry-based technique [11, 12]. In the standard design (shown in Figure 5.3), up to
eight removable cylindrical blocks of low-density (64 kg/m3) insulating foam (OD = 80
mm) are mounted on a wooden base via small dowels. Within each of the blocks is
inserted a 1 mL polypropylene syringe (OD = 6.64 mm, ID = 4.64 mm), filled with either
pre-cured or uncured resin. The uncured specimens are used to determine cure rate,
while the pre-cured specimens are used as “references” and their temperature rise during
irradiation is used to calculate dose rate. Each syringe has embedded in it a 30 gauge K-
type thermocouple placed as close as possible to the geometric center of the syringe.
For cure trials, the calorimeter is either passed back-and-forth in front of an
accelerator electron beam, or held steady in front of the beam for the entire radiation
process (which was done in the experiments described here). Using the back-and-forth
process, up to 4 specimens can be tested at once, which allows 4 reference specimens to
be used to calculate dose rate with time. For this work, only a single reference specimen
and a single curing specimen were tested during each experiment.
80
Temperatures measured during irradiation by the embedded thermocouples are
acquired by a computer-based data acquisition system. A finite-difference based
analytical model then uses this data to calculate the energy absorbed by the calorimeter
from the impinging electrons and the exothermic energy generated by the reaction of the
curing resin. These values are in turn used to determine the EB dose rate and the resin
cure rate. Material parameters related to heat transfer were determined in experiments
performed with preheated reference samples. These calorimetric experiments were
performed by Andrew Johnston in parallel with NIR experiments.
5.2.4. Sample Preparation and Irradiation
The epoxy resin with 1pph CD1012 were mixed together and allowed to
equilibrate at 50 °C for NIR experiments. After approximately 30 minutes, when the
mixed samples appeared clear such that the initiator has dissolved, the mixture was taken
out of the oven. The resin sample is housed in a sealed glass tube inserted into an
aluminum block equipped with cartridge heaters for temperature control. These cure
experiments were conducted at 50°C.
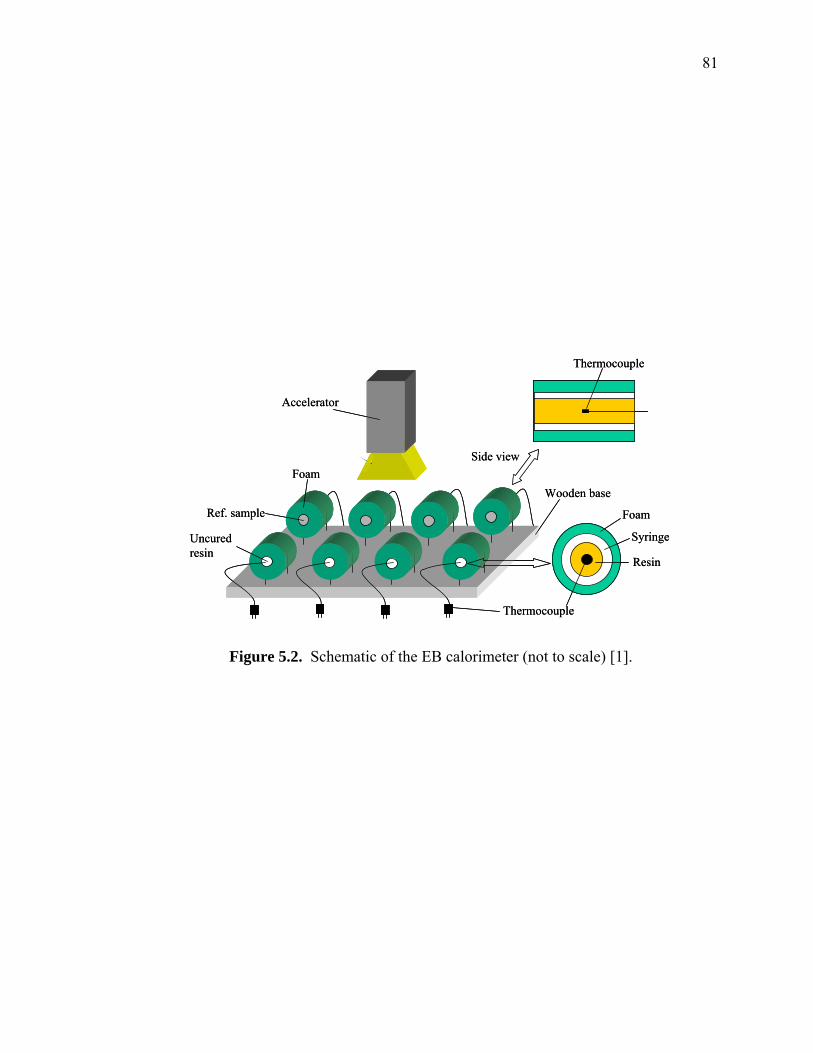
81
Syringe
Resin
Thermocouple
Accelerator
Electron beam
Ref. sample
Uncured resin
Foam
FoamWooden base
Side view
Thermocouple
Syringe
Resin
Thermocouple
Accelerator
Electron beam
Ref. sample
Uncured resin
Foam
FoamWooden base
Side view
Thermocouple
Figure 5.2. Schematic of the EB calorimeter (not to scale) [1].
82
Samples for calorimetry experiments were prepared in a similar fashion except
that 3 pph CD1012 photoinitiator was used (with DGEBA in all cases described here).
After mixing and heating, resin samples were drawn into the mentioned 1 mL syringes,
which were then sealed, covered with aluminum foil to prevent UV irradiation, then
placed into sealed plastic bags to prevent moisture absorption. Immediately prior to cure,
the syringes were removed from the sealed bags, unwrapped, and placed into the
calorimeter foam blocks. The foam block and specimens were then allowed to come to
thermal equilibrium at the starting test temperature, which was measured to be near 20 °C
for all tests described herein.
EB cure experiments were performed at the University of Dayton Research
Institute Laboratory for Research on Electron Beam Curing of Composites. The EB
machine is a 3 MeV EB accelerator specifically designed for irradiating samples in a
controlled manner. For NIR experiments, irradiation settings were kept constant as
follows: 25 pulses/second, 60% scan width, 150 mA/pulse, and 5.5 kGy/min and
different samples were irradiated for 450, 250s, 200s, 150s, and 100s. For the
calorimetry experiments, the number of pulses per second was adjusted to deliver
irradiation at average dose rates of between 2.4 kGy/min and 24 kGy/min. During each
test, radiation was delivered in a series of discrete doses of roughly 1.0 to 2.0 kGy,
between which the beam was turned off for various periods of up to 300s. In all cases,
temperatures from all embedded calorimeter thermocouples were acquired at intervals of
0.2 s and stored for later processing.
83
EB cure experiments were also conducted using DGEBA to make resin plaques
for mechanical property testing. Dry DGEBA plaques containing 1 pph of photo-initiator
were polymerized using either continuous or discontinuous irradiation. In both cases, a
total of 54 kGy of irradiation was applied at a rate of 5.5 kGy/min, either in one
continuous does or during 15 passes of 3.6 kGy/dose. To control the reaction exotherm,
the 2 mm thick samples were placed on an aluminum plate and chilled by ice water
keeping all experiments under 10°C. The resin plaques were then subjected to a 2-hour
thermal post-cure at 130°C.
5.3. Results and discussion
There is a lack of understanding of the link between processing parameters and
the resulting properties of the material formed during cure. Many processes requiring
radiation cure of composites are conducted with stepped doses in which the part is
subjected to a number of cycles comprised of “radiation on” and “radiation off”
segments. This section of the chapter addresses the influence of dose rate, time, and the
associated total dose on the cure kinetics and performance of epoxy systems. The first
part of this work used the NIR technique to evaluate cure during and after irradiation.
The second part of this work focuses on the kinetics after the radiation has been removed
to understand the fate of active centers responsible for the polymerization. The third part
of this work is to investigate the life time of active centers and the rate of deactivation.
The final part of this work reevaluates past calorimetry data.
84
5.3.1. Interrupted EB Irradiation
A series of PGE samples were prepared using 1pph photo-initiator and placed into
the capillary tube as described in the procedure section. Typically a hermetically sealed
sample was placed in the sample holder and heated to 50°C. It was found that 2 minutes
were sufficient to reach thermal equilibrium; thus samples were held for 2-5 minutes
before the start of irradiation. During this time proper alignment of the sample was
ensured by maximizing the peak height at 2209 nm corresponding to the oxirane ring. A
series of experiments was conducted in which the dose rate was held constant but the
time of irradiation was varied between 100 s and 500 s. The dose rate was 5.5 kGy/min
and the total dosage thus varied from 9.2 kGy to 45.8 kGy. Spectra were collected every
0.134s for a period of 500s in each experiment thus capturing changes in composition
before and after the EB was turned off. The results of these experiments are plotted in
Figure 5.3. In these plots epoxy concentration data is plotted every ten seconds and the
times when the EB radiation was turned off are noted. These data were obtained by
measuring the peak height at 2209 nm for given time and normalizing it by the initial
peak height before EB exposure. Previous work demonstrated that this ratio also
represents M/M0, where M is PGE concentration as function of time and M0 is the initial
PGE concentration [11, 12].
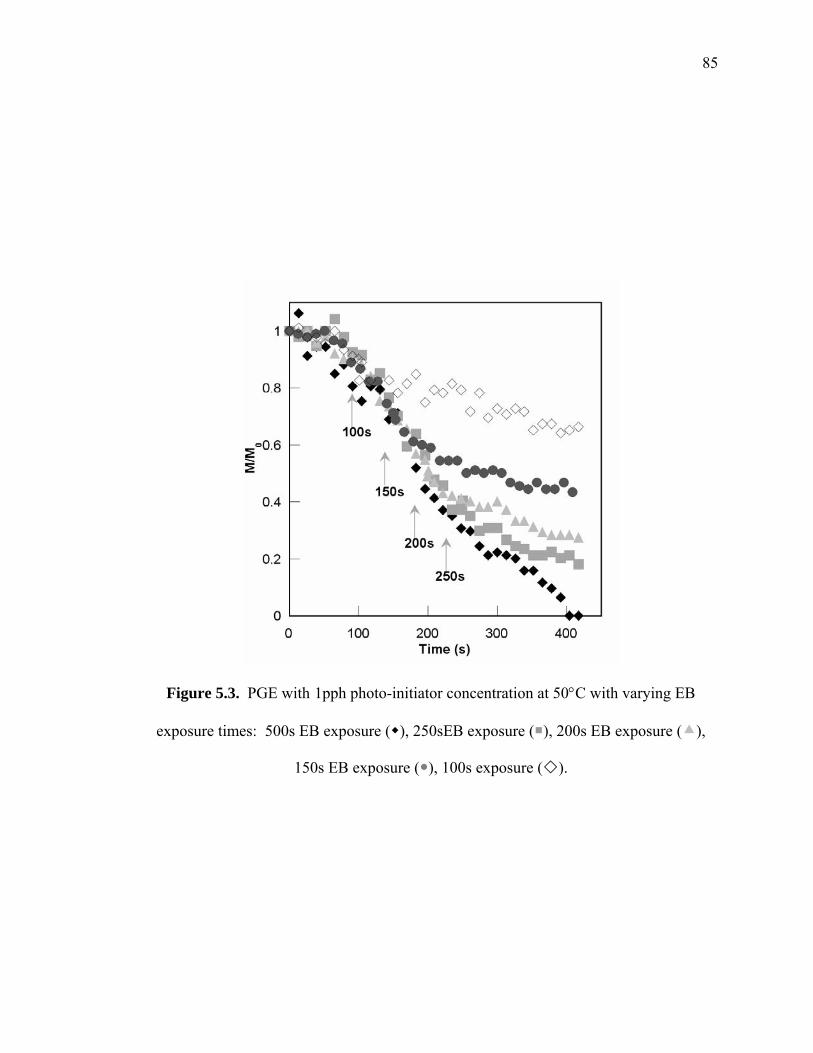
85
Figure 5.3. PGE with 1pph photo-initiator concentration at 50°C with varying EB
exposure times: 500s EB exposure ( ), 250sEB exposure ( ), 200s EB exposure ( ),
150s EB exposure ( ), 100s exposure ( ).
86
The radiation exposure times used were 100 s, 150 s, 200 s, and 250 s and 500 s. The
sample exposed for 500 s ( ) reached complete conversion. In all cases, the data
collected for the other runs matches the 500 s run closely until the time that the EB was
turned off. Upon the cessation of EB exposure the rate of change of epoxy concentration
decreases significantly in all cases. A decrease in rate would be expected since additional
active centers capable of promoting polymerization are no longer being generated. The
data collected from the sample irradiated for 500 s reached complete cure and could be
analyzed on the basis of the Mascioni Model developed for continuous irradiation. In
this model the initiation reaction is assumed to be first order with respect to the
concentration of photo-initiator. Since active centers are assumed not to deactivate, the
active center concentration is given by Equation 5.2, where C0 is the initial photo-initiator
concentration and ki is the initiation rate constant that was found to depend linearly on
dose rate.
( )tkiCI −−⋅= exp10 (5.2)
In this model the polymerization reaction was represented as a second order rate
expression given by Equation 5.3 where M is the concentration of monomers, kp is rate of
polymerization.
IMkdt
dMp ⋅⋅−= (5.3)
Integration of Equation 5.4 yields the following expression relating dimensionless epoxy
concentration to time.
( )⎥⎦
⎤⎢⎣
⎡−⋅⋅+⋅⋅−= ⋅− tk
i
pp
iCkk
tCkMM exp1exp 00
0 (5.4)
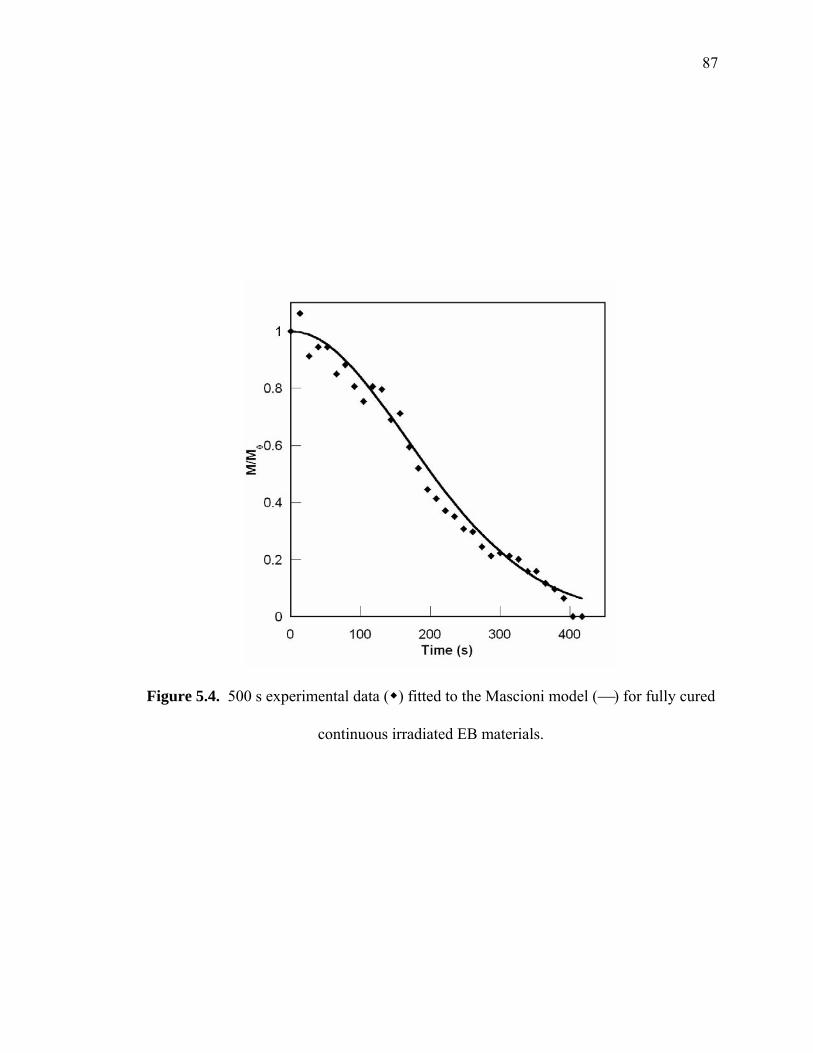
87
Figure 5.4. 500 s experimental data ( ) fitted to the Mascioni model (⎯) for fully cured
continuous irradiated EB materials.
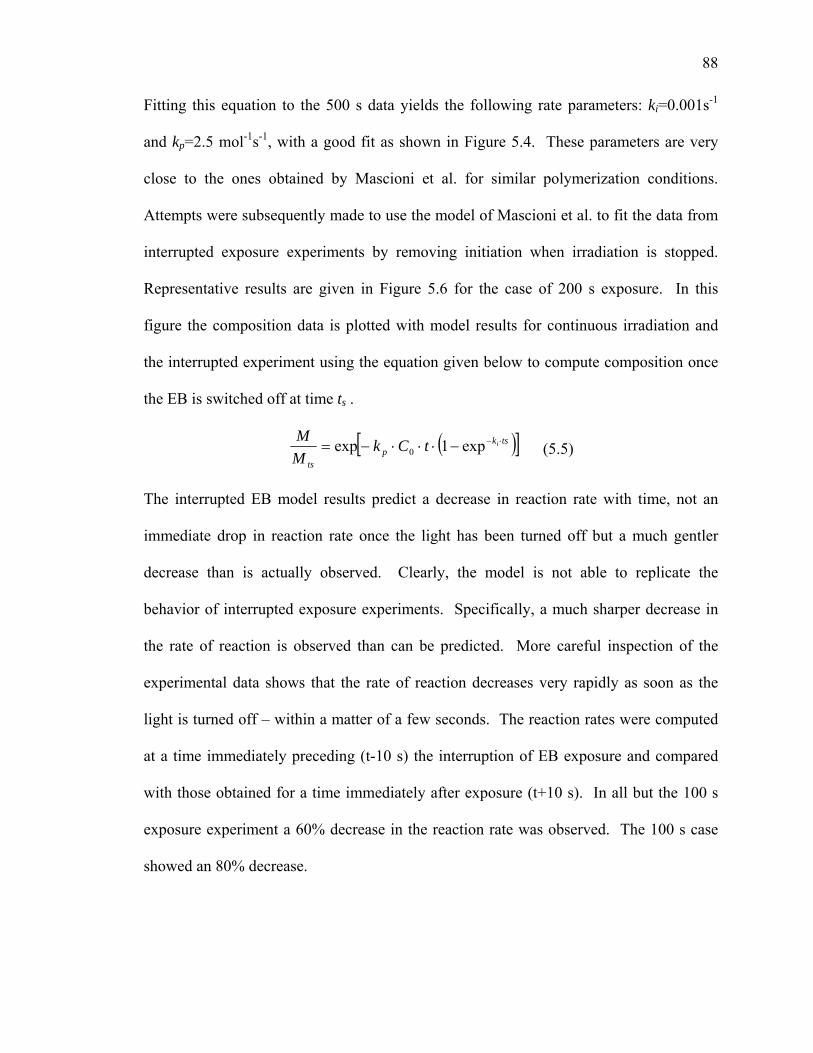
88
Fitting this equation to the 500 s data yields the following rate parameters: ki=0.001s-1
and kp=2.5 mol-1s-1, with a good fit as shown in Figure 5.4. These parameters are very
close to the ones obtained by Mascioni et al. for similar polymerization conditions.
Attempts were subsequently made to use the model of Mascioni et al. to fit the data from
interrupted exposure experiments by removing initiation when irradiation is stopped.
Representative results are given in Figure 5.6 for the case of 200 s exposure. In this
figure the composition data is plotted with model results for continuous irradiation and
the interrupted experiment using the equation given below to compute composition once
the EB is switched off at time ts .
( )[ ]tskp
ts
itCkMM ⋅−−⋅⋅⋅−= exp1exp 0 (5.5)
The interrupted EB model results predict a decrease in reaction rate with time, not an
immediate drop in reaction rate once the light has been turned off but a much gentler
decrease than is actually observed. Clearly, the model is not able to replicate the
behavior of interrupted exposure experiments. Specifically, a much sharper decrease in
the rate of reaction is observed than can be predicted. More careful inspection of the
experimental data shows that the rate of reaction decreases very rapidly as soon as the
light is turned off – within a matter of a few seconds. The reaction rates were computed
at a time immediately preceding (t-10 s) the interruption of EB exposure and compared
with those obtained for a time immediately after exposure (t+10 s). In all but the 100 s
exposure experiment a 60% decrease in the reaction rate was observed. The 100 s case
showed an 80% decrease.
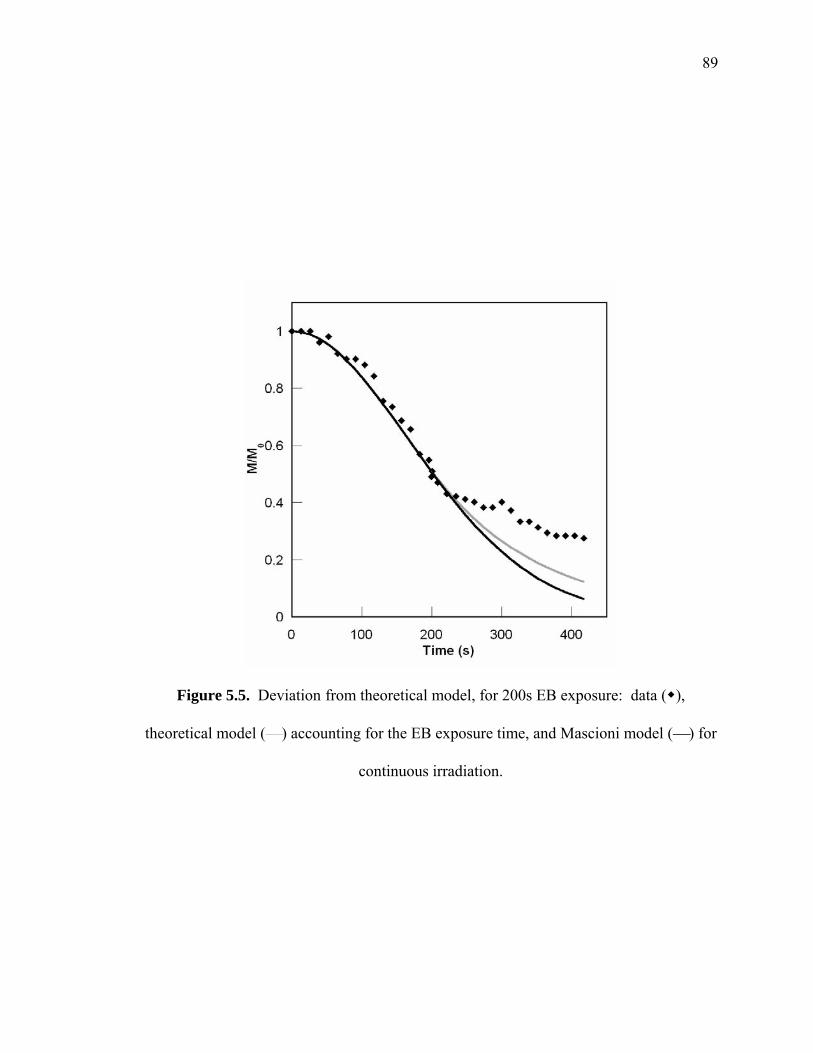
89
Figure 5.5. Deviation from theoretical model, for 200s EB exposure: data ( ),
theoretical model (⎯) accounting for the EB exposure time, and Mascioni model (⎯) for
continuous irradiation.
90
The most likely sources for the observed drop in reaction rate are either a sudden
decrease in propagating center concentration or a rapid drop in temperature. The
potential of temperature effect was examined first. Due to the exothermic nature of this
polymerization significant exotherms can occur even with temperature control. This is
the case particularly for high dose rates where a change in temperature of up to 10ºC has
been observed. The reaction rate constant is strongly dependent on temperature. Using
the parameters for kp obtained by Mascioni et al. for the Arrhenius expression
( )RTEkk pp /exp0 −⋅= (5.6)
where R is the ideal gas law constant, T is reaction absolute temperature, E is 70.152
kJ/mol, and kpo is 2.027·1011 liter/(mol·s) a 60% decrease in kp would require a decrease
in temperature from 62 to 50ºC. It was found by testing the dynamic thermal behavior of
the sample holder, however, that to change the temperature inside the capillary by 10ºC
from 60 to 50ºC would require 48 s. This time scale is much greater than the time scale
associated with the sudden decrease in reaction rate observed after stopping EB exposure.
Thus it was concluded that the sharp decrease in reaction rate is not a result of a rapid
change in temperature but rather a result of a sharp decrease in the concentration or
reactivity of active centers. In the Mascioni model, it was assumed that there was no
diffusion limitation for continuous irradiation, but how it effected discontinuous
irradiation was unknown.
The experimental results also show that although there is a rapid decrease in the
rate of reaction following EB, the rate of reaction does not become 0, rather, a steady
decrease of epoxy concentration is observed. In fact all the samples evaluated showed
full conversion of epoxy when tested at a later date. A hypothesis that would explain this
91
behavior is that there are two classes of active centers; one with a short lifetime that
therefore exists primarily when the EB is on and another set that is long lived and allows
for continued propagation once the EB is turned off. However, the hypothesis of having
more than one active center is not supported by initiation studies. A second hypothesis is
that unlike the assumptions made in developing the Mascioni model, the reactivity of the
active center is dependent on growing polymer molecular weight. During irradiation
active centers are being formed that have short attached polymers, with time the active
polymer chain grows possibly forming a diffusion barrier around the active center.
Hence older active centers would demonstrate lower reactivity by nature of this shielding
effect. When the irradiation is interrupted all active centers age and the overall reactivity
is reduced. However, from the experimental data, Equation 5.5 can be empirically
modified to account for the sudden decrease in the rate of reaction. The slope of the
epoxy conversion before and after the light has been turned off can be used to account for
the decrease given in Equation 5.7.
before
after
tt
tt
mm
ttMMttMM
D =
−−−−
=
21
21
43
43
(5.7)
Mt1 and Mt2 is the M/M0 during irradiation, and Mt3 and Mt4 is after the light has been
turned off. Therefore the Equation 5.5 can be modified by this diffusion limitation D
shown in Equation 5.8.
( )[ ]Dtskp
ts
itCkMM ⋅⋅−−⋅⋅⋅−= exp1exp 0 (5.8)
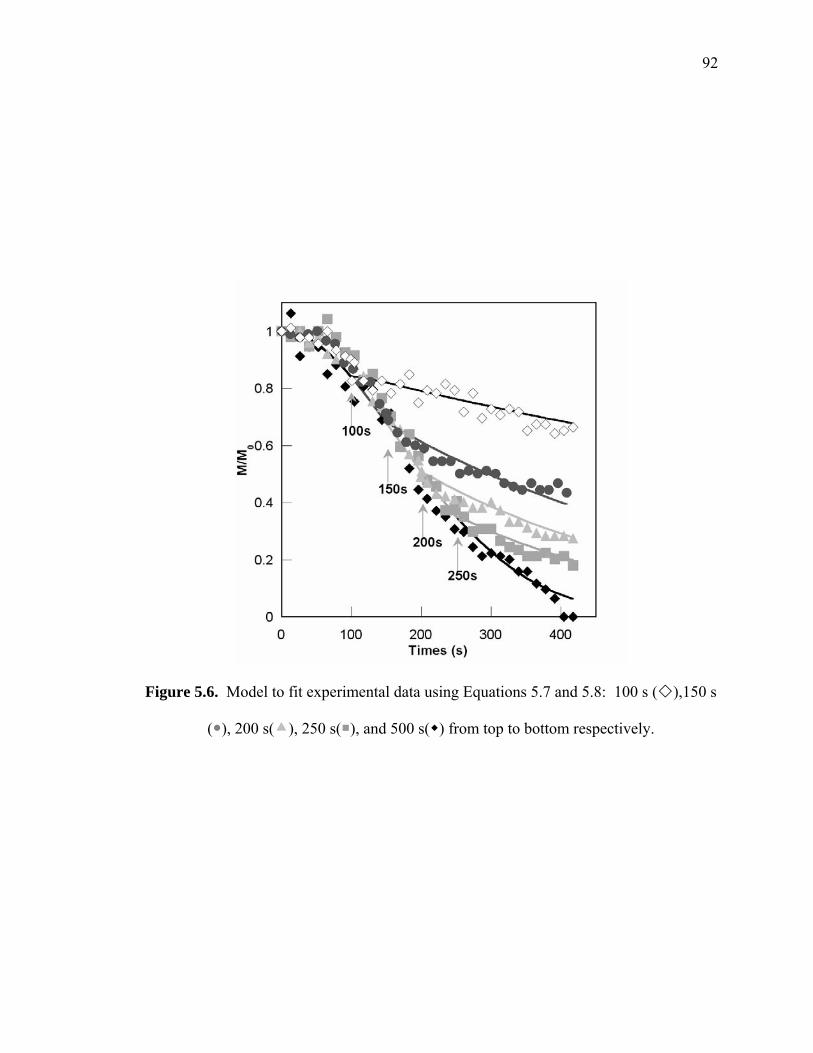
92
Figure 5.6. Model to fit experimental data using Equations 5.7 and 5.8: 100 s ( ),150 s
( ), 200 s( ), 250 s( ), and 500 s( ) from top to bottom respectively.
93
D was calculated for the different irradiations times and the best-fit curves are shown in
Figure 5.6 where D is 0.4 for the 250 s, 200 s, and 150 s exposure and 0.2 for the 100 s
EB exposure. These results are consistent with the measured changes of reaction rate at
the time the EB is shut off. Given the scatter in the NIR results the model appears to fit
the data reasonably well. It should be possible to relate the parameter D to the change in
overall reactivity.
5.4. Analysis of Dark Reactions
The long-term dark reaction data can be used to gain some insight into the
deactivation behavior of the active centers. By analyzing dark reaction behavior in UV
cured systems using similar photoinitiators, researchers have found the half-life of the
active centers to be on the order of 40 minutes [5, 6].
We analyze our dark reaction data based on the assumption that active center
concentration follows first order decay kinetics so that the concentration of active centers
is given by Equation 5.9:
( )tks
dII ⋅−⋅= exp (5.9)
In this equation Is is the concentration of active centers at time ts, computed using
Equation 5.9 and, kd is the first order deactivation rate constant. The rate of propagation
after ts is therefore given by Equation 5.10.
tkspp
dIMkRdt
dM −⋅⋅⋅−== exp (5.10)
Rearranging Equation 5.10 and taking its logarithm yields Equation 5.11 which can be
used to obtain kd as represented by the slope of the equation.
94
tkIkMR
dspp ⋅−⋅=⎟⎟
⎠
⎞⎜⎜⎝
⎛lnln (5.11)
Equation 5.11 was used to analyze the dark reaction data given in Figure 5.6 with the
exception of the 100 s data and the results are shown in Figure 5.7. The initial portion of
these curves has a slight negative slope or a slope close to 0. The associated kd values are
reported in Table 5.2. The sharp increase in kd as time increases is potentially a result of
diffusional limitations and associated trapping of active centers. These data, however,
show significant scatter suggesting that improvements in technique and additional
experiments are needed in order to obtain reliable quantification of the deactivation rate
constant. Nevertheless the results corroborate the contention that reactive sites exist
having long half-lives.
In addition to the abovementioned experiments a secondary assessment of the
deactivation rate constant for long-lived reactive centers was undertaken. Dried PGE was
fully cured by UV using 3 pph photo-initiator in a vial. The resulting polymer left in the
oven at 50°C. After two hours PGE was added to the vial at a 1:1 ratio and well mixed.
The conversion of epoxy was monitored using NIR. After 100 minutes, a significant
decrease in the epoxy peak corresponding to 14% conversion was observed. The data
from the first 100 minutes was used to obtain kd, which yielded a 233 min half life. This
result further supports the notion of living cationic polymerization in these systems.
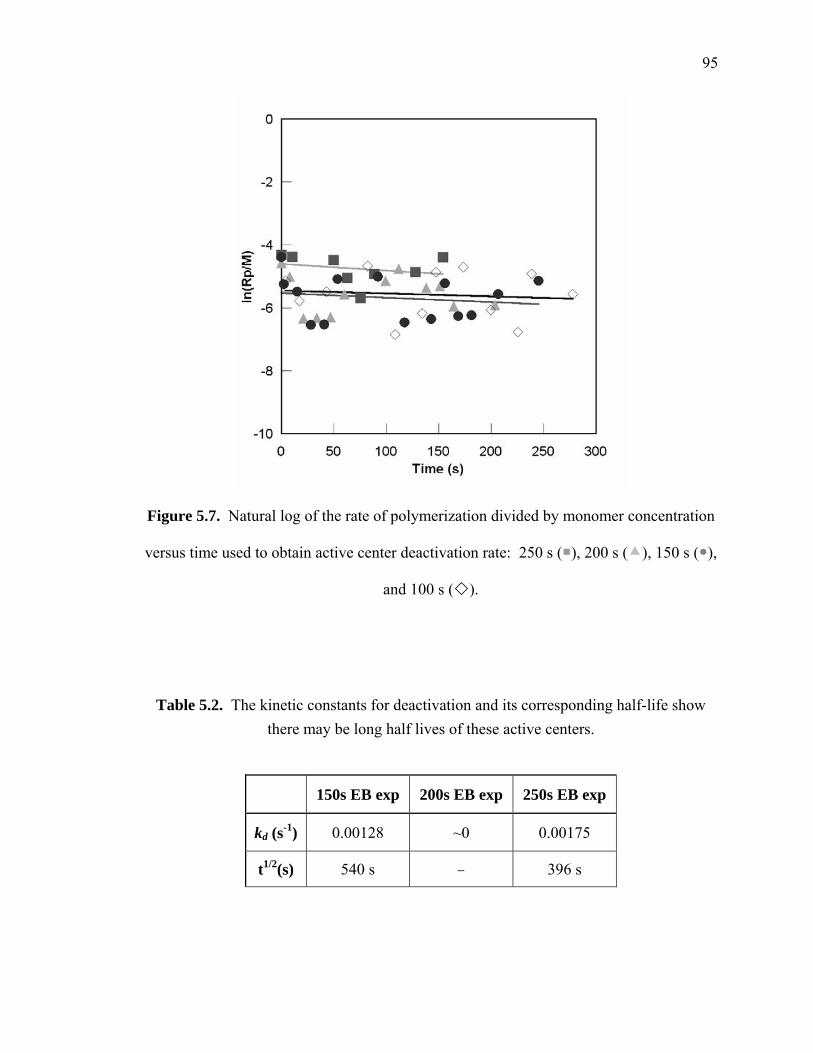
95
Figure 5.7. Natural log of the rate of polymerization divided by monomer concentration
versus time used to obtain active center deactivation rate: 250 s ( ), 200 s ( ), 150 s ( ),
and 100 s ( ).
Table 5.2. The kinetic constants for deactivation and its corresponding half-life show there may be long half lives of these active centers.
150s EB exp 200s EB exp 250s EB exp
kd (s-1) 0.00128 ~0 0.00175
t1/2(s) 540 s − 396 s
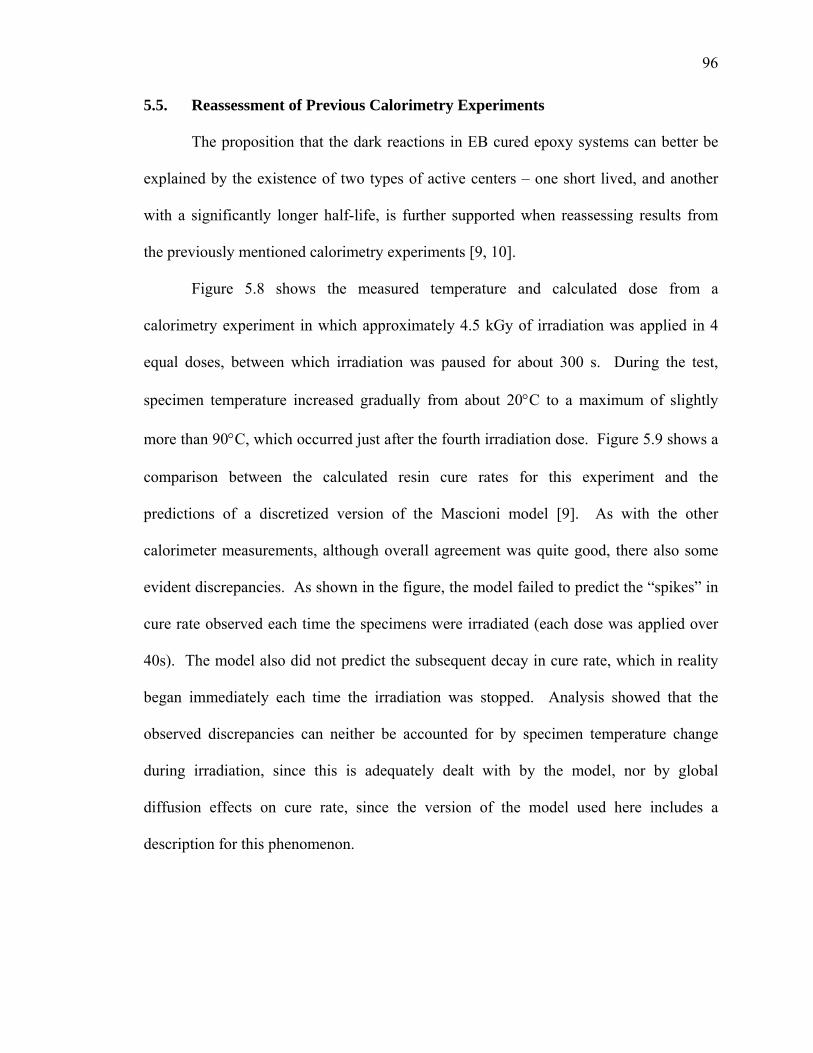
96
5.5. Reassessment of Previous Calorimetry Experiments
The proposition that the dark reactions in EB cured epoxy systems can better be
explained by the existence of two types of active centers – one short lived, and another
with a significantly longer half-life, is further supported when reassessing results from
the previously mentioned calorimetry experiments [9, 10].
Figure 5.8 shows the measured temperature and calculated dose from a
calorimetry experiment in which approximately 4.5 kGy of irradiation was applied in 4
equal doses, between which irradiation was paused for about 300 s. During the test,
specimen temperature increased gradually from about 20°C to a maximum of slightly
more than 90°C, which occurred just after the fourth irradiation dose. Figure 5.9 shows a
comparison between the calculated resin cure rates for this experiment and the
predictions of a discretized version of the Mascioni model [9]. As with the other
calorimeter measurements, although overall agreement was quite good, there also some
evident discrepancies. As shown in the figure, the model failed to predict the “spikes” in
cure rate observed each time the specimens were irradiated (each dose was applied over
40s). The model also did not predict the subsequent decay in cure rate, which in reality
began immediately each time the irradiation was stopped. Analysis showed that the
observed discrepancies can neither be accounted for by specimen temperature change
during irradiation, since this is adequately dealt with by the model, nor by global
diffusion effects on cure rate, since the version of the model used here includes a
description for this phenomenon.
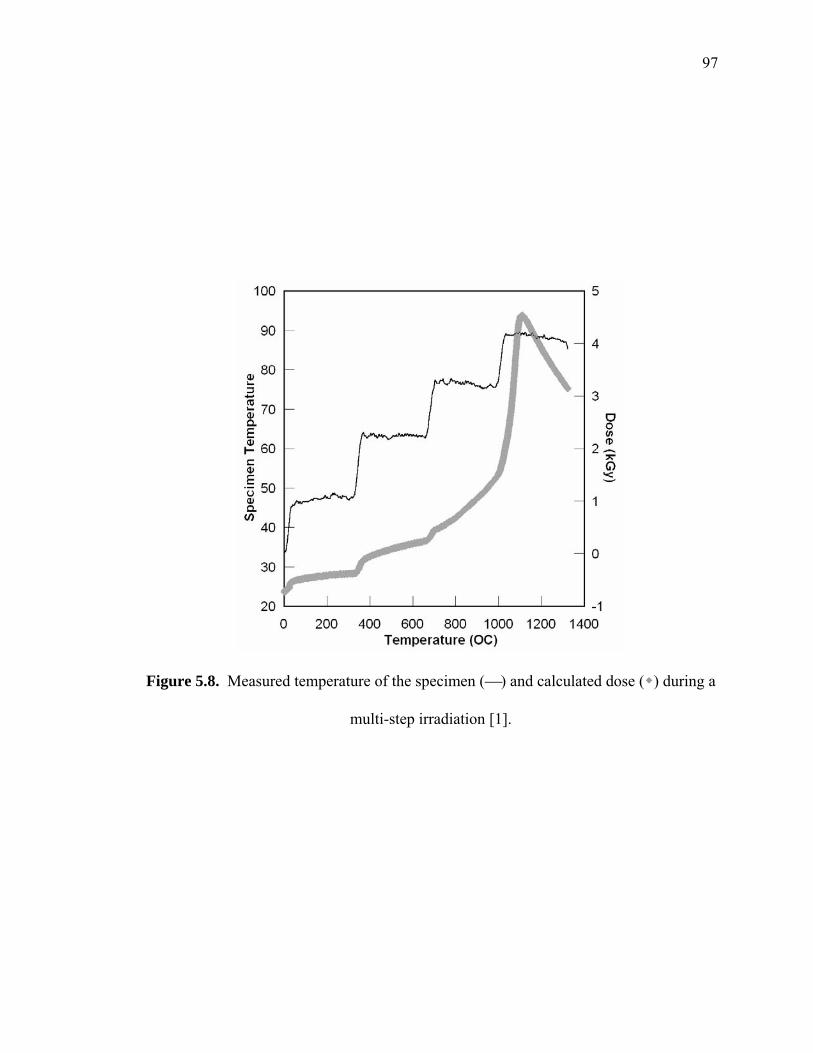
97
Figure 5.8. Measured temperature of the specimen (⎯) and calculated dose ( ) during a
multi-step irradiation [1].
98
Figure 5.9. Measured ( ) and predicted (⎯) cure rates during a multi-step irradiation –
single active center assumed (Masconi model) [1].
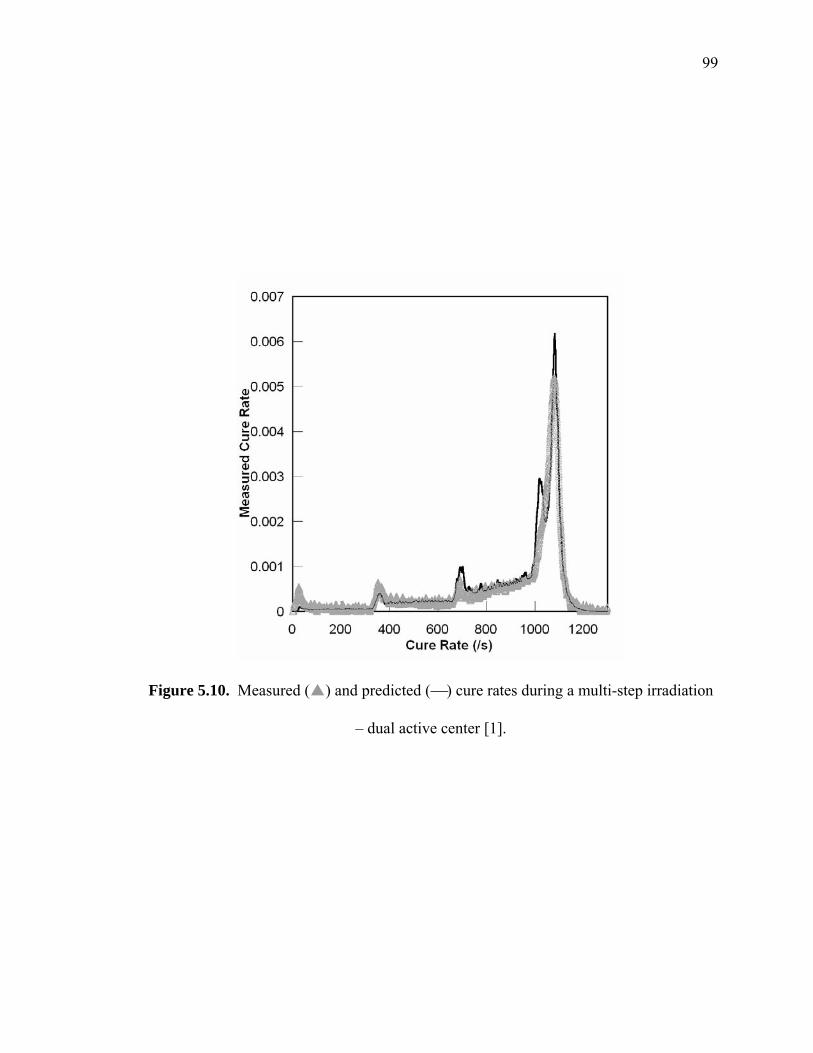
99
Figure 5.10. Measured ( ) and predicted (⎯) cure rates during a multi-step irradiation
– dual active center [1].
100
To establish whether a better fit with experimental results could be obtained using
a model assuming two active centers, one long-lived and one short-lived, a minor
modification was made to the Mascioni cure model. In the revised model, total active
center activation rate is kept the same as before, but two such centers are tracked; one
with a long life (arbitrarily set to 5s) and one with an infinite life. During irradiation,
both centers are assumed to contribute to the curing reaction, but upon halting irradiation,
the short-lived version quickly decays and the cure rate drops by 60%. Applying this
model to prediction of the calorimeter measurements (all other model parameters kept the
same as previously), we see from Figure 5.10 that much better qualitative and
quantitative agreement is obtained.
5.6. Conclusion
In this work, the light and dark reactions (i.e. those during and following
irradiation) of radiation-cured cured cationic epoxy systems using an in situ NIR fiber
optic technique to evaluate the kinetics of active center deactivation and potential impacts
that this might have on typical cure processing of composite materials were investigated.
Previous work focused on the cure behavior of such systems under continuous irradiation
(light reactions only). A successful model had been developed that assumed the time
scale for active center deactivation to be much greater than the characteristic time for
complete reaction. This assumption was based on literature values of deactivation
constants for similar systems and on the observation that polymerization continues to
occur many hours after epoxy samples are exposed to EB irradiation. However, in
practice, EB processing is usually not conducted in a continuous fashion but rather as a
set of irradiation steps separated by variable length irradiation free periods. Although the
101
model worked well for continuous EB exposure experiments, it was found that it did not
describe data from interrupted-dose experiments well. In particular, reaction rates during
dark reaction periods were over predicted. In this work conversion data for PGE was
obtained for the time period following EB irradiation for a number of exposure doses.
The key observations were: first, that the reaction persists for a long time after the
irradiation, and second, that there is a rapid decrease in the rate of reaction when the EB
is turned off. The sudden reduction in the rate of reaction is roughly 60% for the
conditions investigated at the time the EB is turned off. Long time dark polymerization
experiments show that the active centers possess a half-life greater than 100 minutes.
Using an empirical adjustment to a propagation model without initiation if was possible
to fit both NIR and calorimetry data well.
102
5.7. Reference
1. Lee J, Johnston A, Palmese GR. SAMPE Int Symp, (2004).
2. Mascioni M, Sands JM, Palmese GR. SAMPE Int Symp, 47 ,93 (2002).
3. Mascioni M, Sands JM, Palmese GR. Nuc Inst and Meth in Phys Res B, 208,
353-357 (2003).
4. Palmese GR, Stein G. SAMPE Int Symp, 48, (2003).
5. Sipani V, Scranton AB. J Polym Sci Part A: Polym Chem, 41, 2064 (2003).
6. Sipani V, Scranton AB. J Photochem and Photobio A: Chem, 159, 189 (2003).
7. Lopata ES,.Riccitiello SR. J Applied Poly Sci, 21, 91 (1977).
8. Crivello JV, Ortiz RA. J Polym Sci Part A: Polym Chem, 39, 2385 (2001).
9. Johnston A, Palmese GR, Cole KC, Petrescue L, Chen JH, Lopata V. Society of
Adv of Mat and Process Eng, (2003).
10. Lee J, Palmese GR, SAMPE Int Symp, (2005).
11. Chen JH, Johnston A, Petrescue L, Bordovsky L. Proceedings of 4th Canadian Int
Conf on Comp Mat, (2003).
12. Chen JH, Johnston A, Petrescue L, Hojjati M. Rad Phys and Chem, 75, 336-349
(2006).
13. Rohr DF, Klein MT. Center for Comp Mats Rep, 87-44 (1987).
103
CHAPTER 6: PROPERTIES OF TRIGLYCIDYL ETHER OF
TRISPHENOL-METHANE (TACTIX 742)
6.1. Introduction
In selecting a thermoset resin, one must consider properties such as tensile
strength, modulus, and glass transition temperature, material availability, ease of
processing, and cost. Epoxy resins such as DGEBA used throughout this work provides a
unique balance of chemical and mechanical properties combined with extreme processing
versatility. However, there are limitations in tailoring the network of DGEBA to satisfy
particular requirements which will be discussed in a later chapter. Tactix 742 is a
trifunctional epoxy that can provide improved properties. This chapter investigates the
improvements Tactix 742 can provide to optimize mechanical properties in our DGEBA
system.
6.2. Materials
The chemical structures of materials used in this investigation are given in Table
6.1. The difunctional epoxy used in this study was diglycidyl ether of bisphenol A
(DGEBA) (Resolution Epon 825). Water was removed from DGEBA using 4Å
molecular sieves (Aldrich Chemical Company, Inc) conditioned at 120°C for 12 hours
prior to use. Such drying limits water concentration to below 0.1% in the DGEBA. The
trifunctional epoxy used was triglycidyl ether of trisphenol-methane (Ciba Tactix 742).
Unlike DGEBA, Tactix 742 is considered to be in a solid state in room temperature.
However due to it’s viscosity, it must be frozen to be transfered and then heated to be
mixed into the system. Diphenyl iodonium hexafluoroantimonate (Applied Poleramics
CD1012) was used as the photoinitiator.
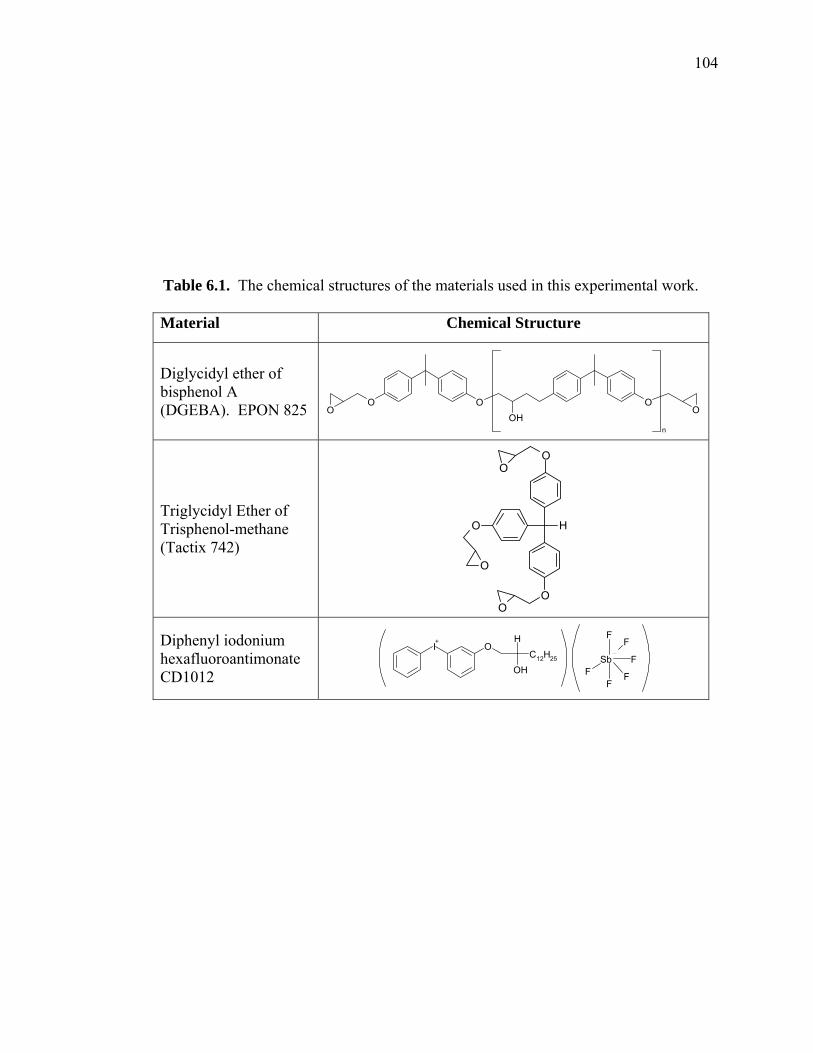
104
Table 6.1. The chemical structures of the materials used in this experimental work.
Material Chemical Structure
Diglycidyl ether of bisphenol A (DGEBA). EPON 825 OO
O OOH
O
n
Triglycidyl Ether of Trisphenol-methane (Tactix 742)
O
O
OO
H
O
O
Diphenyl iodonium hexafluoroantimonate CD1012
I+
OH
OHC12H25
Sb
F
F
F
F
FF
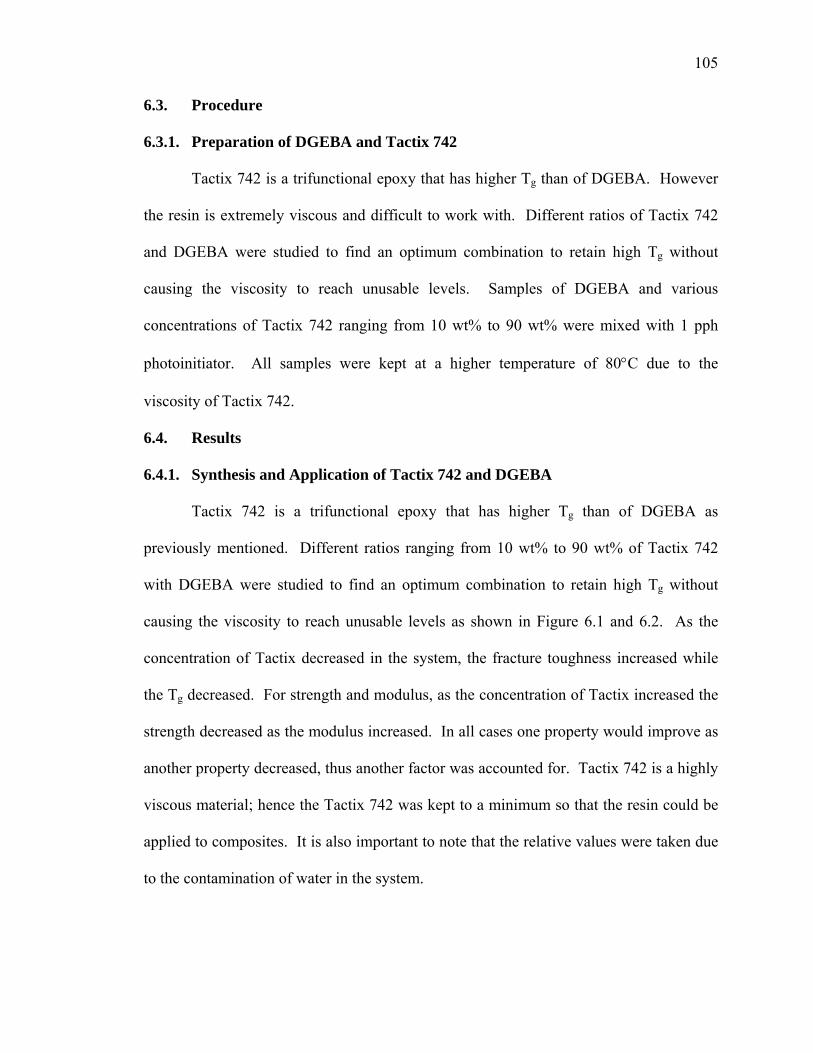
105
6.3. Procedure
6.3.1. Preparation of DGEBA and Tactix 742
Tactix 742 is a trifunctional epoxy that has higher Tg than of DGEBA. However
the resin is extremely viscous and difficult to work with. Different ratios of Tactix 742
and DGEBA were studied to find an optimum combination to retain high Tg without
causing the viscosity to reach unusable levels. Samples of DGEBA and various
concentrations of Tactix 742 ranging from 10 wt% to 90 wt% were mixed with 1 pph
photoinitiator. All samples were kept at a higher temperature of 80°C due to the
viscosity of Tactix 742.
6.4. Results
6.4.1. Synthesis and Application of Tactix 742 and DGEBA
Tactix 742 is a trifunctional epoxy that has higher Tg than of DGEBA as
previously mentioned. Different ratios ranging from 10 wt% to 90 wt% of Tactix 742
with DGEBA were studied to find an optimum combination to retain high Tg without
causing the viscosity to reach unusable levels as shown in Figure 6.1 and 6.2. As the
concentration of Tactix decreased in the system, the fracture toughness increased while
the Tg decreased. For strength and modulus, as the concentration of Tactix increased the
strength decreased as the modulus increased. In all cases one property would improve as
another property decreased, thus another factor was accounted for. Tactix 742 is a highly
viscous material; hence the Tactix 742 was kept to a minimum so that the resin could be
applied to composites. It is also important to note that the relative values were taken due
to the contamination of water in the system.
106
Figure 6.1. Various ratios of Tactix 742 and DGEBA were made and cured via EB and
tested for fracture toughness ( ) and Tg ( ). With increasing amounts of Tactix 742
fracture toughness decreases, the glass transition temperature increases.
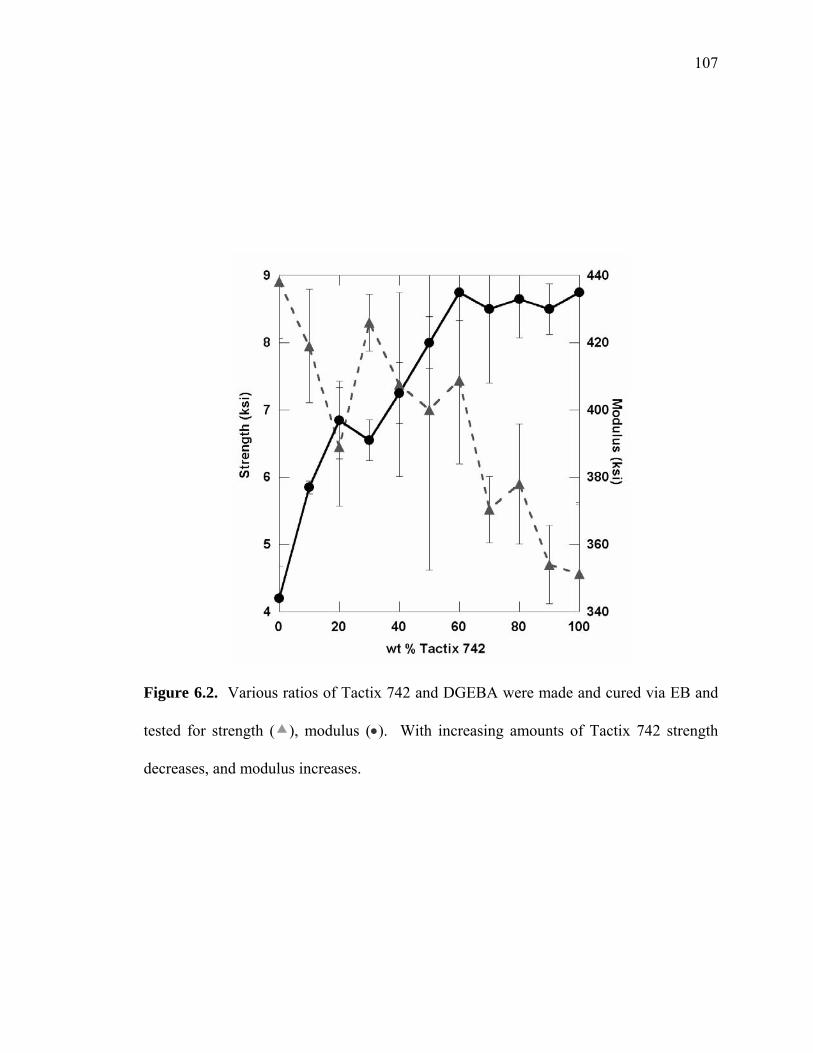
107
Figure 6.2. Various ratios of Tactix 742 and DGEBA were made and cured via EB and
tested for strength ( ), modulus (•). With increasing amounts of Tactix 742 strength
decreases, and modulus increases.
108
6.5. Conclusion
Various concentrations of Tactix 742 were mixed with DGEBA to find the
optimum material properties. Between 20 wt% and 40 wt% of Tactix 742 in DGEBA
seemed to result in the best balance of properties. However, due to the viscosity of
Tactix 742, 40 wt% would be difficult to process into a composite.
6.6. Reference
1. Dabestani R, Ivanov I. SAMPE Int Symp, 46, 2075 (2001).
109
CHAPTER 7: IMPROVED EB CURED DGEBA SYSTEMS BY
COPOLYMERIZATION WITH NOVEL TETRAHYDROFURAN FUNCTIONAL
COMONOMERS
7.1. Introduction
As discussed in previous chapters, electron beam (EB) cured epoxy-matrix
composites have significant processing advantages over their thermally cured
counterparts, but suffer from low compressive strength and poor interlaminar shear
strength [1-10]. One reason for this is that cationically cured DGEBA possesses poor
fracture toughness when compared with amine or anhydride cured DGEBA systems. The
focus of this chapter is to design improved EB cured DGEBA systems by modification
with appropriate chain extenders designed to impart the appropriate level of network
flexibility while maintaining glass transition temperature requirements. This is shown
schematically in Figure 7.1 where tailoring the network is accomplished by
copolymerization with other monomers that increase the molecular weight between
crosslinks. This method also allows for varying chain flexibility to adjust material
properties by changing the monomer type.
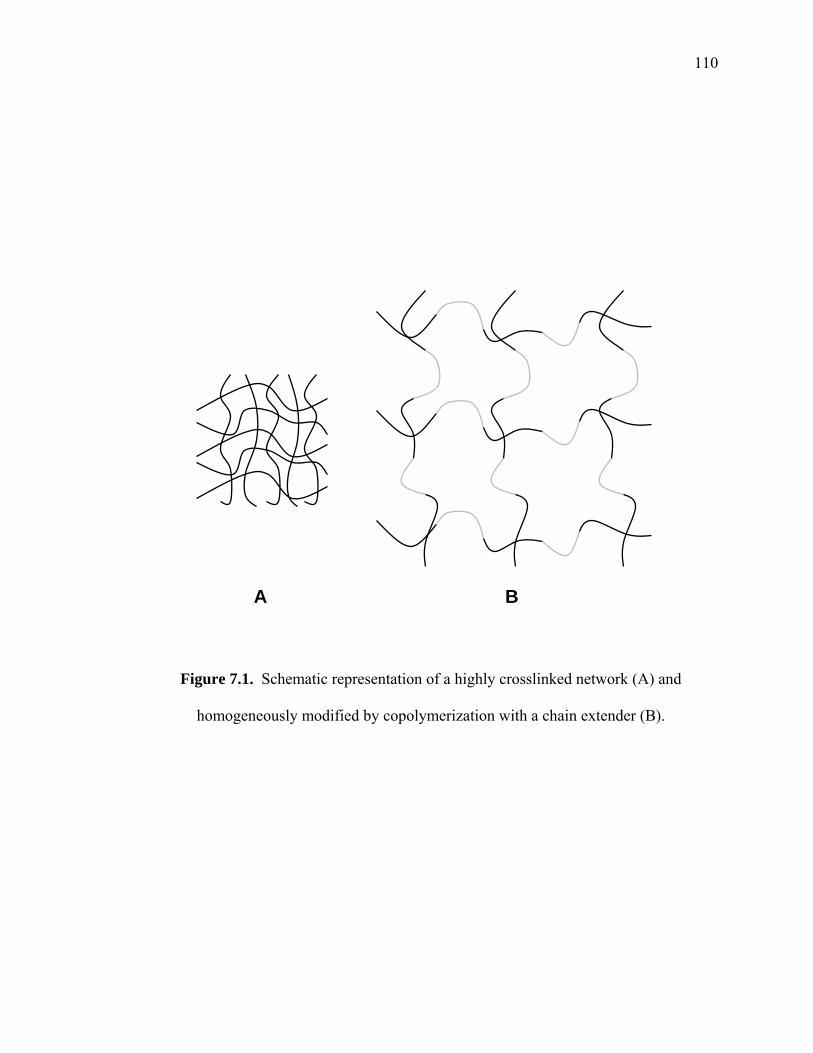
110
Figure 7.1. Schematic representation of a highly crosslinked network (A) and
homogeneously modified by copolymerization with a chain extender (B).
A B
111
In previous work, Ghosh et al. investigated factors influencing the polymerization
of epoxy resins and found that hydroxyl groups, specifically alcohols, can play an
important role in the polymerization of epoxies. Alcohols with –OH groups positioned
on different carbon atoms of the chain (primary, secondary, and tertiary) were studied to
determine their influence on the network formation of DGEBA via cationic
polymerization. Ghosh et al. concluded that the intrinsic reactivity of alcoholic species
with the active center relative to that of a glycidyl ether moiety with active centers
changed the degree to which the network structure was disrupted. This showed that the
potential exists to tailor epoxy network formation in such systems by introducing
specifically designed comonomers with appropriate –OH functionality [10].
In Chapter 5, the influence of water on DGEBA cationic polymerization induced
by EB and found that the addition of water affects the cure behavior of DGEBA and the
formation of the network structure. In such cases an initial retardation period followed
by acceleration in the epoxy conversion was observed. Increased concentrations of water
caused longer delays and increased epoxy conversion. Consumption of water during the
polymerization indicated that the resulting network structure was altered. The addition of
water decreased the glass transition temperature significantly from ~190°C for “dry”
epoxy to values as low as 170°C for systems modified with 1 wt% water. This decrease
in Tg was accompanied by a modest increase of fracture toughness from a G1C of 56 J/m2
for the “dry” system to a G1C ~140 J/m2 for the material modified with water. These
results suggest that the increase of G1C resulted from the decrease of cross-link density
associated with chain transfer reactions with water [19]. The objective of this Chapter is
to discuss the design of improved EB cured epoxy systems based on diglycidyl ether of
112
bisphenol A (DGEBA) by the use of network modifiers.
7.2. Experimental
7.2.1. Materials
The chemical structures of materials used in this investigation are given in Table
7.1. These include the materials used to synthesize THF functional comonomers.
Diglycidyl ether of bisphenol A (DGEBA) (Resolution Epon 825) was used in this
investigation. Water was removed from this material using 4Å molecular sieves
(Aldrich) conditioned at 120°C for 12 hours prior to use. Such drying limits water
concentration to below 0.1% in the DGEBA. Diphenyl iodonium hexafluoroantimonate
(Applied Poleramics CD1012) was used as the photoinitiator.
Phenyl glycidyl ether (PGE) obtained from Aldrich (99.0%) was treated the same
as DGEBA. The chain extender tetrahydrofuran (THF) was obtained from Aldrich
(≥99.0%, H2O <0.05%; inhibited with 250 ppm butylated hydroxytoluene) and was also
dried using molecular sieves. The other chain extenters were purchased from Aldrich,
cyclohexene oxide (CHO) (98.0%), phthalan was (99.0%), 2,3-dihydrobenzofuran
(Coumaran) (99.0%). Tetrahydro-2-furoic acid (Aldrich: 97%; inhibited with 250 ppm
butylated hydroxytoluene) was used to synthesize difunctional and trifunctional chain
extending comonomers based on the esterification reaction with DGEBA and triglycidyl
ether of trisphenol-methane (Tactix 742) respectively. The esterification procedure is
described in section 7.3.
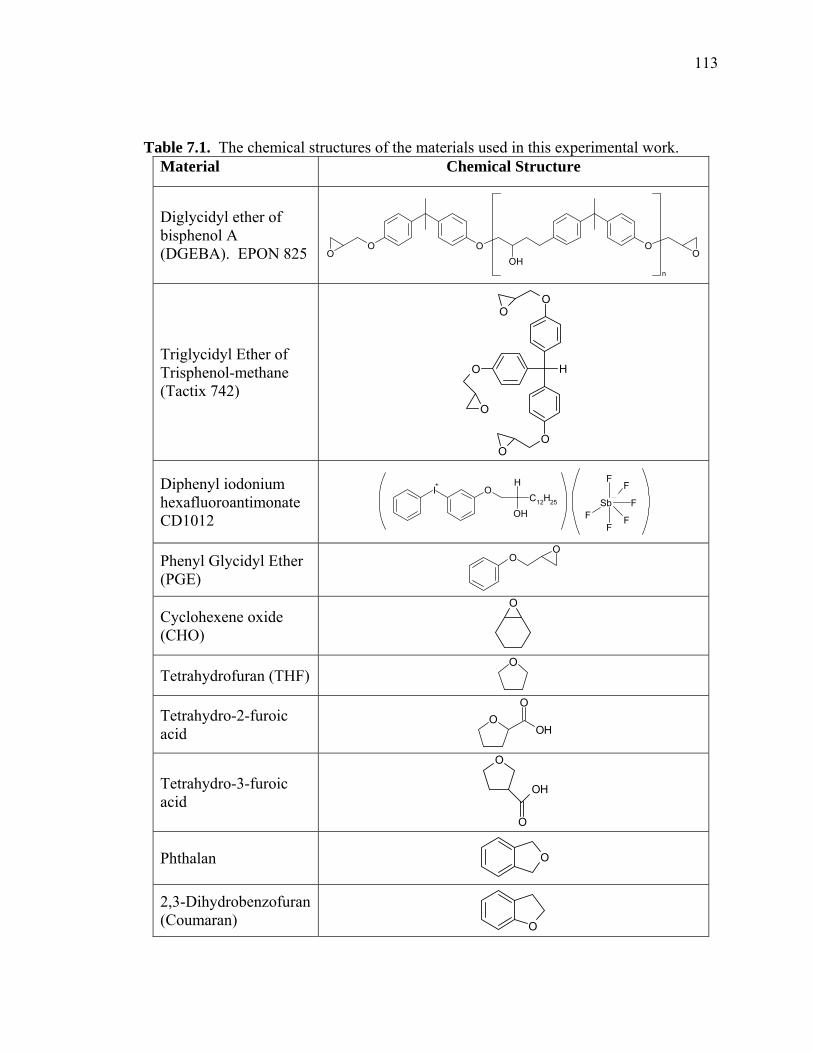
113
Table 7.1. The chemical structures of the materials used in this experimental work. Material Chemical Structure
Diglycidyl ether of bisphenol A (DGEBA). EPON 825 OO
O OOH
O
n
Triglycidyl Ether of Trisphenol-methane (Tactix 742)
O
O
OO
H
O
O
Diphenyl iodonium hexafluoroantimonate CD1012
I+
OH
OHC12H25
Sb
F
F
F
F
FF
Phenyl Glycidyl Ether (PGE)
OO
Cyclohexene oxide (CHO)
O
Tetrahydrofuran (THF)
O
Tetrahydro-2-furoic acid
OOH
O
Tetrahydro-3-furoic acid
O
OH
O
Phthalan O
2,3-Dihydrobenzofuran (Coumaran) O
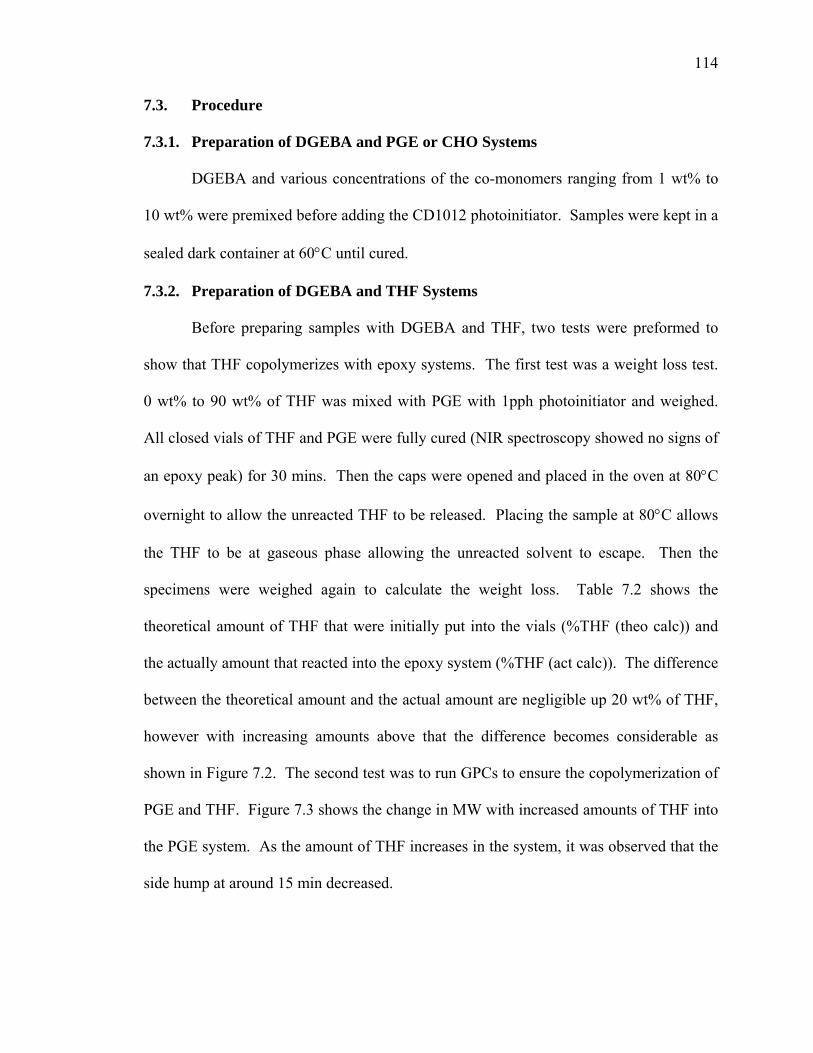
114
7.3. Procedure
7.3.1. Preparation of DGEBA and PGE or CHO Systems
DGEBA and various concentrations of the co-monomers ranging from 1 wt% to
10 wt% were premixed before adding the CD1012 photoinitiator. Samples were kept in a
sealed dark container at 60°C until cured.
7.3.2. Preparation of DGEBA and THF Systems
Before preparing samples with DGEBA and THF, two tests were preformed to
show that THF copolymerizes with epoxy systems. The first test was a weight loss test.
0 wt% to 90 wt% of THF was mixed with PGE with 1pph photoinitiator and weighed.
All closed vials of THF and PGE were fully cured (NIR spectroscopy showed no signs of
an epoxy peak) for 30 mins. Then the caps were opened and placed in the oven at 80°C
overnight to allow the unreacted THF to be released. Placing the sample at 80°C allows
the THF to be at gaseous phase allowing the unreacted solvent to escape. Then the
specimens were weighed again to calculate the weight loss. Table 7.2 shows the
theoretical amount of THF that were initially put into the vials (%THF (theo calc)) and
the actually amount that reacted into the epoxy system (%THF (act calc)). The difference
between the theoretical amount and the actual amount are negligible up 20 wt% of THF,
however with increasing amounts above that the difference becomes considerable as
shown in Figure 7.2. The second test was to run GPCs to ensure the copolymerization of
PGE and THF. Figure 7.3 shows the change in MW with increased amounts of THF into
the PGE system. As the amount of THF increases in the system, it was observed that the
side hump at around 15 min decreased.
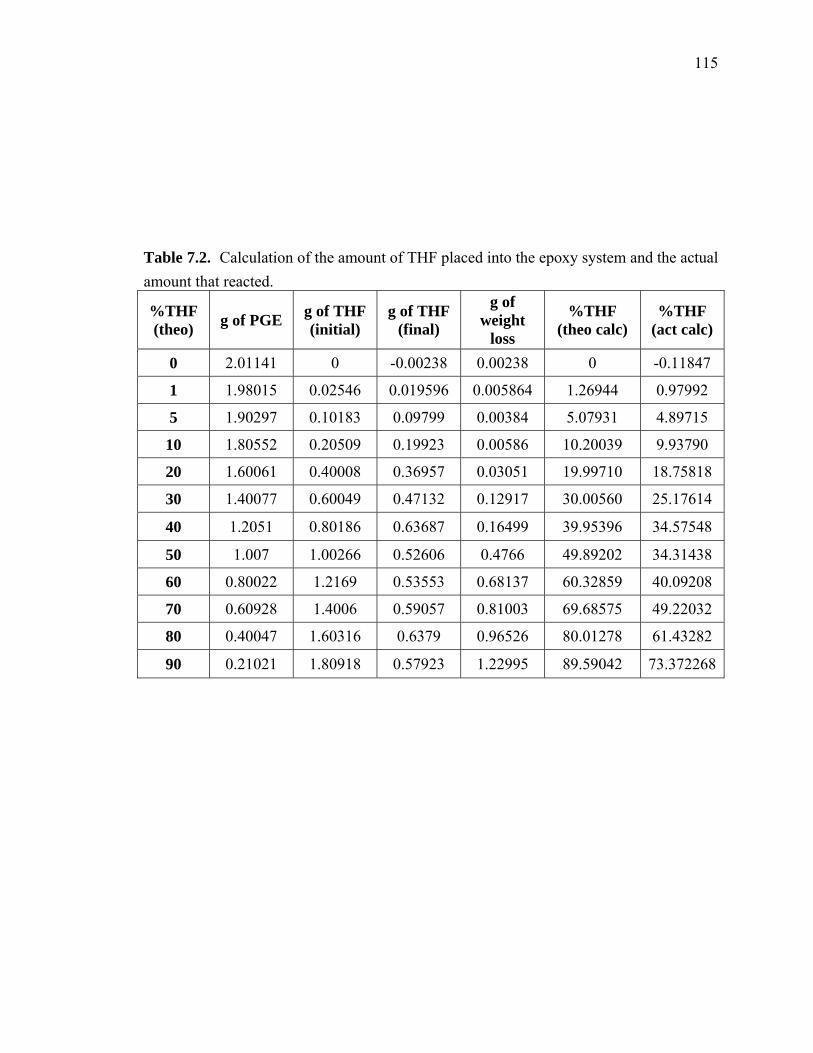
115
Table 7.2. Calculation of the amount of THF placed into the epoxy system and the actual amount that reacted.
%THF (theo) g of PGE g of THF
(initial) g of THF
(final)
g of weight
loss
%THF (theo calc)
%THF (act calc)
0 2.01141 0 -0.00238 0.00238 0 -0.11847
1 1.98015 0.02546 0.019596 0.005864 1.26944 0.97992
5 1.90297 0.10183 0.09799 0.00384 5.07931 4.89715
10 1.80552 0.20509 0.19923 0.00586 10.20039 9.93790
20 1.60061 0.40008 0.36957 0.03051 19.99710 18.75818
30 1.40077 0.60049 0.47132 0.12917 30.00560 25.17614
40 1.2051 0.80186 0.63687 0.16499 39.95396 34.57548
50 1.007 1.00266 0.52606 0.4766 49.89202 34.31438
60 0.80022 1.2169 0.53553 0.68137 60.32859 40.09208
70 0.60928 1.4006 0.59057 0.81003 69.68575 49.22032
80 0.40047 1.60316 0.6379 0.96526 80.01278 61.43282
90 0.21021 1.80918 0.57923 1.22995 89.59042 73.372268
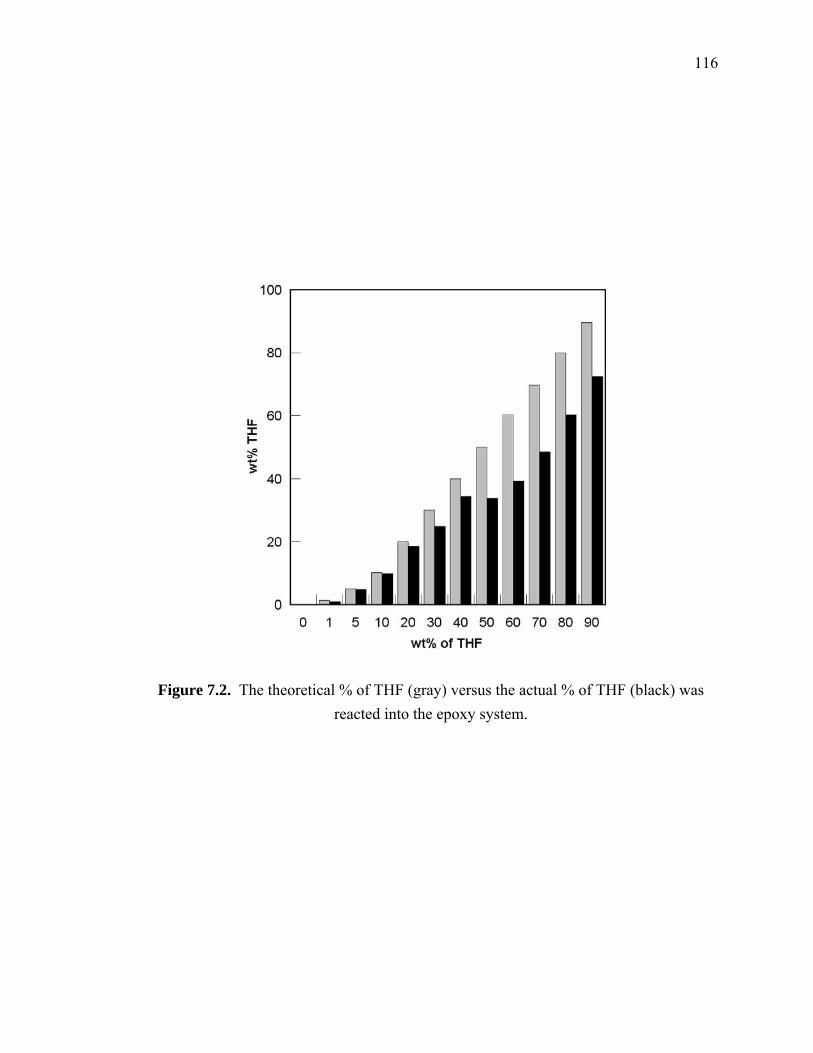
116
Figure 7.2. The theoretical % of THF (gray) versus the actual % of THF (black) was reacted into the epoxy system.
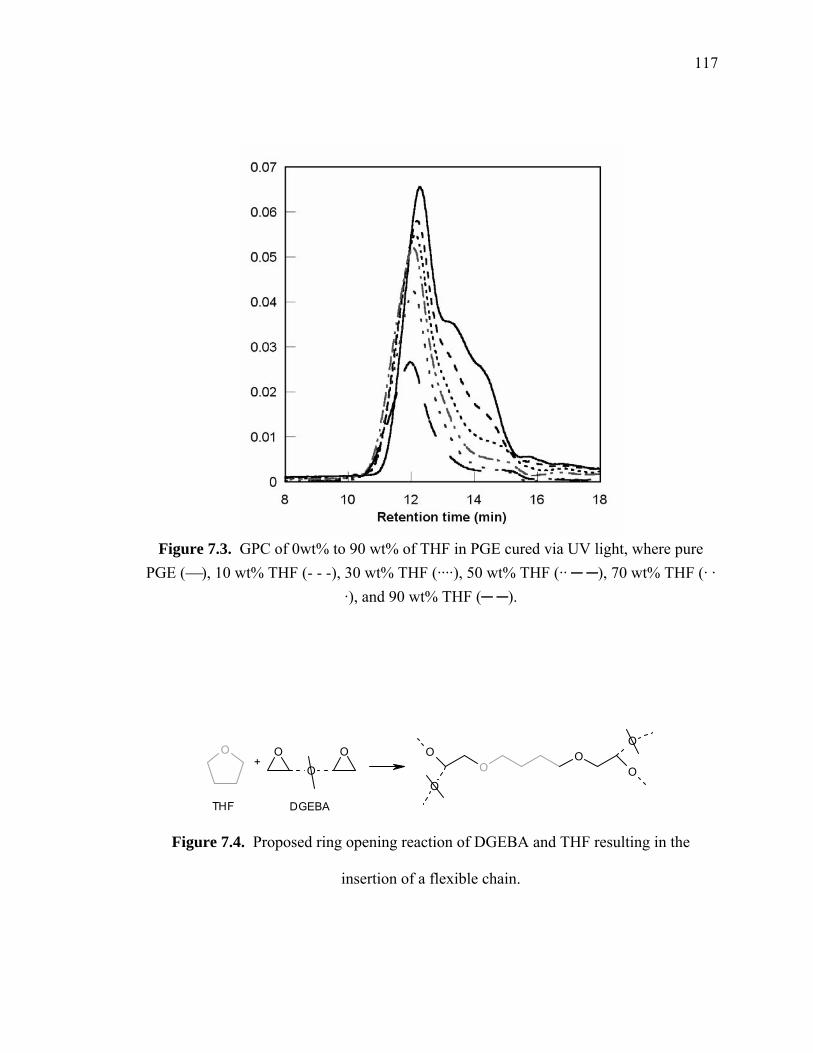
117
Figure 7.3. GPC of 0wt% to 90 wt% of THF in PGE cured via UV light, where pure
PGE (⎯), 10 wt% THF (- - -), 30 wt% THF (····), 50 wt% THF (·· ─ ─), 70 wt% THF (· · ·), and 90 wt% THF (─ ─).
O O
O
OO
O
O
OO
O+
THF DGEBA
Figure 7.4. Proposed ring opening reaction of DGEBA and THF resulting in the
insertion of a flexible chain.
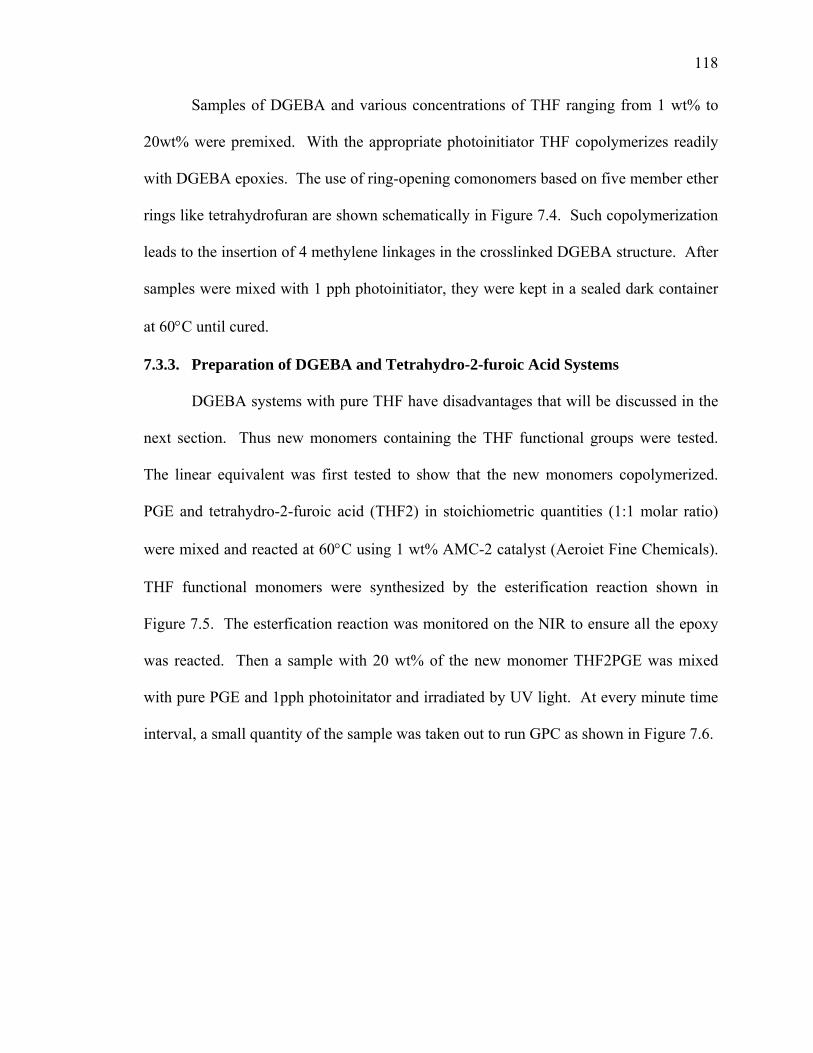
118
Samples of DGEBA and various concentrations of THF ranging from 1 wt% to
20wt% were premixed. With the appropriate photoinitiator THF copolymerizes readily
with DGEBA epoxies. The use of ring-opening comonomers based on five member ether
rings like tetrahydrofuran are shown schematically in Figure 7.4. Such copolymerization
leads to the insertion of 4 methylene linkages in the crosslinked DGEBA structure. After
samples were mixed with 1 pph photoinitiator, they were kept in a sealed dark container
at 60°C until cured.
7.3.3. Preparation of DGEBA and Tetrahydro-2-furoic Acid Systems
DGEBA systems with pure THF have disadvantages that will be discussed in the
next section. Thus new monomers containing the THF functional groups were tested.
The linear equivalent was first tested to show that the new monomers copolymerized.
PGE and tetrahydro-2-furoic acid (THF2) in stoichiometric quantities (1:1 molar ratio)
were mixed and reacted at 60°C using 1 wt% AMC-2 catalyst (Aeroiet Fine Chemicals).
THF functional monomers were synthesized by the esterification reaction shown in
Figure 7.5. The esterfication reaction was monitored on the NIR to ensure all the epoxy
was reacted. Then a sample with 20 wt% of the new monomer THF2PGE was mixed
with pure PGE and 1pph photoinitator and irradiated by UV light. At every minute time
interval, a small quantity of the sample was taken out to run GPC as shown in Figure 7.6.
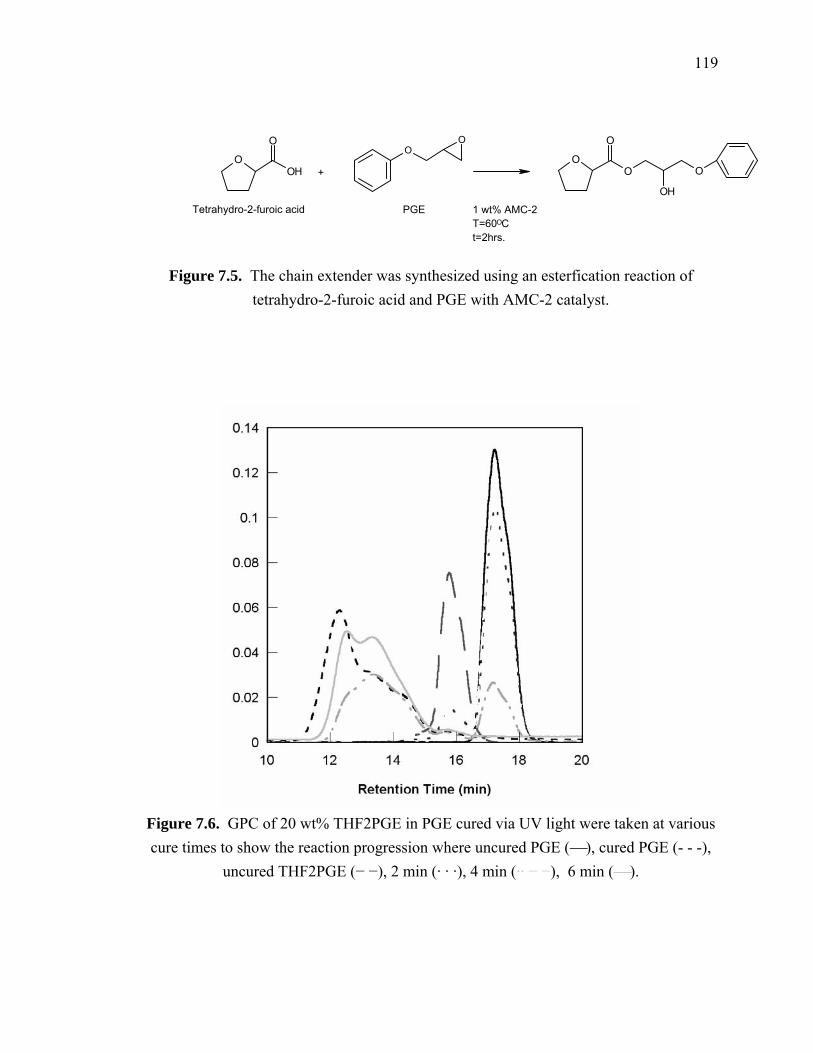
119
OOH
O OO
OO
O
OH
O
Tetrahydro-2-furoic acid PGE
+
1 wt% AMC-2T=60OCt=2hrs.
Figure 7.5. The chain extender was synthesized using an esterfication reaction of tetrahydro-2-furoic acid and PGE with AMC-2 catalyst.
Figure 7.6. GPC of 20 wt% THF2PGE in PGE cured via UV light were taken at various cure times to show the reaction progression where uncured PGE (⎯), cured PGE (- - -),
uncured THF2PGE (− −), 2 min (· · ·), 4 min (·· − −), 6 min (⎯).
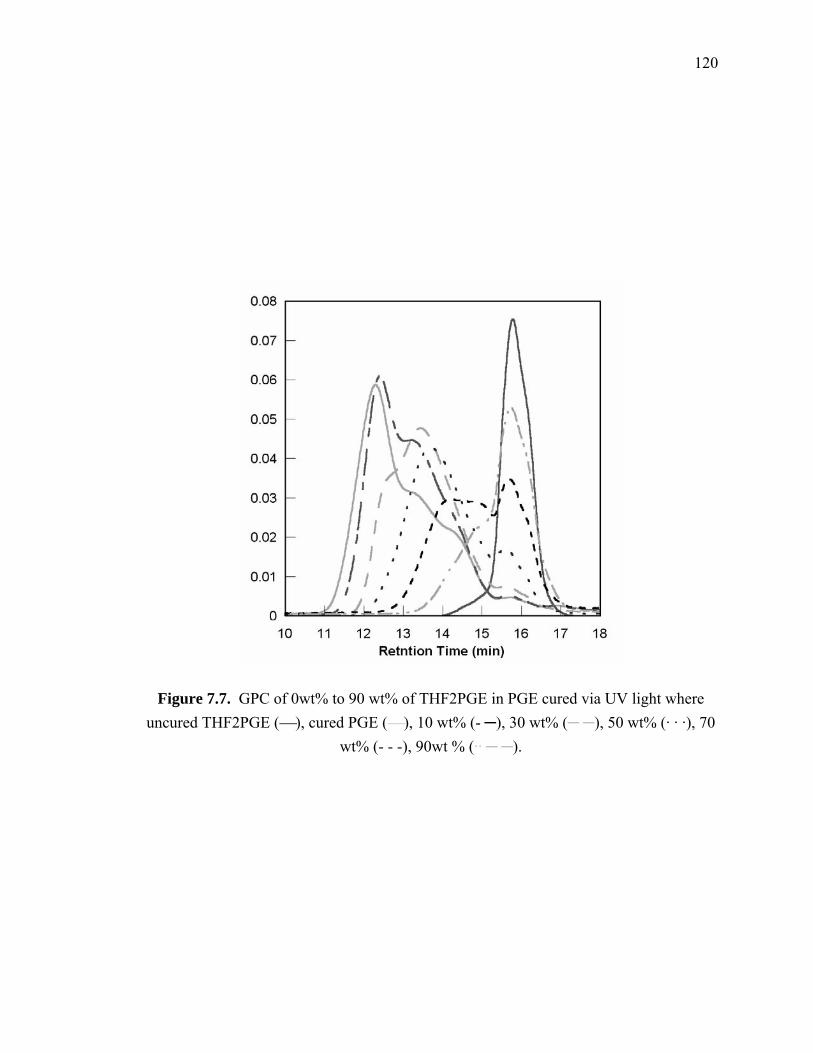
120
Figure 7.7. GPC of 0wt% to 90 wt% of THF2PGE in PGE cured via UV light where uncured THF2PGE (⎯), cured PGE (⎯), 10 wt% (- ─), 30 wt% (─ ─), 50 wt% (· · ·), 70
wt% (- - -), 90wt % (·· ─ ─).
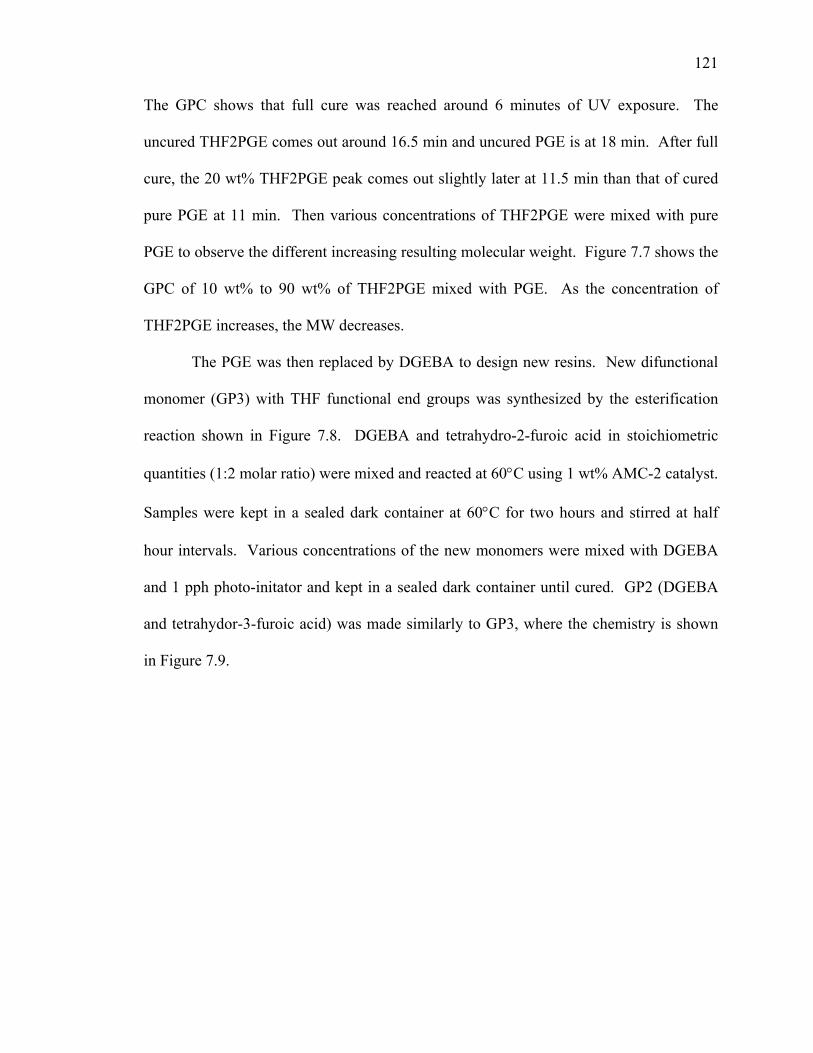
121
The GPC shows that full cure was reached around 6 minutes of UV exposure. The
uncured THF2PGE comes out around 16.5 min and uncured PGE is at 18 min. After full
cure, the 20 wt% THF2PGE peak comes out slightly later at 11.5 min than that of cured
pure PGE at 11 min. Then various concentrations of THF2PGE were mixed with pure
PGE to observe the different increasing resulting molecular weight. Figure 7.7 shows the
GPC of 10 wt% to 90 wt% of THF2PGE mixed with PGE. As the concentration of
THF2PGE increases, the MW decreases.
The PGE was then replaced by DGEBA to design new resins. New difunctional
monomer (GP3) with THF functional end groups was synthesized by the esterification
reaction shown in Figure 7.8. DGEBA and tetrahydro-2-furoic acid in stoichiometric
quantities (1:2 molar ratio) were mixed and reacted at 60°C using 1 wt% AMC-2 catalyst.
Samples were kept in a sealed dark container at 60°C for two hours and stirred at half
hour intervals. Various concentrations of the new monomers were mixed with DGEBA
and 1 pph photo-initator and kept in a sealed dark container until cured. GP2 (DGEBA
and tetrahydor-3-furoic acid) was made similarly to GP3, where the chemistry is shown
in Figure 7.9.
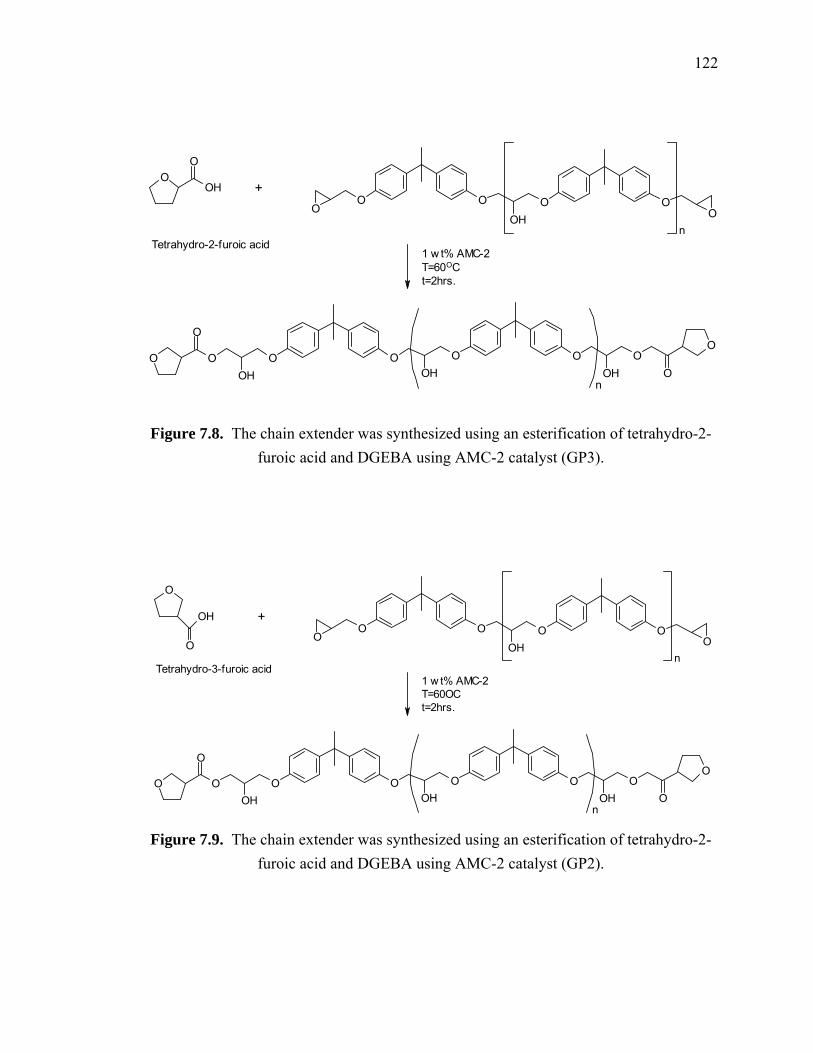
122
OOO O
OHO O
n
O O
O
OHO O
OHO O
n
OOH O
O
OOH
O
+
1 w t% AMC-2T=60OCt=2hrs.
Tetrahydro-2-furoic acid
Figure 7.8. The chain extender was synthesized using an esterification of tetrahydro-2-furoic acid and DGEBA using AMC-2 catalyst (GP3).
OOO O
OHO O
n
O O
O
OHO O
OHO O
n
OOH O
O
O
OH
O
Tetrahydro-3-furoic acid
+
1 w t% AMC-2T=60OCt=2hrs.
Figure 7.9. The chain extender was synthesized using an esterification of tetrahydro-2-
furoic acid and DGEBA using AMC-2 catalyst (GP2).
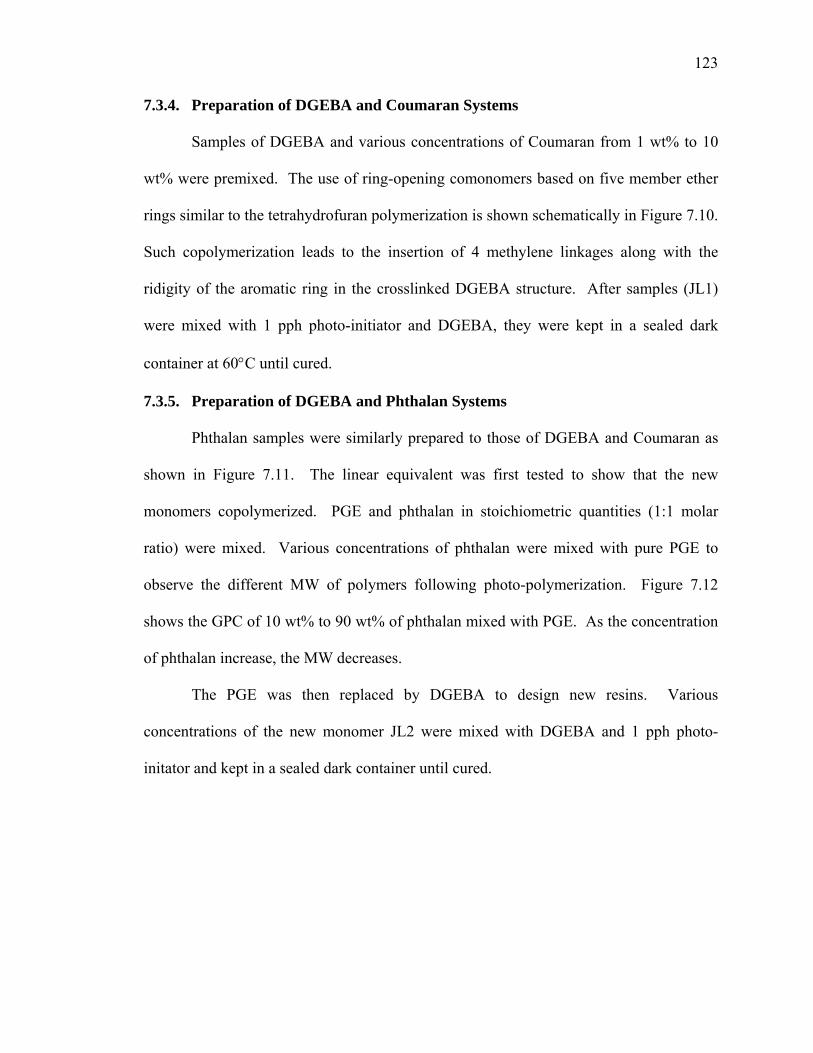
123
7.3.4. Preparation of DGEBA and Coumaran Systems
Samples of DGEBA and various concentrations of Coumaran from 1 wt% to 10
wt% were premixed. The use of ring-opening comonomers based on five member ether
rings similar to the tetrahydrofuran polymerization is shown schematically in Figure 7.10.
Such copolymerization leads to the insertion of 4 methylene linkages along with the
ridigity of the aromatic ring in the crosslinked DGEBA structure. After samples (JL1)
were mixed with 1 pph photo-initiator and DGEBA, they were kept in a sealed dark
container at 60°C until cured.
7.3.5. Preparation of DGEBA and Phthalan Systems
Phthalan samples were similarly prepared to those of DGEBA and Coumaran as
shown in Figure 7.11. The linear equivalent was first tested to show that the new
monomers copolymerized. PGE and phthalan in stoichiometric quantities (1:1 molar
ratio) were mixed. Various concentrations of phthalan were mixed with pure PGE to
observe the different MW of polymers following photo-polymerization. Figure 7.12
shows the GPC of 10 wt% to 90 wt% of phthalan mixed with PGE. As the concentration
of phthalan increase, the MW decreases.
The PGE was then replaced by DGEBA to design new resins. Various
concentrations of the new monomer JL2 were mixed with DGEBA and 1 pph photo-
initator and kept in a sealed dark container until cured.
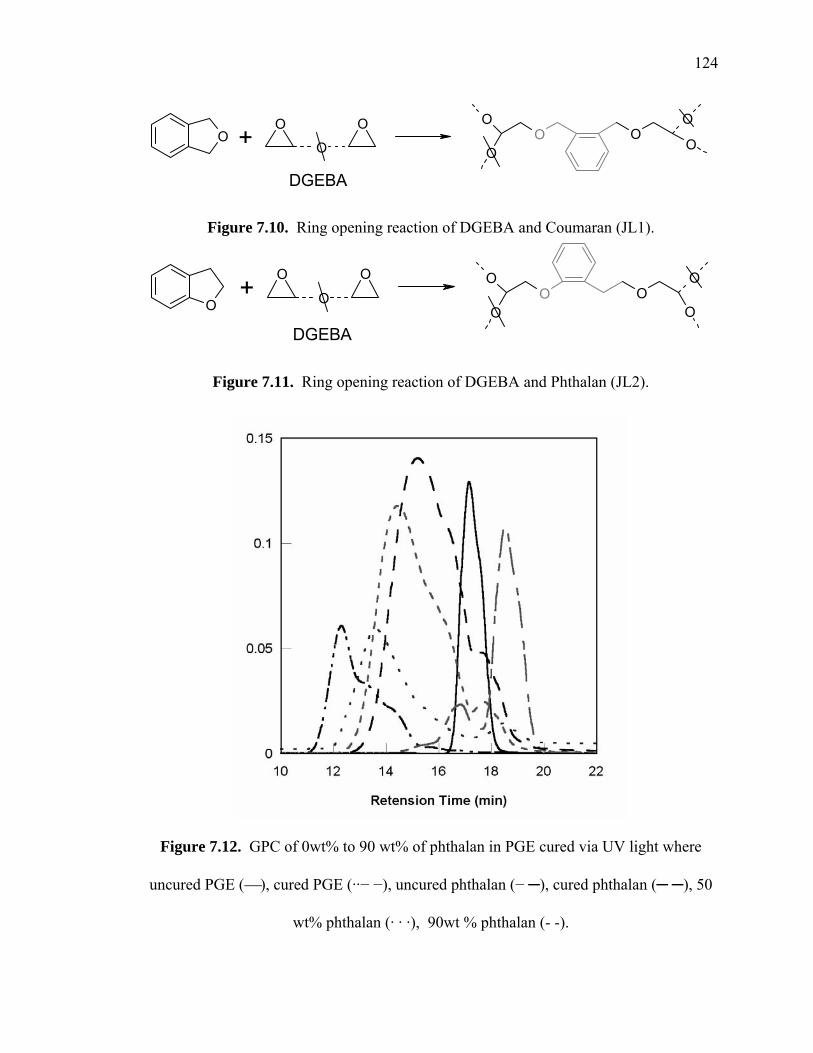
124
OOO
OO
O
OO
O
O+
DGEBA
Figure 7.10. Ring opening reaction of DGEBA and Coumaran (JL1).
O
OO
O OO
OO
O
O+
DGEBA
Figure 7.11. Ring opening reaction of DGEBA and Phthalan (JL2).
Figure 7.12. GPC of 0wt% to 90 wt% of phthalan in PGE cured via UV light where
uncured PGE (⎯), cured PGE (··− −), uncured phthalan (− ─), cured phthalan (─ ─), 50
wt% phthalan (· · ·), 90wt % phthalan (- -).
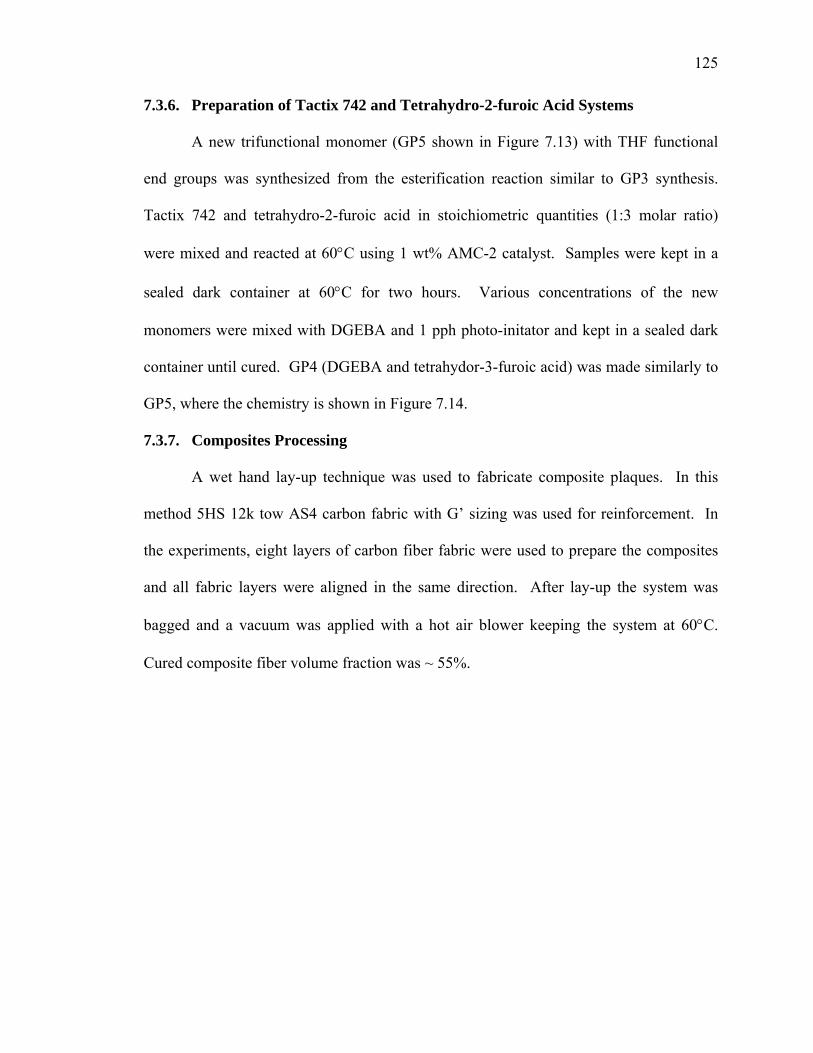
125
7.3.6. Preparation of Tactix 742 and Tetrahydro-2-furoic Acid Systems
A new trifunctional monomer (GP5 shown in Figure 7.13) with THF functional
end groups was synthesized from the esterification reaction similar to GP3 synthesis.
Tactix 742 and tetrahydro-2-furoic acid in stoichiometric quantities (1:3 molar ratio)
were mixed and reacted at 60°C using 1 wt% AMC-2 catalyst. Samples were kept in a
sealed dark container at 60°C for two hours. Various concentrations of the new
monomers were mixed with DGEBA and 1 pph photo-initator and kept in a sealed dark
container until cured. GP4 (DGEBA and tetrahydor-3-furoic acid) was made similarly to
GP5, where the chemistry is shown in Figure 7.14.
7.3.7. Composites Processing
A wet hand lay-up technique was used to fabricate composite plaques. In this
method 5HS 12k tow AS4 carbon fabric with G’ sizing was used for reinforcement. In
the experiments, eight layers of carbon fiber fabric were used to prepare the composites
and all fabric layers were aligned in the same direction. After lay-up the system was
bagged and a vacuum was applied with a hot air blower keeping the system at 60°C.
Cured composite fiber volume fraction was ~ 55%.
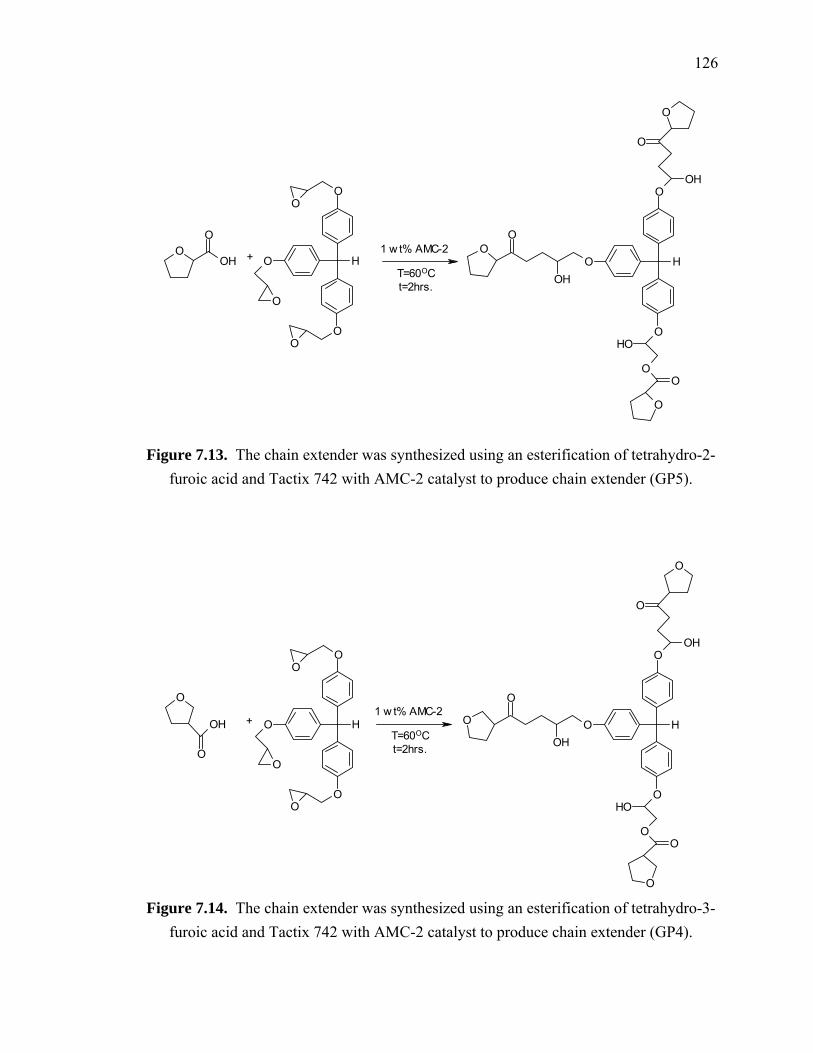
126
OOH
O
O
O
OO
H
O
O
O
O
O
O
H
O
O
OH
OO
OH
O
OH
O
T=60OCt=2hrs.
+1 w t% AMC-2
Figure 7.13. The chain extender was synthesized using an esterification of tetrahydro-2-furoic acid and Tactix 742 with AMC-2 catalyst to produce chain extender (GP5).
O
O
O
O
H
O
O
OH
OO
OH
O
OH
O
O
OH
OO
O
OO
H
O
O+T=60OCt=2hrs.
1 w t% AMC-2
Figure 7.14. The chain extender was synthesized using an esterification of tetrahydro-3-
furoic acid and Tactix 742 with AMC-2 catalyst to produce chain extender (GP4).
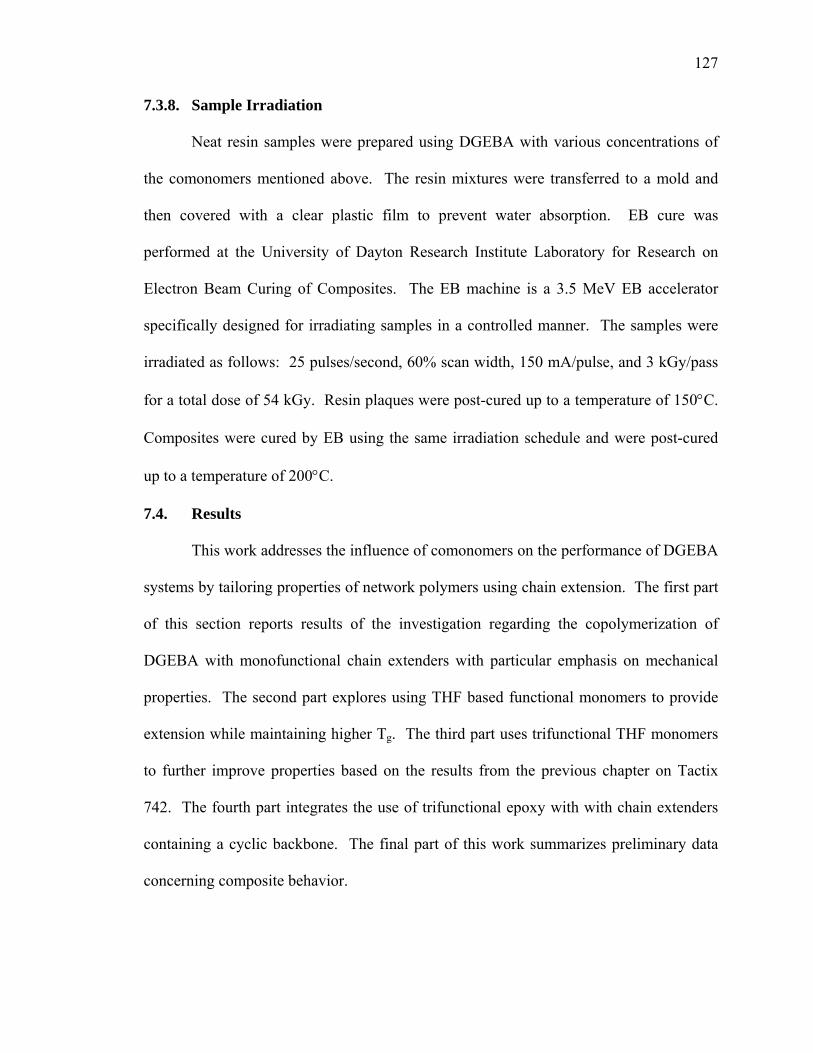
127
7.3.8. Sample Irradiation
Neat resin samples were prepared using DGEBA with various concentrations of
the comonomers mentioned above. The resin mixtures were transferred to a mold and
then covered with a clear plastic film to prevent water absorption. EB cure was
performed at the University of Dayton Research Institute Laboratory for Research on
Electron Beam Curing of Composites. The EB machine is a 3.5 MeV EB accelerator
specifically designed for irradiating samples in a controlled manner. The samples were
irradiated as follows: 25 pulses/second, 60% scan width, 150 mA/pulse, and 3 kGy/pass
for a total dose of 54 kGy. Resin plaques were post-cured up to a temperature of 150°C.
Composites were cured by EB using the same irradiation schedule and were post-cured
up to a temperature of 200°C.
7.4. Results
This work addresses the influence of comonomers on the performance of DGEBA
systems by tailoring properties of network polymers using chain extension. The first part
of this section reports results of the investigation regarding the copolymerization of
DGEBA with monofunctional chain extenders with particular emphasis on mechanical
properties. The second part explores using THF based functional monomers to provide
extension while maintaining higher Tg. The third part uses trifunctional THF monomers
to further improve properties based on the results from the previous chapter on Tactix
742. The fourth part integrates the use of trifunctional epoxy with with chain extenders
containing a cyclic backbone. The final part of this work summarizes preliminary data
concerning composite behavior.
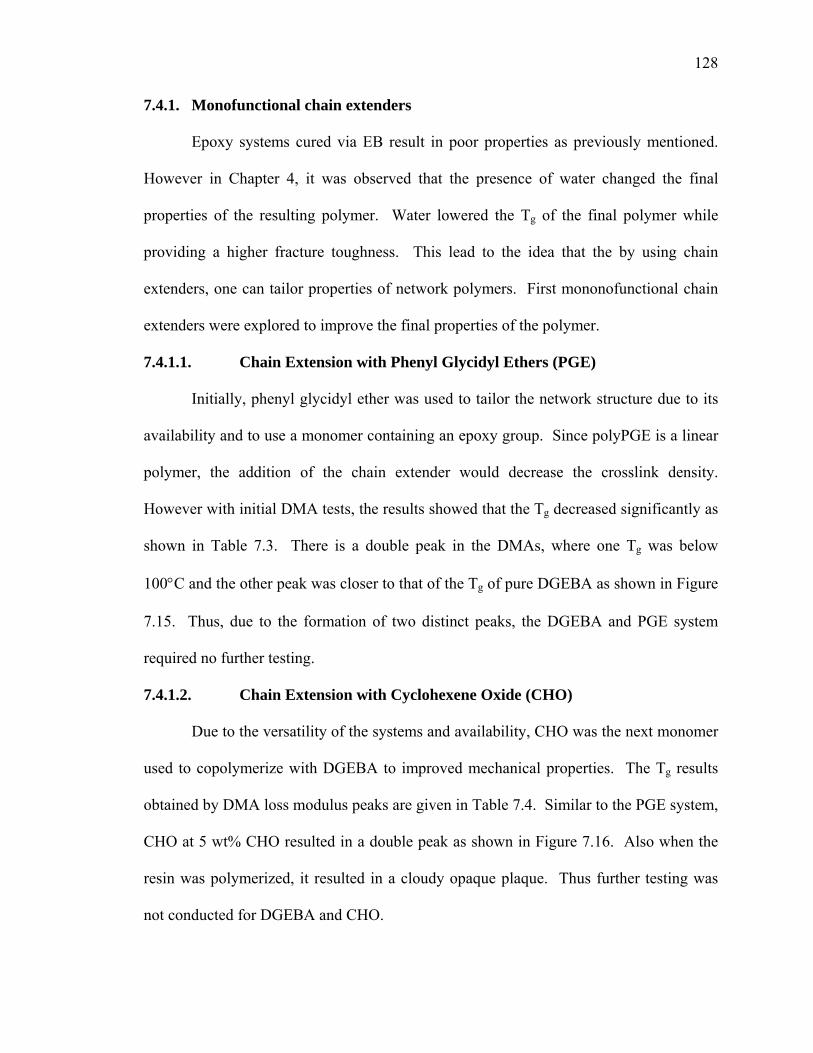
128
7.4.1. Monofunctional chain extenders
Epoxy systems cured via EB result in poor properties as previously mentioned.
However in Chapter 4, it was observed that the presence of water changed the final
properties of the resulting polymer. Water lowered the Tg of the final polymer while
providing a higher fracture toughness. This lead to the idea that the by using chain
extenders, one can tailor properties of network polymers. First mononofunctional chain
extenders were explored to improve the final properties of the polymer.
7.4.1.1. Chain Extension with Phenyl Glycidyl Ethers (PGE)
Initially, phenyl glycidyl ether was used to tailor the network structure due to its
availability and to use a monomer containing an epoxy group. Since polyPGE is a linear
polymer, the addition of the chain extender would decrease the crosslink density.
However with initial DMA tests, the results showed that the Tg decreased significantly as
shown in Table 7.3. There is a double peak in the DMAs, where one Tg was below
100°C and the other peak was closer to that of the Tg of pure DGEBA as shown in Figure
7.15. Thus, due to the formation of two distinct peaks, the DGEBA and PGE system
required no further testing.
7.4.1.2. Chain Extension with Cyclohexene Oxide (CHO)
Due to the versatility of the systems and availability, CHO was the next monomer
used to copolymerize with DGEBA to improved mechanical properties. The Tg results
obtained by DMA loss modulus peaks are given in Table 7.4. Similar to the PGE system,
CHO at 5 wt% CHO resulted in a double peak as shown in Figure 7.16. Also when the
resin was polymerized, it resulted in a cloudy opaque plaque. Thus further testing was
not conducted for DGEBA and CHO.
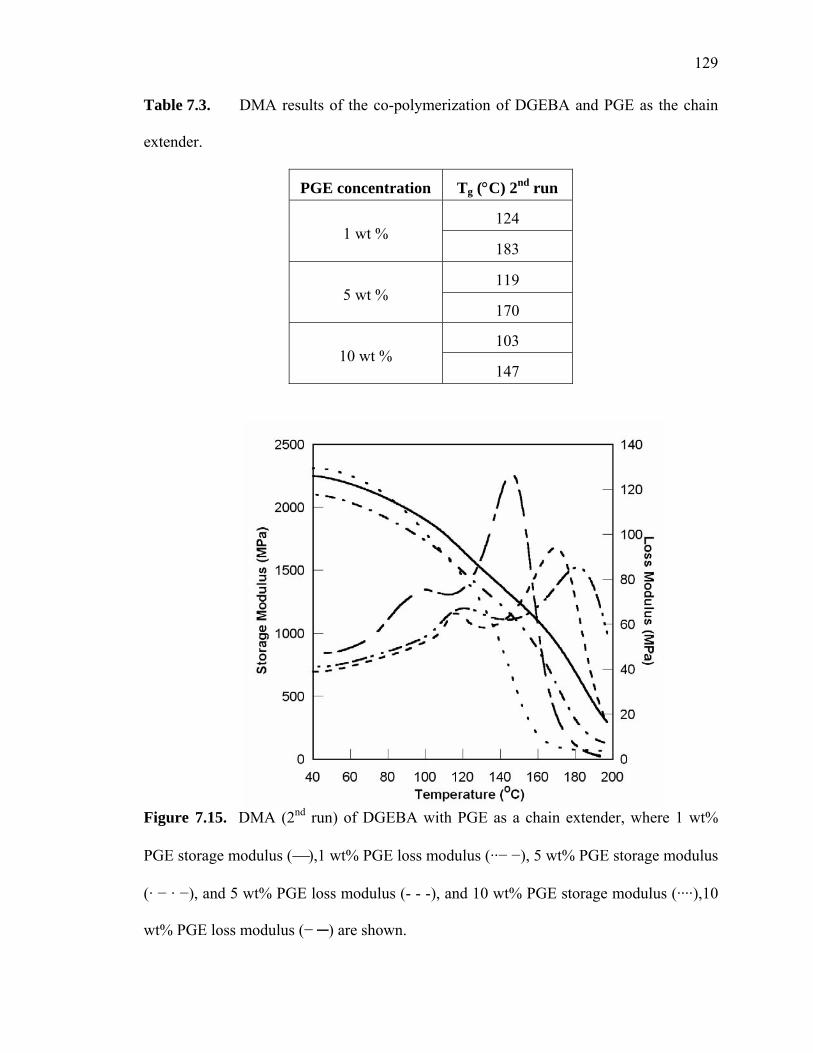
129
Table 7.3. DMA results of the co-polymerization of DGEBA and PGE as the chain
extender.
PGE concentration Tg (°C) 2nd run
124 1 wt %
183
119 5 wt %
170
103 10 wt %
147
Figure 7.15. DMA (2nd run) of DGEBA with PGE as a chain extender, where 1 wt%
PGE storage modulus (⎯),1 wt% PGE loss modulus (··− −), 5 wt% PGE storage modulus
(· − · −), and 5 wt% PGE loss modulus (- - -), and 10 wt% PGE storage modulus (····),10
wt% PGE loss modulus (− ─) are shown.
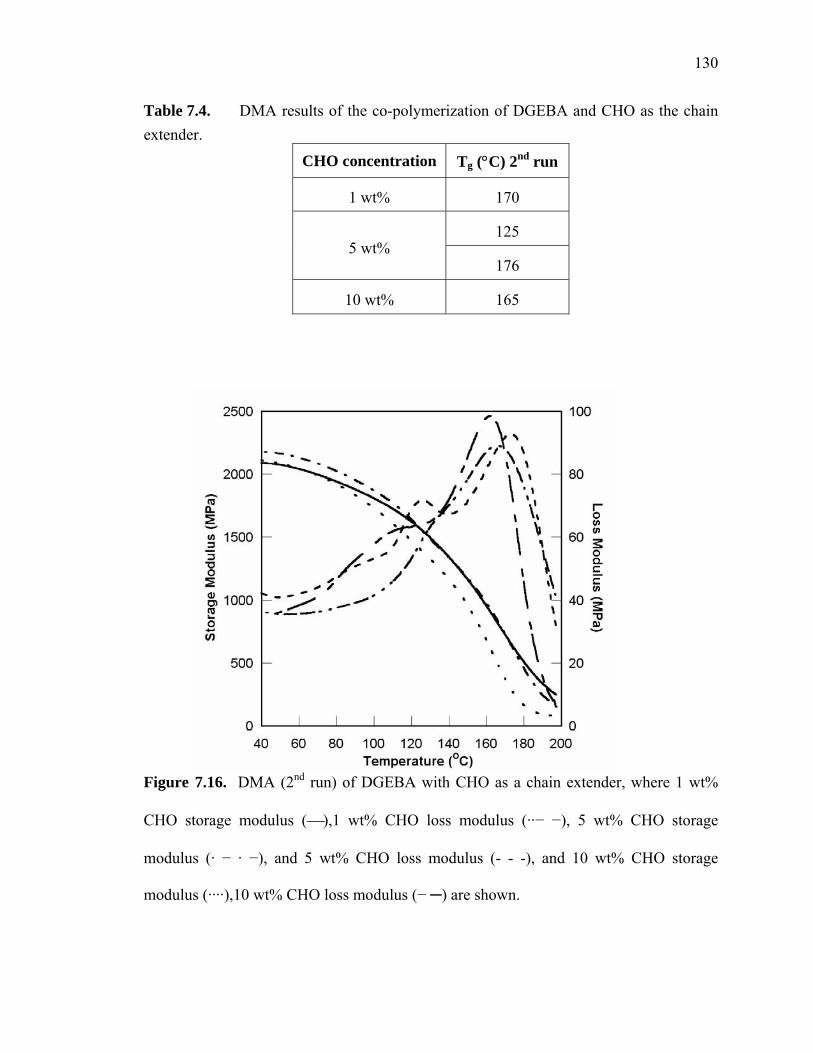
130
Table 7.4. DMA results of the co-polymerization of DGEBA and CHO as the chain extender.
CHO concentration Tg (°C) 2nd run
1 wt% 170
125 5 wt%
176
10 wt% 165
Figure 7.16. DMA (2nd run) of DGEBA with CHO as a chain extender, where 1 wt%
CHO storage modulus (⎯),1 wt% CHO loss modulus (··− −), 5 wt% CHO storage
modulus (· − · −), and 5 wt% CHO loss modulus (- - -), and 10 wt% CHO storage
modulus (····),10 wt% CHO loss modulus (− ─) are shown.
131
7.4.1.3. Chain Extension with Tetrahydrofuran (THF)
Other chain extending strategies needed to be explored to tailor the network
structure and improve mechanical properties. The most interesting of these was the use
of ring-opening comonomers based on five member ether THF rings as shown
schematically in Figure 7.4. It is presumed that a tetramethylene ether grouping is added
to the crosslinked network comprised primarily of DGEBA via ring opening of the THF
molecule. This would necessarily result in a decreased crosslink density and potentially
higher fracture toughness. In fact, our results show improved mechanical properties. At
10 wt% THF in DGEBA, the G1C value increased almost by a factor of four: from 56
J/m2 for neat dry DGEBA to 217 J/m2 for the modified system. However, the Tg of these
systems suffered a very significant loss of Tg from 190°C for neat DGEBA to 129°C as
shown in Table 7.5.
Some of the loss could be a result of plasticization due to unreacted THF
remaining in the system. However, after postcuring it is expected that unreacted THF
will have been removed and no appreciable weight loss was observed. The high
volatility of THF presents a practical problem in its use and application to commercial
processes. And, while the decrease in Tg can be somewhat curtailed by reducing the
concentration of THF used, the dangers associated with THF evolution cannot. It was
hypothesized that using THF as reactive endgroup on monomers possessing similar chain
structure to DGEBA would result in toughened systems with higher Tg. The next section
explores the possibility using such difunctional monomers.
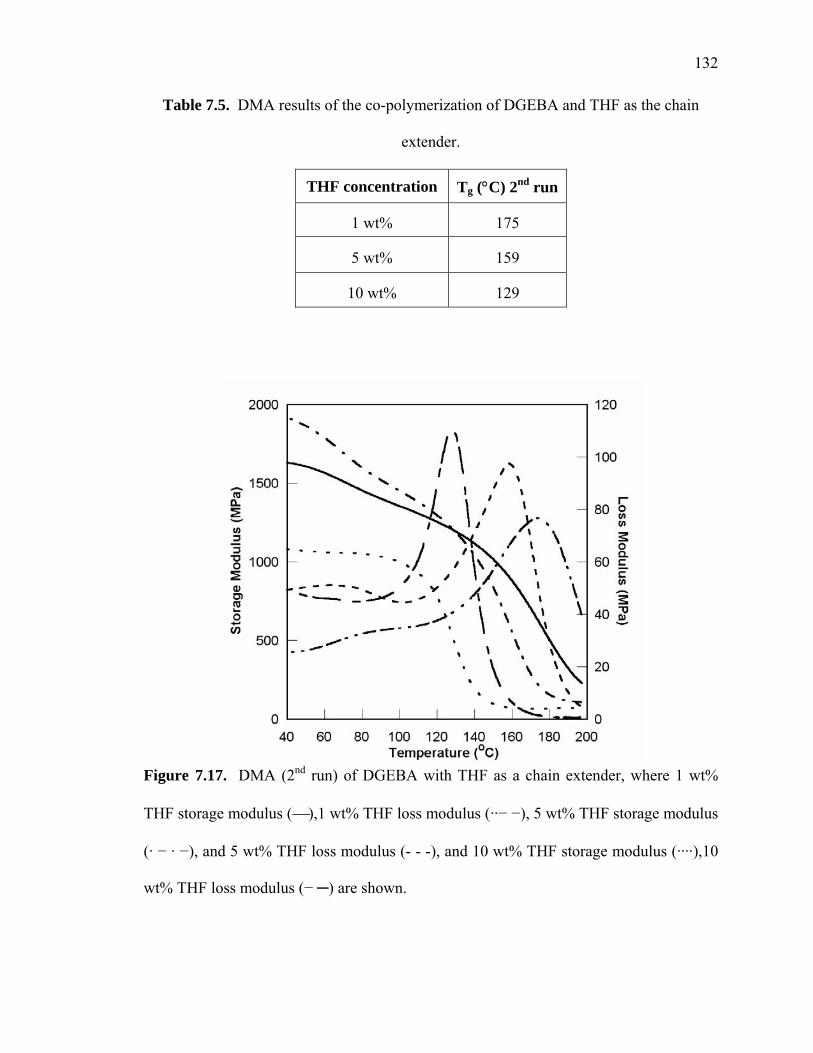
132
Table 7.5. DMA results of the co-polymerization of DGEBA and THF as the chain
extender.
THF concentration Tg (°C) 2nd run
1 wt% 175
5 wt% 159
10 wt% 129
Figure 7.17. DMA (2nd run) of DGEBA with THF as a chain extender, where 1 wt%
THF storage modulus (⎯),1 wt% THF loss modulus (··− −), 5 wt% THF storage modulus
(· − · −), and 5 wt% THF loss modulus (- - -), and 10 wt% THF storage modulus (····),10
wt% THF loss modulus (− ─) are shown.
133
7.4.2. Difunctional chain extenders
The previous section showed the potential of using THF as a chain extender in
tailoring the epoxy system. However due to the drawbacks of THF such as high volatility,
other monomers containing the THF functionality were explored. THF in DGEBA also
resulted in a lower Tg, this factor also had to be accounted for in tailoring the properties.
Thus using THF difunctional monomers were made to provide chain extension while
maintaining higher Tg.
7.4.2.1. Synthesis and Application of Chain Extenders by Esterification of
DGEBA and Tetrahydro-2-furoic acid
A new monomer, GP3, was synthesized by the esterification of DGEBA with
tetrahydro-2-furoic acid as described in the experimental section and shown in Figure 7.8.
This reaction adds THF functionality to the ends of DGEBA. DGEBA was mixed with
GP3 at 20 wt% and 35 wt% loading and cured according to the procedures described
earlier. The properties of the resulting polymers as obtained by DMA analysis and
fracture toughness measurements in comparison to neat DGEBA polymers are given in
Table 7.6. In both cases fracture toughness increased substantially with a concomitant
decrease in Tg. The drop in Tg is significantly less than that observed for pure the THF
modification. In fact, 35 wt% GP3 corresponds roughly to the molar concentration of
THF moieties found in 10 wt% THF modified DGEBA systems. Thus the comparison of
35 wt% GP3 with 10 wt% THF shows a significant increase in Tg as well as slightly
improved fracture toughness value. A likely explanation for this behavior is that the use
of difunctional GP3 places a crosslink between two tetramethylene ether groupings in the
resulting network structure.
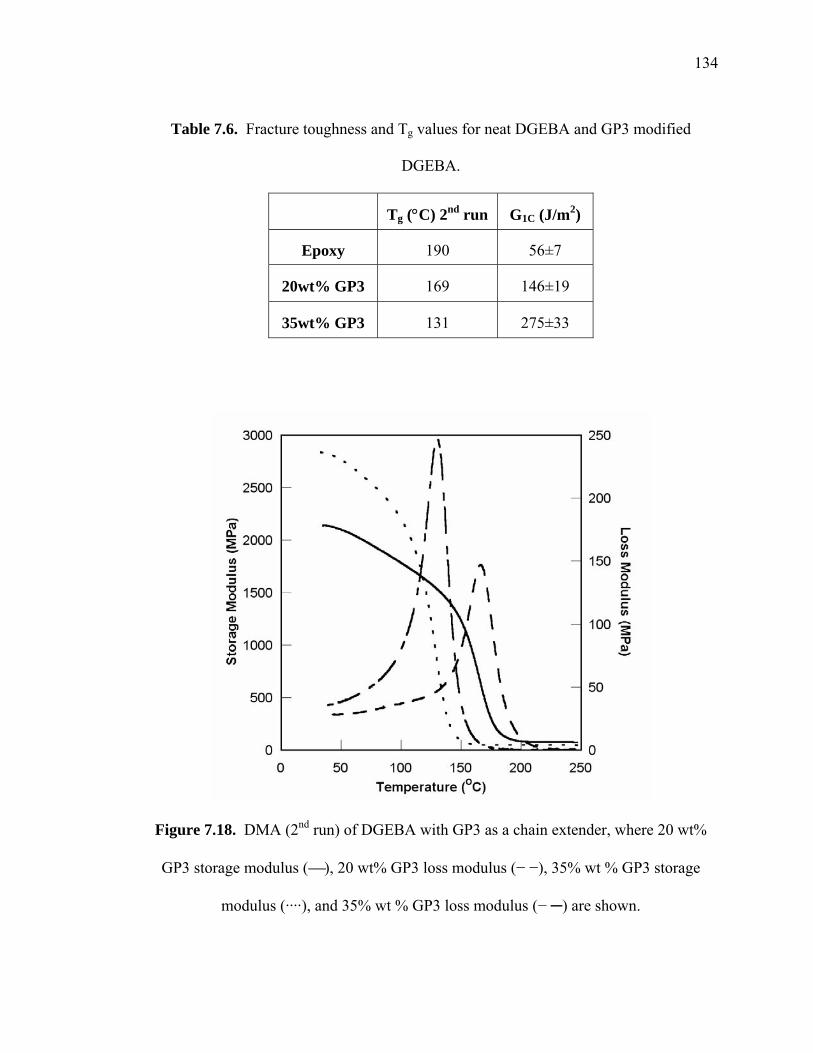
134
Table 7.6. Fracture toughness and Tg values for neat DGEBA and GP3 modified
DGEBA.
Tg (°C) 2nd run G1C (J/m2)
Epoxy 190 56±7
20wt% GP3 169 146±19
35wt% GP3 131 275±33
Figure 7.18. DMA (2nd run) of DGEBA with GP3 as a chain extender, where 20 wt%
GP3 storage modulus (⎯), 20 wt% GP3 loss modulus (− −), 35% wt % GP3 storage
modulus (····), and 35% wt % GP3 loss modulus (− ─) are shown.
135
A second interesting observation is that the 20 wt% GP3 system possesses a Tg
similar to that of DGEBA modified with 1 wt% water and a similar fracture toughness to
that system. These results indicate the potential for improving the mechanical properties
of EB cured DGEBA systems. The challenge remains to improve fracture toughness with
minimal or no loss in other properties, particularly Tg.
7.4.2.2. Synthesis and Application of Chain Extenders by Esterification of
DGEBA and Tetrahydro-3-furoic acid
A new monomer, GP2, was synthesized by the esterification of DGEBA with tetrahydro-
3-furoic acid as described in the experimental section and shown in Figure 7.9. This
reaction adds THF functionality to the ends of DGEBA similarly to GP3. DGEBA was
mixed with GP2 at 20 wt% and 35 wt% loading and cured according to the procedures
described earlier. The properties of the resulting polymers as obtained by DMA analysis
and fracture toughness measurements in comparison to neat DGEBA polymers are given
in Table 7.7. In both cases fracture toughness increased substantially with a concomitant
decrease in Tg. The drop in Tg is significantly less than that observed for the pure THF
modification. The fracture toughness of the system was greatly improved compared to
that of pure DGEBA; however the concern for the Tg must be acknowledged, thus the
next section explores trifunctional epoxies.
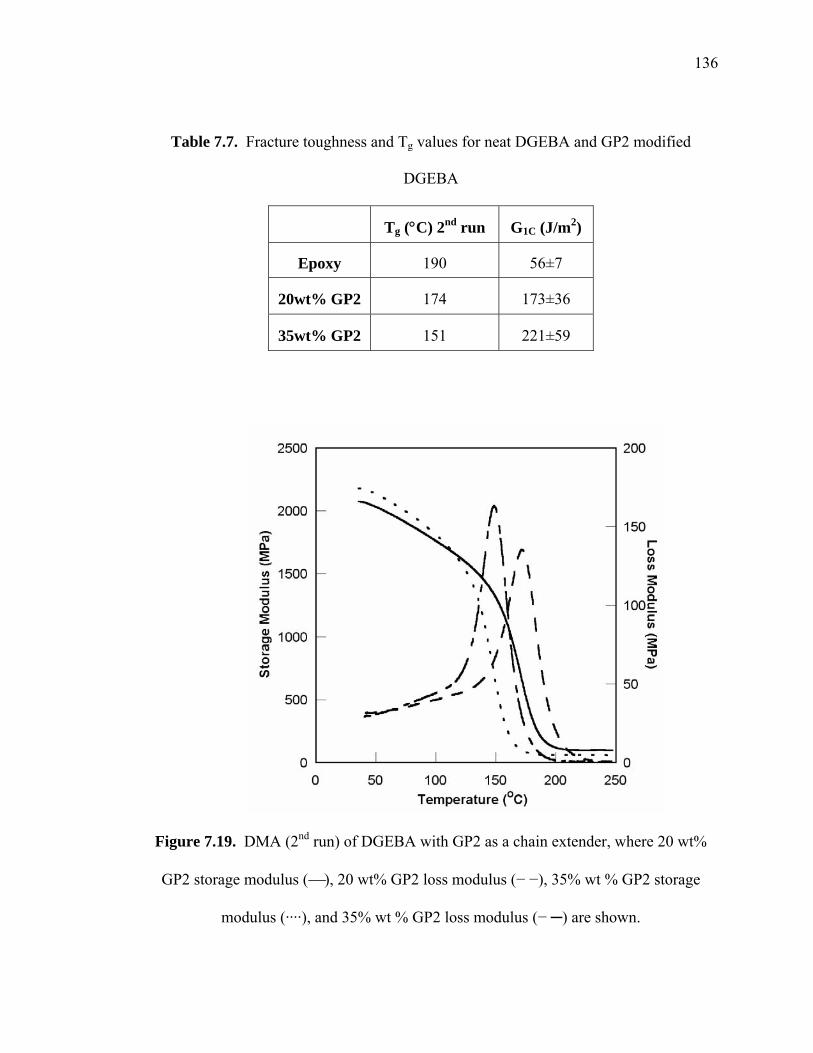
136
Table 7.7. Fracture toughness and Tg values for neat DGEBA and GP2 modified
DGEBA
Tg (°C) 2nd run G1C (J/m2)
Epoxy 190 56±7
20wt% GP2 174 173±36
35wt% GP2 151 221±59
Figure 7.19. DMA (2nd run) of DGEBA with GP2 as a chain extender, where 20 wt%
GP2 storage modulus (⎯), 20 wt% GP2 loss modulus (− −), 35% wt % GP2 storage
modulus (····), and 35% wt % GP2 loss modulus (− ─) are shown.
137
7.4.3. Trifunctional chain extenders
In Chapter 6, the initial goal was to use Tactix 742 to see if this could increase the
Tg of the epoxy system. Various concentrations of Tactix 742 in DGEBA resulted in an
increase in one property while another property suffered. An optimum combination for
these properties was found to be 20 to 40 wt% of Tactix 742 in DGEBA. The viscosity
also had to be factored into choosing the quantity of the trifunctional epoxy used for
future use in composites. However, the use of this trifunctional epoxy increased the final
Tg of the polymer. Thus this section explores the use of this trifunctional epoxy in order
to increase the Tg while maintaining the high mechanical properties resulted from the
THF functional monomers.
7.4.3.1. Synthesis and Application of Chain Extenders by Esterification of
Trifunctional Epoxies (Tactix 742) with Tetrahydro-2-furoic acid
Based on the results obtained for the difunctional THF endcapped system
described in the previous section, analogous trifunctional systems were considered with
the notion that these should result in higher Tg materials when used as modifiers for
DGEBA. Tactix 742 is a well known trifunctional epoxy that is commonly used for
higher Tg applications compared to DGEBA. A new monomer, GP5, was synthesized via
the esterification of Tactix 742 with tetrahydro-2-furoic acid as described in the
experimental section and shown in Figure 7.10. This reaction adds THF functionality to
the ends of the trifunctional epoxy resulting in a modifier with three THF functional
groups. DGEBA was mixed with GP5 at 1, 5 and 10 wt% loading and cured via EB
according to the procedures described earlier. The properties of the resulting polymers as
obtained by DMA analysis, flexural testing and fracture toughness measurements in
138
comparison to the neat DGEBA polymer are given in Table 7.8.
The Tg of the modified DGEBA systems was found to be only slightly influenced
by GP5 loading. Moreover the loss behavior observed by DMA and given in Figure 7.20
for the series of GP5 modified samples shows not only a nearly unchanged Tg but also a
sharper transition indicating the existence of a more homogeneous network for systems
containing higher concentrations of GP5. The results of flexural testing show that the
modifier has no influence on the flexural modulus of the material but that a significant
increase in the flexural strength was obtained for all GP5 modified materials. A large,
almost five-fold, improvement in fracture toughness was observed for the DGEBA
modified with only 10 wt% GP5. This is a striking result given that there was not an
accompanying significant loss in Tg. Moreover it suggests that it is possible to improve
the properties of cationically EB cured DGEBA based epoxy systems without the loss of
other important material properties.
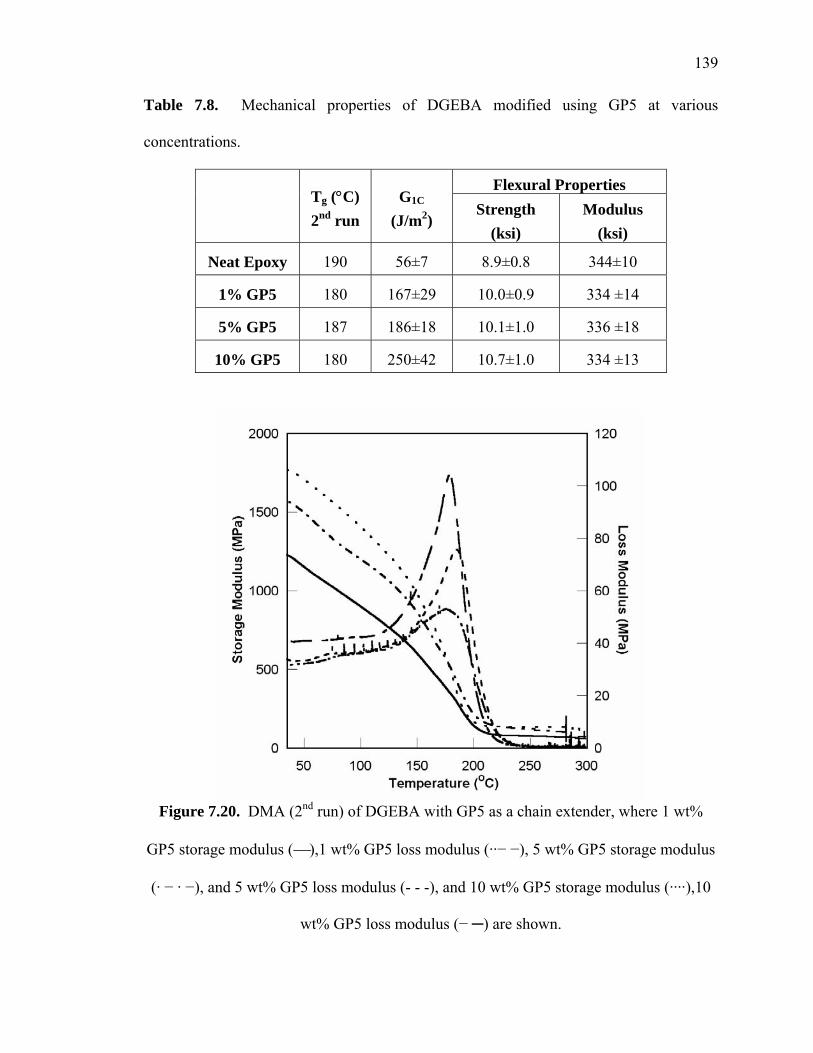
139
Table 7.8. Mechanical properties of DGEBA modified using GP5 at various
concentrations.
Flexural Properties
Tg (°C) 2nd run
G1C
(J/m2) Strength
(ksi) Modulus
(ksi)
Neat Epoxy 190 56±7 8.9±0.8 344±10
1% GP5 180 167±29 10.0±0.9 334 ±14
5% GP5 187 186±18 10.1±1.0 336 ±18
10% GP5 180 250±42 10.7±1.0 334 ±13
Figure 7.20. DMA (2nd run) of DGEBA with GP5 as a chain extender, where 1 wt%
GP5 storage modulus (⎯),1 wt% GP5 loss modulus (··− −), 5 wt% GP5 storage modulus
(· − · −), and 5 wt% GP5 loss modulus (- - -), and 10 wt% GP5 storage modulus (····),10
wt% GP5 loss modulus (− ─) are shown.
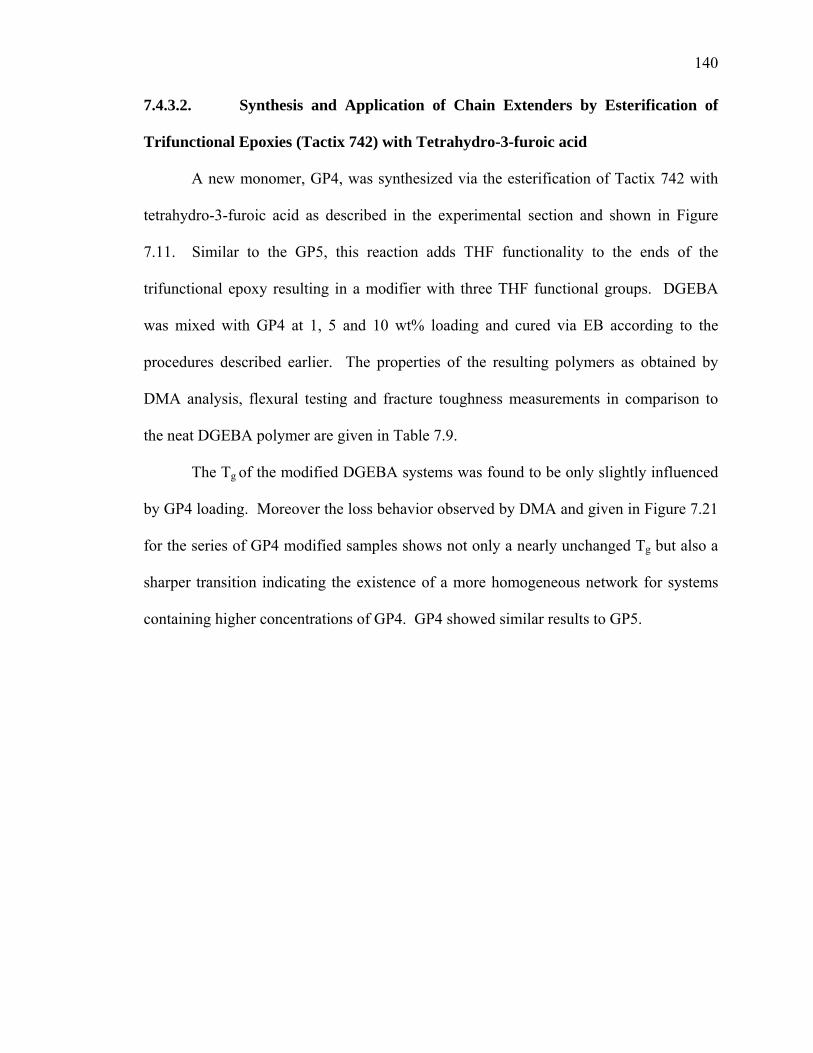
140
7.4.3.2. Synthesis and Application of Chain Extenders by Esterification of
Trifunctional Epoxies (Tactix 742) with Tetrahydro-3-furoic acid
A new monomer, GP4, was synthesized via the esterification of Tactix 742 with
tetrahydro-3-furoic acid as described in the experimental section and shown in Figure
7.11. Similar to the GP5, this reaction adds THF functionality to the ends of the
trifunctional epoxy resulting in a modifier with three THF functional groups. DGEBA
was mixed with GP4 at 1, 5 and 10 wt% loading and cured via EB according to the
procedures described earlier. The properties of the resulting polymers as obtained by
DMA analysis, flexural testing and fracture toughness measurements in comparison to
the neat DGEBA polymer are given in Table 7.9.
The Tg of the modified DGEBA systems was found to be only slightly influenced
by GP4 loading. Moreover the loss behavior observed by DMA and given in Figure 7.21
for the series of GP4 modified samples shows not only a nearly unchanged Tg but also a
sharper transition indicating the existence of a more homogeneous network for systems
containing higher concentrations of GP4. GP4 showed similar results to GP5.
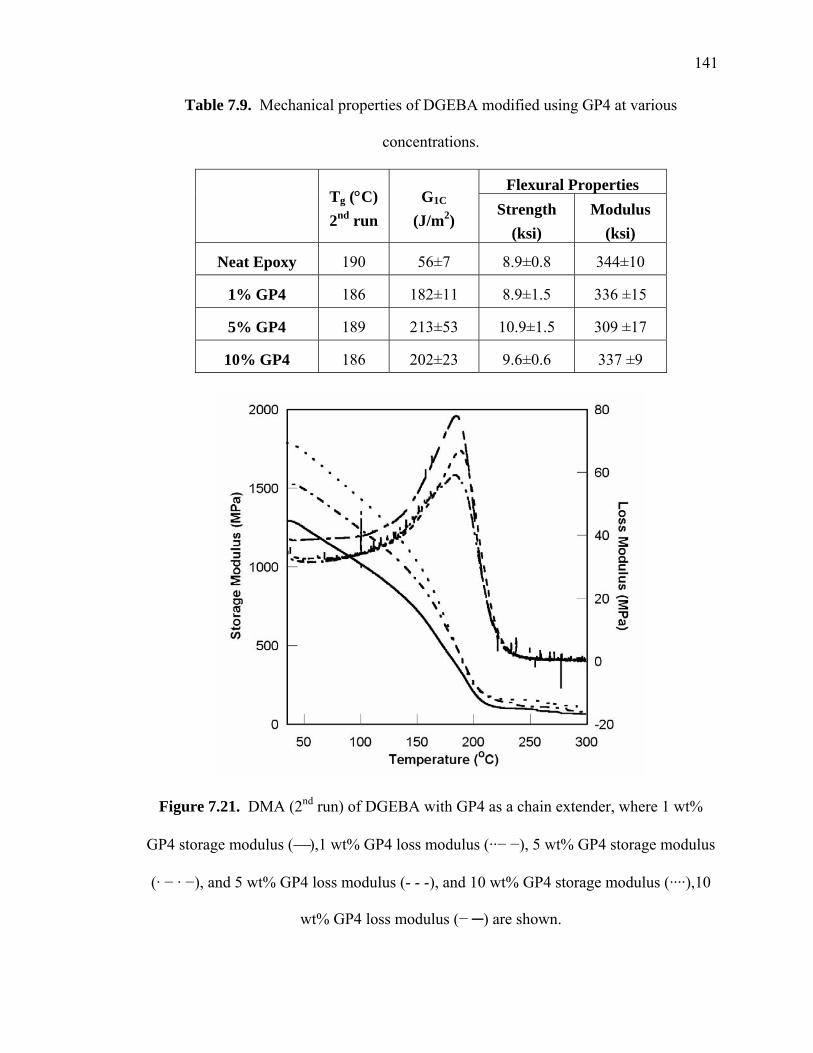
141
Table 7.9. Mechanical properties of DGEBA modified using GP4 at various
concentrations.
Flexural Properties
Tg (°C) 2nd run
G1C (J/m2)
Strength (ksi)
Modulus (ksi)
Neat Epoxy 190 56±7 8.9±0.8 344±10
1% GP4 186 182±11 8.9±1.5 336 ±15
5% GP4 189 213±53 10.9±1.5 309 ±17
10% GP4 186 202±23 9.6±0.6 337 ±9
Figure 7.21. DMA (2nd run) of DGEBA with GP4 as a chain extender, where 1 wt%
GP4 storage modulus (⎯),1 wt% GP4 loss modulus (··− −), 5 wt% GP4 storage modulus
(· − · −), and 5 wt% GP4 loss modulus (- - -), and 10 wt% GP4 storage modulus (····),10
wt% GP4 loss modulus (− ─) are shown.
142
7.4.4. Cyclic chain extenders
The use of trifunctional epoxy to synthesize new monomers with THF
functionality showed improvement with the mechanical properties while maintaining the
Tg. However further improvement was desired to increase the Tg of the epoxy system.
The Tg can be improved by increasing the stiffness of the of the network by adding
monomers with cyclic backbones. This section explores the use of cyclic monomers
containing the THF functionality to further improve the final polymer.
7.4.4.1. Synthesis and Application of Chain Extenders of DGEBA and
Coumaran
JL1 was synthesized by mixing of DGEBA with 2,3-dihydrobenzofuran as
described in the experimental section. DGEBA was mixed with JL1 at 1, 5 and 10 wt%
loading and cured via EB according to the procedures described earlier. The properties
of the resulting polymers as obtained by DMA analysis, flexural testing and fracture
toughness measurements in comparison to the neat DGEBA polymer are given in Table
7.10.
The Tg of the modified DGEBA systems was found to cause a double peak by JL1
loading as shown in Figure 7.22. This indicated two different polymers forming in the
system. The first Tg peak is extremely low and continues to suffer with increasing
amounts of JL1. The second Tg peak is similar to that of regular DGEBA, but decreased
significantly with higher concentrations of JL1. However all the other mechanical
properties increase with increase amounts of the comonomer. However due to the Tg
behavior, this comonomer JL1 was not tested futher.
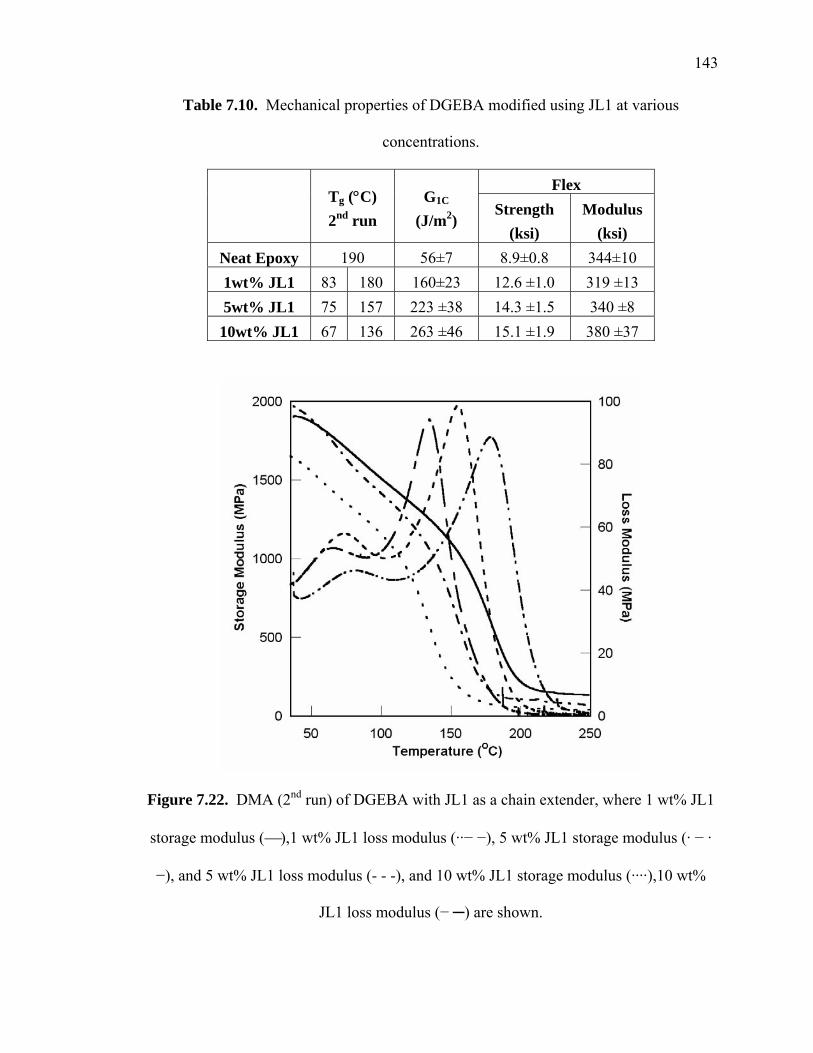
143
Table 7.10. Mechanical properties of DGEBA modified using JL1 at various
concentrations.
Flex
Tg (°C) 2nd run
G1C (J/m2)
Strength (ksi)
Modulus (ksi)
Neat Epoxy 190 56±7 8.9±0.8 344±10 1wt% JL1 83 180 160±23 12.6 ±1.0 319 ±13 5wt% JL1 75 157 223 ±38 14.3 ±1.5 340 ±8
10wt% JL1 67 136 263 ±46 15.1 ±1.9 380 ±37
Figure 7.22. DMA (2nd run) of DGEBA with JL1 as a chain extender, where 1 wt% JL1
storage modulus (⎯),1 wt% JL1 loss modulus (··− −), 5 wt% JL1 storage modulus (· − ·
−), and 5 wt% JL1 loss modulus (- - -), and 10 wt% JL1 storage modulus (····),10 wt%
JL1 loss modulus (− ─) are shown.
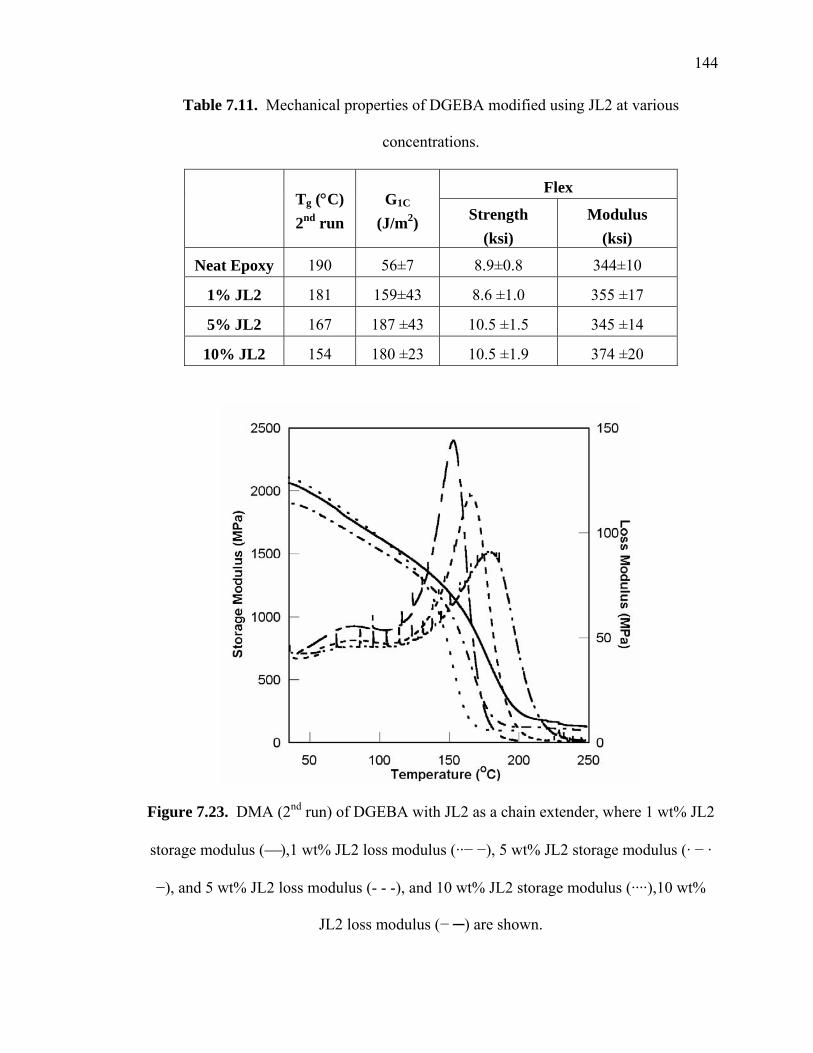
144
Table 7.11. Mechanical properties of DGEBA modified using JL2 at various
concentrations.
Flex
Tg (°C) 2nd run
G1C (J/m2) Strength
(ksi) Modulus
(ksi)
Neat Epoxy 190 56±7 8.9±0.8 344±10
1% JL2 181 159±43 8.6 ±1.0 355 ±17
5% JL2 167 187 ±43 10.5 ±1.5 345 ±14
10% JL2 154 180 ±23 10.5 ±1.9 374 ±20
Figure 7.23. DMA (2nd run) of DGEBA with JL2 as a chain extender, where 1 wt% JL2
storage modulus (⎯),1 wt% JL2 loss modulus (··− −), 5 wt% JL2 storage modulus (· − ·
−), and 5 wt% JL2 loss modulus (- - -), and 10 wt% JL2 storage modulus (····),10 wt%
JL2 loss modulus (− ─) are shown.
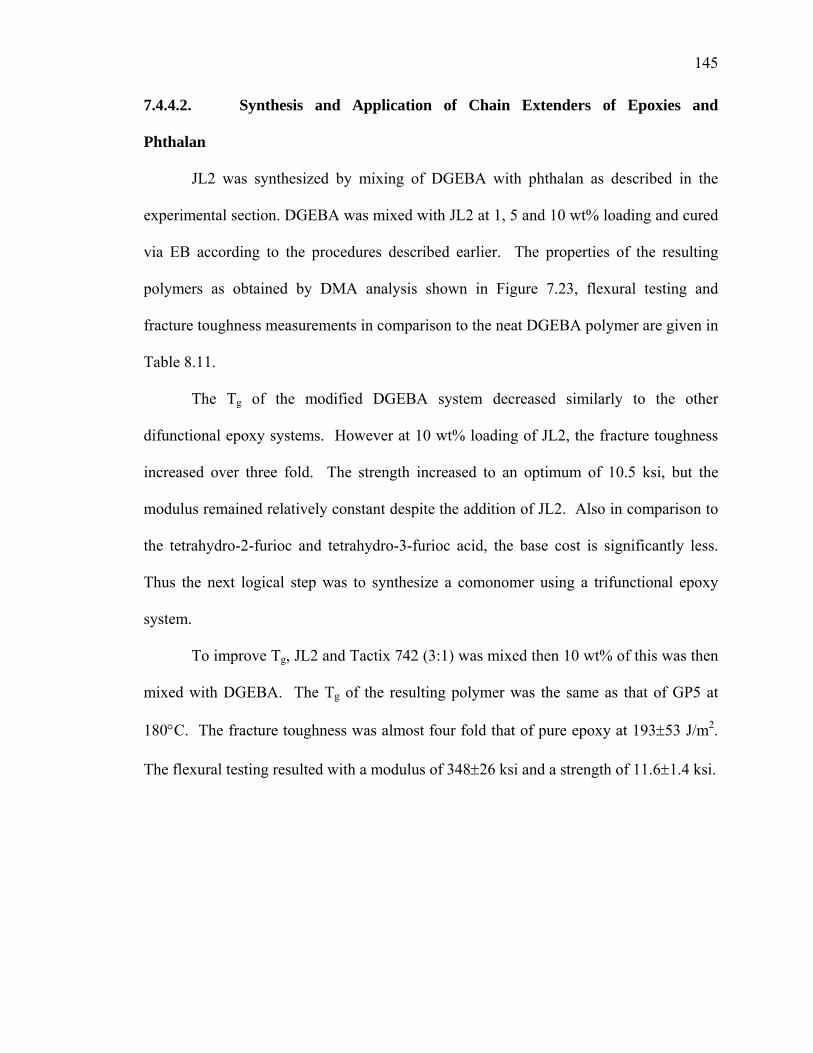
145
7.4.4.2. Synthesis and Application of Chain Extenders of Epoxies and
Phthalan
JL2 was synthesized by mixing of DGEBA with phthalan as described in the
experimental section. DGEBA was mixed with JL2 at 1, 5 and 10 wt% loading and cured
via EB according to the procedures described earlier. The properties of the resulting
polymers as obtained by DMA analysis shown in Figure 7.23, flexural testing and
fracture toughness measurements in comparison to the neat DGEBA polymer are given in
Table 8.11.
The Tg of the modified DGEBA system decreased similarly to the other
difunctional epoxy systems. However at 10 wt% loading of JL2, the fracture toughness
increased over three fold. The strength increased to an optimum of 10.5 ksi, but the
modulus remained relatively constant despite the addition of JL2. Also in comparison to
the tetrahydro-2-furioc and tetrahydro-3-furioc acid, the base cost is significantly less.
Thus the next logical step was to synthesize a comonomer using a trifunctional epoxy
system.
To improve Tg, JL2 and Tactix 742 (3:1) was mixed then 10 wt% of this was then
mixed with DGEBA. The Tg of the resulting polymer was the same as that of GP5 at
180°C. The fracture toughness was almost four fold that of pure epoxy at 193±53 J/m2.
The flexural testing resulted with a modulus of 348±26 ksi and a strength of 11.6±1.4 ksi.
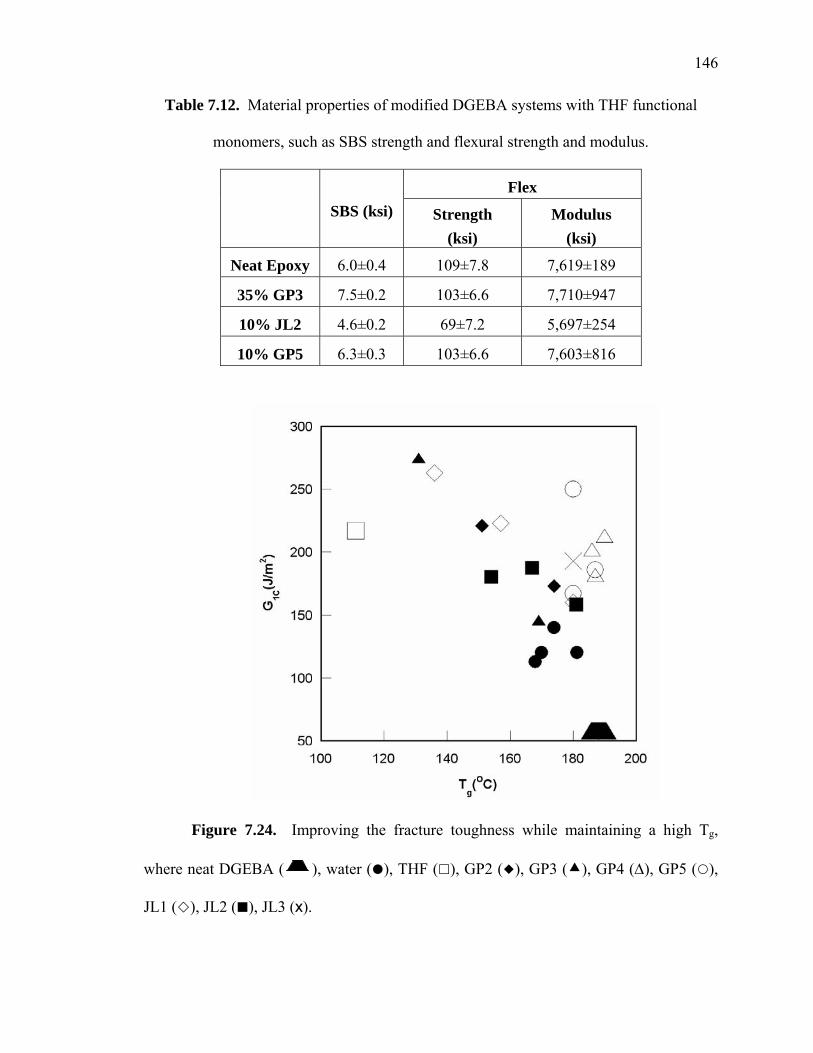
146
Table 7.12. Material properties of modified DGEBA systems with THF functional
monomers, such as SBS strength and flexural strength and modulus.
Flex SBS (ksi) Strength
(ksi) Modulus
(ksi)
Neat Epoxy 6.0±0.4 109±7.8 7,619±189
35% GP3 7.5±0.2 103±6.6 7,710±947
10% JL2 4.6±0.2 69±7.2 5,697±254
10% GP5 6.3±0.3 103±6.6 7,603±816
Figure 7.24. Improving the fracture toughness while maintaining a high Tg,
where neat DGEBA ( ), water ( ), THF ( ), GP2 ( ), GP3 ( ), GP4 (Δ), GP5 ( ),
JL1 ( ), JL2 ( ), JL3 (x).
147
7.4.5. Composite Properties
Carbon fiber composites were fabricated using a wet layup technique and cured
by EB as describe in the experimental section. Modification of DGEBA resin with the
THF functional monomers GP3, GP5, and JL2 may improve interlaminar shear behavior
as measured by SBS tests shown in Table 7.12. The SBS strength of neat DGEBA –
carbon fiber composites using G’ sized 5HS AS4 fabric was 6.0±0.4 ksi. This is a typical
result for EB cured epoxy systems and is one of the principal shortcomings associated
with such materials. A similarly fabricated composite using DGEBA modified with 35
wt% GP3 as a matrix was found to have SBS strength of 7.5±0.2 ksi which is a
considerable improvement that further illustrates the potential of THF functional
modifiers. JL2 matrix was found to have SBS strength of 4.6±0.2 ksi. In the case of the
modified DGEBA with the trifunctional monomer, for 10 wt% GP5 the SBS strength was
found to be 6.3±0.3 ksi. The improvement was slight in this situation, however with
higher loads can result in increased interlaminar shear behavior. However there were
difficulties in the manufacture of these composites. The curing process must be applied
immediately after the fabrication of the composite; unfortunately the turn around time for
this was not ideal. Time is a huge factor in manufacturing the composites due to the
system being under vacuum and when sent over for the curing process some vacuum is
lost over time. When vacuum is reapplied with heat the resin in the composite has the
potential of being sucked out. In fact, when the composites were cut, there were voids in
many of the samples. Most importantly these systems are sensitive to light and water as
described in the previous chapters. The exposure to daylight could initiate the cure
process and the water could plasticize the system. The flexural tests resulted in the
148
following, where the strength of pure epoxy was 109±7.8 ksi and the modulus was
7,619±189 ksi. For JL2, the strength was 69±7.2 ksi and the modulus was 5,697±254 ksi.
For GP5 modified system the strength was 103±6.6 ksi and the modulus was 7,603±816
ksi. Despite the manufacturing difficulties, the initial composites clearly show a
significant increase in interlaminar shear with the copolymerization of epoxies and THF
functional monomers.
7.5. Conclusions
One of the major drawbacks associated with EB curing of DGEBA based systems
is the poor fracture toughness obtained for such materials. In this chapter new chain
extending modifiers were explored to tailor the network structure and improve
mechanical properties of DGEBA epoxies cured cationically via EB. Initial tests with
CHO, PGE, and THF lead to the discovery that THF copolymerizes readily with DGEBA
under EB irradiation and in the presence of a photoinitiator such as diphenyl iodonium
hexafluoroantimonate. It is presumed that via the ring opening of the THF molecule, a
tetramethylene ether grouping is added to the crosslinked network comprised primarily of
DGEBA. This results in lower crosslink density (lower Tg) and higher fracture toughness.
In order to maintain Tg while improving fracture toughness a number of novel
difunctional and trifunctional monomers were developed based on endcaping difunctional
and trifunctional epoxies with THF moieties via appropriate synthetic procedures. These
monomers were used as modifiers of DGEBA in the range of 1-35 wt%. All
combinations increased fracture toughness considerably and in the case of the
trifunctional system at 10 wt% loading, fracture toughness was improved almost five-fold
with little effect on Tg resulting in a material with G1c of 250±42 J/m2 and a Tg of 180°C.
149
The results of DGEBA resin modification conducted in this investigation are summarized
in Figure 7.24 as a plot of G1C vs Tg. It is clear that fracture toughness can be improved
while maintaining Tg. Moreover, preliminary results suggest that the resin improvements
also translate into improved composite properties.
7.6. References
1. Beziers D, Capdepuy B. SAMPE Int Symp, 35 1220 (1990).
2. Saunders CB, Lopata VJ, Kremers W, McDougall TE, Tateishi M, Singh A.
SAMPE Int Symp, 38, 1682 (1993).
3. Saunders CB, Lopata VJ, Kremers W, Chung M, Barnard JW. SAMPE Int Symp,
40, 112 (1995).
4. Janke CJ, Havens SJ, Dorsey GF, Lopata VJ. SAMPE Int Tech Conf, 41, 196
(1996).
5. Janke CJ, Havens SJ, Dorsey GF, Lopata VJ. SAMPE Int Tech Conf, 28, 901
(1996).
6. Janke CJ, Havens SJ, Lopata VJ, Chung M. SAMPE Int Tech Conf, 28, 901
(1996).
7. Goodman DL, Brix DL, Palmese GR, Chen A. SAMPE Int Symp, 41, 207 (1996).
8. Janke CJ, Norris RE, Yarborough K, Havens SJ, Lopata VJ. SAMPE Int Symp,
42, 477 (1997).
9. Dabestani R, Ivanov I. SAMPE Int Symp, 46, 2075 (2001).
10. Palmese GR, Ghosh NN, McKnight SH. SAMPE Int Symp, 45 (2000).
11. Chabanne P, Tighzert L, Pascault J. J. Appl. Polym. Sci., 53, 769(1994).
12. Chabanne P, Tighzert L, Pascault J. J. Appl. Polym. Sci., 53, 787 (1994).
150
13. Chabanne P, Tighzert L, Pascault J, Bonnetot. J. Appl. Polym. Sci., 49, 685
(1993).
14. Bouillon N, Pascault J, Tighzert L. Makromol Chem, 191, 1403 (1990).
15. Bouillon N, Pascault J, Tighzert L. Makromol Chem, 191, 1417 (1990).
16. Bouillon N, Pascault J, Tighzert L. Makromol Chem, 191, 1435 (1990).
17. Lunak S, Krejcar E. Die Angew Makol Chem, 10, 109 (1970).
18. Lee J, Johnston A, Palmese G.R. SAMPE Int Symp, (2004).
19. Lee J, Palmese GR. SAMPE Int Symp, (2005).
151
CHAPTER 8: CONCLUSIONS
8.1. Summary
This work developed a fundamental understanding of the physical and chemical
processes underlying EB polymerization of epoxy systems in order to design improved
systems. This investigation included (i) developing a cure kinetics model that accounts
for active center deactivation and the effects of water (ii) developing an understanding of
the relationships among cure process/variables with network structure/morphology and
properties and (iii) designing new systems with improved properties based on the science
base developed in i and ii. This was accomplished by investigating the influence of
process variables such as temperature, time, dose/dose rate, initiator concentration, and
impurities. NIR spectroscopy was also further developed and used to investigate the EB
induced polymerization of epoxy cured systems.
8.2. Water Reactions
The purpose of this investigation was to gain further understanding of the
influence of water on phenyl glycidyl ether (PGE) and diglycidyl ether of bispehnol A
(DGEBA). A near infrared (NIR) spectroscopy technique reported earlier was further
developed to perform real-time in-situ kinetic analysis of radiation induced, electron
beam (EB) and ultraviolet (UV), cationic polymerization of epoxy systems with water.
Experiments were conducted with four purposes: (1) to quantify the concentration of
water in PGE and DGEBA prior to cure via near infrared spectroscopy (NIR); (2) to
determine the reaction kinetics of the mono-epoxy system PGE and water cured via UV
and EB (3) to determine the reaction kinetics of di-epoxy system DGEBA and water
cured via UV and EB; and (4) and to investigate the effect of water on the network
152
formation of a DGEBA epoxy-matrix composite. The chemical kinetics results indicated
that the presence of water affects the polymerization of the epoxy systems by (a) the
appearance of a pronounced retardation period, (b) an accelerated reaction following the
retardation period when compared to “dry” systems, and (c) higher conversion at shorter
times. A kinetic mechanism was proposed to explain this behavior and a model based on
this mechanism was found to be in good qualitative agreement with experimental results.
It was also shown that the presence of water influences the behavioral characteristics of
cationically cured epoxies by reducing glass transition temperature (Tg) and increasing
fracture toughness.
8.3. Dark Reactions
Process variables, such as dose, dose rate, initiator concentration, temperature,
time, and impurities, influence the generation of active centers and subsequent
polymerization of epoxies induced by ultraviolet (UV) and electron beam (EB) radiation
by cationic mechanisms. Longer exposure to radiation produces higher concentration of
active centers that has previously been modeled by a simple first order kinetic model that
assumes infinite life for the generated centers. However, it appears that such a model is
not suitable for predicting the behavior of interrupted EB exposure experiments. NIR
spectroscopy was used to monitor the epoxy concentration throughout the polymerization
of glycidyl ethers for experiments in which the EB is turned off before complete
conversion is achieved and dark reactions are monitored thereafter. This investigation is
based on the continued development of a near infrared (NIR) spectroscopic technique for
performing real-time in situ kinetic measurements of EB induced cationic polymerization
of epoxy systems. The results of these experiments indicate that a significant reduction
153
in reactivity occurs when radiation is curtailed and that the active centers possess very
long half-lives.
8.4. Co-monomers for Chain Extension
The overall objective of this work was the design of improved EB cured epoxy
systems based on diglycidyl ether of bisphenol A (DGEBA). One method for designing
such systems is the use of network modifiers. This work developed a new class of chain
extenders based on the ring opening copolymerization of tetrahydrofuran (THF) with
DGEBA. Copolymerization of THF with DGEBA can be induced by EB in the presence
of an appropriate photoinitiator. THF was found to increase fracture toughness with a
concomitant decrease in glass transition temperature. THF presents practical processing
difficulties associated with its high volatility. Thus a series of novel THF functional
comonomers were designed to mitigate the aforementioned drawbacks associated with
THF. These include difunctional and trifunctional monomers possessing THF
functionality. The system was further modified by introducing cyclic backbone to add
stiffness to the network in order to increase the Tg. Methods of synthesis and the
properties of DGEBA systems modified with these novel monomers were presented. It
was found that the fracture toughness of EB cured DGEBA systems can be improved
almost five fold without loss of Tg. Moreover preliminary results indicate that composite
properties can also be improved using these comonomers.