categorization training increases the perceptual ... · categorization training increases the...
TRANSCRIPT
Cognition 139 (2015) 105–129
Contents lists available at ScienceDirect
Cognition
journal homepage: www.elsevier .com/locate /COGNIT
Categorization training increases the perceptual separabilityof novel dimensions
http://dx.doi.org/10.1016/j.cognition.2015.02.0060010-0277/� 2015 Elsevier B.V. All rights reserved.
⇑ Corresponding author. Tel.: +1 805 893 7909; fax: +1 805 893 4303.E-mail address: [email protected] (F.A. Soto).
Fabian A. Soto ⇑, F. Gregory AshbyDepartment of Psychological and Brain Sciences, University of California, Santa Barbara, Santa Barbara, CA 93106, USA
a r t i c l e i n f o a b s t r a c t
Article history:Received 13 March 2014Revised 18 February 2015Accepted 21 February 2015
Keywords:Perceptual separabilityPerceptual independenceCategory learningGeneral recognition theory
Perceptual separability is a foundational concept in cognitive psychology. A variety ofresearch questions in perception – particularly those dealing with notions such as‘‘independence,’’ ‘‘invariance,’’ ‘‘holism,’’ and ‘‘configurality’’ – can be characterized as spe-cial cases of the problem of perceptual separability. Furthermore, many cognitive mecha-nisms are applied differently to perceptually separable dimensions than to non-separabledimensions. Despite the importance of dimensional separability, surprisingly little isknown about its origins. Previous research suggests that categorization training can leadto learning of novel dimensions, but it is not known whether the separability of suchdimensions also increases with training. Here, we report evidence that training in a cat-egorization task increases perceptual separability of the category-relevant dimensionaccording to a variety of tests from general recognition theory (GRT). In Experiment 1, par-ticipants who received pre-training in a categorization task showed reduced Garner inter-ference effects and reduced violations of marginal invariance, compared to participantswho did not receive such pre-training. Both of these tests are theoretically related to viola-tions of perceptual separability. In Experiment 2, participants who received pre-training ina categorization task showed reduced violations of perceptual separability according to amodel-based analysis of data using GRT. These results are at odds with the commonassumption that separability and independence are fixed, hardwired characteristics of fea-tures and dimensions.
� 2015 Elsevier B.V. All rights reserved.
1. Introduction
An important task of perceptual systems is to produce are-description of the incoming sensory input, through arepresentation that is useful for the tasks that are usuallyencountered in the natural environment. One way tocharacterize internal stimulus representations is to deter-mine whether a set of ‘‘privileged’’ stimulus propertiesexists, which can be used to describe a variety of stimuli,and that are processed and represented independentlyfrom one another. In perceptual science, an important
amount of effort has been dedicated to understandingwhat aspects of stimuli are represented in such anindependent fashion (e.g., Bruce & Young, 1986; Haxby,Hoffman, & Gobbini, 2000; Kanwisher, 2000; Op deBeeck, Haushofer, & Kanwisher, 2008; Stankiewicz, 2002;Ungerleider & Haxby, 1994; Vogels, Biederman, Bar, &Lorincz, 2001).
There are many different conceptual and operationaldefinitions of what it means for two stimulus dimensionsto be independent (Ashby & Townsend, 1986), but perhapsthe most widely studied and influential type of indepen-dence is dimensional separability. Separable stimulusdimensions are those that can be selectively attendedand that directly determine the similarity among stimuli

106 F.A. Soto, F.G. Ashby / Cognition 139 (2015) 105–129
(Garner, 1974; Shepard, 1991). This is in contrast to inte-gral dimensions, which cannot be selectively attendedand do not directly determine the similarity among stim-uli. When stimuli vary along integral dimensions, theirsimilarity is directly perceived and the notion of dimen-sions loses meaning.
There are two main reasons to believe that a completeunderstanding of complex forms of visual cognition, suchas object recognition and categorization, will benefit froma good understanding of perceptual separability. The firstreason is that many important questions in perceptualscience can be understood as questions about perceptualseparability of object dimensions.
For example, in the area of visual object recognition, thequestion of whether object representations are invariantacross changes in identity-preserving variables (such asrotation and translation; for reviews, see Biederman,2001; Kravitz, Vinson, & Baker, 2008; Peissig & Tarr,2007) is essentially the same as the question of whetherobject representations are perceptually separable fromsuch variables. Shape dimensions that may be importantfor invariant object recognition have been shown to beseparable from other shape dimensions and from view-point information, according to traditional tests of sep-arability (Stankiewicz, 2002).
A second example comes from the area of face percep-tion. It has been proposed that a hallmark of human faceperception is that faces are processed in a configural orholistic manner (for reviews, see Farah, Wilson, Drain, &Tanaka, 1998; Maurer, Grand, & Mondloch, 2002; Richler,Palmeri, & Gauthier, 2012). Configural or holistic face per-ception can be seen as non-separable processing of differ-ent face features (e.g., Mestry, Wenger, & Donnelly, 2012;Richler, Gauthier, Wenger, & Palmeri, 2008; Thomas,2001). Similarly, influential theories of face processinghave proposed that different aspects of faces, such as iden-tity and emotional expression, are processed indepen-dently (e.g., Bruce & Young, 1986; Haxby et al., 2000) andthese hypotheses are usually investigated using tests ofperceptual separability (e.g., Fitousi & Wenger, 2013;Ganel & Goshen-Gottstein, 2004; Schweinberger &Soukup, 1998; Soto, Musgrave, Vucovich, & Ashby, 2015).
Casting such research questions in terms of perceptualseparability is not only possible, but desirable. As we willsee below, perceptual separability has a precise formal def-inition within multidimensional signal detection theory(Ashby & Townsend, 1986; for a review, see Ashby &Soto, 2015), which offers the advantage of providing strictdefinitions to rather ambiguous concepts such as indepen-dence, holistic processing, configural processing, etcetera(e.g., Fitousi & Wenger, 2013; Mestry et al., 2012; Richleret al., 2008). Furthermore, it allows us to determinewhether behavioral evidence of a dimensional interactionis due to true perceptual interactions versus interactionsat the level of decisional processes.
The fact that a variety of research questions in visualcognition can be characterized as special cases of the prob-lem of perceptual separability suggests that a better under-standing of this general problem, including explanations ofwhy some dimensions are separable and how they
acquired such status, would necessarily lead to a betterunderstanding of each of the special cases.
A second reason why an understanding of perceptualseparability is important to understand visual cognitionis that considerable evidence suggests that higher-levelcognitive mechanisms are applied differently when stimulidiffer along separable dimensions rather than along inte-gral dimensions. Given the definition of perceptual sep-arability, the most obvious of such mechanisms isselective attention, which is more easily deployed to sep-arable than to non-separable dimensions (e.g., Garner,1970, 1974; Goldstone, 1994b). Other examples of pro-cesses that might be applied differently to separable-di-mension and integral-dimension stimuli are the rules bywhich different sources of predictive and causal knowledgeare combined (Soto, Gershman, & Niv, 2014), as well as theperformance cost of storing an additional object in visualworking memory (Bae & Flombaum, 2013).
There is much evidence suggesting that the mecha-nisms used by people to categorize stimuli vary dependingon whether or not categories differ along separable dimen-sions. Some of this evidence comes from studies usingunsupervised categorization tasks, in which people areasked to group stimuli in two or more categories withoutfeedback about their performance. When stimuli inunsupervised categorization tasks vary along separabledimensions, people rely almost exclusively on one-dimen-sional strategies (Handel & Imai, 1972; Handel, Imai, &Spottswood, 1980; Medin, Wattenmaker, & Hampson,1987), even in tasks in which categories are not definedby a simple one-dimensional rule and after being explicitlytold that the optimal strategy is to integrate informationfrom two dimensions (Ashby, Queller, & Berretty, 1999).Furthermore, unsupervised learning is possible only whenthe categories clearly differ along a single dimension(Ashby et al., 1999). On the other hand, when stimuli varyalong integral dimensions, people show limited ability tolearn unsupervised categories and they do not show astrong preference for one-dimensional rules. Instead, theyshow a variety of strategies, including integration of infor-mation from both dimensions (Ell, Ashby, & Hutchinson,2012).
A similar pattern of results is found in supervised cat-egorization tasks, in which categorization choices are fol-lowed by feedback. When stimuli vary along separabledimensions, learning a category structure in which goodperformance requires attending to a single dimension ismuch easier for people than learning an equivalent cate-gory structure in which good performance requiresintegration of information from two dimensions (e.g.,Smith, Beran, Crossley, Boomer, & Ashby, 2010). There isa large body of evidence suggesting that the one-dimen-sional categorization task is learned through a rule-basedcategorization system, whereas the information-integra-tion task is learned through a separate procedural cat-egorization system (for reviews, see Ashby & Maddox,2005; Ashby & Valentin, 2005). On the other hand, whenstimuli vary along integral dimensions, a one-dimensionaltask is not consistently easier to learn than an information-integration task (Ell et al., 2012).

Fig. 1. Example of a multivariate normal GRT model for a 2 � 2 design (2dimensions, each with 2 levels). Ellipses represent contours of equallikelihood for the perceptual distribution of a particular stimulus.Marginal distributions are presented in the left and bottom of the figure,next to their corresponding dimension.
F.A. Soto, F.G. Ashby / Cognition 139 (2015) 105–129 107
Despite the importance of dimensional separability forour understanding of both perception and high-level cog-nition, surprisingly little is known about its origins.Specifically, an important open question is whether sep-arable dimensions can be learned and what are the condi-tions that might foster such learning. Our previous reviewof the literature suggests that this is a foundational ques-tion in the field of object categorization and recognition.If perceptual separability of a dimension can be learnedand we could understand the mechanisms by which suchlearning happens, then we would not only be in a betterposition to explain why some object dimensions are ‘‘spe-cial,’’ in the sense of being processed independently, butalso how they became special (i.e., what conditions fos-tered this learning) and why they should be processed insuch a privileged fashion (i.e., why it is adaptive for high-level cognitive mechanisms to operate differently on theserepresentations).
In the following section, we introduce general recogni-tion theory (GRT), a formal framework within which per-ceptual separability can be defined and studied. This isfollowed by a review of previous literature related to theidea of separability learning.
1.1. GRT and a formal definition of perceptual separability
GRT is an extension of signal detection theory to cases inwhich stimuli vary along two or more dimensions (Ashby &Townsend, 1986; for a tutorial review, see Ashby & Soto,2015). It offers a framework in which different types ofdimensional interactions can be defined formally and stud-ied, while inheriting from signal detection theory the abilityto dissociate perceptual from decisional sources for suchinteractions. For this reason, GRT is arguably the best frame-work for the analysis and interpretation of studies aimed attesting different forms of dimensional independence.
GRT assumes that repeated presentations of a singlestimulus produce different perceptual effects, which followsome probability distribution. The most common applica-tions of GRT are to tasks in which stimuli vary in twodimensions, A and B, each with two stimulus components,resulting in four stimuli: A1B1, A2B1, A2B1 and A2B2. Fig. 1 isan example of a GRT model for such a 2 � 2 design. In thismodel, each stimulus generates perceptual effects accord-ing to a different bivariate normal distribution. Each dis-tribution is represented in the figure by a differentellipse, which represents the set of all percepts that are eli-cited with equal likelihood by the stimulus. For any ellipse(and therefore any stimulus), percepts inside the ellipseare more likely than percepts outside the ellipse. Aftermany presentations of a particular stimulus, the scatter-plot of perceptual effects will take the shape of the ellipsecorresponding to that stimulus. However, in some cases,presenting a stimulus will produce a percept that lies out-side that stimulus’ ellipse, perhaps closer to the ellipsecorresponding to a different stimulus. In all cases, a deci-sion must be made about what stimulus was actually pre-sented. This decision process is modeled by assuming thata participant sets decision bounds that divide the percep-tual space into different regions, each corresponding tothe identification of a particular stimulus. The simplest
decision bounds are lines, like those shown in Fig. 1, whichare used to make decisions about both the level of dimen-sion A and the level of dimension B.
In this framework, dimension A is perceptually sep-arable from dimension B if the perceptual effects associatedwith dimension A do not depend on the level of dimensionB. Mathematically this occurs if (and only if) the marginaldistribution of perceptual effects along dimension A is thesame across levels of B. Marginal distributions for dimen-sions A and B are depicted at the bottom and left of Fig. 1,respectively. The marginal distributions for dimension Bare identical, regardless of the level of A, meaning thatdimension B is perceptually separable from dimension A.Conversely, the marginal distributions for dimension Aare farther apart for level 1 of dimension B than for level2 of dimension B, meaning that dimension A is not per-ceptually separable from dimension B.
There are other forms of dimensional interaction thatcan be defined within GRT besides perceptual separability(Ashby & Townsend, 1986). One of these is decisional sep-arability. Dimension A is decisionally separable fromdimension B if the strategy used to decide the level ofdimension A does not depend on the perceived value ofdimension B. Mathematically, decisional separability holdsif (and only if) the decision bounds are linear and orthogo-nal to each stimulus dimension. In Fig. 1, this means thatdimension A is decisionally separable from dimension B,but dimension B is not decisionally separable from dimen-sion A.
Finally, perceptual independence refers to dimensionalinteractions within a single stimulus. Perceptual indepen-dence holds for stimulus AiBj if the perceived value of theA component is statistically independent from the per-ceived value of the B component, which is true in themultivariate normal case when the correlation between

108 F.A. Soto, F.G. Ashby / Cognition 139 (2015) 105–129
dimensions is zero. In Fig. 1, the diagonally-oriented ellipsefor stimulus A1B2, representing a positive correlationbetween dimensions, is a sign of violations of perceptualindependence for that stimulus.
In applications of GRT, inferences are made about thesetypes of dimensional interactions from behavioral data.There is a number of theorems in the literature that linkeach type of dimensional interaction with statistics thatcan be computed from identification and categorizationdata (Ashby & Maddox, 1994; Ashby & Townsend, 1986;Kadlec & Townsend, 1992a, 1992b). Another approach isto fit one or more GRT models directly to the data; theparameter values of the best-fitting model can then beused to characterize the pattern of dimensional interac-tions (Ashby & Lee, 1991; Soto et al., 2015; Thomas,2001). Here, we will use both the summary statistics andmodel-based approaches to study perceptual separability.
There are clear advantages to using GRT for the study ofperceptual separability, instead of simply relying on tradi-tional tests and operational definitions. The theory pro-vides a formal definition of perceptual separability thatcoherently links together a number of operational def-initions. This permits the consistent study of the sameunderlying concept through different tests and experimen-tal designs. Furthermore, GRT allows the focus to be onperceptual separability by dissociating its influence onbehavior from other forms of interactions. In particular,here we will be interested in whether training in cat-egorization tasks produces changes in perceptual sep-arability, independently of any changes in decisionstrategies. The analysis of dimensional interactions viaGRT is critical to achieving this goal, as it is known that tra-ditional tests of separability are influenced by variablessuch as experimental instructions (Foard & Kemler-Nelson, 1984; Melara, Marks, & Lesko, 1992), which arelikely to affect decision strategies instead of perceptualinteractions (Ashby, Waldron, Lee, & Berkman, 2001).
1.2. Can separable dimensions be learned?
The hypothesis that learning might have an influenceon the separability of psychological dimensions is as oldas the concept of separability itself (see Garner, 1970). Insupport of this hypothesis, developmental data haveshown that the ability to selectively attend to separablestimulus dimensions develops with age. Stimulus dimen-sions that are perceived as integrated wholes by pre-schoolchildren are instead perceived as analytic components byolder children and adults (for a recent review, seeHanania & Smith, 2010). However, it is not clear that suchdevelopmental trends are a product of learning, or even ofincrements in the separability of specific dimensions, asthey could be the product of developmental changes inselective attention abilities. Evidence suggesting that colorexperts can selectively attend to at least some integralcolor dimensions more easily than non-experts moreclearly points towards a role of learning in determiningdimensional separability (Burns & Shepp, 1988).
Although little is known about what conditions mightfoster learning of separable dimensions, one possibility isthat these conditions are met in categorization tasks. A
controversial hypothesis in the field of object categoriza-tion and recognition is that these processes are oftenaccompanied by the creation of new features (Schyns,Goldstone, & Thibaut, 1998).
There is a large body of work suggesting that cat-egorization training does produce changes in perceptualrepresentations of the stimuli involved (for recent reviews,see Goldstone, Gerganov, Landy, & Roberts, 2009;Goldstone & Hendrickson, 2010). Stimulus dimensions thatare relevant for category discrimination become more dis-tinctive, in what has been termed ‘‘acquired distinctive-ness.’’ Operationally, acquired distinctiveness is observedas an increase in discriminability along the category-rele-vant dimension after categorization training. A special caseoccurs when the greatest enhancement in discriminabilityis seen at the boundary between categories, which can beinterpreted as a case of acquired categorical perception.On the other hand, stimulus components that are irrele-vant for category discrimination become less distinctive,in what has been termed ‘‘acquired equivalence.’’Operationally, acquired equivalence is observed as adecrease in discriminability along the category-irrelevantdimension after categorization training.
Some evidence suggests that categorization traininginvolving already-existing separable dimensions producesboth acquired distinctiveness along the relevant dimensionand acquired equivalence along the irrelevant dimension.On the other hand, categorization training involving inte-gral dimensions produces acquired distinctiveness in bothrelevant and irrelevant dimensions (Goldstone, 1994b).These results are consistent with the possibility that cat-egorization training alters selective attention to the cat-egory-relevant dimension. With separable dimensions,the category-relevant dimension can be selectivelyattended, whereas with integral dimensions, attentionmust be paid to both dimensions. Still, the increase in dis-criminability of integral dimensions was larger for the cat-egory-relevant dimension than the category-irrelevantdimension. Goldstone interpreted these results as suggest-ing that categorization training produces differentiation ofintegral dimensions.
However, using the same integral dimensions asGoldstone (saturation and brightness), Foard and Kemler-Nelson (1984) found evidence that learning effects in asorting task transferred across different sets of stimuli onlywhen the task-relevant dimension corresponded to thedimensions identified by the experimenter (that is, eithersaturation or brightness). If the task-relevant dimensionwas rotated 45 degrees from the original dimensions,learning did not transfer. This suggests that the integraldimensions of saturation and brightness might be primaryaxes in stimulus space (Smith & Kemler, 1978) despite thefact that they usually interact during perceptual tasks (seealso Melara, Marks, & Potts, 1993). Thus, the resultsreported by Goldstone (1994b) can be interpreted as anincrease in selective attention or as further differentiationof already-existing psychological dimensions.
There is also evidence suggesting that categorizationtraining produces novel psychologically-differentiatedstimulus dimensions. Goldstone and Steyvers (2001) werethe first to report evidence for such an effect. In their study,
F.A. Soto, F.G. Ashby / Cognition 139 (2015) 105–129 109
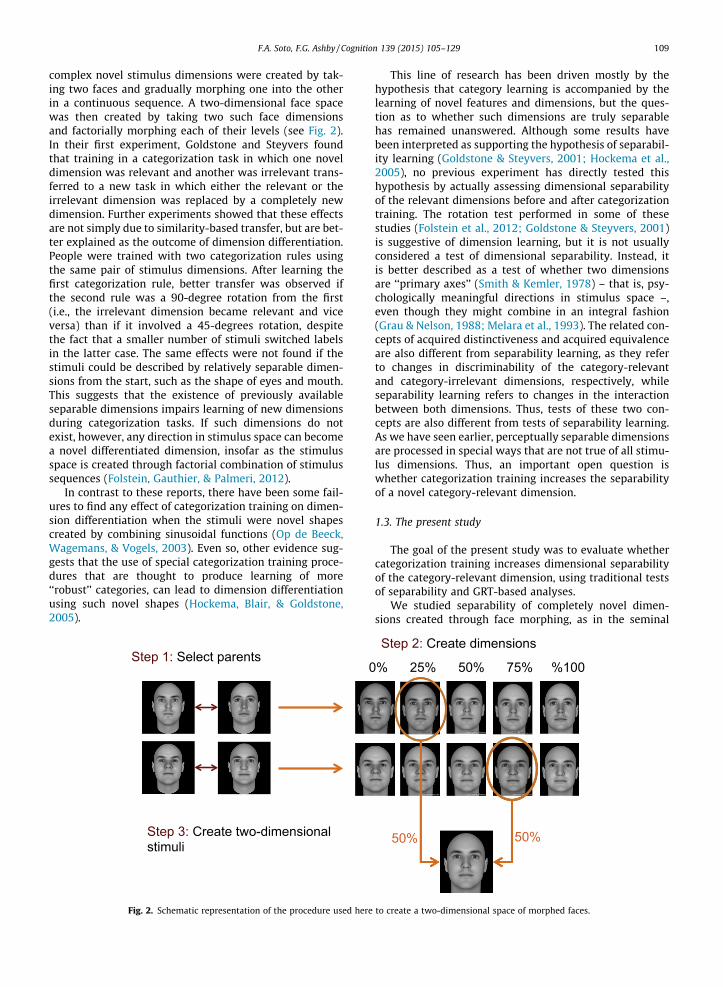
complex novel stimulus dimensions were created by tak-ing two faces and gradually morphing one into the otherin a continuous sequence. A two-dimensional face spacewas then created by taking two such face dimensionsand factorially morphing each of their levels (see Fig. 2).In their first experiment, Goldstone and Steyvers foundthat training in a categorization task in which one noveldimension was relevant and another was irrelevant trans-ferred to a new task in which either the relevant or theirrelevant dimension was replaced by a completely newdimension. Further experiments showed that these effectsare not simply due to similarity-based transfer, but are bet-ter explained as the outcome of dimension differentiation.People were trained with two categorization rules usingthe same pair of stimulus dimensions. After learning thefirst categorization rule, better transfer was observed ifthe second rule was a 90-degree rotation from the first(i.e., the irrelevant dimension became relevant and viceversa) than if it involved a 45-degrees rotation, despitethe fact that a smaller number of stimuli switched labelsin the latter case. The same effects were not found if thestimuli could be described by relatively separable dimen-sions from the start, such as the shape of eyes and mouth.This suggests that the existence of previously availableseparable dimensions impairs learning of new dimensionsduring categorization tasks. If such dimensions do notexist, however, any direction in stimulus space can becomea novel differentiated dimension, insofar as the stimulusspace is created through factorial combination of stimulussequences (Folstein, Gauthier, & Palmeri, 2012).
In contrast to these reports, there have been some fail-ures to find any effect of categorization training on dimen-sion differentiation when the stimuli were novel shapescreated by combining sinusoidal functions (Op de Beeck,Wagemans, & Vogels, 2003). Even so, other evidence sug-gests that the use of special categorization training proce-dures that are thought to produce learning of more‘‘robust’’ categories, can lead to dimension differentiationusing such novel shapes (Hockema, Blair, & Goldstone,2005).
Fig. 2. Schematic representation of the procedure used here
This line of research has been driven mostly by thehypothesis that category learning is accompanied by thelearning of novel features and dimensions, but the ques-tion as to whether such dimensions are truly separablehas remained unanswered. Although some results havebeen interpreted as supporting the hypothesis of separabil-ity learning (Goldstone & Steyvers, 2001; Hockema et al.,2005), no previous experiment has directly tested thishypothesis by actually assessing dimensional separabilityof the relevant dimensions before and after categorizationtraining. The rotation test performed in some of thesestudies (Folstein et al., 2012; Goldstone & Steyvers, 2001)is suggestive of dimension learning, but it is not usuallyconsidered a test of dimensional separability. Instead, itis better described as a test of whether two dimensionsare ‘‘primary axes’’ (Smith & Kemler, 1978) – that is, psy-chologically meaningful directions in stimulus space –,even though they might combine in an integral fashion(Grau & Nelson, 1988; Melara et al., 1993). The related con-cepts of acquired distinctiveness and acquired equivalenceare also different from separability learning, as they referto changes in discriminability of the category-relevantand category-irrelevant dimensions, respectively, whileseparability learning refers to changes in the interactionbetween both dimensions. Thus, tests of these two con-cepts are also different from tests of separability learning.As we have seen earlier, perceptually separable dimensionsare processed in special ways that are not true of all stimu-lus dimensions. Thus, an important open question iswhether categorization training increases the separabilityof a novel category-relevant dimension.
1.3. The present study
The goal of the present study was to evaluate whethercategorization training increases dimensional separabilityof the category-relevant dimension, using traditional testsof separability and GRT-based analyses.
We studied separability of completely novel dimen-sions created through face morphing, as in the seminal
to create a two-dimensional space of morphed faces.

110 F.A. Soto, F.G. Ashby / Cognition 139 (2015) 105–129
work of Goldstone and Steyvers (2001). Using noveldimensions built through morphing is convenient becausethere is evidence suggesting that such dimensions are inte-gral (Goldstone & Steyvers, 2001) and that there are nopsychologically-meaningful directions in a space con-structed this way (Folstein et al., 2012). Furthermore,morphing results in stimuli and dimensions that seemmore ecologically valid than completely artificial stimuli.
We created a two-dimensional space of faces and trainedparticipants in a categorization task that could be solved byselectively attending to only one of those dimensions. Next,we tested separability of the category-relevant dimension inthe context of a completely novel dimension, never seenduring training. We were interested in learning that is speci-fic to the relevant training dimension, but not specific to thestimuli and irrelevant dimensions seen during training. Wereasoned that when people are presented with new prob-lems involving known dimensions, it is unlikely that suchproblems involve exactly the same stimuli and dimensionsexperienced earlier. Instead, new objects are likely to haveproperties that have never been seen before. Furthermore,finding that the separability of a dimension increases evenwhen it is tested with a completely new dimension impliesthat there has been separability learning with the originaldimensions, which generalizes across changes in the cat-egory-irrelevant dimension. This is a more general findingthan observing increases in separability only for the origi-nally-trained dimensions.
Two different tasks were used to test perceptual sep-arability. In Experiment 1, we used the popular Garner fil-tering task and evaluated separability using a summarystatistics approach to GRT analyses. In Experiment 2, weused an identification task and evaluated separability bydirectly estimating the parameters of a GRT model fromthe data using maximum likelihood estimation, followedby tests of separability performed on such estimates.
2. Experiment 1
Perhaps the most popular test of dimensional separabil-ity is the Garner filtering task (Garner, 1974), in which par-ticipants classify a number of stimuli according to theirvalue on some target dimension as fast as possible.Participants complete two different conditions in differentblocks. In control blocks, the stimuli vary only on the targetdimension, whereas in filtering blocks, the stimuli alsovary on an irrelevant dimension. If the target dimensionis separable from the irrelevant dimension, then partici-pants should be able to selectively attend to the targetdimension during filtering blocks, and performance shouldtherefore not differ significantly from that found duringcontrol blocks. On the other hand, if the target dimensionis not separable from the irrelevant dimension, then per-formance should suffer in the filtering condition comparedto the control condition, what is usually called an interfer-ence effect.
Although the Garner filtering task is popular and intui-tive, by itself it provides only an operational test of percep-tual separability, without a rigorous theoreticaljustification. Fortunately, the data gathered from a
Garner filtering task can be used to compute a number ofstatistics that are known to be related to perceptual sep-arability as defined within GRT. When the 2 � 2 design dis-cussed earlier is used in a Garner filtering task, participantsmust report the perceived level of the relevant dimensionA while ignoring the level of dimension B. Let ai denotethe event that the participant responded that the level ofdimension A was i, where i = 1 or 2. Then a simple statisticthat can be computed from the response frequencies is theproportion of correct responses for each of the four stimuliduring filtering blocks, or p(ai|AiBj). Marginal responseinvariance holds when the probability of identifying thecorrect level of the relevant dimension A does not dependon the level of B, that is, when
pðaijAiB1Þ ¼ pðaijAiB2Þ
for both i = 1, 2. Ashby and Townsend (1986) showed that ifdecisional and perceptual separability hold for dimension A,then marginal response invariance must hold as well.
Response times (RTs) are also usually gathered in aGarner filtering task. Ashby and Maddox (1994) developedan extended GRT framework to analyze such data. Theyassumed that classification RT decreases with the distancebetween the perceptual effect and the decision bound. Ifthis RT-distance hypothesis holds then the interferenceeffect in RT is theoretically linked to perceptual separabil-ity if two more assumptions are made: first, that decisionalseparability holds and second, that the perception of eachstimulus is the same in the filtering and control conditions(i.e., perception is context free).
Ashby and Maddox also showed that the presence of aninterference effect is generally not diagnostic of violationsof perceptual separability. A much better test is given bymarginal RT invariance: the finding that the distributionof RTs at each level of the target dimension is not affectedby variations in the irrelevant dimension. Specifically, letp(RTi 6 t|AiBj) denote the probability that the RT is lessthan or equal to some value t on trials when the participantcorrectly classified the level of component A. Then mar-ginal RT invariance is found when
pðRTi 6 tjAiB1Þ ¼ pðRTi 6 tjAiB2Þ;
for i = 1 and 2 and for all t > 0. If the RT-distance hypothesisand decisional separability both hold, then marginal RTinvariance holds if and only if perceptual separability holds(Ashby & Maddox, 1994). That is, observing marginal RTinvariance would indicate that perceptual separabilityholds and observing violations of marginal RT invariancewould indicate that perceptual separability is violated.This makes marginal RT invariance the strongest test ofperceptual separability that can be computed from aGarner filtering task.
Experiment 1 used the Garner filtering task to explorewhether categorization training increases the separabilityof a category-relevant dimension. Participants in theexperimental group received three sessions of training ina categorization task involving morphed faces that variedin two novel dimensions, whereas participants in the con-trol group did not receive such training. During the testsession, both groups performed a Garner filtering task withstimuli varying along the category-relevant dimension and
F.A. Soto, F.G. Ashby / Cognition 139 (2015) 105–129 111
a new irrelevant dimension never seen before by eithergroup. Perceptual separability was evaluated through bothGarner interference effects and marginal invariance testsperformed on response proportions and correct RTs.
2.1. Materials and methods
2.1.1. ParticipantsForty-nine undergraduates at the University of
California Santa Barbara voluntarily participated in thisexperiment in exchange for class credit or a monetarycompensation. The experimental group consisted of nine-teen participants and the control group consisted of thirtyparticipants. More participants were included in the con-trol group because we expected that a large proportion ofthem would be unable to master the difficult test task.
2.1.2. StimuliStimuli were created from 6 parent images chosen from
a database of 300 computer-generated Caucasian facesdescribed by Oosterhof and Todorov (2008), created usingthe Facegen Modeller program (http://facegen.com),Version 3.1. From the original database, 33 male faces werechosen that had similar eyebrow color and similar levels offacial fat. The chosen images were converted to grayscaleand their intensity histograms were equalized. Thisensured that stimuli along the resulting dimensions variedin shape features, but not in simpler features such as skincolor and brightness. Following the original study byGoldstone and Steyvers (2001), similarity measures wereobtained from these stimuli using the efficient methoddescribed by Goldstone (1994a). Three pairs of faces withmean similarity values within 15% of each other were cho-sen as parents, to ensure that the dimensions created fromthem had relatively similar salience. A second criterionwas that the parent pairs should not be discriminablealong an easily verbalizable dimension, such as degree offemininity/masculinity or head width.
Morphs with different proportions of each parent facewere generated in MATLAB using the factorial procedureof Goldstone and Steyvers (2001). The procedure is illus-trated in Fig. 2. In the first step, pairs of faces are chosento be the parents for a dimension. In the second step, eachdimension is created by generating morphs with differentproportions from each pair of parents. In the exampleshown in the figure, five levels are created for each dimen-sion by creating morphs with 0%, 25%, 50%, 75% or 100% ofthe second parent. These levels were chosen to illustratethe procedure; they are not the levels used in our experi-ment. After two face dimensions are created, the thirdand final step is to generate a two-dimensional space byfactorially combining each of the faces in each dimensionwith each of the faces in the other dimension. As shownin the figure, these two-dimensional morphs include 50%from each of the one-dimensional faces. In the example,the final two-dimensional face has a level of 25% in onedimension and 75% in the other dimension.
Dimensions were created using a continuous sequenceof 19 morphs for each pair of parents, with percentagesof parent 1 equal to 0%, 6%, 14%, 20%, 24%, 30%, 32%, 38%,42%, 50%, 58%, 62%, 68%, 70%, 76%, 80%, 86%, 94%, and
100%. The three resulting dimensions were used to createtwo-dimensional spaces by factorially combining all levelsof one dimension with all levels of a second dimension.
2.1.3. ProcedureParticipants in the experimental group were exposed to
3 sessions of pre-training in the categorization task shownin Fig. 3a. This task has been used in the past to showlearning of new dimensions (Folstein et al., 2012) andhas the advantage that the circular arrangement of stimulide-emphasizes the dimensional structure of the stimuli.The sessions were run within a span of three days and nomore than two sessions were run on the same day.Consecutive sessions were separated by at least 1 h andat most 25 h, with the exception of a single pair of sessionsthat was separated by 10 min. At the beginning of each ses-sion, instructions were displayed on the screen indicatingthat the participant’s task was to categorize faces as accu-rately as possible into two different categories (clubs)based purely on physical appearance. The instructions alsoexplained the structure of each trial and how to report acategorization response. Participants were warned thatthey would need to guess the correct answer early in train-ing, but they would get more accurate as the experimentprogressed.
Each pretraining session consisted of 9 blocks of 72 tri-als each, for a total of 648 trials. Each stimulus (36 per cat-egory) was presented once in a block, with the orderrandomized within the block. There were voluntary breaksof 1 min between blocks, which the participant could finishby clicking on a button labeled ‘‘continue.’’
Each pretraining trial started with the presentation of awhite cross in the middle of a black screen for 500 ms.Immediately afterwards a face stimulus was presented inthe middle of the black screen until the participant pressedone of the two response buttons or a time deadline of 4 swas reached, whichever happened first. Then the partici-pant received feedback about the correct response. For cor-rect responses, the word CORRECT was presented for500 ms, in green font color in the middle of the screen,accompanied by a pleasant chime presented through theheadphones. For incorrect responses or if the time deadlinewas reached, the word INCORRECT was presented for500 ms, in red font color in the middle of the screen,accompanied by an unpleasant buzzer presented throughthe headphones. This was followed by a 1 s inter-trialinterval, during which the monitor was completely black.
Participants in both groups completed one session of aGarner filtering task illustrated in Fig. 3b. This task usedfour stimuli, which resulted from the factorial combinationof two levels of the category-relevant dimension and anovel dimension. As shown in the figure, levels 5 and 15from each dimension were used and none of the com-binations of levels was used before in the categorizationtask. At the beginning of the session, instructions were dis-played indicating that the participant’s task would be tocategorize four stimuli into two different groups basedon physical appearance. The four stimuli were displayedin the screen, grouped in the two categories that wouldbe used during the task. Participants were asked to studythe two groups of stimuli carefully before continuing with

(a) (b)
(c)
Fig. 3. Schematic representation of the tasks used in the experiments presented here. Each point represents a different stimulus presented during a task.The requirements of the task are represented by lines that divide the stimuli in response classes. Such response classes are also labeled for each task (X andY; A and B; R1–R4).
112 F.A. Soto, F.G. Ashby / Cognition 139 (2015) 105–129
the experiment, as a way to highlight in a non-verbal waywhat aspects of the stimuli were relevant and irrelevant forthe task. The instructions also explained the structure of acategorization task and asked participants to respond asaccurately and as fast as possible.
The session consisted of 16 blocks of 32 trials each, for atotal of 512 trials. There were three block types that dif-fered on the stimuli presented. During baseline blocks,only two stimuli were presented, which varied in the levelof the category-relevant dimension, but for which the
irrelevant dimension was held constant. Each stimuluswas repeated 16 times. There were two types of baselineblocks, one for each level of the irrelevant dimension.During filtering blocks, all four stimuli were presented,each repeated 8 times. Trials were randomized withinblocks.
Each type of baseline block was repeated 4 times andthe interference block was repeated 8 times. Blocks weregrouped in pairs of one baseline block and one interferenceblock; there were a total of 8 block pairs in the session. The

F.A. Soto, F.G. Ashby / Cognition 139 (2015) 105–129 113
order of each block in the pair was counterbalanced andthe order of presentation of the block pairs was semi-ran-domly determined for each participant, with the constraintof alternating the baseline block type in the sequence ofblock pairs.
Trials in the Garner filtering task had the same overallstructure as trials in the pre-training categorization task.However, the response deadline was set to 2 s, after whichthe phrase TOO SLOW! was presented in the middle of thescreen in red font color, accompanied by an unpleasantbuzzer presented through the headphones.
2.2. Results and discussion
The experimental group showed accurate performancein the final session of the categorization pre-training task,with a mean proportion of correct responses of 0.81(sd = 0.1). The Garner filtering task was quite difficult tolearn, especially for participants in the control group, withsome participants showing chance performance through-out the task. To minimize differences in task performancebetween the control and experimental groups, and becauseGRT is only applicable to asymptotic performance and notto learning data, for each participant we only included datastarting from the first block pair in which the proportion ofcorrect responses was at least 0.75. This excluded from theanalysis all data from 14 participants in the control group(9 of these showed performance that seemed completelyrandom) and 2 participants in the experimental group,who never reached such a high level of performance.Thus, the results presented here are based on data from16 participants in the control group and 17 participantsin the experimental group.
Analyses of RTs (measured in seconds) were performedonly on data from correct trials. We used quantiles (med-ian and deciles) to characterize the RT distribution fromeach participant, which were then used in group-levelanalyses. Quantiles are asymptotically normal andunbiased estimators, so they can be used to obtain groupaverages and to perform statistical analyses involvingassumptions of normality (Van Zandt, 2002).
2.2.1. Garner interference effectsAn interference score was computed for each partici-
pant by subtracting accuracy during control blocks fromaccuracy during filtering blocks. The mean of these inter-ference scores is plotted separately for each group inFig. 4a. It can be seen that there is a Garner interferenceeffect in accuracy for the control group, with the meaninterference score ð�x ¼ :033Þ being significantly higherthan zero according to a single-sample t-test, t(15) = 2.84,p < .01, d = .71. On the other hand, the Garner interferenceeffect in accuracy for the experimental group is muchsmaller ð�x ¼ :002Þ and not significantly greater than zero,t(16) = .39, p > .1, d = .09. The difference between groupsð�x1 � �x2 ¼ :031Þ was also found to be significant accordingto a two-sample t-test, t(31) = 2.41, p < .05, d = 0.87.
Traditionally, the analysis of Garner interference effectsin RT is performed on the median values from the relevantRT distributions of each participant. In line with this
standard procedure, we first computed the median RT foreach participant for both filtering and baseline blocks. Aninterference score was computed by subtracting medianRT during control blocks from median RT during filteringblocks. The mean of these interference scores is plottedseparately for each group in Fig. 4b. The results mirror thosefound with accuracy: the control group shows a Garnerinterference effect that seems to be absent in the experi-mental group. The mean interference score ð�x ¼ :023Þ wassignificantly greater than zero in the control group,t(15) = 2.06, p < .05, d = .52, but not in the experimentalgroup ð�x ¼ :003Þ, t(16) = .52, p > .1, d = .13. However, thedifference between groups ð�x1 � �x2 ¼ :02Þwas only margin-ally significant, t(31) = 1.63, p = .057, d = .59.
2.2.2. Marginal invariance testsDuring each baseline block, participants repeatedly saw
only two stimuli that shared the same value on the irrele-vant dimension, so they had time to adjust their decisionstrategy to the demands imposed by those specific stimuli.In other words, participants might have used differentdecision bounds in each type of baseline block, whichwould violate the assumption of decisional separabilityrequired by the theorems linking marginal invarianceswith perceptual separability (Ashby & Maddox, 1994;Ashby & Townsend, 1986). This is less likely to happen dur-ing filtering blocks, in which participants saw all four stim-uli randomly interspersed. For this reason, analyses ofmarginal invariances were performed only on data fromfiltering blocks.
In the analysis of marginal response invariance, for eachparticipant and each level of the relevant dimension wecomputed the difference in accuracy across the two levelsof the irrelevant dimension. The resulting value representsthe deviation from marginal response invariance at onelevel of the relevant dimension, so there were two of thesescores for each participant (one for each value of the rele-vant dimension). The absolute values of these two scoreswere added together to obtain a single score per partici-pant, representing violations of marginal response invari-ance. The means of these scores are plotted separately foreach group in Fig. 4c. Note that we expect these meansto be above zero even if there are no violations of marginalresponse invariance, because in that case each individualscore would be the sum of two absolute random devia-tions. Thus, testing whether each mean is different fromzero using traditional statistical tests is not appropriate.To test whether there were significant violations of mar-ginal response invariance, we performed a permutationtest by randomly shuffling the levels of the irrelevantdimension in each participant’s data 500 times. The meanscores representing violations of marginal response invari-ance were computed from each of these shuffled data sets,resulting in an empirical distribution of mean scores underthe null hypothesis of no violations of marginal responseinvariance. These permutation tests revealed significantviolations of marginal response invariance in both groups(both p < .01).
More importantly, the comparison between groupsclearly showed that violations of marginal response

a b
c d
Fig. 4. Results of the Garner interference and marginal invariance tests carried out in Experiment 1. Error bars represent standard error of the mean.
114 F.A. Soto, F.G. Ashby / Cognition 139 (2015) 105–129
invariance were higher in the control group than in theexperimental group ð�x1 � �x2 ¼ :15Þ, t(31) = 2.51, p < .01,d = .9.
Remember that for marginal RT invariance to hold, thedistribution of RTs for a given level of the relevant dimen-sion should be the same across levels of the irrelevantdimension. Thus, unlike the Garner interference test,which requires a comparison of only median RTs, the mar-ginal RT invariance test requires comparing full RT dis-tributions. With this goal in mind, we started bycomputing the deciles of the RT distribution for each par-ticipant and each stimulus. As indicated earlier, quantiles(which include deciles) have been previously recom-mended for the analysis of RT distributions due to theirgood statistical properties (Van Zandt, 2002). Each set ofdeciles summarizes the RT distribution for one level ofthe relevant dimension and one level of the irrelevantdimension. If marginal RT invariance holds, we wouldexpect that corresponding deciles for a given level of therelevant dimension would be the same across levels ofthe irrelevant dimension. Using dijk to represent the kthdecile from the RT distribution of a stimulus with level iin the relevant dimension and level j in the irrelevantdimension, we computed a single measure of deviations
from marginal RT invariance for each participant in the fol-lowing way:
V ¼X2
i¼1
X9
k¼1
jdi1k � di2kj;
where |x| represents the absolute value of x. The mean ofthese scores is plotted separately for each group inFig. 4d. It can be seen that violations of marginal RT invari-ance were higher in the control group than in the experi-mental group ð�x1 � �x2 ¼ :64Þ with the difference beingstatistically significant, t(31) = 1.71, p < .05, d = 0.61.
As in the analysis of marginal response invariance, test-ing whether the observed deviations from marginal RTinvariance were statistically significant within each grouprequired performing a permutation test. The test followedthe same procedure as before, but computing the V statisticfor each permuted data set. The results of these per-mutation tests revealed significant violations of marginalRT invariance in both groups (both p < .01).
Fig. 5 partially captures the differences between groupsin RT distributions. The figure plots the mean of the decileestimates separately for the control (top panels) andexperimental groups (bottom panels) and for each level

Fig. 5. Mean estimates of deciles for each group (Exp = experimental, Cont = control) and level of the relevant dimension (number in the subpanel titles).Different colors represent different levels of the irrelevant dimension. If marginal RT invariance held, lines within each panel should not differ. (Forinterpretation of the references to color in this figure legend, the reader is referred to the web version of this article.)
F.A. Soto, F.G. Ashby / Cognition 139 (2015) 105–129 115
of the relevant dimension (level 1 in left panels, level 2 inright panels). The distributions for the two levels of theirrelevant dimension are plotted using different colors.For each panel, the magnitude of violations of marginalRT invariance is represented by the horizontal distancebetween the two distributions. Note that such violationsare apparent in both the experimental and control groups,even though these averaged curves can only capture devia-tions from marginal RT invariance that are consistentacross participants. The plot also captures some of the dif-ferences between groups, especially in the lower half of thedistributions (the first five deciles, corresponding to cumu-lative proportions of 0–50%). For level 1 of the relevantdimension (two left panels), we see that for the first fivedeciles (0–50%) there is almost no difference between thetwo distributions for the experimental group (bottom-leftpanel), whereas there are considerable differences for thecontrol group (top-left panel). For the last five deciles(60–100%), differences between the distributions startbeing apparent in the experimental group, but these aremuch smaller than those found in the control group. Thedifferences between groups are not so clear-cut for level2 of the relevant dimension, corresponding to the two right
panels. For the first five deciles (0–50%), differencesbetween distributions are slightly larger in the controlgroup than the experimental group, but this pattern seemsto reverse in the last five deciles (60–100%).
In summary, both the size of the Garner interferenceeffect and the magnitude of violations of marginal invari-ance were smaller in the experimental group, whichreceived categorization pre-training, than in the controlgroup, which did not receive such pretraining. This differ-ence between groups was found in the analysis of bothaccuracy and RT data and suggests that categorizationtraining increased the perceptual separability of the cat-egory-relevant dimension.
On the other hand, permutation tests revealed viola-tions of marginal response and RT invariance in bothgroups, suggesting that categorization training does notproduce complete dimensional separability.
A problem with the present experiment is that theGarner interference and marginal invariance tests both relyon the assumption that decisional separability holds(Ashby & Maddox, 1994). Although it has been found thatthis assumption is valid in some cases (Maddox & Ashby,1996), it is possible that categorization training had an

116 F.A. Soto, F.G. Ashby / Cognition 139 (2015) 105–129
impact on the decision strategies used by participantsrather than on perceptual separability. One way to betterdissociate perceptual and decisional separability is byusing an identification task, in which participants areasked to report the perceived level of both dimensions oneach trial. GRT analyses of identification data do notrequire assuming decisional separability to test for percep-tual separability, instead it is possible to simultaneouslytest the validity of both forms of dimensional interaction.The goal of Experiment 2 was to evaluate whether cat-egorization pre-training increases perceptual separabilityusing an identification task.
1 An alternative model, which makes equivalent predictions to GRT-wIND, assumes that all participants share the same decision bounds butevery participant attends to different stimulus dimensions (which can beoriented in any direction of stimulus space). We did not explore this modelfor two reasons. First, following standard applications of signal detectiontheory, we assumed that participants have more control over their decisionstrategies than over their sensory and perceptual processing of thestimulus, whereas this alternative model assumes the opposite. Second,fitting the alternative model would be difficult, because it requires findingwhat ‘‘privileged’’ directions in space should be allowed to stretch andshrink for each participant.
3. Experiment 2
The present experiment evaluated separability learningusing GRT analyses of data from an identification task.Participants with experience in a categorization task per-formed a 2 � 2 identification task using stimuli createdfrom the category-relevant dimension and a novel stimu-lus dimension, as illustrated in Fig. 3c. Their performancewas compared to that of participants without experiencewith the category-relevant dimension.
The 2 � 2 identification task used here is similar to theclassification task used in the previous experiment, in thatit includes four stimuli that result from the factorial com-bination of two levels of dimension A and 2 levels of dimen-sion B (compare Fig. 4b and c). The main difference is that inthe identification task participants must report not only theperceived level on dimension A, but also the perceived levelon dimension B – that is, they must identify the specificstimulus presented during a particular trial. The mostimportant advantage of the identification task over theGarner filtering task used before is that it allows us to dis-sociate perceptual and decisional types of separability.
Currently, the best available approach within the GRTframework for the analysis of dimensional interactions, atleast for 2 � 2 identification data, is a model-basedapproach using GRT-wIND (GRT with INdividualDifferences; Soto et al., 2015). GRT-wIND is an extensionof GRT that assumes that all participants share similar per-ceptual representations. More specifically, the modelassumes that the same stimulus dimensions are used byall participants to represent a set of stimuli. In most cases,these dimensions are assumed to correspond to thoseexplicitly manipulated by the experimenter in an identifi-cation task (for more on the assumption of correspon-dence, see Ashby & Townsend, 1986; Dunn, 1983; Sotoet al., 2014), which are usually manipulated because theyare suspected to be psychologically privileged. A conse-quence of assuming the same dimensional representationacross people is that perceptual separability (and percep-tual independence) in GRT-wIND either holds for all par-ticipants or is violated for all participants.
On the other hand, GRT-wIND also assumes that differentparticipants may allocate different amounts of attention toeach stimulus dimension and may use different decisionstrategies. Individual differences in attention are modeledby increasing or decreasing perceptual noise on each dimen-sion. For example, attention to dimension A would result in
less perceptual noise and easier discrimination of perceptsalong that dimension. Although attention might changehow well an individual can discriminate a dimension, it doesnot affect whether two dimensions perceptually interact.Individual differences in decisional strategies are modeledby having a different set of two decision bounds for eachindividual. For this reason, decisional separability is a phe-nomenon that can hold in some individuals and fail inothers, or even vary for a single individual as a function offactors such as training with a task.1
GRT-wIND solves a number of problems that have beenrecently identified in traditional GRT models. Importantly,while traditional GRT models have problems dissociatingperceptual and decisional forms of separability in the2 � 2 identification design (e.g., Mack, Richler, Gauthier,& Palmeri, 2011; Silbert & Thomas, 2013), we have shownthat GRT-wIND does not suffer from these problems (seeappendix of Soto et al., 2015).
A disadvantage of using GRT-wIND to analyze data froman identification task is that the model has not been linkedto RT data yet. Recent developments in GRT have providedtools to analyze RT data from identification tasks(Townsend, Houpt, & Silbert, 2012), but these tools cannotdissociate between perceptual and decisional separability,like GRT-wIND does. Because dissociating perceptual anddecisional separability was one of the goals of the presentexperiment, here we will focus exclusively on the analysisof response frequencies using GRT-wIND.
Theorems linking dimensional interactions with sum-mary statistics are still not available for GRT-wIND, butthe full model can be fit to data from all participants usingmaximum likelihood estimation. Then, the analysis ofdimensional interactions can be easily performed using sta-tistical tests on maximum likelihood estimates. InAppendix, we include a more formal description of GRT-wIND, the procedures used to find maximum-likelihoodestimates of its parameters, and statistical tests forthe analysis of dimensional interactions. Importantly,Appendix describes a new statistical test that allowsbetween-group tests of differences in perceptual separabil-ity, decisional separability and perceptual independence,which makes it possible to directly compare perceptualseparability in the experimental and control groups of thepresent experiment.
3.1. Materials and methods
3.1.1. ParticipantsThe same 19 participants from the experimental group
of Experiment 1 were included in the present experiment.

F.A. Soto, F.G. Ashby / Cognition 139 (2015) 105–129 117
An additional 25 undergraduates from the University ofCalifornia Santa Barbara were recruited for the controlgroup. They voluntarily participated in exchange for classcredit.
3.1.2. StimuliStimuli were the same as those described for
Experiment 1.
3.1.3. ProcedureParticipants in the experimental group completed 3 ses-
sions of pre-training in a categorization task, plus one ses-sion of testing in a Garner interference task, as describedpreviously. Participants in both groups then completedone session of the identification task illustrated in Fig. 3c.As in Experiment 1, the task used four stimuli resultingfrom the factorial combination of two levels of the cat-egory-relevant dimension and two levels of a novel dimen-sion. In contrast to Experiment 1, levels 7 and 17 from eachdimension were used. Note that none of the combinationsof these levels was experienced before by the experimentalgroup.
At the beginning of the session, instructions were dis-played indicating that the participant’s task would be toidentify four faces, each one of them assigned to a uniqueresponse key. The four stimuli were displayed on thescreen, together with their key assignments. The instruc-tions also explained the structure of a trial in the task,emphasizing that stimuli would be presented very briefly,and that participants should respond as accurately and asfast as possible.
The session consisted of 45 blocks of 20 trials each, for atotal of 900 trials. Each block involved 5 presentations ofeach of the four stimuli and trials were randomized withinblocks. Each trial started with the presentation of a whitecross in the middle of a black screen for 500 ms.Immediately afterwards a face stimulus was quicklyflashed in the middle of the black screen for 34 ms. Thisshort presentation time was chosen to make the task moredifficult, as errors are critical to an analysis using GRT-wIND. Participants were given 2 s to report the presentedface by pushing the correct button and they received feed-back about the correctness of their responses as inExperiment 1. If the participant did not respond within2 s, the trial ended with the message ‘‘TOO SLOW!’’ dis-played in the middle of the screen and accompanied byan unpleasant buzzer through the headphones.
3.2. Results and discussion
The data from 11 participants (9 from the control groupand 2 from the experimental group) were excluded fromthe analysis because their performance was near chance(below 27% correct) by the end of the experiment. GRT isa model of asymptotic performance, not of learning, so itis important to discard data during the learning periodwhen estimating individual participant confusion matri-ces. Toward this end, learning curves were obtained byaveraging performance within a moving window of 50trials, starting with the average of trials 1–50, moving thewindow one trial up in each step (2–51, 3–53, and so
on), and ending with the average of the last 50 trials. Anexponential function was fit to the resulting average learn-ing curves using least-squares estimation. The point in thebest-fitting exponential curve where the slope was smallerthan 0.001 for the first time was used as a cutoff: only dataafter this point were used to estimate individual confusionmatrices.
GRT-wIND was fit to the data from individual confusionmatrices using the procedures outlined in Appendix. Aseparate fit was performed for the data of each group. Tofacilitate finding the global maximum of the likelihoodfunction instead of a local maximum, the optimizationwas run 60 times, each time with different random startingvalues for the parameters and the solution with highestmaximum likelihood was chosen for further analysis.
The parameter estimates from the best-fitting modelwere used to estimate response probabilities for each cellin each individual participant’s confusion matrix. Theseestimated probabilities could then be compared with thecorresponding observed response proportions for a quickevaluation of the model’s ability to account for variabilityin the data (Soto et al., 2015). It was found that the modelaccounted for 97.43% of the variance in the data from theexperimental group and 95.77% of the variance in the datafrom the control group.
Fig. 6 shows the group perceptual distributionsobtained from the best-fitting model, separately for eachgroup. Each ellipse represents the contour of equal likeli-hood for the distribution of perceptual effects elicited byone stimulus. The category-relevant dimension is repre-sented on the abscissa, whereas the novel dimension isrepresented on the ordinate. Note that the scales of eachdimension are not comparable across groups; the compar-ison of results should focus on what the figure suggestsabout dimensional interactions. We will focus first on theresults regarding the category-relevant dimension, whichare the most important given the goals of this experiment.
3.2.1. Separability of the category-relevant dimensionViolations of perceptual separability of the category-
relevant dimension can be evaluated from Fig. 6 by com-paring horizontal means and variances of the two left dis-tributions and the two right distributions. The results fromthe control group, shown in Fig. 6a, suggest strong viola-tions of perceptual separability for the category-relevantdimension. For example, the bottom-left distribution hasa much smaller variance along the category-relevantdimension than the top-left distribution. Furthermore,the bottom-right distribution has a much smaller meanthan the top-left distribution. These violations of percep-tual separability were found to be statistically significantaccording to a Wald test (see Appendix for a description),v2(4) = 38.54, p < 0.001, and they confirm the results fromExperiment 1 and previous studies (Goldstone & Steyvers,2001) suggesting that dimensions created by face morph-ing are not separable.
The results from the experimental group, shown inFig. 6b, are quite different, with both means and variancesalong the relevant dimension being much more similaracross levels of the irrelevant dimension. In other words,the figure suggests that categorization training in this group

(a) (b)
Fig. 6. Best-fitting configuration of perceptual distributions for control (a) and experimental (b) groups of Experiment 2. Ellipses are contours of equallikelihood.
118 F.A. Soto, F.G. Ashby / Cognition 139 (2015) 105–129
did indeed increase the separability of the category-rele-vant dimension. This was confirmed by statistical tests,which revealed that the deviations from perceptualseparability of the category-relevant dimension were notstatistically significant in the experimental group,v2(4) = 1.82, p > 0.1. Furthermore, a statistical testcomparing the magnitude of deviations from perceptualseparability between groups (which is derived inAppendix) showed that the two groups differed signifi-cantly in the separability of the category-relevant dimen-sion, v2(4) = 12.13, p < 0.05.
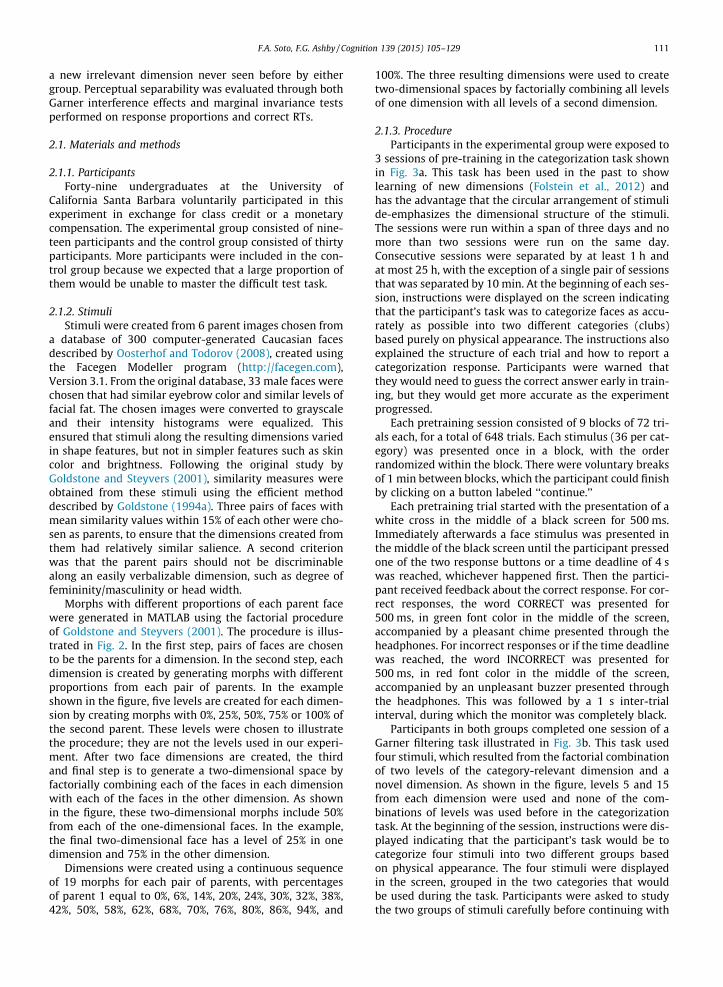
To visualize differences between groups in decisionalseparability on the category-relevant dimension, slopes ofthe individual decision bounds were transformed to reflectdegrees of clockwise rotation from vertical. These rotationvalues should equal zero when decisional separabilityholds, with values higher or lower than zero representingdeviations from decisional separability. Both individualslope values and kernel density estimates computed fromthose values are shown in Fig. 7, which displays the resultsfrom both groups in separate panels.
Fig. 7a shows the rotation of bounds for the controlgroup. It can be seen that violations of decisional separabil-ity were common, with all bounds having positive rotationvalues and a density mode around 30 degrees of rotation.This was confirmed by a Wald test showing that, on aver-age, the control group showed statistically significant vio-lations of decisional separability for the category-relevantdimension, v2(1) = 5.43, p < 0.05.
Fig. 7b shows the rotation of bounds for the experimen-tal group. In this case, although some participants seem toshow violations of decisional separability, the group as a
whole has slope values that concentrate around zero andthe density mode is only slightly below zero. Thus, it seemsas if violations of decisional separability were not as strongand consistent in the experimental group as in the controlgroup. This was confirmed by a Wald test showing that, onaverage, violations of decisional separability for the cat-egory-relevant dimension were not significant in theexperimental group, v2(1) = 0.1, p > 0.1. A between-groupsstatistical test comparing the magnitude of average viola-tions of decisional separability was only marginally signifi-cant, v2(1) = 3.79, p = 0.051.
In conclusion, the results from the present experimentconfirm those found previously with the Garner filteringtask, providing evidence that categorization trainingincreases the perceptual separability of the category-rele-vant dimension. Furthermore, this experiment also pro-vided evidence suggestive of an increase in decisionalseparability of the category-relevant dimension after cat-egorization training, although the relevant statistical testcomparing both groups did not reach significance at the0.05 level.
3.2.2. Separability of the novel dimensionViolations of perceptual separability of the novel
dimension can be visualized in Fig. 6 by comparing thetwo bottom distributions and the two top distributionswith respect to their vertical means and variances. Forthe control group (Fig. 6a), there seems to be differencesboth in means and variances between the two bottom dis-tributions, whereas the two top distributions seem to havesimilar means and variances. A Wald test indicated that
(b)
(a)
Fig. 7. Degrees of clockwise rotation from the decisional separability bound for the category-relevant dimension in Experiment 2. Both individual estimates(tick marks) and kernel density estimates are shown.
F.A. Soto, F.G. Ashby / Cognition 139 (2015) 105–129 119
these violations of perceptual separability were sta-tistically significant, v2(4) = 45.92, p < 0.001.
Similar deviations from perceptual separability areobserved in the experimental group (Fig. 6b). The meansand variances of the two bottom distributions differ impor-tantly and in the same direction as those in the controlgroup. For both groups, the mean of the bottom-right dis-tribution is shifted down compared to the bottom-left
distribution, and the variance of the bottom-right dis-tribution is larger than the variance of the bottom-left dis-tribution. There is also a difference in the variances of thetwo top distributions that was not observed in the controlgroup. A Wald test indicated that these violations of per-ceptual separability were statistically significant,v2(4) = 12.12, p < 0.05. The difference between groups inmagnitude of deviations from perceptual separability in

(b)
(a)
Fig. 8. Degrees of clockwise rotation from the decisional separability bound for the novel dimension in Experiment 2. Both individual estimates (tick marks)and kernel density estimates are shown.
120 F.A. Soto, F.G. Ashby / Cognition 139 (2015) 105–129
the novel dimension was not statistically significant,v2(4) = 3.03, p > 0.1.
The importance of these findings is that they indicatethat separability learning is dimension-specific; that is, itinvolves changes in separability only for the category-rele-vant dimension, instead of more general changes thatcould affect a completely novel dimension.
The degree of clockwise rotation from horizontal in theindividual decision bounds are plotted in Fig. 8. Many par-ticipants in the control group (Fig. 8a) seem to show viola-tions of decisional separability, with all but one bound
having positive rotation values and a density modebetween 20 and 30 degrees of rotation. This was confirmedby a Wald test showing statistically significant violationsof decisional separability on average in the control group,v2(1) = 4.57, p < 0.05.
Fig. 8b shows a different pattern of results in the experi-mental group. Although many participants show importantviolations of decisional separability, with absolute degreesof rotation larger than 20, most participants cluster arounda value of 0 degrees of rotation, as reflected by the densitymode. A Wald test showed that, on average, violations of
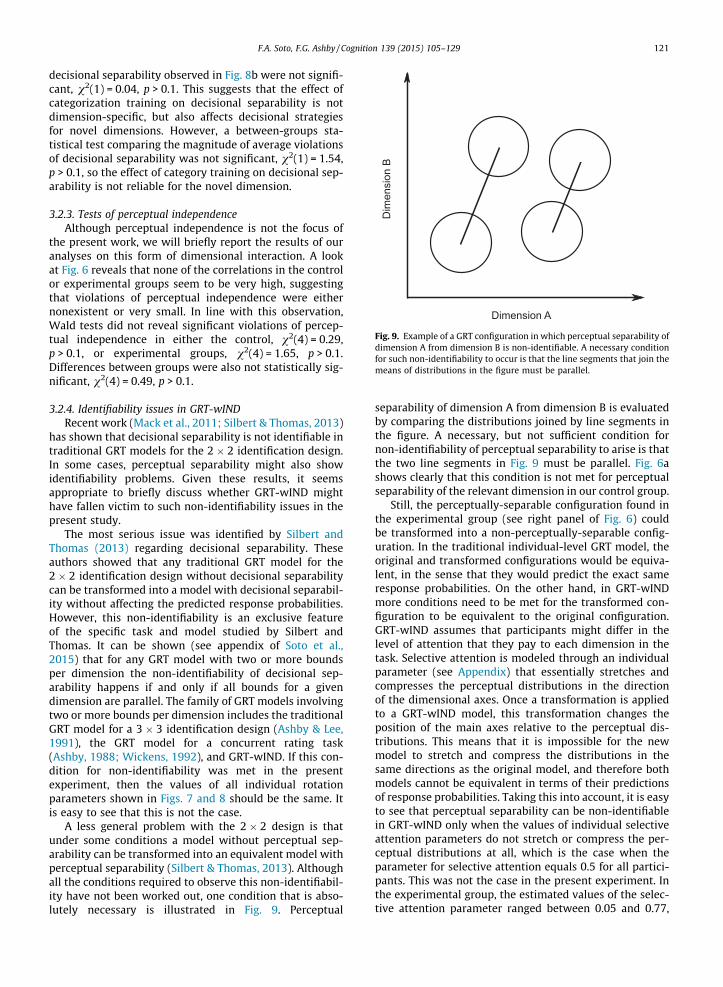
Fig. 9. Example of a GRT configuration in which perceptual separability ofdimension A from dimension B is non-identifiable. A necessary conditionfor such non-identifiability to occur is that the line segments that join themeans of distributions in the figure must be parallel.
F.A. Soto, F.G. Ashby / Cognition 139 (2015) 105–129 121
decisional separability observed in Fig. 8b were not signifi-cant, v2(1) = 0.04, p > 0.1. This suggests that the effect ofcategorization training on decisional separability is notdimension-specific, but also affects decisional strategiesfor novel dimensions. However, a between-groups sta-tistical test comparing the magnitude of average violationsof decisional separability was not significant, v2(1) = 1.54,p > 0.1, so the effect of category training on decisional sep-arability is not reliable for the novel dimension.
3.2.3. Tests of perceptual independenceAlthough perceptual independence is not the focus of
the present work, we will briefly report the results of ouranalyses on this form of dimensional interaction. A lookat Fig. 6 reveals that none of the correlations in the controlor experimental groups seem to be very high, suggestingthat violations of perceptual independence were eithernonexistent or very small. In line with this observation,Wald tests did not reveal significant violations of percep-tual independence in either the control, v2(4) = 0.29,p > 0.1, or experimental groups, v2(4) = 1.65, p > 0.1.Differences between groups were also not statistically sig-nificant, v2(4) = 0.49, p > 0.1.
3.2.4. Identifiability issues in GRT-wINDRecent work (Mack et al., 2011; Silbert & Thomas, 2013)
has shown that decisional separability is not identifiable intraditional GRT models for the 2 � 2 identification design.In some cases, perceptual separability might also showidentifiability problems. Given these results, it seemsappropriate to briefly discuss whether GRT-wIND mighthave fallen victim to such non-identifiability issues in thepresent study.
The most serious issue was identified by Silbert andThomas (2013) regarding decisional separability. Theseauthors showed that any traditional GRT model for the2 � 2 identification design without decisional separabilitycan be transformed into a model with decisional separabil-ity without affecting the predicted response probabilities.However, this non-identifiability is an exclusive featureof the specific task and model studied by Silbert andThomas. It can be shown (see appendix of Soto et al.,2015) that for any GRT model with two or more boundsper dimension the non-identifiability of decisional sep-arability happens if and only if all bounds for a givendimension are parallel. The family of GRT models involvingtwo or more bounds per dimension includes the traditionalGRT model for a 3 � 3 identification design (Ashby & Lee,1991), the GRT model for a concurrent rating task(Ashby, 1988; Wickens, 1992), and GRT-wIND. If this con-dition for non-identifiability was met in the presentexperiment, then the values of all individual rotationparameters shown in Figs. 7 and 8 should be the same. Itis easy to see that this is not the case.
A less general problem with the 2 � 2 design is thatunder some conditions a model without perceptual sep-arability can be transformed into an equivalent model withperceptual separability (Silbert & Thomas, 2013). Althoughall the conditions required to observe this non-identifiabil-ity have not been worked out, one condition that is abso-lutely necessary is illustrated in Fig. 9. Perceptual
separability of dimension A from dimension B is evaluatedby comparing the distributions joined by line segments inthe figure. A necessary, but not sufficient condition fornon-identifiability of perceptual separability to arise is thatthe two line segments in Fig. 9 must be parallel. Fig. 6ashows clearly that this condition is not met for perceptualseparability of the relevant dimension in our control group.
Still, the perceptually-separable configuration found inthe experimental group (see right panel of Fig. 6) couldbe transformed into a non-perceptually-separable config-uration. In the traditional individual-level GRT model, theoriginal and transformed configurations would be equiva-lent, in the sense that they would predict the exact sameresponse probabilities. On the other hand, in GRT-wINDmore conditions need to be met for the transformed con-figuration to be equivalent to the original configuration.GRT-wIND assumes that participants might differ in thelevel of attention that they pay to each dimension in thetask. Selective attention is modeled through an individualparameter (see Appendix) that essentially stretches andcompresses the perceptual distributions in the directionof the dimensional axes. Once a transformation is appliedto a GRT-wIND model, this transformation changes theposition of the main axes relative to the perceptual dis-tributions. This means that it is impossible for the newmodel to stretch and compress the distributions in thesame directions as the original model, and therefore bothmodels cannot be equivalent in terms of their predictionsof response probabilities. Taking this into account, it is easyto see that perceptual separability can be non-identifiablein GRT-wIND only when the values of individual selectiveattention parameters do not stretch or compress the per-ceptual distributions at all, which is the case when theparameter for selective attention equals 0.5 for all partici-pants. This was not the case in the present experiment. Inthe experimental group, the estimated values of the selec-tive attention parameter ranged between 0.05 and 0.77,

122 F.A. Soto, F.G. Ashby / Cognition 139 (2015) 105–129
with a median of 0.38. In the control group, the estimatedvalues of the selective attention parameter rangedbetween 0.14 and 0.93, with a median of 0.66. In sum,GRT-wIND shows non-identifiability of perceptual sep-arability under very specific and restricted conditions,which were not met by the maximum likelihood estimatesobtained from the model in the present study.
In many signal detection theory models, means andvariances of the perceptual distributions are not uniquelyidentifiable. Although this issue has not been systemati-cally explored either analytically or numerically, our pre-vious work fitting GRT-wIND to real data showed thatvariances seem to capture variability in the data that isnot captured by the means alone, suggesting that theseparameters may all be uniquely identifiable (Soto et al.,2015). Still, it might be the case that errors in our optimiza-tion algorithm led to such a result by mere chance.
Although a full study of the identifiability of means andvariances in GRT-wIND is beyond the scope of the presentstudy, we conducted two new analyses testing thispossibility, which we briefly discuss here.
First, as in our previous study, we fitted a GRT-wINDmodel in which all variances were fixed to 1.0 to the datafrom both groups in the present experiment. In both cases,the fit of this restricted model was worse than that of thefull model (i.e., larger AIC; for details, see Soto et al.,2015). The probability that the fixed-variances modelwas the best model in this comparison, computed throughAkaike weights (Wagenmakers & Farrell, 2004) was5 � 10�8 in the control group and 5 � 10�13 in the experi-mental group. These results are similar to those found inour previous study, making it less likely that those pre-vious results were due to the optimization algorithmfavoring one model over the other due to random chance.
Second, we performed several simulations to determinewhether the response probabilities predicted by the modelafter a change in a single mean could be reproduced by anarbitrary change in the corresponding variances. If meansand variances are non-identifiable in GRT-wIND, then whenone mean changes we should always be able to find a changein variances that leads to an equivalent pattern of behavioralpredictions. The results of our simulations, presented inAppendix, clearly indicate that this is not the case.
In sum, although a full study of the identifiability ofmeans and variances in GRT-wIND is beyond the scope ofthis article, the available evidence from both model fitsto the observed data and numerical simulations clearlysuggests that these parameters are identifiable.
3.2.5. Is learned separability homogeneous acrossparticipants?
An important assumption of GRT-wIND is that percep-tual representations for a set of stimuli are similar acrosspeople and differences in performance are the product ofdifferences in individual attentional and decisional strate-gies. This seems like a reasonable assumption when deal-ing with stimulus dimensions whose separability is notmalleable, because a specific level of separability has beeneither innately determined or learned by most adultsthrough considerable experience with the dimensions.However, this assumption might be violated by
dimensions that are relatively novel. The category-relevantdimension might or might not be perceived similarlyacross participants in the Experimental group, dependingon whether the limited experience with this dimensionfostered similar learning across participants. Differencesin learning rates could have easily led to violations of theassumptions of GRT-wIND. This issue is less critical whendimensions are completely novel, as in our Control group,where all participants are equivalently inexperienced withthe dimensions.
Thus, to apply GRT-wIND in the present experiment,one must assume that the effect of categorization trainingwas similar across participants in the Experimental group.An examination of individual performance during the lastsession with the categorization task reveals that this wasnot necessarily the case: accuracy for the participantsincluded in the present experiment ranged between 0.60and 0.93, meaning that they learned the task to varyingdegrees of proficiency.
One way to more directly determine whether theassumptions of GRT-wIND are appropriate is to analyzethe fit of the model to the data from each participant. Aswe have argued before (Soto et al., 2015), if the assumptionof common perceptual representations in GRT-wIND is vio-lated, then the perceptual distributions estimated fromdata should offer a good fit to the data from some partici-pants, but offer a poor fit to the data from other partici-pants. This should lead to distributions of fit values thatare not unimodal.
We computed the percentage of the variance in eachparticipant’s data explained by GRT-wIND as a measureof individual fit. All participants in the Experimental groupshowed high values of model-fit (0.92 and above), with amedian of 0.97. The distribution appeared unimodal,which was confirmed by a non-significant dip test of uni-modality (Hartigan & Hartigan, 1985), D = 0.07, p > 0.5.
It could be argued that differences among participantsin perceptual separability of the category-relevant dimen-sion could have been captured by GRT-wIND as differencesin decisional separability (Silbert & Thomas, 2013). As indi-cated earlier (Section 3.2.4), this is unlikely to be an issuein GRT-wIND. Furthermore, if this was the case, then thedecision bounds for the category-relevant dimensionshould have varied widely across participants. As seen inFig. 7b, this was not the case: decision bounds do vary,but they are similar and close to vertical (zero degrees ofrotation). In fact, a comparison of Figs. 7b and 8b revealsthat bounds seemed more homogeneous for the cat-egory-relevant dimension than for a completely noveldimension. There were no significant deviations from uni-modality in any of the distributions of bound parameters(rotation and location of the bounds for each dimension)in the Experimental group.
In sum, the results show no evidence that the effect ofcategorization training was dissimilar across participantsin the Experimental group. If anything, the results seem tosuggest that categorization training actually homogenizedperceptual and decisional processes in the Experimentalgroup, compared to completely novel dimensions.
The median model-fit value in the Control group washigh (0.96) and comparable to that of the Experimental

F.A. Soto, F.G. Ashby / Cognition 139 (2015) 105–129 123
group, with between-group differences in fit being non-sig-nificant according to a Kruskal–Wallis test. One participantin the Control group showed extremely poor model-fit(0.17), but a close examination of the data showed that thisparticipant had a performance level close to chance, whichwas not detected prior to analysis by our exclusion criteria.Thus, the difference in fit cannot be attributed to a differencein the way this participant perceived the stimuli. The dip testrevealed no violations of unimodality in the model-fit mea-sures from the Control group, D = 0.06, p > 0.5.
The parameters from decision bounds (Figs. 7a and 8a)also seemed more heterogeneous in the Control group thanin the Experimental group. However, as indicated earlier,there is little reason to expect that people would differ intheir perception of completely novel dimensions. It seemsmore likely that the results are due to heterogeneous deci-sion strategies, just as modeled by GRT-wIND. Importantly,even if people in the control group did perceive stimuliheterogeneously, our conclusions for the present experi-ment would not change. Note that there are many waysin which perceptual representations can violate perceptualseparability (heterogeneity), but only one way in whichthey can be separable. If dimensions are perceptually sep-arable across participants, GRTw-IND should be able tocapture this pattern, as it does for the category-relevantdimension in the Experimental group. In the GRT frame-work, heterogeneity of perceptual distributions across par-ticipants can only mean that violations of perceptualseparability and perceptual independence are present inthe data of at least some participants.
4. General discussion
The experiments reported here found evidence thattraining in a categorization task increases the separabilityof the category-relevant dimension according to a varietyof tests from multidimensional signal detection theory. InExperiment 1, participants who received pre-training in acategorization task showed reduced Garner interferenceeffects and reduced violations of marginal response andRT invariance, compared to participants who did notreceive such pre-training. Both of these tests are theoreti-cally related to violations of perceptual separability whendecisional separability is assumed to hold (Ashby &Maddox, 1994; Ashby & Townsend, 1986). In Experiment2, participants who received pre-training in a categoriza-tion task showed reduced violations of perceptual sep-arability according to a model-based analysis of datausing GRT-wIND (Soto et al., 2015), the best currentlyavailable framework for the analysis of dimensional inter-actions using GRT. The use of an identification task andGRT-wIND allowed us to dissociate perceptual from deci-sional dimensional interactions in Experiment 2, leadingto the finding that categorization experience increasesboth perceptual and decisional separabilities. We mustnote, however, that the effect of categorization on decisio-nal separability was only marginally significant, and moreresearch is required to evaluate the reliability of this result.
On the other hand, the data suggest that while the cat-egorization training we provided seemed to increase
perceptual separability, it did not necessarily produce com-plete separability. Experiment 1 showed evidence of viola-tions of perceptual separability in participants that hadreceived categorization training, according to both the mar-ginal response invariance and marginal RT invarianceanalyses. Such violations could also be observed inExperiment 2 (Fig. 6), but they were not statistically signifi-cant. One possibility is that these violations of perceptualseparability might disappear with even more categoriza-tion training. Another possibility is that the violations area consequence of testing separability of the category-rele-vant dimension when presented together with a com-pletely novel dimension. It is possible that separabilitylearning shows some level of dimensional specificity, beingstronger when tested with the originally trainedcategory-irrelevant dimension. If this is correct, then animportant goal for future research is to determine underwhat learning conditions such specificity can be completelyovercome.
As indicated in the introduction, a number of importantproblems in perception science can be seen as special casesof the question of whether or not two or more stimulusdimensions are perceptually separable. Notably, thisincludes any research testing the ‘‘independent’’ or ‘‘holis-tic’’ nature of perceptual processing and representations(e.g., Arguin & Saumier, 2000, 2004; Blais, Arguin, &Marleau, 2009; Fitousi & Wenger, 2013; Ganel & Goshen-Gottstein, 2004; Mack et al., 2011; Mestry et al., 2012;Richler et al., 2008; Schweinberger & Soukup, 1998; Soto& Wasserman, 2011; Soto et al., 2015; Stankiewicz, 2002;Thomas, 2001). In most research directed to answer suchquestions, experimenters have assumed that separabilityis a fixed characteristic of stimulus dimensions, in somecases determined by processing through independentbrain pathways and/or representations (e.g., Andrews &Ewbank, 2004; Bruce & Young, 1986; Haxby et al., 2000;Kayaert, Biederman, & Vogels, 2005; Vogels et al., 2001;Winston, Henson, Fine-Goulden, & Dolan, 2004). If the con-clusions reached by our study are correct and generaliz-able, then there would be three important consequencesfor such lines of research.
First, researchers should abandon the assumption thatseparability is an either/or feature of stimulus dimensionsthat must be hardwired in the brain. For example, someshape properties might have a special status in objectrecognition, being processed ‘‘independently’’ (Arguin &Saumier, 2000, 2004; Kayaert et al., 2005; Stankiewicz,2002; Vogels et al., 2001), simply because they are diagnos-tic in object categorization tasks usually encountered in theenvironment, instead of being innately determined(Biederman, 2001). Whether dimensions of face stimuliare separable (Fitousi & Wenger, 2013; Schweinberger &Soukup, 1998; Soto et al., 2015) might not be the result ofdifferent brain representations that are hardwired in thebrain (Andrews & Ewbank, 2004; Bruce & Young, 1986;Haxby et al., 2000; Winston et al., 2004). Instead, bothbehavioral and neurobiological markers of separabilitymight be better conceptualized as the result of learningthrough experience in object categorization.
Second, it is important to keep in mind that conclusionsabout separability might depend on the methods used for

124 F.A. Soto, F.G. Ashby / Cognition 139 (2015) 105–129
testing separability. For example, the Garner filtering task,which is one of the most widely used tests of separabilityor ‘‘independence’’ in perceptual science, is essentially acategorization task. Given the results reported here, thismeans that training in the task by itself might increase per-ceptual separability of the dimensions being tested. Wecurrently do not know how training in any other taskmight affect perceptual separability. For this reason, itseems wise that any research aimed at testing notionsrelated to separability should include controls aimed atshowing that the procedures used are capable to ade-quately detect violations of perceptual separability.
Third, when interpreting results suggesting separabilityor independence of perceptual dimensions, researchersshould take into account the possibility that prior categorylearning might have caused that separability. Given thefinding that a particular dimension is processed separatelyor independently, the question that a researcher should askhim/herself is: Is this a dimension that people often use todivide natural objects into classes?
An important aspect of our study is that we focused onGRT analyses of dimensional interactions. One advantageof using GRT is that it dissociates perceptual from decisio-nal factors in the study of separability and independence.The results from Experiment 2 suggest that categorizationtraining changes the separability of perceptual representa-tions, in addition to any changes it might also induce indecisional or attentional factors. This is in line with theresults of previous studies suggesting that category learn-ing may be accompanied by changes in perceptual repre-sentations rather than only in decisional processes(Folstein, Palmeri, & Gauthier, 2013; Goldstone, Lippa, &Shiffrin, 2001; Notman, Sowden, & Özgen, 2005).
On a more technical front, the present work also con-tributed to the development of new tests within the GRTframework to study differences between groups in viola-tions of perceptual separability, perceptual independenceand decisional separability (see Appendix). One reasonwhy such tests are important is that it has been recognizedfor a long time that the separability/integrality of stimulusdimensions is a matter of degree rather than kind (e.g.,Shepard, 1991). Our results are in line with this idea: learn-ing can increase the separability of a dimension, eventhough violations of separability can still be found in thedata. Given this, in many cases determining whether thereare differences between two conditions in dimensionalinteractions might be more interesting than determiningwhether two dimensions do or do not perceptually interact.
How do the present results relate to the hypothesis(Schyns et al., 1998) that category learning creates newfunctional features? Separability learning as studied hereis related to, but not the same as the creation of new func-tional features. An important aspect of the new featuresproposed by Schyns and colleagues is that they increasethe representational capacity of the visual system. This isnot necessarily true of separability learning, whichinvolves a re-description of objects in terms of dimensionsthat might not enrich representational capacity, but mightinstead facilitate the use of high-level cognitive mecha-nisms such as selective attention and rule learning. Onthe other hand, one defining characteristic of new
functional features is that they are perceived indepen-dently from their components (Schyns & Rodet, 1997;Schyns et al., 1998). That is, a feature is a unit of configuralor holistic perception, which is perceived directly and notanalyzed into components. As indicated earlier, the differ-ence between holistic or configural processing versus ana-lytic processing can be cast in terms of integrality/separability of component features. Thus, at least someaspects of the problem of new feature learning, as con-ceived by Schyns and colleagues, are captured by the con-cept of separability learning.
Importantly, one problem with the controversy overwhether the visual system represents objects through fixedversus flexible features is that there is no formal definition ofa feature (see Schyns et al., 1998, and comments). In theobject recognition literature, a feature is essentially anyphysical stimulus dimension that can be varied by theexperimenter in a task, or any form of information thatcan be extracted from an image by a computational model.We propose that focusing on separable features or dimen-sions is both more tractable and more theoretically relevantthat focusing on features in general. It is more tractablebecause there are clear formal definitions of perceptual sep-arability, accompanied by operational tests to detect it.Differences in separability can be measured, which is thefirst step of a sound science. Focusing on separable dimen-sions is more theoretically relevant because, as discussedin the introduction, there are several ways in which sep-arable dimensions are ‘‘special’’ compared to dimensionsthat do not show separability. Importantly, it seems like anumber of cognitive operations (e.g., selective attention,rule learning, categorization, generalization, working mem-ory) depend on whether or not dimensions are separable. Itis such operations and their effect on behavioral choices thatultimately determine whether a set of dimensions is ‘‘spe-cial’’ in terms of adaptive behavior.
Author notes
Preparation of this article was supported in part by theUS Army Research Office through the Institute forCollaborative Biotechnologies under Grant W911NF-07-1-0072. The U.S. government is authorized to reproduceand distribute reprints for Governmental purposes notwithstanding any copyright annotation thereon. The viewsand conclusions contained herein are those of the authorsand should not be interpreted as necessarily representingthe official policies or endorsements, either expressed orimplied, of the U.S. Government.
Appendix
GRT-wIND
In the 2 � 2 identification design used in Experiment 2,stimuli vary along two dimensions A and B, each with twolevels indexed by i = 1, 2, and j = 1, 2, respectively. Supposethere are N participants indexed by k = 1,2, . . .N. The GRT-wIND model for this design has four perceptual dis-tributions, which are assumed to be bivariate normal and

F.A. Soto, F.G. Ashby / Cognition 139 (2015) 105–129 125
common to all participants. Each distribution is describedby a mean vector:
lAiBj¼
lAiBj1
lAiBj2
" #; ðA1Þ
and a covariance matrix:
RAiBj¼
r2AiBj1
qAiBjrAiBj1rAiBj2
qAiBjrAiBj1rAiBj2 r2
AiBj2
" #; ðA2Þ
where r and q represent standard deviations and correla-tions, respectively. We set lA1B1
¼ ½0;0� and rA1B1 ¼ rA1B2
¼ 1, to fix the position and scale of the final solution.The model also has several parameters describing pro-
cesses unique to each individual. The parameters jk andkk represent global and selective attention to dimensionsby participant k, respectively. The covariance matrix forthe distribution of perceptual effects of AiBj in participantk is equal to:
RAiBjk ¼
r2AiBj1
jkkkqAiBj
rAiBj1rAi Bj2ffiffiffiffiffiffiffiffiffiffiffiffiffiffiffiffiffij2
kkkð1�kkÞ
pqAiBj
rAi Bj1rAiBj2ffiffiffiffiffiffiffiffiffiffiffiffiffiffiffiffiffij2
kkkð1�kkÞ
p r2Ai Bj2
jkð1�kkÞ
26664
37775: ðA3Þ
Note that high values of jk decrease the values of allvariances, leading to fewer confusion errors in general. Avalue of kk = 0.5 represents equal attention to each dimen-sion. High values of kk decrease the variances on dimensionA and increase the variances on dimension B, representingselective attention to A. The opposite is true for low valuesof kk.
The other four individual parameters describe the par-ticipant’s linear decision bounds. Each single bound canbe written as a discriminant function:
hAkðx1; x2Þ ¼ bAk1x1 þ bAk2x2 þ cAk; ðA4Þ
where hAk represents the discriminant function used toclassify component A by the kth participant. A similarequation can be used to describe hBk, the discriminantfunction used to classify component B by the kth partici-pant. The parameters bAk1 and bBk2 were fixed to a valueof 1.0.
Maximum likelihood estimation of parameters
The data from each participant in an identificationexperiment are summarized in a confusion matrix, withdifferent rows for each stimulus, different columns foreach response, and response frequencies reported in eachcell of the matrix. Let Si and Rj denote stimuli andresponses in the task, respectively, with i and j rangingfrom 1 to 4. There are N participants in the experiment,indexed by k = 1,2, . . .,N. Let rkij denote the frequency withwhich participant k responded Rj on trials when stimulus Si
was presented and Pk(Rj|Si) the corresponding responseprobability.
Given a set of parameter values, the likelihood of thedata is computed in two steps. First, the predicted confu-sion matrix of each participant is obtained from the model,where each Pk(Rj|Si) is computed by integrating the volume
of the Si perceptual distribution in response region Rj (seeAshby & Soto, 2015). Second, the log of the likelihood func-tion for each participant is computed and summed acrossall participants:
log L ¼XN
k¼1
X4
i¼1
X4
j¼1
rkij log PkðRjjSiÞ: ðA5Þ
The maximum likelihood estimates are those that maxi-mize Eq. (A5).
Tests of dimensional interactions
Dimensional interactions can be tested by comparingmaximum-likelihood parameter estimates againstexpected values from null hypotheses using a Wald test(Soto et al., 2015). Let h be a column vector containingthe maximum likelihood parameter estimates. The Waldtest can be used to test any null hypothesis that can beexpressed in the form of linear restrictions on h:
H0 : Rh� q ¼ 0
H1 : Rh� q – 0;ðA6Þ
where R is a matrix with number of columns equal to thenumber of parameters and number of rows equal to thenumber of restrictions being tested, and q is a column vec-tor with number of rows equal to the number of restric-tions being tested. For example, if we wanted to test thehypothesis that h1 ¼ 0, then R would have a single row(we are testing a single restriction) with a +1 in the firstcell of that row and zeros in all other cells, while q wouldhave a single cell with a zero in it. If we want to addition-ally test the hypothesis that h2 � h3 ¼ 10, then we wouldadd a second row to R with a +1 in the second column(corresponding to þh2) and �1 in the third column(corresponding to �h3), while q would now have a secondcell with the value 10 in it.
The Wald statistic:
W ¼ Rh� qh iT
RRhRTh i�1
½Rh� q�; ðA7Þ
where []T represents matrix transpose, has a chi-squareddistribution with degrees of freedom equal to the numberof restrictions being tested (the length of qÞ. The covariancematrix of the maximum likelihood estimates can be esti-mated using the inverse of the Hessian of the log-likeli-hood function at the solution.
The restrictions imposed on the model by perceptualseparability of dimension A from dimension B are thefollowing:
lA1B21 ¼ 0
rA1B21 ¼ 1lA2B11 � lA2B21 ¼ 0
rA2B11 � rA2B21 ¼ 0
ðA8Þ
The restrictions imposed in the model by perceptualseparability of dimension B from dimension A are thefollowing:

126 F.A. Soto, F.G. Ashby / Cognition 139 (2015) 105–129
lA2B12 ¼ 0
rA2B12 ¼ 1lA1B22 � lA2B22 ¼ 0
rA1B22 � rA2B22 ¼ 0
ðA9Þ
The restrictions imposed in the model by perceptualindependence in each of the perceptual distributions arethe following:
qA1B1¼ 0
qA1B2¼ 0
qA2B1¼ 0
qA2B2¼ 0
ðA10Þ
The Wald test allows tests of decisional separability forthe group average or for each participant individually.Here, we test decisional separability on average to keepconsistence with between-group comparisons, which canonly be performed on average decisional separability (seebelow). The single restriction imposed in the model byaverage decisional separability of dimension A fromdimension B can be summarized as:
XN
k¼1
bAk2¼ 0 ðA11Þ
The restriction imposed on the model by average deci-sional separability of dimension B from dimension A isthe following:
XN
k¼1
bBk1¼ 0 ðA12Þ
Tests of differences between groups in the magnitude ofdimensional interactions
In many applications of GRT, such as Experiment 2 of thepresent study, it is desirable to statistically compare twosets of parameter estimates, h1 and h2, to evaluate the relia-bility of observed differences in the magnitude of violationsof separability or independence across experimental condi-tions. Here we derive a test for the case in which the twosets of parameter estimates have been obtained fromindependent samples.
First note that if hi is a maximum likelihood estimate,then one of its asymptotic properties is that it is approxi-mately normally distributed:
hi �a Normalðhi;RiÞ ðA13Þ
From our discussion of the Wald test, we know thatmany hypotheses about these parameter estimates canbe expressed as linear restrictions on hi. The followingvector:
x ¼ Rih� q ðA14Þ
measures deviations from each one of the restrictions thathave been encoded in the matrix Ri and the vector q. Theprevious section described what restrictions correspondto the hypotheses of perceptual separability, decisional
separability and perceptual independence. Because a lineartransformation of a normally distributed vector is also nor-mally distributed, we have that
xi�a Normal Rhi � q;RiRiR
Ti
� �ðA15Þ
We are interested in testing the following hypotheses:
H0 : x1 �x2 ¼ 0H1 : x1 �x2 – 0
ðA16Þ
To obtain a statistic to test these hypotheses, we notethat because both x1 and x2 are multivariate normal(Eq. (A15)), their difference is also multivariate normaland the statistic:
D ¼ x1 � x2½ �T Rx1�x2
� ��1 x1 � x2½ � ðA17Þ
where
Rx1�x2 ¼ R1R1RT1 þ R2R2RT
2 ðA18Þ
follows a Chi-square distribution under H0, with degrees offreedom equal to the number of rows in the matrices Ri, soit can be used as our test statistic. As for the Wald test, wecan obtain estimates of the covariance matrices in Eq.(A18) by taking the inverse of the Hessian of the log-likeli-hood function at the solution. Because of the use of an esti-mate of the covariance matrix, the distribution of the testonly approximates a Chi-square distribution. The inverseof the Hessian is a consistent estimator of the covariancematrix, so the quality of this approximation will increaseas sample size increases.
Note that because slope parameters reflect individualbounds, they are not individually comparable acrossgroups through D. The only valid between-groups compar-ison of decisional separability is in terms of group averages(Eqs. (A11) and (A12)). A test of individual decisional sep-arability (used in Soto et al., 2015) does not have acorresponding between-groups test and therefore wasnot used here.
Identifiability of means and variances in GRT-wIND
Here we briefly report the results of simulations aimedat determining whether means and variances are bothuniquely identifiable in GRT-wIND. Each of our simulationsconsisted of 150 repetitions of the following procedure.Starting with the best-fitting model found for the experi-mental group of Experiment 2, one parameter from themodel was randomly selected and changed by a randomvalue. The response probabilities from this ‘‘target model’’were computed. Then, we used an optimization algorithmto find the value of a set of free parameters in a ‘‘testmodel’’ leading to predictions as similar as possible tothose of the target model. The dissimilarity of predictionswas measured through their sum of squared differences(SSD).
If means and variances are non-identifiable in GRT-wIND, then it should always be possible to change a meanusing this procedure and find a set of corresponding vari-ances leading to an SSD of zero. In practice, of course, theoptimization algorithm might not always be able to find

F.A. Soto, F.G. Ashby / Cognition 139 (2015) 105–129 127
the set of variances leading to the lowest SSD. To deter-mine an upper limit of precision for our optimization algo-rithm, we performed several benchmark simulations inwhich the randomly changed parameter in the targetmodel was a single variance (randomly changed from 0to 1, 0 to 2, or 0 to 4 in different simulations), and the freeparameters in the test model were the two variances fromthe same distribution. The minimal SSD found in thesesimulations ranged between 0 and 0.019, with a medianof 2.92 � 10�6. The maximum value of 0.019 was used asbenchmark in the following analyses.
We then performed a simulation in which the randomlychanged parameter in the target model was a single mean(randomly changed from 0 to 1), and the free parameters inthe test model were the two variances from the same dis-tribution. In this case, the SSD ranged between 0 and 2.302,with a median of 0.054, which was significantly higherthan the maximum SSD found in our benchmark sim-ulations, according to a Wilcoxon signed rank test(p < 0.0001). The only SSD equal to zero in this simulationwas due to equivalent predictions in the target and testmodels before the optimization was run, which resultedfrom a too small random change in the mean parameterof the target model. In sum, this simulation suggests thatthe group means and variances are identifiable in GRT-wIND. These results are unlikely to be due to the optimiza-tion algorithm being stuck in local minima because plot-ting SSD as a function of the values of the variancesrevealed a smooth concave function.
To determine whether changes in individual variances(which are determined by the group variances and individ-ual attention parameters) could produce the same confu-sion matrices as changes in a group mean, we repeatedthe previous simulations, but this time the free parametersin the test model were the two variances of the modifieddistribution plus all individual attention parameters. Theminimal SSDs from this simulation ranged from1.36 � 10�6 to 2.58, with a median of 0.049, which was sig-nificantly higher than the maximum SSD found in ourbenchmark simulations, according to a Wilcoxon signedrank test (p < 0.0001). In other words, these simulationssuggest that the means and individual variances areidentifiable in GRT-wIND.
Thus, all of our analyses suggest that, unlike standardsignal detection theory, means and variances are uniquelyidentifiable in GRT-wIND. We believe this is because achange in a mean in the model affects response probabili-ties in a single row of all confusion matrices. Because eachparticipant has different decision bounds and attentionparameters, which scale variances differently, a change ina mean has a different impact in different participants,and to obtain an equivalent model by changing variances,we would have to change each individual set of variancesin a specific way. This is why a change in the group vari-ances cannot achieve the same result as a change in themeans. The reason why individual variances and meansare also uniquely identifiable is that individual variancesdepend on attention parameters that affect all perceptualdistributions. Changes in individual attention parametersaffect response probabilities in all rows of a single confusionmatrix, so under no circumstances can a change in
attention parameters and global variances lead to the samepredictions as a change in a single mean, which affectsresponse probabilities in a single row of all confusion matri-ces. In other words, changes in individual attentionparameters affect not only those cells in the confusionmatrix affected by changes in a mean, but also severalother cells.
References
Andrews, T. J., & Ewbank, M. P. (2004). Distinct representations for facialidentity and changeable aspects of faces in the human temporal lobe.Neuroimage, 23(3), 905–913.
Arguin, M., & Saumier, D. (2000). Conjunction and linear non-separabilityeffects in visual shape encoding. Vision Research, 40(22), 3099–3115.
Arguin, M., & Saumier, D. (2004). Independent processing of parts and oftheir spatial organization in complex visual objects. PsychologicalScience, 15(9), 629–633.
Ashby, F. G. (1988). Estimating the parameters of multidimensional signaldetection theory from simultaneous ratings on separate stimuluscomponents. Perception & Psychophysics, 44(3), 195–204.
Ashby, F. G., & Lee, W. W. (1991). Predicting similarity and categorizationfrom identification. Journal of Experimental Psychology: General,120(2), 150–172.
Ashby, F. G., & Maddox, W. T. (1994). A response time theory ofseparability and integrality in speeded classification. Journal ofMathematical Psychology, 38(4), 423–466.
Ashby, F. G., & Maddox, W. T. (2005). Human category learning. AnnualReview of Psychology, 56, 149–178.
Ashby, F. G., Queller, S., & Berretty, P. M. (1999). On the dominance ofunidimensional rules in unsupervised categorization. Attention,Perception, & Psychophysics, 61(6), 1178–1199.
Ashby, F. G., & Soto, F. A. (2015). Multidimensional signal detectiontheory. In J. R. Busemeyer, J. T. Townsend, Z. J. Wang, & A. Eidels (Eds.),Oxford handbook of computational and mathematical psychology(pp. 13–34). New York, NY: Oxford University Press.
Ashby, F. G., & Townsend, J. T. (1986). Varieties of perceptualindependence. Psychological Review, 93(2), 154–179.
Ashby, F. G., & Valentin, V. V. (2005). Multiple systems of perceptualcategory learning: Theory and cognitive tests. In H. Cohen & C.Lefebvre (Eds.), Categorization in cognitive science (pp. 548–572). NewYork: Elsevier.
Ashby, F. G., Waldron, E. M., Lee, W. W., & Berkman, A. (2001).Suboptimality in human categorization and identification. Journal ofExperimental Psychology: General, 130(1), 77.
Bae, G. Y., & Flombaum, J. I. (2013). Two items remembered as precisely asone: How integral features can improve visual working memory.Psychological Science, 24, 2038–2047.
Biederman, I. (2001). Recognizing depth-rotated objects: A review ofrecent research and theory. Spatial Vision, 13(2–3), 241–253.
Blais, C., Arguin, M., & Marleau, I. (2009). Orientation invariance in visualshape perception. Journal of Vision, 9(2), 1–23.
Bruce, V., & Young, A. (1986). Understanding face recognition. BritishJournal of Psychology, 77(3), 305–327.
Burns, B., & Shepp, B. E. (1988). Dimensional interactions and thestructure of psychological space: The representation of hue,saturation, and brightness. Perception & Psychophysics, 43(5),494–507.
Dunn, J. C. (1983). Spatial metrics of integral and separable dimensions.Journal of Experimental Psychology: Human Perception and Performance,9(2), 242–257.
Ell, S. W., Ashby, F. G., & Hutchinson, S. (2012). Unsupervised categorylearning with integral-dimension stimuli. The Quarterly Journal ofExperimental Psychology, 65(8), 1537–1562.
Farah, M. J., Wilson, K. D., Drain, M., & Tanaka, J. N. (1998). What is‘‘special’’ about face perception? Psychological Review, 105(3), 482.
Fitousi, D., & Wenger, M. J. (2013). Variants of independence in theperception of facial identity and expression. Journal of ExperimentalPsychology: Human Perception and Performance, 39(1), 133–155.
Foard, C. F., & Kemler-Nelson, D. G. (1984). Holistic and analytic modes ofprocessing: The multiple determinants of perceptual analysis. Journalof Experimental Psychology: General, 113(1), 94–111.
Folstein, J. R., Gauthier, I., & Palmeri, T. J. (2012). Not all morph spacesstretch alike: How category learning affects object discrimination.Journal of Experimental Psychology: Learning, Memory, and Cognition,38(4), 802–807.

128 F.A. Soto, F.G. Ashby / Cognition 139 (2015) 105–129
Folstein, J. R., Palmeri, T. J., & Gauthier, I. (2013). Category learningincreases discriminability of relevant object dimensions in visualcortex. Cerebral Cortex, 23(4), 814–823.
Ganel, T., & Goshen-Gottstein, Y. (2004). Effects of familiarity on theperceptual integrality of the identity and expression of faces: Theparallel-route hypothesis revisited. Journal of Experimental Psychology:Human Perception and Performance, 30(3), 583–596.
Garner, W. R. (1970). The stimulus in information processing. AmericanPsychologist, 25, 350–358.
Garner, W. R. (1974). The processing of information and structure. NewYork: Lawrence Erlbaum Associates.
Goldstone, R. L. (1994a). An efficient method for obtaining similarity data.Behavior Research Methods, 26(4), 381–386.
Goldstone, R. L. (1994b). Influences of categorization on perceptualdiscrimination. Journal of Experimental Psychology: General, 123(2),178–200.
Goldstone, R. L., Gerganov, A., Landy, D., & Roberts, M. E. (2009). Learningto see and conceive. In L. Tommasi, M. A. Peterson, & L. Nadel (Eds.),Cognitive biology: Evolutionary and developmental perspectives on mind,brain, and behavior (pp. 163). Cambridge, MA: MIT Press.
Goldstone, R. L., & Hendrickson, A. T. (2010). Categorical perception. WileyInterdisciplinary Reviews: Cognitive Science, 1(1), 69–78.
Goldstone, R. L., Lippa, Y., & Shiffrin, R. M. (2001). Altering objectrepresentations through category learning. Cognition, 78(1), 27–43.
Goldstone, R. L., & Steyvers, M. (2001). The sensitization anddifferentiation of dimensions during category learning. Journal ofExperimental Psychology: General, 130(1), 116.
Grau, J. W., & Nelson, D. K. (1988). The distinction between integral andseparable dimensions: Evidence for the integrality of pitch andloudness. Journal of Experimental Psychology: General, 117(4),347–370.
Hanania, R., & Smith, L. B. (2010). Selective attention and attentionswitching: Towards a unified developmental approach. DevelopmentalScience, 13(4), 622–635.
Handel, S., & Imai, S. (1972). The free classification of analyzable andunanalyzable stimuli. Perception & Psychophysics, 12, 108–116.
Handel, S., Imai, S., & Spottswood, P. (1980). Dimensional, similarity, andconfigural classification of integral and separable stimuli. Perception &Psychophysics, 28, 205–212.
Hartigan, J. A., & Hartigan, P. M. (1985). The dip test of unimodality. TheAnnals of Statistics, 13(1), 70–84.
Haxby, J. V., Hoffman, E. A., & Gobbini, M. I. (2000). The distributed humanneural system for face perception. Trends in Cognitive Sciences, 4(6),223–232.
Hockema, S. A., Blair, M. R., & Goldstone, R. L. (2005). Differentiation fornovel dimensions. In B. G. Bara, L. W. Barsalou, & M. Bucciarelli (Eds.),Proceedings of the twenty-seventh annual conference of the cognitivescience society (pp. 953–958). Hillsdale, NJ: Erlbaum.
Kadlec, H., & Townsend, J. T. (1992a). Implications of marginal andconditional detection parameters for the separabilities andindependence of perceptual dimensions. Journal of MathematicalPsychology, 36(3), 325–374.
Kadlec, H., & Townsend, J. T. (1992b). Signal detection analysis ofmultidimensional interactions. In F. G. Ashby (Ed.), Multidimensionalmodels of perception and cognition (pp. 181–231). Hillsdale, NJ:Lawrence Erlbaum Associates.
Kanwisher, N. (2000). Domain specificity in face perception. NatureNeuroscience, 3, 759–763.
Kayaert, G., Biederman, I., & Vogels, R. (2005). Representation of regularand irregular shapes in macaque inferotemporal cortex. CerebralCortex, 15(9), 1308–1321.
Kravitz, D. J., Vinson, L. D., & Baker, C. I. (2008). How position dependent isvisual object recognition? Trends in Cognitive Sciences, 12(3),114–122.
Mack, M. L., Richler, J. J., Gauthier, I., & Palmeri, T. J. (2011). Indecision ondecisional separability. Psychonomic Bulletin & Review, 18(1), 1–9.
Maddox, W. T., & Ashby, F. G. (1996). Perceptual separability, decisionalseparability, and the identification–speeded classificationrelationship. Journal of Experimental Psychology: Human Perceptionand Performance, 22(4), 795–817.
Maurer, D., Grand, R. L., & Mondloch, C. J. (2002). The many faces ofconfigural processing. Trends in Cognitive Sciences, 6(6), 255–260.
Medin, D. L., Wattenmaker, W. D., & Hampson, S. E. (1987). Familyresemblance, conceptual cohesiveness, and category construction.Cognitive Psychology, 19(2), 242–279.
Melara, R. D., Marks, L. E., & Lesko, K. E. (1992). Optional processes insimilarity judgments. Perception & Psychophysics, 51(2), 123–133.
Melara, R. D., Marks, L. E., & Potts, B. C. (1993). Primacy of dimensions incolor perception. Journal of Experimental Psychology: HumanPerception and Performance, 19(5), 1082–1104.
Mestry, N., Wenger, M. J., & Donnelly, N. (2012). Identifying sources ofconfigurality in three face processing tasks. Frontiers in PerceptionScience, 3, 456.
Notman, L. A., Sowden, P. T., & Özgen, E. (2005). The nature of learnedcategorical perception effects: A psychophysical approach. Cognition,95(2), B1–B14.
Oosterhof, N. N., & Todorov, A. (2008). The functional basis of faceevaluation. Proceedings of the National Academy of Sciences, 105(32),11087–11092.
Op de Beeck, H. P., Haushofer, J., & Kanwisher, N. G. (2008). InterpretingfMRI data: Maps, modules and dimensions. Nature ReviewsNeuroscience, 9(2), 123–135.
Op de Beeck, H. P., Wagemans, J., & Vogels, R. (2003). The effect ofcategory learning on the representation of shape: Dimensions can bebiased but not differentiated. Journal of Experimental Psychology:General, 132(4), 491–511.
Peissig, J. J., & Tarr, M. J. (2007). Visual object recognition: Do we know morenow than we did 20 years ago? Annual Review of Psychology, 58, 75.
Richler, J. J., Gauthier, I., Wenger, M. J., & Palmeri, T. J. (2008). Holisticprocessing of faces: Perceptual and decisional components. Journal ofExperimental Psychology: Learning, Memory, and Cognition, 34(2),328–342.
Richler, J. J., Palmeri, T. J., & Gauthier, I. (2012). Meanings, mechanisms,and measures of holistic processing. Frontiers in Perception Science, 3,553.
Schweinberger, S. R., & Soukup, G. R. (1998). Asymmetric relationshipsamong perceptions of facial identity, emotion, and facial speech.Journal of Experimental Psychology: Human Perception and Performance,24(6), 1748–1765.
Schyns, P. G., Goldstone, R. L., & Thibaut, J. P. (1998). The development offeatures in object concepts. Behavioral and Brain Sciences, 21(01),1–17.
Schyns, P. G., & Rodet, L. (1997). Categorization creates functionalfeatures. Journal of Experimental Psychology: Learning, Memory, andCognition, 23(3), 681–696.
Shepard, R. N. (1991). Integrality versus separability of stimulusdimensions: From an early convergence of evidence to a proposedtheoretical basis. In J. Pomerantz & G. Lockhead (Eds.), The perceptionof structure: Essays in honor of Wendell R. Garner (pp. 53–71).Washington, DC: American Psychological Association.
Silbert, N. H., & Thomas, R. (2013). Decisional separability, modelidentification, and statistical inference in the general recognitiontheory framework. Psychonomic Bulletin & Review, 20(1), 1–20.
Smith, J. D., Beran, M. J., Crossley, M. J., Boomer, J., & Ashby, F. G. (2010).Implicit and explicit category learning by macaques (Macaca mulatta)and humans (Homo sapiens). Journal of Experimental Psychology:Animal Behavior Processes, 36(1), 54–65.
Smith, L. B., & Kemler, D. G. (1978). Levels of experienced dimensionalityin children and adults. Cognitive Psychology, 10(4), 502–532.
Soto, F. A., Gershman, S. J., & Niv, Y. (2014). Explaining compoundgeneralization in associative and causal learning through rationalprinciples of dimensional generalization. Psychological Review, 121(3),526–558.
Soto, F. A., Musgrave, R., Vucovich, L., & Ashby, F. G. (2015). Generalrecognition theory with individual differences: A new method forexamining perceptual and decisional interactions with an applicationto face perception. Psychonomic Bulletin & Review, 22(1),88–111.
Soto, F. A., & Wasserman, E. A. (2011). Asymmetrical interactions in theperception of face identity and emotional expression are not uniqueto the primate visual system. Journal of Vision, 11(3).
Stankiewicz, B. J. (2002). Empirical evidence for independent dimensionsin the visual representation of three-dimensional shape. Journal ofExperimental Psychology: Human Perception and Performance, 28(4),913–932.
Thomas, R. (2001). Perceptual interactions of facial dimensions inspeeded classification and identification. Attention, Perception &Psychophysics, 63(4), 625–650.
Townsend, J. T., Houpt, J. W., & Silbert, N. H. (2012). General recognitiontheory extended to include response times: Predictions for a class ofparallel systems. Journal of Mathematical Psychology, 56(6),476–494.
Ungerleider, L. G., & Haxby, J. V. (1994). ‘‘What’’ and ‘‘where’’ in thehuman brain. Current Opinion in Neurobiology, 4(2), 157–165.

F.A. Soto, F.G. Ashby / Cognition 139 (2015) 105–129 129
Van Zandt, T. (2002). Analysis of response time distributions. In J. T.Wixted (Ed.), Steven’s handbook of experimental psychology:Methodology in experimental psychology (pp. 461–516). San Diego,CA: Academic Press.
Vogels, R., Biederman, I., Bar, M., & Lorincz, A. (2001). Inferior temporalneurons show greater sensitivity to nonaccidental than to metricshape differences. Journal of Cognitive Neuroscience, 13(4),444–453.
Wagenmakers, E. J., & Farrell, S. (2004). AIC model selection using Akaikeweights. Psychonomic Bulletin & Review, 11(1), 192–196.
Wickens, T. D. (1992). Maximum-likelihood estimation of a multivariateGaussian rating model with excluded data. Journal of MathematicalPsychology, 36(2), 213–234.
Winston, J. S., Henson, R. N. A., Fine-Goulden, M. R., & Dolan, R. J. (2004).FMRI-adaptation reveals dissociable neural representations ofidentity and expression in face perception. Journal ofNeurophysiology, 92(3), 1830–1839.