cast iron soil pipe fittings from china · pdf filepublication 4722 september 2017 cast iron...
TRANSCRIPT

U.S. International Trade CommissionPublication 4722 September 2017
Washington, DC 20436
Cast Iron Soil Pipe Fittings from China
Investigation Nos. 701-TA-583 and 731-TA-1381 (Preliminary)
U.S. International Trade Commission
COMMISSIONERS
Rhonda K. Schmidtlein, Chairman David S. Johanson, Vice Chairman
Irving A. Williamson Meredith M. Broadbent
Catherine DeFilippo
Staff assigned
Address all communications to Secretary to the Commission
United States International Trade Commission Washington, DC 20436
Director of Operations
Amelia Shister, Investigator Mark Brininstool, Industry Analyst
Craig Thomsen, Economist Emily Kim, Accountant Laura Thayn, Statistician
Darlene Smith, Statistical Assistant Heng Loke, Attorney
Douglas Corkran, Supervisory Investigator
Special assistance fromKeysha Martinez, Investigator

U.S. International Trade CommissionWashington, DC 20436
www.usitc.gov
Publication 4722 September 2017
Cast Iron Soil Pipe Fittings from China
Investigation Nos. 701-TA-583 and 731-TA-1381 (Preliminary)

CONTENTS Page
i
Determinations ............................................................................................................................... 1 Views of the Commission ............................................................................................................... 3
Part I: Introduction .............................................................................................................. I-1
Background ................................................................................................................................ I-1
Statutory criteria and organization of the report ..................................................................... I-1
Statutory criteria ................................................................................................................... I-1
Organization of report ........................................................................................................... I-3
Market summary ....................................................................................................................... I-3
Summary data and data sources ............................................................................................... I-4
Previous and related investigations .......................................................................................... I-4
Nature and extent of alleged subsidies and sales at LTFV ........................................................ I-5
Alleged subsidies ................................................................................................................... I-5
Alleged sales at LTFV ............................................................................................................. I-7
The subject merchandise .......................................................................................................... I-7
Commerce’s scope ................................................................................................................ I-7
Tariff treatment ..................................................................................................................... I-8
The product ............................................................................................................................... I-8
Description and applications ................................................................................................. I-8
Manufacturing processes .................................................................................................... I-10
Domestic like product issues ................................................................................................... I-12

CONTENTS Page
ii
Part II: Conditions of competition in the U.S. market........................................................... II-1
U.S. market characteristics....................................................................................................... II-1
Channels of distribution ........................................................................................................... II-1
Geographic distribution ........................................................................................................... II-2
Supply and demand considerations ......................................................................................... II-3
U.S. supply ............................................................................................................................ II-3
U.S. demand ......................................................................................................................... II-6
Substitutability issues ............................................................................................................. II-10
Lead times .......................................................................................................................... II-11
Factors affecting purchasing decisions............................................................................... II-11
Comparison of U.S.-produced and imported CISP fittings ................................................. II-11
Part III: U.S. producers’ production, shipments, and employment ...................................... III-1
U.S. producers ......................................................................................................................... III-1
U.S. production, capacity, and capacity utilization ................................................................. III-2
Alternative products ............................................................................................................ III-2
U.S. producers’ U.S. shipments and exports ........................................................................... III-3
U.S. producers’ inventories ..................................................................................................... III-3
U.S. employment, wages, and productivity ............................................................................ III-3
Part IV: U.S. imports, apparent U.S. consumption, and market shares ............................... IV-1
U.S. importers.......................................................................................................................... IV-1
U.S. imports ............................................................................................................................. IV-2
Negligibility .............................................................................................................................. IV-4
Presence in the market ........................................................................................................... IV-5
Geographical markets ........................................................................................................... IV-10
Apparent U.S. consumption .................................................................................................. IV-11
U.S. market shares ................................................................................................................ IV-12

CONTENTS Page
iii
Part V: Pricing data ............................................................................................................. V-1
Factors affecting prices ............................................................................................................ V-1
Raw material costs ............................................................................................................... V-1
Transportation costs to the U.S. market .............................................................................. V-3
U.S. inland transportation costs ........................................................................................... V-3
Pricing practices ....................................................................................................................... V-3
Pricing methods .................................................................................................................... V-3
Sales terms and discounts .................................................................................................... V-4
Price data .................................................................................................................................. V-5
Price trends ........................................................................................................................... V-7
Lost sales and lost revenue ...................................................................................................... V-7
Part VI: Financial experience of U.S. producers .................................................................. VI-1
Introduction............................................................................................................................. VI-1
Operations on cast iron soil pipe fittings ................................................................................ VI-1
Net sales .............................................................................................................................. VI-1
Cost of goods sold and gross profit or (loss) ....................................................................... VI-2
SG&A expenses and operating income or (loss) ................................................................. VI-3
Other expenses and net income or (loss) ........................................................................... VI-3
Variance analysis ................................................................................................................. VI-4
Capital expenditures and research and development expenses ............................................ VI-4
Assets and return on assets .................................................................................................... VI-5
Capital and investment ........................................................................................................ VI-5
CONTENTS Page
iv
Part VII: Threat considerations and information on nonsubject countries .......................... VII-1
The industry in China .............................................................................................................. VII-3
Changes in operations ........................................................................................................ VII-4
Operations on CISP fittings ................................................................................................. VII-4
Alternative products ........................................................................................................... VII-6
Exports ................................................................................................................................ VII-6
U.S. inventories of imported merchandise ............................................................................ VII-7
U.S. importers’ outstanding orders ........................................................................................ VII-8
Antidumping or countervailing duty orders in third-country markets .................................. VII-8
Appendixes
A. Federal Register notices ................................................................................................. A-1
B. List of conference witnesses .......................................................................................... B-1
C. Summary data ................................................................................................................ C-1
Note.—Information that would reveal confidential operations of individual concerns may not be published and therefore has been deleted. Such deletions are indicated by asterisks.

UNITED STATES INTERNATIONAL TRADE COMMISSION
Investigation Nos. 701-TA-583 and 731-TA-1381 (Preliminary)
Cast Iron Soil Pipe Fittings from China
DETERMINATIONS
On the basis of the record1 developed in the subject investigations, the United States International Trade Commission (“Commission”) determines, pursuant to the Tariff Act of 1930 (“the Act”), that there is a reasonable indication that an industry in the United States is materially injured by reason of imports of cast iron soil pipe fittings from China, provided for in subheading 7307.11.00 of the Harmonized Tariff Schedule of the United States, that are alleged to be sold in the United States at less than fair value (“LTFV”) and to be subsidized by the government of China.
COMMENCEMENT OF FINAL PHASE INVESTIGATIONS
Pursuant to section 207.18 of the Commission’s rules, the Commission also gives notice of the commencement of the final phase of its investigations. The Commission will issue a final phase notice of scheduling, which will be published in the Federal Register as provided in section 207.21 of the Commission’s rules, upon notice from the Department of Commerce (“Commerce”) of affirmative preliminary determinations in the investigations under sections 703(b) or 733(b) of the Act, or, if the preliminary determinations are negative, upon notice of affirmative final determinations in those investigations under sections 705(a) or 735(a) of the Act. Parties that filed entries of appearance in the preliminary phase of the investigations need not enter a separate appearance for the final phase of the investigations. Industrial users, and, if the merchandise under investigation is sold at the retail level, representative consumer organizations have the right to appear as parties in Commission antidumping and countervailing duty investigations. The Secretary will prepare a public service list containing the names and addresses of all persons, or their representatives, who are parties to the investigations.
BACKGROUND
On July 13, 2017, the Cast Iron Soil Pipe Institute, Mundelein, Illinois, filed a petition with the Commission and Commerce, alleging that an industry in the United States is materially injured or threatened with material injury by reason of LTFV and subsidized imports of cast iron soil pipe fittings from China. Accordingly, effective July 13, 2017, the Commission, pursuant to sections 703(a) and 733(a) of the Act (19 U.S.C. 1671b(a) and 1673b(a)), instituted countervailing duty investigation No. 701-TA-583 and antidumping duty investigation No. 731-TA-1381 (Preliminary).
1 The record is defined in sec. 207.2(f) of the Commission’s Rules of Practice and Procedure (19 CFR 207.2(f)).

Notice of the institution of the Commission’s investigations and of a public conference to be held in connection therewith was given by posting copies of the notice in the Office of the Secretary, U.S. International Trade Commission, Washington, DC, and by publishing the notice in the Federal Register of July 20, 2017 (82 FR 33515). The conference was held in Washington, DC, on August 3, 2017, and all persons who requested the opportunity were permitted to appear in person or by counsel.

3
Views of the Commission
Based on the record in the preliminary phase of these investigations, we determine that there is a reasonable indication that an industry in the United States is materially injured by reason of imports of cast iron soil pipe fittings (“CISP” fittings) from China that are allegedly sold in the United States at less than fair value and that are allegedly subsidized by the government of China.
The Legal Standard for Preliminary Determinations I.
The legal standard for preliminary antidumping and countervailing duty determinations requires the Commission to determine, based upon the information available at the time of the preliminary determinations, whether there is a reasonable indication that a domestic industry is materially injured or threatened with material injury, or that the establishment of an industry is materially retarded, by reason of the allegedly unfairly traded imports.1 In applying this standard, the Commission weighs the evidence before it and determines whether “(1) the record as a whole contains clear and convincing evidence that there is no material injury or threat of such injury; and (2) no likelihood exists that contrary evidence will arise in a final investigation.”2
BackgroundII.
Cast Iron Soil Pipe Institute (“CISPI”), an industry association of three domesticproducers of cast iron soil pipe fittings (“CISP fittings”) (collectively, the “domestic interested parties” or “Petitioners”),3 filed the petitions in these investigations on July 13, 2017. Petitioners appeared at the conference and submitted a postconference brief.
Several respondent entities (“Respondents”) participated in these investigations. These include five U.S. importers of subject merchandise, NewAge Casting, LP (“NewAge”), Max Supply Inc. (“Max Supply”), Steve’s Wholesale Supply, B & W Plumbing & Heating Wholesale, and Sibo International Limited; and two exporters of subject merchandise, Kingway Pipe Co., Ltd. and Hebei Metal & Engineering Products Trading Co., Ltd. NewAge and Max Supply appeared at the conference and each submitted postconference briefs.
1 19 U.S.C. §§ 1671b(a), 1673b(a) (2000); see also American Lamb Co. v. United States, 785 F.2d 994, 1001-04 (Fed. Cir. 1986); Aristech Chem. Corp. v. United States, 20 CIT 353, 354-55 (1996). No party argues that the establishment of an industry in the United States is materially retarded by the allegedly unfairly traded imports.
2 American Lamb Co., 785 F.2d at 1001; see also Texas Crushed Stone Co. v. United States, 35 F.3d 1535, 1543 (Fed. Cir. 1994).
3 The three member companies are AB&I Foundry (“AB&I”), Tyler Pipe, and Charlotte Pipe & Foundry (“Charlotte Pipe”). Petition at 2.

4
U.S. industry data are based on the questionnaire responses of three producers, accounting for 100 percent of U.S. production of CISP fittings in 2016.4 U.S. import data are based on official import statistics and questionnaire responses from nine U.S. importers, accounting for 83.0 percent of total subject imports in 2016.5 The Commission received seven questionnaire responses from producers of subject merchandise from China, accounting for approximately *** percent of production of subject merchandise from China in 2016.6
Domestic Like Product III.
In determining whether there is a reasonable indication that an industry in the United States is materially injured or threatened with material injury by reason of imports of the subject merchandise, the Commission first defines the “domestic like product” and the “industry.”7 Section 771(4)(A) of the Tariff Act of 1930, as amended (“the Tariff Act”), defines the relevant domestic industry as the “producers as a whole of a domestic like product, or those producers whose collective output of a domestic like product constitutes a major proportion of the total domestic production of the product.”8 In turn, the Tariff Act defines “domestic like product” as “a product which is like, or in the absence of like, most similar in characteristics and uses with, the article subject to an investigation.”9
The decision regarding the appropriate domestic like product(s) in an investigation is a factual determination, and the Commission has applied the statutory standard of “like” or “most similar in characteristics and uses” on a case-by-case basis.10 No single factor is dispositive, and the Commission may consider other factors it deems relevant based on the facts of a particular investigation.11 The Commission looks for clear dividing lines among
4 Confidential Report (“CR”) at I-5, Public Report (“PR”) at I-4; CR/PR at Table C-1. 5 CR at I-5 and IV-1, PR at I-4 and IV-1. 6 CR at VII-3, PR at VII-3. 7 19 U.S.C. § 1677(4)(A). 8 19 U.S.C. § 1677(4)(A). 9 19 U.S.C. § 1677(10). 10 See, e.g., Cleo Inc. v. United States, 501 F.3d 1291, 1299 (Fed. Cir. 2007); NEC Corp. v.
Department of Commerce, 36 F. Supp. 2d 380, 383 (Ct. Int’l Trade 1998); Nippon Steel Corp. v. United States, 19 CIT 450, 455 (1995); Torrington Co. v. United States, 747 F. Supp. 744, 749 n.3 (Ct. Int’l Trade 1990), aff’d, 938 F.2d 1278 (Fed. Cir. 1991) (“every like product determination ‘must be made on the particular record at issue’ and the ‘unique facts of each case’”). The Commission generally considers a number of factors including the following: (1) physical characteristics and uses; (2) interchangeability; (3) channels of distribution; (4) customer and producer perceptions of the products; (5) common manufacturing facilities, production processes, and production employees; and, where appropriate, (6) price. See Nippon, 19 CIT at 455 n.4; Timken Co. v. United States, 913 F. Supp. 580, 584 (Ct. Int’l Trade 1996).
11 See, e.g., S. Rep. No. 96-249 at 90-91 (1979).

5
possible like products and disregards minor variations.12 Although the Commission must accept Commerce’s determination as to the scope of the imported merchandise that is subsidized and/or sold at less than fair value,13 the Commission determines what domestic product is like the imported articles Commerce has identified.14
A. Product Description
In its notices of initiation, Commerce defined the imported merchandise within the scope of these investigations as follows:
The merchandise covered by this investigation is cast iron soil pipe fittings, finished and unfinished, regardless of industry or proprietary specifications, and regardless of size. Cast iron soil pipe fittings are nonmalleable iron castings of various designs and sizes, including, but not limited to, bends, tees, wyes, traps, drains, and other common or special fittings, with or without side inlets.
Cast iron soil pipe fittings are classified into two major types—hubless and hub and spigot. Hubless cast iron soil pipe fittings are manufactured without a hub, generally in compliance with Cast Iron Soil Pipe Institute (CISPI) specification 301 and/or American Society for Testing and Materials (ASTM) specification A888. Hub and spigot pipe fittings have hubs into which the spigot (plain end) of the pipe or fitting is inserted. Cast iron soil pipe fittings are generally distinguished from other types of nonmalleable cast iron fittings by the manner in which they are connected to cast iron soil pipe and other fittings.
12 See, e.g., Nippon, 19 CIT at 455; Torrington, 747 F. Supp. at 748-49; see also S. Rep. No. 96-249 at 90-91 (Congress has indicated that the like product standard should not be interpreted in “such a narrow fashion as to permit minor differences in physical characteristics or uses to lead to the conclusion that the product and article are not ‘like’ each other, nor should the definition of ‘like product’ be interpreted in such a fashion as to prevent consideration of an industry adversely affected by the imports under consideration.”).
13 See, e.g., USEC, Inc. v. United States, 34 Fed. App’x 725, 730 (Fed. Cir. 2002) (“The ITC may not modify the class or kind of imported merchandise examined by Commerce.”); Algoma Steel Corp. v. United States, 688 F. Supp. 639, 644 (Ct. Int’l Trade 1988), aff’d, 865 F.3d 240 (Fed. Cir.), cert. denied, 492 U.S. 919 (1989).
14 Hosiden Corp. v. Advanced Display Mfrs., 85 F.3d 1561, 1568 (Fed. Cir. 1996) (the Commission may find a single like product corresponding to several different classes or kinds defined by Commerce); Cleo, 501 F.3d at 1298 n.1 (“Commerce’s {scope} finding does not control the Commission’s {like product} determination.”); Torrington, 747 F. Supp. at 748-52 (affirming the Commission’s determination defining six like products in investigations where Commerce found five classes or kinds).
6
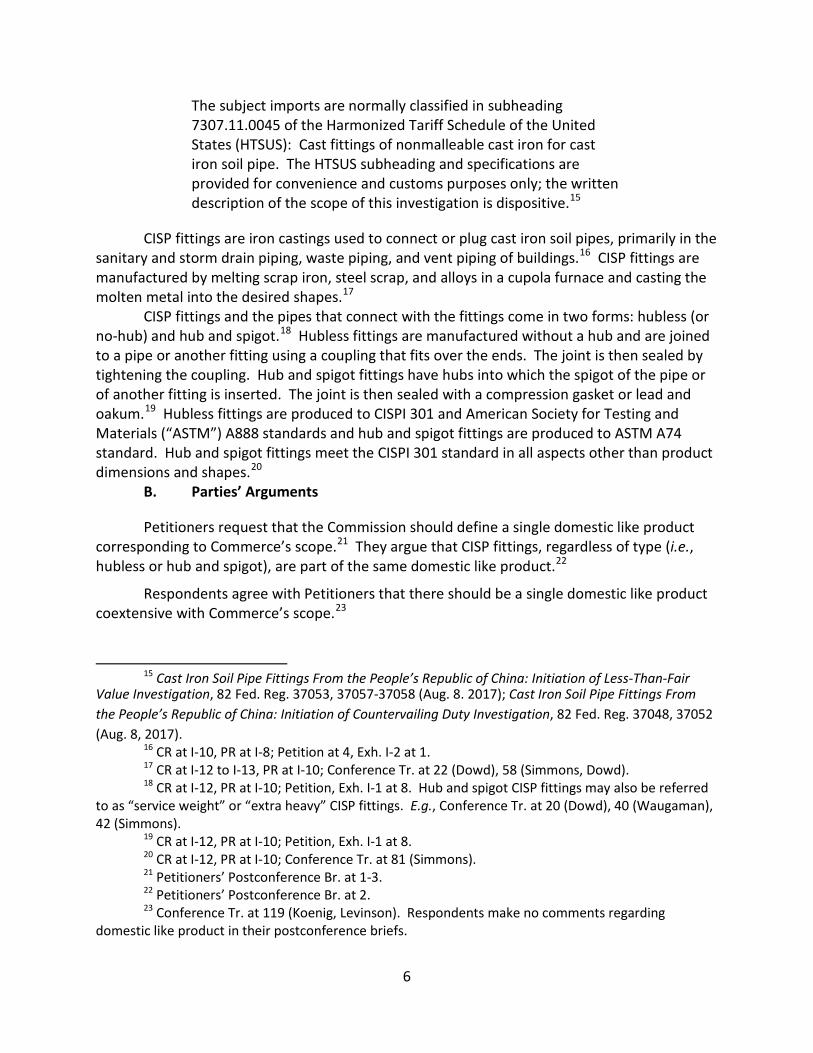
The subject imports are normally classified in subheading 7307.11.0045 of the Harmonized Tariff Schedule of the United States (HTSUS): Cast fittings of nonmalleable cast iron for cast iron soil pipe. The HTSUS subheading and specifications are provided for convenience and customs purposes only; the written description of the scope of this investigation is dispositive.15
CISP fittings are iron castings used to connect or plug cast iron soil pipes, primarily in the sanitary and storm drain piping, waste piping, and vent piping of buildings.16 CISP fittings are manufactured by melting scrap iron, steel scrap, and alloys in a cupola furnace and casting the molten metal into the desired shapes.17
CISP fittings and the pipes that connect with the fittings come in two forms: hubless (or no-hub) and hub and spigot.18 Hubless fittings are manufactured without a hub and are joined to a pipe or another fitting using a coupling that fits over the ends. The joint is then sealed by tightening the coupling. Hub and spigot fittings have hubs into which the spigot of the pipe or of another fitting is inserted. The joint is then sealed with a compression gasket or lead and oakum.19 Hubless fittings are produced to CISPI 301 and American Society for Testing and Materials (“ASTM”) A888 standards and hub and spigot fittings are produced to ASTM A74 standard. Hub and spigot fittings meet the CISPI 301 standard in all aspects other than product dimensions and shapes.20
B. Parties’ Arguments
Petitioners request that the Commission should define a single domestic like product corresponding to Commerce’s scope.21 They argue that CISP fittings, regardless of type (i.e., hubless or hub and spigot), are part of the same domestic like product.22
Respondents agree with Petitioners that there should be a single domestic like product coextensive with Commerce’s scope.23
15 Cast Iron Soil Pipe Fittings From the People’s Republic of China: Initiation of Less-Than-Fair Value Investigation, 82 Fed. Reg. 37053, 37057-37058 (Aug. 8. 2017); Cast Iron Soil Pipe Fittings From the People’s Republic of China: Initiation of Countervailing Duty Investigation, 82 Fed. Reg. 37048, 37052 (Aug. 8, 2017).
16 CR at I-10, PR at I-8; Petition at 4, Exh. I-2 at 1. 17 CR at I-12 to I-13, PR at I-10; Conference Tr. at 22 (Dowd), 58 (Simmons, Dowd). 18 CR at I-12, PR at I-10; Petition, Exh. I-1 at 8. Hub and spigot CISP fittings may also be referred
to as “service weight” or “extra heavy” CISP fittings. E.g., Conference Tr. at 20 (Dowd), 40 (Waugaman), 42 (Simmons).
19 CR at I-12, PR at I-10; Petition, Exh. I-1 at 8. 20 CR at I-12, PR at I-10; Conference Tr. at 81 (Simmons). 21 Petitioners’ Postconference Br. at 1-3. 22 Petitioners’ Postconference Br. at 2. 23 Conference Tr. at 119 (Koenig, Levinson). Respondents make no comments regarding
domestic like product in their postconference briefs.
7
C. Analysis
Physical Characteristics and Uses. CISP fittings are nonmalleable iron castings that are used in conjunction with cast iron soil pipes in the sanitary and storm drain, waste, and vent pipe of buildings.24 CISP fittings are manufactured in either hub and spigot or hubless forms. These two forms have the same end use but do not share the same connection mechanism.25 The two connection mechanisms are not designed to connect with each other, but there are special adapters that can connect the two.26 Hubless fittings are produced to CISPI 301 and ASTM A888 standards and hub and spigot fittings are produced to ASTM A74 standard. Hub and spigot fittings meet the CISPI 301 standard in all aspects other than product dimensions and shapes.27
Manufacturing Facilities, Production Processes and Employees. All CISP fittings are manufactured by melting raw materials in a furnace and casting into a desired shape.28 All CISP fittings are produced using the same equipment, process, and employees.29
Channels of Distribution. CISP fittings typically are sold to distributors which then sell to end users.30 Both hub and spigot and hubless forms of CISP fittings are sold through distributors.31
Interchangeability. Interchangeability between hub and spigot and hubless CISP fittings is limited by their connection mechanism.32 Hubless fittings may not be used in conjunction with hub and spigot pipes, and the same applies for hub and spigot fittings and hubless pipes.33 Petitioners argue that although the two connection mechanisms may not be used together within the same drainage system, the two connection mechanisms are interchangeable when engineers design a system.34 Furthermore, special adapters are available to transition between the two different mechanisms.35
Producer and Customer Perceptions. Hubless CISP fittings are more modern and lighter than hub and spigot CISP fittings.36 However, Petitioners argue that both types serve the same function.37 Charlotte Pipe, the largest of the three petitioning producers, markets both hubless
24 CR at I-10, PR at I-8; Petition, Exh. I-1 at 5, 7-8. 25 Petition, Exh. I-1 at 8. 26 Conference Tr. at 42 (Simmons). 27 CR at I-12, PR at I-10; Conference Tr. at 81 (Simmons). 28 CR at I-12 to I-13, PR at I-10; Conference Tr. at 22 (Dowd), 58 (Dowd, Simmons). 29 Petitioners’ Postconference Br. at 2. 30 CR at II-2, PR at II-1; Petitioner, Exh. I-1 at 12; Conference Tr. at 27 (Lowe). 31 Petitioners’ Postconference Br. at 3. 32 Conference Tr. at 42 (Simmons). 33 Conference Tr. at 42 (Simmons). 34 Petitioners’ Postconference Br. at 2. 35 Petitioners’ Postconference Br. at 2; Conference Tr. at 42 (Simmons). 36 Petition, Exh. I-1 at 11; Petitioners’ Postconference Br. at 2. 37 Petitioners’ Postconference Br. at 2-3.

8
and hub and spigot CISP fittings as part of the cast iron DWV (drain, waste, and vent) pipe and fittings system product category.38
Price. In 2016, the average unit value for domestically produced hub and spigot fittings was *** percent higher than that of hubless fittings.39
Conclusion. The preliminary phase record indicates that hub and spigot and hubless forms have the same end uses, production processes, channels of distribution, and customer and producer perceptions. Their principal distinction is their different connection mechanisms which prevents them from being used together within the same drainage system. The record does not indicate, nor has any party suggested, that this distinction is tantamount to a clear dividing line. Instead, in our view, the similarities between hub and spigot and hubless fittings outweigh their distinctions. Accordingly, we find that there is a single domestic like product coextensive with the scope of the investigation.
Domestic Industry IV.
The domestic industry is defined as the domestic “producers as a whole of a domestic like product, or those producers whose collective output of a domestic like product constitutes a major proportion of the total domestic production of the product.”40 In defining the domestic industry, the Commission’s general practice has been to include in the industry producers of all domestic production of the like product, whether toll-produced, captively consumed, or sold in the domestic merchant market. In light of our domestic like product definition, we define one domestic industry consisting of all domestic producers of CISP fittings.41
Negligible Imports V.
Pursuant to Section 771(24) of the Tariff Act, imports from a subject country of merchandise corresponding to a domestic like product that account for less than 3 percent of all such merchandise imported into the United States during the most recent 12 months for which data are available preceding the filing of the petition shall be deemed negligible.42 The statute further provides that subject imports from a single country which comprise less than 3 percent of total such imports of the product may not be considered negligible if there are
38 E.g., Conference Tr. at 20 (Dowd); http://www.charlottepipe.com/cast_iron_dwv.aspx (downloaded and printed August 21, 2017) (EDIS Doc. 620885).
39 CR/PR at Table IV-8. The unit values are $*** per short ton for hubless CISP fittings and $*** for hub and spigot CISP fittings. Id. Each of the four pricing products in these preliminary phase investigations is a hubless CISP fitting. CR at V-7, PR at V-5.
40 19 U.S.C. § 1677(4)(A). 41 There are no related parties issues in these investigations. ***. CR at III-2, PR at III-1. 42 19 U.S.C. §§ 1671b(a), 1673b(a), 1677(24)(A)(i), 1677(24)(B); see also 15 C.F.R. § 2013.1
(developing countries for purposes of 19 U.S.C. § 1677(36)).

9
several countries subject to investigation with negligible imports and the sum of such imports from all those countries collectively accounts for more than 7 percent of the volume of all such merchandise imported into the United States.43 In the case of countervailing duty investigations involving developing countries (as designated by the United States Trade Representative), the statute indicates that the negligibility limits are 4 percent and 9 percent, rather than 3 percent and 7 percent.44
Based on official import statistics, subject imports from China accounted for 98.7 percent as a share of total imports of CISP fittings by quantity for June 2016 to June 2017, the 12-month period preceding the filing of the petition. 45 Because this exceeds the statutory negligibility threshold, we find that subject imports are not negligible.
Reasonable Indication of Material Injury by Reason of Subject Imports VI.
A. Legal Standard
In the preliminary phase of antidumping and countervailing duty investigations, the Commission determines whether there is a reasonable indication that an industry in the United States is materially injured or threatened with material injury by reason of the imports under investigation.46 In making this determination, the Commission must consider the volume of subject imports, their effect on prices for the domestic like product, and their impact on domestic producers of the domestic like product, but only in the context of U.S. production operations.47 The statute defines “material injury” as “harm which is not inconsequential, immaterial, or unimportant.”48 In assessing whether there is a reasonable indication that the domestic industry is materially injured by reason of subject imports, we consider all relevant economic factors that bear on the state of the industry in the United States.49 No single factor is dispositive, and all relevant factors are considered “within the context of the business cycle and conditions of competition that are distinctive to the affected industry.”50
43 19 U.S.C. § 1677(24)(A)(ii). 44 19 U.S.C. § 1677(24)(B). 45 CR/PR at Table IV-3. 46 19 U.S.C. §§ 1671b(a), 1673b(a). The Trade Preferences Extension Act of 2015, Pub. L. 114-27,
amended the provisions of the Tariff Act pertaining to Commission determinations of reasonable indication of material injury and threat of material injury by reason of subject imports in certain respects. We have applied these amendments here.
47 19 U.S.C. § 1677(7)(B). The Commission “may consider such other economic factors as are relevant to the determination” but shall “identify each {such} factor ... {a}nd explain in full its relevance to the determination.” 19 U.S.C. § 1677(7)(B).
48 19 U.S.C. § 1677(7)(A). 49 19 U.S.C. § 1677(7)(C)(iii). 50 19 U.S.C. § 1677(7)(C)(iii).
10
Although the statute requires the Commission to determine whether there is a reasonable indication that the domestic industry is “materially injured by reason of” unfairly traded imports,51 it does not define the phrase “by reason of,” indicating that this aspect of the injury analysis is left to the Commission’s reasonable exercise of its discretion.52 In identifying a causal link, if any, between subject imports and material injury to the domestic industry, the Commission examines the facts of record that relate to the significance of the volume and price effects of the subject imports and any impact of those imports on the condition of the domestic industry. This evaluation under the “by reason of” standard must ensure that subject imports are more than a minimal or tangential cause of injury and that there is a sufficient causal, not merely a temporal, nexus between subject imports and material injury.53
In many investigations, there are other economic factors at work, some or all of which may also be having adverse effects on the domestic industry. Such economic factors might include nonsubject imports; changes in technology, demand, or consumer tastes; competition among domestic producers; or management decisions by domestic producers. The legislative history explains that the Commission must examine factors other than subject imports to ensure that it is not attributing injury from other factors to the subject imports, thereby inflating an otherwise tangential cause of injury into one that satisfies the statutory material injury threshold.54 In performing its examination, however, the Commission need not isolate
51 19 U.S.C. §§ 1671b(a), 1673b(a). 52 Angus Chemical Co. v. United States, 140 F.3d 1478, 1484-85 (Fed. Cir. 1998) (“{T}he statute
does not ‘compel the commissioners’ to employ {a particular methodology}.”), aff’g 944 F. Supp. 943, 951 (Ct. Int’l Trade 1996).
53 The Federal Circuit, in addressing the causation standard of the statute, has observed that “{a}s long as its effects are not merely incidental, tangential, or trivial, the foreign product sold at less than fair value meets the causation requirement.” Nippon Steel Corp. v. USITC, 345 F.3d 1379, 1384 (Fed. Cir. 2003). This was re-affirmed in Mittal Steel Point Lisas Ltd. v. United States, 542 F.3d 867, 873 (Fed. Cir. 2008), in which the Federal Circuit, quoting Gerald Metals, Inc. v. United States, 132 F.3d 716, 722 (Fed. Cir. 1997), stated that “this court requires evidence in the record ‘to show that the harm occurred “by reason of” the LTFV imports, not by reason of a minimal or tangential contribution to material harm caused by LTFV goods.’” See also Nippon Steel Corp. v. United States, 458 F.3d 1345, 1357 (Fed. Cir. 2006); Taiwan Semiconductor Industry Ass’n v. USITC, 266 F.3d 1339, 1345 (Fed. Cir. 2001).
54 Uruguay Round Agreements Act Statement of Administrative Action (SAA), H.R. Rep. 103-316, Vol. I at 851-52 (1994) (“{T}he Commission must examine other factors to ensure that it is not attributing injury from other sources to the subject imports.”); S. Rep. 96-249 at 75 (1979) (the Commission “will consider information which indicates that harm is caused by factors other than less-than-fair-value imports.”); H.R. Rep. 96-317 at 47 (1979) (“in examining the overall injury being experienced by a domestic industry, the ITC will take into account evidence presented to it which demonstrates that the harm attributed by the petitioner to the subsidized or dumped imports is attributable to such other factors;” those factors include “the volume and prices of nonsubsidized imports or imports sold at fair value, contraction in demand or changes in patterns of consumption, trade restrictive practices of and competition between the foreign and domestic producers, developments in technology and the export performance and productivity of the domestic industry”); accord Mittal Steel, 542 F.3d at 877.

11
the injury caused by other factors from injury caused by unfairly traded imports.55 Nor does the “by reason of” standard require that unfairly traded imports be the “principal” cause of injury or contemplate that injury from unfairly traded imports be weighed against other factors, such as nonsubject imports, which may be contributing to overall injury to an industry.56 It is clear that the existence of injury caused by other factors does not compel a negative determination.57
Assessment of whether material injury to the domestic industry is “by reason of” subject imports “does not require the Commission to address the causation issue in any particular way” as long as “the injury to the domestic industry can reasonably be attributed to the subject imports” and the Commission “ensure{s} that it is not attributing injury from other sources to the subject imports.”58 Indeed, the Federal Circuit has examined and affirmed various Commission methodologies and has disavowed “rigid adherence to a specific formula.”59
The Federal Circuit’s decisions in Gerald Metals, Bratsk, and Mittal Steel all involved cases in which the relevant “other factor” was the presence in the market of significant
55 SAA at 851-52 (“{T}he Commission need not isolate the injury caused by other factors from injury caused by unfair imports.”); Taiwan Semiconductor Industry Ass’n , 266 F.3d at 1345. (“{T}he Commission need not isolate the injury caused by other factors from injury caused by unfair imports ... . Rather, the Commission must examine other factors to ensure that it is not attributing injury from other sources to the subject imports.” (emphasis in original)); Asociacion de Productores de Salmon y Trucha de Chile AG v. United States, 180 F. Supp. 2d 1360, 1375 (Ct. Int’l Trade 2002) (“{t}he Commission is not required to isolate the effects of subject imports from other factors contributing to injury” or make “bright-line distinctions” between the effects of subject imports and other causes.); see also Softwood Lumber from Canada, Inv. Nos. 701-TA-414 and 731-TA-928 (Remand), USITC Pub. 3658 at 100-01 (Dec. 2003) (Commission recognized that “{i}f an alleged other factor is found not to have or threaten to have injurious effects to the domestic industry, i.e., it is not an ‘other causal factor,’ then there is nothing to further examine regarding attribution to injury”), citing Gerald Metals, 132 F.3d at 722 (the statute “does not suggest that an importer of LTFV goods can escape countervailing duties by finding some tangential or minor cause unrelated to the LTFV goods that contributed to the harmful effects on domestic market prices.”).
56 S. Rep. 96-249 at 74-75; H.R. Rep. 96-317 at 47. 57 See Nippon, 345 F.3d at 1381 (“an affirmative material-injury determination under the statute
requires no more than a substantial-factor showing. That is, the ‘dumping’ need not be the sole or principal cause of injury.”).
58 Mittal Steel, 542 F.3d at 877-78; see also id. at 873 (“While the Commission may not enter an affirmative determination unless it finds that a domestic industry is materially injured ‘by reason of’ subject imports, the Commission is not required to follow a single methodology for making that determination ... {and has} broad discretion with respect to its choice of methodology.”) citing United States Steel Group v. United States, 96 F.3d 1352, 1362 (Fed. Cir. 1996) and S. Rep. 96-249 at 75. In its decision in Swiff-Train v. United States, 793 F.3d 1355 (Fed. Cir. 2015), the Federal Circuit affirmed the Commission’s causation analysis as comporting with the Court’s guidance in Mittal.
59 Nucor Corp. v. United States, 414 F.3d 1331, 1336, 1341 (Fed. Cir. 2005); see also Mittal Steel, 542 F.3d at 879 (“Bratsk did not read into the antidumping statute a Procrustean formula for determining whether a domestic injury was ‘by reason’ of subject imports.”).
12
volumes of price-competitive nonsubject imports. The Commission interpreted the Federal Circuit’s guidance in Bratsk as requiring it to apply a particular additional methodology following its finding of material injury in cases involving commodity products and a significant market presence of price-competitive nonsubject imports.60 The additional “replacement/benefit” test looked at whether nonsubject imports might have replaced subject imports without any benefit to the U.S. industry. The Commission applied that specific additional test in subsequent cases, including the Carbon and Certain Alloy Steel Wire Rod from Trinidad and Tobago determination that underlies the Mittal Steel litigation.
Mittal Steel clarifies that the Commission’s interpretation of Bratsk was too rigid and makes clear that the Federal Circuit does not require the Commission to apply an additional test nor any one specific methodology; instead, the court requires the Commission to have “evidence in the record ‘to show that the harm occurred ‘by reason of’ the LTFV imports,’” and requires that the Commission not attribute injury from nonsubject imports or other factors to subject imports.61 Accordingly, we do not consider ourselves required to apply the replacement/benefit test that was included in Commission opinions subsequent to Bratsk.
The progression of Gerald Metals, Bratsk, and Mittal Steel clarifies that, in cases involving commodity products where price-competitive nonsubject imports are a significant factor in the U.S. market, the Court will require the Commission to give full consideration, with adequate explanation, to non-attribution issues when it performs its causation analysis.62
The question of whether the material injury threshold for subject imports is satisfied notwithstanding any injury from other factors is factual, subject to review under the substantial evidence standard.63 Congress has delegated this factual finding to the Commission because of the agency’s institutional expertise in resolving injury issues.64
60 Mittal Steel, 542 F.3d at 875-79. 61 Mittal Steel, 542 F.3d at 873 (quoting from Gerald Metals, 132 F.3d at 722), 875-79 & n.2
(recognizing the Commission’s alternative interpretation of Bratsk as a reminder to conduct a non-attribution analysis).
62 To that end, after the Federal Circuit issued its decision in Bratsk, the Commission began to present published information or send out information requests in the final phase of investigations to producers in nonsubject countries that accounted for substantial shares of U.S. imports of subject merchandise (if, in fact, there were large nonsubject import suppliers). In order to provide a more complete record for the Commission’s causation analysis, these requests typically seek information on capacity, production, and shipments of the product under investigation in the major source countries that export to the United States. The Commission plans to continue utilizing published or requested information in the final phase of investigations in which there are substantial levels of nonsubject imports.
63 We provide in our respective discussions of volume, price effects, and impact a full analysis of other factors alleged to have caused any material injury experienced by the domestic industry.
64 Mittal Steel, 542 F.3d at 873; Nippon Steel Corp., 458 F.3d at 1350, citing U.S. Steel Group, 96 F.3d at 1357; S. Rep. 96-249 at 75 (“The determination of the ITC with respect to causation is ... complex and difficult, and is a matter for the judgment of the ITC.”).
13
B. Conditions of Competition and the Business Cycle
The following conditions of competition inform our analysis of whether there is a reasonable indication of material injury by reason of subject imports.
1. Demand Conditions
U.S. demand for CISP fittings is a function of the demand for construction activity.65 Construction value and spending in the United States both increased during the January 1, 2014 to June 30, 2017 period of investigation (“POI”).66 The value of U.S. construction put in place increased by 8.2 percent for public construction, 23.7 percent for private non-residential construction, and 41.0 percent for private residential construction.67 Construction spending increased by more than 10 percent from 2014 to 2015, and more than 6 percent from 2015 to 2016; such spending during January to June 2017 (“interim 2017”) was nearly 5 percent higher than that of the comparable period in 2016.68
All three U.S. producers reported an increase in demand for CISP fittings over the POI and importers provided a mixed response.69 While most (all three U.S. producers and five of eight importers) firms indicated that the CISP fittings market is not subject to business cycles, two importers stated that demand was seasonal, with demand highest in the summer period with peak construction activity and lowest in the winter.70 Construction spending is highly seasonal, with spending lowest in each January and then generally increasing through the summer, and remaining at elevated levels through October before falling during the final months of the year.71
Apparent U.S. consumption increased from *** short tons in 2014 to *** short tons in 2015 and *** short tons in 2016, an increase of *** percent from 2014 to 2016. Apparent U.S. consumption was *** short tons in interim 2017, which was *** percent lower than the *** short tons in interim 2016.72
65 CR at II-9 to II-10, PR at II-6 to II-7. While cast iron is the predominant material used in soil pipe fittings in commercial construction due to building code mandates and the various physical qualities of cast iron, plastic is the predominant material used in residential construction due to its lower cost and ease of installation. CR at II-13 to II-14, PR at II-10; Petitioners’ Postconference Br. at 10; Respondents’ Postconference Br. at 2. Plastic fittings (which are outside the scope of these investigations) have been used in the residential market since the 1970s, and by the early 1990s, plastic had become the predominant material used for soil pipe fittings in residential construction. Petitioners’ Postconference Br. at 10; Conference Tr. at 109 (Miao and Singh).
66 CR at II-11 to II-12, PR at II-8. 67 CR/PR at Figures II-1 and II-2. 68 CR/PR at Table II-4. 69 CR/PR at Table II-3. Two importers reported an increase, three importers reported no change,
two importers reported a decrease, and one importer reported fluctuation in demand. Id. 70 CR at II-10 to II-11, PR at II-7; CR/PR at Table II-3. 71 CR at II-12, PR at II-8; CR/PR at Figure II-2. 72 CR/PR at Tables IV-7 and C-1.
14
2. Supply Conditions
Domestic shipments, subject imports, and imports from nonsubject sources all supplied the U.S. market during the POI.73 The domestic industry was the largest source of supply. The domestic industry’s U.S. market share increased from *** percent in 2014 to *** percent in 2015, and then declined to *** percent in 2016; the domestic industry’s market share was *** percent in interim 2017 compared with *** percent in interim 2016.74 Subject imports’ market share declined from *** percent in 2014 to *** percent in 2015, and then increased to *** percent in 2016; subject imports’ market share was *** percent in interim 2017 compared with *** percent in interim 2016.75 Subject imports were by far the largest source of imports, accounting for 99.0 percent of all imports in 2016.76 The market share of imports from nonsubject sources was very small throughout the POI: it was *** percent in 2014, *** percent in 2015, and *** percent in 2016; the market share was *** percent in interim 2017 compared with *** percent in interim 2016.77
The domestic industry consists of three producers, two of which are commonly owned.78 Its capacity *** and it had substantial unused capacity throughout the POI.79 All three U.S. producers and five of the nine responding importers indicated that they have not experienced any supply constraints during the POI.80
The domestic industry’s production facilities and sales are geographically dispersed. The three U.S. producers each have one foundry in the United States, located in California, North Carolina, and Texas.81 They reported that *** percent of their sales were within 100 miles of their production facilities, *** percent were between 101 and 1,000 miles, and *** percent were greater than 1,000 miles.82 In comparison, most subject imports entered the United
73 CR/PR at Tables IV-7 and C-1. 74 CR/PR at Table IV-9. 75 CR/PR at Table IV-9. 76 CR/PR at Table IV-2. According to Petitioners, CISP fittings imports from China have been in
the U.S. market for more than a decade. Conference Tr. at 56 (Schagrin). Respondent NewAge is the *** U.S. importer of CISP fittings from China. CR/PR at Table IV-1.
Respondent NewAge claims that it is the only supplier of epoxy-coated CISP fittings in the U.S. market. NewAge Postconference Br. at 16; Conference Tr. at 99-100 (Singh). We observe that the domestic industry does not produce epoxy-coated CISP fittings, and that ***. Conference Tr. at 51 (Simmons); CR at VI-16, PR at VI-4.
77 CR/PR at Table IV-9. 78 CR/PR at Table IV-9. The share of U.S. production of CISP fittings in 2016 of AB&I, Charlotte
Pipe, and Tyler Pipe was *** percent, *** percent, and *** percent, respectively. CR/PR at Table III-1. AB&I and Tyler Pipe are wholly owned subsidiaries of McWane, Inc. CR/PR at Table III-2.
79 CR at II-4, PR at II-3; CR/PR at Table III-4. 80 CR at II-8, PR at II-5. Petitioners assert that there were no supply constraints during the POI
and that the domestic industry always had ample capacity to supply the entirety of the U.S. market. Conference Tr. at 8 (Cloutier).
81 CR/PR at Table III-1. 82 CR at II-3, PR at II-2.

15
States through West Coast or New York ports, and importers sold 59 percent of shipments of subject merchandise within 100 miles of their U.S. point of shipment, 9 percent between 101 and 1,000 miles, and 32 percent greater than 1,000 miles.83
3. Substitutability
Both subject imports and domestically produced CISP fittings must conform to the applicable ASTM standards.84 Based on the record in the preliminary phase of these investigations, we find that subject imports and the domestic like product have a high degree of physical interchangeability but certain requirements or preferences for domestic product may limit the degree of substitutability.85 Five of the eight of U.S. importers responding to the Commission’s questionnaire reported that subject imports are either always or frequently interchangeable with the domestic like product.86 Out of the three U.S. producers, *** indicated that subject imports and the domestic like product are sometimes interchangeable, and *** indicated that they are always interchangeable.87
Price appears to be a moderately important factor in purchasing decisions as purchaser responses to the preliminary phase lost sales/lost revenue survey identify several non-price considerations that are important to such decisions. The top three factors considered in the purchasing decisions of the eight purchasers that responded to the survey were whether the product was domestically sourced (five purchasers), the product’s quality (three purchasers), and the product’s price (two purchasers).88 *** producers indicated that differences other than price are sometimes significant to purchasing decisions. Five of eight responding importers indicated that differences other than price are always significant, while two indicated that such difference were sometimes significant and one indicated that they were never significant.89
83 CR at II-3 to II-4, PR at II-2; CR/PR at Table II-2. 84 Conference Tr. at 21 (Dowd), 36 (Simmons), 115 (Singh). Respondent NewAge claims that its
epoxy-coated fittings are qualitatively superior to the asphalt-coated CISP fittings offered by the domestic industry. NewAge Postconference Br. at 15-16.
85 CR at II-14, PR at II-10. 86 CR/PR at Table II-5. 87 CR/PR at Table II-5. 88 CR at II-15, PR at II-11. The record does not indicate whether or to what extent distributors or
end users are required to use domestically produced CISP fittings, or whether domestically produced fittings may simply be preferred by certain purchasers. In any final phase of these investigations, we intend to explore further the nature of the supplier-purchaser relationships, and the extent to which purchasers are inclined to switch suppliers over time. We also intend to explore how subject imports and the domestic like product compete with each other in the market and to what extent this competition is price-based.
89 CR/PR at Table II-6.
16
4. Other conditions
The record indicates that the vast majority of CISP fittings are sold to distributors which then sell to end users.90 These distributors typically operate through branches and some have branches located throughout the United States.91 The prices offered to these branches are primarily set by a negotiable multiplier, which is a regional adjustment to the list price.92 Domestic producers offer a variety of rebates and discounts through loyalty incentive programs, which contain terms that require the branch to enter into exclusivity agreements for the entire calendar year.93 These programs provide a strong incentive for each branch to purchase fittings from only one producer, but distributors with multiple branches may purchase fittings from more than one producer since incentive programs are offered at the branch level.94 The rebates and discounts are typically paid out annually or bi-annually and they can add up to over 20 percent.95 Respondent *** also offers loyalty rebates to its distributors, but these rebates appear to be lower than those offered by the domestic industry.96
There have been several allegations concerning anticompetitive conduct by the domestic industry. Notably, in 2013, the Federal Trade Commission (“FTC”) concluded an investigation into Charlotte Pipe’s 2010 acquisition of Star Pipe, an importer of CISP fittings from China. The investigation resulted in a consent decree that required Charlotte Pipe to report previously undisclosed acquisitions and to notify the FTC before making similar acquisitions in the United States.97 Also, in 2014, distributors of CISP fittings filed a class action antitrust lawsuit against the domestic interested parties for price fixing and other anticompetitive behavior for over $300 million, which resulted in a settlement in excess of $30 million in October 2016.98
Domestic producers and producers from China use different types of raw material inputs. Domestic producers use mainly iron scrap and producers in China use pig iron.99 The prices for these raw materials shared similar trends throughout the POI: they declined in 2014
90 CR at I-4, PR at I-3; Conference Tr. at 33 (Lowe, Waugaman), 105-106 (Miao, Singh). The
leading distributor is ***, accounting for ***. CR at I-4, PR at I-3. 91 Conference Tr. at 65-66 (Waugaman), 123-124 (Singh). 92 CR at V-4 to V-5, PR at V-3; Conference Tr. at 69 (Waugaman), 125 (Singh). 93 CR at V-6, PR at V-4 to V-5; Conference Tr. at 72-72 (Lowe, Waugaman) 98 (Singh); Petitioners’
Postconference Br., Exh. 5, 6; NewAge Postconference Br., Exh. 5-7. 94 Petitioners’ Postconference Br., Exh. 5, 6; NewAge Postconference Br., Exh. 5-7. For example,
*** purchases all three domestic brands. CR at I-4, PR at I-3. 95 Petitioners’ Postconference Br., Exh. 5, 6; NewAge Postconference Br., Exh. 5-7. 96 Conference Tr. at 128 (Singh); NewAge Postconference Br. at 18, Exh. 8, 9. Respondents
contend that these distributors tend to be smaller businesses. Id. 97 NewAge Postconference Br. at 2, Exh. 1a. 98 NewAge Postconference Br. at 2; Conference Tr. at 12 (Levinson), 48-49 (Dowd). The
anticompetitive behavior was alleged to have occurred between 2006 and 2013. Max Supply Postconference Br., Exh. 1; Conference Tr. at 98 (Singh).
99 CR at V-1, PR at V-1.
17
and 2015 and trended upwards in 2016 and interim 2017.100 The ratio of cost of raw materials to cost of goods sold (“COGS”) for the domestic industry decreased from *** percent in 2014 to *** percent in 2015 and *** percent in 2016; the ratio was *** percent in interim 2017 and *** percent in interim 2016.101 “Other factory costs” constituted the largest share of domestic producers’ COGS; this share increased from *** percent in 2014 to *** percent in 2015 and *** percent in 2016; the ratio was *** percent in interim 2017 and *** percent in interim 2016.102
C. Volume of Subject Imports
Section 771(7)(C)(i) of the Tariff Act provides that the “Commission shall consider whether the volume of imports of the merchandise, or any increase in that volume, either in absolute terms or relative to production or consumption in the United States, is significant.”103
China was the only significant non-domestic source of CISP fittings in the U.S. market.104 The volume of subject imports increased overall from 2014 to 2016. Subject imports decreased from 7,328 short tons in 2014 to 5,531 short tons in 2015, and subsequently increased to 8,360 short tons in 2016; the volume was 2,746 short tons in interim 2017 compared with 3,364 short tons in interim 2016.105 As observed above, subject imports’ market share declined from *** percent in 2014, to *** percent in 2015, and then increased to *** percent in 2016; the market share was *** percent in interim 2017 compared with *** percent in interim 2016.106
In light of the foregoing, we find that the volume of subject imports from China significant in both absolute terms and relative to U.S. consumption.
D. Price Effects of the Subject Imports
Section 771(7)(C)(ii) of the Tariff Act provides that, in evaluating the price effects of subject imports, the Commission shall consider whether –
(I) there has been significant price underselling by the imported merchandise as compared with the price of domestic like products of the United States, and
100 CR/PR at Figure V-1. The price declines between January 2014 and December 2015 ranged
from *** percent to *** percent for iron scrap and *** percent for pig iron. The price increases between December 2015 and June 2017 ranged from *** percent to *** percent for iron scrap and *** percent for pig iron. Id.
101 CR/PR at Table VI-1. 102 CR/PR at Table VI-1. 103 19 U.S.C. § 1677(7)(C)(i). 104 CR/PR at Table IV-2. 105 CR/PR at Table IV-7. 106 CR/PR at Table IV-9.

18
(II) the effect of imports of such merchandise otherwise depresses prices to a significant degree or prevents price increases, which otherwise would have occurred, to a significant degree.107
As observed above, the record indicates that there is a high degree of physical interchangeability between subject imports and the domestic like product. While price is a moderately important factor in purchasing decisions, quality and whether the product is domestically sourced are also considerations in purchasing decisions.
The Commission requested U.S. producers and importers to provide quarterly data for the total quantity and f.o.b. value net of all rebates on four pricing products shipped to unrelated U.S. customers over the POI.108 All three U.S. producers and seven importers provided usable pricing data for the requested products, but not all firms reported pricing for all products for all quarters.109 The pricing data account for approximately 15.9 percent of U.S. producers’ shipments of CISP fittings and 21.5 percent of U.S. shipments of subject imports in 2016.110
Subject imports undersold the domestic like product in all 56 quarterly comparisons, involving 3,983 short tons of subject imports, at underselling margins ranging from 22.1 percent to 50.1 percent, with an average margin of underselling of 37.2 percent. Underselling margins declined over the POI as prices for the domestic like product fell while prices for subject imports were relatively stable.111 Given the high degree of physical interchangeability between the subject imports and the domestic like product, and that price is a moderately important factor in purchasing decisions, we find this pervasive underselling to be significant for the purposes of these preliminary determinations.
Prices for the domestic like product declined from 2014 to 2016 while the domestic industry’s costs were also declining.112 In interim 2017, however, prices for the domestic like
107 19 U.S.C. § 1677(7)(C)(ii). 108 CR at V-7, PR at V-5. All four pricing products are types of hubless CISP fittings: Product 1.-- 2” no hub, 1/4 bend cast iron soil pipe fitting Product 2.-- 2” no hub, 1/8 bend cast iron soil pipe fitting Product 3.-- 2” no hub, sanitary Tee cast iron soil pipe fitting Product 4.-- 4” no hub, 1/8 bend cast iron soil pipe fitting 109 CR at V-7, PR at V-5. 110 CR at V-7, PR at V-5. 111 CR at V-17, PR at V-7; CR/PR at Tables V-3 to V-7. 112 CR/PR at Tables V-3 to V-6 and VI-1 to VI-2. Prices for all four domestically produced pricing
declined year-over-year. CR/PR at Tables V-3 to V-6. The domestic industry’s average unit value (“AUV”) of COGS declined from $*** per short ton in 2014 to $*** in 2015 and $*** in 2016. CR/PR at Table VI-1.
U.S. producers assert that their list prices increased in 2014 and in January 2015, by about 3 to 5 percent. Conference Tr. at 66-68 (Dowd, Lowe, Waugaman). According to Petitioners, the multipliers (Continued…)

19
product continued to decline despite higher costs.113 From 2014 to 2016, the domestic industry’s COGS to net sales ratio remained relatively stable, decreasing slightly from *** percent in 2014 to *** percent in 2016. However, in interim 2017, the industry’s COGS to net sales ratio was *** percent, which was *** percentage points higher than the *** percent in interim 2016.114 Furthermore, five out of eight responding purchasers reported that U.S. producers reduced prices to complete with subject imports.115 Additionally, Petitioners contend that Charlotte Pipe had announced a price increase in 2016 to be effective at the beginning of 2017, but the increase was never implemented due to “competitive conditions.”116 On the basis of these considerations, we find on the record of these preliminary phase investigations that low-priced subject imports had a significant role in the domestic industry’s price declines and inability to recover costs in interim 2017, and consequently had significant price-depressing effects or prevented price increases that otherwise would have occurred.117
E. Impact of the Subject Imports118
Section 771(7)(C)(iii) of the Tariff Act provides that the Commission, in examining the impact of the subject imports on the domestic industry, “shall evaluate all relevant economic factors which have a bearing on the state of the industry.” These factors include output, sales, inventories, capacity utilization, market share, employment, wages, productivity, gross profits, net profits, operating profits, cash flow, return on investment, return on capital, ability to raise capital, ability to service debt, research and development, and factors affecting domestic prices.
(…Continued) of the domestic like product for most of the country have declined since 2014. Conference Tr. at 69-70 (Lowe, Waugaman).
113 Price decreases for the four domestically produced pricing products ranged from 3.9 percent to 7.4 percent between the fourth quarter of 2016 and the second quarter of 2017. Derived from CR/PR at Tables V-3 to V-6. The COGS AUV was $*** in interim 2016 and higher, at $***, in interim 2017. CR/PR at Table VI-1.
114 CR/PR at Table VI-1. 115 CR/PR at Table V-11. 116 Petitioners’ Postconference Br. at 17-18. 117 In any final phase of these investigations, we intend to examine further how and whether
price competition might occur between subject imports and the domestic like product, and whether other factors might be causing the price declines. In particular, we will examine whether there is increased intra-industry competition as a result of these other factors, including producer-distributor relationships or purchaser preferences for U.S.-produced CISP fittings, during the POI that might have caused these price declines.
118 In its notice initiating the antidumping duty investigation on CISP fittings from China, Commerce reported an estimated dumping margin of 92.46 percent. Cast Iron Soil Pipe Fittings from the People’s Republic of China: Initiation of Less-Than-Fair Value Investigation, 82 Fed. Reg. 37053, 37056 (Aug. 8, 2017).
20
No single factor is dispositive and all relevant factors are considered “within the context of the business cycle and conditions of competition that are distinctive to the affected industry.”119
The domestic industry’s production and shipments rose between 2014 and 2016, and showed fairly minor changes between interim 2016 and interim 2017. Production of CISP fittings increased from *** short tons in 2014 to *** short tons in 2015 and *** short tons in 2016; production was *** short tons in interim 2017 compared with *** short tons in interim 2016.120 The domestic industry’s capacity decreased from *** short tons in 2014 to *** short tons in 2015 and *** short tons in 2016; capacity was *** short tons in interim 2017 compared with *** short tons in interim 2016.121 Capacity utilization increased from *** percent in 2014 to *** percent in 2015 and *** percent in 2016; capacity utilization was *** percent in interim 2017 compared with *** percent in interim 2016.122 As observed above, the domestic industry’s U.S. market share increased from *** percent in 2014 to *** percent in 2015, and then declined to *** percent in 2016; market share was *** percent in interim 2017 compared with *** percent market share in interim 2016.123 End-of-period inventories increased from *** short tons in 2014 to *** short tons in 2015, and subsequently decreased to *** short tons in 2016; the end-of-period inventories were *** short tons in interim 2017 compared with *** short tons in interim 2016.124
Indicators of the domestic industry’s employment generally improved during the POI. The number of production and related workers (“PRWs”), hours worked, hours worked per PRW, wages paid, and hourly wages all increased from 2014 to 2016 and were higher in interim 2017 than in interim 2016.125 By contrast, productivity declined from 2014 to 2016 and was
119 19 U.S.C. § 1677(7)(C)(iii). This provision was amended by the Trade Preferences Extension
Act of 2015, Pub. L. 114-27. 120 CR/PR at Table III-4. 121 CR/PR at Table III-4. 122 CR/PR at Table III-4. 123 CR/PR at Table IV-9. 124 CR/PR at Table III-7. 125 CR/PR at Table III-8. Number of PRWs increased from *** in 2014 to *** in 2015, and then
fell to *** in 2016; the number of PRWs was *** in interim 2017 compared with *** in interim 2016. Total hours worked increased from *** in 2014 to *** in 2015, and then to *** in 2015; total hours worked was *** in interim 2017 compared with *** in interim 2016. Hours worked per PRW increased from *** in 2014 to *** in 2015, and then to *** in 2016; hours worked per PRW was *** in interim 2017 compared with *** in interim 2016. Wages paid increased from $*** in 2014 to $*** in 2015, and then to $*** in 2016; wages paid were $*** in interim 2017 compared with $*** in interim 2016. Hourly wages declined from $*** in 2014 to $*** in 2015, and then increased to $*** in 2016; hourly wages was $*** in interim 2017 compared with $*** in interim 2016. Id.
21
lower in interim 2017 than in interim 2016.126 Unit labor costs increased from 2014 to 2016, and were higher in interim 2017 than interim 2016.127
The domestic industry’s sales revenues and measures of profitability all showed overall improvement between 2014 and 2016, but were at lower levels in interim 2017 than in interim 2016.128 Net sales revenue increased from $*** in 2014 to $*** in 2015 and $*** in 2016; the net sales revenue was $*** in interim 2017 compared with $*** in interim 2016. The lower net sales revenues in interim 2017 occurred notwithstanding increasing costs; COGS increased from $*** in 2014 to $*** in 2015 and $*** in 2016; COGS were higher in interim 2017, at $***, than in interim 2016, at $***. Gross profit remained level at $*** from 2014 to 2015 and subsequently increased to $*** in 2016; gross profit was lower in interim 2017, at $***, than in interim 2016, when it was $***. Operating income decreased from $*** in 2014 to $*** in 2015, and subsequently increased to $*** in 2016; the $*** operating income in interim 2017 was lower than the $*** in interim 2016. Similarly, the operating income margin decreased from *** percent in 2014 to *** percent in 2015, and subsequently increased to *** percent in 2016; the margin was lower in interim 2017, when it was *** percent, than in interim 2016, when it was *** percent. Net income increased from $*** in 2014 to *** in 2015, declined to *** in 2016, and was lower in interim 2017, when it was $***, than in interim 2016, when it was ***.129 Capital expenses increased from 2014 to 2016, but were lower in interim 2017 than in interim 2016.130
For the purpose of these preliminary determinations, we find some reasonable indication that subject imports from China had a significant impact on the domestic industry. Towards the end of 2016 and into interim 2017, despite rising raw material costs, the domestic industry lowered prices to maintain market share in light of the pervasive underselling of significant volumes of subject imports.131 Consequently, notwithstanding improvements in virtually all of the domestic industry’s performance and financial indicators from 2014 to 2016, during the latter portion of the POI the domestic industry’s revenues were worse than they would have been in the absence of subject imports. Indeed, the sales revenues and profitability of the domestic industry were significantly lower in interim 2017 than in interim 2016.
126 CR/PR at Table III-8. Productivity, in short tons per thousand hours, declined from *** in
2014 to *** in 2015, and increased to *** in 2016; it was *** in interim 2017 compared with *** in interim 2016. Id.
127 CR/PR at Table III-8. Unit labor costs per short ton increased from $*** in 2014 to $*** in 2015, and then to $*** in 2016; they were $*** in interim 2017 compared with $*** in interim 2016. Id.
128 CR/PR at Tables VI-1 and VI-3. 129 CR/PR at Table VI-1 and C-1. 130 Capital expenses were $*** in 2014, $*** in 2015, $*** in 2016, $*** in interim 2016, and
*** in interim 2017. Research and development expenses were minimal. CR/PR at Table VI-5. 131 Conference Tr. at 8 (Cloutier); Petitioners’ Postconference Br. at 14, 20. This conclusion is
premised on our finding for purposes of the preliminary determinations that price plays a moderate role in purchasing decisions. As stated above, we intend in any final phase investigations to examine in more detail the nature of price competition between the domestic like product and the subject imports.
22
We have also considered the role of other factors so as not to attribute injury from other factors to the subject imports. We observe that nonsubject imports’ market share was minimal throughout the POI.132 Given the very limited nature of nonsubject import competition, the industry’s foregone revenues cannot be explained by nonsubject imports.
We are not persuaded by Respondents’ argument that competition from plastic fittings was a source of injury to the domestic industry.133 We acknowledge that during the POI, the domestic industry essentially maintained its share of a growing market. Indeed, although plastic fittings are substitutable with CISP fittings in certain commercial construction applications, apparent U.S. consumption of CISP fittings increased by 11 percent from 2014 to 2016.134
Conclusion VII.
For the reasons stated above, we determine that there is a reasonable indication that an industry in the United States is materially injured by reason of subject imports of CISP fittings from China that are allegedly subsidized and sold in the United States at less than fair value.
132 CR/PR at Table IV-9. Nonsubject imports’ market share ranged from *** percent to ***
percent throughout the POI. Id. 133 Conference Tr. at 103 (Singh); NewAge Postconference Tr. at 2. 134 CR at II-13 to II-14, PR at II-10; CR/PR at Table C-1. We are also not persuaded by
Respondents’ argument that the epoxy-coated fittings offered by importer NewAge are qualitatively superior to the asphalt-coated fittings that the domestic industry offers. Conference Tr. at 99-100 (Singh); NewAge Postconference Br. at 15-16. As mentioned above, we find that there is a high degree of interchangeability between subject imports and the domestic like product. Furthermore, based on sales data produced by NewAge, the absolute number of epoxy-coated CISP fittings units sold is small, relative to its asphalt-coated CISP fittings sales. NewAge Postconference Br., Exh. 4.
I-1
PART I: INTRODUCTION
BACKGROUND
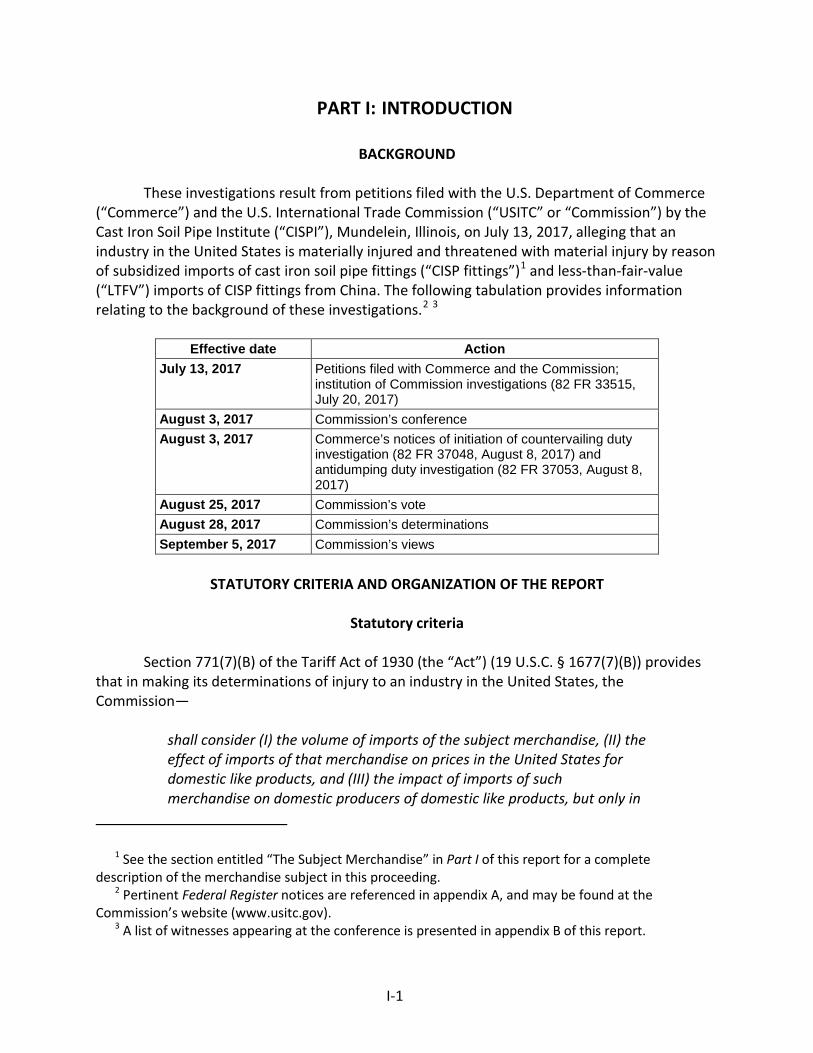
These investigations result from petitions filed with the U.S. Department of Commerce (“Commerce”) and the U.S. International Trade Commission (“USITC” or “Commission”) by the Cast Iron Soil Pipe Institute (“CISPI”), Mundelein, Illinois, on July 13, 2017, alleging that an industry in the United States is materially injured and threatened with material injury by reason of subsidized imports of cast iron soil pipe fittings (“CISP fittings”)1 and less-than-fair-value (“LTFV”) imports of CISP fittings from China. The following tabulation provides information relating to the background of these investigations.2 3
Effective date Action July 13, 2017 Petitions filed with Commerce and the Commission;
institution of Commission investigations (82 FR 33515, July 20, 2017)
August 3, 2017 Commission’s conference August 3, 2017 Commerce’s notices of initiation of countervailing duty
investigation (82 FR 37048, August 8, 2017) and antidumping duty investigation (82 FR 37053, August 8, 2017)
August 25, 2017 Commission’s vote August 28, 2017 Commission’s determinations September 5, 2017 Commission’s views
STATUTORY CRITERIA AND ORGANIZATION OF THE REPORT
Statutory criteria
Section 771(7)(B) of the Tariff Act of 1930 (the “Act”) (19 U.S.C. § 1677(7)(B)) provides that in making its determinations of injury to an industry in the United States, the Commission—
shall consider (I) the volume of imports of the subject merchandise, (II) the effect of imports of that merchandise on prices in the United States for domestic like products, and (III) the impact of imports of such merchandise on domestic producers of domestic like products, but only in
1 See the section entitled “The Subject Merchandise” in Part I of this report for a complete description of the merchandise subject in this proceeding.
2 Pertinent Federal Register notices are referenced in appendix A, and may be found at the Commission’s website (www.usitc.gov).
3 A list of witnesses appearing at the conference is presented in appendix B of this report.
I-2
the context of production operations within the United States; and. . . may consider such other economic factors as are relevant to the determination regarding whether there is material injury by reason of imports.
Section 771(7)(C) of the Act (19 U.S.C. § 1677(7)(C)) further provides that-—4
In evaluating the volume of imports of merchandise, the Commission shall consider whether the volume of imports of the merchandise, or any increase in that volume, either in absolute terms or relative to production or consumption in the United States is significant.. . .In evaluating the effect of imports of such merchandise on prices, the Commission shall consider whether. . .(I) there has been significant price underselling by the imported merchandise as compared with the price of domestic like products of the United States, and (II) the effect of imports of such merchandise otherwise depresses prices to a significant degree or prevents price increases, which otherwise would have occurred, to a significant degree.. . . In examining the impact required to be considered under subparagraph (B)(i)(III), the Commission shall evaluate (within the context of the business cycle and conditions of competition that are distinctive to the affected industry) all relevant economic factors which have a bearing on the state of the industry in the United States, including, but not limited to. . . (I) actual and potential decline in output, sales, market share, gross profits, operating profits, net profits, ability to service debt, productivity, return on investments, return on assets, and utilization of capacity, (II) factors affecting domestic prices, (III) actual and potential negative effects on cash flow, inventories, employment, wages, growth, ability to raise capital, and investment, (IV) actual and potential negative effects on the existing development and production efforts of the domestic industry, including efforts to develop a derivative or more advanced version of the domestic like product, and (V) in {an antidumping investigation}, the magnitude of the margin of dumping.
In addition, Section 771(7)(J) of the Act (19 U.S.C. § 1677(7)(J)) provides that—5 (J) EFFECT OF PROFITABILITY.—The Commission may not determine that there is no material injury or threat of material injury to an industry in the United States merely because that industry is profitable or because the performance of that industry has recently improved.
4 Amended by PL 114-27 (as signed, June 29, 2015), Trade Preferences Extension Act of 2015. 5 Amended by PL 114-27 (as signed, June 29, 2015), Trade Preferences Extension Act of 2015.

I-3
Organization of report
Part I of this report presents information on the subject merchandise, alleged
subsidy/dumping margins, and domestic like product. Part II of this report presents information on conditions of competition and other relevant economic factors. Part III presents information on the condition of the U.S. industry, including data on capacity, production, shipments, inventories, and employment. Parts IV and V present the volume of subject imports and pricing of domestic and imported products, respectively. Part VI presents information on the financial experience of U.S. producers. Part VII presents the statutory requirements and information obtained for use in the Commission’s consideration of the question of threat of material injury as well as information regarding nonsubject countries.
MARKET SUMMARY
CISP fittings are generally used in the sanitary and storm drain, waste, and vent pipe
systems of buildings to connect lengths of cast iron soil pipe. CISP fittings include various designs and sizes, including bends, tees, wyes, traps, drains, and other common or special fittings. CISP fittings are non-malleable and can be classified as hub and spigot or hubless/no-hub. There are three U.S. producers of CISP fittings: AB&I Foundry (“AB&I”), Charlotte Pipe & Foundry (“Charlotte”), and Tyler Pipe (“Tyler”).6 China is the only major source of exports of CISP fittings to the United States and Shanxi Xuanshi Industrial Group Co., Ltd (“Shanxi Xuanshi”) and Qinshui Shunshida Casting Co., Ltd (“Qinshui Shunshida”) are the leading producers of CISP fittings in China. The leading U.S. importer of CISP fittings from China is ***. U.S. imports from nonsubject sources in 2016 account for less than one percent of all imports. U.S. purchasers of CISP fittings are mainly distributors of commercial plumbing supplies that in turn sell to mechanical and plumbing contractors. The leading purchaser is ***. It was the largest customer for ***.
Apparent U.S. consumption of CISP fittings totaled approximately *** short tons (***) in 2016. U.S. producers’ U.S. shipments of CISP fittings totaled *** short tons (***) in 2016, and accounted for *** percent of apparent U.S. consumption by quantity and *** percent by value. U.S. imports from subject sources totaled 8,360 short tons ($9.76 million) in 2016 and accounted for *** percent of apparent U.S. consumption by quantity and *** percent by value. U.S. imports from nonsubject sources totaled 83 short tons ($292,000) in 2016 and accounted for *** percent of apparent U.S. consumption by quantity and *** percent by value.
In the past decade, there have been two instances of Federal Trade Commission (“FTC”) investigations and one instance of litigation. In 2013, the FTC initiated an investigation into allegations that Charlotte Pipe’s acquisition of Star Pipe Products, Inc. was anticompetitive. An order was issued on May 9, 2013 prohibiting Charlotte from enforcing any provisions of the
6 AB&I and Tyler are both wholly owned by McWane, Inc.

I-4
“Confidentiality and Non-Competition Agreement” put in place during the acquisition.7 The FTC also launched a two-year investigation against Charlotte Pipe and McWane Inc. (the parent company of AB&I and Tyler) regarding allegations of anticompetitive behavior. This investigation did not result in charges.8 In July 2016, a class action antitrust suit was brought by purchasers of CISP fittings against Charlotte Pipe and McWane, alleging price fixing.9 In October 2016, the case was settled for $30 million.10 The settlement is reflected in the financial data for Charlotte Pipe but is not reflected in financial data for AB&I and Tyler.11
SUMMARY DATA AND DATA SOURCES
A summary of data collected in these investigations is presented in appendix C, table C-
1. Except as noted, U.S. industry data are based on questionnaire responses of three firms that accounted for 100 percent of U.S. production of CISP fittings during 2016. U.S. imports are based on questionnaire responses of nine firms accounting for 83.0 percent of CISP fitting imports from China and 82.2 percent of CISP fitting imports from all sources as well as public import statistics.
PREVIOUS AND RELATED INVESTIGATIONS
The Commission has conducted one previous import relief investigation on CISP fittings
as well as several investigations covering similar merchandise. The following tabulation presents data on previous and related investigations.
7 In the Matter of Charlotte Pipe and Foundry Company, a corporation, and Randolf Holding Company LLC: Decision and Order, Federal Trade Commission, Docket No. C-4403, p. 4. See also Respondents Postconference Brief, Exh. 1a.
8 Conference transcript, p. 48 (Dowd). See also, Letter from Donald S. Clark, Secretary, Federal Trade Commission to Mark W. Merritt, Esq., Counsel, Charlotte Pipe and Foundry Company, Re: Charlotte Pipe and Foundry Company, File No. 111 0033, April 1, 2013; and Letter from Donald S. Clark, Secretary, Federal Trade Commission to Joseph Ostoyich, Esq., Counsel, McWane, Inc., Re: McWane, Inc., File No. 111 0033, April 1, 2013.
9 Respondents Postconference Brief, Exh. 1b. 10 Conference transcript, p. 12 (Levinson). See also Respondents Postconference Brief, Exh. 1. 11 Conference transcript, p. 75 (Dowd, Lowe).
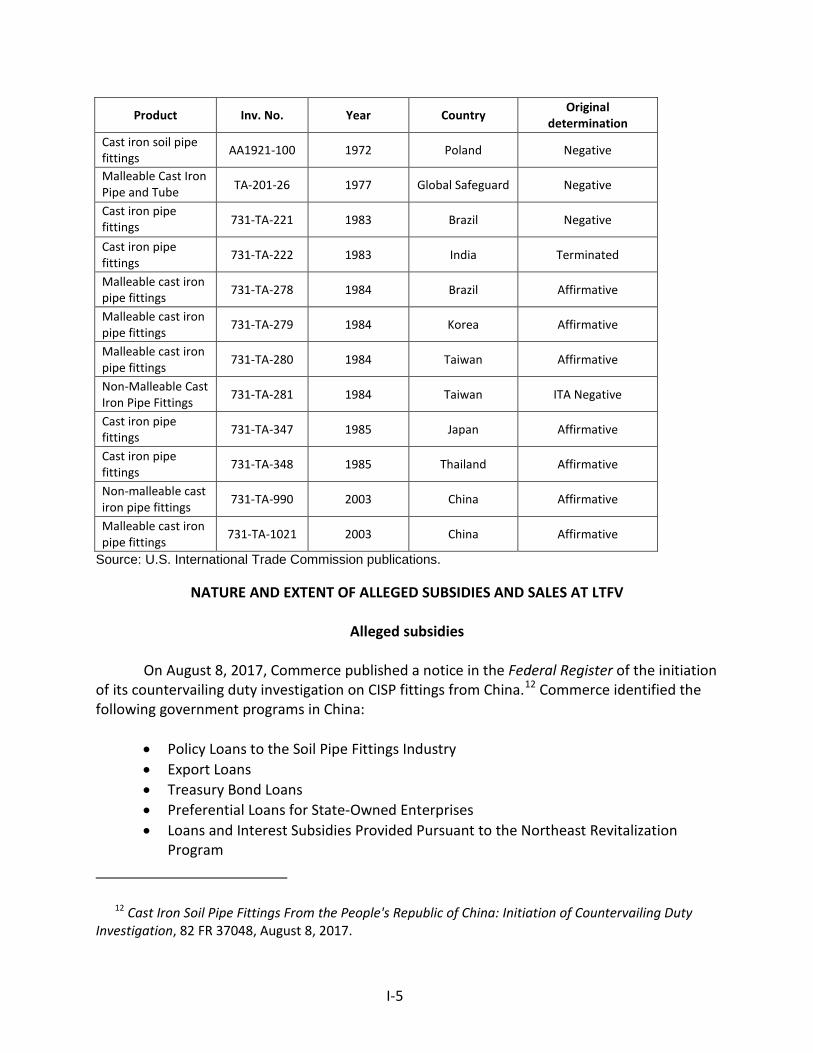
I-5
Product Inv. No. Year Country Original determination
Cast iron soil pipe fittings AA1921-100 1972 Poland Negative
Malleable Cast Iron Pipe and Tube
TA-201-26 1977 Global Safeguard Negative
Cast iron pipe fittings
731-TA-221 1983 Brazil Negative
Cast iron pipe fittings 731-TA-222 1983 India Terminated
Malleable cast iron pipe fittings 731-TA-278 1984 Brazil Affirmative
Malleable cast iron pipe fittings 731-TA-279 1984 Korea Affirmative
Malleable cast iron pipe fittings 731-TA-280 1984 Taiwan Affirmative
Non-Malleable Cast Iron Pipe Fittings 731-TA-281 1984 Taiwan ITA Negative
Cast iron pipe fittings 731-TA-347 1985 Japan Affirmative
Cast iron pipe fittings 731-TA-348 1985 Thailand Affirmative
Non-malleable cast iron pipe fittings 731-TA-990 2003 China Affirmative
Malleable cast iron pipe fittings 731-TA-1021 2003 China Affirmative
Source: U.S. International Trade Commission publications.
NATURE AND EXTENT OF ALLEGED SUBSIDIES AND SALES AT LTFV
Alleged subsidies
On August 8, 2017, Commerce published a notice in the Federal Register of the initiation of its countervailing duty investigation on CISP fittings from China.12 Commerce identified the following government programs in China:
• Policy Loans to the Soil Pipe Fittings Industry • Export Loans • Treasury Bond Loans • Preferential Loans for State-Owned Enterprises • Loans and Interest Subsidies Provided Pursuant to the Northeast Revitalization
Program
12 Cast Iron Soil Pipe Fittings From the People's Republic of China: Initiation of Countervailing Duty Investigation, 82 FR 37048, August 8, 2017.
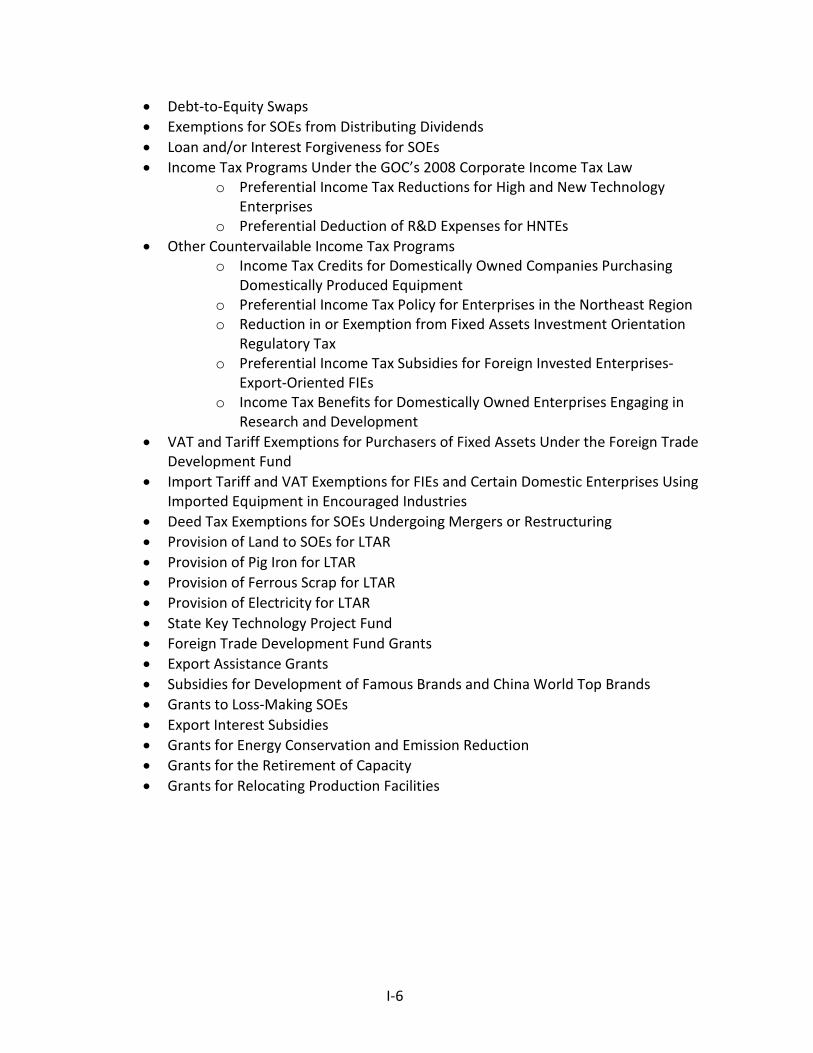
I-6
• Debt-to-Equity Swaps • Exemptions for SOEs from Distributing Dividends • Loan and/or Interest Forgiveness for SOEs • Income Tax Programs Under the GOC’s 2008 Corporate Income Tax Law
o Preferential Income Tax Reductions for High and New Technology Enterprises
o Preferential Deduction of R&D Expenses for HNTEs • Other Countervailable Income Tax Programs
o Income Tax Credits for Domestically Owned Companies Purchasing Domestically Produced Equipment
o Preferential Income Tax Policy for Enterprises in the Northeast Region o Reduction in or Exemption from Fixed Assets Investment Orientation
Regulatory Tax o Preferential Income Tax Subsidies for Foreign Invested Enterprises-
Export-Oriented FIEs o Income Tax Benefits for Domestically Owned Enterprises Engaging in
Research and Development • VAT and Tariff Exemptions for Purchasers of Fixed Assets Under the Foreign Trade
Development Fund • Import Tariff and VAT Exemptions for FIEs and Certain Domestic Enterprises Using
Imported Equipment in Encouraged Industries • Deed Tax Exemptions for SOEs Undergoing Mergers or Restructuring • Provision of Land to SOEs for LTAR • Provision of Pig Iron for LTAR • Provision of Ferrous Scrap for LTAR • Provision of Electricity for LTAR • State Key Technology Project Fund • Foreign Trade Development Fund Grants • Export Assistance Grants • Subsidies for Development of Famous Brands and China World Top Brands • Grants to Loss-Making SOEs • Export Interest Subsidies • Grants for Energy Conservation and Emission Reduction • Grants for the Retirement of Capacity • Grants for Relocating Production Facilities

I-7
Alleged sales at LTFV
On August 8, 2017, Commerce published a notice in the Federal Register of the initiation of its antidumping duty investigation on CISP fittings from China.13 Commerce has initiated an antidumping duty investigation based on estimated dumping margins of 92.48 percent for CISP fittings from China.
THE SUBJECT MERCHANDISE
Commerce’s scope
Commerce has defined the scope of these investigations as follows: The merchandise covered by this investigation is cast iron soil pipe fittings, finished and unfinished, regardless of industry or proprietary specifications, and regardless of size. Cast iron soil pipe fittings are nonmalleable iron castings of various designs and sizes, including, but not limited to, bends, tees, wyes, traps, drains, and other common or special fittings, with or without side inlets. Cast iron soil pipe fittings are classified into two major types—hubless and hub and spigot. Hubless cast iron soil pipe fittings are manufactured without a hub, generally in compliance with Cast Iron Soil Pipe Institute (CISPI) specification 301 and/or American Society for Testing and Materials (ASTM) specification A888. Hub and spigot pipe fittings have hubs into which the spigot (plain end) of the pipe or fitting is inserted. Cast iron soil pipe fittings are generally distinguished from other types of nonmalleable cast iron fittings by the manner in which they are connected to cast iron soil pipe and other fittings.
The subject imports are normally classified in subheading 7307.11.0045 of the Harmonized Tariff Schedule of the United States (HTSUS): Cast fittings of nonmalleable cast iron for cast iron soil pipe. The HTSUS subheading and specifications are provided for convenience and customs purposes only; the written description of the scope of this investigation is dispositive.
13 Cast Iron Soil Pipe Fittings From the People's Republic of China: Initiation of Less-Than-Fair Value Investigation, 82 FR 37053, August 8, 2017.
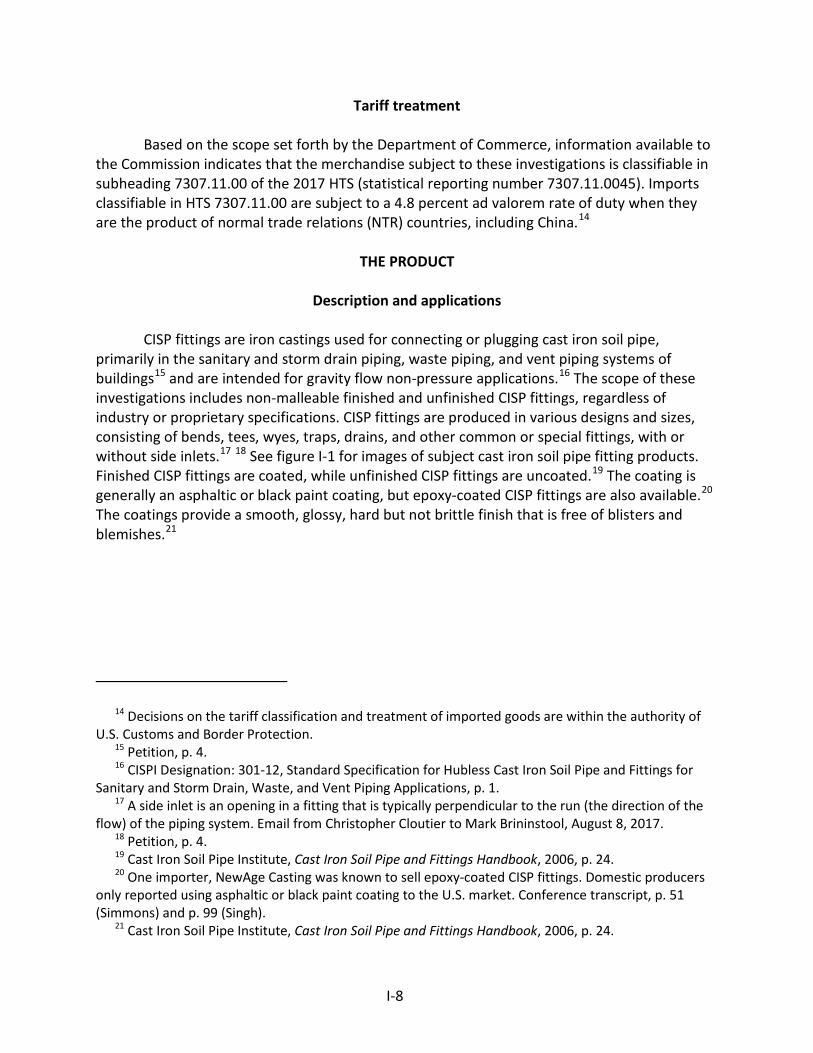
I-8
Tariff treatment
Based on the scope set forth by the Department of Commerce, information available to the Commission indicates that the merchandise subject to these investigations is classifiable in subheading 7307.11.00 of the 2017 HTS (statistical reporting number 7307.11.0045). Imports classifiable in HTS 7307.11.00 are subject to a 4.8 percent ad valorem rate of duty when they are the product of normal trade relations (NTR) countries, including China.14
THE PRODUCT
Description and applications
CISP fittings are iron castings used for connecting or plugging cast iron soil pipe,
primarily in the sanitary and storm drain piping, waste piping, and vent piping systems of buildings15 and are intended for gravity flow non-pressure applications.16 The scope of these investigations includes non-malleable finished and unfinished CISP fittings, regardless of industry or proprietary specifications. CISP fittings are produced in various designs and sizes, consisting of bends, tees, wyes, traps, drains, and other common or special fittings, with or without side inlets.17 18 See figure I-1 for images of subject cast iron soil pipe fitting products. Finished CISP fittings are coated, while unfinished CISP fittings are uncoated.19 The coating is generally an asphaltic or black paint coating, but epoxy-coated CISP fittings are also available.20 The coatings provide a smooth, glossy, hard but not brittle finish that is free of blisters and blemishes.21
14 Decisions on the tariff classification and treatment of imported goods are within the authority of U.S. Customs and Border Protection.
15 Petition, p. 4. 16 CISPI Designation: 301-12, Standard Specification for Hubless Cast Iron Soil Pipe and Fittings for
Sanitary and Storm Drain, Waste, and Vent Piping Applications, p. 1. 17 A side inlet is an opening in a fitting that is typically perpendicular to the run (the direction of the
flow) of the piping system. Email from Christopher Cloutier to Mark Brininstool, August 8, 2017. 18 Petition, p. 4. 19 Cast Iron Soil Pipe Institute, Cast Iron Soil Pipe and Fittings Handbook, 2006, p. 24. 20 One importer, NewAge Casting was known to sell epoxy-coated CISP fittings. Domestic producers
only reported using asphaltic or black paint coating to the U.S. market. Conference transcript, p. 51 (Simmons) and p. 99 (Singh).
21 Cast Iron Soil Pipe Institute, Cast Iron Soil Pipe and Fittings Handbook, 2006, p. 24.

I-9
Figure I-1 Cast iron soil pipe fittings: Images of cast iron soil pipe fittings
Bend
Tee
Wye
Trap
Source: Lowe’s Companies, Inc., https://www.lowes.com/pl/Cast-iron-fittings-Cast-iron-pipe-fittings-Pipe-fittings-Plumbing/4294822000, (Accessed August 4, 2017).
The material from which CISP fittings are made, cast iron, is an alloy primarily composed of iron, carbon, and silicon. The carbon content of cast iron is greater than 2 percent while steel contains less than 2 percent carbon. In comparison with steel, the carbon and silicon content of cast iron gives it characteristics that are beneficial to casting, such as a lower melting temperature, more fluidity in a molten state, less reactivity with molding materials, and less change in volume during the conversion from a liquid to a solid.22
The scope of these investigations contains only non-malleable cast iron, which includes gray iron and ductile iron.23 Gray iron contains interconnected graphite flakes which form during solidification of the iron24 and ductile iron contains graphite that occurs as spheroids owing to the addition of a small amount of magnesium to the molten iron.25 Malleable cast iron, which is not included in the scope of these investigations, contains graphite which occurs as irregularly shaped nodules of graphite as a result of heat treatment after the castings are formed.26 The form in which the graphite occurs in the cast iron determines a range of properties in the cast iron. Malleable cast iron is not used to produce CISP fittings and does not meet CISPI or ASTM standards for CISP fittings.27
CISP fittings are classified as hub and spigot fittings or hubless fittings.28 Hub and spigot fittings have hubs into which the spigot (plain end) of the pipe or of another fitting is inserted.
22 Atlas Foundry Company, Understanding Cast Irons, http://www.atlasfdry.com/cast-irons.htm. 23 CISPI Designation: 301-12, Standard Specification for Hubless Cast Iron Soil Pipe and Fittings for
Sanitary and Storm Drain, Waste, and Vent Piping Applications, p. 4. 24 Atlas Foundry Company, Understanding Cast Irons - Gray Iron, http://www.atlasfdry.com/gray-
iron.htm. 25 Atlas Foundry Company, Understanding Cast Irons - Ductile Iron,
http://www.atlasfdry.com/ductile-iron.htm. 26 Atlas Foundry Company, Understanding Cast Irons - Malleable Iron,
http://www.atlasfdry.com/malleable-iron.htm. 27 Conference transcript, p. 80 (Simmons). 28 Petition, p. 4.
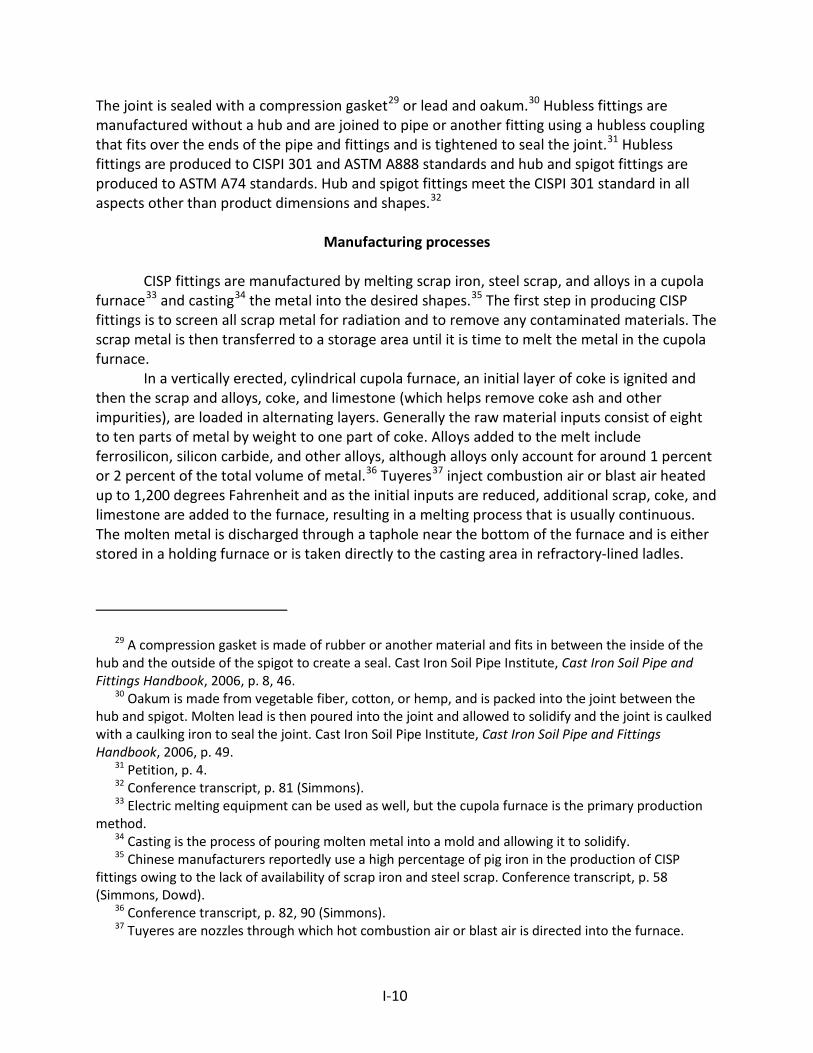
I-10
The joint is sealed with a compression gasket29 or lead and oakum.30 Hubless fittings are manufactured without a hub and are joined to pipe or another fitting using a hubless coupling that fits over the ends of the pipe and fittings and is tightened to seal the joint.31 Hubless fittings are produced to CISPI 301 and ASTM A888 standards and hub and spigot fittings are produced to ASTM A74 standards. Hub and spigot fittings meet the CISPI 301 standard in all aspects other than product dimensions and shapes.32
Manufacturing processes
CISP fittings are manufactured by melting scrap iron, steel scrap, and alloys in a cupola
furnace33 and casting34 the metal into the desired shapes.35 The first step in producing CISP fittings is to screen all scrap metal for radiation and to remove any contaminated materials. The scrap metal is then transferred to a storage area until it is time to melt the metal in the cupola furnace.
In a vertically erected, cylindrical cupola furnace, an initial layer of coke is ignited and then the scrap and alloys, coke, and limestone (which helps remove coke ash and other impurities), are loaded in alternating layers. Generally the raw material inputs consist of eight to ten parts of metal by weight to one part of coke. Alloys added to the melt include ferrosilicon, silicon carbide, and other alloys, although alloys only account for around 1 percent or 2 percent of the total volume of metal.36 Tuyeres37 inject combustion air or blast air heated up to 1,200 degrees Fahrenheit and as the initial inputs are reduced, additional scrap, coke, and limestone are added to the furnace, resulting in a melting process that is usually continuous. The molten metal is discharged through a taphole near the bottom of the furnace and is either stored in a holding furnace or is taken directly to the casting area in refractory-lined ladles.
29 A compression gasket is made of rubber or another material and fits in between the inside of the hub and the outside of the spigot to create a seal. Cast Iron Soil Pipe Institute, Cast Iron Soil Pipe and Fittings Handbook, 2006, p. 8, 46.
30 Oakum is made from vegetable fiber, cotton, or hemp, and is packed into the joint between the hub and spigot. Molten lead is then poured into the joint and allowed to solidify and the joint is caulked with a caulking iron to seal the joint. Cast Iron Soil Pipe Institute, Cast Iron Soil Pipe and Fittings Handbook, 2006, p. 49.
31 Petition, p. 4. 32 Conference transcript, p. 81 (Simmons). 33 Electric melting equipment can be used as well, but the cupola furnace is the primary production
method. 34 Casting is the process of pouring molten metal into a mold and allowing it to solidify. 35 Chinese manufacturers reportedly use a high percentage of pig iron in the production of CISP
fittings owing to the lack of availability of scrap iron and steel scrap. Conference transcript, p. 58 (Simmons, Dowd).
36 Conference transcript, p. 82, 90 (Simmons). 37 Tuyeres are nozzles through which hot combustion air or blast air is directed into the furnace.
I-11
The molten metal from the cupola furnace is cast into CISP fittings using either sand molds or permanent metal molds. When using sand molds, the molten iron is poured from a ladle into the sand molds which contain sand cores; both are produced on site. The molds provide the exterior shape of the fitting while the cores are used to produce the hollow space inside the fitting. The molten iron is allowed to cool inside the mold until the iron solidifies, at which point the castings are removed from the molds and moved to a grate where sand from the used molds and cores is collected and the fittings are allowed to further cool in the open air. Once fully cool, the castings are still covered with a small amount of sand that must be removed. The sand from the used molds and cores is recycled.
When permanent metal molds are used, the interior of a reusable, two-piece, water- or air-cooled metal mold is coated with soot from burning acetylene to prevent the mold from chilling the molten iron and to prevent the casting from sticking to the mold. A ladle pours the molten iron into the molds which are water- or air-cooled and contain sand cores and the metal is allowed to solidify. The fittings are then removed from the mold to finish cooling and to be cleaned, and the used molds are cleaned and reused.
Cleaning the fittings after they are removed from the molds involves removing not only sand, but imperfections such as gates, fins, and risers. This is accomplished using such methods as shot blast, tumbling machines, reamers, and grinding equipment. After the fittings are cleaned, they are inspected and tested before they receive any finishing they might need. Separate types of finish that can be applied to CISP fittings include asphaltic, black paint, and epoxy finishes. CISP fittings finished with an asphaltic or black paint coating are finished by dipping the fitting into a bath of coating material. An epoxy finish is applied to CISP fittings using a proprietary process.38 The coatings provide a smooth, glossy, hard but not brittle finish that is free of blisters and blemishes. The epoxy coating reportedly also provides protection against corrosion.39
38 Conference transcript, p. 139 (Singh). 39 NewAge Casting, LP imports CISP fittings with and without the epoxy finish. Any CISP fitting that
has not been given the epoxy finish at the foundry in China is given the epoxy finish at NewAge Casting’s facility in Houston, Texas. Email from Ronald Wisla to Amelia Shister, August 4, 2017, and email from Bikram Singh to Amelia Shister, August 5, 2017. NewAge Casting claims that its epoxy-coated CISP fittings can resist pH levels of 2 to 12, while traditionally coated CISP fittings can resist pH levels of only 4.3 and above. Conference transcript, p. 99-100 (Singh). The Cast Iron Soil Pipe Institute claims that 95% of the soils in the United States are non-corrosive to cast iron and that in soils which may cause corrosion, a loose wrap of polyethylene film can be used to protect CISP fittings coated with traditional coatings such as asphaltic coating and black paint coating. Cast Iron Soil Pipe Institute, Cast Iron Soil Pipe and Fittings Handbook, 2006, p. 7.

I-12
DOMESTIC LIKE PRODUCT ISSUES
Petitioners proposed a single domestic like product consisting of CISP fittings covered by the scope. These CISP fittings conform to industry specifications in order to connect cast iron soil pipe to make a complete system and only CISP fittings can connect to cast iron soil pipe. Respondents agreed with the domestic like product definition for the purposes of the preliminary investigation.40 Petitioners and respondents both acknowledge domestic and imported CISP fittings are interchangeable41 and that both domestic and imported CISP fittings are sold to distributors who sell the product to end users.42 No issues with respect to domestic like product have been raised in this investigation.43
40 Conference transcript, p. 119 (Levinson). 41 Conference transcript, p. 36 (Lowe, Simmons), p. 115 (Singh). 42 Conference transcript, p. 33 (Lowe, Waugaman), pp. 105-6 (Miao, Singh). 43 Conference transcript, p. 43 (Schagrin), p. 119 (Koenig, Levinson).
II‐1
PART II: CONDITIONS OF COMPETITION IN THE U.S. MARKET
U.S. MARKET CHARACTERISTICS
Cast iron soil pipe fittings (“CISP fittings”) are non‐malleable iron castings of a variety of shapes and sizes which are connection components for systems of sanitary and storm drain, waste, and vent piping. Building types which use CISP fittings include residential, commercial, and industrial construction, as well as public buildings such as schools and hospitals. Additionally, CISP fittings may be used for storm drainage from roofs, yards, areaways, courts, and in high‐rise buildings. Consequently, demand for CISP fittings is tied to building construction activity.
Shapes of CISP fittings include not only bends and tees, but also wyes, traps, drains, and other specialty shapes. There are two types of CISP fittings: hubless/no‐hub and hub and spigot.1 Hubless CISP fittings comprise the largest portion of the market.2 CISP fittings are used in conjunction with pipes, valves, and pumps to form a piping system. CISP fittings sold in the United States must be produced to ASTM and CISPI (Cast Iron Soil Pipe Institute) standards. CISP fittings are typically sold in standard sizes (1.5 inches to 15 inches).3 CISP fittings and pipe are typically sold as a system, and for large‐scale commercial projects, the name of the manufacturer of the fittings and pipe will be submitted by the contractor.4
Apparent U.S. consumption of CISP fittings increased during 2014‐16 and but lower in January‐June 2017 than in January‐June 2016. Overall, apparent U.S. consumption in 2016 was *** percent higher than in 2014, but *** percent lower in the first half of 2017 than the first half of 2016. In 2016, U.S. producers’ shipments represented *** percent of apparent U.S. consumption and subject imports represented *** percent in 2016, with nonsubject imports representing a small remainder (*** percent). In the first half of 2017, the share of U.S. apparent consumption attributable to U.S. producers was *** percent, compared with *** percent during the first half of 2016.
CHANNELS OF DISTRIBUTION
Nearly all shipments of CISP fittings were to distributors during January 2014‐June 2017
(table II‐1). *** shipments from U.S. producers and more than *** shipments of imports from China were to distributors. Importer NewAge maintains four distribution centers in the United States from which it ships CISP fittings to its distributor customers, and in some instances, directly to the job site.5 Most CISP fittings in the U.S. market are sold through distributors that stock both pipe and fittings for sale to construction contractors.6
1 Petition, pp. 4‐6. 2 See Table IV‐8, infra, and staff telephone interview with ***. 3 See, e.g., http://www.charlottepipe.com/cast_iron.aspx. 4 Conference transcript, p. 108 (Singh). 5 Conference transcript, p. 106 (Singh). 6 Conference transcript, p. 27 (Lowe) and Conference transcript, p. 117 (Singh).
II‐2
Table II-1 CISP fittings: U.S. producers’ and importers’ U.S. commercial shipments, by sources and channels of distribution, 2014-16, January-June 2016, and January-June 2017
* * * * * * *
GEOGRAPHIC DISTRIBUTION
*** U.S. producers reported selling CISP fittings to all regions in the United States (table II‐2). Tyler’s sales are mostly in the ***, and AB&I’s sales are concentrated in *** parts of the country.7 Only one importer (***) reported selling CISP fittings to all U.S. regions. Multiple importers reported selling to the Northeast, Pacific Coast, and Midwest regions. Importer NewAge stated that markets along the I‐95 corridor, running from around Boston, Massachusetts, to around Richmond, Virginia, are the most extensively used commercial plumbing industry markets in the United States, with New York being the largest market in the world for cast iron soil pipe.8 Most imports of CISP fittings enter the United States through West Coast ports or through New York.
U.S. producers reported that *** percent of their sales were within 100 miles of their production facility, *** percent were between 101 and 1,000 miles, and *** percent were greater than 1,000 miles. Importers of CISP fittings from China sold 59 percent within 100 miles of their U.S. point of shipment, 9 percent between 101 and 1,000 miles, and 32 percent greater than 1,000 miles.
7 Conference transcript, p. 85 (Lowe). 8 Conference transcript, pp. 140‐141 (Singh).

II‐3
Table II-2 CISP fittings: Geographic market areas in the United States served by U.S. producers and importers
Region U.S. producers Importers
China Northeast *** 5 Midwest *** 3 Southeast *** 1 Central Southwest *** 1 Mountain *** 1 Pacific Coast *** 4 Other1 *** 1 All regions (except Other) *** 1 Reporting firms *** 9
1 All other U.S. markets, including AK, HI, PR, and VI. Source: Compiled from data submitted in response to Commission questionnaires.
SUPPLY AND DEMAND CONSIDERATIONS
U.S. supply Domestic production
Based on available information, U.S. producers of CISP fittings have the ability to respond to changes in demand with large changes in the quantity of shipments of U.S.‐produced CISP fittings to the U.S. market. The main contributing factors to this degree of responsiveness of supply are the availability of unused capacity and very large inventories.
Industry capacity
Domestic capacity has remained nearly stable since 2014. Capacity utilization increased from *** percent in 2014 to *** percent in 2016 as a result of increased production. Capacity utilization in interim 2017 was higher than it was in 2016 at *** percent, but was slightly lower when compared with interim 2016, when it was *** percent. *** U.S. producers also manufacture other products using the same equipment and workers as those making CISP fittings. Overall capacity utilization including these products increased from *** percent in 2014 to *** percent in 2016 as a result of increased production. Capacity utilization was also higher in interim 2017 compared with interim 2016, at *** percent compared with *** percent. This low level of capacity utilization suggests that U.S. producers may have a substantial ability to increase production of CISP fittings in response to an increase in prices.

II‐4
Alternative markets
U.S. producers’ exports represented a small share of their total shipments, and declined from *** percent of total shipments in 2014 to *** percent in 2016. This indicates that U.S. producers may have a very limited ability to shift shipments between the U.S. market and other markets in response to price changes.
Inventory levels
U.S. producers’ inventories, relative to total shipments, declined slightly from *** percent at the end of 2014 to *** percent at the end of 2016. Inventories were *** percent of total shipments in January‐June 2016 and *** percent in January‐June 2017. These inventory levels suggest that U.S. producers may have ample ability to respond to changes in demand with changes in the quantity shipped from inventories.
Production alternatives
Two of three responding U.S. producers (AB&I and Charlotte) stated that they could switch production from CISP fittings to other products, and Tyler stated that ***. *** stated it could also produce custom castings for other CISP producers, and *** stated it could produce non‐plumbing related commercial castings. Charlotte can produce commercial castings using the same production facilities, but these castings have different metallurgical and quality requirements as well as different personnel training requirements; and AB&I makes a small amount of gray iron castings.9 In each period, approximately *** of overall production using the same equipment as subject production was of goods other than CISP fittings. In addition to producing CISP fittings, Charlotte is also the largest producer of plastic drain waste and vent piping fittings in the United States, and is the only CISP fittings producers that manufactures both plastic and CISP fittings.10
Subject imports from China11
Based on available information, producers of CISP fittings from China have the ability to respond to changes in demand with moderate‐to‐large changes in the quantity of shipments of CISP fittings to the U.S. market. The main contributing factors to this degree of responsiveness of supply are the availability of unused capacity and inventories.
9 Conference transcript, pp. 30‐31 (Simmons, Lowe). 10 Conference transcript, p. 20 (Dowd). 11 For data on the number of responding foreign firms and their share of U.S. imports from China,
please refer to Part I, “Summary Data and Data Sources.”
II‐5
Industry capacity
Chinese production capacity increased slightly while production fluctuated from 2014 to 2016. Capacity utilization fluctuated, decreasing from 70.8 percent in 2014 to 63.8 percent in 2015, and then increasing to 71.0 percent in 2016. Capacity utilization was 65.6 percent in January‐June 2016 and 73.2 percent in January‐June 2017. This relatively low level of capacity utilization suggests that Chinese producers may have a substantial ability to increase production of CISP fittings in response to an increase in prices.
Alternative markets
Most of Chinese producers’ shipments were to the Chinese home market. Chinese producers’ home market shipments, as a share of their total shipments, decreased from 92.4 percent in 2014 to 86.7 percent in 2016, and were 88.7 percent in interim 2017, compared with 86.5 percent in interim 2016. Chinese producers’ exports to non‐U.S. markets, as a percentage of total shipments, increased irregularly from *** percent in 2014 to *** percent in 2016, and were *** percent in interim 2017, compared with *** percent in interim 2016. This indicates that Chinese producers may have limited ability to shift shipments between the U.S. market and other markets in response to price changes. Chinese producers reported exports to Asia (including Hong Kong, Korea, Philippines, Singapore, and Taiwan), and to the EU and Turkey.
Inventory levels
Chinese producers’ inventories, relative to total shipments, decreased from 42.0 percent at the end of 2014 to 40.6 percent at the end of 2016. Inventories were 25.8 percent of total shipments in the first half of 2016 and were 20.5 percent in the first half of 2017. These inventory levels suggest that Chinese producers may have some ability to respond to changes in demand with changes in the quantity shipped from inventories.
Production alternatives
All eight responding Chinese producers stated that they could not switch production from CISP fittings to other products, although one Chinese producer reported producing other products on the same equipment as CISP fittings. This producer (***) reported producing cast iron pipes, manhole covers, and other cast iron products on the same equipment.
Supply constraints
All three responding U.S. producers and five of nine responding importers indicated that they have not experienced any constraints in their ability to supply CISP fittings since January 1, 2014. Four importers reported experiencing supply constraints with imported product from China. Importer *** stated that at the end of 2016 many foundries in China were closed by the government and required to upgrade their pollution control equipment. It stated that many fittings were not available from China in 2017, including fittings in 1.5 inch to 4 inch diameters,
II‐6
specialty fittings, and complex base fittings. Importer *** reported that it has purchased from domestic distributors and has increased its inventories to avoid shortages of fittings.
In 2014, an antitrust lawsuit was filed regarding anti‐competitive practices of the domestic producers of CISP fittings during 2006 through 2013. This resulted in a settlement of $30 million to direct purchasers of CISP pipe and fittings. The suit was originally filed seeking over $385 million, with the possibility of treble damages. With respect to the lawsuit, petitioners noted that “It was nuisance value in terms of our settlement versus over a billion dollars potential damages.”12
In addition, just before 2014, the Federal Trade Commission (“FTC”) concluded an investigation into Charlotte Pipe’s 2010 acquisition of Star Pipe’s cast iron soil pipe business which it deemed as anticompetitive behavior.13 Respondent NewAge alleged that this is part of the industry’s anticompetitive business practices, which include Charlotte’s and AB&I/Tyler’s parent company McWane’s purchases of competitors, including several importers and seven producers with the purpose to shut them down.14 Petitioner Charlotte stated that the FTC’s two‐year investigation was closed “without bringing charges against anyone.”15
Nonsubject imports
Nonsubject imports accounted for less than *** percent of the U.S. market throughout the period for which data were collected. In 2016, imports from countries other than China accounted for nearly 1.0 percent of total imports, and *** percent of apparent U.S. consumption in 2016.
U.S. demand
Based on available information, the overall demand for CISP fittings is likely to
experience small changes in response to changes in price. The main contributing factors are the limited substitute products in some end uses and the small cost share of CISP fittings in the total construction costs of buildings.
End uses and cost share
U.S. demand for CISP fittings depends on the demand for piping systems in residential, commercial, industrial, and public buildings. CISP fittings account for a relatively small share of
12 Conference transcript, p. 49 (Dowd). 13 FTC, “Charlotte Pipe and Foundry Settles Charges That Its 2010 Purchase of Star Pipe’s Cast Iron
Soil Pipe Business Was Anticompetititve,” April 2, 2013, included as exhibit 1A of Respondent NewAge’s postconference brief.
14 Conference transcript, p. 12 (Levinson). 15 Conference transcript, p. 48 (Dowd).
II‐7
the cost of these piping systems, generally ranging from one‐fifth to one‐third of the cost,16 but a very small portion of the overall cost of the building/construction project.17
Business cycles
All three U.S. producers and 5 of the 8 responding importers indicated that the CISP fittings market was not subject to business cycles. On the other hand, two importers stated that demand for fittings was seasonal, with demand highest during the summer during peak construction activity and lowest during the winter.18
One U.S. producer and one importer indicated that the CISP fittings market is subject to distinct conditions of competition. U.S. producer *** stated that oversupply of domestic and imported CISP fittings was a distinct condition. Importer *** stated that conditions of competition include: (1) some jobs require U.S. product; (2) multiple revisions to the ASTM A888 standards over the years;19 (3) lack of availability of many types of Chinese fittings during April 2017; (4) the small number of U.S. manufacturers of fittings, the antitrust case, and the purchase of AB&I by the parent company of Tyler; (5) high shipping costs that make it prohibitive for Charlotte to compete with the other two U.S. producers; and (6) the availability of substitute products.
16 Among the firms reporting the cost share in piping systems of CISP fittings, *** three importers reported cost shares of about 20 percent, one importer reported 33 percent, and one importer reported 70 percent.
17 *** reported that CISP fittings account for 2 percent of the cost of buildings. 18 One importer that indicated that the market was subject to business cycles did not elaborate on its
answer. 19 Respondent NewAge also alleges that the industry group responsible for changes to ASTM
standards, the Cast Iron Soil Pipe Institute (“CISPI”), is largely governed by Petitioners, and has changed ASTM standards applicable to CISP fittings 13 times since 2000. It alleges that these changes “have related to neither the quality nor longevity of the product” but have caused NewAge to spend large amounts of money to comply with the new standards. Respondent NewAge’s postconference brief, pp. 20‐22. Importer *** also stated that CISPI has changed ASTM A888 standards frequently, allegedly in an attempt to differentiate domestic fittings from imported fittings. The current standard, ASTM A888–15, is the “Standard Specification for Hubless Cast Iron Soil Pipe and Fittings for Sanitary and Storm Drain, Waste, and Vent Piping Applications,” and can be found at https://www.astm.org/Standards/A888.htm. The number following A888 indicates the year of the latest revision to the standard. This site provides the active standard (2015), as well as prior versions (13, 13‐A, 11, 09, 08, 08‐A, 07, 07‐A, 05, 04, 04‐A, and 03).
Counsel for petitioners stated that ASTM is an independent organization, and does not believe changes are made in a way that NewAge is simply outvoted by domestic producers. Conference transcript, p. 147 (Schagrin).

II‐8
Demand trends
All three U.S. producers reported an increase in U.S. demand for CISP fittings since January 1, 2014 (table II‐3), citing increased commercial construction. Importers reported a variety of answers regarding demand trends. Importer Leo stated that demand increased for CISP fittings as construction of commercial buildings and apartments has increased, but Leo and 2 other importers also stated that demand for CISP fittings has been reduced by increasing use of plastic fittings.
Table II-3 CISP fittings: Firms’ responses regarding U.S. demand and demand outside the United States
Item Increase No change Decrease Fluctuate Demand in the United States: U.S. producers *** *** *** *** Importers 2 3 2 1 Demand outside the United States: U.S. producers *** *** *** *** Importers 0 1 2 0
Source: Compiled from data submitted in response to Commission questionnaires.
As can be seen in figure II‐1, the value of construction put in place in the United States grew from January 2014 to June 2017, on a seasonally adjusted basis. Overall, the value of public construction put in place increased by 8.2 percent over the nearly three‐and‐a‐half year period, while the value of private non‐residential construction put in place increased 23.7 percent and private residential construction put in place increased 41.0 percent.
Construction spending is highly seasonal, however. As shown in figure II‐2, non‐seasonally adjusted construction spending was lowest in each January and then generally increased through the summer, and remained at elevated levels through October before falling for the final months of the year. Public construction spending was characterized by the greatest seasonal variation and private residential construction spending by the least seasonal variation. Second‐half construction spending was higher than first‐half construction spending for all three types by 16.1 percent in 2014, 15.6 percent in 2015, and 15.4 percent in 2016. Year‐over‐year construction spending has been increasing; however it has been increasing by decreasing amounts, based on half‐yearly data (table II‐4).
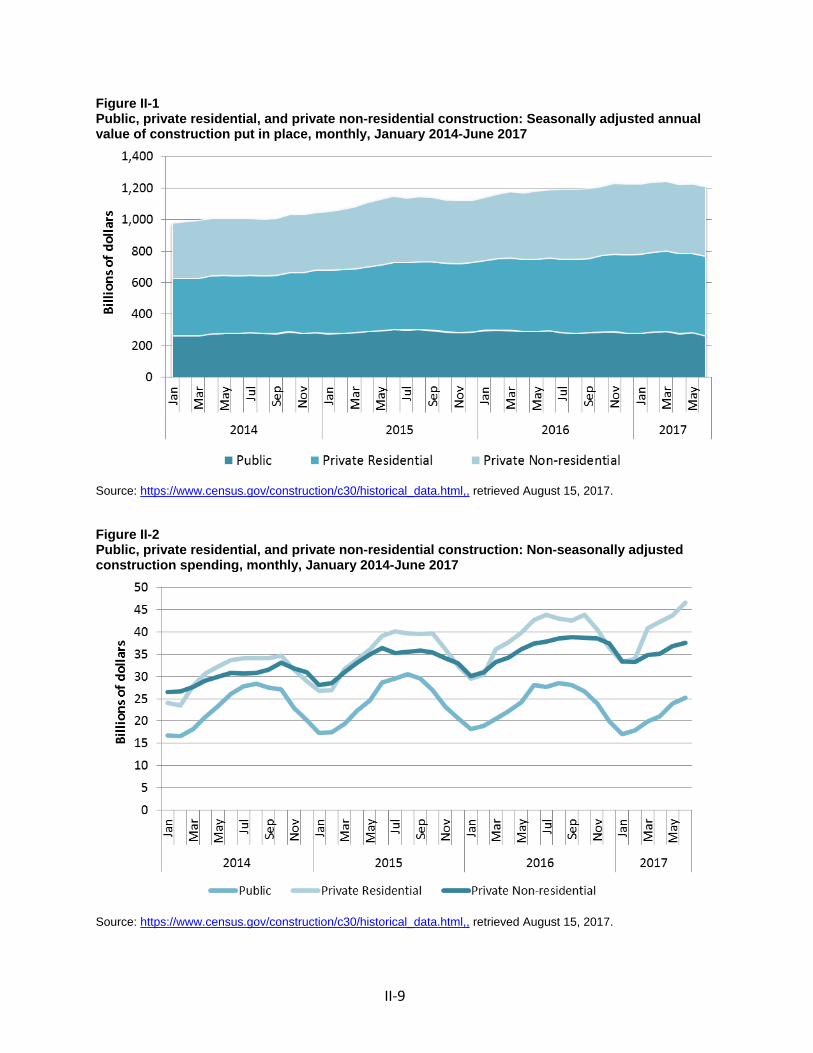
II‐9
Figure II-1 Public, private residential, and private non-residential construction: Seasonally adjusted annual value of construction put in place, monthly, January 2014-June 2017
Source: https://www.census.gov/construction/c30/historical_data.html,, retrieved August 15, 2017. Figure II-2 Public, private residential, and private non-residential construction: Non-seasonally adjusted construction spending, monthly, January 2014-June 2017
Source: https://www.census.gov/construction/c30/historical_data.html,, retrieved August 15, 2017.
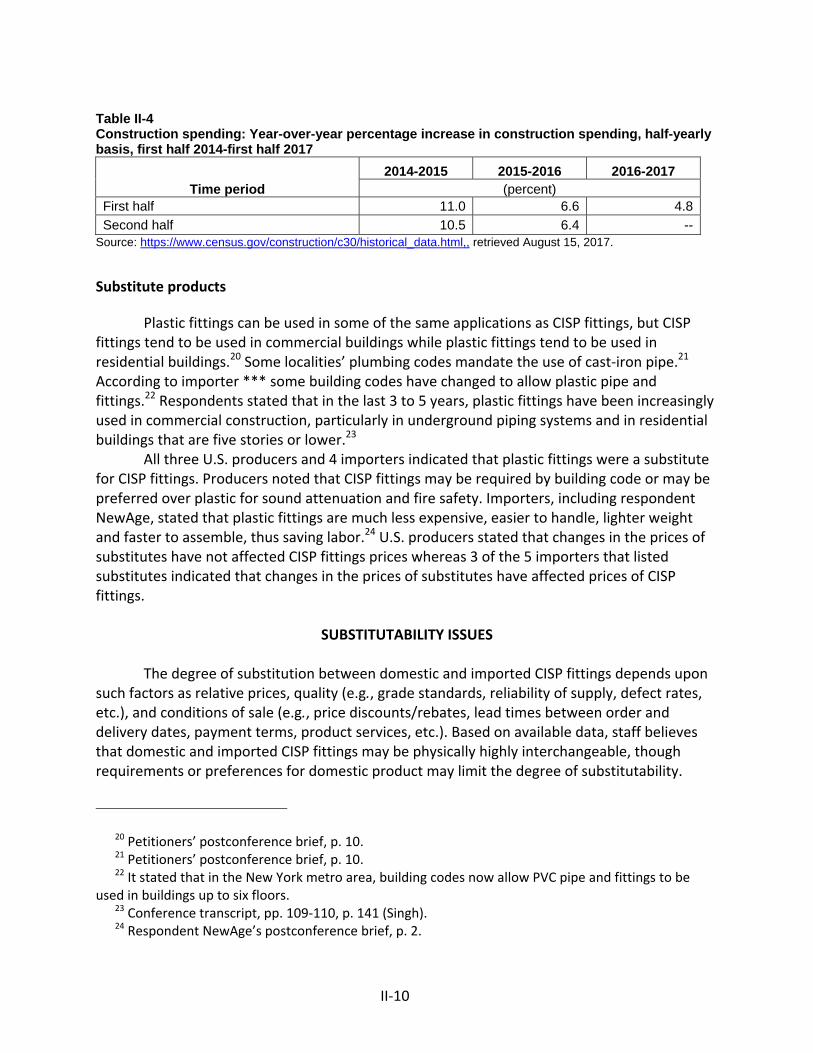
II‐10
Table II-4 Construction spending: Year-over-year percentage increase in construction spending, half-yearly basis, first half 2014-first half 2017
Time period 2014-2015 2015-2016 2016-2017
(percent) First half 11.0 6.6 4.8Second half 10.5 6.4 --
Source: https://www.census.gov/construction/c30/historical_data.html,, retrieved August 15, 2017. Substitute products
Plastic fittings can be used in some of the same applications as CISP fittings, but CISP fittings tend to be used in commercial buildings while plastic fittings tend to be used in residential buildings.20 Some localities’ plumbing codes mandate the use of cast‐iron pipe.21 According to importer *** some building codes have changed to allow plastic pipe and fittings.22 Respondents stated that in the last 3 to 5 years, plastic fittings have been increasingly used in commercial construction, particularly in underground piping systems and in residential buildings that are five stories or lower.23
All three U.S. producers and 4 importers indicated that plastic fittings were a substitute for CISP fittings. Producers noted that CISP fittings may be required by building code or may be preferred over plastic for sound attenuation and fire safety. Importers, including respondent NewAge, stated that plastic fittings are much less expensive, easier to handle, lighter weight and faster to assemble, thus saving labor.24 U.S. producers stated that changes in the prices of substitutes have not affected CISP fittings prices whereas 3 of the 5 importers that listed substitutes indicated that changes in the prices of substitutes have affected prices of CISP fittings.
SUBSTITUTABILITY ISSUES
The degree of substitution between domestic and imported CISP fittings depends upon
such factors as relative prices, quality (e.g., grade standards, reliability of supply, defect rates, etc.), and conditions of sale (e.g., price discounts/rebates, lead times between order and delivery dates, payment terms, product services, etc.). Based on available data, staff believes that domestic and imported CISP fittings may be physically highly interchangeable, though requirements or preferences for domestic product may limit the degree of substitutability.
20 Petitioners’ postconference brief, p. 10. 21 Petitioners’ postconference brief, p. 10. 22 It stated that in the New York metro area, building codes now allow PVC pipe and fittings to be
used in buildings up to six floors. 23 Conference transcript, pp. 109‐110, p. 141 (Singh). 24 Respondent NewAge’s postconference brief, p. 2.
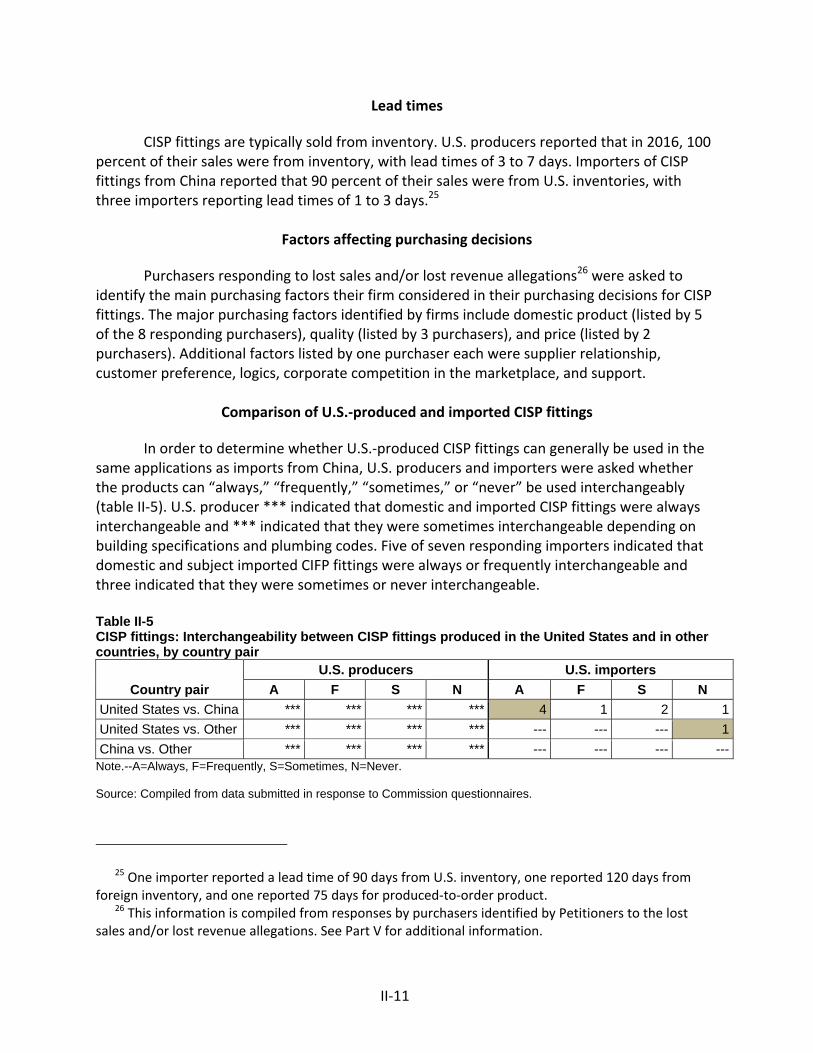
II‐11
Lead times
CISP fittings are typically sold from inventory. U.S. producers reported that in 2016, 100 percent of their sales were from inventory, with lead times of 3 to 7 days. Importers of CISP fittings from China reported that 90 percent of their sales were from U.S. inventories, with three importers reporting lead times of 1 to 3 days.25
Factors affecting purchasing decisions
Purchasers responding to lost sales and/or lost revenue allegations26 were asked to
identify the main purchasing factors their firm considered in their purchasing decisions for CISP fittings. The major purchasing factors identified by firms include domestic product (listed by 5 of the 8 responding purchasers), quality (listed by 3 purchasers), and price (listed by 2 purchasers). Additional factors listed by one purchaser each were supplier relationship, customer preference, logics, corporate competition in the marketplace, and support.
Comparison of U.S.‐produced and imported CISP fittings
In order to determine whether U.S.‐produced CISP fittings can generally be used in the
same applications as imports from China, U.S. producers and importers were asked whether the products can “always,” “frequently,” “sometimes,” or “never” be used interchangeably (table II‐5). U.S. producer *** indicated that domestic and imported CISP fittings were always interchangeable and *** indicated that they were sometimes interchangeable depending on building specifications and plumbing codes. Five of seven responding importers indicated that domestic and subject imported CIFP fittings were always or frequently interchangeable and three indicated that they were sometimes or never interchangeable.
Table II-5 CISP fittings: Interchangeability between CISP fittings produced in the United States and in other countries, by country pair
Country pair U.S. producers U.S. importers
A F S N A F S N United States vs. China *** *** *** *** 4 1 2 1 United States vs. Other *** *** *** *** --- --- --- 1 China vs. Other *** *** *** *** --- --- --- ---
Note.--A=Always, F=Frequently, S=Sometimes, N=Never. Source: Compiled from data submitted in response to Commission questionnaires.
25 One importer reported a lead time of 90 days from U.S. inventory, one reported 120 days from foreign inventory, and one reported 75 days for produced‐to‐order product.
26 This information is compiled from responses by purchasers identified by Petitioners to the lost sales and/or lost revenue allegations. See Part V for additional information.
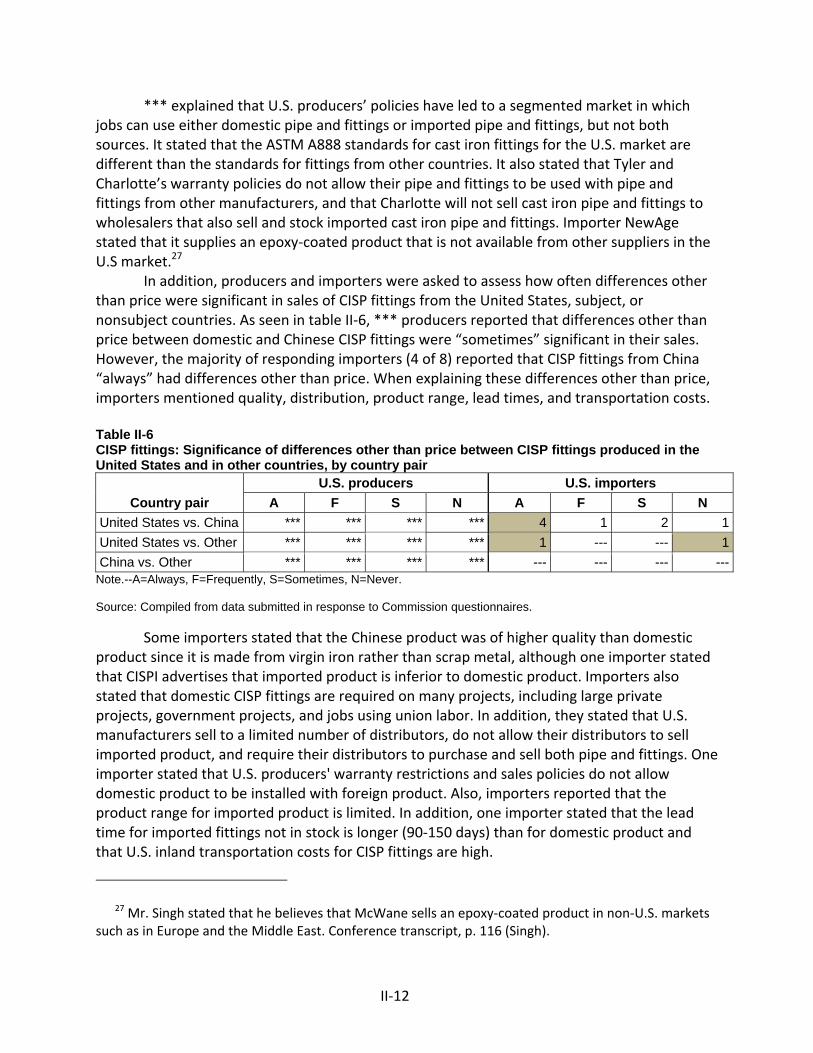
II‐12
*** explained that U.S. producers’ policies have led to a segmented market in which jobs can use either domestic pipe and fittings or imported pipe and fittings, but not both sources. It stated that the ASTM A888 standards for cast iron fittings for the U.S. market are different than the standards for fittings from other countries. It also stated that Tyler and Charlotte’s warranty policies do not allow their pipe and fittings to be used with pipe and fittings from other manufacturers, and that Charlotte will not sell cast iron pipe and fittings to wholesalers that also sell and stock imported cast iron pipe and fittings. Importer NewAge stated that it supplies an epoxy‐coated product that is not available from other suppliers in the U.S market.27
In addition, producers and importers were asked to assess how often differences other than price were significant in sales of CISP fittings from the United States, subject, or nonsubject countries. As seen in table II‐6, *** producers reported that differences other than price between domestic and Chinese CISP fittings were “sometimes” significant in their sales. However, the majority of responding importers (4 of 8) reported that CISP fittings from China “always” had differences other than price. When explaining these differences other than price, importers mentioned quality, distribution, product range, lead times, and transportation costs.
Table II-6 CISP fittings: Significance of differences other than price between CISP fittings produced in the United States and in other countries, by country pair
Country pair U.S. producers U.S. importers
A F S N A F S N United States vs. China *** *** *** *** 4 1 2 1United States vs. Other *** *** *** *** 1 --- --- 1 China vs. Other *** *** *** *** --- --- --- ---
Note.--A=Always, F=Frequently, S=Sometimes, N=Never. Source: Compiled from data submitted in response to Commission questionnaires.
Some importers stated that the Chinese product was of higher quality than domestic product since it is made from virgin iron rather than scrap metal, although one importer stated that CISPI advertises that imported product is inferior to domestic product. Importers also stated that domestic CISP fittings are required on many projects, including large private projects, government projects, and jobs using union labor. In addition, they stated that U.S. manufacturers sell to a limited number of distributors, do not allow their distributors to sell imported product, and require their distributors to purchase and sell both pipe and fittings. One importer stated that U.S. producers' warranty restrictions and sales policies do not allow domestic product to be installed with foreign product. Also, importers reported that the product range for imported product is limited. In addition, one importer stated that the lead time for imported fittings not in stock is longer (90‐150 days) than for domestic product and that U.S. inland transportation costs for CISP fittings are high.
27 Mr. Singh stated that he believes that McWane sells an epoxy‐coated product in non‐U.S. markets such as in Europe and the Middle East. Conference transcript, p. 116 (Singh).

III-1
PART III: U.S. PRODUCERS’ PRODUCTION, SHIPMENTS, AND EMPLOYMENT
The Commission analyzes a number of factors in making injury determinations (see 19 U.S.C. §§ 1677(7)(B) and 1677(7)(C)). Information on the subsidies and dumping margins was presented in Part I of this report and Parts VI and V present the volume of subject imports and pricing of domestic and imported products, respectively. Information on the other factors specified is presented in this section and/or Part VI and (except as noted) is based on the questionnaire responses of three firms that accounted for all U.S. production of CISP fittings during 2016.
U.S. PRODUCERS
The Commission issued a U.S. producer questionnaire to three firms based on
information contained in the petition. All three firms provided usable data on their productive operations. Staff believes that these responses represent all of U.S. production of CISP fittings.
Table III-1 lists U.S. producers of CISP fittings, their production locations, positions on the petition, and shares of total production. Table III-1 CISP fittings: U.S. producers, their positions on the petition, production locations, and shares of reported production, 2016
Firm Position on
petition Production location(s)
Share of production (percent)
AB&I Foundry Support Oakland, CA *** Charlotte Pipe Support Charlotte, NC *** Tyler Pipe Support Tyler, TX ***
Total *** Source: Compiled from data submitted in response to Commission questionnaires.
Table III-2 presents information on U.S. producers’ ownership, related and/or affiliated firms.
Table III-2 CISP fittings: U.S. producers’ ownership, related and/or affiliated firms
* * * * * * *
As indicated in table III-2, *** U.S. producers are related to a foreign producer of CISP
fittings located in *** and *** U.S. producers are related to U.S. importers of the subject merchandise. In addition, as discussed in greater detail below, no U.S. producers directly import CISP fittings and none purchase CISP fittings from U.S. importers.
Table III-3 presents U.S. producers’ reported changes in operations since January 1, 2014.

III-2
Table III-3 CISP fittings: U.S. producers’ reported changes in operations, since January 1, 2014
* * * * * * *
U.S. PRODUCTION, CAPACITY, AND CAPACITY UTILIZATION
Table III-4 and figure III-1 present U.S. producers’ production, capacity, and capacity utilization. Allocated capacity modestly declined during 2014-16 and was somewhat lower between interim 2016/17 periods. Production increased in both 2015 and 2016, and average capacity utilization increased by *** percentage points to *** percent. Capacity utilization stood at *** percent in January to June 2017, compared to *** percent in January to June 2016, reflecting *** fewer short tons produced.1
Table III-4 CISP fittings: U.S. producers’ production, capacity, and capacity utilization, 2014-16, January to June 2016 and January to June 2017
* * * * * * *
Figure III-1 CISP fittings: U.S. producers’ production, capacity, and capacity utilization, 2014-16, January to June 2016 and January to June 2017
* * * * * * *
Alternative products
As shown in table III‐5, *** percent of the CISP fittings produced during 2016 by U.S. producers was of product subject to these investigations. Charlotte and AB&I testified to producing out-of-scope goods, however both acknowledged the preference to produce CISP fittings, citing training costs and profit margins.2
Table III-5 CISP fittings: U.S. producers’ overall plant capacity and production on the same equipment as subject production, 2014-16, January to June 2016 and January to June 2017
* * * * * * *
1 Production reported in the first half of 2016 was *** short tons. Production in the second half of 2016 was *** short tons.
2 Conference transcript, pp. 30-31 (Lowe, Simmons).

III-3
U.S. PRODUCERS’ U.S. SHIPMENTS AND EXPORTS
Table III-6 presents U.S. producers’ U.S. shipments, export shipments, and total shipments. In terms of both quantity and value, total U.S. shipments increased from 2014 to 2016, although the average unit value of total U.S. shipments decreased. Total U.S. shipment quantity increased but value and average unit value were lower in January to June 2017 than in January to June 2016.3 Table III-6 CISP fittings: U.S. producers’ U.S. shipments, exports shipments, and total shipments, 2014-16, January to June 2016 and January to June 2017
* * * * * * *
U.S. PRODUCERS’ INVENTORIES
Table III-7 presents U.S. producers’ end-of-period inventories and the ratio of these inventories to U.S. producers’ production, U.S. shipments, and total shipments. End-of-period inventories consistently represented approximately *** of U.S. production and U.S. shipments. Inventory volume irregularly increased during 2014-16, but declined relative to production and shipments. June inventories were lower in interim 2017 compared to the same period in 2016. Table III-7 CISP fittings: U.S. producers’ inventories, 2014-16, January to June 2016 and January to June 2017
* * * * * * * .
U.S. EMPLOYMENT, WAGES, AND PRODUCTIVITY
Table III-8 presents U.S. producers’ employment-related data. The number of production and related workers (PRWs) producing CISP fittings increased between 2014 and 2016, and was higher in January-June 2017 than in January-June 2016. Hours worked exhibited similar growth, reflecting both the greater number of PRWs and more hours worked per PRW. Wages increased overall, reflecting both the greater number of hours worked and higher hourly wage rates. However, the combination of higher hourly wages and reduced productivity contributed to higher unit labor costs.
3 The average unit value of U.S. shipments in the first half of 2016 was *** and decreased to *** in the second half of 2016, based on total 2016 U.S shipment quantity and value.

III-4
Table III-8 CISP fittings: Average number of production and related workers, hours worked, wages paid to such employees, hourly wages, productivity, and unit labor costs, 2014-16, January to June 2016 and January to June 2017
* * * * * * *

IV-1
PART IV: U.S. IMPORTS, APPARENT U.S. CONSUMPTION, AND MARKET SHARES
U.S. IMPORTERS
The Commission issued importer questionnaires to 47 firms believed to be importers of subject CISP fittings, as well as to all U.S. producers of CISP fittings.1 Usable questionnaire responses were received from nine companies, representing 83.0 percent of U.S. imports from China in 2016 under HTS statistical reporting number 7307.11.0045. Table IV-1 lists all responding U.S. importers of CISP fittings from China, their locations, and their shares of U.S. imports, in 2016.2
Table IV-1 CISP fittings: U.S. importers by source, 2016
Firm Headquarters
Share of imports by source (percent)
China Nonsubject
sources All import sources
B and W Brooklyn, NY *** *** *** Bay Supply San Jose, CA *** *** *** Copperfit Pomona, CA *** *** *** Leo Brooklyn, NY *** *** *** Lino Great Neck, NY *** *** *** Max Supply College Point, NY *** *** *** NewAge Sugar Land, TX *** *** *** Pro San Francisco, CA *** *** *** Wells Chicago, IL *** *** ***
Total *** *** *** Source: Compiled from data submitted in response to Commission questionnaires.
NewAge Casting (“NewAge”) is the *** importer of CISP fittings from China, accounting
for *** percent of all imports of CISP fittings from China by quantity in 2016, *** B and W Plumbing Wholesale, Inc. (“B and W”) and Max Supply, Inc. (“Max Supply”) at *** and *** percent respectively. The top three importers of CISP fittings from China accounted for *** percent of subject imports, according to confidential Customs data. NewAge is a partial owner of two foundries in China, *** and sources exclusively from those two firms.3
1 The Commission issued questionnaires to those firms identified in the petition, along with firms that, based on a review of data provided by U.S. Customs and Border Protection (“Customs”), may have accounted for more than one percent of total imports under HTS subheading 7307.11.0045 in 2016.
2 No responding importer reported imports of CISP fittings from nonsubject sources. 3 ***.
IV-2
U.S. IMPORTS
Table IV-2 and figure IV-1 present data for U.S. imports of CISP fittings from China and all other sources. China was consistently the primary source for imports of CISP fittings, accounting for more than 90 percent of import quantity and value in each full and partial period. The quantity of U.S. imports of CISP fittings from China was 1,032 short tons higher in 2016 (8,360 short tons) than in 2014 (7,328 short tons). U.S. imports from China were equivalent to *** percent of U.S. production in 2016, compared to *** percent in 2014. The value of U.S. imports of CISP fittings from China was $320,000 lower in 2016 than in 2014, reflecting a decline in average unit value from $1,376 per short ton to $1,168 per short ton. The quantity of U.S. imports of CISP fittings from China was 618 short tons lower in January-June 2017 (2,746 short tons) than in January-June 2016 (3,364 short tons). U.S. imports from China were equivalent to *** percent of U.S. production in January-June 2017, compared to *** percent in January-June 2016. The value of U.S. imports of CISP fittings from China was $791,000 lower in January-June 2017 than in January-June 2016, reflecting the lower quantity of imports noted previously as well as a lower average unit value ($1,246 in January-June 2017 compared to $1,253 in January-June 2016).

IV-3
Table IV-2 CISP fittings: U.S. imports by source, 2014-16, January to June 2016, and January to June 2017
Item Calendar year January to June
2014 2015 2016 2016 2017 Quantity (short tons) U.S. imports from.-- China 7,328 5,531 8,360 3,364 2,746
Nonsubject sources 124 166 83 30 49 All import sources 7,452 5,697 8,443 3,394 2,795
Value (1,000 dollars) U.S. imports from.-- China 10,084 7,064 9,764 4,213 3,422
Nonsubject sources 573 493 292 129 171 All import sources 10,657 7,557 10,056 4,342 3,593
Unit value (dollars per short ton) U.S. imports from.-- China 1,376 1,277 1,168 1,253 1,246
Nonsubject sources 4,640 2,975 3,535 4,232 3,471 All import sources 1,430 1,326 1,191 1,279 1,285
Share of quantity (percent) U.S. imports from.-- China 98.3 97.1 99.0 99.1 98.2
Nonsubject sources 1.7 2.9 1.0 0.9 1.8 All import sources 100.0 100.0 100.0 100.0 100.0
Share of value (percent) U.S. imports from.-- China 94.6 93.5 97.1 97.0 95.2
All other sources 5.4 6.5 2.9 3.0 4.8 All import sources 100.0 100.0 100.0 100.0 100.0
Ratio to U.S. production U.S. imports from.-- China *** *** *** *** ***
Nonsubject sources *** *** *** *** *** All import sources *** *** *** *** ***
Source: Official U.S. import statistics for HTS statistical reporting number 7307.11.0045, accessed August 8, 2017.

IV-4
Figure IV-1 CISP fittings: U.S. import volumes and prices, 2014-16, January to June 2016, and January to June 2017
Source: Official U.S. import statistics for HTS statistical reporting number 7307.11.045, accessed August 8, 2017.
NEGLIGIBILITY
The statute requires that an investigation be terminated without an injury determination if imports of the subject merchandise are found to be negligible.4 Negligible imports are generally defined in the Tariff Act of 1930, as amended, as imports from a country of merchandise corresponding to a domestic like product where such imports account for less than 3 percent of the volume of all such merchandise imported into the United States in the most recent 12-month period for which data are available that precedes the filing of the petition or the initiation of the investigation. However, if there are imports of such merchandise from a number of countries subject to investigations initiated on the same day that individually account for less than 3 percent of the total volume of the subject merchandise, and if the imports from those countries collectively account for more than 7 percent of the volume of all such merchandise imported into the United States during the applicable 12-month period, then imports from such countries are deemed not to be negligible.5 As shown in table IV-3, imports from China accounted for 98.7 percent of total imports of CISP fittings by quantity during July 2016 to June 2017.
4 Sections 703(a)(1), 705(b)(1), 733(a)(1), and 735(b)(1) of the Act (19 U.S.C. §§ 1671b(a)(1), 1671d(b)(1), 1673b(a)(1), and 1673d(b)(1)).
5 Section 771 (24) of the Act (19 U.S.C § 1677(24)).

IV-5
Table IV-3 CISP fittings: U.S. imports in the twelve month period preceding the filing of the petition
Item
July 2016 to June 2017
Quantity (short tons)
Share of quantity (percent)
U.S. imports from.-- China 7,743 98.7
Nonsubject sources 101 1.3 All import sources 7,844 100.0
Source: Official U.S. import statistics for HTS statistical reporting number 7307.11.0045, accessed August 8, 2017.
PRESENCE IN THE MARKET
Table IV-4 shows monthly imports. Imports of CISP fittings from China were present in
all 42 months Between January 2014 and June 2017. According to official import statistics, the highest levels of imports from China occurred in November 2016, September 2014, and May 2016. The lowest levels of imports from china occurred in March 2016, April 2017, and May 2015.
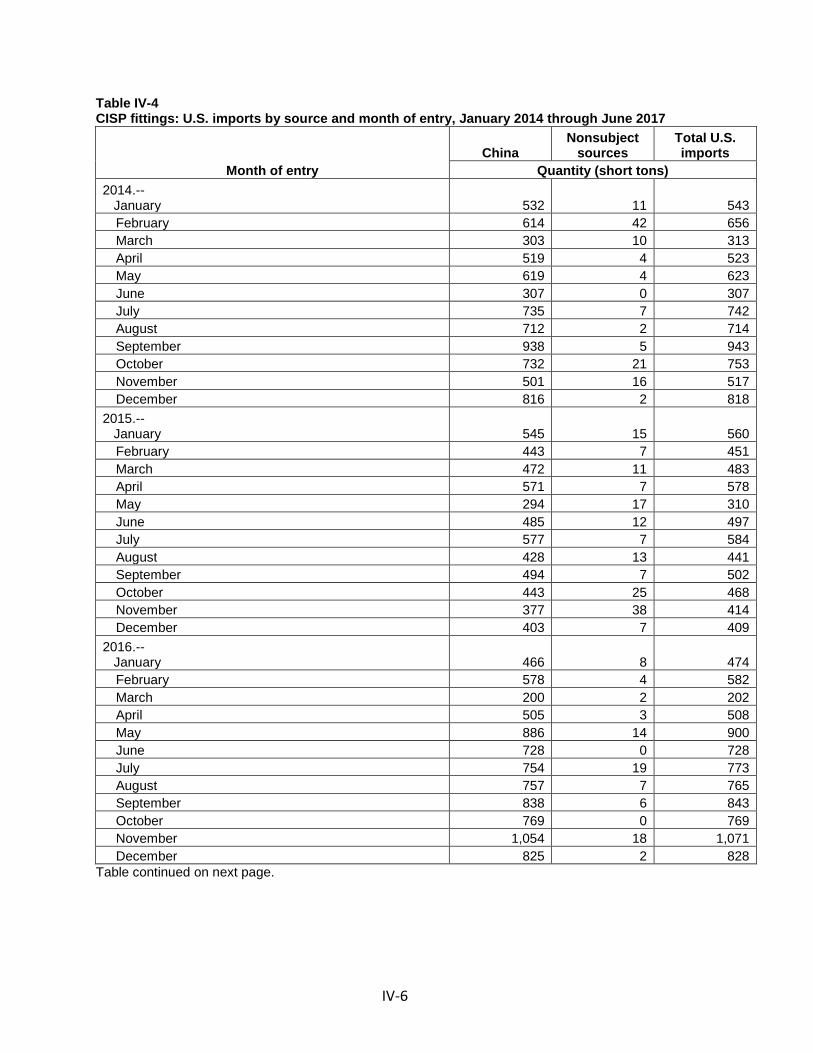
IV-6
Table IV-4 CISP fittings: U.S. imports by source and month of entry, January 2014 through June 2017
Month of entry China
Nonsubject sources
Total U.S. imports
Quantity (short tons) 2014.-- January 532 11 543
February 614 42 656 March 303 10 313 April 519 4 523 May 619 4 623 June 307 0 307 July 735 7 742 August 712 2 714 September 938 5 943 October 732 21 753 November 501 16 517 December 816 2 818
2015.-- January 545 15 560
February 443 7 451 March 472 11 483 April 571 7 578 May 294 17 310 June 485 12 497 July 577 7 584 August 428 13 441 September 494 7 502 October 443 25 468 November 377 38 414 December 403 7 409
2016.-- January 466 8 474
February 578 4 582 March 200 2 202 April 505 3 508 May 886 14 900 June 728 0 728 July 754 19 773 August 757 7 765 September 838 6 843 October 769 0 769 November 1,054 18 1,071 December 825 2 828
Table continued on next page.

IV-7
Table IV-4--Continued CISP fittings: U.S. imports by source and month of entry, January 2014 through June 2017
Month of entry China
Nonsubject sources
Total U.S. imports
Quantity (short tons) 2017.-- January 488 13 501
February 674 3 676 March 315 0 315 April 217 4 221 May 559 2 560 June 495 27 522
Month of entry China
Nonsubject sources
Total U.S. imports
Value (1,000 dollars) 2014.-- January 767 39 805
February 764 115 878 March 363 49 412 April 731 29 760 May 909 23 933 June 462 0 462 July 1,019 74 1,093 August 1,052 8 1,060 September 1,302 43 1,345 October 938 81 1,019 November 599 96 695 December 1,179 17 1,196
2015.-- January 656 43 699
February 547 25 572 March 712 36 748 April 566 26 592 May 397 50 447 June 657 52 709 July 822 27 848 August 592 36 628 September 556 24 580 October 604 31 636 November 430 101 531 December 524 43 567
Table continued on next page.
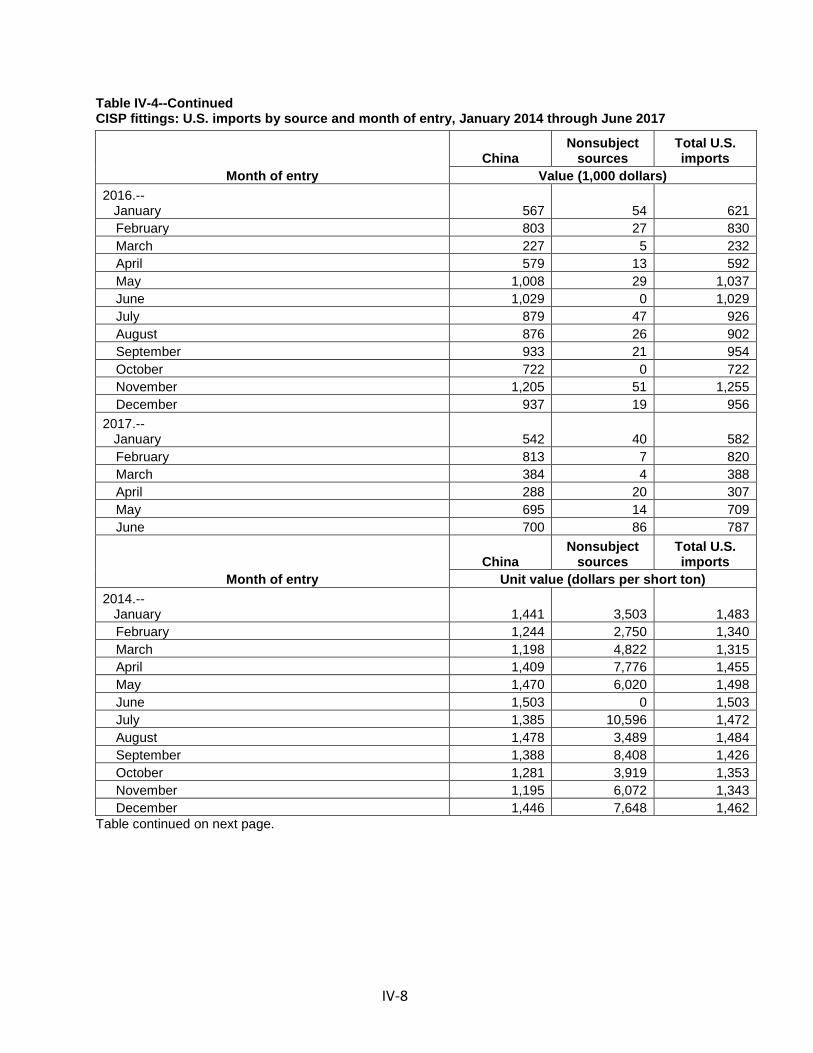
IV-8
Table IV-4--Continued CISP fittings: U.S. imports by source and month of entry, January 2014 through June 2017
Month of entry China
Nonsubject sources
Total U.S. imports
Value (1,000 dollars) 2016.-- January 567 54 621
February 803 27 830 March 227 5 232 April 579 13 592 May 1,008 29 1,037 June 1,029 0 1,029 July 879 47 926 August 876 26 902 September 933 21 954 October 722 0 722 November 1,205 51 1,255 December 937 19 956
2017.-- January 542 40 582
February 813 7 820 March 384 4 388 April 288 20 307 May 695 14 709 June 700 86 787
Month of entry China
Nonsubject sources
Total U.S. imports
Unit value (dollars per short ton) 2014.-- January 1,441 3,503 1,483
February 1,244 2,750 1,340 March 1,198 4,822 1,315 April 1,409 7,776 1,455 May 1,470 6,020 1,498 June 1,503 0 1,503 July 1,385 10,596 1,472 August 1,478 3,489 1,484 September 1,388 8,408 1,426 October 1,281 3,919 1,353 November 1,195 6,072 1,343 December 1,446 7,648 1,462
Table continued on next page.
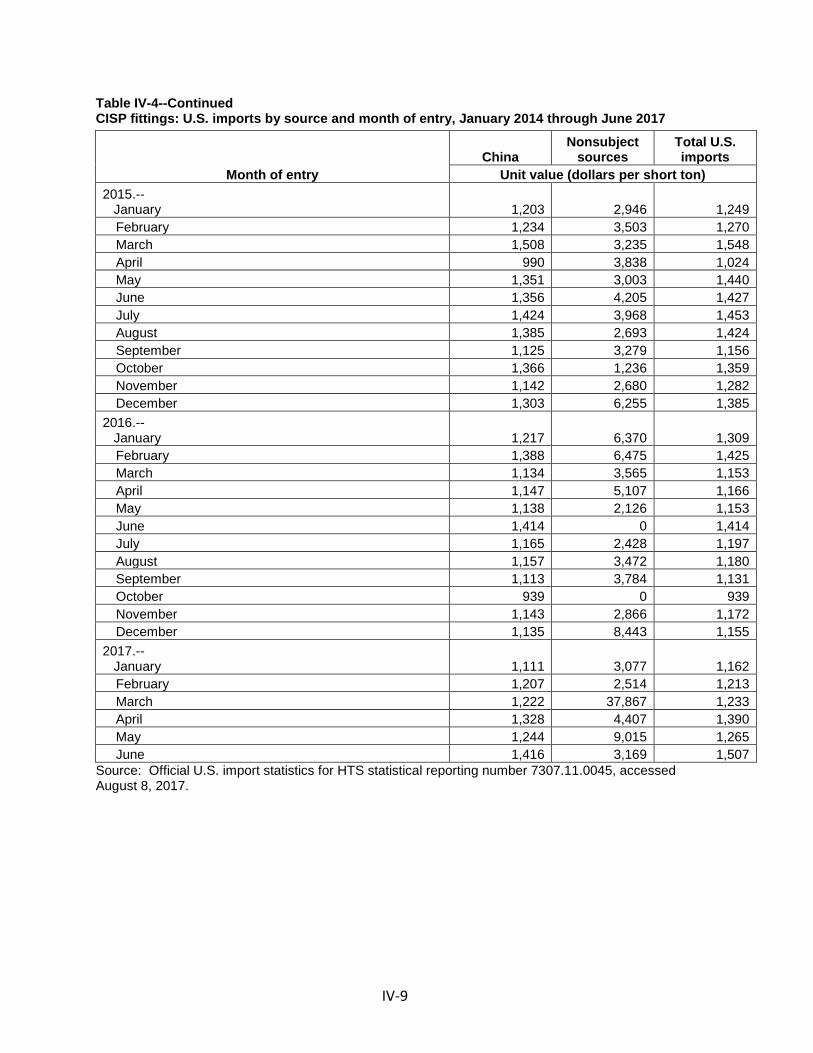
IV-9
Table IV-4--Continued CISP fittings: U.S. imports by source and month of entry, January 2014 through June 2017
Month of entry China
Nonsubject sources
Total U.S. imports
Unit value (dollars per short ton) 2015.-- January 1,203 2,946 1,249
February 1,234 3,503 1,270 March 1,508 3,235 1,548 April 990 3,838 1,024 May 1,351 3,003 1,440 June 1,356 4,205 1,427 July 1,424 3,968 1,453 August 1,385 2,693 1,424 September 1,125 3,279 1,156 October 1,366 1,236 1,359 November 1,142 2,680 1,282 December 1,303 6,255 1,385
2016.-- January 1,217 6,370 1,309
February 1,388 6,475 1,425 March 1,134 3,565 1,153 April 1,147 5,107 1,166 May 1,138 2,126 1,153 June 1,414 0 1,414 July 1,165 2,428 1,197 August 1,157 3,472 1,180 September 1,113 3,784 1,131 October 939 0 939 November 1,143 2,866 1,172 December 1,135 8,443 1,155
2017.-- January 1,111 3,077 1,162
February 1,207 2,514 1,213 March 1,222 37,867 1,233 April 1,328 4,407 1,390 May 1,244 9,015 1,265 June 1,416 3,169 1,507
Source: Official U.S. import statistics for HTS statistical reporting number 7307.11.0045, accessed August 8, 2017.

IV-10
GEOGRAPHICAL MARKETS
Tables IV-5 and IV-6present import entries by region and customs district. In 2016, 44.8
percent of U.S. imports of CISP fittings entered through Los Angeles, California and 40.3 percent of U.S. imports of CISP fittings entered through New York, NY. While the top two districts of entry accounted for 85.1 percent of U.S. imports of CISP fittings, subject imports also entered through San Francisco, California; Houston-Galveston, Texas; Chicago, Illinois; Philadelphia, Pennsylvania; Ogdensburg, New York; Charlotte, North Carolina; Mobile, Alabama; and Cleveland, Ohio.
Table IV-5 CISP fittings: U.S. imports by border of entry, 2016
Item Calendar year 2016
East North South West Total Quantity (short tons)
U.S. imports from.-- China 3,417 143 231 4,570 8,360
Nonsubject sources 0 82 --- --- 83 All import sources 3,417 225 231 4,570 8,443
Share across (percent) U.S. imports from.-- China 40.9 1.7 2.8 54.7 100.0
Nonsubject sources 0.2 99.8 --- --- 100.0 All import sources 40.5 2.7 2.7 54.1 100.0
Share down (percent) U.S. imports from.-- China 100.0 63.4 100.0 100.0 99.0
Nonsubject sources 0.0 36.6 --- --- 1.0 All import sources 100.0 100.0 100.0 100.0 100.0
Note-- Border of entry is defined by Customs and depicts geographic region. For imports of CISP fittings, East consists of Boston, Massachusetts; Buffalo, New York; Charlotte, North Carolina; New York, New York; Ogdensburg, New York; Philadelphia, Pennsylvania; and St. Albans, Vermont. North consists of Chicago, Illinois; Cleveland, Ohio; and Detroit, Michigan. South consists of Houston-Galveston, Texas; Mobile, Alabama; and New Orleans, Louisiana. West consists of Los Angeles, California and San Francisco, California.
Source: Official U.S. import statistics for HTS statistical reporting number 7307.11.0045, accessed August 8, 2017.
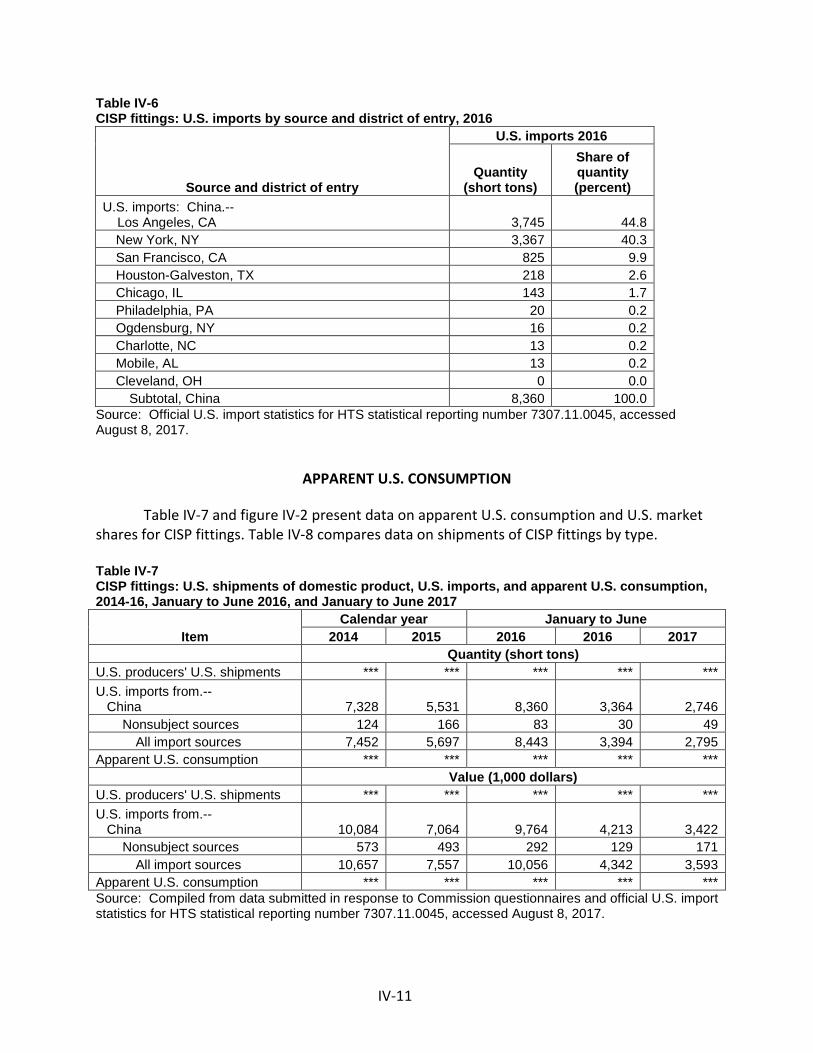
IV-11
Table IV-6 CISP fittings: U.S. imports by source and district of entry, 2016
Source and district of entry
U.S. imports 2016
Quantity (short tons)
Share of quantity (percent)
U.S. imports: China.-- Los Angeles, CA 3,745 44.8
New York, NY 3,367 40.3 San Francisco, CA 825 9.9 Houston-Galveston, TX 218 2.6 Chicago, IL 143 1.7 Philadelphia, PA 20 0.2 Ogdensburg, NY 16 0.2 Charlotte, NC 13 0.2 Mobile, AL 13 0.2 Cleveland, OH 0 0.0
Subtotal, China 8,360 100.0 Source: Official U.S. import statistics for HTS statistical reporting number 7307.11.0045, accessed August 8, 2017.
APPARENT U.S. CONSUMPTION
Table IV-7 and figure IV-2 present data on apparent U.S. consumption and U.S. market shares for CISP fittings. Table IV-8 compares data on shipments of CISP fittings by type. Table IV-7 CISP fittings: U.S. shipments of domestic product, U.S. imports, and apparent U.S. consumption, 2014-16, January to June 2016, and January to June 2017
Item Calendar year January to June
2014 2015 2016 2016 2017 Quantity (short tons) U.S. producers' U.S. shipments *** *** *** *** *** U.S. imports from.-- China 7,328 5,531 8,360 3,364 2,746
Nonsubject sources 124 166 83 30 49 All import sources 7,452 5,697 8,443 3,394 2,795
Apparent U.S. consumption *** *** *** *** *** Value (1,000 dollars) U.S. producers' U.S. shipments *** *** *** *** *** U.S. imports from.-- China 10,084 7,064 9,764 4,213 3,422
Nonsubject sources 573 493 292 129 171 All import sources 10,657 7,557 10,056 4,342 3,593
Apparent U.S. consumption *** *** *** *** *** Source: Compiled from data submitted in response to Commission questionnaires and official U.S. import statistics for HTS statistical reporting number 7307.11.0045, accessed August 8, 2017.
IV-12
Figure IV-2 CISP fittings: Apparent U.S. consumption, 2014-16, January to June 2016, and January to June 2017
* * * * * * *
Table IV-8 CISP fittings: U.S. producers and U.S. importers’ U.S. shipments, by type, 2016
* * * * * * *
U.S. MARKET SHARES
U.S. market share data are presented in table IV-9. The share of U.S. imports from China by quantity increased from *** percent in 2014 to *** percent in 2016 while the share of value of U.S. imports of CISP fittings from China decreased from *** percent in 2014 to *** percent in 2016. The share of U.S. imports from China by quantity dropped *** percentage points from *** percent in interim 2016 points to *** percent in January to June 2017. Share of value also dropped from *** percent in interim 2016 to *** percent in 2017. Table IV-9 CISP fittings: U.S. consumption and market shares, 2014-16, January to June 2016, and January to June 2017
* * * * * * *
V‐1
PART V: PRICING DATA
FACTORS AFFECTING PRICES
Raw material costs
CISP fittings primarily consist of cast iron molded to the desired shape. Raw material costs represent a not insubstantial component of CISP fittings costs, especially the cost of the scrap iron, although they do not account for a majority of the cost of CISP fitting production. The share of raw materials of the costs of goods sold for CISP fittings decreased from *** in 2014 to *** in 2016. In the first six months of 2017, this ratio was *** percent.
For domestic producers, the main two types of scrap iron used in producing CISP fittings are cupola cast iron scrap (*** percent) and shredded iron scrap (*** percent).1 In contrast, the main raw material used in China to manufacture CISP fittings is pig iron.2 Trends in relevant scrap iron prices are summarized in figure V‐1. U.S. producer Charlotte reported that raw material prices decreased until about December 2015 and then started to increase.3 This is consistent with published prices of scrap and pig iron, which declined in 2014 and 2015 and have trended upwards in 2016 and the first half of 2017.
Figure V-1 Raw material costs: Prices of cupola cast scrap, shredded auto scrap, and pig iron, monthly, January 2014-June 2017
* * * * * * *
In addition to the cost of the iron, energy is also a large input cost. Foundry coke is used
to heat the furnaces, but electricity and natural gas are used as well.4 Since cupola furnaces need to remain burning, these costs can be high. Trends in energy costs are shown in figures V‐2 and V‐3. Producers included these costs in “other factory costs.” Petitioners also noted that environmental and safety costs are large.5 “Other factory costs” as a share of the cost of goods sold increased from *** percent in 2014 to *** percent in 2016. In the first six months of 2017, this ratio was *** percent.
1 Telephone interview with ***. 2 Conference transcript, pp. 60‐61 (Simmons). 3 Conference transcript, pp. 67‐68 (Simmons). 4 AB&I noted that its electricity and natural gas costs in California are much higher than Tyler’s costs
in Texas. Conference transcript, p. 32 (Lowe). 5 Conference transcript, p. 20 (Dowd), p. 35 (Lowe, Simmons), p. 76 (Simmons), and p. 77 (Lowe).

V‐2
Figure V-2 Energy costs: Foundry coke prices, quarterly, January 2014-March 2017
Source: Energy Information Administration, www.eia.gov/coal/production/quarterly/. Figure V-3 Energy costs: Industrial natural gas and electricity prices, monthly, January 2014-June 2017
Source: Energy Information Administration, www.eia.gov, retrieved August 1, 2017.
V‐3
Transportation costs to the U.S. market
Transportation costs to the U.S. market were 9.3 percent6 for CISP fittings imported from China in 2016.
U.S. inland transportation costs
*** U.S. producers and 8 of 9 importers reported that they typically arrange
transportation to their customers. U.S. producers reported that their U.S. inland transportation costs ranged from *** to *** percent. Five importers reported transportation costs of 3 to 5 percent, and one importer each reported 8, 19, and 25 percent. AB&I ships its product by truck, as does Charlotte for its customers on the East Coast.7 For its customers in the western United States, Charlotte ships some product by rail to its storage facility in Utah for further distribution by truck.
PRICING PRACTICES
Pricing methods
As presented in table V‐1, U.S. producers used both transaction‐by‐transaction
negotiation and contracts, while responding importers sold CISP fittings primarily on an adjusted price list basis. CISP fittings are typically sold as part of a bundle of CISP products that contain CISP pipe, fittings, couplings, and other pieces. CISP fittings represent approximately 20‐22 percent of the total tonnage of CISP orders.8 The primary method of price setting in the CISP industry – for both pipe and fittings – is via a set price list adjusted by a multiplier that is set depending on the region in which the CISP is sold.9 These multipliers are negotiable with purchasers.10
6 Transportation costs were determined by comparing the c.i.f. value of imports to the Customs value of imports for HTS code 7307.11.0045, using values from 2016.
7 Conference transcript, p. 33 (Lowe, Waugaman). 8 Conference transcript, pp. 60‐61 (Waugaman). 9 U.S. producers stated that their list prices increased in 2014 and in January 2015, by about 3 to 5
percent. Conference transcript pp. 66‐68 (Dowd, Lowe, Waugaman). Importer NewAge stated that it tried to raise prices in 2016 and 2017 by issuing new price lists but that it was unable to do so because domestic producers had not raised prices since 2015. Conference transcript, p. 101 (Singh).
The price list multiplier varies by region and is much lower in the West Coast than in other regions, and the multipliers for most of the country have gone down since 2014. Conference transcript, pp. 69‐70 (Lowe, Waugaman).
10 Conference transcript, p. 70 (Lowe, Waugaman).
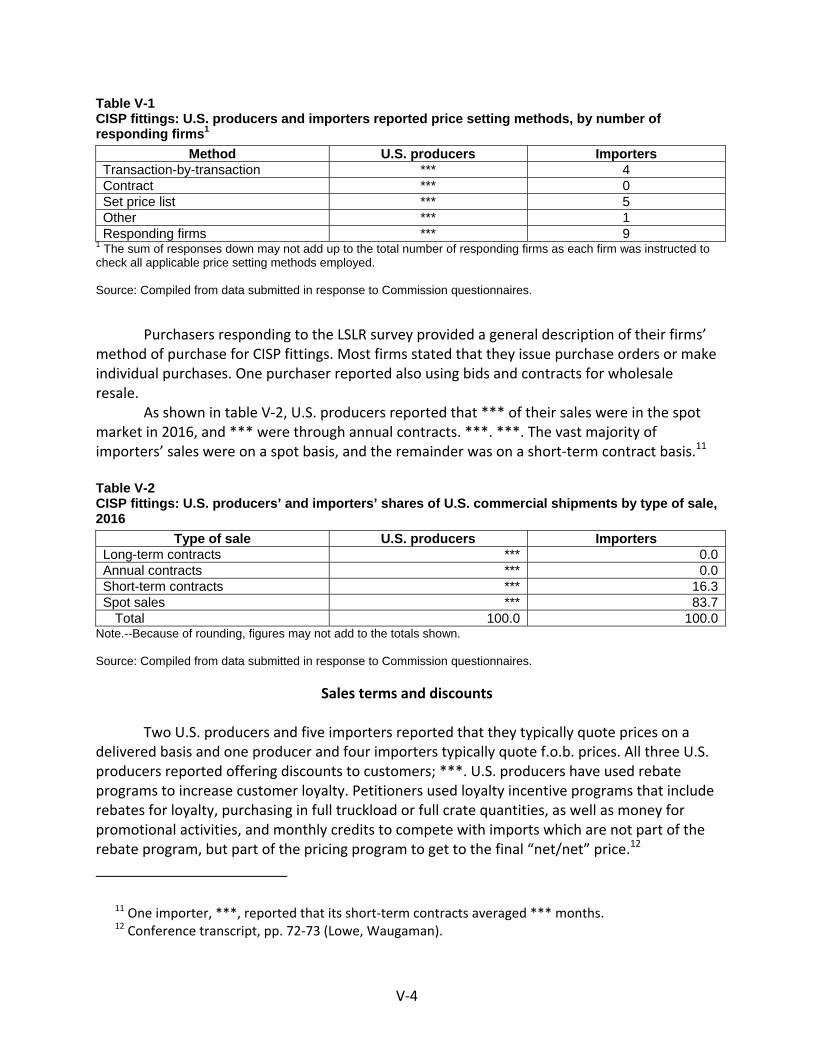
V‐4
Table V-1 CISP fittings: U.S. producers and importers reported price setting methods, by number of responding firms1
Method U.S. producers Importers Transaction-by-transaction *** 4 Contract *** 0 Set price list *** 5 Other *** 1 Responding firms *** 9
1 The sum of responses down may not add up to the total number of responding firms as each firm was instructed to check all applicable price setting methods employed. Source: Compiled from data submitted in response to Commission questionnaires.
Purchasers responding to the LSLR survey provided a general description of their firms’ method of purchase for CISP fittings. Most firms stated that they issue purchase orders or make individual purchases. One purchaser reported also using bids and contracts for wholesale resale.
As shown in table V‐2, U.S. producers reported that *** of their sales were in the spot market in 2016, and *** were through annual contracts. ***. ***. The vast majority of importers’ sales were on a spot basis, and the remainder was on a short‐term contract basis.11
Table V-2 CISP fittings: U.S. producers’ and importers’ shares of U.S. commercial shipments by type of sale, 2016
Type of sale U.S. producers Importers Long-term contracts *** 0.0Annual contracts *** 0.0Short-term contracts *** 16.3Spot sales *** 83.7
Total 100.0 100.0Note.--Because of rounding, figures may not add to the totals shown. Source: Compiled from data submitted in response to Commission questionnaires.
Sales terms and discounts
Two U.S. producers and five importers reported that they typically quote prices on a delivered basis and one producer and four importers typically quote f.o.b. prices. All three U.S. producers reported offering discounts to customers; ***. U.S. producers have used rebate programs to increase customer loyalty. Petitioners used loyalty incentive programs that include rebates for loyalty, purchasing in full truckload or full crate quantities, as well as money for promotional activities, and monthly credits to compete with imports which are not part of the rebate program, but part of the pricing program to get to the final “net/net” price.12
11 One importer, ***, reported that its short‐term contracts averaged *** months. 12 Conference transcript, pp. 72‐73 (Lowe, Waugaman).

V‐5
Among importers, five reported some type of discount policy, including quantity discounts (3 firms), total volume discounts (2 firms), and other discounts (2 firms), and four reported no discount policy. Importer ***.
All three U.S. producers reported sales terms of 3/10 net 30 days. Five importers reported sales terms of net 30 days, three reported 2/10 net 30 days, and four reported requiring cash on delivery or other terms.
PRICE DATA
The Commission requested U.S. producers and importers to provide quarterly data for
the total quantity and f.o.b. value net of all rebates of the following CISP fittings products shipped to unrelated U.S. customers during January 2014 to June 2017.
Product 1.‐‐ 2” no hub, ¼ bend cast iron soil pipe fitting
Product 2.‐‐ 2” no hub, 1/8 bend cast iron soil pipe fitting
Product 3.‐‐ 2” no hub, sanitary Tee cast iron soil pipe fitting
Product 4.‐‐ 4” no hub, 1/8 bend cast iron soil pipe fitting
All three U.S. producers and seven importers provided usable pricing data for sales of the requested products, although not all firms reported pricing for all products for all quarters.13 Pricing data reported by these firms accounted for approximately 15.9 percent of U.S. producers’ shipments of CISP fittings and 21.5 percent of U.S. shipments of subject imports from China in 2016. Price data for products 1‐4 are presented in tables V‐3 to V‐6, and figures V‐4 to V‐7.
13 Per‐unit pricing data are calculated from total quantity and total value data provided by U.S. producers and importers. The precision and variation of these figures may be affected by rounding, limited quantities, and producer or importer estimates.

V‐6
Table V-3 CISP fittings: Weighted-average f.o.b. prices and quantities of domestic and imported product 1 and margins of underselling/(overselling), by quarters, January 2014-June 2017
* * * * * * * Table V-4 CISP fittings: Weighted-average f.o.b. prices and quantities of domestic and imported product 2 and margins of underselling/(overselling), by quarters, January 2014-June 2017
* * * * * * * Table V-5 CISP fittings: Weighted-average f.o.b. prices and quantities of domestic and imported product 3
and margins of underselling/(overselling), by quarters, January 2014-June 2017
* * * * * * * Table V-6 CISP fittings: Weighted-average f.o.b. prices and quantities of domestic and imported product 4
and margins of underselling/(overselling), by quarters, January 2014-June 2017
* * * * * * * Figure V-4 CISP fittings: Weighted-average prices and quantities of domestic and imported product 1, by quarters, January 2014-June 2017
* * * * * * *
Figure V-5 CISP fittings: Weighted-average prices and quantities of domestic and imported product 2, by quarters, January 2014-June 2017
* * * * * * * Figure V-6 CISP fittings: Weighted-average prices and quantities of domestic and imported product 3, by quarters, January 2014-June 2017
* * * * * * * Figure V-7 CISP fittings: Weighted-average prices and quantities of domestic and imported product 4, by quarters, January 2014-June 2017
* * * * * * *

V‐7
Price trends
Domestic prices decreased during January 2014‐June 2017. Table V‐7 summarizes the price trends, by country and by product. Domestic prices decreased by *** to *** percent during January 2014‐June 2017. Prices of subject imported products 1, 2, and 4, increased by 1.3 to 12.0 percent, while prices of subject imported product 4 declined by *** percent. Domestic prices decreased in 37 of 52 available quarters across all four products, whereas prices for imported Chinese CISP fittings decreased in only 22 of 52 available quarters. Domestic prices typically moved in the same direction (positive/negative), and with similar magnitudes across the four products, but this was prices for imported Chinese CISP fittings did not display the same pattern.
Table V-7 CISP fittings: Summary of weighted-average f.o.b. prices for products 1-4 from the United States and China
* * * * * * *
Price comparisons
As shown in table V‐8, prices for CISP fittings imported from China were below those for U.S.‐produced product in all 56 instances (3,983 short tons). Margins of underselling ranged from 22.1 to 50.1 percent, averaging 37.2 percent, and have been decreasing since 2014 due to decreasing domestic prices combined with relatively level prices of CISP fittings from China. Table V-8 CISP fittings: Instances of underselling and the range and average of margins, by year and by product, January 2014-June 2017
* * * * * * *
LOST SALES AND LOST REVENUE
The Commission requested U.S. producers of CISP fittings to report purchasers where they experienced instances of lost sales or revenue due to competition from imports of CISP fittings from China since January 1, 2014. Of the three responding U.S. producers, *** reported reducing prices, and *** reported rolling back announced price increases. *** U.S. producers reported lost sales.
The Commission requested U.S. producers to submit allegations of lost sales and lost revenue. *** submitted lost sale and lost revenue allegations, identifying 78 lost sales

V‐8
allegations and 25 lost revenue allegations.14 The timeframe for the allegations ranged from 2014 to 2017, and the method of sale was not listed.
Staff contacted 35 purchasers and received responses from eight. Responding purchasers reported purchasing *** short tons of CISP fittings 2016 (table V‐9). All eight responding purchasers reported purchasing domestic product during January 2014‐June 2017, two reported purchasing product imported from China, and none reported purchasing product imported from other countries.
Table V-9 CISP fittings: Purchasers’ responses to purchasing patterns
* * * * * * * Of the eight responding purchasers, one reported decreasing purchases from domestic
producers, three reported increasing purchases, and four reported no change (table V‐10). Of the two firms that purchased Chinese product since 2014, *** reported that it decreased its purchases from China, as it switched exclusively to domestic product, whereas *** reported an increase in purchases from China, noting multiple reasons for that decision, and explaining that “The domestic manufacturers do not offer certain products to the USA. They seem to offer the products internationally but not in the USA.”15
Table V-10 CISP fittings: Purchasers’ responses to purchasing subject imports instead of domestic product
* * * * * * *
Of the eight responding purchasers, five reported that U.S. producers had reduced prices in order to compete with lower‐priced imports from China, one reported that U.S. producers did not do so, and one reported that it did not know (table V‐11). Two purchasers that responded affirmatively reported that the estimated price reduction was about 10 percent, one reported it was 32 percent, and one reported a 60‐percent price reduction.
Table V-11 CISP fittings: Purchasers’ responses to U.S. producer price reductions
* * * * * * *
14 ***. The vast majority of the lost sales allegations involved specific projects such as a school or hospital, and did not list contact information for the purchaser.
15 Email from ***.
V‐9
Three purchasers provided additional information on purchases and market dynamics. *** stated that it only purchases domestic product because it had a “very bad experience” purchasing imports many years ago, and that it prefers to stay with quality vendors and not to mix vendor products. *** stated that it purchases only domestic product because of the quality of the product and better liability. *** stated that the reason it purchases only domestic product is that most of its customers have a “domestic‐only” requirement. It also stated that there are certain products that U.S. producers sell internationally but not in the U.S. market (i.e., epoxy‐coated iron).


VI‐1
PART VI: FINANCIAL EXPERIENCE OF U.S. PRODUCERS
INTRODUCTION
Three U.S. producers (AB&I, Charlotte, and Tyler) provided financial data on their operations on cast iron soil pipe (CISP) fittings. *** accounted for the majority of total net sales value in 2016 (*** percent), followed by *** (*** percent) and *** (*** percent).1 All U.S. producers reported a fiscal year end of December 31 and reported their financial data based on U.S. generally accepted accounting principles.
OPERATIONS ON CAST IRON SOIL PIPE FITTINGS
Table VI‐1 presents aggregated data on U.S. producers’ operations in relation to CISP fittings. Table VI‐2 shows the changes in average unit values of select financial indicators. Table VI‐3 presents selected company‐specific financial data. Commercial sales accounted for the large majority of net sales during each full and partial period during 2014‐2016 and interim 2016/2017. The remainder were transfers to related firms by ***.
Net sales
The net sales value of CISP fittings consisted of commercial sales (*** percent) and
transfers to related firms (*** percent) in 2016. As shown in table VI‐1, the quantity and value of net sales increased from 2014 to 2016. The net sales quantity was higher whereas the net sales value was lower in January‐June 2017 compared to January‐June 2016. As shown in table VI‐3, ***.
From 2014 to 2016, the average unit net sales value decreased from $*** (in 2014) to $*** (in 2016) and was lower in January‐June 2017 compared to January‐June 2016. As shown in table VI‐3, ***.
1 ABI and Tyler are owned by the same parent company, McWane, Inc. ***. U.S. producers’ questionnaires response of ***, question II‐11.
VI‐2
Table VI-1 Cast iron soil pipe fittings: Results of operations of U.S. producers, 2014-16, January to June 2016, and January to June 2017
* * * * * * * Table VI-2 Cast iron soil pipe fittings: Changes in AUVs, between fiscal years and between partial year periods
* * * * * * * Table VI-3 Cast iron soil pipe fittings: Select results of operations of U.S. producers, by company, 2014-16, January to June 2016, and January to June 2017
* * * * * * *
Cost of goods sold and gross profit or (loss)
As shown in table VI‐1, the average cost of goods sold (COGS) to net sales ratio moved within a relatively narrow range, increasing from *** percent in 2014 to *** percent in 2015 before decreasing to *** percent in 2016. Average COGS was higher at *** percent in January‐June 2017 compared to *** percent in January‐June 2016. On a company‐specific basis, ***.
COGS are comprised of raw material, direct labor, and other factory costs (“OFC”). OFC represented the largest component of COGS, accounting for between *** percent in January‐June 2017 and *** percent in 2016. As shown in table VI‐3, average unit OFC moved within a relatively narrow range from 2014 to 2016 but was higher in January‐June 2017 compared to January‐June 2016. ***.2
Raw material accounted for between *** percent in 2016 and January‐June 2016 and *** percent in 2014 of COGS whereas direct labor accounted for between *** percent in 2014 and *** percent in January‐June 2017. As shown in table VI‐3, the average unit raw material cost decreased from 2014 to 2016 and was higher in January‐June 2017 compared to January‐June 2016. *** reported decreasing unit raw material costs from 2014 to 2016 and higher unit raw material costs in January‐June 2017 compared to January‐June 2016. The average unit direct labor cost increased from 2014 to 2016 and was higher in January‐June 2017 compared to January‐June 2016. ***.3 4
2 ***. Email from ***, August 6, 2017. ***. Email from ***, August 5, 2017. 3 ***. Email from ***, August 18, 2017. 4 ***. Email from ***, August 21, 2017.

VI‐3
The industry’s gross profit increased by *** percent from $*** in 2014 to $*** in 2016.
The increase in total net sales value was greater than the increase in COGS from 2014 to 2016. Gross profit was lower by *** percent from $*** in January‐June 2016 to $*** in January‐June 2017 as COGS was higher, and total net sales value was lower, comparing the interim periods. On a company‐specific basis, ***.
SG&A expenses and operating income or (loss)
As shown in table VI‐1, the industry’s SG&A expense ratio (i.e., total SG&A expenses divided by total net sales value) moved within a relatively narrow range from *** percent in January‐June 2016 to *** percent in 2015 and 2016. ***.5
The industry’s operating income decreased from $*** in 2014 to $*** in 2015 before increasing to $*** in 2016. Operating income was $*** in January‐June 2017 compared to $*** in January‐June 2016. On a company‐specific basis, ***.
Other expenses and net income or (loss)
Classified below the operating income levels are other expense and other income, which are usually allocated to the product line from high levels in the corporation. Other expenses increased from $*** in 2014 to $*** in 2016 and were higher in January‐June 2017 compared to January‐June 2016. The increase in 2016 is mainly attributable to ***.6
Other income increased from $*** in 2014 to $*** in 2015, before decreasing to $*** in 2016 and was higher in January‐June 2017 compared to January‐June 2016. The increase in 2015 is mainly attributable to ***.7
By definition, items classified at this level in the income statement only affect net income or (loss). Net income increased from $*** in 2014 to $*** in 2015 before decreasing to $*** in 2016. Net income was lower at $*** in January‐June 2017 compared to $*** in January‐June 2016.
5 Email from ***, August 15, 2017. 6 ***. U.S. producers’ questionnaire response of ***, question III‐10. According to Court documents,
an antitrust agreement was reached whereby a total $30 million was ordered as settlement on November 29, 2016, Order and final judgement, retrieved August 11, 2017. According to petitioners’ postconference brief, *** Petitioners’ postconference brief, footnote 11, p. 6.
7 U.S. producers’ questionnaire response of ***, question III‐10.

VI‐4
Variance analysis
The variance analysis presented in table VI‐4 is based on the data in table VI‐1.8 The analysis shows that the operating income increased from 2014 to 2016 because ***. Between the comparable interim periods, the lower operating income in January‐June 2017 is primarily attributable to ***. Table VI-4 Cast iron soil pipe fittings: Variance analysis for U.S. producers, between fiscal years and between partial year periods
* * * * * * *
CAPITAL EXPENDITURES AND RESEARCH AND DEVELOPMENT EXPENSES
Table VI‐5 presents capital expenditures and research and development (“R&D”) expenses by firm. Capital expenditures decreased from $*** in 2014 to $*** in 2015 before increasing to $*** in 2016 and were lower in January‐June 2017 compared to January‐June 2016. As shown in table VI‐5, ***.9 ***.10 ***.11
R&D expenses increased from 2014 to 2016 and decreased to zero in January‐June 2017 compared to January‐June 2016. ***.12 ***.
Table VI-5 Cast iron soil pipe fittings: Capital expenditures and research and development expenses for U.S. producers, by firm, 2014-16, January to June 2016, and January to June 2017
* * * * * * *
8 The Commission’s variance analysis is calculated in three parts: sales variance, cost of sales variance (COGS variance), and SG&A expense variance. Each part consists of a price variance (in the case of the sales variance) or a cost variance (in the case of the COGS and SG&A expense variance), and a volume variance. The sales or cost variance is calculated as the change in unit price or unit cost/expense times the new volume, while the volume variance is calculated as the change in volume times the old unit price or unit cost. Summarized at the bottom of the table, the price variance is from sales; the cost/expense variance is the sum of those items from COGS and SG&A expense variances, respectively, and the volume variance is the sum of the volume components of the net sales, COGS, and SG&A expense variances.
9 U.S. producers’ questionnaire response of ***, question III‐13. Email from ***, August 11, 2017. 10 U.S. producers’ questionnaire response of ***, question III‐13. 11 U.S. producers’ questionnaire response of ***, question III‐13. 12 U.S. producers’ questionnaire response of ***, question III‐13.

VI‐5
ASSETS AND RETURN ON ASSETS
Table VI‐6 presents data on the U.S. producers’ total assets and their operating return on assets.13 Total assets increased irregularly from $*** in 2014 to $*** in 2016. The return on assets increased from *** percent in 2014 to *** percent in 2016. ***.14 ***.15 ***.16
Table VI-6 Cast iron soil pipe fittings: Value of assets used in production, warehousing, and sales, and return on assets for U.S. producers by firm, 2014-16
* * * * * * *
CAPITAL AND INVESTMENT
The Commission requested U.S. producers of CISP fittings to describe actual or potential negative effects of imports of CISP fittings from the subject countries on their firms’ growth, investment, ability to raise capital, development and production efforts, or on the scale of capital investments. Table VI‐7 presents U.S. producers’ responses in a tabulated format and table VI‐8 provides the narrative responses.
Table VI-7 Cast iron soil pipe fittings: Actual and anticipated negative effects of imports on investment and growth and development
* * * * * * * Table VI-8 Cast iron soil pipe fittings: Narratives relating to actual and anticipated negative effects of imports on investment and growth and development, since January 1, 2014
* * * * * * *
13 With respect to a company’s overall operations, staff notes that a total asset value (i.e., the bottom line number on the asset side of a company’s balance sheet) reflects an aggregation of a number of assets which are generally not product specific. Accordingly, high‐level allocation factors were required in order to report a total asset value for cast iron soil pipe fittings.
14 U.S. producers’ questionnaires response of ***, question II‐12. See earlier discussion in the capital expenditures and R&D expenses section.
15 U.S. producers’ questionnaire response of ***, question III‐12. *** Email from ***, August 5, 2017. 16 U.S. producers’ questionnaire response of ***, question III‐12.

VII-1
PART VII: THREAT CONSIDERATIONS AND INFORMATION ON NONSUBJECT COUNTRIES
Section 771(7)(F)(i) of the Act (19 U.S.C. § 1677(7)(F)(i)) provides that—
In determining whether an industry in the United States is threatened with material injury by reason of imports (or sales for importation) of the subject merchandise, the Commission shall consider, among other relevant economic factors1-- (I) if a countervailable subsidy is involved, such information as may be
presented to it by the administering authority as to the nature of the subsidy (particularly as to whether the countervailable subsidy is a subsidy described in Article 3 or 6.1 of the Subsidies Agreement), and whether imports of the subject merchandise are likely to increase,
(II) any existing unused production capacity or imminent, substantial increase in production capacity in the exporting country indicating the likelihood of substantially increased imports of the subject merchandise into the United States, taking into account the availability of other export markets to absorb any additional exports,
(III) a significant rate of increase of the volume or market penetration of imports of the subject merchandise indicating the likelihood of substantially increased imports,
(IV) whether imports of the subject merchandise are entering at prices that are likely to have a significant depressing or suppressing effect on domestic prices, and are likely to increase demand for further imports,
(V) inventories of the subject merchandise,
1 Section 771(7)(F)(ii) of the Act (19 U.S.C. § 1677(7)(F)(ii)) provides that “The Commission shall consider {these factors} . . . as a whole in making a determination of whether further dumped or subsidized imports are imminent and whether material injury by reason of imports would occur unless an order is issued or a suspension agreement is accepted under this title. The presence or absence of any factor which the Commission is required to consider . . . shall not necessarily give decisive guidance with respect to the determination. Such a determination may not be made on the basis of mere conjecture or supposition.”
VII-2
(VI) the potential for product-shifting if production facilities in the foreign country, which can be used to produce the subject merchandise, are currently being used to produce other products,
(VII) in any investigation under this title which involves imports of both a raw agricultural product (within the meaning of paragraph (4)(E)(iv)) and any product processed from such raw agricultural product, the likelihood that there will be increased imports, by reason of product shifting, if there is an affirmative determination by the Commission under section 705(b)(1) or 735(b)(1) with respect to either the raw agricultural product or the processed agricultural product (but not both),
(VIII) the actual and potential negative effects on the existing development and production efforts of the domestic industry, including efforts to develop a derivative or more advanced version of the domestic like product, and
(IX) any other demonstrable adverse trends that indicate the probability that there is likely to be material injury by reason of imports (or sale for importation) of the subject merchandise (whether or not it is actually being imported at the time).2
Information on the nature of the alleged subsidies was presented earlier in this report; Parts VI and V present the volume of subject imports and pricing of domestic and imported products, respectively; and information on the effects of imports of the subject merchandise on U.S. producers’ existing development and production efforts is presented in Part VI. Information on inventories of the subject merchandise; foreign producers’ operations, including the potential for “product-shifting;” any other threat indicators, if applicable; and any dumping in third-country markets, follows.
2 Section 771(7)(F)(iii) of the Act (19 U.S.C. § 1677(7)(F)(iii)) further provides that, in antidumping investigations, “. . . the Commission shall consider whether dumping in the markets of foreign countries (as evidenced by dumping findings or antidumping remedies in other WTO member markets against the same class or kind of merchandise manufactured or exported by the same party as under investigation) suggests a threat of material injury to the domestic industry.”
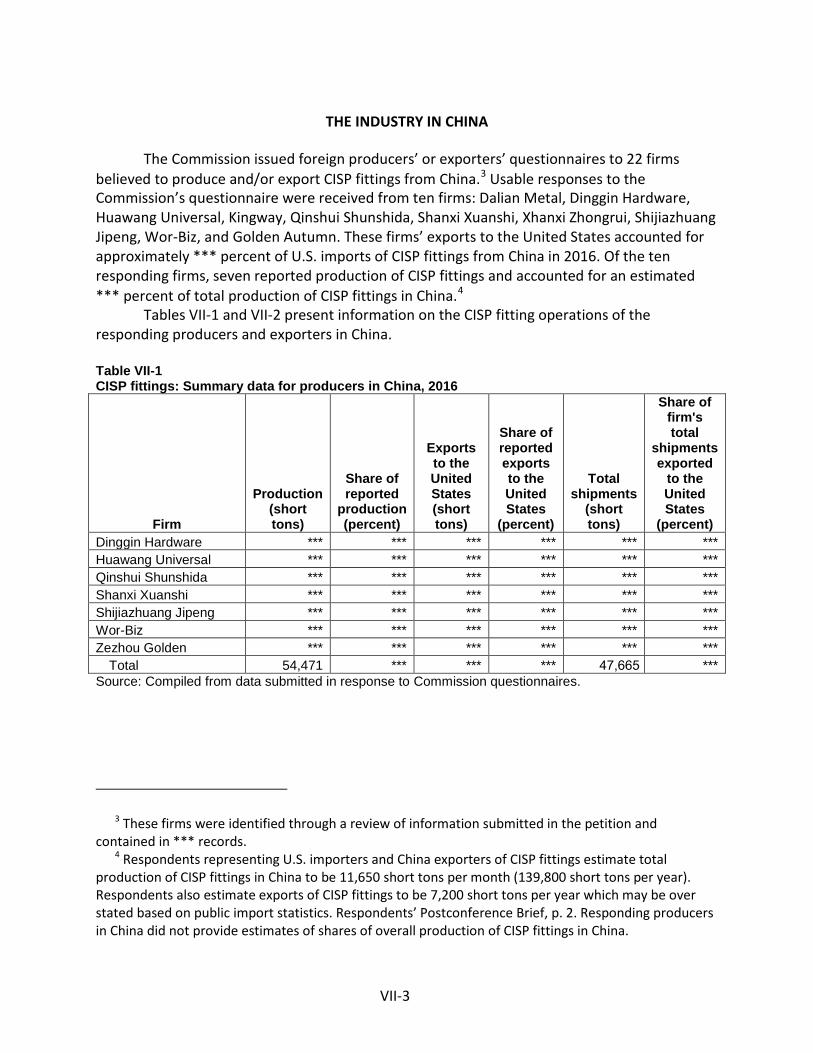
VII-3
THE INDUSTRY IN CHINA
The Commission issued foreign producers’ or exporters’ questionnaires to 22 firms believed to produce and/or export CISP fittings from China.3 Usable responses to the Commission’s questionnaire were received from ten firms: Dalian Metal, Dinggin Hardware, Huawang Universal, Kingway, Qinshui Shunshida, Shanxi Xuanshi, Xhanxi Zhongrui, Shijiazhuang Jipeng, Wor-Biz, and Golden Autumn. These firms’ exports to the United States accounted for approximately *** percent of U.S. imports of CISP fittings from China in 2016. Of the ten responding firms, seven reported production of CISP fittings and accounted for an estimated *** percent of total production of CISP fittings in China.4
Tables VII-1 and VII-2 present information on the CISP fitting operations of the responding producers and exporters in China.
Table VII-1 CISP fittings: Summary data for producers in China, 2016
Firm
Production (short tons)
Share of reported
production (percent)
Exports to the United States (short tons)
Share of reported exports to the United States
(percent)
Total shipments
(short tons)
Share of firm's total
shipments exported
to the United States
(percent) Dinggin Hardware *** *** *** *** *** *** Huawang Universal *** *** *** *** *** *** Qinshui Shunshida *** *** *** *** *** *** Shanxi Xuanshi *** *** *** *** *** *** Shijiazhuang Jipeng *** *** *** *** *** *** Wor-Biz *** *** *** *** *** *** Zezhou Golden *** *** *** *** *** ***
Total 54,471 *** *** *** 47,665 *** Source: Compiled from data submitted in response to Commission questionnaires.
3 These firms were identified through a review of information submitted in the petition and contained in *** records.
4 Respondents representing U.S. importers and China exporters of CISP fittings estimate total production of CISP fittings in China to be 11,650 short tons per month (139,800 short tons per year). Respondents also estimate exports of CISP fittings to be 7,200 short tons per year which may be over stated based on public import statistics. Respondents’ Postconference Brief, p. 2. Responding producers in China did not provide estimates of shares of overall production of CISP fittings in China.
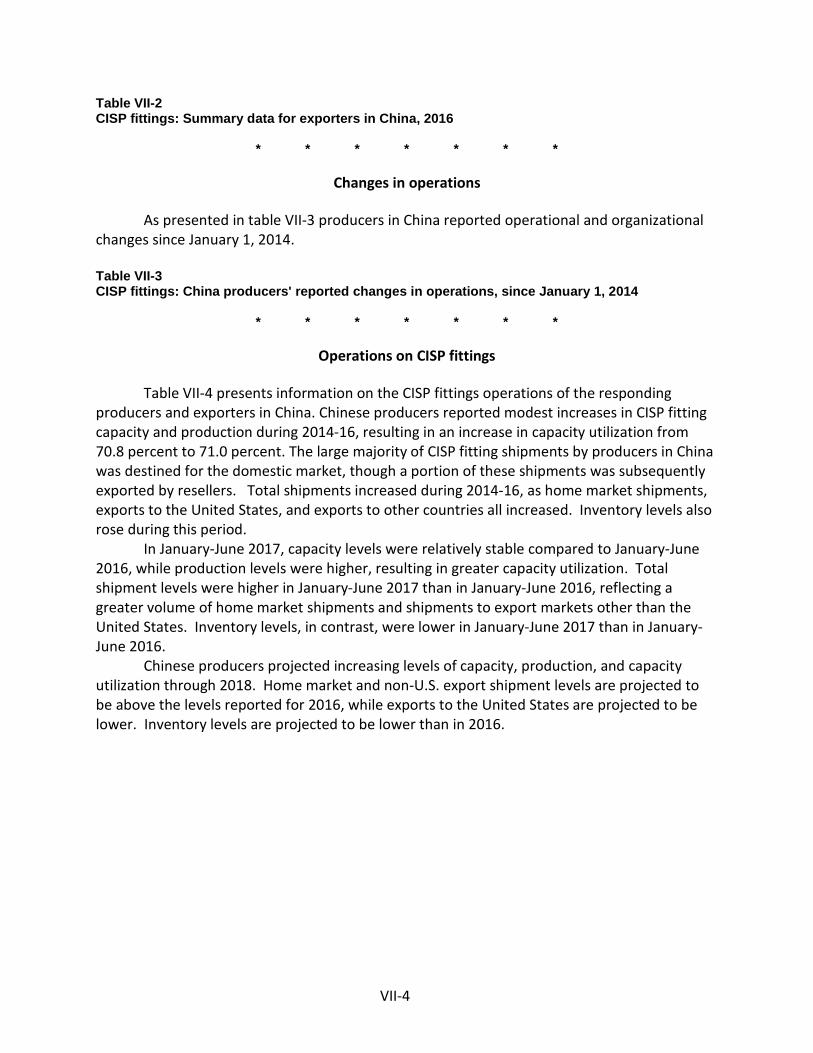
VII-4
Table VII-2 CISP fittings: Summary data for exporters in China, 2016
* * * * * * *
Changes in operations
As presented in table VII-3 producers in China reported operational and organizational changes since January 1, 2014.
Table VII-3 CISP fittings: China producers' reported changes in operations, since January 1, 2014
* * * * * * *
Operations on CISP fittings
Table VII-4 presents information on the CISP fittings operations of the responding producers and exporters in China. Chinese producers reported modest increases in CISP fitting capacity and production during 2014-16, resulting in an increase in capacity utilization from 70.8 percent to 71.0 percent. The large majority of CISP fitting shipments by producers in China was destined for the domestic market, though a portion of these shipments was subsequently exported by resellers. Total shipments increased during 2014-16, as home market shipments, exports to the United States, and exports to other countries all increased. Inventory levels also rose during this period.
In January-June 2017, capacity levels were relatively stable compared to January-June 2016, while production levels were higher, resulting in greater capacity utilization. Total shipment levels were higher in January-June 2017 than in January-June 2016, reflecting a greater volume of home market shipments and shipments to export markets other than the United States. Inventory levels, in contrast, were lower in January-June 2017 than in January-June 2016.
Chinese producers projected increasing levels of capacity, production, and capacity utilization through 2018. Home market and non-U.S. export shipment levels are projected to be above the levels reported for 2016, while exports to the United States are projected to be lower. Inventory levels are projected to be lower than in 2016.
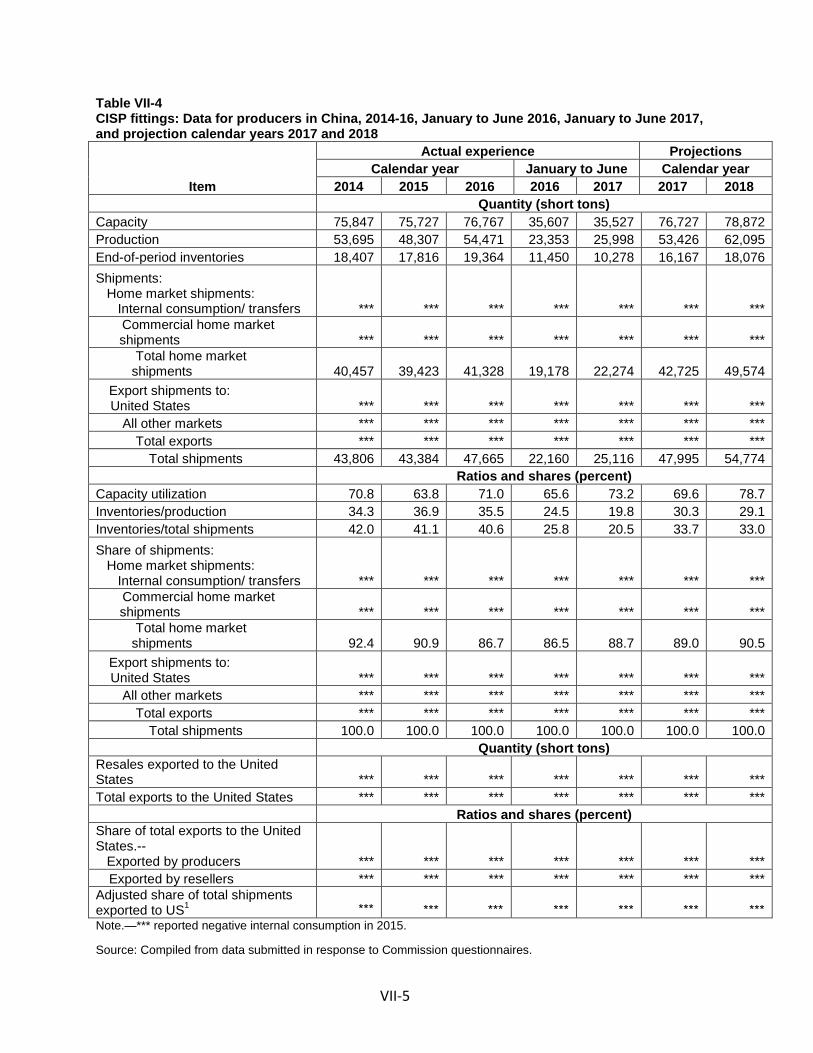
VII-5
Table VII-4 CISP fittings: Data for producers in China, 2014-16, January to June 2016, January to June 2017, and projection calendar years 2017 and 2018
Item
Actual experience Projections Calendar year January to June Calendar year
2014 2015 2016 2016 2017 2017 2018 Quantity (short tons)
Capacity 75,847 75,727 76,767 35,607 35,527 76,727 78,872 Production 53,695 48,307 54,471 23,353 25,998 53,426 62,095 End-of-period inventories 18,407 17,816 19,364 11,450 10,278 16,167 18,076 Shipments: Home market shipments: Internal consumption/ transfers *** *** *** *** *** *** ***
Commercial home market shipments *** *** *** *** *** *** ***
Total home market shipments 40,457 39,423 41,328 19,178 22,274 42,725 49,574
Export shipments to: United States *** *** *** *** *** *** ***
All other markets *** *** *** *** *** *** *** Total exports *** *** *** *** *** *** ***
Total shipments 43,806 43,384 47,665 22,160 25,116 47,995 54,774 Ratios and shares (percent)
Capacity utilization 70.8 63.8 71.0 65.6 73.2 69.6 78.7 Inventories/production 34.3 36.9 35.5 24.5 19.8 30.3 29.1 Inventories/total shipments 42.0 41.1 40.6 25.8 20.5 33.7 33.0 Share of shipments: Home market shipments: Internal consumption/ transfers *** *** *** *** *** *** ***
Commercial home market shipments *** *** *** *** *** *** ***
Total home market shipments 92.4 90.9 86.7 86.5 88.7 89.0 90.5
Export shipments to: United States *** *** *** *** *** *** ***
All other markets *** *** *** *** *** *** *** Total exports *** *** *** *** *** *** ***
Total shipments 100.0 100.0 100.0 100.0 100.0 100.0 100.0 Quantity (short tons)
Resales exported to the United States *** *** *** *** *** *** *** Total exports to the United States *** *** *** *** *** *** ***
Ratios and shares (percent) Share of total exports to the United States.-- Exported by producers *** *** *** *** *** *** ***
Exported by resellers *** *** *** *** *** *** *** Adjusted share of total shipments exported to US1 *** *** *** *** *** *** *** Note.—*** reported negative internal consumption in 2015.
Source: Compiled from data submitted in response to Commission questionnaires.

VII-6
Alternative products
As shown in table VII-5, *** produced other products on the same equipment and machinery used to produce CSIP fittings.
Table VII-5 CISP fittings: China producers' overall capacity and production on the same equipment as subject production, 2014-16, January to June 2016, and January to June 2017
* * * * * * *
Exports
According to GTA, the leading export markets for non-malleable cast iron pipe fittings from China are the United States, Taiwan, Hong Kong, Singapore, Japan, Canada, Spain, the United Arab Emirates, and the United Kingdom (table VII-6). During 2016, the United States was the top export market for non-malleable cast iron pipe fittings from China, accounting for 39.3 percent of all exports, followed by the Taiwan, accounting for 4.5 percent.
Table VII-6 Non-malleable cast iron pipe fittings: Exports from China by destination market, 2014-16
Destination market Calendar year
2014 2015 2016 Quantity (short tons) Exports from China to the United States 135,351 126,048 129,858 Exports from China to other major destination markets.-- Taiwan 12,941 16,552 14,951
Hong Kong 12,590 14,468 12,492 Singapore 9,836 9,344 11,127 Japan 11,290 9,717 10,253 Canada 9,151 10,806 9,817 Spain 8,827 11,223 9,174 United Arab Emirates 5,907 9,053 8,892 United Kingdom 8,174 6,858 7,253 All other destination markets 104,404 113,435 116,456
Total exports from China 318,471 327,504 330,272 Table continued on next page.

VII-7
Table VII-6--Continued Non-malleable cast iron pipe fittings: Exports from China by destination market, 2014-16
Destination market Calendar year
2014 2015 2016 Value (1,000 dollars) Exports from China to the United States 236,995 219,529 205,839 Exports from China to other major destination markets.-- Taiwan 15,417 17,967 15,044
Hong Kong 19,694 22,493 19,328 Singapore 17,088 15,267 16,588 Japan 26,363 23,884 23,408 Canada 16,537 19,757 16,270 Spain 13,652 17,782 14,232 United Arab Emirates 9,613 15,650 13,882 United Kingdom 15,031 12,176 11,756 All other destination markets 205,214 224,275 216,116
Total exports from China 575,604 588,779 552,464 Unit value (dollars per short ton) Exports from China to the United States 1,751 1,742 1,585 Exports from China to other major destination markets.-- Taiwan 1,191 1,085 1,006
Hong Kong 1,564 1,555 1,547 Singapore 1,737 1,634 1,491 Japan 2,335 2,458 2,283 Canada 1,807 1,828 1,657 Spain 1,547 1,584 1,551 United Arab Emirates 1,627 1,729 1,561 United Kingdom 1,839 1,775 1,621 All other destination markets 1,966 1,977 1,856
Total China exports 1,807 1,798 1,673 Share of quantity (percent) Exports from China to the United States 42.5 38.5 39.3 Exports from China to other major destination markets.-- Taiwan 4.1 5.1 4.5
Hong Kong 4.0 4.4 3.8 Singapore 3.1 2.9 3.4 Japan 3.5 3.0 3.1 Canada 2.9 3.3 3.0 Spain 2.8 3.4 2.8 United Arab Emirates 1.9 2.8 2.7 United Kingdom 2.6 2.1 2.2 All other destination markets 32.8 34.6 35.3
Total exports from China 100.0 100.0 100.0 Source: Official exports statistics under HS subheading 7307.11 as reported by China Customs in the IHS/GTA database, accessed July 31, 2017.
U.S. INVENTORIES OF IMPORTED MERCHANDISE
Table VII-7 presents data on U.S. importers’ reported inventories of CISP fittings.
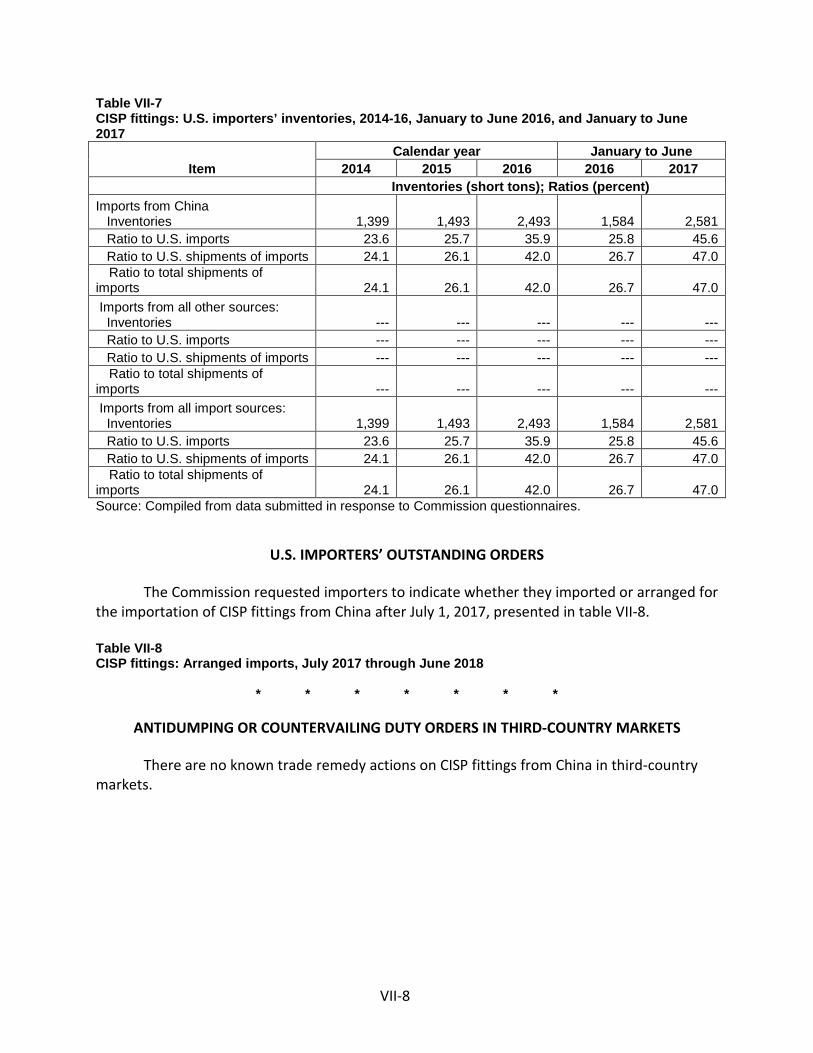
VII-8
Table VII-7 CISP fittings: U.S. importers’ inventories, 2014-16, January to June 2016, and January to June 2017
Item Calendar year January to June
2014 2015 2016 2016 2017 Inventories (short tons); Ratios (percent)
Imports from China Inventories 1,399 1,493 2,493 1,584 2,581 Ratio to U.S. imports 23.6 25.7 35.9 25.8 45.6 Ratio to U.S. shipments of imports 24.1 26.1 42.0 26.7 47.0
Ratio to total shipments of imports 24.1 26.1 42.0 26.7 47.0 Imports from all other sources: Inventories --- --- --- --- --- Ratio to U.S. imports --- --- --- --- --- Ratio to U.S. shipments of imports --- --- --- --- ---
Ratio to total shipments of imports --- --- --- --- --- Imports from all import sources: Inventories 1,399 1,493 2,493 1,584 2,581 Ratio to U.S. imports 23.6 25.7 35.9 25.8 45.6 Ratio to U.S. shipments of imports 24.1 26.1 42.0 26.7 47.0
Ratio to total shipments of imports 24.1 26.1 42.0 26.7 47.0 Source: Compiled from data submitted in response to Commission questionnaires.
U.S. IMPORTERS’ OUTSTANDING ORDERS
The Commission requested importers to indicate whether they imported or arranged for the importation of CISP fittings from China after July 1, 2017, presented in table VII-8.
Table VII-8 CISP fittings: Arranged imports, July 2017 through June 2018
* * * * * * *
ANTIDUMPING OR COUNTERVAILING DUTY ORDERS IN THIRD-COUNTRY MARKETS
There are no known trade remedy actions on CISP fittings from China in third-country markets.

A-1
APPENDIX A
FEDERAL REGISTER NOTICES

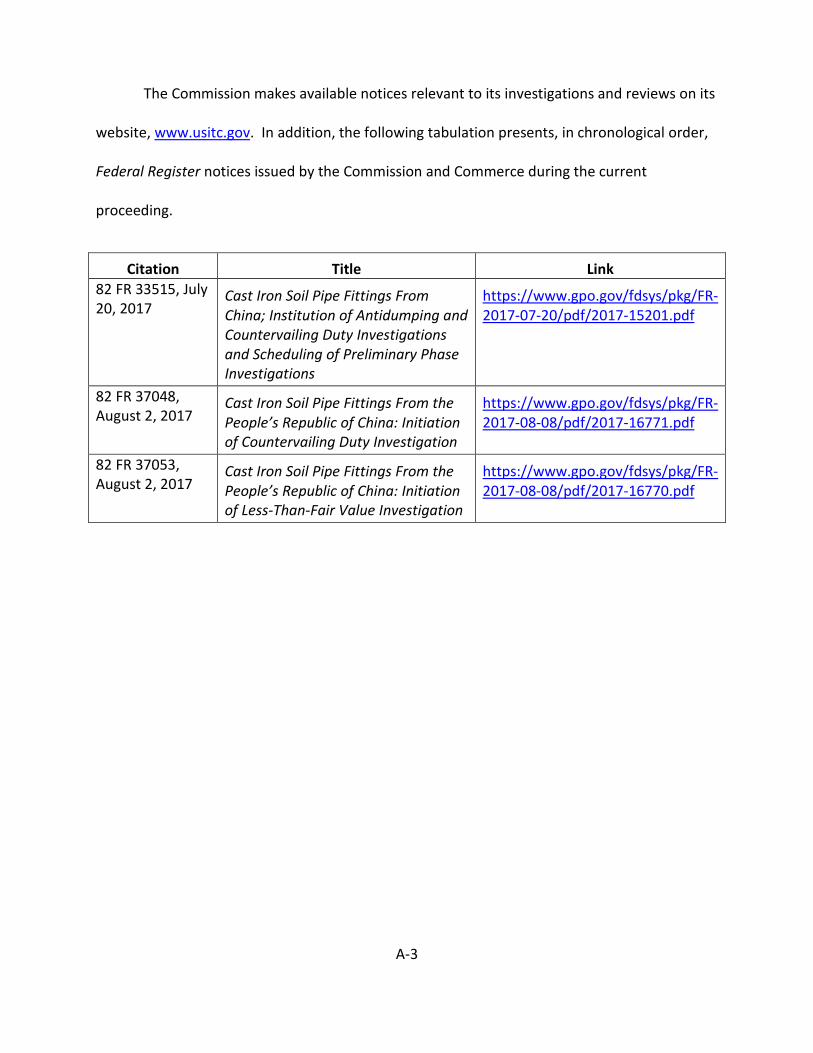
A-3
The Commission makes available notices relevant to its investigations and reviews on its
website, www.usitc.gov. In addition, the following tabulation presents, in chronological order,
Federal Register notices issued by the Commission and Commerce during the current
proceeding.
Citation Title Link 82 FR 33515, July 20, 2017
Cast Iron Soil Pipe Fittings From China; Institution of Antidumping and Countervailing Duty Investigations and Scheduling of Preliminary Phase Investigations
https://www.gpo.gov/fdsys/pkg/FR-2017-07-20/pdf/2017-15201.pdf
82 FR 37048, August 2, 2017
Cast Iron Soil Pipe Fittings From the People’s Republic of China: Initiation of Countervailing Duty Investigation
https://www.gpo.gov/fdsys/pkg/FR-2017-08-08/pdf/2017-16771.pdf
82 FR 37053, August 2, 2017
Cast Iron Soil Pipe Fittings From the People’s Republic of China: Initiation of Less-Than-Fair Value Investigation
https://www.gpo.gov/fdsys/pkg/FR-2017-08-08/pdf/2017-16770.pdf


B-1
APPENDIX B
CONFERENCE WITNESSES

B-3
CALENDAR OF PUBLIC PRELIMINARY CONFERENCE
Those listed below appeared as witnesses at the United States International Trade Commission’s preliminary conference:
Subject: Cast Iron Soil Pipe Fittings from China
Inv. Nos.: 701-TA-583 and 731-TA-1381 (Preliminary)
Date and Time: August 3, 2017 - 9:40 a.m.
Sessions were held in connection with these preliminary phase investigations in the Main Hearing Room (room 101), 500 E Street, S.W., Washington, DC.
OPENING REMARKS:
Petitioner (Christopher T. Cloutier, Schagrin Associates) Respondents (Lizbeth Levinson, Kutak Rock LLP)
In Support to the Imposition of Antidumping and Countervailing Duty Orders:
Schagrin Associates Washington, DC on behalf of
Cast Iron Soil Institute
Roddey Dowd, Jr., Chief Executive Officer, Charlotte Pipe and Foundry Company
Hooper Hardison, President, Charlotte Pipe and Foundry Company
Don Waugaman, Vice President and National Sales Manager, Charlotte Pipe and Foundry Company
Greg Simmons, Senior Vice President, Cast Iron Division, Charlotte Pipe and Foundry Company
Michael Lowe, General Manager and Vice President of Sales, AB&I Foundry
B-4
In Support to the Imposition of Antidumping and Countervailing Duty Orders (continued):
Joel Holzbauer, Group Director of Sales Operations, AB&I Foundry and Tyler Pipe
Roger B. Schagrin ) Paul W. Jameson ) – OF COUNSEL Christopher T. Cloutier )
In Opposition to the Imposition of Antidumping and Countervailing Duty Orders:
Kutak Rock LLP Washington, DC on behalf of
NewAge Casting
Bikram Singh, President and Chief Executive Officer, NewAge Casting
Lizbeth Levinson ) ) – OF COUNSEL
Ronald M. Wisla )
Squire Patton Boggs (US) LLP Washington, DC on behalf of
Max Supply
Gary Miao, Vice President, Max Supply
Peter J. Koenig ) – OF COUNSEL
REBUTTAL/CLOSING REMARKS:
Petitioner (Roger B. Schagrin, Schagrin Associates) Respondents (Lizbeth Levinson, Kutak Rock LLP; and Peter J. Koenig, Squire
Patton Boggs (US) LLP)
-END-

C-1
APPENDIX C
SUMMARY DATA


Table C-1Cast iron soil pipe fittings: Summary data concerning the U.S. market, 2014-16, January to June 2016, and January to June 2017
Jan-Jun2014 2015 2016 2016 2017 2014-16 2014-15 2015-16 2016-17
U.S. consumption quantity:Amount *** *** *** *** *** *** *** *** ***Producers' share (fn1) *** *** *** *** *** *** *** *** ***Importers' share (fn1):
China *** *** *** *** *** *** *** *** ***Nonsubject sources *** *** *** *** *** *** *** *** ***
All import sources *** *** *** *** *** *** *** *** ***
U.S. consumption value:Amount *** *** *** *** *** *** *** *** ***Producers' share (fn1) *** *** *** *** *** *** *** *** ***Importers' share (fn1):
China *** *** *** *** *** *** *** *** ***Nonsubject sources *** *** *** *** *** *** *** *** ***
All import sources *** *** *** *** *** *** *** *** ***
U.S. imports from:China:
Quantity 7,328 5,531 8,360 3,364 2,746 14.1 (24.5) 51.2 (18.4)Value 10,084 7,064 9,764 4,213 3,422 (3.2) (30.0) 38.2 (18.8)Unit value $1,376 $1,277 $1,168 $1,253 $1,246 (15.1) (7.2) (8.6) (0.5)Ending inventory quantity 1,399 1,493 2,493 1,584 2,581 78.2 6.7 67.0 62.9
Nonsubject sources:Quantity 124 166 83 30 49 (33.2) 34.2 (50.2) 61.6 Value 573 493 292 129 171 (49.1) (14.0) (40.8) 32.5 Unit value $4,640 $2,975 $3,535 $4,232 $3,471 (23.8) (35.9) 18.8 (18.0)Ending inventory quantity 0 0 0 0 0 fn2 fn2 fn2 fn2
All import sources:Quantity 7,452 5,697 8,443 3,394 2,795 13.3 (23.5) 48.2 (17.6)Value 10,657 7,557 10,056 4,342 3,593 (5.6) (29.1) 33.1 (17.2)Unit value $1,430 $1,326 $1,191 $1,279 $1,285 (16.7) (7.3) (10.2) 0.5 Ending inventory quantity 1,399 1,493 2,493 1,584 2,581 78.2 6.7 67.0 62.9
U.S. producers':Average capacity quantity *** *** *** *** *** *** *** *** ***Production quantity *** *** *** *** *** *** *** *** ***Capacity utilization (fn1) *** *** *** *** *** *** *** *** ***U.S. shipments:
Quantity *** *** *** *** *** *** *** *** ***Value *** *** *** *** *** *** *** *** ***Unit value *** *** *** *** *** *** *** *** ***
Export shipments:Quantity *** *** *** *** *** *** *** *** ***Value *** *** *** *** *** *** *** *** ***Unit value *** *** *** *** *** *** *** *** ***
Ending inventory quantity *** *** *** *** *** *** *** *** ***Inventories/total shipments (fn1) *** *** *** *** *** *** *** *** ***Production workers *** *** *** *** *** *** *** *** ***Hours worked (1,000s) *** *** *** *** *** *** *** *** ***Wages paid ($1,000) *** *** *** *** *** *** *** *** ***Hourly wages (dollars) *** *** *** *** *** *** *** *** ***Productivity (short tons per 1,000 hours) *** *** *** *** *** *** *** *** ***Unit labor costs *** *** *** *** *** *** *** *** ***Net sales:
Quantity *** *** *** *** *** *** *** *** ***Value *** *** *** *** *** *** *** *** ***Unit value *** *** *** *** *** *** *** *** ***
Cost of goods sold (COGS) *** *** *** *** *** *** *** *** ***Gross profit or (loss) *** *** *** *** *** *** *** *** ***SG&A expenses *** *** *** *** *** *** *** *** ***Operating income or (loss) *** *** *** *** *** *** *** *** ***Net income or (loss) *** *** *** *** *** *** *** *** ***Capital expenditures *** *** *** *** *** *** *** *** ***Unit COGS *** *** *** *** *** *** *** *** ***Unit SG&A expenses *** *** *** *** *** *** *** *** ***Unit operating income or (loss) *** *** *** *** *** *** *** *** ***Unit net income or (loss) *** *** *** *** *** *** *** *** ***COGS/sales (fn1) *** *** *** *** *** *** *** *** ***Operating income or (loss)/sales (fn1) *** *** *** *** *** *** *** *** ***Net income or (loss)/sales (fn1) *** *** *** *** *** *** *** *** ***
Notes:
fn1.--Reported data are in percent and period changes are in percentage points.fn2.--Undefined.
Source: Compiled from data submitted in response to Commission questionnaires and official U.S. import statistics (see part IV for details).
C-3
Period changes
(Quantity=short tons; Value=1,000 dollars; Unit values, unit labor costs, and unit expenses=dollars per short ton; Period changes=percent--exceptions noted)
Calendar year Calendar yearReported data
January to June
