case studies in structural engineering - core · case studies in structural engineering 6 ......
TRANSCRIPT
Cs
Pa
b
c
d
a
ARRAA
KLPMPL
1
tofaTba
v
2l
Case Studies in Structural Engineering 6 (2016) 11–21
Contents lists available at ScienceDirect
Case Studies in Structural Engineering
j ourna l h om epa ge: w ww.elsev ier .com/ locate /csse
ase study of load-bearing precast wall system subject to loweismic intensity by linear and nonlinear analyses
atrick Liq Yee Tionga,b,∗, Sing Ping Chiewc, Beng Hur Teowd
School of Civil and Environmental Engineering, Nanyang Technological University, SingaporeBase Isolation Technology (Asia) Sdn. Bhd., MalaysiaSingapore Institute of Technology, SingaporeHC Precast System Sdn. Bhd., Malaysia
r t i c l e i n f o
rticle history:eceived 20 February 2016eceived in revised form 5 April 2016ccepted 1 May 2016vailable online 3 May 2016
eywords:ow seismicityrecast wallodal response spectrum analysis
ushoveroad-bearing wall
a b s t r a c t
This paper investigates the behaviour of load-bearing precast wall system (namely the HCPrecast System − HCPS) subject to seismicity in Malaysia. Recent tremors felt across thecountry heeded the call for the need of seismic design guidelines to be implemented. Forthis study, the design ground acceleration for Malaysia has not been finalized. Throughoutthe years, several schools of thought that occurred among different researchers pertainingto the value of design ground acceleration, ranging from 0.05 g to 0.1 g. The implicationsof the selected values can be great especially in designing new buildings or retrofittingexisting ones. Thus, linear analysis using Modal Response Spectrum Analysis (MRSA) andnonlinear pushover analysis of representative HCPS were performed for this study. Thefinite element (FE) model focused particularly on the nonlinear behaviour of the interfacebetween a precast wall and cast in-situ column. Prior to the modal and pushover analy-ses, the FE model was validated against quasi-static cyclic test results of identical precastsystem obtained from literature. Differences between the MRSA and pushover approachesare presented and discussed. Performance levels of the structural system were subjectedto three levels of design ground acceleration (0.05, 0.075 and 0.1 g) have been included.© 2016 The Authors. Published by Elsevier Ltd. This is an open access article under the CC
BY-NC-ND license (http://creativecommons.org/licenses/by-nc-nd/4.0/).
. Introduction
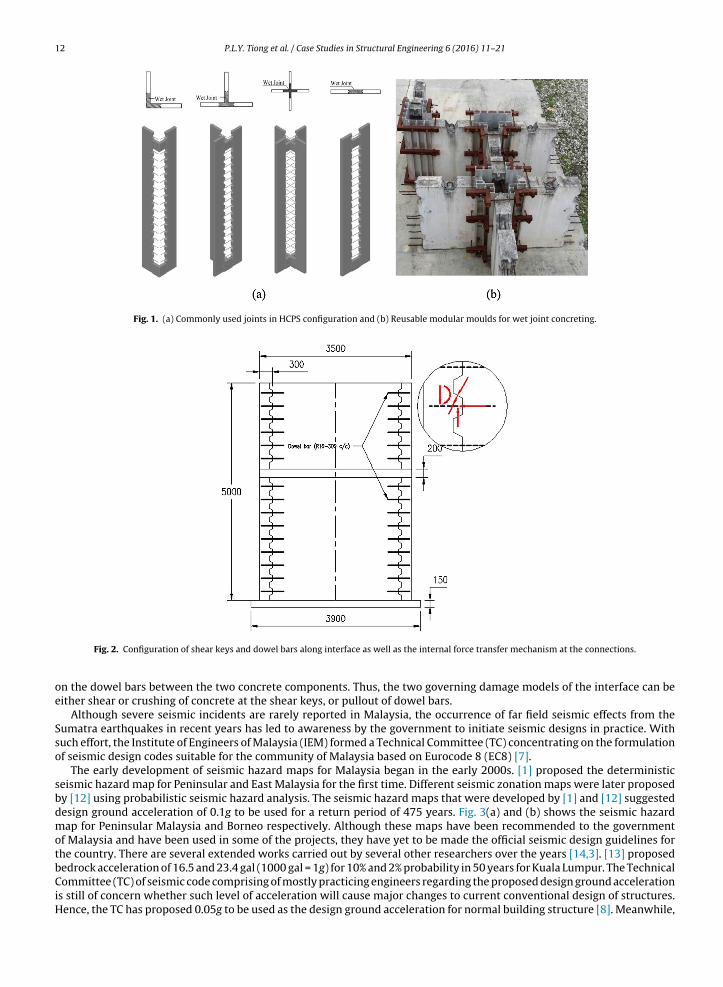
The government of Malaysia has been strongly encouraging the use of Industrialized Building System (IBS) in the construc-ion industry especially for large projects. The precast concrete method and structural steel are the two major componentsf IBS. However, the level of acceptance of local contractors in using precast concrete construction is very low [15]. This callsor local precast suppliers to take the initiative to develop their own product lines in order to respond to the call from theuthorities. Among them are the HC Precast System (HCPS), which consists of structural wall panels prefabricated off-site.he wall panels are joined at site through wet concreting along the vertical joints (Fig. 1). Instead of using conventional tim-
er formwork for site concreting, the modular mould [15] was invented by the system supplier to improve the reusabilitys well as to speed up the construction process.Fig. 2 shows the force transfer mechanism along the vertical interface between the wall panel and the column. Whileertical force (i.e. design load of the structure) is mainly resisted by the shear keys, resistance against lateral force depends
∗ Corresponding author at: School of Civil and Environmental Engineering, Nanyang Technological University, Singapore.E-mail address: [email protected] (P.L.Y. Tiong).
http://dx.doi.org/10.1016/j.csse.2016.05.001214-3998/© 2016 The Authors. Published by Elsevier Ltd. This is an open access article under the CC BY-NC-ND license (http://creativecommons.org/
icenses/by-nc-nd/4.0/).
12 P.L.Y. Tiong et al. / Case Studies in Structural Engineering 6 (2016) 11–21
Fig. 1. (a) Commonly used joints in HCPS configuration and (b) Reusable modular moulds for wet joint concreting.
Fig. 2. Configuration of shear keys and dowel bars along interface as well as the internal force transfer mechanism at the connections.
on the dowel bars between the two concrete components. Thus, the two governing damage models of the interface can beeither shear or crushing of concrete at the shear keys, or pullout of dowel bars.
Although severe seismic incidents are rarely reported in Malaysia, the occurrence of far field seismic effects from theSumatra earthquakes in recent years has led to awareness by the government to initiate seismic designs in practice. Withsuch effort, the Institute of Engineers of Malaysia (IEM) formed a Technical Committee (TC) concentrating on the formulationof seismic design codes suitable for the community of Malaysia based on Eurocode 8 (EC8) [7].
The early development of seismic hazard maps for Malaysia began in the early 2000s. [1] proposed the deterministicseismic hazard map for Peninsular and East Malaysia for the first time. Different seismic zonation maps were later proposedby [12] using probabilistic seismic hazard analysis. The seismic hazard maps that were developed by [1] and [12] suggesteddesign ground acceleration of 0.1g to be used for a return period of 475 years. Fig. 3(a) and (b) shows the seismic hazardmap for Peninsular Malaysia and Borneo respectively. Although these maps have been recommended to the governmentof Malaysia and have been used in some of the projects, they have yet to be made the official seismic design guidelines forthe country. There are several extended works carried out by several other researchers over the years [14,3]. [13] proposedbedrock acceleration of 16.5 and 23.4 gal (1000 gal = 1g) for 10% and 2% probability in 50 years for Kuala Lumpur. The Technical
Committee (TC) of seismic code comprising of mostly practicing engineers regarding the proposed design ground accelerationis still of concern whether such level of acceleration will cause major changes to current conventional design of structures.Hence, the TC has proposed 0.05g to be used as the design ground acceleration for normal building structure [8]. Meanwhile,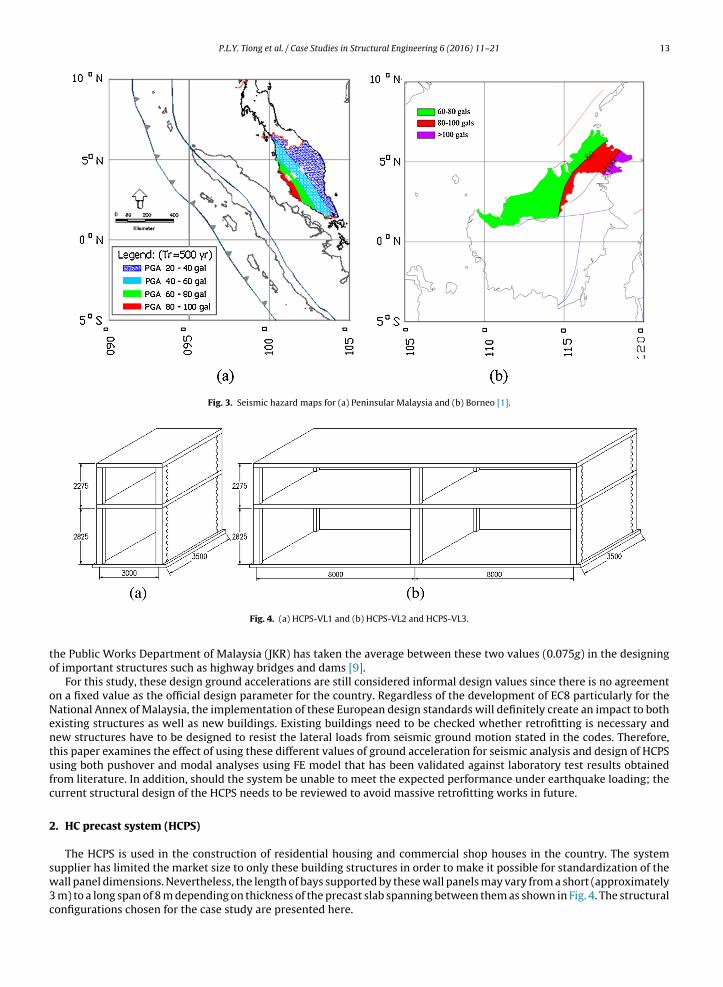
P.L.Y. Tiong et al. / Case Studies in Structural Engineering 6 (2016) 11–21 13
Fig. 3. Seismic hazard maps for (a) Peninsular Malaysia and (b) Borneo [1].
to
oNentufc
2
sw3c
Fig. 4. (a) HCPS-VL1 and (b) HCPS-VL2 and HCPS-VL3.
he Public Works Department of Malaysia (JKR) has taken the average between these two values (0.075g) in the designingf important structures such as highway bridges and dams [9].
For this study, these design ground accelerations are still considered informal design values since there is no agreementn a fixed value as the official design parameter for the country. Regardless of the development of EC8 particularly for theational Annex of Malaysia, the implementation of these European design standards will definitely create an impact to bothxisting structures as well as new buildings. Existing buildings need to be checked whether retrofitting is necessary andew structures have to be designed to resist the lateral loads from seismic ground motion stated in the codes. Therefore,his paper examines the effect of using these different values of ground acceleration for seismic analysis and design of HCPSsing both pushover and modal analyses using FE model that has been validated against laboratory test results obtainedrom literature. In addition, should the system be unable to meet the expected performance under earthquake loading; theurrent structural design of the HCPS needs to be reviewed to avoid massive retrofitting works in future.
. HC precast system (HCPS)
The HCPS is used in the construction of residential housing and commercial shop houses in the country. The systemupplier has limited the market size to only these building structures in order to make it possible for standardization of the
all panel dimensions. Nevertheless, the length of bays supported by these wall panels may vary from a short (approximatelym) to a long span of 8 m depending on thickness of the precast slab spanning between them as shown in Fig. 4. The structuralonfigurations chosen for the case study are presented here.

14 P.L.Y. Tiong et al. / Case Studies in Structural Engineering 6 (2016) 11–21
Table 1Three different configurations of HCPS with different imposed vertical loads.
HCPS-VL1 HCPS-VL2 HCPS-VL3
Wall type Exterior Interior Interior
Slab length 3.5 m 8.0 m 8.0 mNos. of story 2 2 2Live load 1.5 kN/m2 1.5 kN/m2 4.0 kN/m2
Total weight 265 kN 995 kN 1475 kN
Fig. 5. Structural configurations of HCPS.
Three types of vertical loading were considered in the seismic analyses. The dead load (DL) was taken from the self-weight of the structural elements themselves while live load (LL) was obtained from BS 6399-1 [5]. Although the buildingcodes have been replaced by Eurocode, British Standards are still widely used in the country during the current transitionperiod. Loading from non-structural element was excluded in the model since it was not included in the quasi-static cyclictest in the first place [11]. HCPS-VL1 consisted of possible minimum loading that could be imposed on the structure whileHCPS-VL3 comprised the probable maximum loading. The intermediate vertical loading, which represented typical weightcarried by many shop house structural layouts, was denoted by HCPS-VL2. The maximum intensity of distributed load forLL was taken as 4.0 kN/m2 due to the wide range of possibility of commercial shop lot usage while the minimum one was1.5 kN/m2. External wall refers to the perimeter wall (Fig. 4(a)) while the interior wall refers to the middle wall in Fig. 4(b).The three types of HCPS loading are listed in Table 1. Details of reinforcement and structural configuration of HCPS areshown in Fig. 5.Concrete grade C30 was used for all concrete elements. The structure was designed according to BS 8110-1[6] without earthquake loading. However, the notional load due to geometry imperfection was considered in the design bytaking into consideration lateral load of 1.5% storey mass.
In a finite element (FE) analysis, the column was modeled as a frame element with possible plastic hinges at criticalregions as stated in FEMA 356 [10]. Meanwhile, the wall panels were represented by nonlinear shell elements. The mostsignificant part of the modeling was the interface between wall and column. The shear keys have been represented bya series of rotational springs fully restrained in all six degree-of-freedoms. Dowel bars were modeled as nonlinear linkelements taking into consideration strength degradation due to pullout. The ultimate anchorage resistance (Vb) of dowelbars was estimated using Eq. (1) [6]. Considering that the castellated joint was unreinforced, ultimate allowable shear stressof 1.3 MPa as recommended in BS8110-1 was used to determine the shear key resistance. Detail FE model of the entire
interface was complex and is presented briefly when dealing with pushover analysis in this paper. For further reading, referto [16]. However, validation of the proposed FEM against the hysteresis loops from laboratory test data [11] is shown inFig. 6. The proposed FE model shows good agreement with the hysteresis loops obtained from the quasi-static cyclic test.It should be noted that the nonlinear behaviour is only activated in the pushover analysis. In the linear analysis, the FE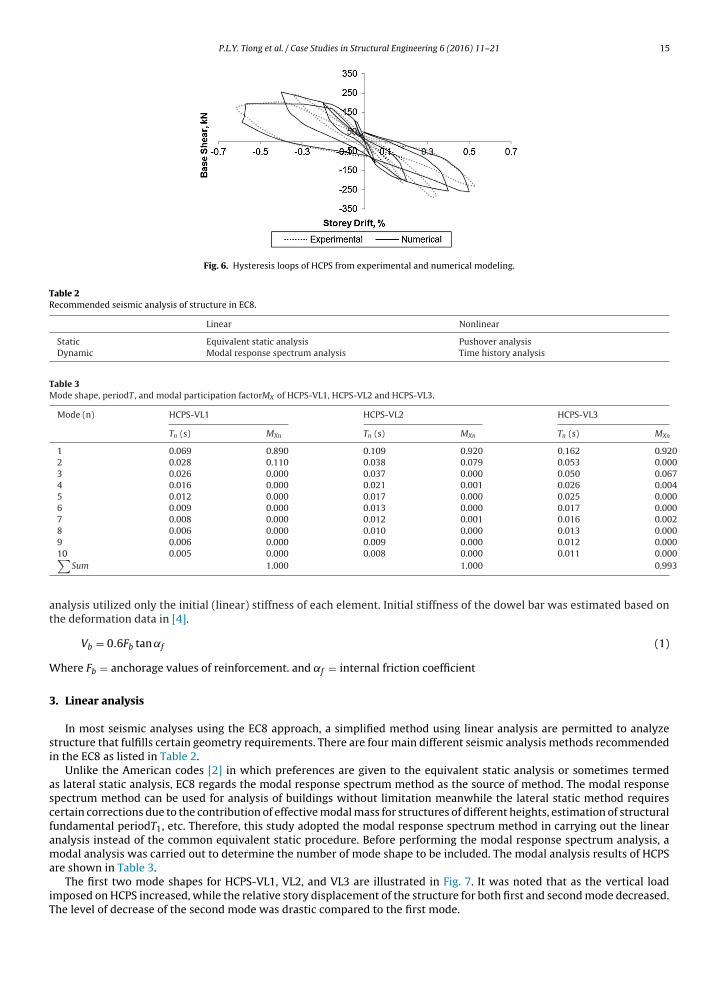
P.L.Y. Tiong et al. / Case Studies in Structural Engineering 6 (2016) 11–21 15
Fig. 6. Hysteresis loops of HCPS from experimental and numerical modeling.
Table 2Recommended seismic analysis of structure in EC8.
Linear Nonlinear
Static Equivalent static analysis Pushover analysisDynamic Modal response spectrum analysis Time history analysis
Table 3Mode shape, periodT , and modal participation factorMX of HCPS-VL1, HCPS-VL2 and HCPS-VL3.
Mode (n) HCPS-VL1 HCPS-VL2 HCPS-VL3
Tn (s) MXn Tn (s) MXn Tn (s) MXn
1 0.069 0.890 0.109 0.920 0.162 0.9202 0.028 0.110 0.038 0.079 0.053 0.0003 0.026 0.000 0.037 0.000 0.050 0.0674 0.016 0.000 0.021 0.001 0.026 0.0045 0.012 0.000 0.017 0.000 0.025 0.0006 0.009 0.000 0.013 0.000 0.017 0.0007 0.008 0.000 0.012 0.001 0.016 0.0028 0.006 0.000 0.010 0.000 0.013 0.0009 0.006 0.000 0.009 0.000 0.012 0.000
03
at
W
3
si
ascfama
iT
10 0.005 0.000 0.008 0.000 0.011 0.00∑Sum 1.000 1.000 0.99
nalysis utilized only the initial (linear) stiffness of each element. Initial stiffness of the dowel bar was estimated based onhe deformation data in [4].
Vb = 0.6Fb tan ˛f (1)
here Fb = anchorage values of reinforcement. and ˛f = internal friction coefficient
. Linear analysis
In most seismic analyses using the EC8 approach, a simplified method using linear analysis are permitted to analyzetructure that fulfills certain geometry requirements. There are four main different seismic analysis methods recommendedn the EC8 as listed in Table 2.
Unlike the American codes [2] in which preferences are given to the equivalent static analysis or sometimes termeds lateral static analysis, EC8 regards the modal response spectrum method as the source of method. The modal responsepectrum method can be used for analysis of buildings without limitation meanwhile the lateral static method requiresertain corrections due to the contribution of effective modal mass for structures of different heights, estimation of structuralundamental periodT1, etc. Therefore, this study adopted the modal response spectrum method in carrying out the linearnalysis instead of the common equivalent static procedure. Before performing the modal response spectrum analysis, aodal analysis was carried out to determine the number of mode shape to be included. The modal analysis results of HCPS
re shown in Table 3.
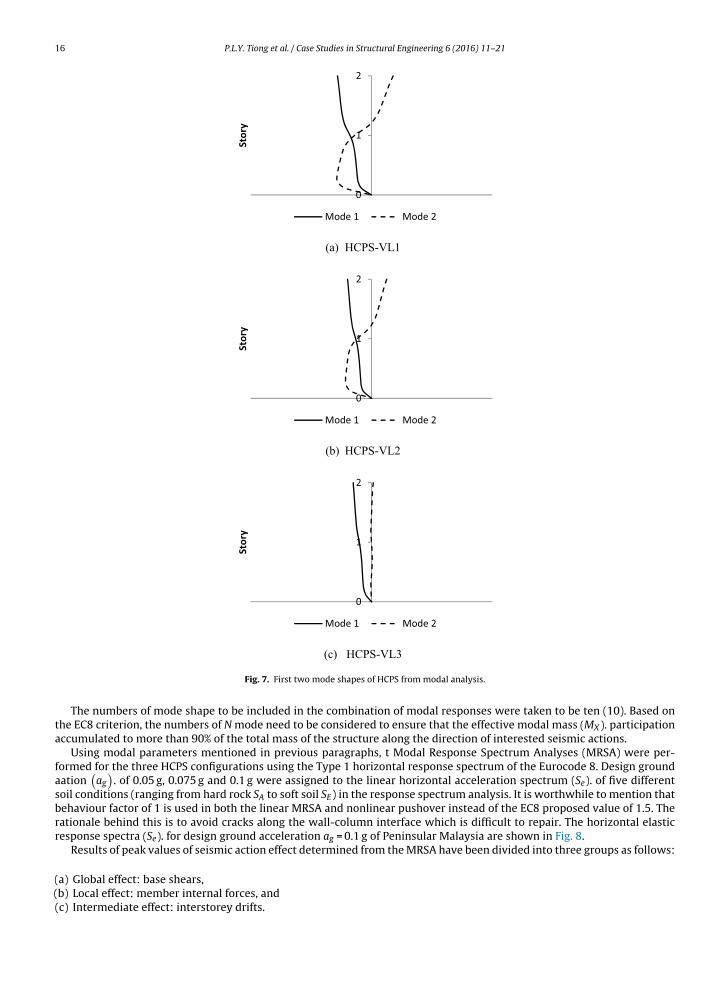
The first two mode shapes for HCPS-VL1, VL2, and VL3 are illustrated in Fig. 7. It was noted that as the vertical loadmposed on HCPS increased, while the relative story displacement of the structure for both first and second mode decreased.he level of decrease of the second mode was drastic compared to the first mode.
16 P.L.Y. Tiong et al. / Case Studies in Structural Engineering 6 (2016) 11–21
(a) HCPS-VL 1
(b) HCPS-VL 2
0
1
2
Story
Mode 1 Mode 2
0
1
2
Story
Mode 1 Mode 2
0
1
2
Story
Mode 1 Mode 2
((
(c) HCPS-VL 3
Fig. 7. First two mode shapes of HCPS from modal analysis.
The numbers of mode shape to be included in the combination of modal responses were taken to be ten (10). Based onthe EC8 criterion, the numbers of N mode need to be considered to ensure that the effective modal mass (MX ). participationaccumulated to more than 90% of the total mass of the structure along the direction of interested seismic actions.
Using modal parameters mentioned in previous paragraphs, t Modal Response Spectrum Analyses (MRSA) were per-formed for the three HCPS configurations using the Type 1 horizontal response spectrum of the Eurocode 8. Design groundaation
(ag
). of 0.05 g, 0.075 g and 0.1 g were assigned to the linear horizontal acceleration spectrum (Se). of five different
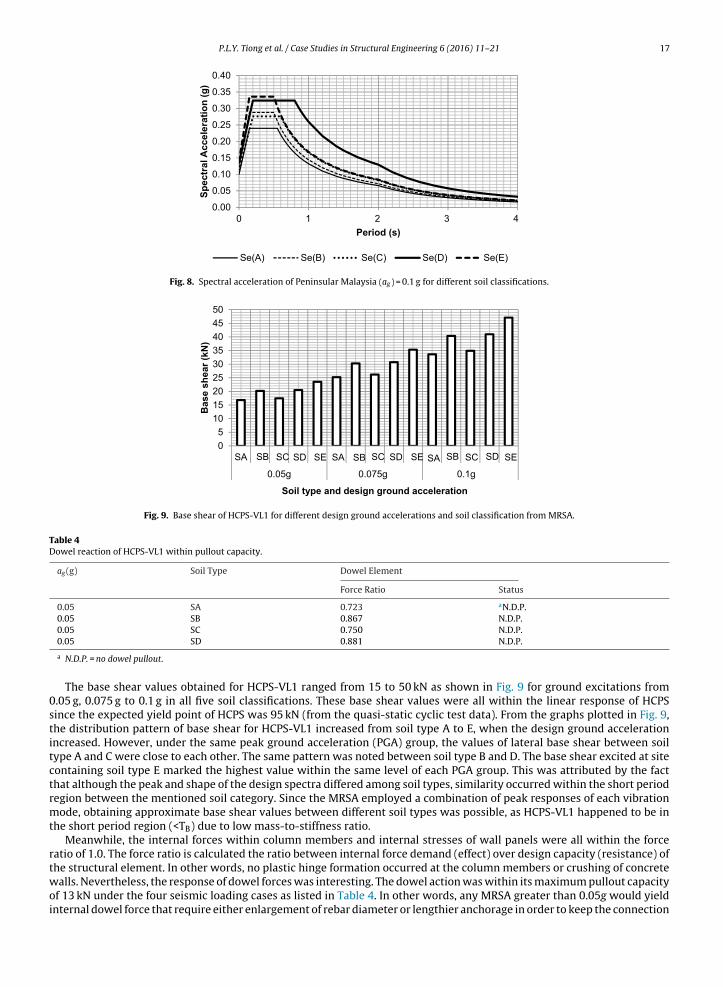
soil conditions (ranging from hard rock SA to soft soil SE) in the response spectrum analysis. It is worthwhile to mention thatbehaviour factor of 1 is used in both the linear MRSA and nonlinear pushover instead of the EC8 proposed value of 1.5. Therationale behind this is to avoid cracks along the wall-column interface which is difficult to repair. The horizontal elasticresponse spectra (Se). for design ground acceleration ag = 0.1 g of Peninsular Malaysia are shown in Fig. 8.
Results of peak values of seismic action effect determined from the MRSA have been divided into three groups as follows:
a) Global effect: base shears,b) Local effect: member internal forces, and
(c) Intermediate effect: interstorey drifts.
P.L.Y. Tiong et al. / Case Studies in Structural Engineering 6 (2016) 11–21 17
0.00
0.05
0.10
0.15
0.20
0.25
0.30
0.35
0.40
43210
Sp
ec
tra
l A
cc
ele
rati
on
(g
)
Period (s)
Se(A) Se( B) Se(C) Se(D) Se( E)
Fig. 8. Spectral acceleration of Peninsular Malaysia (ag ) = 0.1 g for different soil classifications.
0
5
10
15
20
25
30
35
40
45
50
SESDSCSBSASESDSCSBSASESDSCSBSA
0.1g0.075g0.05g
Ba
se
sh
ea
r (k
N)
Soil type and design ground acceleration
Fig. 9. Base shear of HCPS-VL1 for different design ground accelerations and soil classification from MRSA.
Table 4Dowel reaction of HCPS-VL1 within pullout capacity.
ag (g) Soil Type Dowel Element
Force Ratio Status
0.05 SA 0.723 aN.D.P.0.05 SB 0.867 N.D.P.
0stitctrmt
rtwoi
0.05 SC 0.750 N.D.P.0.05 SD 0.881 N.D.P.
a N.D.P. = no dowel pullout.
The base shear values obtained for HCPS-VL1 ranged from 15 to 50 kN as shown in Fig. 9 for ground excitations from.05 g, 0.075 g to 0.1 g in all five soil classifications. These base shear values were all within the linear response of HCPSince the expected yield point of HCPS was 95 kN (from the quasi-static cyclic test data). From the graphs plotted in Fig. 9,he distribution pattern of base shear for HCPS-VL1 increased from soil type A to E, when the design ground accelerationncreased. However, under the same peak ground acceleration (PGA) group, the values of lateral base shear between soilype A and C were close to each other. The same pattern was noted between soil type B and D. The base shear excited at siteontaining soil type E marked the highest value within the same level of each PGA group. This was attributed by the facthat although the peak and shape of the design spectra differed among soil types, similarity occurred within the short periodegion between the mentioned soil category. Since the MRSA employed a combination of peak responses of each vibrationode, obtaining approximate base shear values between different soil types was possible, as HCPS-VL1 happened to be in
he short period region (<TB) due to low mass-to-stiffness ratio.Meanwhile, the internal forces within column members and internal stresses of wall panels were all within the force
atio of 1.0. The force ratio is calculated the ratio between internal force demand (effect) over design capacity (resistance) of
he structural element. In other words, no plastic hinge formation occurred at the column members or crushing of concretealls. Nevertheless, the response of dowel forces was interesting. The dowel action was within its maximum pullout capacityf 13 kN under the four seismic loading cases as listed in Table 4. In other words, any MRSA greater than 0.05g would yieldnternal dowel force that require either enlargement of rebar diameter or lengthier anchorage in order to keep the connection
18 P.L.Y. Tiong et al. / Case Studies in Structural Engineering 6 (2016) 11–21
0
0.05
0.1
0.15
0.2
0.25
0.3
0.35
0.4
SESDSCSBSASESDSCSBSASESDSCSBSA
0.1g0.075g0.05g
To
p d
isp
lacem
en
t (m
m)
Soil type and design ground acceleration
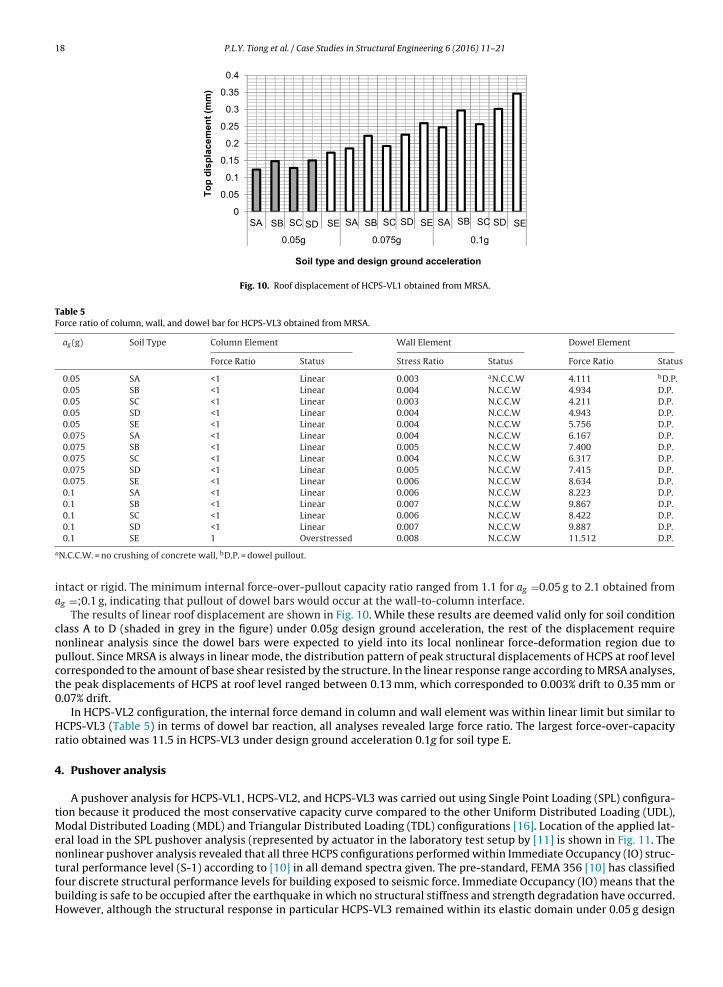
Fig. 10. Roof displacement of HCPS-VL1 obtained from MRSA.
Table 5Force ratio of column, wall, and dowel bar for HCPS-VL3 obtained from MRSA.
ag (g) Soil Type Column Element Wall Element Dowel Element
Force Ratio Status Stress Ratio Status Force Ratio Status
0.05 SA <1 Linear 0.003 aN.C.C.W 4.111 bD.P.0.05 SB <1 Linear 0.004 N.C.C.W 4.934 D.P.0.05 SC <1 Linear 0.003 N.C.C.W 4.211 D.P.0.05 SD <1 Linear 0.004 N.C.C.W 4.943 D.P.0.05 SE <1 Linear 0.004 N.C.C.W 5.756 D.P.0.075 SA <1 Linear 0.004 N.C.C.W 6.167 D.P.0.075 SB <1 Linear 0.005 N.C.C.W 7.400 D.P.0.075 SC <1 Linear 0.004 N.C.C.W 6.317 D.P.0.075 SD <1 Linear 0.005 N.C.C.W 7.415 D.P.0.075 SE <1 Linear 0.006 N.C.C.W 8.634 D.P.0.1 SA <1 Linear 0.006 N.C.C.W 8.223 D.P.0.1 SB <1 Linear 0.007 N.C.C.W 9.867 D.P.0.1 SC <1 Linear 0.006 N.C.C.W 8.422 D.P.0.1 SD <1 Linear 0.007 N.C.C.W 9.887 D.P.
0.1 SE 1 Overstressed 0.008 N.C.C.W 11.512 D.P.aN.C.C.W. = no crushing of concrete wall, bD.P. = dowel pullout.
intact or rigid. The minimum internal force-over-pullout capacity ratio ranged from 1.1 for ag =0.05 g to 2.1 obtained fromag =;0.1 g, indicating that pullout of dowel bars would occur at the wall-to-column interface.
The results of linear roof displacement are shown in Fig. 10. While these results are deemed valid only for soil conditionclass A to D (shaded in grey in the figure) under 0.05g design ground acceleration, the rest of the displacement requirenonlinear analysis since the dowel bars were expected to yield into its local nonlinear force-deformation region due topullout. Since MRSA is always in linear mode, the distribution pattern of peak structural displacements of HCPS at roof levelcorresponded to the amount of base shear resisted by the structure. In the linear response range according to MRSA analyses,the peak displacements of HCPS at roof level ranged between 0.13 mm, which corresponded to 0.003% drift to 0.35 mm or0.07% drift.
In HCPS-VL2 configuration, the internal force demand in column and wall element was within linear limit but similar toHCPS-VL3 (Table 5) in terms of dowel bar reaction, all analyses revealed large force ratio. The largest force-over-capacityratio obtained was 11.5 in HCPS-VL3 under design ground acceleration 0.1g for soil type E.
4. Pushover analysis
A pushover analysis for HCPS-VL1, HCPS-VL2, and HCPS-VL3 was carried out using Single Point Loading (SPL) configura-tion because it produced the most conservative capacity curve compared to the other Uniform Distributed Loading (UDL),Modal Distributed Loading (MDL) and Triangular Distributed Loading (TDL) configurations [16]. Location of the applied lat-eral load in the SPL pushover analysis (represented by actuator in the laboratory test setup by [11] is shown in Fig. 11. Thenonlinear pushover analysis revealed that all three HCPS configurations performed within Immediate Occupancy (IO) struc-
tural performance level (S-1) according to [10] in all demand spectra given. The pre-standard, FEMA 356 [10] has classifiedfour discrete structural performance levels for building exposed to seismic force. Immediate Occupancy (IO) means that thebuilding is safe to be occupied after the earthquake in which no structural stiffness and strength degradation have occurred.However, although the structural response in particular HCPS-VL3 remained within its elastic domain under 0.05 g design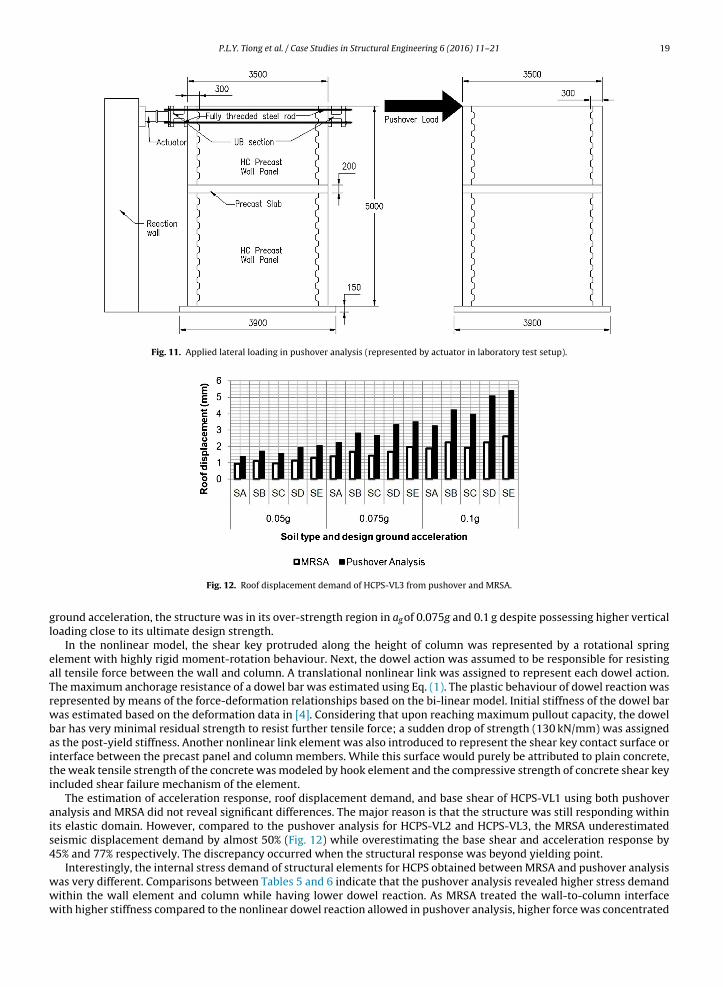
P.L.Y. Tiong et al. / Case Studies in Structural Engineering 6 (2016) 11–21 19
Fig. 11. Applied lateral loading in pushover analysis (represented by actuator in laboratory test setup).
gl
eaTrwbaiti
ais4
www
Fig. 12. Roof displacement demand of HCPS-VL3 from pushover and MRSA.
round acceleration, the structure was in its over-strength region in agof 0.075g and 0.1 g despite possessing higher verticaloading close to its ultimate design strength.
In the nonlinear model, the shear key protruded along the height of column was represented by a rotational springlement with highly rigid moment-rotation behaviour. Next, the dowel action was assumed to be responsible for resistingll tensile force between the wall and column. A translational nonlinear link was assigned to represent each dowel action.he maximum anchorage resistance of a dowel bar was estimated using Eq. (1). The plastic behaviour of dowel reaction wasepresented by means of the force-deformation relationships based on the bi-linear model. Initial stiffness of the dowel baras estimated based on the deformation data in [4]. Considering that upon reaching maximum pullout capacity, the dowel
ar has very minimal residual strength to resist further tensile force; a sudden drop of strength (130 kN/mm) was assigneds the post-yield stiffness. Another nonlinear link element was also introduced to represent the shear key contact surface ornterface between the precast panel and column members. While this surface would purely be attributed to plain concrete,he weak tensile strength of the concrete was modeled by hook element and the compressive strength of concrete shear keyncluded shear failure mechanism of the element.
The estimation of acceleration response, roof displacement demand, and base shear of HCPS-VL1 using both pushovernalysis and MRSA did not reveal significant differences. The major reason is that the structure was still responding withints elastic domain. However, compared to the pushover analysis for HCPS-VL2 and HCPS-VL3, the MRSA underestimatedeismic displacement demand by almost 50% (Fig. 12) while overestimating the base shear and acceleration response by5% and 77% respectively. The discrepancy occurred when the structural response was beyond yielding point.
Interestingly, the internal stress demand of structural elements for HCPS obtained between MRSA and pushover analysisas very different. Comparisons between Tables 5 and 6 indicate that the pushover analysis revealed higher stress demandithin the wall element and column while having lower dowel reaction. As MRSA treated the wall-to-column interfaceith higher stiffness compared to the nonlinear dowel reaction allowed in pushover analysis, higher force was concentrated
20 P.L.Y. Tiong et al. / Case Studies in Structural Engineering 6 (2016) 11–21
Table 6Force ratio of column, wall and dowel bar for HCPS-VL3 obtained from pushover analysis.
ag (g) Soil Type Column Element Wall Element Dowel Element
Force Ratio Status Stress Ratio Status Force Ratio Status
0.05 SA <1 Linear 0.074 aN.C.C.W 0.210 bN.D.P.0.05 SB <1 Linear 0.074 N.C.C.W 0.210 N.D.P.0.05 SC <1 Linear 0.074 N.C.C.W 0.210 N.D.P.0.05 SD <1 Linear 0.074 N.C.C.W 0.210 N.D.P.0.05 SE <1 Linear 0.074 N.C.C.W 0.196 N.D.P.0.075 SA <1 Linear 0.074 N.C.C.W 0.196 N.D.P.0.075 SB <1 Linear 0.152 N.C.C.W 0.748 *N.D.P.0.075 SC <1 Linear 0.152 N.C.C.W 0.748 *N.D.P.0.075 SD <1 Linear 0.152 N.C.C.W 0.748 *N.D.P.0.075 SE 1 Overstressed 0.152 N.C.C.W 0.748 *N.D.P.0.1 SA 1 Overstressed 0.122 N.C.C.W 0.208 N.D.P.0.1 SB <1 Linear 0.153 N.C.C.W 0.968 *N.D.P.0.1 SC <1 Linear 0.152 N.C.C.W 0.748 *N.D.P.
.
.
0.1 SD <1 Linear 0.153 N.C.C.W 0.968 *N.D.P0.1 SE 1.25 Overstressed 0.168 N.C.C.W 0.968 *N.D.PaN.C.C.W. = no crushing of concrete wall, bN.D.P. = no dowel pullout.
within the dowel bars in MRSA. The linear MRSA was observed to over-estimate the dowel force demand exerted by theseismic action onto HCPS. Although the base shear values between the linear MRSA and nonlinear pushover analyses wererelatively in tandem, the roof acceleration responses between the two differed vastly.
The reason is due the difference of wall-to-column interface mainly the dowel stiffness that was used in these twoanalyses. This only occurred when the seismic demand had exceeded those linear capacities of HCPS, such as those occurringin 0.1g for soil type E. In the linear analysis, the model only took into account the initial stiffness of dowel bar due tothe procedure in linear procedure. The degradation of local joint was unable to be included in the analysis regardless ofoccurrence of any yielding. Meanwhile, the nonlinear pushover analysis was able to utilize the true force-deformationrelationship established for the dowel action due to pullout, and failure in shear key elements. These local nonlinear effectscaused additional energy dissipation of the HCPS and thus leading to a less stiff structure compared to the linear model. Asa result, the roof acceleration responses became lower than the linear analyses. The same theory applies to the estimationregarding displacement.
5. Conclusion
MRSA and pushover analysis of the three vertical loading configurations of HCPS under Malaysia earthquake conditionswere performed using response spectrum developed by [1] for the country. The study shows that MRSA overestimated thedowel reaction in HCPS due to the nature of analysis that combined all internal forces within the link elements in positivevalues. This treated all forces in tension acting along the dowel bars. Hence, dowel pullout was observed from MRSA evenat very small design ag (as low as 0.05g in soil classification class E).
The pushover analysis revealed that regardless of the level of design ground acceleration used, HCPS-VL1, HCPS-VL2 andHCPS-VL3 remained within Immediate Occupancy (IO) structural performance level according to [10]. Thus, retrofitting ofcompleted buildings within the vertical loading used in this study is not required when the EC8 is to be implemented inMalaysia in the near future. However, further assessment is required if the structural configuration differs vastly from theone used in this study or when the geometrical aspects do not meet the requirements of EC8. In addition, the out-of-planeresistance and behaviour of the wall panel may be further investigated.
References
[1] A. Adnan, Marto A. Hendriyawan, M. Irsyam, Seismic hazard assessment for Peninsular Malaysia using Gumbel distribution method, J. Teknol. 42 (B)(2005) 57–73.
[2] ASCE, ASCE 7-10 7–10: Minimum Design Loadings for Buildings and Other Structures, American Society of Civil Engineers, US, 2010.[3] M. Azmi, J. Kiyono, A. Furukawa, Development of probabilistic seismic hazard map of Penang Island: MalaysiaDevelopment of probabilistic seismic
hazard map of Penang Island: malaysia, J. Disaster Mitig. Historical Cities 7 (July) (2013) 153–160.[4] F. Bljuger, Design of precast concrete structuresDesign of Precast Concrete Structures, Ellis Horwood, West Sussex, England, 1988.[5] British Standards Institution, BS6399: Loading for buildings. Part 1- Code of practice for dead and imposed loadsBS6399: Loading for Buildings. Part
1- Code of Practice for Dead and Imposed Loads, British Standards Institution, London, 1984.[6] British Standards Institution, BS8110: Structural use of concrete. Part 1- Code of practice for design and constructionBS8110: Structural Use of
Concrete. Part 1- Code of Practice for Design and Construction, British Standards Institution, London, 1997.[7] CEN, Eurocode 8: Design of Structures for Earthquake Resistance ? Part 1: General Rules, Seismic Actions and Rules for Buildings, British Standards
Institution, London, UK, 2003.[8] J. Chiang, Two-day Eurocode 8 seminar in MalaysiaTwo-day Eurocode 8 Seminar in Malaysia, Institute of Engineers Malaysia, 2011, Unpublished
note.[9] J. Chiang, M.C. Hee, Technical review of JKR’s handbook on seismic design guidelines for concrete buildings in Malaysia, Jurutera (2008), March:
26–28.

[
[
[
[
[
[
[
P.L.Y. Tiong et al. / Case Studies in Structural Engineering 6 (2016) 11–21 21
10] FEMA, FEMA-356: Pre-standard and commentary for the seismic rehabilitation of buildingsFEMA-356: Pre-standard and Commentary for theSeismic Rehabilitation of Buildings, Federal Emergency Management Agency, US, 2000.
11] N.H.A. Hamid, N.M. Mohamad, Z.A. Hamid, S.H.A. Ghani, Seismic behavior of precast shear key wall under in-plane lateral cyclic loading, MalaysianConstr. Res. J. 15 (2) (2014) 63–73.
12] Hendriyawan, Seismic macrozontation of Peninsular Malaysia and microzonation of Kuala Lumpur City Center and Putrajaya. Ph.D. ThesisSeismicMacrozontation of Peninsular Malaysia and Microzonation of Kuala Lumpur City Center and Putrajaya. Ph.D. Thesis, Universiti Teknologi Malaysia,Skudai, 2007.
13] A.B. Nabilah, T. Balendra, Seismic hazard analysis for Kuala Lumpur: MalaysiaSeismic hazard analysis for Kuala Lumpur, Malaysia, J. Earthq. Eng. 16(7) (2012) 1076–1094.
14] A.V. Shoushtari, A. Adnan, M. Zare, N.S.H. Harith, Estimation of the maximum credible hazard in Kuala Lumpur and Singapore due to gigantic
Sumatran megathrust earthquakes: based on a comparative study on attenuation laws, Nat. Hazards 78 (1) (2015) 725–751.15] P.L.Y. Tiong, A. Adnan, Ahmad F, Improved discrete precast concrete wall panels and modular moulds for wet joints in Malaysia, Concr. Plant Int. 6(December) (2011) 150–152.
16] P.L.Y. Tiong, A. Adnan, N.H.A. Hamid, Behaviour factor and displacement estimation of low-ductility precast wall system under seismic actions?Earthq. Struct. 5 (6) (2013) 625–655.