cars, consumers, & credit cycles - manheim auctions pickup cuv / suv van source: manheim...
TRANSCRIPT
Cars, Consumers, & Credit Cycles“History never repeats itself, but it often rhymes”
Tom WebbCox Automotive
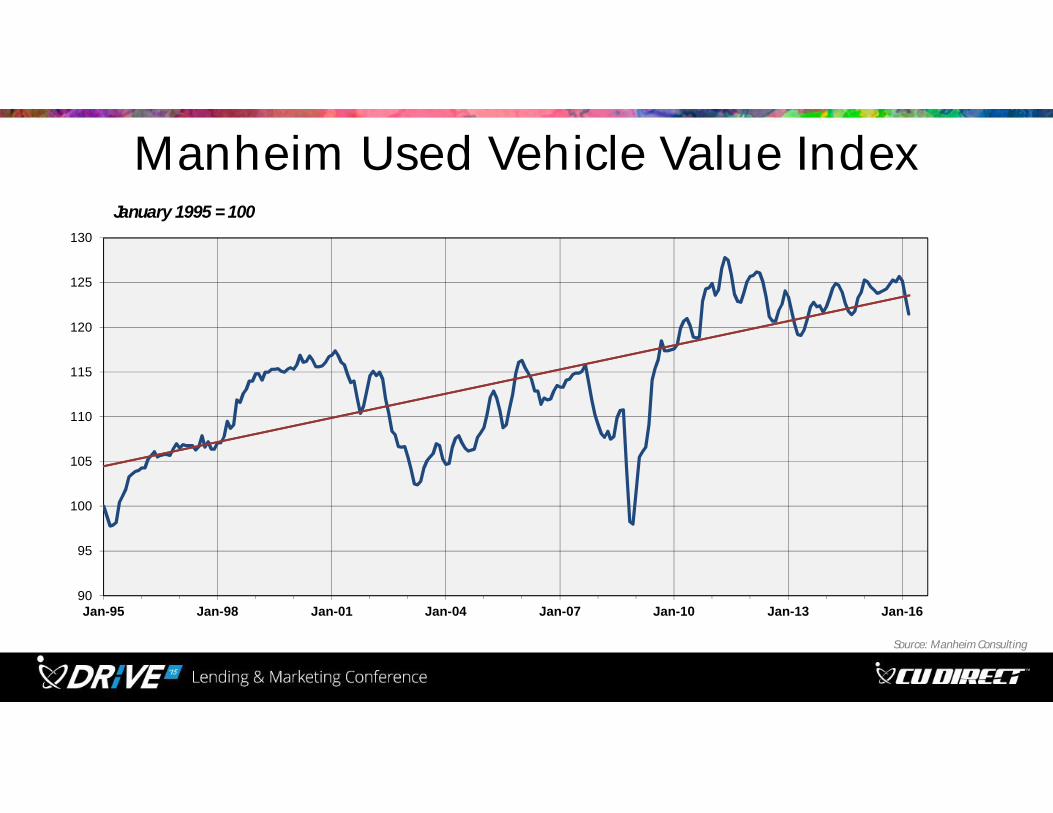
Manheim Used Vehicle Value Index
90
95
100
105
110
115
120
125
130
Jan-95 Jan-98 Jan-01 Jan-04 Jan-07 Jan-10 Jan-13 Jan-16
Source: Manheim Consulting
January 1995 = 100

30%
35%
40%
45%
50%
55%
60%
Source: Bureau of Labor Statistics & Manheim Consulting
Manheim Index vs. Mix & Quality Adjusted New Vehicle Price with 3 ½ year Lag
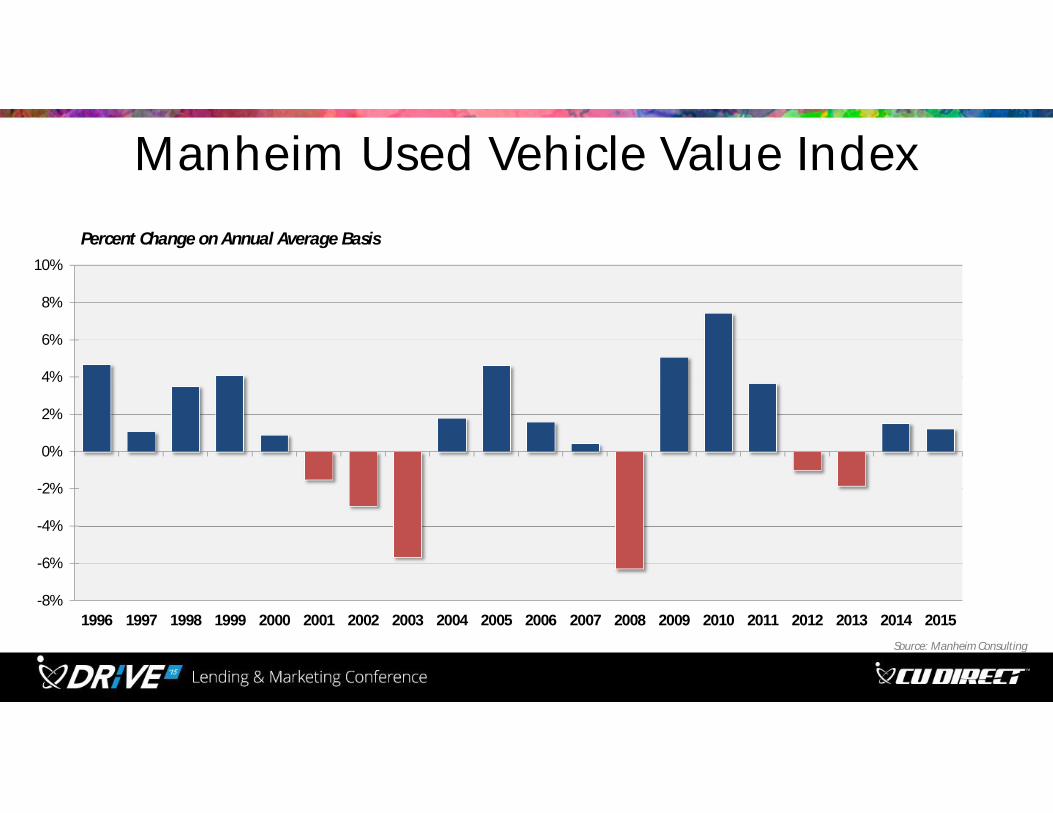
Manheim Used Vehicle Value Index
-8%
-6%
-4%
-2%
0%
2%
4%
6%
8%
10%
1996 1997 1998 1999 2000 2001 2002 2003 2004 2005 2006 2007 2008 2009 2010 2011 2012 2013 2014 2015
Percent Change on Annual Average Basis
Source: Manheim Consulting
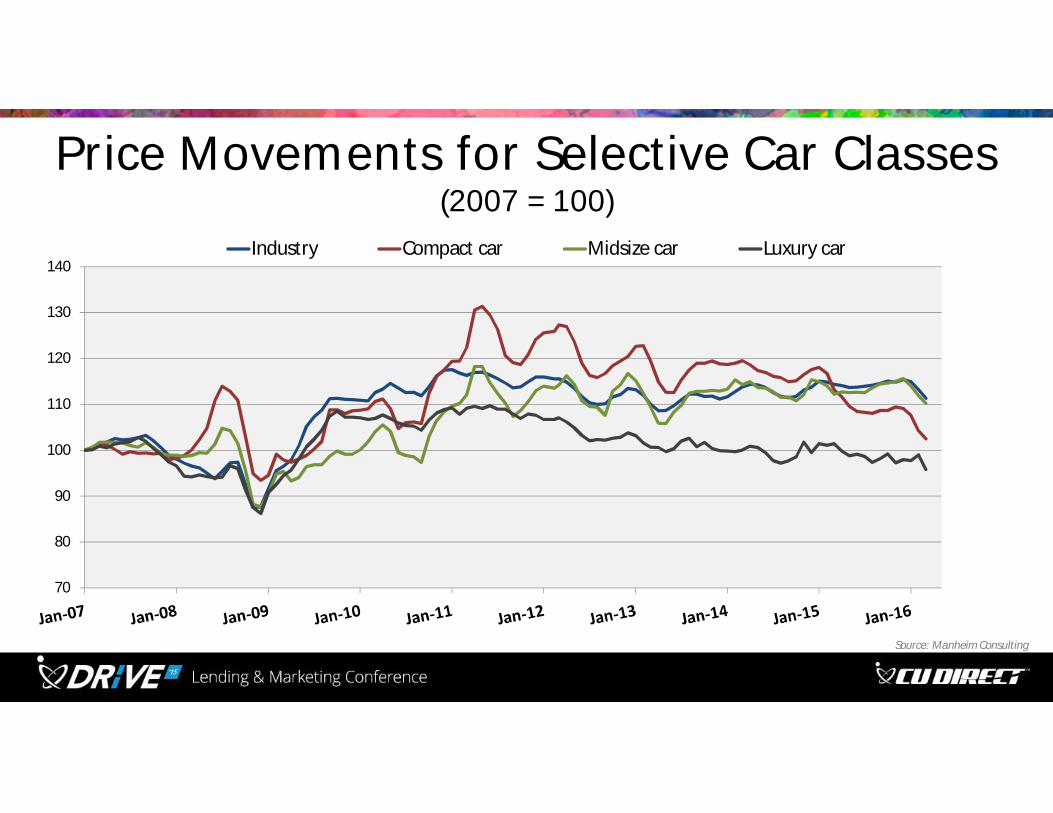
Price Movements for Selective Car Classes (2007 = 100)
70
80
90
100
110
120
130
140Industry Compact car Midsize car Luxury car
Source: Manheim Consulting
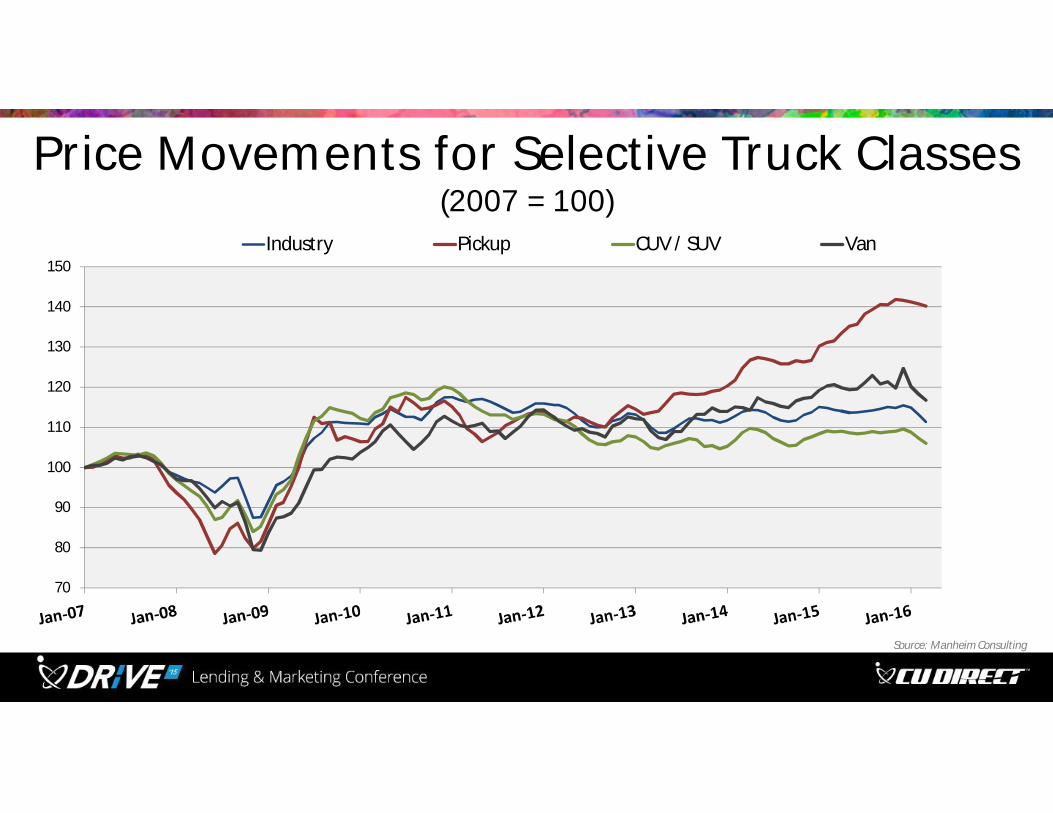
Price Movements for Selective Truck Classes (2007 = 100)
70
80
90
100
110
120
130
140
150Industry Pickup CUV / SUV Van
Source: Manheim Consulting
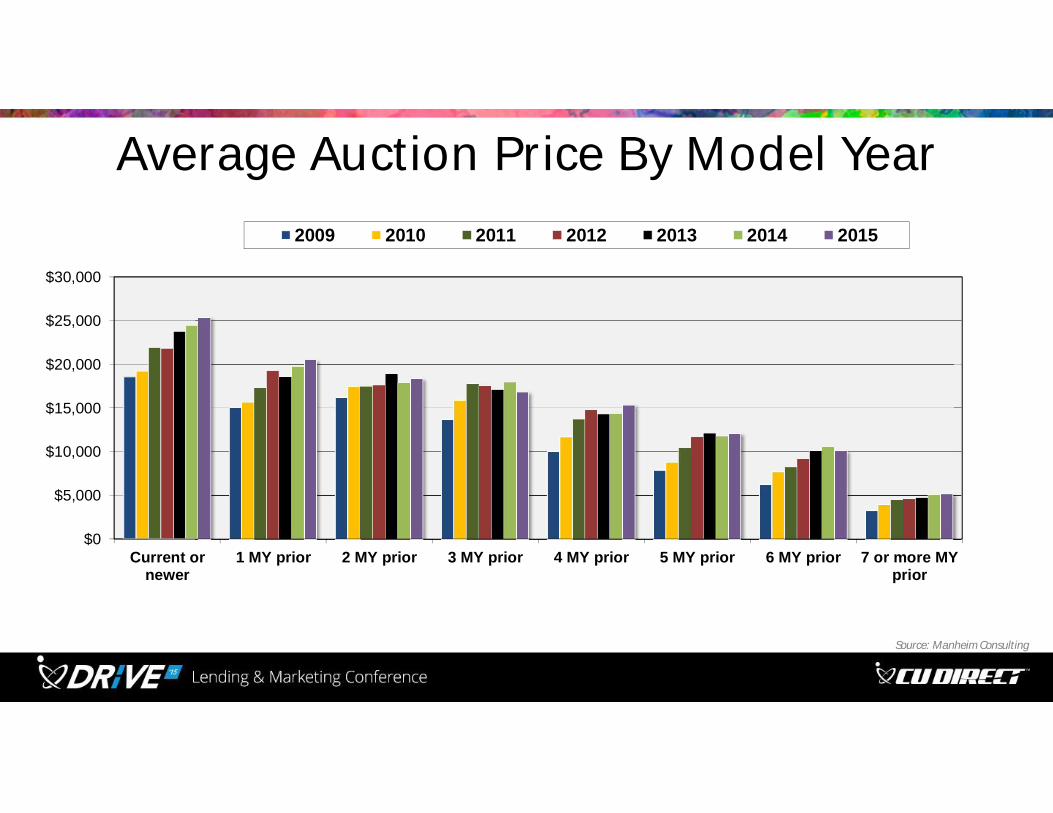
Average Auction Price By Model Year
$0
$5,000
$10,000
$15,000
$20,000
$25,000
$30,000
Current ornewer
1 MY prior 2 MY prior 3 MY prior 4 MY prior 5 MY prior 6 MY prior 7 or more MYprior
2009 2010 2011 2012 2013 2014 2015
Source: Manheim Consulting
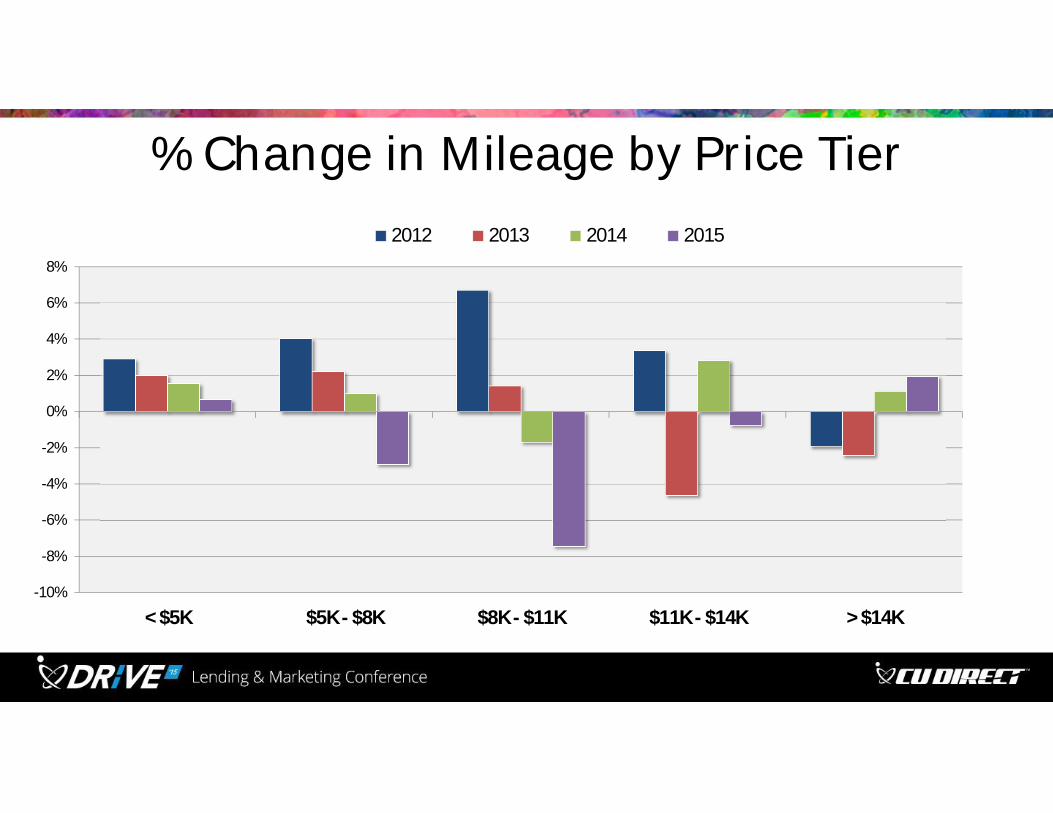
% Change in Mileage by Price Tier
-10%
-8%
-6%
-4%
-2%
0%
2%
4%
6%
8%
< $5K $5K - $8K $8K - $11K $11K - $14K > $14K
2012 2013 2014 2015
Growing Wholesale Supplies

New Vehicle Lease Originations
0.0
0.5
1.0
1.5
2.0
2.5
3.0
3.5
4.0
4.5
1997 1999 2001 2003 2005 2007 2009 2011 2013 2015
Mill
ions
Source: Manheim Consulting
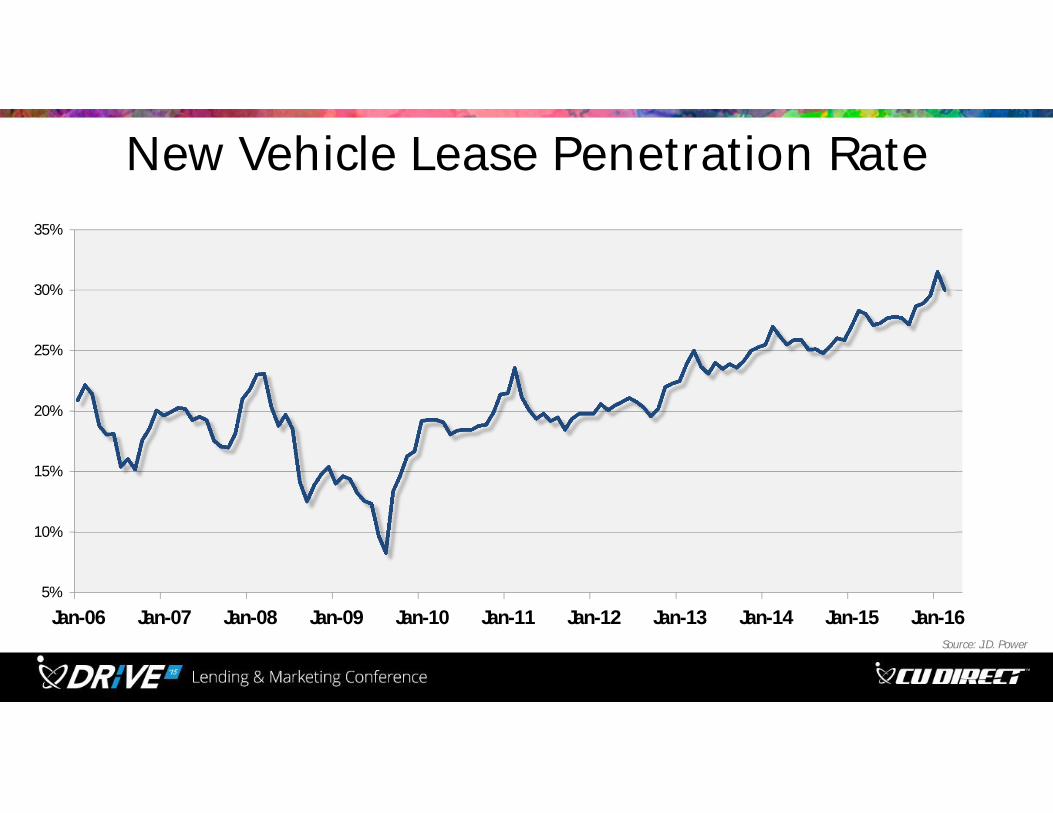
New Vehicle Lease Penetration Rate
5%
10%
15%
20%
25%
30%
35%
Jan-06 Jan-07 Jan-08 Jan-09 Jan-10 Jan-11 Jan-12 Jan-13 Jan-14 Jan-15 Jan-16Source: J.D. Power
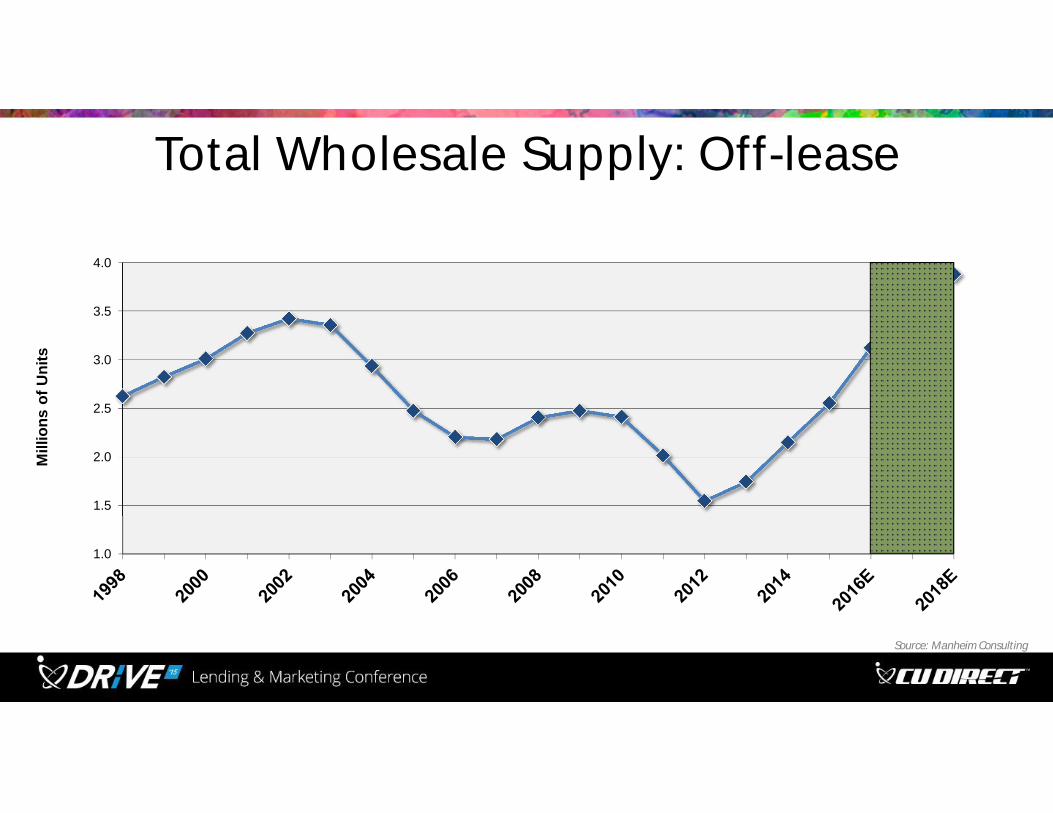
Total Wholesale Supply: Off-lease
1.0
1.5
2.0
2.5
3.0
3.5
4.0
Mill
ions
of U
nits
Source: Manheim Consulting

Off-lease “Return Rate”(not bought by grounding dealer or lessee)
35%
40%
45%
50%
55%
60%
0.0
0.5
1.0
1.5
2.0
2.5
2013 2014 2015 2016 2017 2018 2019 2020
Number Percent
Unit growth from 2015 to 2020: 972,000 units or 82%
Source: Manheim Consulting
Millions of units
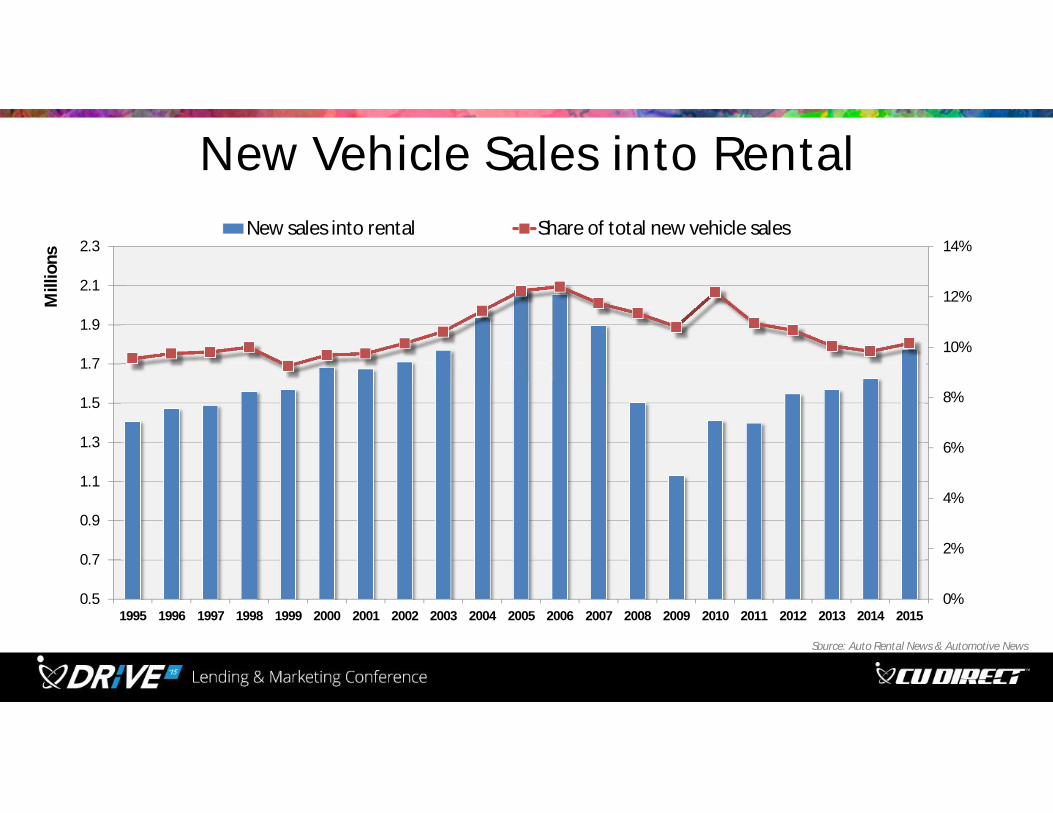
New Vehicle Sales into Rental
0%
2%
4%
6%
8%
10%
12%
14%
0.5
0.7
0.9
1.1
1.3
1.5
1.7
1.9
2.1
2.3
1995 1996 1997 1998 1999 2000 2001 2002 2003 2004 2005 2006 2007 2008 2009 2010 2011 2012 2013 2014 2015
Mill
ions
New sales into rental Share of total new vehicle sales
Source: Auto Rental News & Automotive News

Total Wholesale Supply: Off-rental
0.5
0.7
0.9
1.1
1.3
1.5
1.7
1.9
2.1
2.3
Mill
ions
Source: Manheim Consulting
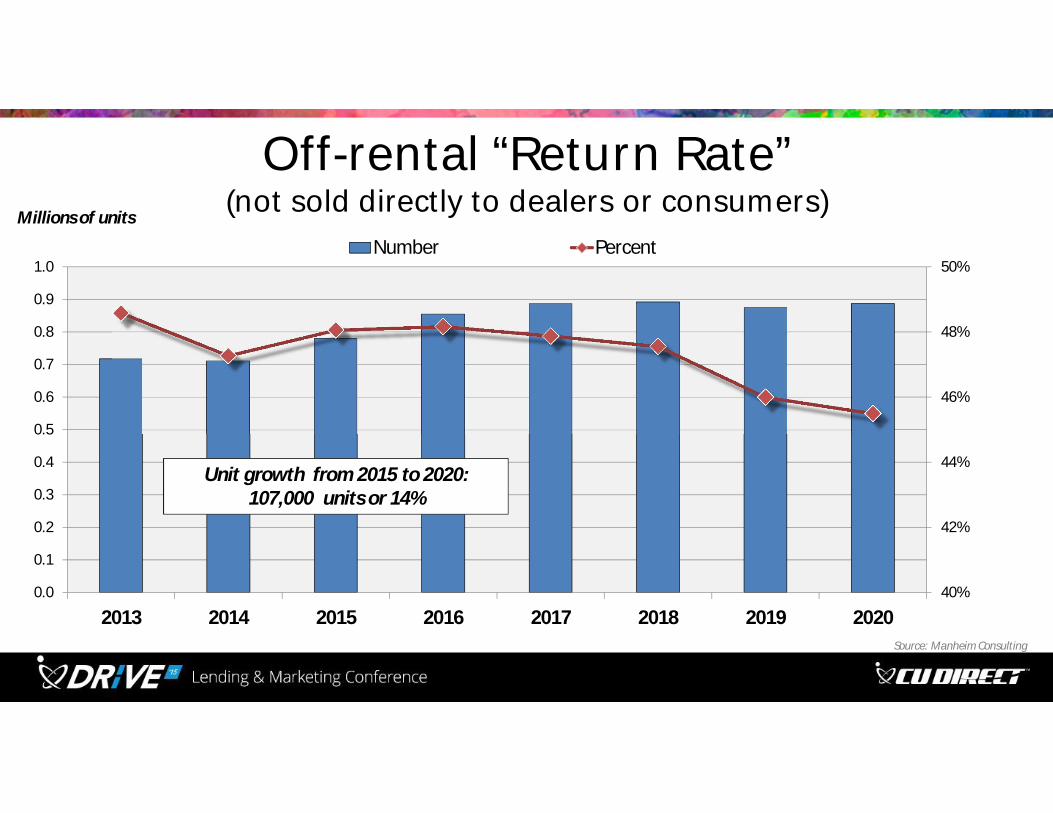
Off-rental “Return Rate”(not sold directly to dealers or consumers)
40%
42%
44%
46%
48%
50%
0.0
0.1
0.2
0.3
0.4
0.5
0.6
0.7
0.8
0.9
1.0
2013 2014 2015 2016 2017 2018 2019 2020
Number Percent
Unit growth from 2015 to 2020: 107,000 units or 14%
Source: Manheim Consulting
Millions of units
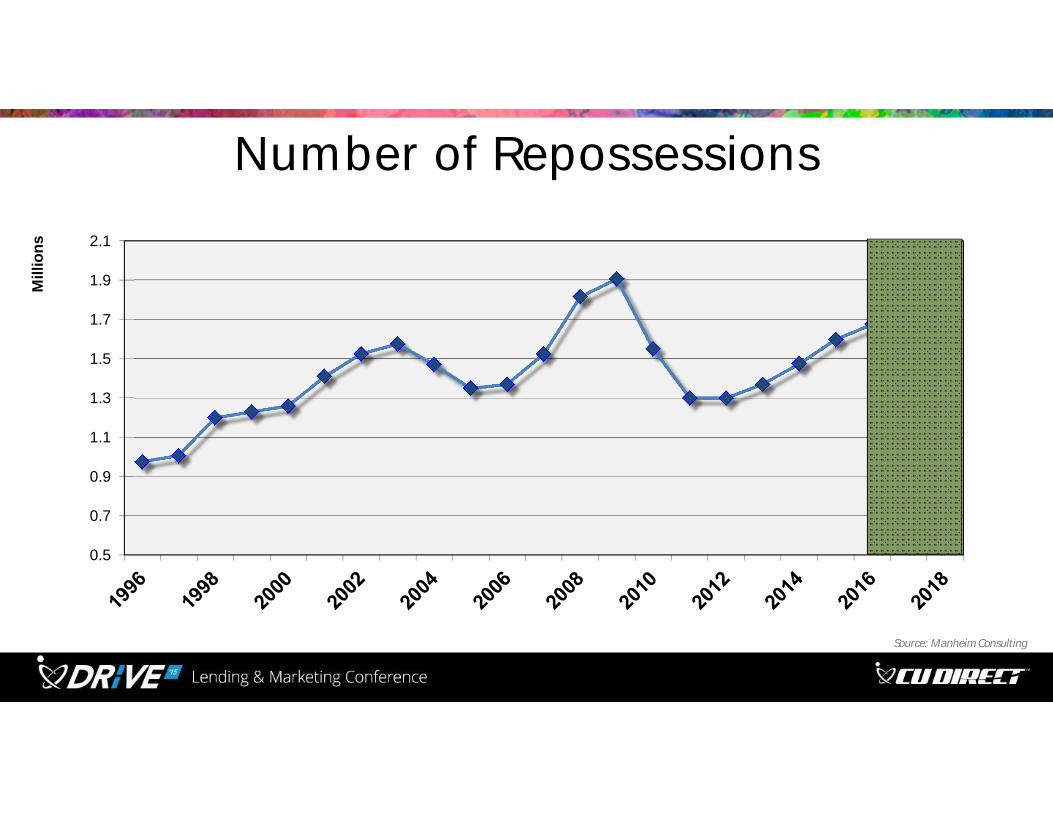
Number of Repossessions
0.5
0.7
0.9
1.1
1.3
1.5
1.7
1.9
2.1
Mill
ions
Source: Manheim Consulting
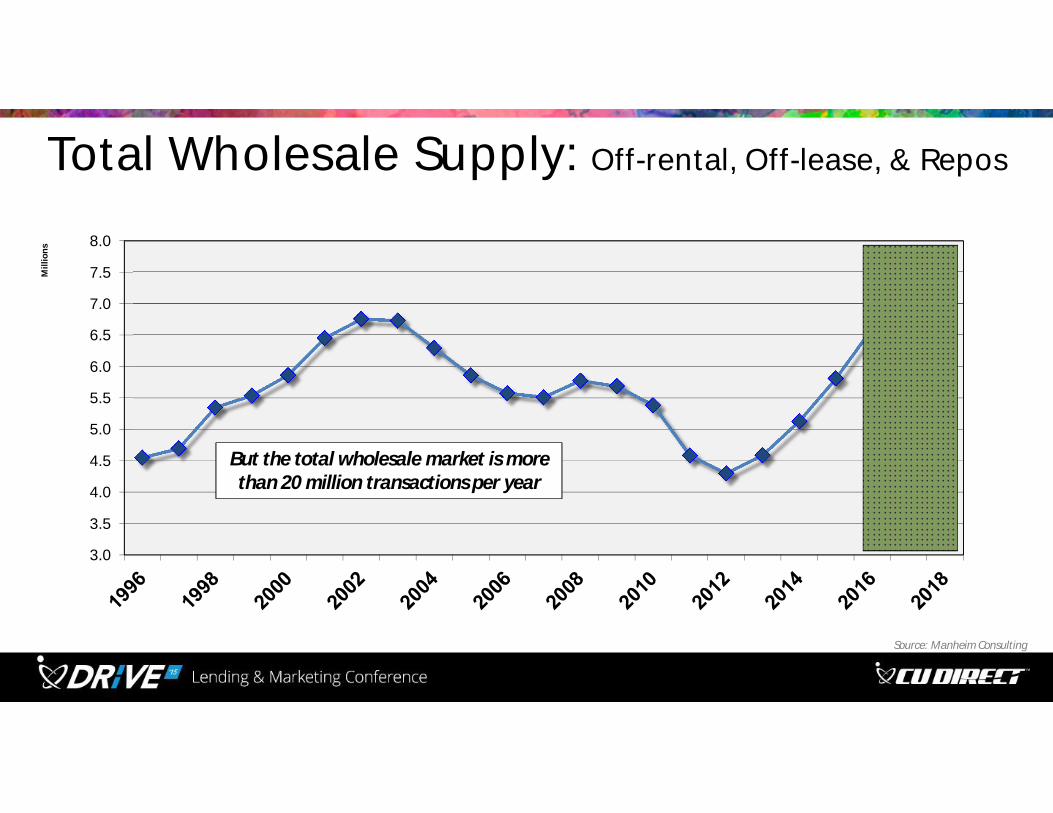
Total Wholesale Supply: Off-rental, Off-lease, & Repos
3.0
3.5
4.0
4.5
5.0
5.5
6.0
6.5
7.0
7.5
8.0
Mill
ions
Source: Manheim Consulting
But the total wholesale market is more than 20 million transactions per year
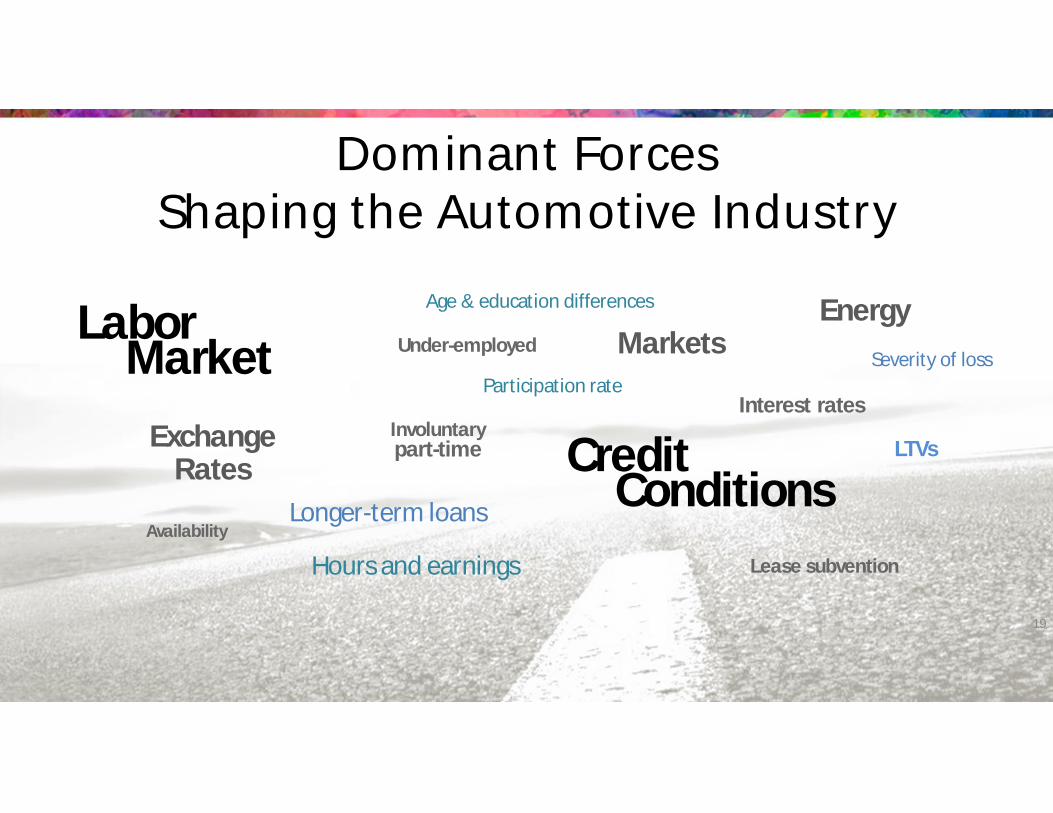
Dominant ForcesShaping the Automotive Industry
19
ExchangeRates
EnergyMarkets
Credit ConditionsLonger-term loans
Availability
Lease subvention
Interest rates
Severity of loss
LTVs
Labor Market
Age & education differences
Participation rate
Hours and earnings
Involuntary part-time
Under-employed
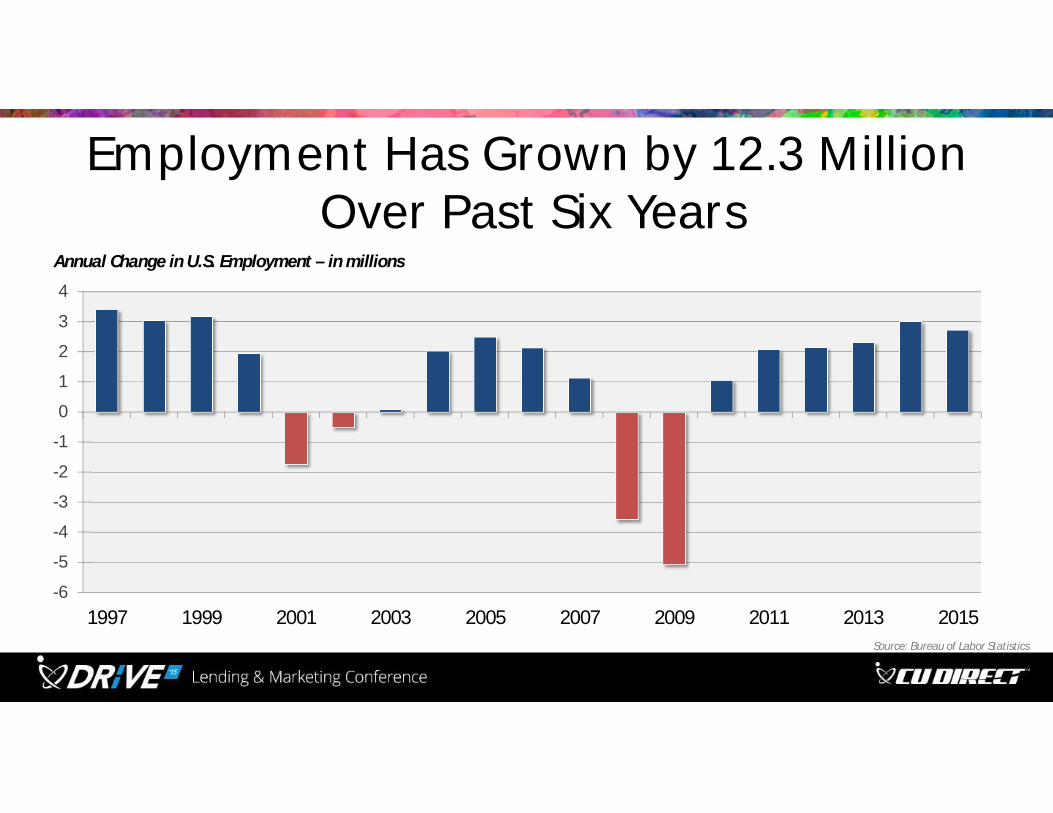
Employment Has Grown by 12.3 MillionOver Past Six Years
-6
-5
-4
-3
-2
-1
0
1
2
3
4
1997 1999 2001 2003 2005 2007 2009 2011 2013 2015Source: Bureau of Labor Statistics
Annual Change in U.S. Employment – in millions

Percent Change From Previous Peak
-10%
-8%
-6%
-4%
-2%
0%
2%
4%
6%
Full-time employment Total employment
Source: BLS
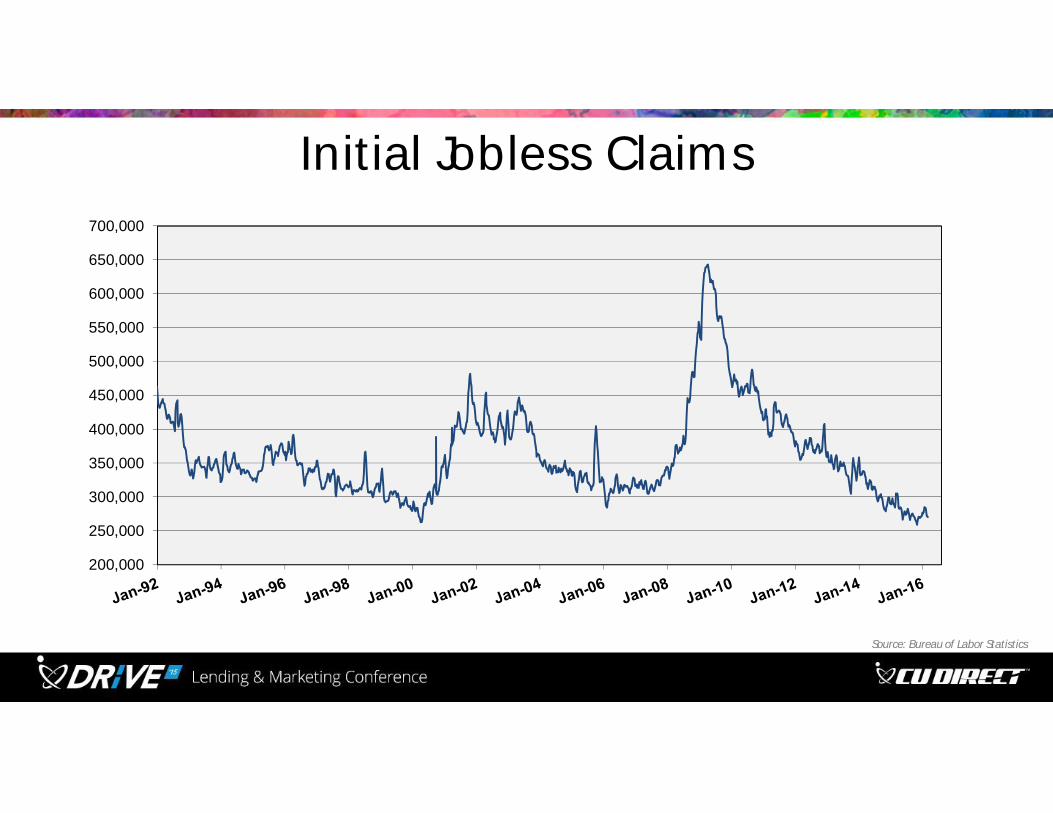
200,000
250,000
300,000
350,000
400,000
450,000
500,000
550,000
600,000
650,000
700,000
Source: Bureau of Labor Statistics
Initial Jobless Claims
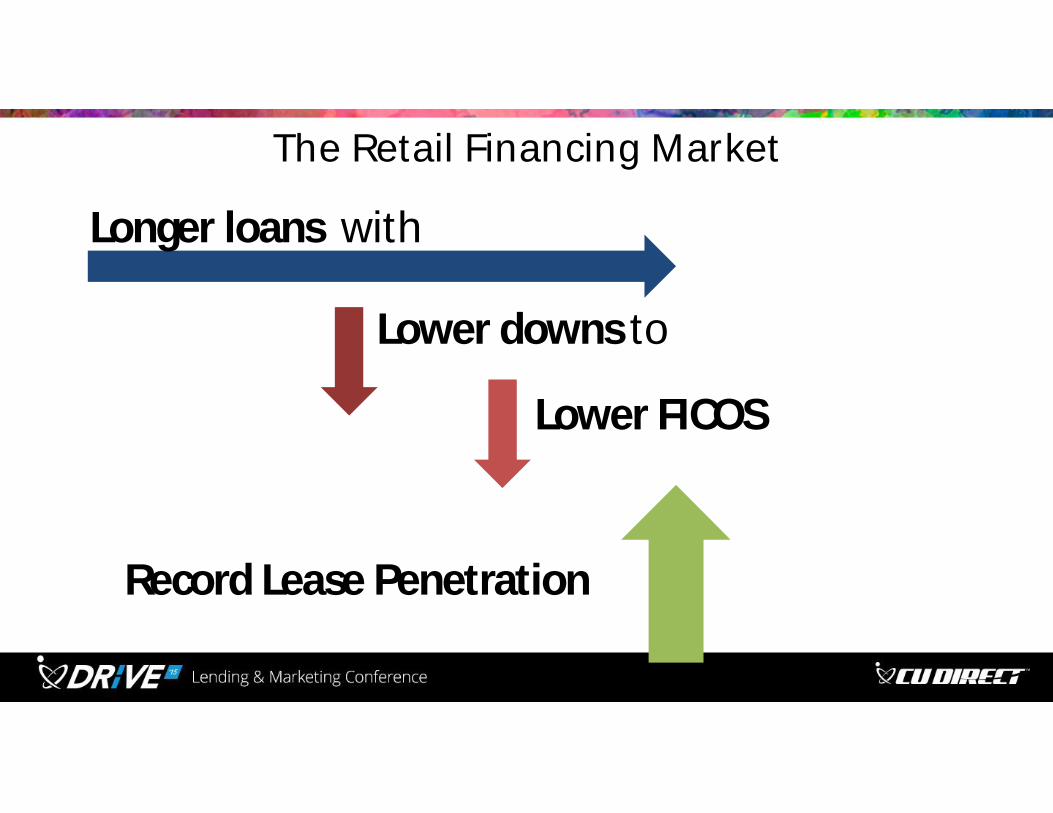
The Retail Financing Market
Longer loans with
Lower downs to
Lower FICOS
Record Lease Penetration
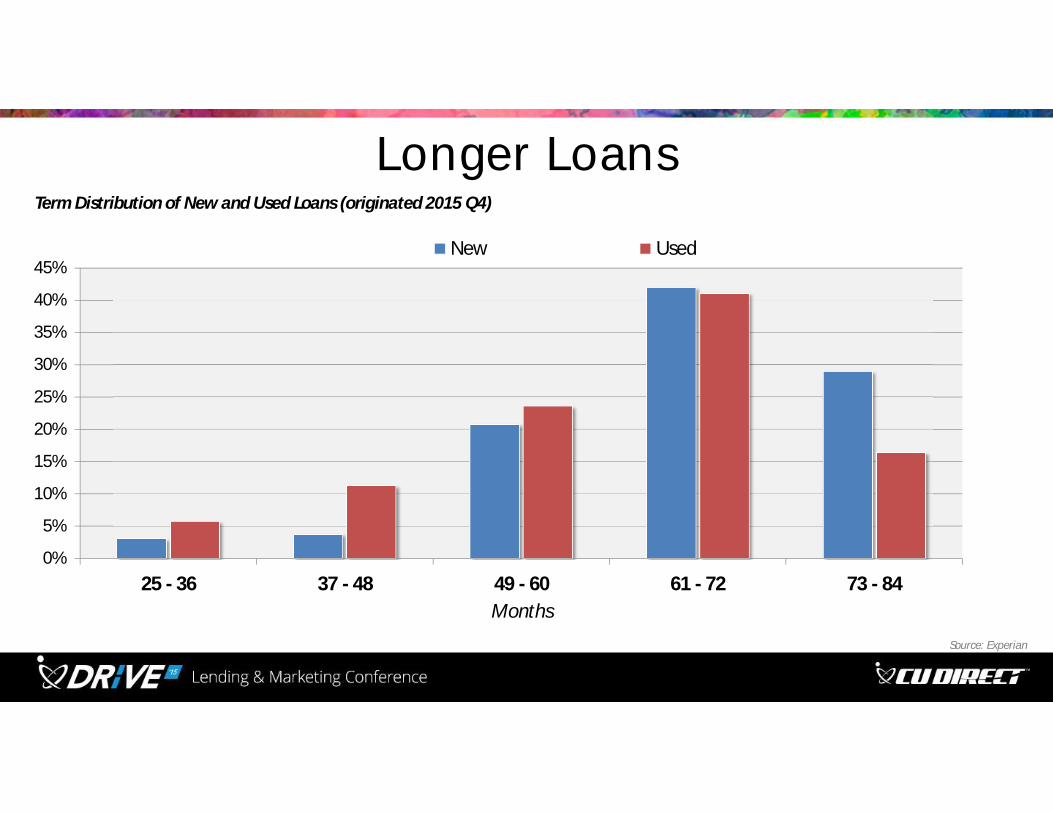
Longer Loans
0%
5%
10%
15%
20%
25%
30%
35%
40%
45%
25 - 36 37 - 48 49 - 60 61 - 72 73 - 84Months
New Used
Source: Experian
Term Distribution of New and Used Loans (originated 2015 Q4)
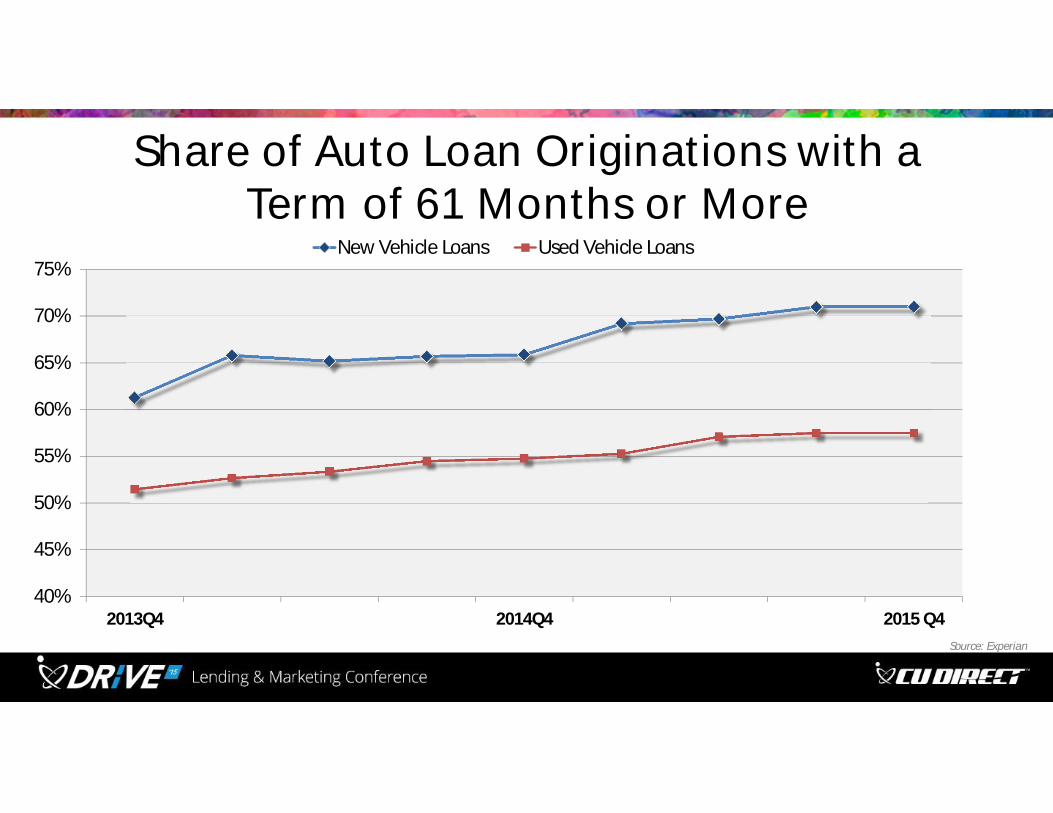
Share of Auto Loan Originations with a Term of 61 Months or More
40%
45%
50%
55%
60%
65%
70%
75%
2013Q4 2014Q4 2015 Q4
New Vehicle Loans Used Vehicle Loans
Source: Experian
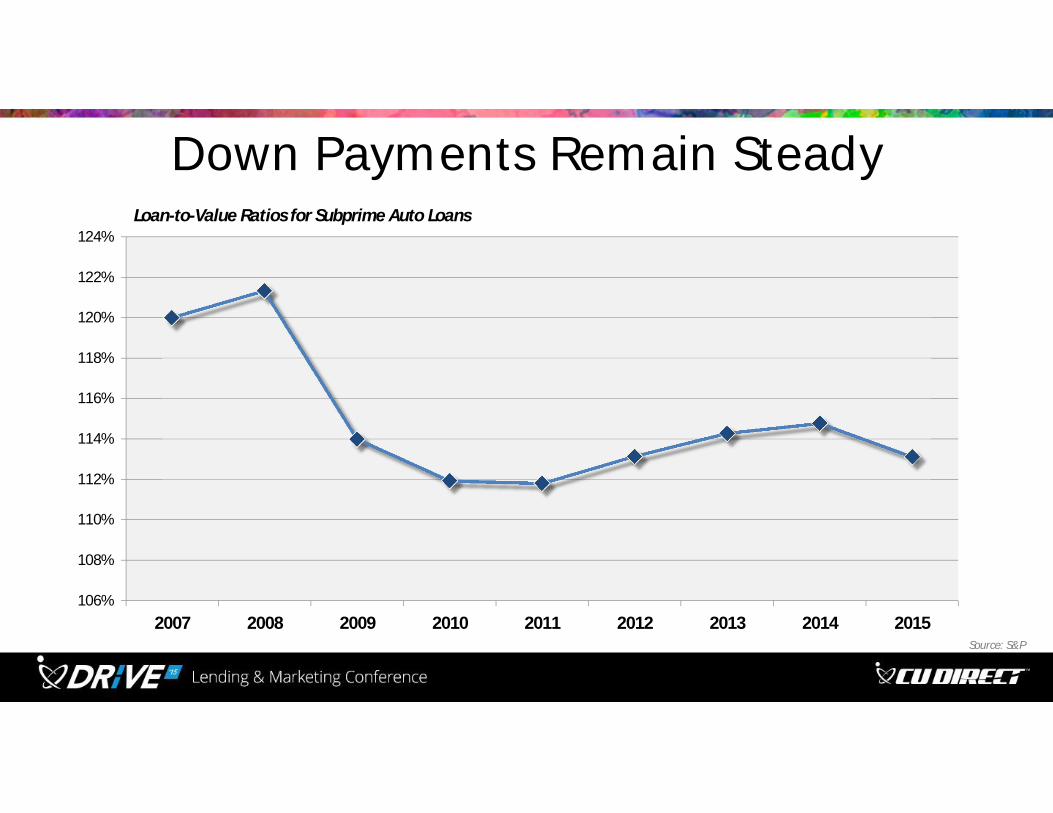
Down Payments Remain Steady
106%
108%
110%
112%
114%
116%
118%
120%
122%
124%
2007 2008 2009 2010 2011 2012 2013 2014 2015Source: S&P
Loan-to-Value Ratios for Subprime Auto Loans
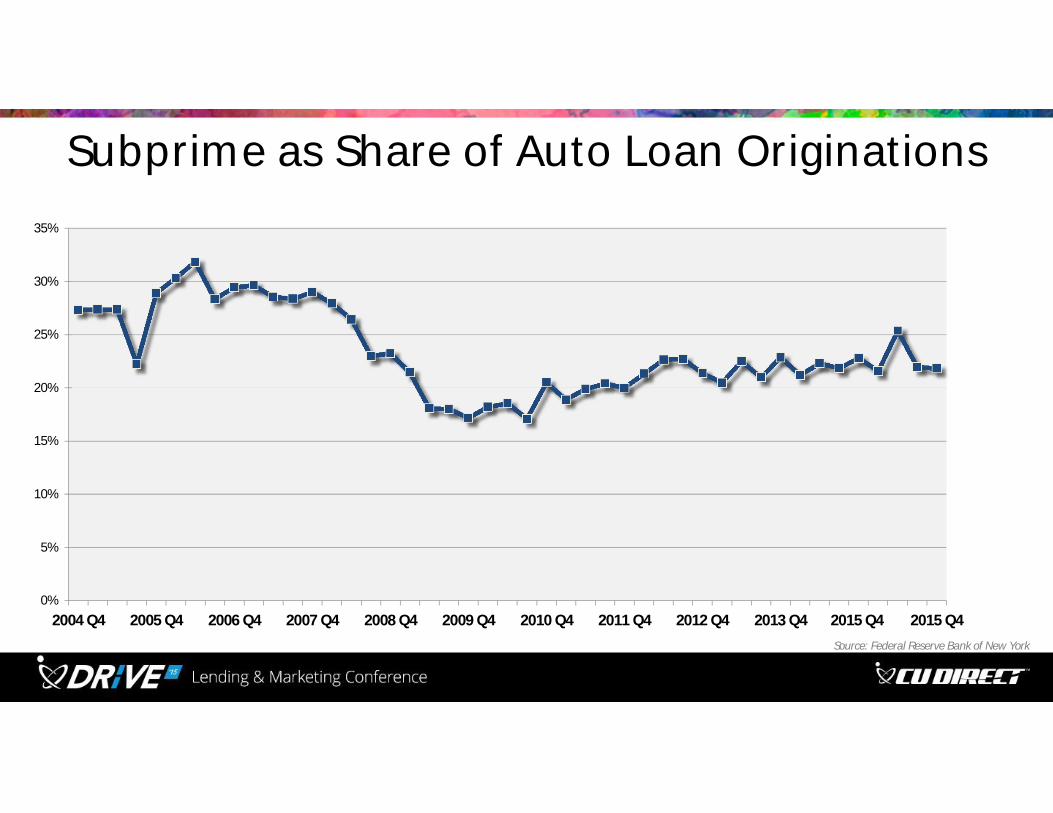
Subprime as Share of Auto Loan Originations
0%
5%
10%
15%
20%
25%
30%
35%
2004 Q4 2005 Q4 2006 Q4 2007 Q4 2008 Q4 2009 Q4 2010 Q4 2011 Q4 2012 Q4 2013 Q4 2015 Q4 2015 Q4
Source: Federal Reserve Bank of New York
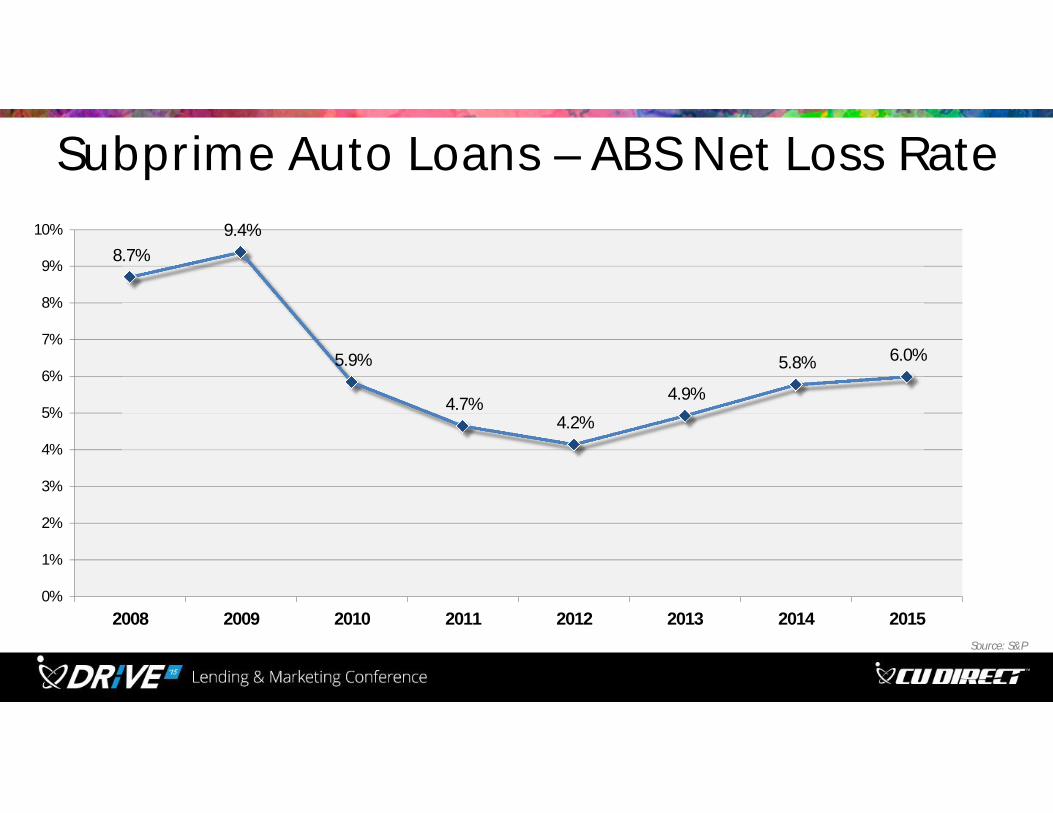
Subprime Auto Loans – ABS Net Loss Rate
8.7%9.4%
5.9%
4.7%4.2%
4.9%
5.8% 6.0%
0%
1%
2%
3%
4%
5%
6%
7%
8%
9%
10%
2008 2009 2010 2011 2012 2013 2014 2015Source: S&P
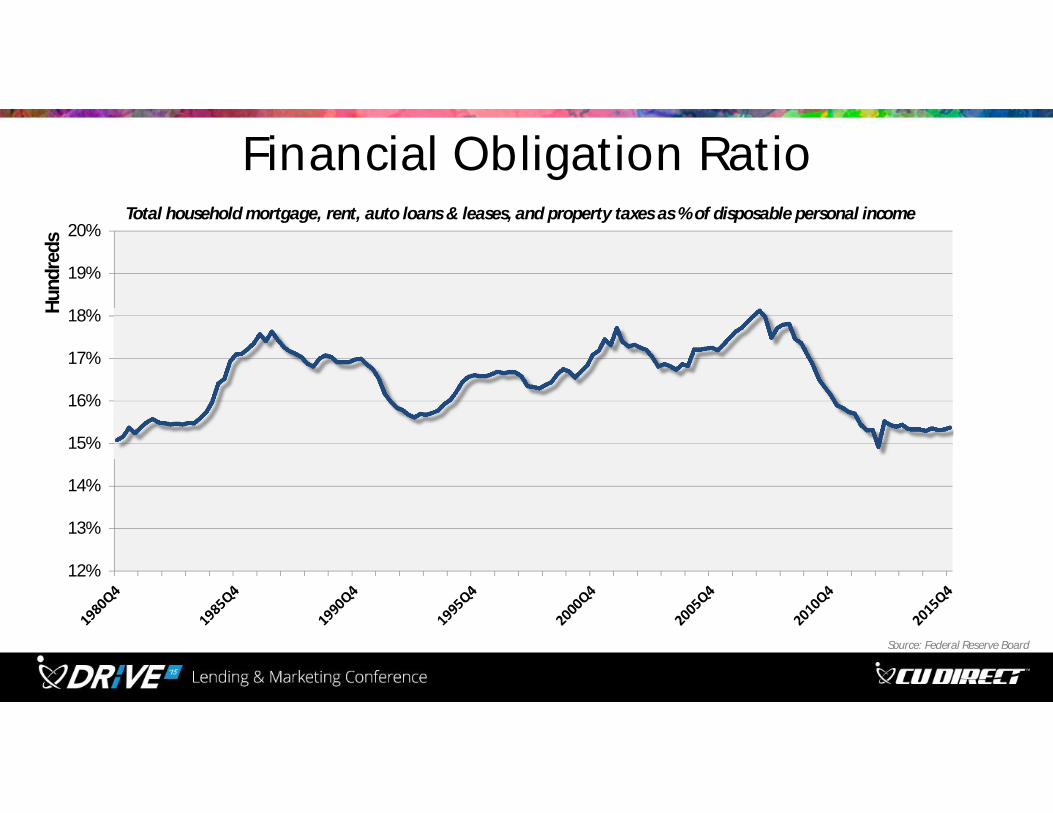
Financial Obligation Ratio
12%
13%
14%
15%
16%
17%
18%
19%
20%
Hund
reds
Total household mortgage, rent, auto loans & leases, and property taxes as % of disposable personal income
Source: Federal Reserve Board
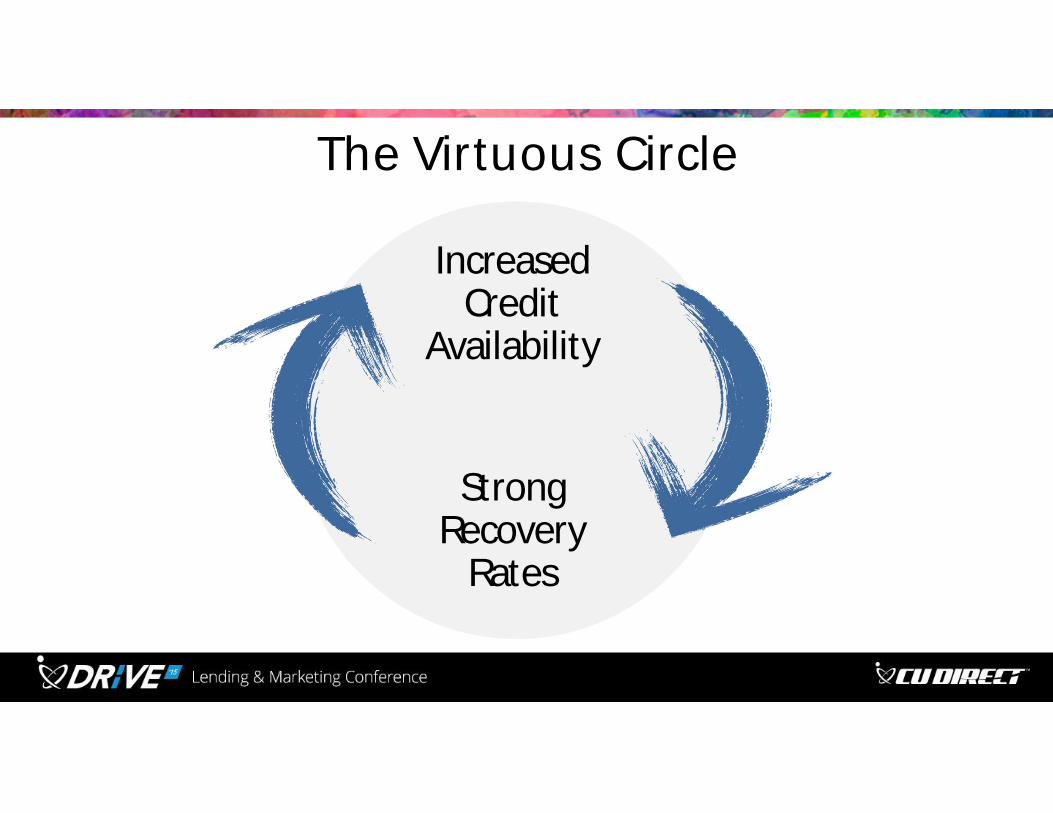
The Virtuous Circle
IncreasedCredit
Availability
StrongRecovery
Rates
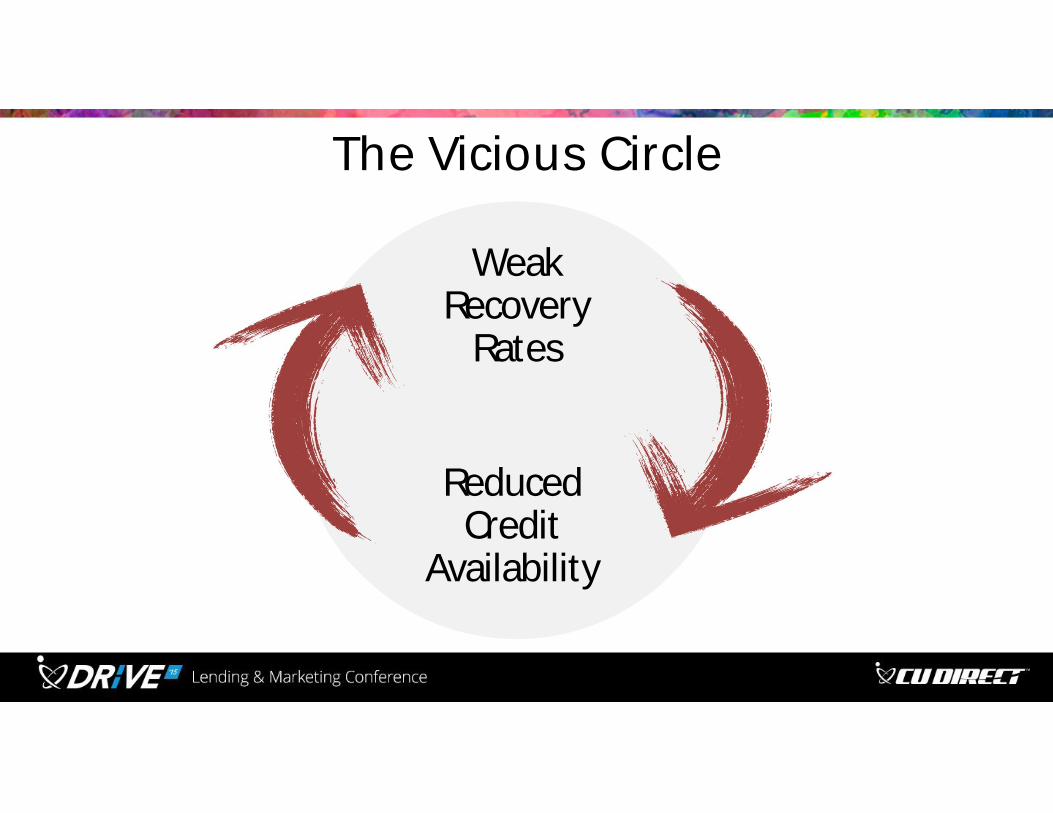
The Vicious Circle
WeakRecovery
Rates
ReducedCredit
Availability
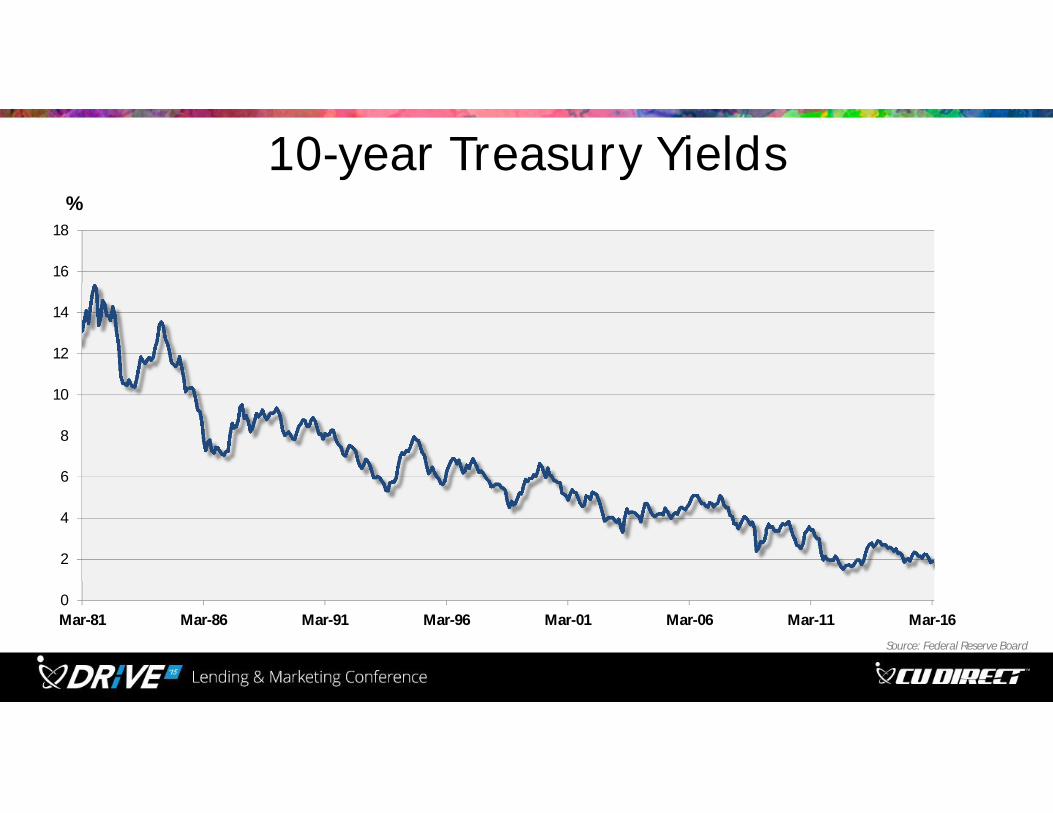
10-year Treasury Yields
0
2
4
6
8
10
12
14
16
18
Mar-81 Mar-86 Mar-91 Mar-96 Mar-01 Mar-06 Mar-11 Mar-16
Source: Federal Reserve Board
%
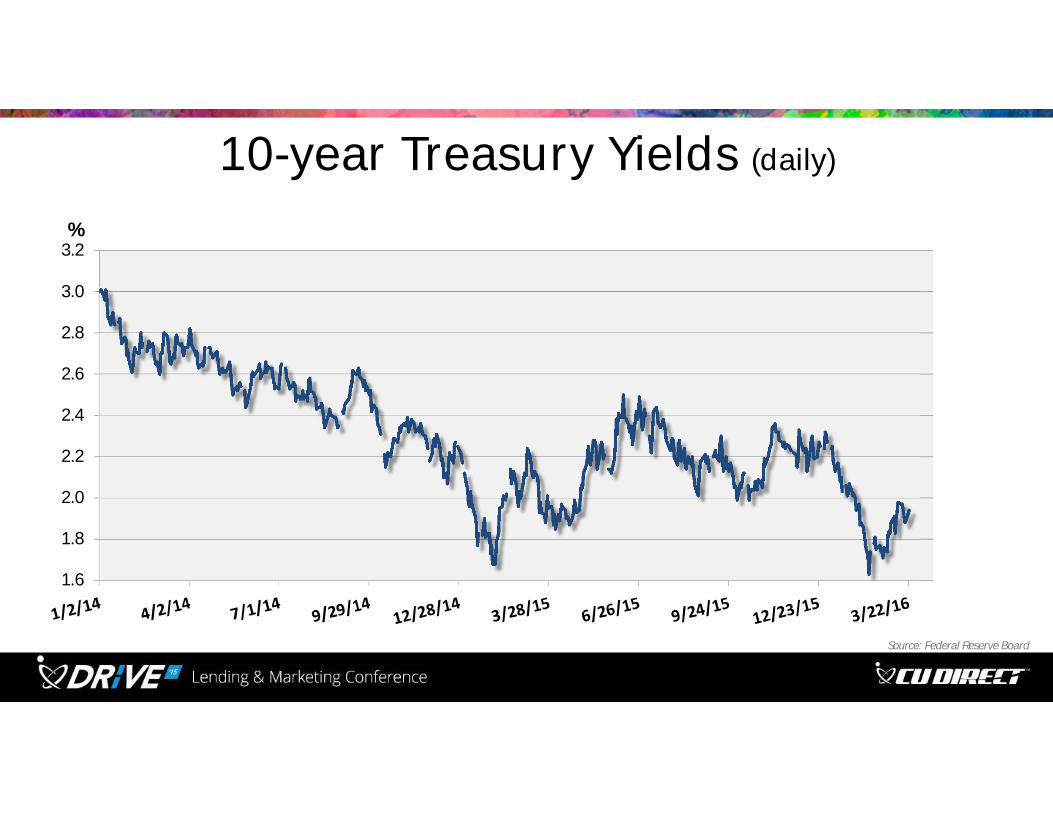
10-year Treasury Yields (daily)
1.6
1.8
2.0
2.2
2.4
2.6
2.8
3.0
3.2%
Source: Federal Reserve Board
“A shift in auto lending will not be the proximate cause for any near-term downturn in the auto industry or the economy at large.
Reporters, financial analysts, and regulators who are focusing their concern on auto lending are looking at the tree. Meanwhile, the forest – global financial markets – is encircled in flames and infested with parasites.”
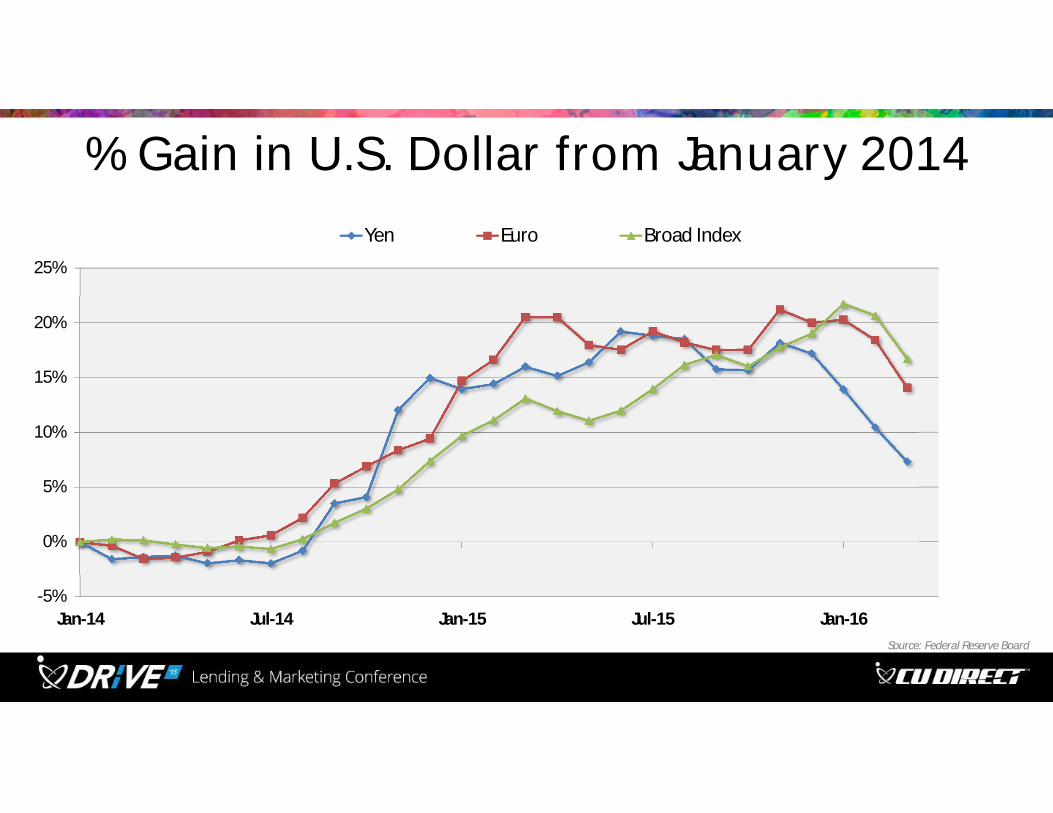
% Gain in U.S. Dollar from January 2014
-5%
0%
5%
10%
15%
20%
25%
Jan-14 Jul-14 Jan-15 Jul-15 Jan-16
Yen Euro Broad Index
Source: Federal Reserve Board

New Car & Light-Duty Truck Sales
4
6
8
10
12
14
16
18
20
1960 1965 1970 1975 1980 1985 1990 1995 2000 2005 2010 2015
millions of units
Source: Automotive News
Used Vehicle Production
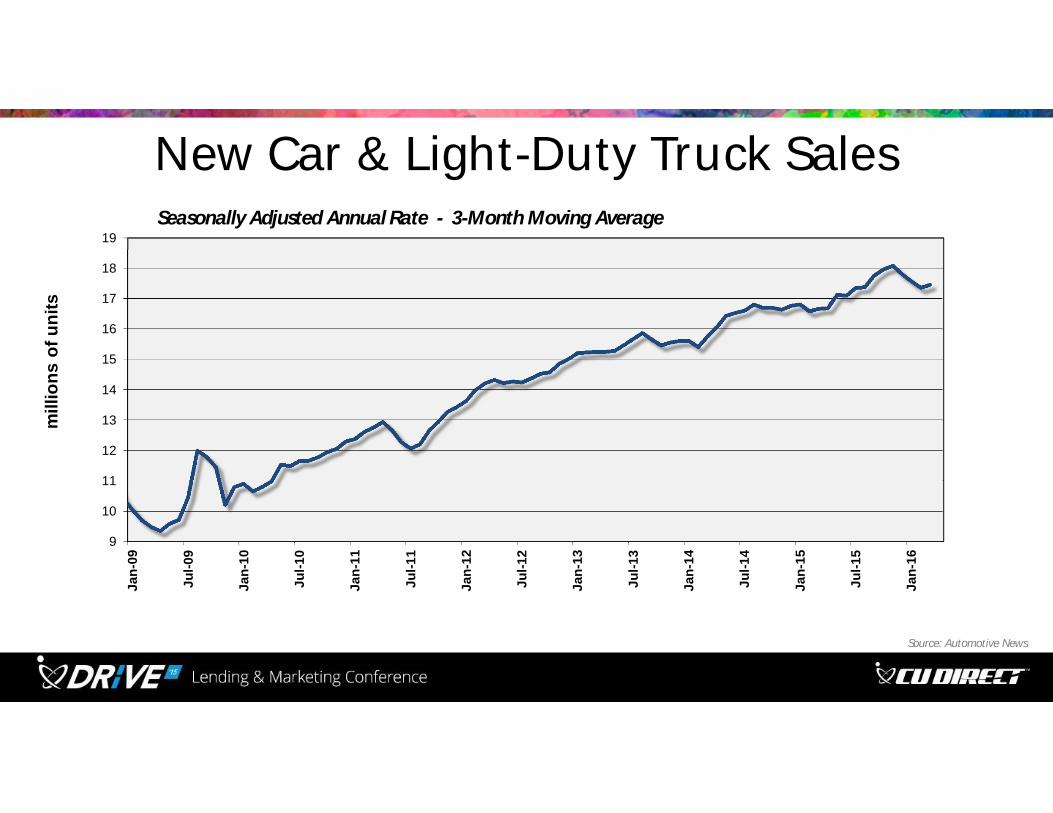
New Car & Light-Duty Truck Sales
9
10
11
12
13
14
15
16
17
18
19
Jan-
09
Jul-0
9
Jan-
10
Jul-1
0
Jan-
11
Jul-1
1
Jan-
12
Jul-1
2
Jan-
13
Jul-1
3
Jan-
14
Jul-1
4
Jan-
15
Jul-1
5
Jan-
16
mill
ions
of u
nits
Source: Automotive News
Seasonally Adjusted Annual Rate - 3-Month Moving Average

% Change Used Units Retailed – Same Store Basis(Publicly-traded Dealership Groups)
-25%
-20%
-15%
-10%
-5%
0%
5%
10%
15%
20%
2004 2005 2006 2007 2008 2009 2010 2011 2012 2013 2014 2015
Source: Company filings
Weighted average for KMX *, AN, PAG, SAH, GPI, ABG, and LAD
*KMX shifted forward one month to correspond with calendar quarter
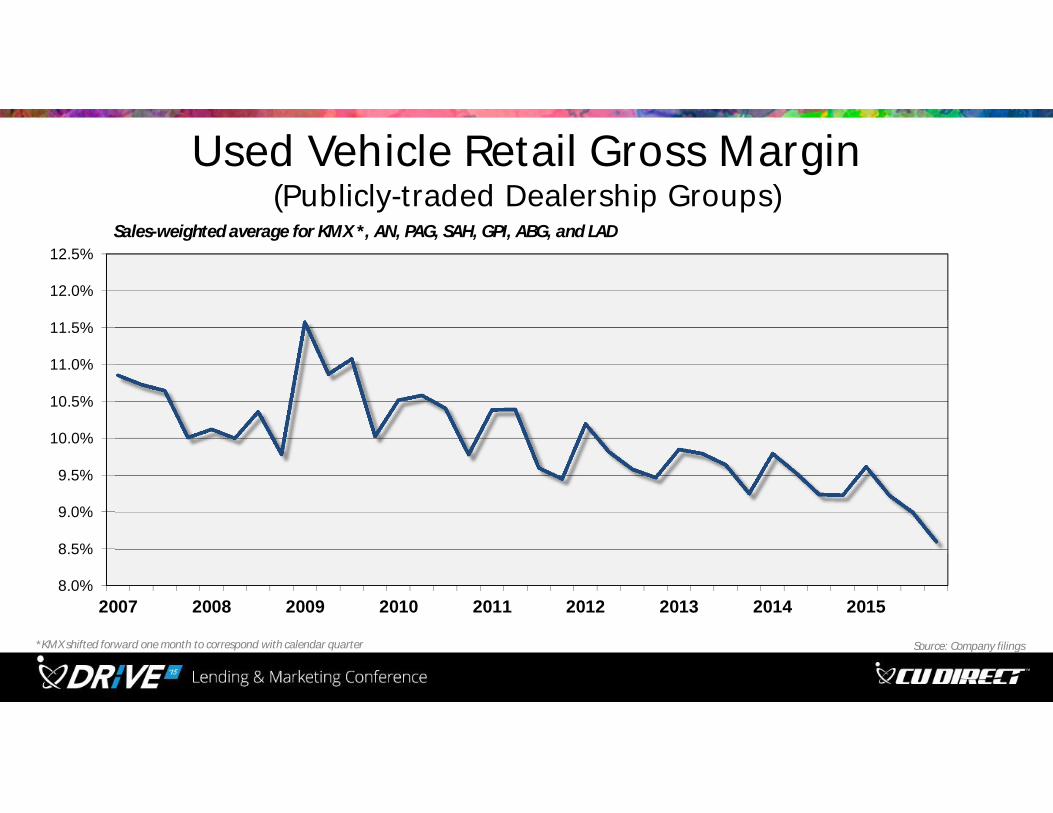
Used Vehicle Retail Gross Margin (Publicly-traded Dealership Groups)
8.0%
8.5%
9.0%
9.5%
10.0%
10.5%
11.0%
11.5%
12.0%
12.5%
2007 2008 2009 2010 2011 2012 2013 2014 2015
Sales-weighted average for KMX *, AN, PAG, SAH, GPI, ABG, and LAD
Source: Company filings *KMX shifted forward one month to correspond with calendar quarter
SummarySlow economic growth with rising recession risks.
New vehicle sales pace levels off.
Growing wholesale supplies force higher used vehicle sales.
Favorable financing environment runs awhile longer.