carroll the making of the fittest
DESCRIPTION
Carroll the Making of the FittestTRANSCRIPT
More praise forThe Making of the Fittest
“So many things in this book that I haven’t read before…. I recommend it to everybody who wants tounderstand more because it is written in such simple yet detailed language, quite a pleasure to read.”
—Ira Flatow, NPR “Science Friday”
“Carroll is an adept and wide-ranging writer…. Reading The Making of the Fittest is like spending afew hours with an extremely knowledgeable and enthusiastic dinner companion.”
—Steve Olson, Washington Post
“Conveying the excitement of current research while also providing a firm foundation of why we knowwhat we know is a rare gift. In The Making of the Fittest, Carroll offers a graceful and insightful view ofthe explanatory power of evolution.”
—Douglas Erwin, American Scientist
“Excellent…. Carroll’s book will certainly help the public to understand evolution more clearly.”—Brian Charlesworth, Nature
“With fervor and clarity, Carroll amasses a glut of facts to refute the twisted logic of the anti-Darwinistcamp.”
—Josie Glausiusz, Discover
“Carroll is not as rude and impatient as I am with those Luddites of the life sciences who, at the first hintof disagreement with their beliefs, stick their fingers in their ears and sing, ‘La la la.’ His book is friendlyand charming and, by its conclusion, quietly devastating in its condemnation of stupidity. Read it andshout, ‘Hallelujah!’”
—Peter Birnie, Vancouver Sun
“Students and teachers of biology will particularly benefit from his readable treatment of the evolutionaryprocess. An essential addition to every school, public, and academic library.”
—Library Journal
“A fast-paced look at how DNA demonstrates the evolutionary process…. Carroll offers someprovocative and convincing evidence.”
—Publishers Weekly
“Of all the scientists in the world today, there is no one with whom Charles Darwin would rather spendan evening than Sean Carroll.”
—Michael Ruse, author of The Evolution-Creation Struggle
“Sean Carroll is our plain-spoken emissary from the next great revolution in biology. His earlier book,
Endless Forms Most Beautiful, provides a fine introduction to the amazing field called Evo Devo. Nowin The Making of the Fittest he offers something even more fundamental—glimpses of what moleculargenetics is revealing about the process and course of evolution. This book is fascinating, lucid, surprising,and (in the truest sense) essential.”
—David Quammen, author of The Reluctant Mr. Darwin and The Song of the Dodo
“Crime-scene investigators love DNA evidence. It can close a case that couldn’t be solved any otherway. This fascinating book presents the DNA evidence for evolution, and anyone who reads it shouldagree that it’s an open-and-shut case. I hope The Making of the Fittest will make a difference in the oneand only place where Darwin’s case is still seriously debated: the court of public opinion.”
—Jonathan Weiner, Pulitzer Prize–winning author of The Beak of the Finch
“Sean Carroll’s gift as a writer is the way in which he invites his readers to see science from the insideand the ease with which he explains the scientific wonders of cutting-edge research in biology. Alwayscaptivating, always accessible, The Making of the Fittest is a book for all readers, and one that fulfillsDarwin’s promise that the science of evolution would ultimately illuminate every aspect of the study oflife itself. In Carroll’s hands, it surely does.”
—Kenneth R. Miller, author of Finding Darwin’s God

ALSO BY SEAN B. CARROLL
Endless Forms Most Beautiful:The New Science of Evo Devo

The Making of the Fittest
DNA AND THE ULTIMATE FORENSIC RECORD OF EVOLUTION
Sean B. Carroll
WITH ILLUSTRATIONS BY
Jamie W. Carroll and Leanne M. Olds
W. W. NORTON & COMPANYNEW YORK LONDON
Copyright © 2006 by Sean B. Carroll
All rights reservedFirst published as a Norton 2007
For information about permission to reproduce selections from this book, write to Permissions, W. W.Norton & Company, Inc., 500 Fifth Avenue, New York, NY 10110
Library of Congress Cataloging-in-Publication Data
Carroll, Sean B.The making of the fittest: DNA and the ultimate forensic record of evolution/
Sean B. Carroll.—1st ed.p. cm.
Includes bibliographical references.ISBN: 978-0-393-06969-3
1. DNA. 2. Evolution (Biology) I. Title.QP624.C37 2006572.8'6—dc22
2006017197
W. W. Norton & Company, Inc., 500 Fifth Avenue, New York, N.Y. 10110www.wwnorton.com
W. W. Norton & Company Ltd., Castle House, 75/76 Wells Street, London W1T 3QT

For Joan H. Carroll and the late J. Robert Carroll.
Thanks for the DNA—and all of my mutations.
Contents
Preface Beyond Any Reasonable Doubt
Chapter 1 Introduction: The Bloodless Fish of Bouvet Island
Chapter 2 The Everyday Math of Evolution: Chance, Selection, and Time
Chapter 3 Immortal Genes: Running in Place for Eons
Chapter 4 Making the New from the Old
Chapter 5 Fossil Genes: Broken Pieces of Yesterday’s Life
Chapter 6 Déjà Vu: How and Why Evolution Repeats Itself
Chapter 7 Our Flesh and Blood: Arms Races, the Human Race, and Natural Selection
Chapter 8 The Making and Evolution of Complexity
Chapter 9 Seeing and Believing
Chapter 10 The Palm Trees of Wyoming
Sources and Further ReadingAcknowledgments

The Making of the Fittest
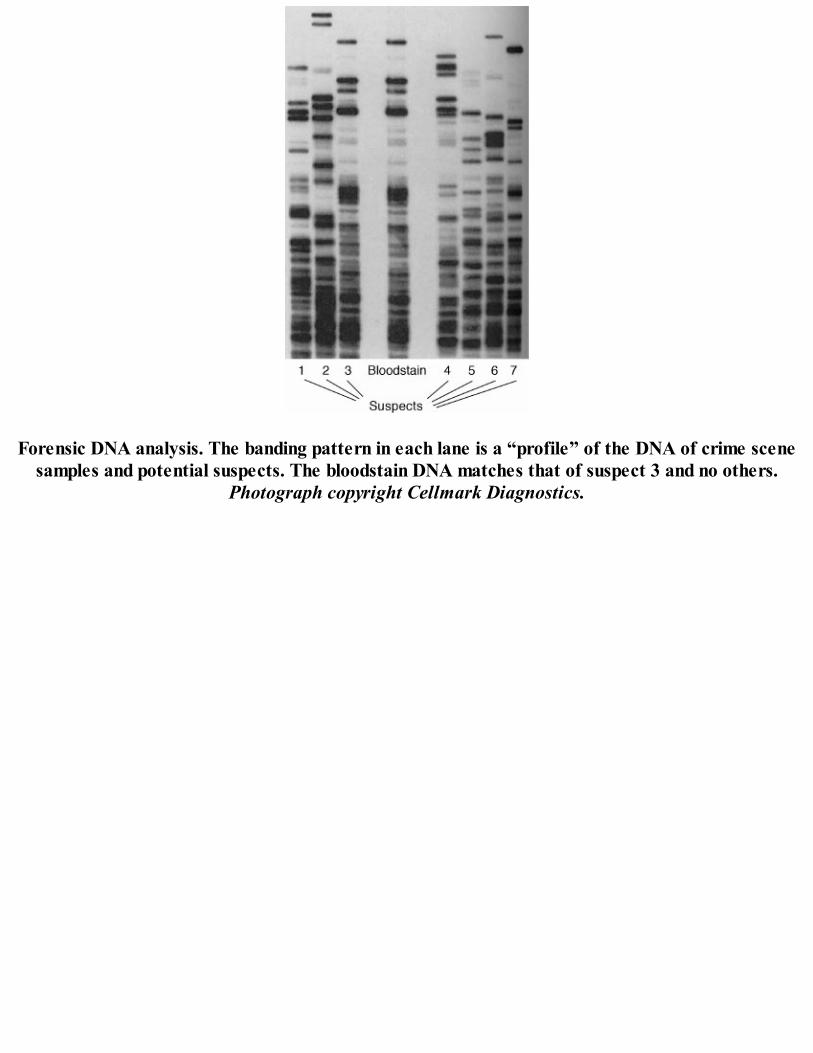
Forensic DNA analysis. The banding pattern in each lane is a “profile” of the DNA of crime scenesamples and potential suspects. The bloodstain DNA matches that of suspect 3 and no others.
Photograph copyright Cellmark Diagnostics.
Preface
Beyond Any Reasonable Doubt
Facts do not cease to exist because they are ignored.—Aldous Huxley
IN 1979, DIANNA GREEN, NINE MONTHS PREGNANT, was severely beaten and her unborn child died from thetrauma. Even though she had amnesia and could not spell her name at trial, she testified that her husband,Kevin Green, had inflicted her injuries. Green was convicted of murder and attempted murder.
In 1996, workers at the California Department of Justice laboratory processed the seventeen-year-old murder scene evidence for DNA analysis. By comparing the samples’ DNA profile with those ofGreen, and in a newly created offender database, they discovered that the original sample and samplesfrom four other murders matched that of a different man, Gerald Parker, who was then in prison on aparole violation. Confronted with the DNA evidence, Parker confessed to the crimes (and wassubsequently sentenced to death), and Green was freed from prison after serving sixteen years for a crimehe did not commit.
More accurate and rigorous than fiber or fingerprint analysis, and far more reliable than eyewitnesstestimony, DNA analysis can provide conclusive proof about who was or was not at the scene of a crime.The authority of DNA evidence, and many cases similar to Green’s, have led to a revolution in thecriminal justice system and a vast increase in the use of DNA testing to both convict the guilty andexonerate the innocent. Many crimes that would have been unsolvable in the past are now solvedroutinely, including “cold cases” several decades old. The number of exonerations is also growing. TheInnocence Project, an organization that provides pro bono representation for DNA-based appeals, reportsmore than 150 exonerations over the past thirteen years, including many individuals freed from death row.
The power of DNA testing extends far beyond criminal justice. The determination of paternity isnow definitive, and testing for carriers of genetic diseases is now routine, thanks to DNA science. Butthere is one arena where that power is not yet widely appreciated: in what one might call thephilosophical realm.
Just as the sequence of each individual’s DNA is unique, the sequence of each species’ DNA isunique. Every evolutionary change between species, from physical form to digestive metabolism, is dueto—and recorded in—changes in DNA. So, too, is the “paternity” of species. DNA contains, therefore,the ultimate forensic record of evolution.
This presents an interesting irony. Juries and judges are relying on DNA evidence to determine theliberty or incarceration, and life or death, of thousands of individuals. And it appears that citizens in the
United States are 100 percent supportive of this development. Yet, in the court of public opinion, some 50percent or more of the U.S. population still doubts or outright denies the reality of biological evolution.We are clearly more comfortable with DNA’s applications than with its implications.
Over a century ago, William Bateson began one of the first important books on evolution to appearafter Darwin’s time with the exhortation: “If facts of the old kind will not help, let us seek facts of a newkind. That the time has come for some new departure most naturalists are now I believe beginning torecognize.”
WITH DNA science penetrating so many facets of everyday life, it is again time for a new departure and toseek facts of a new kind. My goal in this book is to present a body of new facts about evolution gatheredfrom DNA evidence. Over the past few years, biology has gained unprecedented access to a vast amountof DNA evidence from all kinds of organisms, including humans and our closest relatives. In just twentyyears, the amount of DNA sequences in our databases has grown 40,000-fold, with the vast majority ofthat coming in this new century. To put that number in perspective, in 1982 our total knowledge of DNAsequences from all living species amounted to fewer than one million characters. If printed onto pageslike those you are reading, that amount of text would fit easily into one volume about the size of this book.If all of the DNA text that we now have was printed into volumes and stacked, they would reach morethan double the height of the 110-story Sears Tower in Chicago. This library of life is growing by morethan 30 stories per year.
Inside these books is the raw DNA code for the making of all sorts of bacteria, fungi, plants, andanimals. The decoding of these texts, composed of almost infinite permutations of sequences of just fourletters—A, C, G, and T—now presents one of the greatest opportunities in the history of evolutionarybiology. Biologists are mining this rich new resource to investigate and solve some of the mostfascinating mysteries in natural history and to reveal, in unprecedented detail, how all sorts of importanttraits have evolved in nature. In this book I will tell the story of how the new science of genomics—thecomprehensive and, most especially, the comparative study of species DNA—is profoundly expandingour knowledge of the evolution of life.
Genomics allows us to peer deeply into the evolutionary process. For more than a century afterDarwin, natural selection was observable only at the level of whole organisms such as finches or moths,as differences in their survival or reproduction. Now, we can see how the fittest are made. DNA containsan entirely new and different kind of information than what Darwin could have imagined or hoped for, butwhich decisively confirms his picture of evolution. We can now identify specific changes in DNA thathave enabled species to adapt to changing environments and to evolve new lifestyles.
This new level of understanding provides more than just definitive forensic evidence, it includessome surprises that expand our picture of evolution. For example, in the DNA record of every species,we find fossil genes. These are bits of DNA text that were once intact and used by ancestors, but that havefallen into disuse and decay. These relics are an entirely new source of insights into traits and capabilitiesthat have been abandoned as species evolved new lifestyles.
The DNA record also reveals that evolution can and does repeat itself. Similar or identicaladaptations have occurred by the same means in species as different as butterflies and humans. This ispowerful evidence that, confronted with the same challenges or opportunities, the same solution can ariseat entirely different times and places in life’s history. This repetition overthrows the notion that if werewound and replayed the history of life, all of the outcomes would be different.
DNA evidence is also revolutionizing the study and understanding of human origins and earlycivilization. While the sequencing of the human genome has grabbed most of the headlines, it is the
decoding of the genes and genomes of other primates and mammals that enables us to interpret themeaning of the human text. Our genes contain telltale clues to both how we are different and how weevolved to be so. Many genes bear the scars of natural selection—of the battles our ancestors fought withthe germs that have plagued human civilization for millennia.
I wrote this book with a variety of readers in mind. First, for those with a keen interest in naturalhistory, I will roam the planet to show how many fascinating species have adapted to boiling-hot springs,caves, jungles, lava formations, the deep ocean, and other remarkable places. There is grandeur in thisnew knowledge of how changing one or a few letters in simple code can dramatically change the form orphysiology of complex organisms. Second, for students and teachers, I have focused on what I believe arethe best examples that illustrate the key elements of the evolutionary process while reinforcing andexpanding our awe for the amazing diversity and adaptability of life. Most of the stories I tell are not yetin textbooks, but many will become key chapters in evolutionary science. And third, for those trying to siftthrough the rhetoric and pseudoscience of evolution’s opponents, I have provided some background tounderstand the tactics and arguments used to doubt and deny evolutionary science, and plenty of scientificevidence to vaporize those arguments.
The new DNA evidence has a very important role beyond illuminating the process of evolution. Itcould be decisive in the ongoing struggle over the teaching of evolution in schools and the acceptance ofevolution in society at large. It is beyond ironic to ask juries to rely on human genetic variation and DNAevidence in determining the life and liberty of suspects, but to neglect or to undermine the teaching of thebasic principles upon which such evidence, and all of biology, is founded. The anti-evolution movementhas relied on entirely false ideas about genetics, as well as about the evolutionary process. The body ofnew evidence I will describe in this book clinches the case for biological evolution as the basis for life’sdiversity, beyond any reasonable doubt.
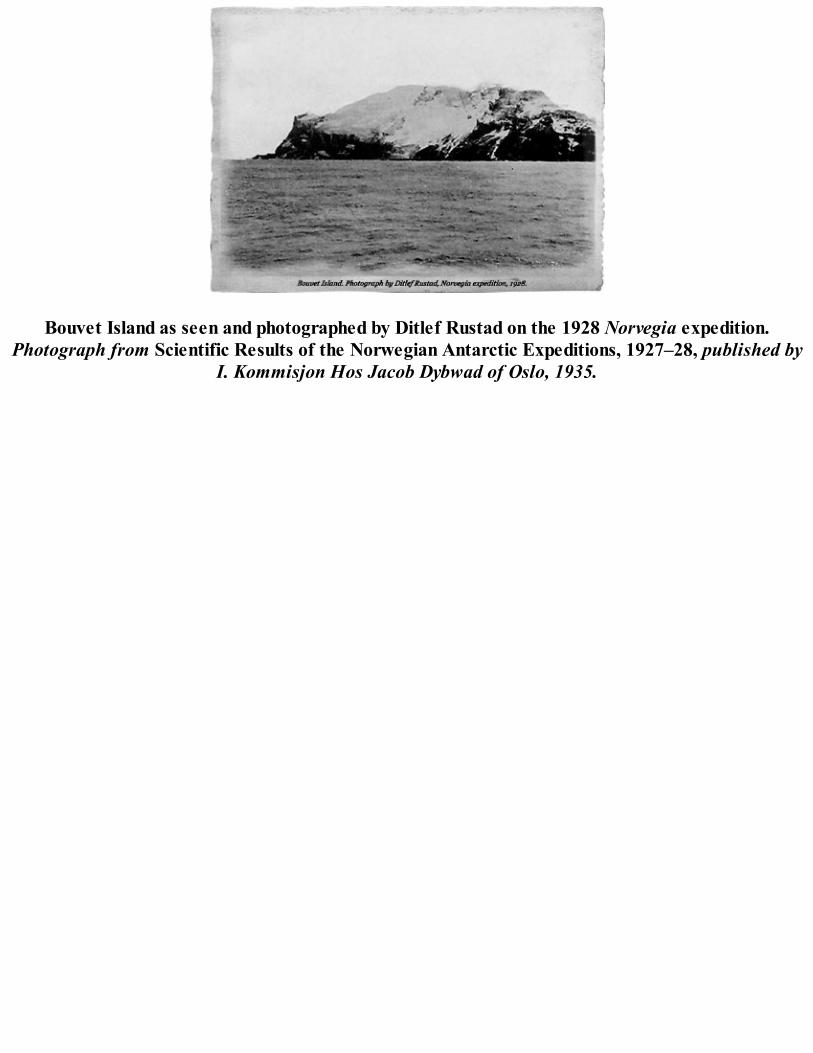
Bouvet Island as seen and photographed by Ditlef Rustad on the 1928 Norvegia expedition.Photograph from Scientific Results of the Norwegian Antarctic Expeditions, 1927–28, published by
I. Kommisjon Hos Jacob Dybwad of Oslo, 1935.
Chapter 1
Introduction: The Bloodless Fish of Bouvet Island
When we no longer look at an organic being as a savage looks at a ship, as at something whollybeyond his comprehension; when we regard every production of nature as one which has had ahistory; when we contemplate every complex structure and instinct as the summing up of manycontrivances, each useful to the possessor, nearly in the same way as when we look at any greatmechanical invention as the summing up of the labor, the experience, the reason, and even theblunders of numerous workmen; when we thus view each organic being, how far moreinteresting, I speak from experience, will the study of natural history become!
—Charles Darwin,On the Origin of Species (1859)
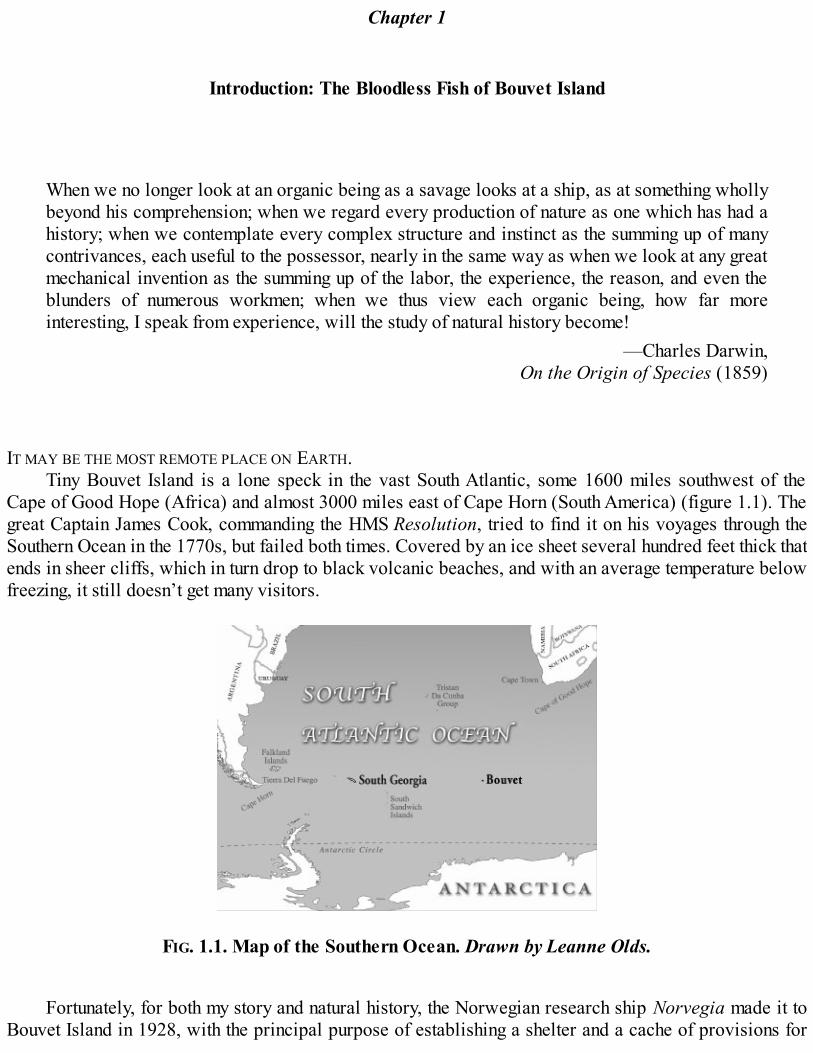
IT MAY BE THE MOST REMOTE PLACE ON EARTH.Tiny Bouvet Island is a lone speck in the vast South Atlantic, some 1600 miles southwest of the
Cape of Good Hope (Africa) and almost 3000 miles east of Cape Horn (South America) (figure 1.1). Thegreat Captain James Cook, commanding the HMS Resolution, tried to find it on his voyages through theSouthern Ocean in the 1770s, but failed both times. Covered by an ice sheet several hundred feet thick thatends in sheer cliffs, which in turn drop to black volcanic beaches, and with an average temperature belowfreezing, it still doesn’t get many visitors.
FIG. 1.1. Map of the Southern Ocean. Drawn by Leanne Olds.
Fortunately, for both my story and natural history, the Norwegian research ship Norvegia made it toBouvet Island in 1928, with the principal purpose of establishing a shelter and a cache of provisions for
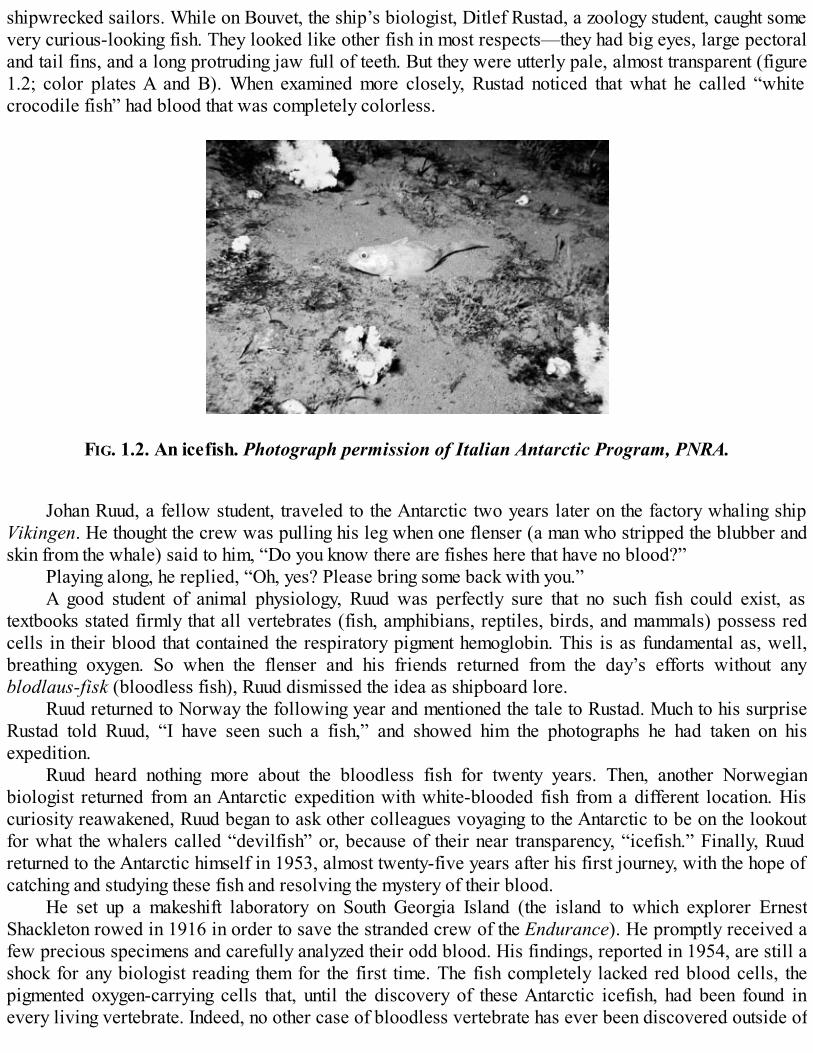
shipwrecked sailors. While on Bouvet, the ship’s biologist, Ditlef Rustad, a zoology student, caught somevery curious-looking fish. They looked like other fish in most respects—they had big eyes, large pectoraland tail fins, and a long protruding jaw full of teeth. But they were utterly pale, almost transparent (figure1.2; color plates A and B). When examined more closely, Rustad noticed that what he called “whitecrocodile fish” had blood that was completely colorless.
FIG. 1.2. An icefish. Photograph permission of Italian Antarctic Program, PNRA.
Johan Ruud, a fellow student, traveled to the Antarctic two years later on the factory whaling shipVikingen. He thought the crew was pulling his leg when one flenser (a man who stripped the blubber andskin from the whale) said to him, “Do you know there are fishes here that have no blood?”
Playing along, he replied, “Oh, yes? Please bring some back with you.”A good student of animal physiology, Ruud was perfectly sure that no such fish could exist, as
textbooks stated firmly that all vertebrates (fish, amphibians, reptiles, birds, and mammals) possess redcells in their blood that contained the respiratory pigment hemoglobin. This is as fundamental as, well,breathing oxygen. So when the flenser and his friends returned from the day’s efforts without anyblodlaus-fisk (bloodless fish), Ruud dismissed the idea as shipboard lore.
Ruud returned to Norway the following year and mentioned the tale to Rustad. Much to his surpriseRustad told Ruud, “I have seen such a fish,” and showed him the photographs he had taken on hisexpedition.
Ruud heard nothing more about the bloodless fish for twenty years. Then, another Norwegianbiologist returned from an Antarctic expedition with white-blooded fish from a different location. Hiscuriosity reawakened, Ruud began to ask other colleagues voyaging to the Antarctic to be on the lookoutfor what the whalers called “devilfish” or, because of their near transparency, “icefish.” Finally, Ruudreturned to the Antarctic himself in 1953, almost twenty-five years after his first journey, with the hope ofcatching and studying these fish and resolving the mystery of their blood.
He set up a makeshift laboratory on South Georgia Island (the island to which explorer ErnestShackleton rowed in 1916 in order to save the stranded crew of the Endurance). He promptly received afew precious specimens and carefully analyzed their odd blood. His findings, reported in 1954, are still ashock for any biologist reading them for the first time. The fish completely lacked red blood cells, thepigmented oxygen-carrying cells that, until the discovery of these Antarctic icefish, had been found inevery living vertebrate. Indeed, no other case of bloodless vertebrate has ever been discovered outside of

the fifteen or so species of icefish now known.Red blood cells contain large amounts of the hemoglobin molecule, which binds oxygen as blood
cells circulate through the lungs or gills, and then releases it as red cells circulate through the rest of thebody. The hemoglobin molecule is made up of a protein called globin and a small molecule called heme.The red color of blood is due to the heme that is buried in the hemoglobin molecule and actually binds theoxygen. We would, and do, die without red cells (anemias are conditions of low red cell numbers). Evenclose relatives of the icefish, such as Antarctic rock cod and New Zealand black cod, are red-blooded.
The existence of these remarkable fish provokes many questions. Where, when, and how did theyevolve? What happened to their hemoglobin? How can the fish survive without it or red blood cells?
The typical place one would begin to explore the origin of a species would be the fossil record.However, that is completely lacking for these fish and their relatives. And, even if we had fossils, wewould not be able to tell, from the remnants of their bones, what color their blood was and when itchanged. But, there is a record of the history of icefish that we can access—in their DNA.
The clear, stunning answer to the question of what happened to their hemoglobin came from the studyof icefish DNA more than forty years after Ruud first sampled their blood. In these amazing fish, the twogenes that normally contain the DNA code for the globin part of the hemoglobin molecule have goneextinct. One gene is a molecular fossil, a mere remnant of a globin gene—it still resides in the DNA of theicefish, but it is utterly useless and eroding away, just as a fossil withers upon exposure to the elements.The second globin gene, which usually lies adjacent to the first in the DNA of red-blooded fish, haseroded away completely. This is absolute proof that the icefish have abandoned, forever, the genes for themaking of a molecule that nurtured the lives of their ancestors for over 500 million years.
What would provoke such a dramatic rejection of a way of life that serves every other vertebrate onthe planet?
Necessity and opportunity, both of which sprang from dramatic, long-term changes in oceantemperature and currents.
Over the past 55 million years, the temperature of the Southern Ocean has dropped, from about 68degrees F to less than 30 degrees in some locales. About 33 to 34 million years ago, in the continualmovement of the Earth’s tectonic plates, Antarctica was severed from the southern tip of South America,and became completely surrounded by ocean. Ensuing changes in ocean currents isolated the watersaround the Antarctic. This limited the migration of fish populations such that they either adapted to thechange, or went extinct (the fate of most). While others vanished, one group of fish exploited the changingecosystem. The icefish are a small family of species, within the larger suborder Notothenioidae, thataltogether contains about 200 species and now dominates the Antarctic fishery.
The low temperature of Antarctic waters presents some great challenges to body physiology. Likethe oil in my car during a Wisconsin winter, the viscosity of body fluids increases in the subfreezingAntarctic water temperatures, which would make them difficult to pump. Antarctic fish, in general, copewith this problem by reducing the number of red cells per volume of circulating blood. Red-bloodedAntarctic fish have hematocrits (the percentage of their blood volume made up of red cells) of around 15to 18 percent, while we have hematocrits of about 45 percent. But the icefish have taken this to theextreme, by eliminating red blood cells altogether, and allowing their hemoglobin genes to mutate intoobsolescence. These fish, whose blood is so dilute that it contains just 1 percent cells by volume (allwhite cells), literally have ice water in their veins! How does this creature cope with the absence of life-sustaining hemoglobin?
It is clear now that the loss of hemoglobin has accompanied a whole suite of changes in the fish thatallows it to thrive at below-freezing temperatures. One of the important differences between warm andcold water is that oxygen solubility is much greater in cold water. The frigid ocean is an exceptionallyoxygen-rich habitat. Icefish have relatively large gills and have evolved a scaleless skin that has

unusually large capillaries. These two features increase the adsorption of oxygen from the environment.Icefish also have larger hearts and blood volumes than those of their red-blooded relatives.
Icefish hearts differ in another obvious and profound way—they are often pale. The rose color ofvertebrate hearts (and skeletal muscles) is due to the presence of another heme-containing, oxygen-binding molecule, called myoglobin. Myoglobin binds oxygen more tightly than hemoglobin andsequesters it in muscles so that it is available upon exertion. The muscles of whales, seals, and dolphinsare so rich in myoglobin that they are brown in color; their high myoglobin allows these diving mammalsto stay submerged for long periods. But myoglobin is not a stand-in for the absence of hemoglobin inicefish. It is absent from the muscles of all icefish and the hearts of five species (hence their paleness).The myoglobin protein is encoded by a single gene in vertebrates. Analysis of the DNA of pale-heartedicefish revealed that their myoglobin gene is mutated—an insertion of five additional letters of DNA hasdisrupted the code for making the normal myoglobin protein. In these species, the myoglobin gene is alsoon its way to becoming a fossil gene. The fishes’ many cardiovascular adaptations are providingsufficient oxygen delivery to body tissues in the complete absence of two fundamental oxygen-carryingmolecules.
Life in very cold waters demands yet further accommodations, and the unmistakable evidence ofevolutionary change is found in many more places in icefish DNA. Even basic structures in each cell mustbe modified to adapt to life in the cold. For example, microtubules form a critical scaffold or “skeleton”within cells. These structures are involved in cell division and movement as well as in the formation ofcell shapes. With so many important jobs to do, the proteins that form the microtubules are among themost faithfully preserved not just in all vertebrates, but in all eukaryotes (the group including, amongothers, animals, plants, and fungi). In mammals, microtubules are unstable at temperatures below 50degrees F. If this were the case in Antarctic fish, they would certainly be dead. Quite to the contrary,microtubules of Antarctic fish assemble and are very stable at temperatures below freezing. Thisremarkable change in microtubule properties is due to a series of changes in the genes that encodecomponents of the microtubules, changes that are unique to cold-adapted fish, both icefish and their red-blooded Antarctic cousins.
There are many more genes that have been modified so that all sorts of vital processes can occur inthe subfreezing climate. But adaptation to cold is not limited to the modification of some genes and theloss of others; it has also required some invention. Foremost among these is the invention of “antifreeze”proteins. The plasma of Antarctic fish is chock-full of these peculiar proteins, which help the fish survivein icy waters by lowering the temperature threshold at which ice crystals can grow. Without them, the fishwould freeze solid. These proteins have a very unusual and simple structure. They are made up of 4 to 55repeats of just three amino acids, whereas most proteins contain all 20 different types of amino acids.Since warm-water fish have nothing of this sort, the antifreeze genes were somehow invented by Antarcticfish. Where in the world did antifreeze come from?
Chi-Hing Cheng, Arthur DeVries, and colleagues at the University of Illinois discovered that theantifreeze genes arose from part of another, entirely unrelated gene. The original gene encoded a digestiveenzyme. A little piece of its code broke off and relocated to a new place in the fish genome. From thissimple nine-letter piece of DNA code, a new stretch of code evolved for making the antifreeze protein.The origin of the antifreeze proteins stands out as a prime example of how evolution works more often bytinkering with materials that are available—in this case a little piece of another gene’s code—rather thanby designing new things completely from scratch.
As a resident of a cold climate, I have to admire the icefishes’ grit and ingenuity. We take variousmeasures to keep our cars running on subzero Wisconsin days, but the icefish has managed to change itswhole engine while the car was running. It invented a new antifreeze, changed its oil (blood) to a newgrade with a remarkably low viscosity, enlarged its fuel pump (heart), and threw out a few parts along the
way—parts that had been used in every model of fish for the past 500 million years.The DNA record of icefish, and of all other species, is a whole new level of evidence of the
evolutionary process. It allows us to see beyond the visible bones and blood, directly into thefundamental text of evolution. The making of the extraordinary icefish illustrates the ordinary, if somewhatmessy, course of the making of the fittest at the DNA level. Icefish evolved from warm-water, red-blooded ancestors ill suited to life in the cold. Their adaptation to the changing environment of theSouthern Ocean was not a matter of instant design, nor just a one-way “progressive” process. It was animprovised series of many steps, including the invention of some new code, the destruction of some veryold code, and the modification of much more.
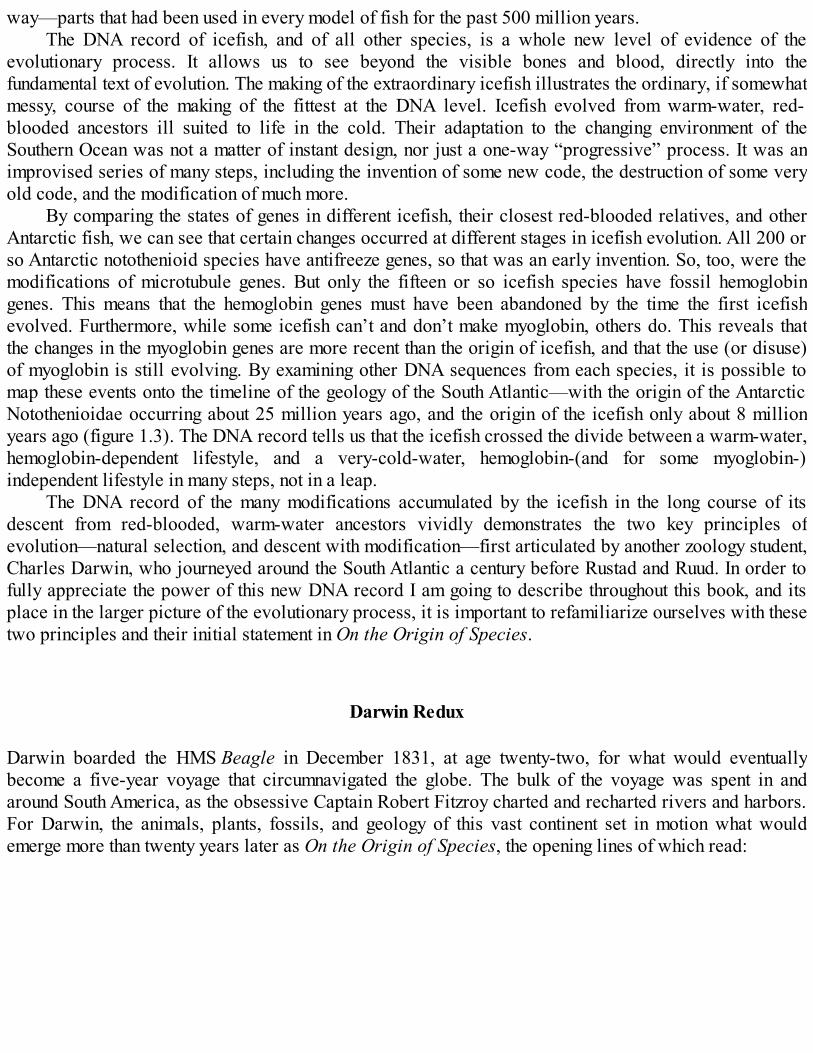
By comparing the states of genes in different icefish, their closest red-blooded relatives, and otherAntarctic fish, we can see that certain changes occurred at different stages in icefish evolution. All 200 orso Antarctic notothenioid species have antifreeze genes, so that was an early invention. So, too, were themodifications of microtubule genes. But only the fifteen or so icefish species have fossil hemoglobingenes. This means that the hemoglobin genes must have been abandoned by the time the first icefishevolved. Furthermore, while some icefish can’t and don’t make myoglobin, others do. This reveals thatthe changes in the myoglobin genes are more recent than the origin of icefish, and that the use (or disuse)of myoglobin is still evolving. By examining other DNA sequences from each species, it is possible tomap these events onto the timeline of the geology of the South Atlantic—with the origin of the AntarcticNotothenioidae occurring about 25 million years ago, and the origin of the icefish only about 8 millionyears ago (figure 1.3). The DNA record tells us that the icefish crossed the divide between a warm-water,hemoglobin-dependent lifestyle, and a very-cold-water, hemoglobin-(and for some myoglobin-)independent lifestyle in many steps, not in a leap.
The DNA record of the many modifications accumulated by the icefish in the long course of itsdescent from red-blooded, warm-water ancestors vividly demonstrates the two key principles ofevolution—natural selection, and descent with modification—first articulated by another zoology student,Charles Darwin, who journeyed around the South Atlantic a century before Rustad and Ruud. In order tofully appreciate the power of this new DNA record I am going to describe throughout this book, and itsplace in the larger picture of the evolutionary process, it is important to refamiliarize ourselves with thesetwo principles and their initial statement in On the Origin of Species.
Darwin Redux
Darwin boarded the HMS Beagle in December 1831, at age twenty-two, for what would eventuallybecome a five-year voyage that circumnavigated the globe. The bulk of the voyage was spent in andaround South America, as the obsessive Captain Robert Fitzroy charted and recharted rivers and harbors.For Darwin, the animals, plants, fossils, and geology of this vast continent set in motion what wouldemerge more than twenty years later as On the Origin of Species, the opening lines of which read:
FIG. 1.3. A timeline of icefish evolution. (Top) The changing geology of Southern landmassesbrought about major changes in ocean currents and temperatures over the past 50 million years.(Bottom) One large group of fish, called the notothenioid fish, adapted to lower temperatures byevolving antifreeze, cold-stable tubulins, and a lower hematocrit. Eventually, globin genes were
fossilized in the common ancestor of bloodless icefish. Drawing by Leanne Olds.
When on board H.M.S. Beagle as naturalist, I was much struck with certain facts in thedistribution of the organic beings inhabiting South America, and in the geological relations ofthe present to the past inhabitants of the continent. These facts…seemed to throw some light onthe origin of species—that mystery of mysteries, as it has been called by one of our greatestphilosophers. On my return home, it occurred to me, in 1837, that something might perhaps bemade out on this question by patiently accumulating and reflecting on all sorts of facts whichcould possibly have any bearing on it. After five years of work I allowed myself to speculateon the subject, and drew up some short notes; these I enlarged in 1844 into a sketch of theconclusions, which then seemed to me probable; from that period on to the present day I havesteadily pursued the same object. I hope that I may be excused for entering on these personaldetails, as I give them to show that I have not been hasty in coming to a decision.
His “abstract” ran 502 pages and sold out in one day, on November 24, 1859.“How extremely stupid not to have thought of that!” exclaimed the great biologist Thomas Huxley
after reading On the Origin of Species.Contrary to most popular notions, it was not the idea of evolution that was novel in Darwin’s book.
That possibility had been floating around for many decades, indeed, in Darwin’s own family. Hisgrandfather, Erasmus Darwin, put forth a theory of evolution in Zoonomia, or the Laws of Organic Life(1794).
Nor was it the mere idea of species changing that prompted Huxley’s reaction. Rather, it was thepower, yet intuitive simplicity, of two ideas—“Descent with Modification” and “Natural Selection”—asthe description of and mechanism for life’s evolution.
Darwin drew an analogy between the selection for variation in the domestication of animals and thestruggle for existence among the far more numerous offspring produced in the wild than are able to thrive:
Can it, then, be thought improbable…that other variations useful in some way to each being inthe great and complex battle of life, should sometimes occur in the course of thousands ofgenerations? If such do occur, can we doubt (remembering that many more individuals are bornthan can possibly survive) that individuals having any advantage, however slight, over others,would have the best chance of surviving and of procreating their kind? On the other hand, wemay feel sure that any variation in the least degree injurious would be rigidly destroyed. Thispreservation of favorable variations and the rejection of injurious variations I call NaturalSelection [emphasis added].
—Ch. IV, On the Origin of Species
Darwin then leaped to the bold conclusion that this process would connect all life’s forms via theirdescent from common ancestors:
Several classes of facts…seem to me to proclaim so plainly, that the innumerable species,genera, and families of organic beings, with which this world is peopled, have all descended,each within its own class or group, from common parents, and have all been modified in thecourse of descent.
—Ch. XIII, On the Origin of Species
And then, even bolder:
Therefore I should infer from analogy that probably all the organic beings which have everlived on this earth have descended from one primordial form, into which life was firstbreathed.
—Ch. XIII, On the Origin of Species
This is the essence of Darwinian evolution—that natural selection for incremental variation forgedthe great diversity of life from its beginning as a simple ancestor. Simple logic, scientific immortality. Nowonder Huxley was chiding himself.
But there was much more in On the Origin of Species than these few conclusions (some of whichAlfred Russel Wallace had independently reached as a result of his studies in South America and theMalay Archipelago). Darwin brought evidence. Mounds and mounds of observations, fact upon fact,ingenious experiments, clever analogies, and twenty years of finely crafted argument.
The esteem we biologists have for Darwin is manifold. Sure, On the Origin of Species is the mostimportant single work in biology. Darwin’s “long argument” is brilliantly constructed, supported by adazzling breadth of facts, and the product of a heroic individual effort. It is also very readable today, withits passion still resonant. But the full body of his contributions filled many books, from insights into thebuilding of coral reefs, to the importance of sexual selection, and the biology of orchids, barnacles, andmuch more. It just dwarfs what the merely talented or industrious might achieve.
So why have his great ideas endured such a struggle?
Seeing the Steps
Darwin understood all too well, and therefore correctly anticipated, most of the objections that could orwould be raised against his ideas. Many of the attacks, of course, were from those who found Darwin’sview of life’s history repulsive and demeaning on nonscientific grounds. Most scientists fairly readilyaccepted the reality of evolution, that is, that species did change. But even Darwin’s supporters haddifficulties with the how—with the mechanism he proposed.
Questioning the how was quite understandable. I believe that most people, scientists or laypeople,initially struggle to get their heads around Darwin’s picture of natural selection, or what also becameknown as “the survival of the fittest.” (An interesting note: Darwin did not coin that famous phrase, thephilosopher Herbert Spencer did. It did not appear in On the Origin of Species until the fifth edition of1869, at Wallace’s suggestion.) Darwin’s process of evolution involved three key components—variation, selection, and time. Each of these presented some conceptual or evidential problems, and allwere potential sources of incredulity. Darwin was asking his readers, in essence, to imagine how slightvariations (whose basis was unknown and invisible) would be selected for (which occurred by a processthat was also invisible and not measurable) and accumulate over a period of time that was beyond humanexperience. Darwin understood the difficulty:
the chief cause of our natural unwillingness to admit that one species has given birth to otherand distinct species, is that we are always slow in admitting any great change of which we donot see the steps [emphasis added]. The difficulty is the same as that felt by so many geologistswhen Lyell first insisted that long lines of inland cliffs had been formed, and great valleysexcavated, by the slow action of the coast waves. The mind cannot possibly grasp the fullmeaning of the term of a hundred million years; it cannot add up and perceive the full effects ofmany slight variations, accumulated during an almost infinite number of generations.
—Ch XIV, On the Origin of Species
The eminent biologist and writer Richard Dawkins points out that the concept of natural selection issimple but deceptively so: “It is almost as if the human brain were specifically designed to misunderstandDarwinism, and to find it hard to believe.” The individual components of chance (in producing variation)and selection (in determining which variants succeed) can be so easily misunderstood or confused. Therole of chance is often inflated (sometimes deliberately so by opponents of evolution) to mean thatevolution occurs completely at random, and that order and complexity arise all at once and at random.This is not at all the case. Selection, which is not random, determines what chance occurrences areretained. It is the cumulative selection (“adding up,” in Darwin’s terms) of variations that forgescomplexity and diversity, over periods of time that we humans just don’t grasp very well. Naturalselection even strained Darwin’s supporters. They just couldn’t see how selection could be powerfulenough to “see” and to accumulate slight variations.
It wasn’t until some fifty years after On the Origin of Species that biologists finally appreciated theinterplay of chance, selection, and time in concrete terms. It turns out that a little bit of everyday math, thekind we use to calculate probabilities in a casino or in a lottery, and to calculate interest on savings andloans, finally convinced biologists (including some prominent doubters) that natural selection was, atleast in theory, strong enough and fast enough to account for evolution.
But math goes only so far. Just as for Johan Ruud and the tale of the bloodless fish of the Antarctic,for most of us believing and understanding is a matter of seeing. We want to see the stuff responsible for

evolution. We want to be able to see, measure, and retrace the steps taken in evolution between onespecies and another.
Now, after 140 years, we can do just that.
The DNA Record of Evolution
Each step in evolution, we now know, is taken and recorded in DNA. Every change or new trait—fromthe antifreeze in the bloodstream of Antarctic fish, to the beautiful colors of an alpine wildflower, to ourlarge brain-packed skulls—is due to one or more (sometimes many, many more) stepwise changes inDNA that are now traceable. Some steps are tiny, just a single change in one letter of one gene’s code.Others are much larger, involving the birth (and death) of entire genes or blocks of genes in one leap.
We can track these changes because of the explosive increase in our knowledge of species genes andgenomes (the entire DNA content of a species). From just a trickle of the small genomes of bacteria andyeast several years ago, the large genomes of complex creatures such as the chimpanzee, dog, whale, andvarious plants are being revealed at a torrential pace. The unique DNA sequence of each species is acomplete record of the present. It is an inventory of all the genes used to build and operate that creature.
The DNA record is also a window into the recent and the deep past. When the first genome of amember of some group is determined, that pioneer paves the way for much faster analysis of its relatives.By comparing genes and genomes between relatives of different ranks, we can pinpoint important changesand spot the mark of natural selection. The view can be as humbling as it is exciting. We can peer back afew million years to track the changes that took place in the evolution of the line that led to us from ourcommon ancestor with the chimpanzee, our closest relative on the planet. We can look back 100 millionyears or so to see what gave rise to the differences between marsupial and placental mammals. We caneven glimpse before the dawn of animals and find hundreds of genes in simple, single-celled organismsthat evolved more than two billion years ago and still carry out the same jobs in our bodies today.
The ability to see into the machinery of evolution transforms how we look at the process. For morethan a century, we were largely restricted to looking only at the outside of evolution. We observedexternal change in the fossil record and assessed differences in anatomy. But before this new molecularage there was no way to make genetic comparisons between species. We could study the reproduction andsurvival of organisms and infer the forces at work. However, we had no concrete knowledge of themechanism of variation or the identity of the meaningful differences between species. Yes, we understoodthat the outcome was the survival of the fittest, but we did not know how the fittest are made. Just as forany work of human creation, we so much better understand how complex things have come to be—cars,computers, spacecraft—when we understand how they are made, and how each new model is differentfrom its predecessors. We are no longer savages staring at passing ships.
The focus of this book will be to peer into the DNA record to see how evolution works. Along theway we will explore how some of the most interesting and important capabilities of some fascinatingcreatures arose. The book is organized into three main parts. I would like to think of them as being like thethree parts of a good and memorable meal—a little bit of preparation, plenty of food, and somemeaningful conversation. First, in order to prepare for the meal, I want to take some care in explaining themain ingredients of evolution—variation, selection, and time—so that we fully appreciate how theyinteract in the making of the fittest.
The late Nobel laureate Sir Peter Medawar once remarked that “the reasons that have ledprofessionals without exception to accept the hypothesis of evolution are in the main too subtle to begrasped by laymen.”
I don’t believe that this is true. However, if it is at all true, this is a failure on the part of scientists toclearly explain the power of natural selection, compounded by time, to make all things great and small—from whales to bloodless icefish.
To redress this shortcoming, I will explain the everyday math of evolution (chapter 2). This is thebest way to get a good feel for the power of natural selection and to vanquish some of the misleadingarguments against the probability of events in evolution. This simple math is generally not explained inpopular accounts of evolution. It is important, however, for grasping not just the plausibility of naturalselection, but also the real-world interplay of chance, time, and selection. I know, you are saying, “Math?!Forget it.” Don’t worry. At the very minimum, that chapter might help you become a better gambler orinvestor.
The main body of the book will be a six-course meal, served in six chapters. The focus of eachchapter will be on how the new DNA record reveals a particular aspect of evolution, with new kinds ofevidence that neither Darwin nor his mathematically gifted disciples could have dreamed of.
I will begin by illustrating how the DNA record documents the processes of natural selection anddescent with modification on a vast geological timescale. I will show unimpeachable evidence of hownatural selection acts to remove, in Darwin’s words, injurious change (chapter 3). This evidence ismanifest in the form of genes that have been preserved across kingdoms of life for two billion years orlonger. The text of these “immortal” genes is stuck “running in place” under the conservative surveillanceof natural selection. Immortal genes are more than just hardy stalwarts against the steady onslaught ofmutation over eons of time, they are key pieces of evidence for the descent of all living species fromcommon ancestors and they provide a new means of reconstructing early events in life’s evolution.
I will then turn to the fundamental question of how species acquire entirely new abilities and fine-tune existing talents (chapter 4). I will focus almost exclusively on a set of the most exquisite examples ofthis idea, all concerning the origin and evolution of color vision in animals. The possession and tuning ofthis sense is central to animal lifestyles, and how they find food, mates, and one another in daylight,darkness, or in the deep blue sea. The steps to the acquisition and fine-tuning of color vision at the DNAlevel are especially well understood and demonstrate the action of natural selection on the text ofevolving genes.
These examples of evolution in nature are convincing demonstrations of specific episodes andmodes of evolution. In many ways they confirm a body of theory that is many decades old. But the DNArecord would be relatively anticlimactic if it did not contain some surprises, some information that wedid not anticipate but that, once revealed, yields new insights and new ways of seeing into theevolutionary process. It has handed up some real gems.
While the focus of much of the study of life’s history has centered on the traditional fossil record,biologists have revealed in DNA a new kind of fossil record—of fossil genes (chapter 5). Just assedimentary rocks contain a record of ancient forms, no longer alive, all species DNA contains genes,sometimes numbering in the hundreds, that are no longer used and are in various states of decay. Fossilgenes, like those I described in the icefish, are telltale clues to past capabilities, and to shifts in species’ways of living from those of their ancestors. Our fossil genes reveal a lot about how we are different fromour hominid ancestors.
The most profound surprise of all, though, is how evolution repeats itself (chapter 6). When speciesthat have independently gained or lost similar traits are compared, we often find that evolution hasrepeated itself, at the level of the same gene, sometimes right down to the very same letter in the code ofthe same gene. In some cases, the same genes have become fossilized in different species. This isremarkable evidence that, in the great arc of time, different species, including those belonging to entirelydifferent taxonomic groups, will respond in the same way to a particular selective condition. Therepetition of evolution is so pervasive that we are forced to change our thinking about the uniqueness of
past events. The new DNA record tells us that the probabilities are in favor not only of species coming upwith particular changes in DNA, but of multiple species coming up with the same particular solutionsagain and again.
The repetition of evolution is not limited to the distant past or to obscure species—it is occurring inour own flesh and blood (chapter 7). Our species has been shaped by the physical environment and thepathogens we encounter. With some ancient foes, such as malaria, we are still locked in evolutionaryarms races, and the scars of these battles are evident in our genes. I will explain how the process ofnatural selection has shaped our genetic makeup and has great implications for human biology andmedicine.
The vast body of evidence I highlight in these five chapters leaves no doubt as to the ubiquity ofnatural selection, or its swiftness in acting on even very small differences among individuals. Yet, eversince Darwin, the most difficult aspect of the evolutionary process to grasp has been the cumulativepower of natural selection in shaping the evolution of complex structures. For more than a century,detailed knowledge of the formation or history of complex organs and body parts was far out of reach.
In the final course of the main meal, I will describe recent insights into the making and evolution ofcomplexity (chapter 8). I will emphasize how understanding the process of development reveals howcomplex structures are built and how comparing the development of structures of different degrees ofcomplexity reveals how such structures evolved. The DNA record contains key insights into howcomplexity and diversity have evolved through the use of ancient body-building genes.
Seeing and Believing: Why Evolution Matters
The real-time observation of the evolutionary process and the revelations of the rich and ancient DNArecord set the stage for the after-dinner conversation. In the final two chapters of the book, I will confrontcontemporary and historical issues surrounding disbelief and acceptance of the facts of evolution and Iwill underscore the importance of applying evolutionary knowledge in the real world. We can learn muchabout the nature of the opposition to, or doubts about, evolution from previous episodes of institutionalignorance and public opposition to science—to Galileo, Pasteur, and even the science that proved DNAwas the basis of heredity. The facts of astronomy, microbiology, and genetics were resisted in certainquarters until the tangible, visible evidence was overwhelming. This new DNA record cannot be arguedaway. The facts of evolution are overwhelming and still growing.
This book is what a critic might call “genocentric,” in that it places so much emphasis on events atthe level of DNA. I confess my presentation is genocentric, but my defense is that the stories I will tell areselected for their power in illustrating the adaptability of species to diverse, and, often, quite extremehabitats.
This new understanding of how the fittest are made expands our wonder at the processes that haveshaped life’s amazing diversity—from ancient microbes that live in boiling water to fish that breathewithout hemoglobin, birds and butterflies that see colors invisible to us, and apes that write books. It alsoreveals why and how the “fittest” is a conditional, if not precarious, status.
The everyday math of evolution and the DNA record of life tell us that natural selection acts only onwhat is useful for the moment. It cannot preserve what is no longer used, and it cannot predict what willbe needed in the future. Living for the moment has the dangerous disadvantage that if circumstanceschange more rapidly than adaptations can arise, faster than the fittest can be made, populations andspecies are at risk.
History shows that as circumstances have changed, globally or locally, many eras’ fittest have been

replaced. The fossil record is paved with creatures—trilobites, ammonites, and dinosaurs, to name just afew—of once very successful groups that evolution has left behind. The icefish have made a remarkableevolutionary journey in adapting to the changing Southern Ocean, but theirs may well be a one-way trip.Having abandoned one mode of living, they have lost capabilities that cannot be recovered. And theirfuture is certainly in doubt.
Ditlef Rustad accidentally discovered icefish in nets he used to haul up krill, a two-to three-inch-long crustacean that is at the very center of the Antarctic food web. In late 2004, biologists studying datacollected by nine countries over forty Antarctic summers reported that Antarctic krill stocks havedeclined by 80 percent since the 1920s. Krill feed on phytoplankton and algae that depend upon sea ice,which is shrinking, and krill are in turn eaten by squid, sea birds, whales, seals,…and icefish. The airtemperature in the Antarctic Peninsula has risen by 4 to 5 degrees F in the last fifty years, and the watertemperature of the Southern Ocean is projected to rise by several degrees over the next century. If thathappens, it is very likely that most cold-adapted species will not be able to adapt to such rapid changes intemperature and food availability, and that part of the enormous and important Antarctic fishery willcollapse, taking the icefish with it.
Knowledge of evolutionary biology is therefore no mere academic pursuit, nor is the acceptance ofits facts a matter that should be open to political or philosophical debate.
Sir Peter Medawar also stated that “the alternative to thinking in evolutionary terms is not to think atall.” That is an alternative our species can no longer afford.
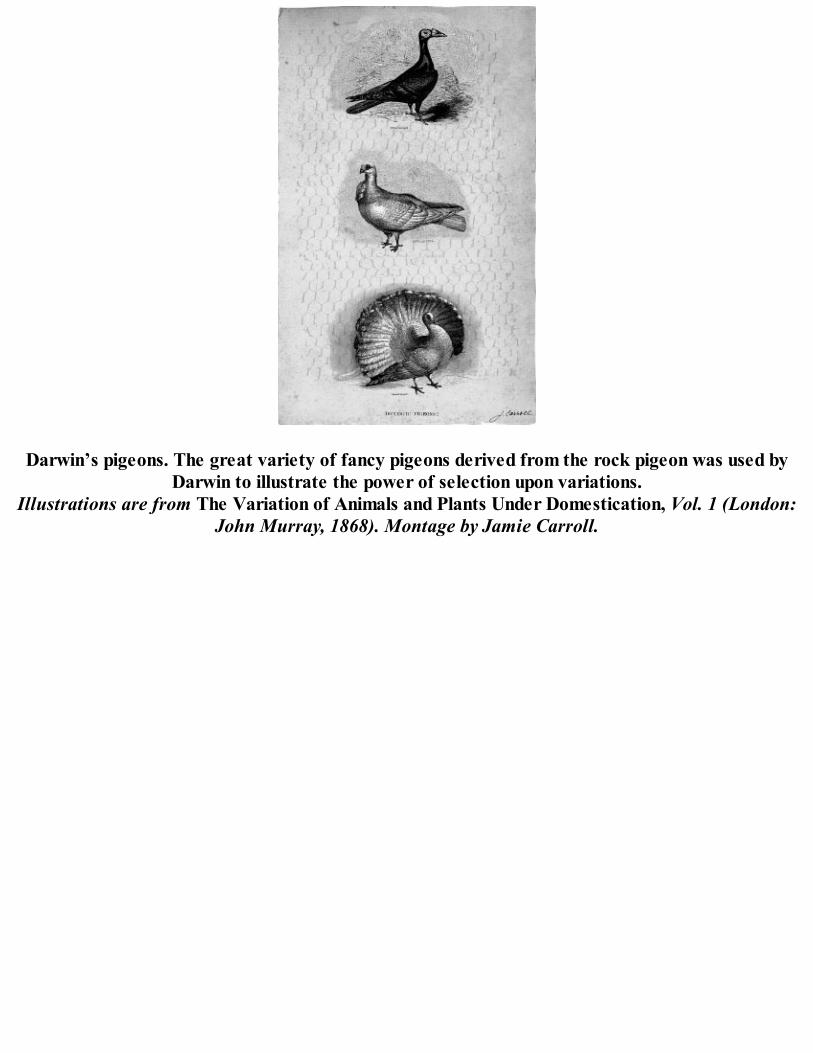
Darwin’s pigeons. The great variety of fancy pigeons derived from the rock pigeon was used byDarwin to illustrate the power of selection upon variations.
Illustrations are from The Variation of Animals and Plants Under Domestication, Vol. 1 (London:John Murray, 1868). Montage by Jamie Carroll.
Chapter 2
The Everyday Math of Evolution: Chance, Selection, and Time
The whole of science is nothing more than a refinement of everyday thinking.—Albert Einstein
EVERY FEW MONTHS OR SO, RADIO AND TV STATIONS will report that the jackpot in the multistate Powerballlottery has gone unclaimed and grown to some huge sum. This prompts a rush to purchase tickets for achance to become filthy rich, and swells the jackpot even more. Many folks who live in nonparticipatingstates and don’t ordinarily play the lottery will drive a fair distance and shell out quite a few bucks,perhaps figuring that it is not worth the trouble to buy a chance for $40 or $50 million, but for $200million, now that’s some real money!
California State University Professor Mike Orkin points out that if a person drives ten miles to buy aticket, he or she is about sixteen times more likely to get killed in a car crash on the way than to win thejackpot. Wait a minute, you say; that may be for one ticket, but they’re buying a lot of tickets—surely, thatimproves the odds. It does, but Orkin notes that a person who buys fifty tickets a week will win thejackpot on average about once every 30,000 years.
We sure do have some very funny ideas and attitudes about statistics and probabilities. And theseideas don’t end with the lottery.
Stories of shark attacks always draw news coverage (not to mention spawning several movies), butthe fact that the incidence of fatal shark attacks is about 1 per 300 million people per year (in the UnitedStates) doesn’t seem to reduce our fear and morbid fascination. And if sharks aren’t scary enough, thereare mountain lions. The chance of a fatal attack happening in California, where there are growing numbersof mountain lions, is 1 in 32 million per year. Now compare that with the chances of dying of a dog bite—almost fifty times higher, at 1 in 700,000 per year—yet we surround ourselves with these lovable,slobbering killers!
Something in our nature makes us believe in our chances of beating the long odds against a greatevent, but we fret over even more remote odds against a tragedy, while ignoring more immediate andgreater dangers. Psychology and statistics clearly do not inhabit the same parts of our brains.
I raise these examples of probabilities because evolution does involve some elements of chance.This is a major source of both doubt and confusion. Some people look at the order of nature and themarvelous ways species are adapted to their surroundings, like the icefish in the freezing waters of theAntarctic, and can’t believe that this could spring from any process that involved an element of chance.Rather, they conclude that the odds are stacked against nature inventing anything new, useful, or complex.Overcoming this doubt requires understanding the interplay between chance, selection, and time. In thischapter, I will show that understanding evolution—meaning change over time—boils down to the samekind of thinking and mathematics we use (or should use in the case of the lottery!) to calculate theprobabilities of everyday events.
Albert Einstein, when asked “What is the most powerful force in the universe?,” replied,“Compounding interest.” If Einstein had been just a little more clever, he would have said, “Natural

selection” each of these forces derives its power from the same mathematical principle. That principlemight be stated simply: even though one starts with a small number (e.g., one’s money in the bank) andeven though the rate of increase in this number is seemingly modest per year (e.g., the interest the bankprovides), given sufficient time, the growth from that initial number is dramatic after many years ofcompounding.
In the case of evolution, the “small number” is the number of individuals in a population with a traitand the “seemingly modest rate” is the small selective advantage that trait confers on those individualsthat carry it. As I will discuss in detail shortly, the “sufficient time” for evolution is far less than onemight think. While the time required for a trait to become prevalent in a population is greater than onelifetime, it is often no more than a few hundred generations. This is a blink of an eye in geologic time.This point was not appreciated until many years after Darwin formulated his theory of natural selection.The implication of this simple fact (based on simple math) is profound: it tells us that small differencesamong individuals, when compounded by natural selection over time, really do add up to the largedifferences we see among species.
Overcoming Doubts with Pigeons and Rats
First-time readers of On the Origin of Species may expect to be greeted with a dazzling parade of life’sdiversity or a sizzling narrative of human origins. They find neither. In chapter I of the most importantbook in all of biology, we get…pigeons.
That’s right. After a five-year voyage around the world and more than twenty years of work andwriting, Darwin opened his life’s opus with English pigeons.
It was the first of many brilliant masterstrokes.Before explaining natural selection and the descent of all species from common ancestors, he chose
to explain the ideas of selection and descent in the more familiar forms of pigeon breeds.Darwin himself was a pigeon expert. He explained at the outset, “Believing that it is always best to
study some special group, I have, after deliberation, taken up domestic pigeons. I have kept every breedwhich I could purchase or obtain, and have been most kindly favoured with skins from several quarters ofthe world.”
Pigeons taught Darwin about the interplay of variation and selection, and convinced him that naturalselection on slight variations could, over time, account for the large differences among species.
Darwin pointed out that the varieties of pigeon were so markedly different from one another that ifshown to an ornithologist and told that they were wild birds, they would each be ranked as well-definedspecies. But Darwin deduced correctly that they were all descended from the rock pigeon. He thenapplied his insights from pigeons to all of Nature.
Naturalists and breeders were misled by appearances into thinking that every kind of domestic breed(cattle, sheep, etc.) came from separate ancestors. Darwin wrote, “When I first kept pigeons and watchedthe several kinds, knowing well how true they bred, I felt fully as much difficulty in believing that theycould ever have descended from a common parent, as any naturalist could in coming to a similarconclusion in regard to the many species of finches.” His explanation for the lack of appreciation of theeffect of selection was simple: “from long-continued study they [breeders] are strongly impressed withthe differences between several races…yet they ignore all general arguments, and refuse to sum up intheir minds slight differences accumulated during many successive generations [emphasis added].”
Darwin knew a wide community of pigeon fanciers with whom he shared knowledge on how muchtime was required to change traits by selective breeding. He notes that “that most skillful breeder, Sir

John Sebright, used to say, with respect to pigeons, that ‘he could produce any given feather in threeyears, but it would take him six years to obtain head and beak.’”
Darwin was convinced of the power of natural selection over time. But even his strongest advocateshad reservations.
The main sticking point was whether natural selection was efficient enough to act on smalldifferences between individuals, or whether selection could work only on large differences. Darwin’sgreatest ally, biologist Thomas Huxley, believed in selection, to be sure. But Huxley found it difficult toexplain the gaps between existing species and those in the fossil record as a result of natural selectionacting on small continuous differences over long periods of time. Huxley preferred to think of selectionacting on “saltations,” which are large discontinuous differences among individuals. Huxley’s favoriteexamples were humans and animals with extra digits. If these could arise fully formed in one generation,then the evolution of differences in digit number between species was, in Huxley’s view, more readilyexplained by saltations than the gradual evolution of digits. Huxley held this view to his death. Thequestion of whether natural selection was powerful enough to shape the gradual evolution of complexstructures would be passed to a new generation of biologists. And for a while, things didn’t look so goodfor Darwin.
Huxley and Darwin went to their graves completely ignorant of the mechanisms of heredity. The firstrules of inheritance were discovered by the Augustinian monk Gregor Mendel in the course of breedingexperiments he conducted on pea plants in the late 1850s and early 1860s (ironically, exactly at the timeof publication of On the Origin of Species). But while Mendel was aware of Darwin, the great naturalistwas never aware of Mendel’s work, although the German journal in which it was described wasavailable in Britain. It wasn’t until 1900, some thirty-four years after publication and sixteen years afterMendel’s death, that the scientific world took note.
One biologist who seized upon Mendel’s work was William Bateson, a Cambridge Universitynaturalist. Bateson was seeking the laws of variation and he wrote a large book on all sorts of large,discontinuous variations found in nature. This was the foundation for his belief that selection acted onlarge differences among individuals, and that Darwin’s picture of evolution occurring in small incrementswas wrong.
In Mendel’s work, Bateson thought he had found the evidence to clinch his view. Mendel showedthat several traits in the pea plant were inherited in a simple fashion such that the difference between peashape or color was determined by single units (we now call these units genes). For Bateson, this was hardevidence that evolution acted on large, discrete differences such as wrinkled or smooth shape, green oryellow color—and not on anything in between. The new Mendelian evidence widened the gap betweendoubters and supporters of natural selection. Mendel’s laws were clearly correct, so how could thisimpasse persist and what discoveries turned the tide back in favor of Darwin?
The turning point came, in the sort of irony that is so common in science, when the doubtersconsidered more evidence. The story is a perfect echo of T. H. Huxley’s admonition that “science warnsme to be careful how I adopt a view which jumps with my preconceptions, and to require strongerevidence for such beliefs than for one to which I was previously hostile.”
The discovery of Mendelian genetics energized all sorts of research programs, includingexperiments to improve animal breeds. One of the most important figures in this area was William Castleof Harvard University, who promptly embraced Mendelian inheritance and Bateson’s view ofdiscontinuous variation as the material for evolution. But Castle was to reverse his support of Bateson’sview in relatively short order.
Castle’s reversal was caused by the results of a series of breeding experiments carried out with ratsover many generations. Castle and other biologists initially believed selection could not change acharacter beyond the original limits of variation of the character. Castle worked with “hooded” rats, so
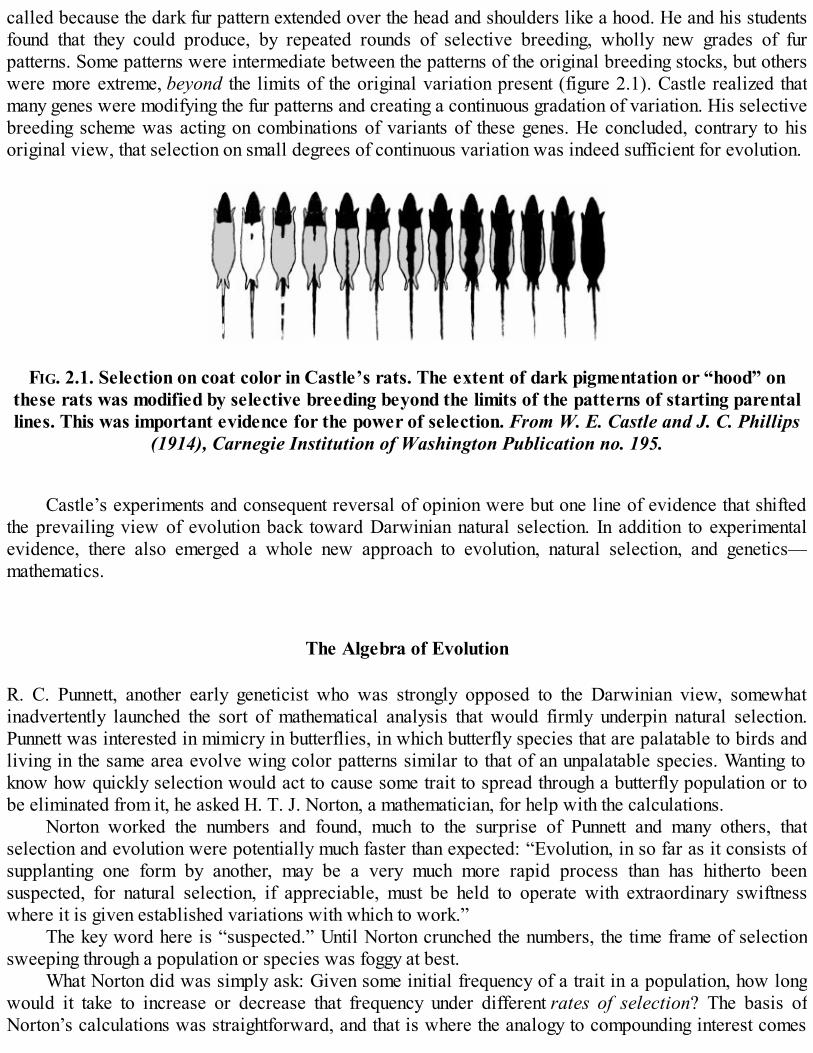
called because the dark fur pattern extended over the head and shoulders like a hood. He and his studentsfound that they could produce, by repeated rounds of selective breeding, wholly new grades of furpatterns. Some patterns were intermediate between the patterns of the original breeding stocks, but otherswere more extreme, beyond the limits of the original variation present (figure 2.1). Castle realized thatmany genes were modifying the fur patterns and creating a continuous gradation of variation. His selectivebreeding scheme was acting on combinations of variants of these genes. He concluded, contrary to hisoriginal view, that selection on small degrees of continuous variation was indeed sufficient for evolution.
FIG. 2.1. Selection on coat color in Castle’s rats. The extent of dark pigmentation or “hood” onthese rats was modified by selective breeding beyond the limits of the patterns of starting parentallines. This was important evidence for the power of selection. From W. E. Castle and J. C. Phillips
(1914), Carnegie Institution of Washington Publication no. 195.
Castle’s experiments and consequent reversal of opinion were but one line of evidence that shiftedthe prevailing view of evolution back toward Darwinian natural selection. In addition to experimentalevidence, there also emerged a whole new approach to evolution, natural selection, and genetics—mathematics.
The Algebra of Evolution
R. C. Punnett, another early geneticist who was strongly opposed to the Darwinian view, somewhatinadvertently launched the sort of mathematical analysis that would firmly underpin natural selection.Punnett was interested in mimicry in butterflies, in which butterfly species that are palatable to birds andliving in the same area evolve wing color patterns similar to that of an unpalatable species. Wanting toknow how quickly selection would act to cause some trait to spread through a butterfly population or tobe eliminated from it, he asked H. T. J. Norton, a mathematician, for help with the calculations.
Norton worked the numbers and found, much to the surprise of Punnett and many others, thatselection and evolution were potentially much faster than expected: “Evolution, in so far as it consists ofsupplanting one form by another, may be a very much more rapid process than has hitherto beensuspected, for natural selection, if appreciable, must be held to operate with extraordinary swiftnesswhere it is given established variations with which to work.”
The key word here is “suspected.” Until Norton crunched the numbers, the time frame of selectionsweeping through a population or species was foggy at best.
What Norton did was simply ask: Given some initial frequency of a trait in a population, how longwould it take to increase or decrease that frequency under different rates of selection? The basis ofNorton’s calculations was straightforward, and that is where the analogy to compounding interest comes
in. His question is very similar to “Given some initial amount of money, how does that amount changeover time at different rates of interest?”
Those of us old enough to have retirement accounts, or fortunate enough to have some savings,should be familiar with the power of compounding. A quantity of anything—money, people, fish—growsexponentially when its increase is proportional to the quantity present. For money, the key to the rate ofgrowth is the interest rate or rate of return. An investor earning 7 percent compounded will see her wealthdouble about every 10 years, while another investor earning only 1 percent compounded will see itdouble about every 70 years. After 70 years, that difference in interest rate means that seven doublingswill occur for the first investor versus only one doubling for the other. The growth in money will be 2 × 2× 2 × 2 × 2 × 2 × 2 or 128-fold for one investor versus just 2-fold for the other, a 64-fold difference inwealth. That 6 percent difference sure adds up.
In biology, exponential growth cannot occur unabated because organisms die, and resources arefinite. Darwin famously pointed out that a pair of elephants that produce six offspring in their 60-year lifespan would have 15 million descendants in just 500 years, even with mortality figured in. But the limitedland, food, and water available means that all organisms live in competition. Competition constrains theabsolute growth of populations, but it is the critical setting for natural selection. Wherever there iscompetition (which is everywhere) and heritable variation, selection operates.
Biologists calculate the power of selection in terms of selection coefficients, which are analogousto interest rates (and abbreviated as s). This coefficient indicates the incremental difference in relativereproductive success and survival between individuals with a trait and those without it. If, for example,the presence of a trait conveys a small advantage to individuals such that they produce 101 viableoffspring and those lacking it produce 100 offspring, this is a 1 percent advantage (a 1 percent rate ofcompounding) and the value of s is positive 0.01. If there is a disadvantage of having a certain trait, say99 offspring are produced instead of 100, s is then negative 0.01. These positive or negative values ofselection coefficients are an indicator of fitness, which is a relative, not an absolute measure.
Just as Einstein and investors appreciate the power of compounding interest, Norton helpedbiologists see the power of natural selection. For example, under a modest selective advantage of just0.01, Norton calculated that a dominant trait would increase in frequency from just 8 individuals in 1000to greater than 90 percent of individuals in only 3000 generations. If the selective advantage was 10-foldgreater (s = 0.1), this time was cut to just 300 generations. With many species having generation times ofa year or less, these figures impressed many biologists. Much more mathematical work followed,particularly that of J. B. S. Haldane, who, along with R. A. Fisher and Sewall Wright, developed a host offormulas for understanding the relationship between evolution, selection, and time under a wide variety ofdifferent conditions.
I have been describing change in the frequency of some trait, but the compounding power of naturalselection also applies to the rate of change in traits themselves. Consider the dimensions of any physicaltrait—the height of a plant or the length of an animal. We appreciate that there will be variation in thesedimensions in any wild population. Now, suppose there is a selective advantage to the taller or longerindividuals of each generation. If the rate of change per generation is just 0.2 percent, which would be 2millimeters on a 1-meter-high plant or 1-meter-long animal, this would be imperceptible generation togeneration. But, in just 200 generations, their height or length would increase by 50 percent.
These calculations demonstrate the potential power and speed of natural selection. Now, what dowe know about it in reality?
Natural Selection in the Wild
Selection is much easier to see in a math formula than it is to see in the wild. In addition to the difficultyof controlling conditions, there are two major factors one can immediately appreciate that make it difficultto measure. The first is time. If changes are measurable only over periods of time that are longer thannaturalists or researchers have the opportunity to record, then it would seem we are out of luck. Thesecond challenge is the number of measurements required. The data sample must be large in order todetect subtle selective advantages or disadvantages.
This latter difficulty is a fact of probability and statistics. If the relative fitness of two forms of aspecies differs by a small percentage, one must count a large number of individuals over time in order toovercome the random effects of sampling error. This can be illustrated with a simple example.
Suppose one is testing whether one color of an animal may be favored over another. How manyanimals need to be sampled to detect a deviation from some expected ratio? Let’s suppose it is a plentifulspecies, say a fish that we can net and count. Probability theory tells us that the more individuals wecount, the closer we come to knowing the actual number of each type of fish in a population. How manydo we need in order to be 95 percent confident in our sample (that is, 95 times out of 100 we will becorrect within a given range)? As the table below shows, the margin of error decreases as the sample sizeincreases.
Sample Size Margin of Error (Percent)
100 ±9.8400 ±4.91000 ±3.1
10,000 ±1.0
If we sample just 100 fish our estimate may be off as much as 10 percent. One cannot detect subtleselection with such large error. (Poll takers face the same problem of small sample size, which is whythey sometimes make errors in forecasting election results).
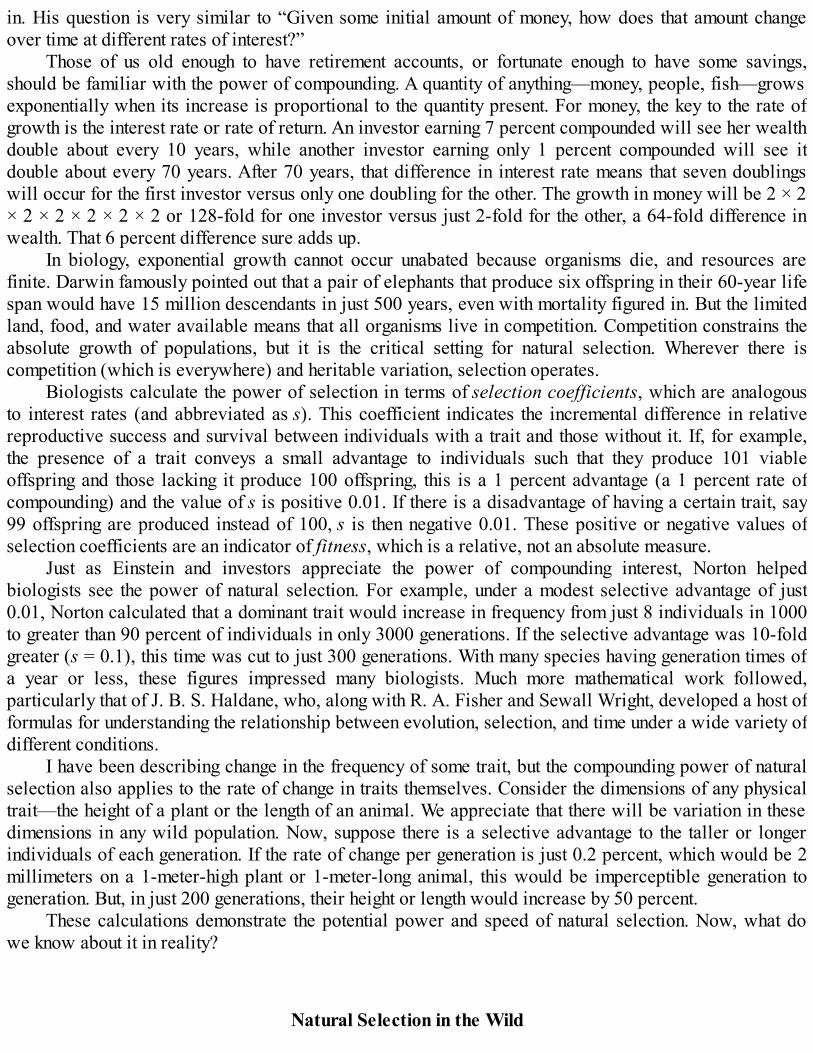
The challenge of detecting slight selective differences in the wild means that we mostly know ofcases where selection is very strong and therefore very fast. The most widely known case is that ofmelanism in peppered moths. With the onset of the Industrial Revolution, pollution in areas of Englandand North America altered the coloration and lichen growth on trees where the peppered moth rests.There was a dramatic, rapid increase in the frequency of dark, melanic forms of the moth in industrialareas and a dramatic decrease in the light form. In just fifty years, from around 1848 to 1896, the darkform arose and evolved to as high as a 98 percent frequency in some areas. Haldane estimated fromsurveys of moth types taken over this period that the selection coefficient against light moths on dark treeswas on the order of negative 0.2. A 20 percent disadvantage may seem modest, but, when compoundedseason after season, it will reduce the frequency of a population very, very quickly. In the last halfcentury, with the enactment of clean air laws, the selection pressure reversed direction and there isexcellent documentation of the rapid decline in the dark melanic form from above 90 percent of pepperedmoths to less than 10 percent in some locations (figure 2.2).
The agents of natural selection on the peppered moth are birds, and here is another variable thatmakes natural selection difficult to investigate in the wild. Not only do we require sufficient samplenumbers of moths, if possible, we want to know about the selective agents acting on them. This can getcomplicated if there are multiple predators, conditions that vary with habitat and time of day, etc. In thepeppered moth case, the rapid rises and declines of the two forms, which occurred in parallel on twocontinents and were associated with changing industrial practices, were no doubt due to natural selectionon color forms.
The peppered moth story is just one example. The natural selection of animal coloration has beenstudied in land snails, ladybird beetles, desert mice, and other species with definite or probable selectiveagents identified. In some of these species the selection coefficients for certain color types are fairly large(from 0.01 to 0.5).
FIG. 2.2. The decline of melanic moths with the improvement of air quality. As the selectiveconditions changed, the frequency of melanic moths has dropped steadily in both the United States(solid diamonds) and Britain (solid circles). The open circles represent the expected decline under aselection coefficient of –0.15. Figure modified from B. S. Grant et al. (1996), Journal of Heredity
87:3551.
It is important to appreciate that the long-term studies necessary to study natural selection in the wildrequire a combination of often heroic personal commitment, continuous financial support, and the evengreater fortune of nature’s cooperation. Field biology itself selects for human researchers withparticularly rare characteristics.
A recent seven-year-long field study of falcon predation on feral pigeons demonstrates the patienceand tenacity required for understanding selection in the wild. The pigeons around Davis, California, occurin six different plumage color schemes, and they are a favorite meal of the peregrine falcon. One form ofthe pigeon is blue-gray with a white rump of feathers between the base of the tail and lower back; allother forms of the pigeon lack this white rump patch (figure 2.3). A team of researchers, led by AlbertoPalleroni of Harvard University, has studied the air war between falcon and pigeon in exceptional detail.Over the seven-year span, they recorded 1485 (!) attacks by five adult falcons on feral pigeons (figure2.4). The scientists looked for any relationship between the pigeon feather colors and the falcons attackand success rate. To do so, they attached bands to and recorded data on 5235 pigeons—a very largesample.

FIG. 2.3. Variation in pigeon rump feather coloration. In urban pigeon populations, some individualssport white rump feathers (left) that offer some advantage in evading attack by peregrine falcons.
Drawings by Jamie Carroll.
FIG. 2.4. The pursuit. A peregrine falcon hits speeds of 150 mph during its dive. Here, a pigeon inperil. Photograph by Rob Palmer, courtesy of Alberto Palleroni.
The researchers found that falcons attacked the white-rumped pigeons less frequently than the otherpigeons, and they were generally unsuccessful at catching them when they did try. While the white-rumpedpigeons made up 20 percent of all pigeons in the area, they accounted for only 2 percent of all pigeonscaptured by the falcons.
Palleroni and colleagues attribute this advantage of white rump feathers to their function during anevasive roll that all pigeons execute in midair while under attack. As the falcon dives at speeds over 200miles per hour, the pigeons dip a wing and roll out of the falcon’s path. The biologists suggest that thewhite patch distracts the falcon as the roll is initiated, providing an extra split second to dodge the attack.
To test their theory further, the researchers switched the rump feathers among 756 white-rumped andblue-barred pigeons (by clipping and splicing the feathers with latex glue), released the birds, andrecorded their fate during falcon attacks. The capture rates were reversed. The formerly white-rumpedbirds were captured at the same rate as the rest of the pigeons forms, and the blue-barred pigeons withtheir transplanted white rumps were protected.
Over the course of this amazing study, the researchers observed a steady increase in the population

of white-rumped pigeons over other types. The pigeons are evolving under natural selection.
THE SPECTRUM of studies of natural selection in the wild is expanding to more complex traits than animalcolor. The evolution of the threespine stickleback fish is a great example. We know from the geologicrecord that as glaciers receded at the end of the last ice age, oceanic sticklebacks that invaded lakes andstreams became isolated. These freshwater populations then diverged from their oceanic ancestors. Theocean form of sticklebacks typically has a continuous row of more than 30 armor plates running from headto tail. In many freshwater populations, this number has been reduced to a range of from 0 to 9 plates. Theselective advantage of plate reduction in lakes and streams may be due to greater body flexibility andmaneuverability while swimming.
FIG. 2.5. Rapid evolution of armor plating in stickleback fish. In lakes throughout northern NorthAmerica, oceanic stickleback fish have adapted to new conditions by reducing the number and size
of armor plates, a part of their body skeleton. Figure from M. A. Bell et al. (2004), Evolution58:814.
The evolution of sticklebacks has also been observed in real time. In Loberg Lake, Alaska, oceanicsticklebacks colonized the lake after a chemical eradication program exterminated the residentpopulations in 1982. Over a span of just twelve years, from 1990 to 2001, regular sampling revealed thatthe frequency of the oceanic form dropped steadily, from 100 percent to 11 percent, while a form withlow plate number rose to 75 percent, with various intermediates making up another small fraction (figure2.5). The evolution of the Loberg Lake population shows that these fish adapt to freshwater habitatswithin decades after their arrival from the oceans. Because sticklebacks evolve quickly in newenvironments, this species is a terrific model for the study of evolution and I will return to them againlater, in chapter 8.
These few examples demonstrate the rapidity of evolution and the strength of selection when actingupon variations already present in a population. But where does that variation comes from? And whathappens if useful variations are not available? How long might a population have to “wait” for newvariations to appear?
The Mutation Lottery: We Are All Mutants
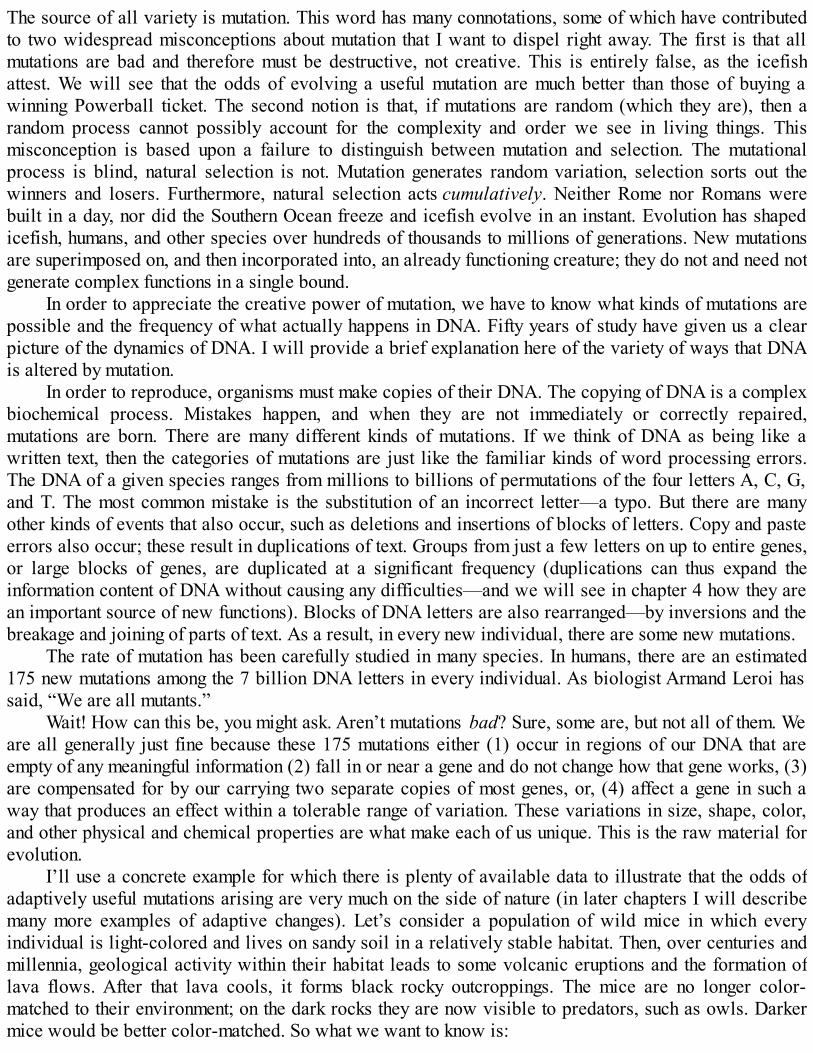
The source of all variety is mutation. This word has many connotations, some of which have contributedto two widespread misconceptions about mutation that I want to dispel right away. The first is that allmutations are bad and therefore must be destructive, not creative. This is entirely false, as the icefishattest. We will see that the odds of evolving a useful mutation are much better than those of buying awinning Powerball ticket. The second notion is that, if mutations are random (which they are), then arandom process cannot possibly account for the complexity and order we see in living things. Thismisconception is based upon a failure to distinguish between mutation and selection. The mutationalprocess is blind, natural selection is not. Mutation generates random variation, selection sorts out thewinners and losers. Furthermore, natural selection acts cumulatively. Neither Rome nor Romans werebuilt in a day, nor did the Southern Ocean freeze and icefish evolve in an instant. Evolution has shapedicefish, humans, and other species over hundreds of thousands to millions of generations. New mutationsare superimposed on, and then incorporated into, an already functioning creature; they do not and need notgenerate complex functions in a single bound.
In order to appreciate the creative power of mutation, we have to know what kinds of mutations arepossible and the frequency of what actually happens in DNA. Fifty years of study have given us a clearpicture of the dynamics of DNA. I will provide a brief explanation here of the variety of ways that DNAis altered by mutation.
In order to reproduce, organisms must make copies of their DNA. The copying of DNA is a complexbiochemical process. Mistakes happen, and when they are not immediately or correctly repaired,mutations are born. There are many different kinds of mutations. If we think of DNA as being like awritten text, then the categories of mutations are just like the familiar kinds of word processing errors.The DNA of a given species ranges from millions to billions of permutations of the four letters A, C, G,and T. The most common mistake is the substitution of an incorrect letter—a typo. But there are manyother kinds of events that also occur, such as deletions and insertions of blocks of letters. Copy and pasteerrors also occur; these result in duplications of text. Groups from just a few letters on up to entire genes,or large blocks of genes, are duplicated at a significant frequency (duplications can thus expand theinformation content of DNA without causing any difficulties—and we will see in chapter 4 how they arean important source of new functions). Blocks of DNA letters are also rearranged—by inversions and thebreakage and joining of parts of text. As a result, in every new individual, there are some new mutations.
The rate of mutation has been carefully studied in many species. In humans, there are an estimated175 new mutations among the 7 billion DNA letters in every individual. As biologist Armand Leroi hassaid, “We are all mutants.”
Wait! How can this be, you might ask. Aren’t mutations bad? Sure, some are, but not all of them. Weare all generally just fine because these 175 mutations either (1) occur in regions of our DNA that areempty of any meaningful information (2) fall in or near a gene and do not change how that gene works, (3)are compensated for by our carrying two separate copies of most genes, or, (4) affect a gene in such away that produces an effect within a tolerable range of variation. These variations in size, shape, color,and other physical and chemical properties are what make each of us unique. This is the raw material forevolution.
I’ll use a concrete example for which there is plenty of available data to illustrate that the odds ofadaptively useful mutations arising are very much on the side of nature (in later chapters I will describemany more examples of adaptive changes). Let’s consider a population of wild mice in which everyindividual is light-colored and lives on sandy soil in a relatively stable habitat. Then, over centuries andmillennia, geological activity within their habitat leads to some volcanic eruptions and the formation oflava flows. After that lava cools, it forms black rocky outcroppings. The mice are no longer color-matched to their environment; on the dark rocks they are now visible to predators, such as owls. Darkermice would be better color-matched. So what we want to know is:
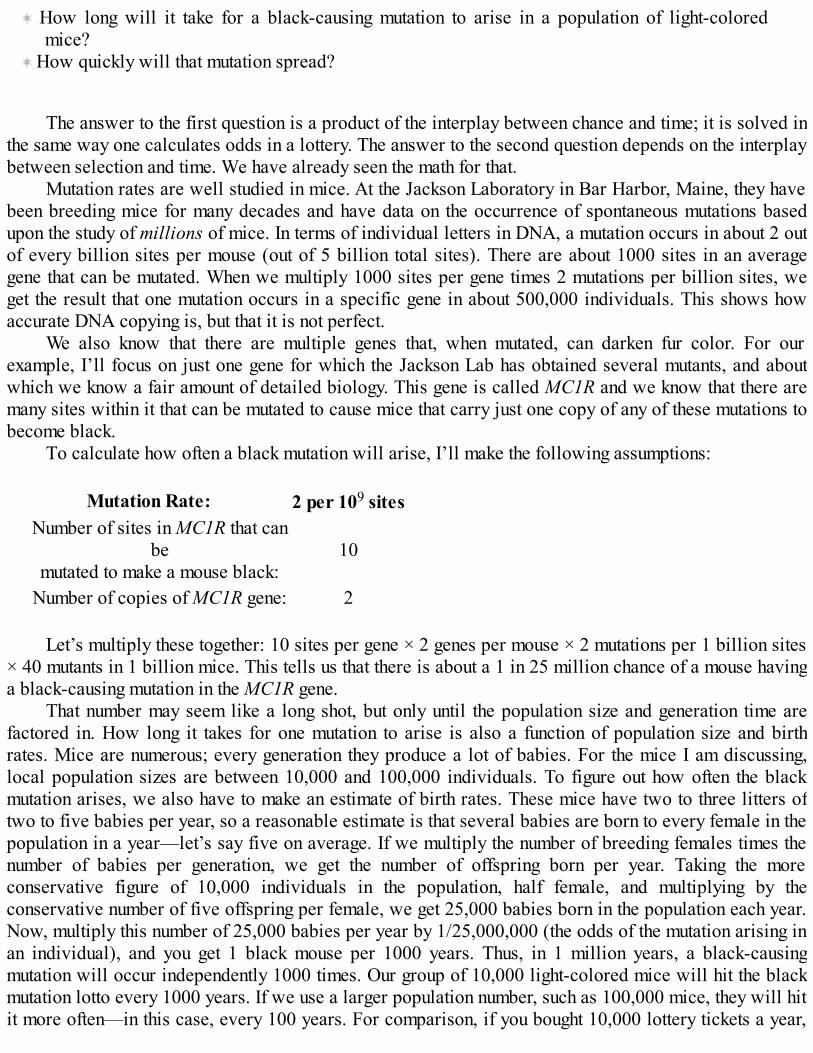
How long will it take for a black-causing mutation to arise in a population of light-coloredmice?
How quickly will that mutation spread?
The answer to the first question is a product of the interplay between chance and time; it is solved inthe same way one calculates odds in a lottery. The answer to the second question depends on the interplaybetween selection and time. We have already seen the math for that.
Mutation rates are well studied in mice. At the Jackson Laboratory in Bar Harbor, Maine, they havebeen breeding mice for many decades and have data on the occurrence of spontaneous mutations basedupon the study of millions of mice. In terms of individual letters in DNA, a mutation occurs in about 2 outof every billion sites per mouse (out of 5 billion total sites). There are about 1000 sites in an averagegene that can be mutated. When we multiply 1000 sites per gene times 2 mutations per billion sites, weget the result that one mutation occurs in a specific gene in about 500,000 individuals. This shows howaccurate DNA copying is, but that it is not perfect.
We also know that there are multiple genes that, when mutated, can darken fur color. For ourexample, I’ll focus on just one gene for which the Jackson Lab has obtained several mutants, and aboutwhich we know a fair amount of detailed biology. This gene is called MC1R and we know that there aremany sites within it that can be mutated to cause mice that carry just one copy of any of these mutations tobecome black.
To calculate how often a black mutation will arise, I’ll make the following assumptions:
Mutation Rate: 2 per 109 sitesNumber of sites in MC1R that can
bemutated to make a mouse black:
10
Number of copies of MC1R gene: 2
Let’s multiply these together: 10 sites per gene × 2 genes per mouse × 2 mutations per 1 billion sites× 40 mutants in 1 billion mice. This tells us that there is about a 1 in 25 million chance of a mouse havinga black-causing mutation in the MC1R gene.
That number may seem like a long shot, but only until the population size and generation time arefactored in. How long it takes for one mutation to arise is also a function of population size and birthrates. Mice are numerous; every generation they produce a lot of babies. For the mice I am discussing,local population sizes are between 10,000 and 100,000 individuals. To figure out how often the blackmutation arises, we also have to make an estimate of birth rates. These mice have two to three litters oftwo to five babies per year, so a reasonable estimate is that several babies are born to every female in thepopulation in a year—let’s say five on average. If we multiply the number of breeding females times thenumber of babies per generation, we get the number of offspring born per year. Taking the moreconservative figure of 10,000 individuals in the population, half female, and multiplying by theconservative number of five offspring per female, we get 25,000 babies born in the population each year.Now, multiply this number of 25,000 babies per year by 1/25,000,000 (the odds of the mutation arising inan individual), and you get 1 black mouse per 1000 years. Thus, in 1 million years, a black-causingmutation will occur independently 1000 times. Our group of 10,000 light-colored mice will hit the blackmutation lotto every 1000 years. If we use a larger population number, such as 100,000 mice, they will hitit more often—in this case, every 100 years. For comparison, if you bought 10,000 lottery tickets a year,
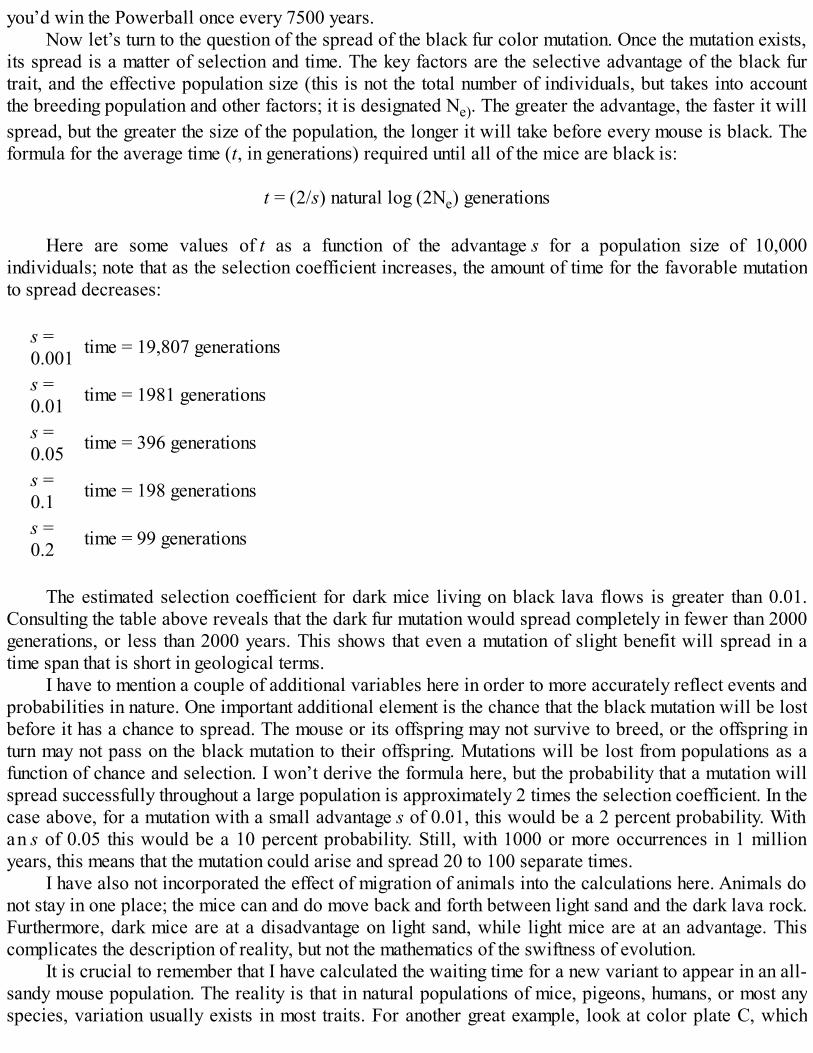
you’d win the Powerball once every 7500 years.Now let’s turn to the question of the spread of the black fur color mutation. Once the mutation exists,
its spread is a matter of selection and time. The key factors are the selective advantage of the black furtrait, and the effective population size (this is not the total number of individuals, but takes into accountthe breeding population and other factors; it is designated Ne). The greater the advantage, the faster it willspread, but the greater the size of the population, the longer it will take before every mouse is black. Theformula for the average time (t, in generations) required until all of the mice are black is:
t = (2/s) natural log (2Ne) generations
Here are some values of t as a function of the advantage s for a population size of 10,000
individuals; note that as the selection coefficient increases, the amount of time for the favorable mutationto spread decreases:
s =0.001 time = 19,807 generations
s =0.01 time = 1981 generations
s =0.05 time = 396 generations
s =0.1 time = 198 generations
s =0.2 time = 99 generations
The estimated selection coefficient for dark mice living on black lava flows is greater than 0.01.
Consulting the table above reveals that the dark fur mutation would spread completely in fewer than 2000generations, or less than 2000 years. This shows that even a mutation of slight benefit will spread in atime span that is short in geological terms.
I have to mention a couple of additional variables here in order to more accurately reflect events andprobabilities in nature. One important additional element is the chance that the black mutation will be lostbefore it has a chance to spread. The mouse or its offspring may not survive to breed, or the offspring inturn may not pass on the black mutation to their offspring. Mutations will be lost from populations as afunction of chance and selection. I won’t derive the formula here, but the probability that a mutation willspread successfully throughout a large population is approximately 2 times the selection coefficient. In thecase above, for a mutation with a small advantage s of 0.01, this would be a 2 percent probability. Withan s of 0.05 this would be a 10 percent probability. Still, with 1000 or more occurrences in 1 millionyears, this means that the mutation could arise and spread 20 to 100 separate times.
I have also not incorporated the effect of migration of animals into the calculations here. Animals donot stay in one place; the mice can and do move back and forth between light sand and the dark lava rock.Furthermore, dark mice are at a disadvantage on light sand, while light mice are at an advantage. Thiscomplicates the description of reality, but not the mathematics of the swiftness of evolution.
It is crucial to remember that I have calculated the waiting time for a new variant to appear in an all-sandy mouse population. The reality is that in natural populations of mice, pigeons, humans, or most anyspecies, variation usually exists in most traits. For another great example, look at color plate C, which
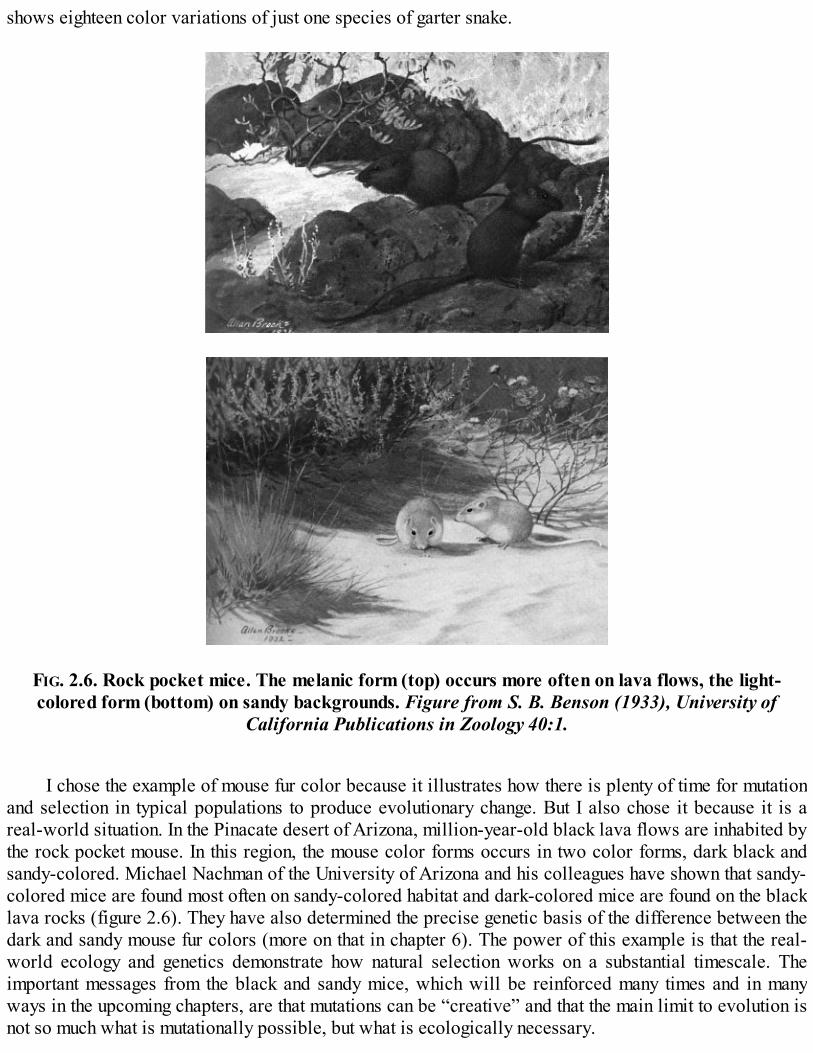
shows eighteen color variations of just one species of garter snake.
FIG. 2.6. Rock pocket mice. The melanic form (top) occurs more often on lava flows, the light-colored form (bottom) on sandy backgrounds. Figure from S. B. Benson (1933), University of
California Publications in Zoology 40:1.
I chose the example of mouse fur color because it illustrates how there is plenty of time for mutationand selection in typical populations to produce evolutionary change. But I also chose it because it is areal-world situation. In the Pinacate desert of Arizona, million-year-old black lava flows are inhabited bythe rock pocket mouse. In this region, the mouse color forms occurs in two color forms, dark black andsandy-colored. Michael Nachman of the University of Arizona and his colleagues have shown that sandy-colored mice are found most often on sandy-colored habitat and dark-colored mice are found on the blacklava rocks (figure 2.6). They have also determined the precise genetic basis of the difference between thedark and sandy mouse fur colors (more on that in chapter 6). The power of this example is that the real-world ecology and genetics demonstrate how natural selection works on a substantial timescale. Theimportant messages from the black and sandy mice, which will be reinforced many times and in manyways in the upcoming chapters, are that mutations can be “creative” and that the main limit to evolution isnot so much what is mutationally possible, but what is ecologically necessary.
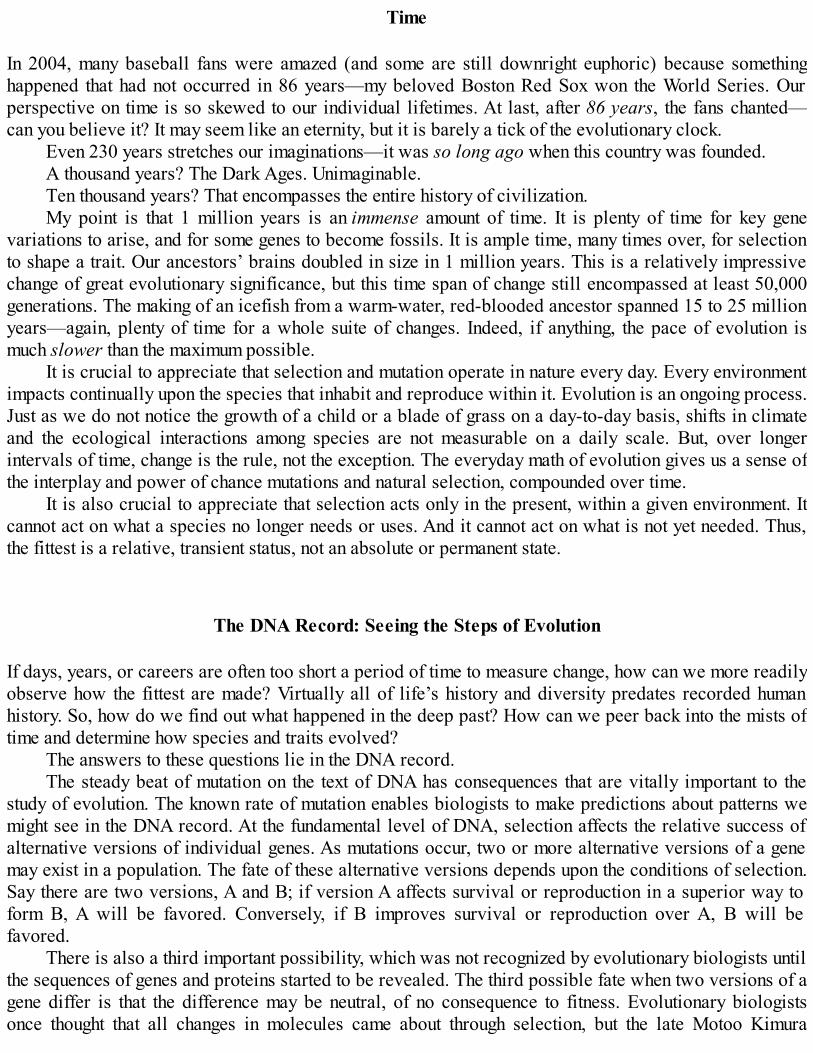
Time
In 2004, many baseball fans were amazed (and some are still downright euphoric) because somethinghappened that had not occurred in 86 years—my beloved Boston Red Sox won the World Series. Ourperspective on time is so skewed to our individual lifetimes. At last, after 86 years, the fans chanted—can you believe it? It may seem like an eternity, but it is barely a tick of the evolutionary clock.
Even 230 years stretches our imaginations—it was so long ago when this country was founded.A thousand years? The Dark Ages. Unimaginable.Ten thousand years? That encompasses the entire history of civilization.My point is that 1 million years is an immense amount of time. It is plenty of time for key gene
variations to arise, and for some genes to become fossils. It is ample time, many times over, for selectionto shape a trait. Our ancestors’ brains doubled in size in 1 million years. This is a relatively impressivechange of great evolutionary significance, but this time span of change still encompassed at least 50,000generations. The making of an icefish from a warm-water, red-blooded ancestor spanned 15 to 25 millionyears—again, plenty of time for a whole suite of changes. Indeed, if anything, the pace of evolution ismuch slower than the maximum possible.
It is crucial to appreciate that selection and mutation operate in nature every day. Every environmentimpacts continually upon the species that inhabit and reproduce within it. Evolution is an ongoing process.Just as we do not notice the growth of a child or a blade of grass on a day-to-day basis, shifts in climateand the ecological interactions among species are not measurable on a daily scale. But, over longerintervals of time, change is the rule, not the exception. The everyday math of evolution gives us a sense ofthe interplay and power of chance mutations and natural selection, compounded over time.
It is also crucial to appreciate that selection acts only in the present, within a given environment. Itcannot act on what a species no longer needs or uses. And it cannot act on what is not yet needed. Thus,the fittest is a relative, transient status, not an absolute or permanent state.
The DNA Record: Seeing the Steps of Evolution
If days, years, or careers are often too short a period of time to measure change, how can we more readilyobserve how the fittest are made? Virtually all of life’s history and diversity predates recorded humanhistory. So, how do we find out what happened in the deep past? How can we peer back into the mists oftime and determine how species and traits evolved?
The answers to these questions lie in the DNA record.The steady beat of mutation on the text of DNA has consequences that are vitally important to the
study of evolution. The known rate of mutation enables biologists to make predictions about patterns wemight see in the DNA record. At the fundamental level of DNA, selection affects the relative success ofalternative versions of individual genes. As mutations occur, two or more alternative versions of a genemay exist in a population. The fate of these alternative versions depends upon the conditions of selection.Say there are two versions, A and B; if version A affects survival or reproduction in a superior way toform B, A will be favored. Conversely, if B improves survival or reproduction over A, B will befavored.
There is also a third important possibility, which was not recognized by evolutionary biologists untilthe sequences of genes and proteins started to be revealed. The third possible fate when two versions of agene differ is that the difference may be neutral, of no consequence to fitness. Evolutionary biologistsonce thought that all changes in molecules came about through selection, but the late Motoo Kimura
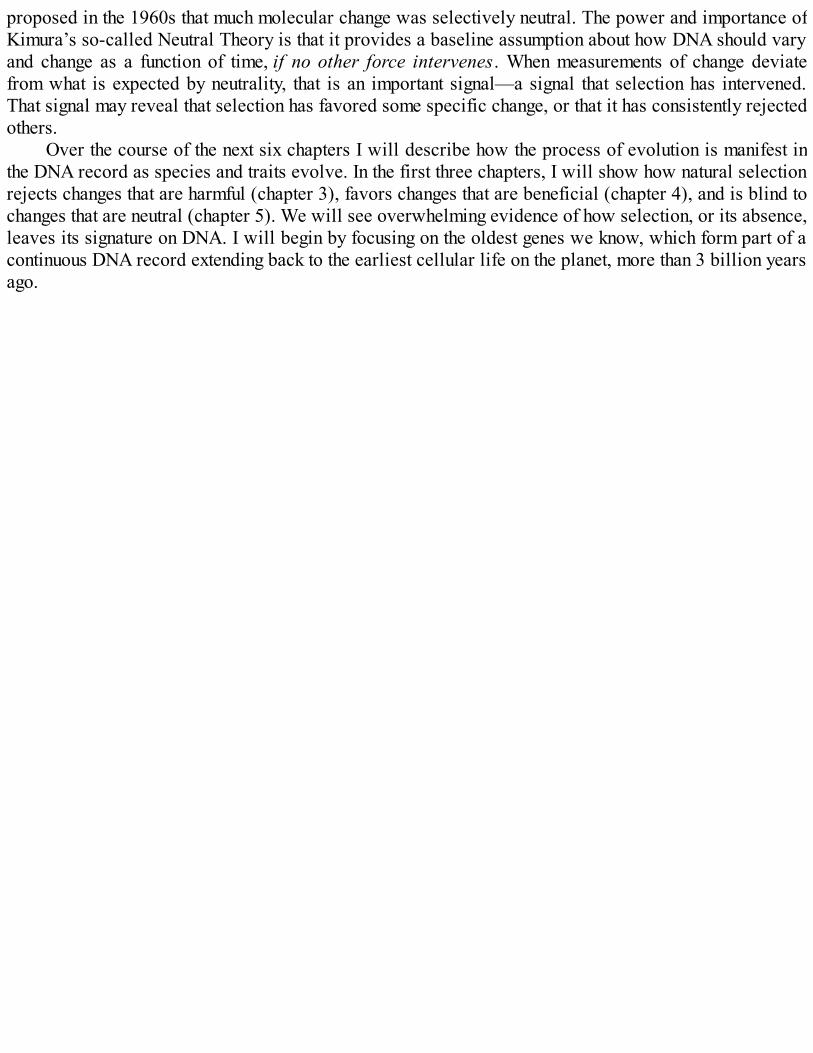
proposed in the 1960s that much molecular change was selectively neutral. The power and importance ofKimura’s so-called Neutral Theory is that it provides a baseline assumption about how DNA should varyand change as a function of time, if no other force intervenes. When measurements of change deviatefrom what is expected by neutrality, that is an important signal—a signal that selection has intervened.That signal may reveal that selection has favored some specific change, or that it has consistently rejectedothers.
Over the course of the next six chapters I will describe how the process of evolution is manifest inthe DNA record as species and traits evolve. In the first three chapters, I will show how natural selectionrejects changes that are harmful (chapter 3), favors changes that are beneficial (chapter 4), and is blind tochanges that are neutral (chapter 5). We will see overwhelming evidence of how selection, or its absence,leaves its signature on DNA. I will begin by focusing on the oldest genes we know, which form part of acontinuous DNA record extending back to the earliest cellular life on the planet, more than 3 billion yearsago.
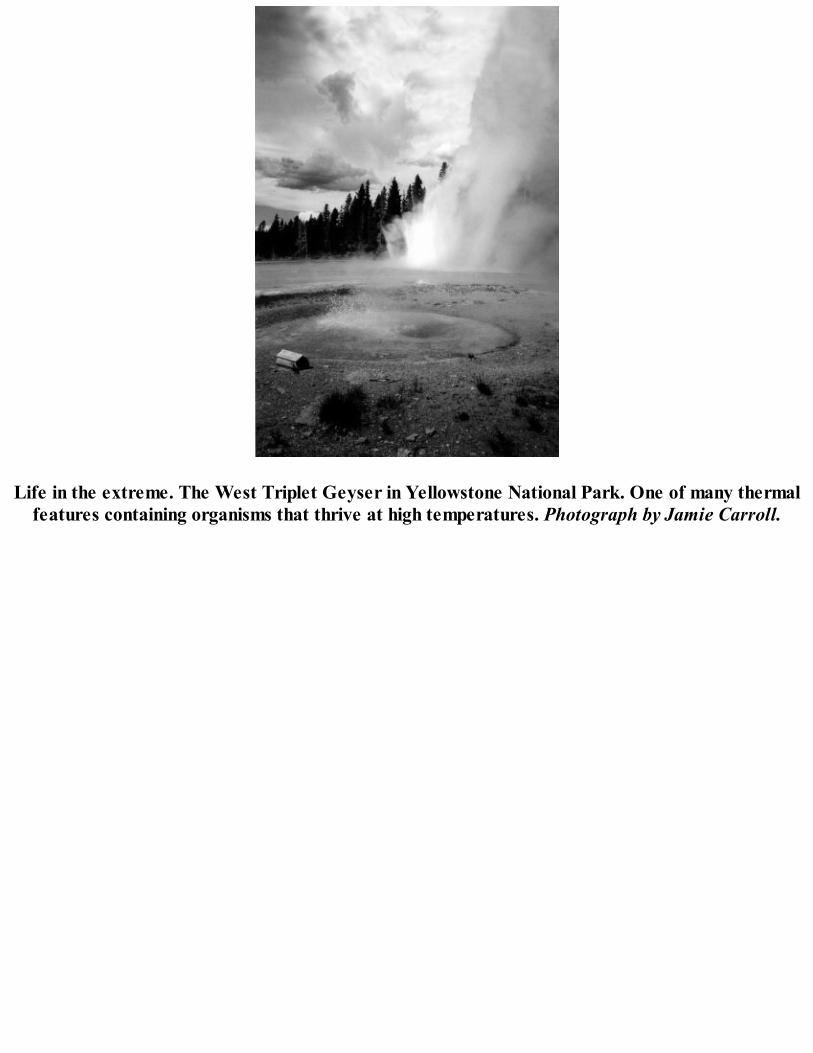
Life in the extreme. The West Triplet Geyser in Yellowstone National Park. One of many thermalfeatures containing organisms that thrive at high temperatures. Photograph by Jamie Carroll.

Chapter 3
Immortal Genes: Running in Place for Eons
To be sure, everything in nature is change but behind the change there is something eternal.—Johann Wolfgang von Goethe
HE WASN’T LOOKING FOR A NEW KINGDOM.Microbiologist Tom Brock and his student Hudson Freeze were prowling around the geysers and hot
springs of Yellowstone National Park one day late in the summer of 1966. They were interested in findingout what kinds of microbes lived around the pools and were drawn to the orange mats that colored theoutflows of several springs.
They collected samples of microbes from Mushroom Spring, a large pool in the Lower Geyser Basinwhose source was exactly 163 degrees F, thought at the time to be the upper temperature limit for life.They were able to isolate a new bacterium from this site, a species that thrived in hot water. In fact, itsoptimal growth temperature was right around that of the hot spring. They dubbed this “thermophilic”creature Thermus aquaticus. Brock also noticed some pink filaments around some even hotter springs,which raised his suspicion that life might occur at even higher temperatures.
The next year, Brock tried a new approach to “fishing” for microbes in the hot springs ofYellowstone. His fishing tackle was simple: he tied one or two microscope slides to a piece of string,dropped it in the pool, and tied the other end to a log or a rock (don’t try this on your own—you will bearrested and quite likely scalded or worse). Days later, upon retrieving the slides, he could see heavygrowth, sometimes so much that the slides had a visible film. Brock was right that organisms were livingat higher temperatures than had previously been thought, but he did not imagine that they were living inboiling water. And they weren’t just tolerating 200 degrees F or more—these organisms were thriving insmoky, acidic, boiling pots such as Sulphur Cauldron, in the Mud Volcano area of the park. Brock’sYellowstone explorations opened eyes and minds to the extraordinary range of life’s adaptability,identified bizarre but important new species such as Sulfolobus and Thermoplasma, and launched thescientific study of what he called “hyperthermophiles,” lovers of superheat.
Brock’s discovery of hyperthermophiles would, in time, lead to three more discoveries withprofound impacts on biology. Brock lumped all of his new species into the classification “bacteria.”Under the microscope, they did appear a lot like ordinary bacteria (figure 3.1). But, a decade later, CarlWoese and George Fox at the University of Illinois discovered that various sulfur-, methane-, and salt-loving species actually formed an entire kingdom unto themselves. They were as different from bacteriaas bacteria are from eukaryotes (the division of life to which we animals belong, as well as plants, fungi,and protists). This new third domain, or division, of life is now referred to as the Archaea.
The second discovery from Brock’s world was a practical one. A heat-stable enzyme that couldcopy DNA at high temperatures was isolated from Thermus aquaticus. This enzyme led to the inventionof a new, efficient, and very fast technique for the study of genes in any species. This technique catalyzeda vast expansion in the amount and diversity of DNA information that could be obtained from nature, aswell as the creation of a multi-hundred-million-dollar market in DNA diagnostics and forensics.
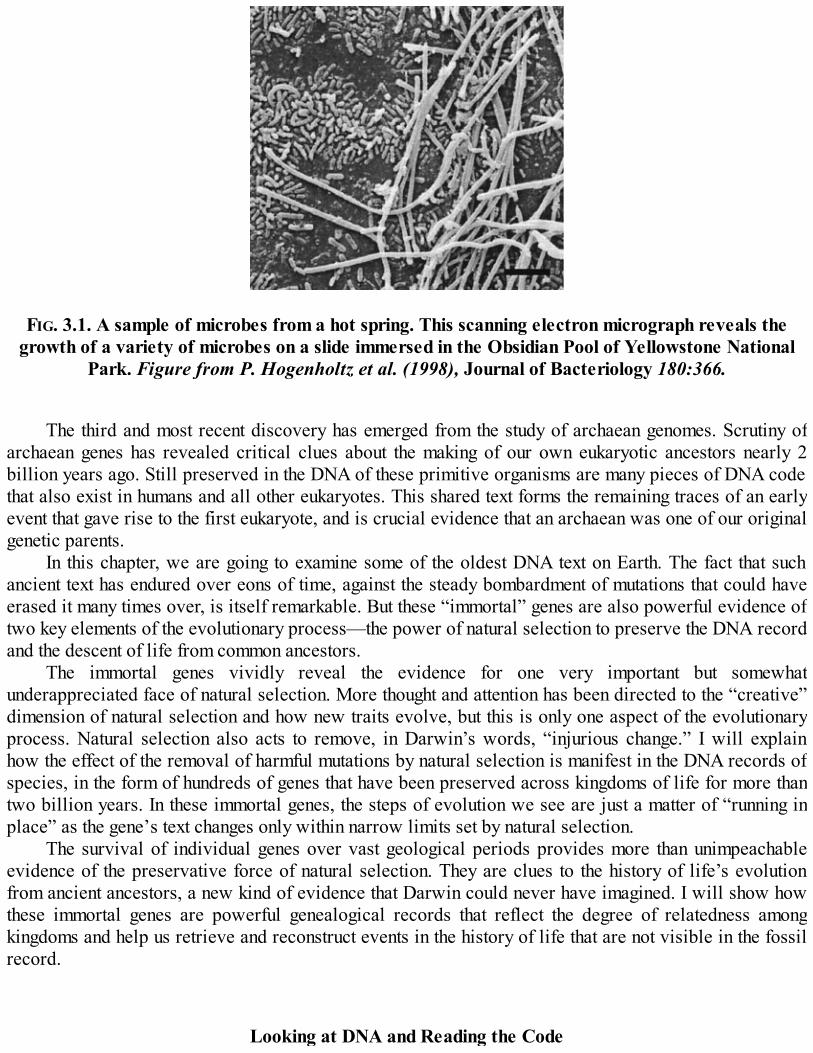
FIG. 3.1. A sample of microbes from a hot spring. This scanning electron micrograph reveals thegrowth of a variety of microbes on a slide immersed in the Obsidian Pool of Yellowstone National
Park. Figure from P. Hogenholtz et al. (1998), Journal of Bacteriology 180:366.
The third and most recent discovery has emerged from the study of archaean genomes. Scrutiny ofarchaean genes has revealed critical clues about the making of our own eukaryotic ancestors nearly 2billion years ago. Still preserved in the DNA of these primitive organisms are many pieces of DNA codethat also exist in humans and all other eukaryotes. This shared text forms the remaining traces of an earlyevent that gave rise to the first eukaryote, and is crucial evidence that an archaean was one of our originalgenetic parents.
In this chapter, we are going to examine some of the oldest DNA text on Earth. The fact that suchancient text has endured over eons of time, against the steady bombardment of mutations that could haveerased it many times over, is itself remarkable. But these “immortal” genes are also powerful evidence oftwo key elements of the evolutionary process—the power of natural selection to preserve the DNA recordand the descent of life from common ancestors.
The immortal genes vividly reveal the evidence for one very important but somewhatunderappreciated face of natural selection. More thought and attention has been directed to the “creative”dimension of natural selection and how new traits evolve, but this is only one aspect of the evolutionaryprocess. Natural selection also acts to remove, in Darwin’s words, “injurious change.” I will explainhow the effect of the removal of harmful mutations by natural selection is manifest in the DNA records ofspecies, in the form of hundreds of genes that have been preserved across kingdoms of life for more thantwo billion years. In these immortal genes, the steps of evolution we see are just a matter of “running inplace” as the gene’s text changes only within narrow limits set by natural selection.
The survival of individual genes over vast geological periods provides more than unimpeachableevidence of the preservative force of natural selection. They are clues to the history of life’s evolutionfrom ancient ancestors, a new kind of evidence that Darwin could never have imagined. I will show howthese immortal genes are powerful genealogical records that reflect the degree of relatedness amongkingdoms and help us retrieve and reconstruct events in the history of life that are not visible in the fossilrecord.
Looking at DNA and Reading the Code
The skyscrapers of DNA sequences that we now own contain a lot of text, about forty thousand volumes,at a million characters each. The records of some species, such as humans, require a whole encyclopediaof about three hundred volumes while others, such as a bacterium, just a three-or four-volume set. Nomatter which volume one looks in, the text at first looks pretty much the same, like this:
ACGGCTATGGGCTACCA AGGGCTACCAACTACCA AAGTTACGGCTAATCGACATAATTGGCTACCAAGACAT AACCTGGCTACCAATTACTATGGACGGCCTACGGCGTCCGCT AATCGACATAACCTTTACTATGGCTACCAAAGTGACATAACCTTT ACTCATAACCTGGCTACCAACCAAGGGCTACCAACTACCA AAATTACTATGGGACATTAATCGACATAACCTTTACTA ACCTGGCTACCAATTACTATGGACGGCCAATCG
etc., for hundreds of pages.How can such a monotonous text composed of just four different characters encode the instructions
for a complex creature? Moreover, how the heck do we read this stuff?To make sense of the language of DNA, we need to learn how to look at genomes and genes and how
to read DNA code. We can then make comparisons between species at many different scales, from veryclose relatives to vastly different life-forms whose lines split off from one another early in life’s history.The clues to evolution emerge from understanding the meaning of the similarities and differences wefind.
In order to decipher the natural history that resides in the DNA record, we have to have a firm graspof the language of DNA, and of how DNA information is decoded in making the working parts of livingorganisms. Don’t be intimidated—you can learn the language of DNA. It has a very small alphabet and avery limited vocabulary, and its rules of grammar are simple. The payoff for learning about the DNA codeis being able to see, and therefore so much better understand, the process of evolution at its mostfundamental level. I understand that new terms can get confusing, so you might want to bookmark thisshort section for future reference.
Here we go.Proteins are the molecules that do all of the work in every organism—from carrying oxygen, to
building tissue, to copying DNA for the next generation. The DNA of each species carries the specificinstructions (in code) necessary for the building of these proteins.
DNA is made of two strands of four distinct bases. These chemical building blocks are representedby the single letters A, C, G, and T. The strands of DNA are held together by strong chemical bondsbetween pairs of bases that lie on opposite strands—A always pairs with T, C always pairs with G—asshown here:
~AGTCAGTC~||||||||
~TCAGTCAG~
so, if we know the sequence of one strand of DNA, we automatically know the sequence of the other
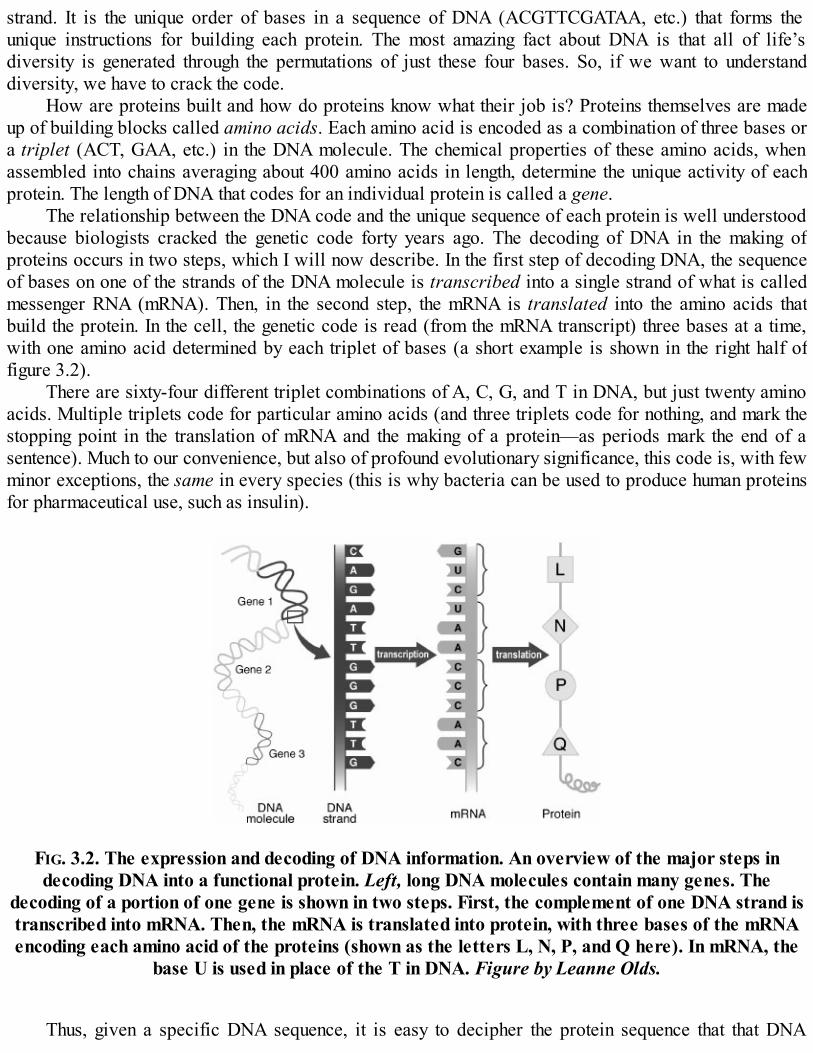
strand. It is the unique order of bases in a sequence of DNA (ACGTTCGATAA, etc.) that forms theunique instructions for building each protein. The most amazing fact about DNA is that all of life’sdiversity is generated through the permutations of just these four bases. So, if we want to understanddiversity, we have to crack the code.
How are proteins built and how do proteins know what their job is? Proteins themselves are madeup of building blocks called amino acids. Each amino acid is encoded as a combination of three bases ora triplet (ACT, GAA, etc.) in the DNA molecule. The chemical properties of these amino acids, whenassembled into chains averaging about 400 amino acids in length, determine the unique activity of eachprotein. The length of DNA that codes for an individual protein is called a gene.
The relationship between the DNA code and the unique sequence of each protein is well understoodbecause biologists cracked the genetic code forty years ago. The decoding of DNA in the making ofproteins occurs in two steps, which I will now describe. In the first step of decoding DNA, the sequenceof bases on one of the strands of the DNA molecule is transcribed into a single strand of what is calledmessenger RNA (mRNA). Then, in the second step, the mRNA is translated into the amino acids thatbuild the protein. In the cell, the genetic code is read (from the mRNA transcript) three bases at a time,with one amino acid determined by each triplet of bases (a short example is shown in the right half offigure 3.2).
There are sixty-four different triplet combinations of A, C, G, and T in DNA, but just twenty aminoacids. Multiple triplets code for particular amino acids (and three triplets code for nothing, and mark thestopping point in the translation of mRNA and the making of a protein—as periods mark the end of asentence). Much to our convenience, but also of profound evolutionary significance, this code is, with fewminor exceptions, the same in every species (this is why bacteria can be used to produce human proteinsfor pharmaceutical use, such as insulin).
FIG. 3.2. The expression and decoding of DNA information. An overview of the major steps indecoding DNA into a functional protein. Left, long DNA molecules contain many genes. The
decoding of a portion of one gene is shown in two steps. First, the complement of one DNA strand istranscribed into mRNA. Then, the mRNA is translated into protein, with three bases of the mRNAencoding each amino acid of the proteins (shown as the letters L, N, P, and Q here). In mRNA, the
base U is used in place of the T in DNA. Figure by Leanne Olds.
Thus, given a specific DNA sequence, it is easy to decipher the protein sequence that that DNA
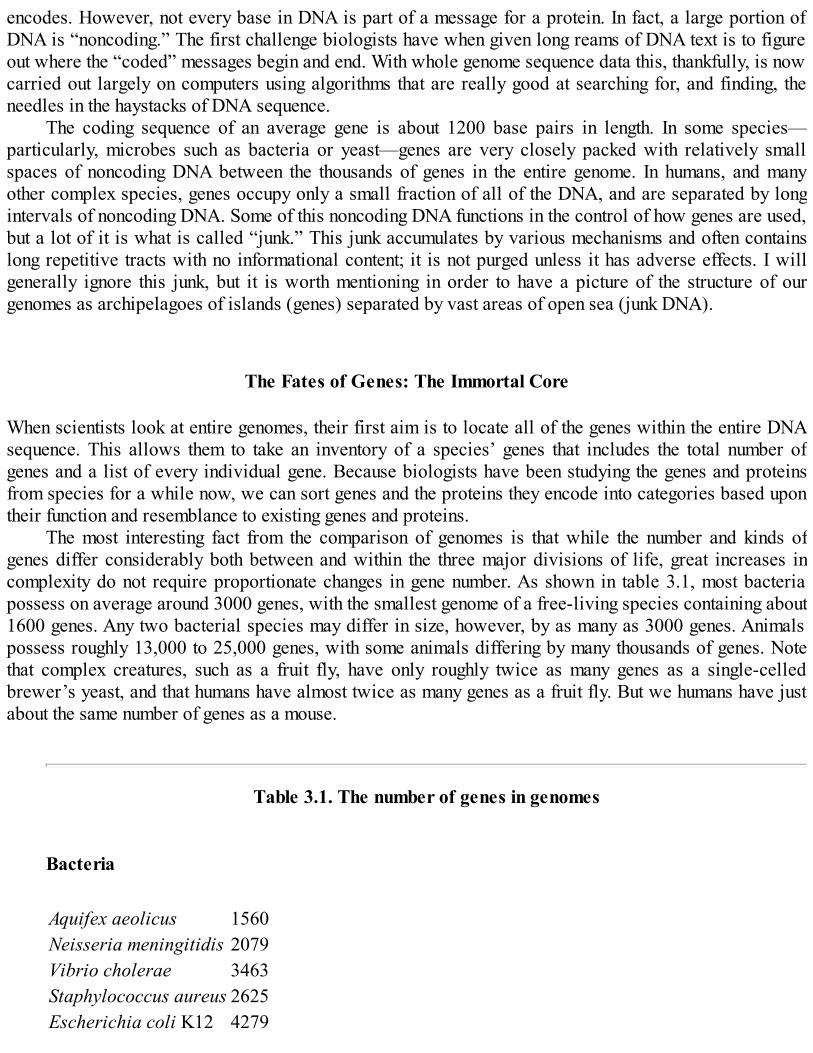
encodes. However, not every base in DNA is part of a message for a protein. In fact, a large portion ofDNA is “noncoding.” The first challenge biologists have when given long reams of DNA text is to figureout where the “coded” messages begin and end. With whole genome sequence data this, thankfully, is nowcarried out largely on computers using algorithms that are really good at searching for, and finding, theneedles in the haystacks of DNA sequence.
The coding sequence of an average gene is about 1200 base pairs in length. In some species—particularly, microbes such as bacteria or yeast—genes are very closely packed with relatively smallspaces of noncoding DNA between the thousands of genes in the entire genome. In humans, and manyother complex species, genes occupy only a small fraction of all of the DNA, and are separated by longintervals of noncoding DNA. Some of this noncoding DNA functions in the control of how genes are used,but a lot of it is what is called “junk.” This junk accumulates by various mechanisms and often containslong repetitive tracts with no informational content; it is not purged unless it has adverse effects. I willgenerally ignore this junk, but it is worth mentioning in order to have a picture of the structure of ourgenomes as archipelagoes of islands (genes) separated by vast areas of open sea (junk DNA).
The Fates of Genes: The Immortal Core
When scientists look at entire genomes, their first aim is to locate all of the genes within the entire DNAsequence. This allows them to take an inventory of a species’ genes that includes the total number ofgenes and a list of every individual gene. Because biologists have been studying the genes and proteinsfrom species for a while now, we can sort genes and the proteins they encode into categories based upontheir function and resemblance to existing genes and proteins.
The most interesting fact from the comparison of genomes is that while the number and kinds ofgenes differ considerably both between and within the three major divisions of life, great increases incomplexity do not require proportionate changes in gene number. As shown in table 3.1, most bacteriapossess on average around 3000 genes, with the smallest genome of a free-living species containing about1600 genes. Any two bacterial species may differ in size, however, by as many as 3000 genes. Animalspossess roughly 13,000 to 25,000 genes, with some animals differing by many thousands of genes. Notethat complex creatures, such as a fruit fly, have only roughly twice as many genes as a single-celledbrewer’s yeast, and that humans have almost twice as many genes as a fruit fly. But we humans have justabout the same number of genes as a mouse.
Table 3.1. The number of genes in genomes
Bacteria
Aquifex aeolicus 1560Neisseria meningitidis 2079Vibrio cholerae 3463Staphylococcus aureus 2625Escherichia coli K12 4279
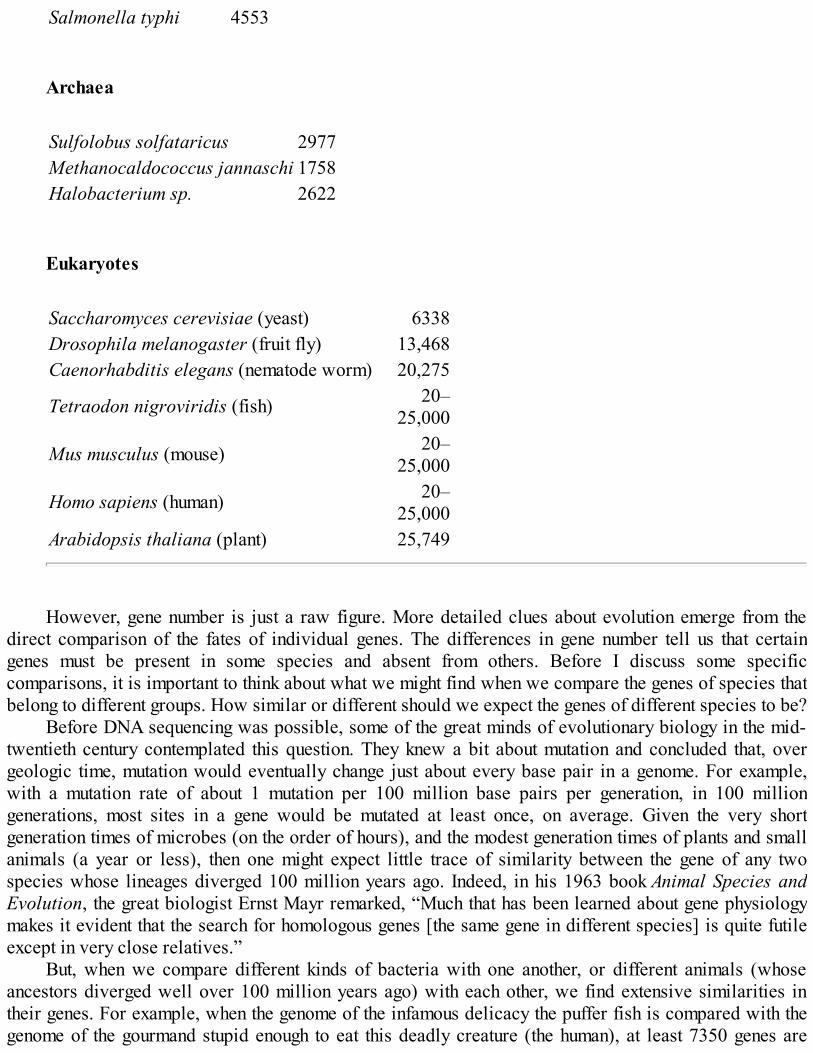
Salmonella typhi 4553
Archaea
Sulfolobus solfataricus 2977Methanocaldococcus jannaschi 1758Halobacterium sp. 2622
Eukaryotes
Saccharomyces cerevisiae (yeast) 6338Drosophila melanogaster (fruit fly) 13,468Caenorhabditis elegans (nematode worm) 20,275
Tetraodon nigroviridis (fish) 20–25,000
Mus musculus (mouse) 20–25,000
Homo sapiens (human) 20–25,000
Arabidopsis thaliana (plant) 25,749
However, gene number is just a raw figure. More detailed clues about evolution emerge from thedirect comparison of the fates of individual genes. The differences in gene number tell us that certaingenes must be present in some species and absent from others. Before I discuss some specificcomparisons, it is important to think about what we might find when we compare the genes of species thatbelong to different groups. How similar or different should we expect the genes of different species to be?
Before DNA sequencing was possible, some of the great minds of evolutionary biology in the mid-twentieth century contemplated this question. They knew a bit about mutation and concluded that, overgeologic time, mutation would eventually change just about every base pair in a genome. For example,with a mutation rate of about 1 mutation per 100 million base pairs per generation, in 100 milliongenerations, most sites in a gene would be mutated at least once, on average. Given the very shortgeneration times of microbes (on the order of hours), and the modest generation times of plants and smallanimals (a year or less), then one might expect little trace of similarity between the gene of any twospecies whose lineages diverged 100 million years ago. Indeed, in his 1963 book Animal Species andEvolution, the great biologist Ernst Mayr remarked, “Much that has been learned about gene physiologymakes it evident that the search for homologous genes [the same gene in different species] is quite futileexcept in very close relatives.”
But, when we compare different kinds of bacteria with one another, or different animals (whoseancestors diverged well over 100 million years ago) with each other, we find extensive similarities intheir genes. For example, when the genome of the infamous delicacy the puffer fish is compared with thegenome of the gourmand stupid enough to eat this deadly creature (the human), at least 7350 genes are
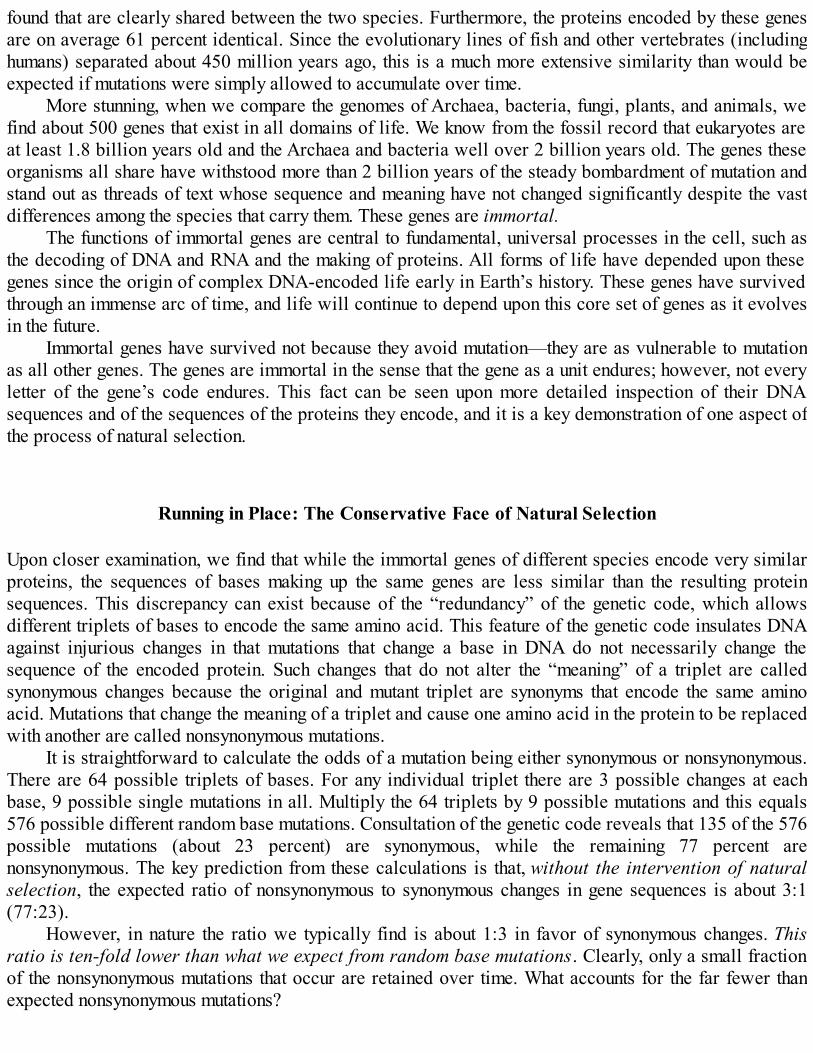
found that are clearly shared between the two species. Furthermore, the proteins encoded by these genesare on average 61 percent identical. Since the evolutionary lines of fish and other vertebrates (includinghumans) separated about 450 million years ago, this is a much more extensive similarity than would beexpected if mutations were simply allowed to accumulate over time.
More stunning, when we compare the genomes of Archaea, bacteria, fungi, plants, and animals, wefind about 500 genes that exist in all domains of life. We know from the fossil record that eukaryotes areat least 1.8 billion years old and the Archaea and bacteria well over 2 billion years old. The genes theseorganisms all share have withstood more than 2 billion years of the steady bombardment of mutation andstand out as threads of text whose sequence and meaning have not changed significantly despite the vastdifferences among the species that carry them. These genes are immortal.
The functions of immortal genes are central to fundamental, universal processes in the cell, such asthe decoding of DNA and RNA and the making of proteins. All forms of life have depended upon thesegenes since the origin of complex DNA-encoded life early in Earth’s history. These genes have survivedthrough an immense arc of time, and life will continue to depend upon this core set of genes as it evolvesin the future.
Immortal genes have survived not because they avoid mutation—they are as vulnerable to mutationas all other genes. The genes are immortal in the sense that the gene as a unit endures; however, not everyletter of the gene’s code endures. This fact can be seen upon more detailed inspection of their DNAsequences and of the sequences of the proteins they encode, and it is a key demonstration of one aspect ofthe process of natural selection.
Running in Place: The Conservative Face of Natural Selection
Upon closer examination, we find that while the immortal genes of different species encode very similarproteins, the sequences of bases making up the same genes are less similar than the resulting proteinsequences. This discrepancy can exist because of the “redundancy” of the genetic code, which allowsdifferent triplets of bases to encode the same amino acid. This feature of the genetic code insulates DNAagainst injurious changes in that mutations that change a base in DNA do not necessarily change thesequence of the encoded protein. Such changes that do not alter the “meaning” of a triplet are calledsynonymous changes because the original and mutant triplet are synonyms that encode the same aminoacid. Mutations that change the meaning of a triplet and cause one amino acid in the protein to be replacedwith another are called nonsynonymous mutations.
It is straightforward to calculate the odds of a mutation being either synonymous or nonsynonymous.There are 64 possible triplets of bases. For any individual triplet there are 3 possible changes at eachbase, 9 possible single mutations in all. Multiply the 64 triplets by 9 possible mutations and this equals576 possible different random base mutations. Consultation of the genetic code reveals that 135 of the 576possible mutations (about 23 percent) are synonymous, while the remaining 77 percent arenonsynonymous. The key prediction from these calculations is that, without the intervention of naturalselection, the expected ratio of nonsynonymous to synonymous changes in gene sequences is about 3:1(77:23).
However, in nature the ratio we typically find is about 1:3 in favor of synonymous changes. Thisratio is ten-fold lower than what we expect from random base mutations. Clearly, only a small fractionof the nonsynonymous mutations that occur are retained over time. What accounts for the far fewer thanexpected nonsynonymous mutations?
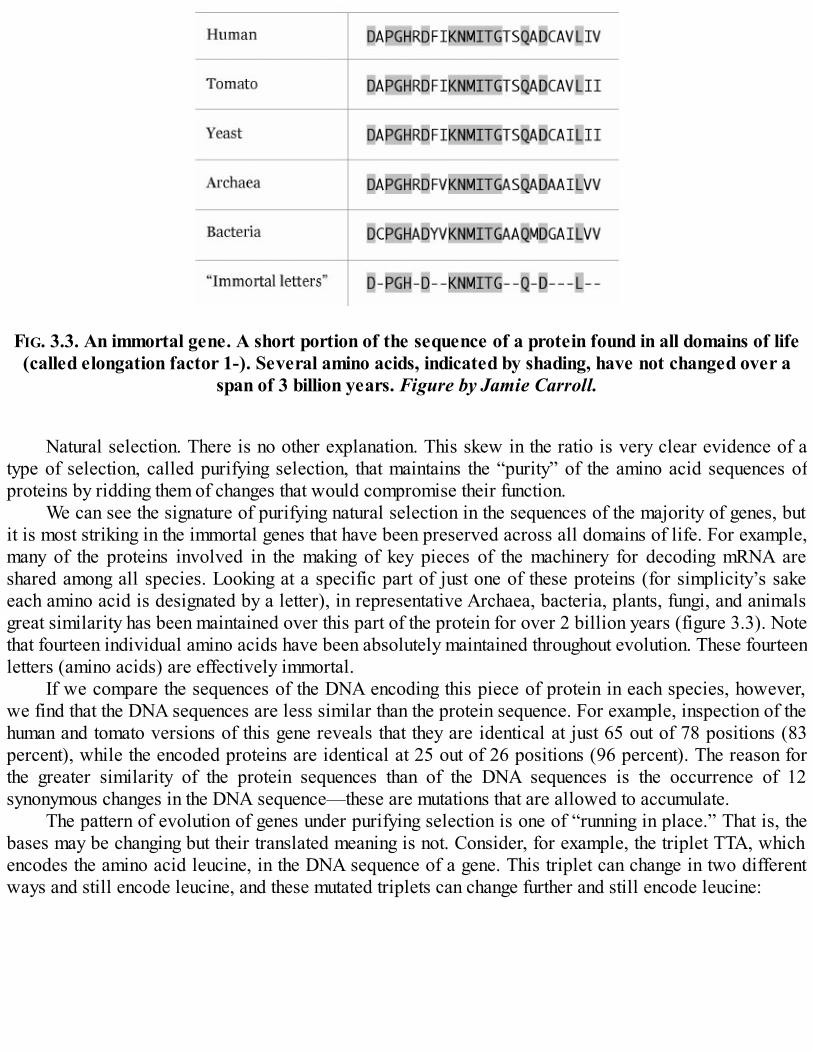
FIG. 3.3. An immortal gene. A short portion of the sequence of a protein found in all domains of life(called elongation factor 1-). Several amino acids, indicated by shading, have not changed over a
span of 3 billion years. Figure by Jamie Carroll.
Natural selection. There is no other explanation. This skew in the ratio is very clear evidence of atype of selection, called purifying selection, that maintains the “purity” of the amino acid sequences ofproteins by ridding them of changes that would compromise their function.
We can see the signature of purifying natural selection in the sequences of the majority of genes, butit is most striking in the immortal genes that have been preserved across all domains of life. For example,many of the proteins involved in the making of key pieces of the machinery for decoding mRNA areshared among all species. Looking at a specific part of just one of these proteins (for simplicity’s sakeeach amino acid is designated by a letter), in representative Archaea, bacteria, plants, fungi, and animalsgreat similarity has been maintained over this part of the protein for over 2 billion years (figure 3.3). Notethat fourteen individual amino acids have been absolutely maintained throughout evolution. These fourteenletters (amino acids) are effectively immortal.
If we compare the sequences of the DNA encoding this piece of protein in each species, however,we find that the DNA sequences are less similar than the protein sequence. For example, inspection of thehuman and tomato versions of this gene reveals that they are identical at just 65 out of 78 positions (83percent), while the encoded proteins are identical at 25 out of 26 positions (96 percent). The reason forthe greater similarity of the protein sequences than of the DNA sequences is the occurrence of 12synonymous changes in the DNA sequence—these are mutations that are allowed to accumulate.
The pattern of evolution of genes under purifying selection is one of “running in place.” That is, thebases may be changing but their translated meaning is not. Consider, for example, the triplet TTA, whichencodes the amino acid leucine, in the DNA sequence of a gene. This triplet can change in two differentways and still encode leucine, and these mutated triplets can change further and still encode leucine:

Most amino acids are encoded by at least two different triplets, and several amino acids areencoded by three or more (or, in the case of leucine, six). So triplets in DNA sequences can “run” (changefrom sequence to sequence) but selection usually sees to it that they do not run so far as to change theprotein’s sequence and function.
Selection prevents protein sequences from changing by favoring one particular sequence overvariants in which one or more letters of the sequence is altered. If a variant works less well than otherforms of proteins, even if that is just 0.001 percent less well, selection over time will, by the algebra wesaw in the last chapter, purge the variant from a large population. This purging is so efficient thatindividual letters in a protein’s text can remain unchanged among virtually all species. Realize that animmortal letter in a protein sequence has experienced mutation again and again, in uncountablenumbers of individuals, in millions of species, over billions of years, but that all of these mutationshave been purged by selection over and over again.
From the alignment of protein sequences in figure 3.3, we can see that constraints exist on manyamino acids in this protein in that only a few positions are allowed to differ between species. Many moresynonymous mutations are allowed than are nonsynonymous mutations. I have shown this relationship forjust one gene, but I could have selected thousands more genes, either from the 500 or so immortal genesor the majority of other genes in any group of species. This pattern of the strong preservation of theprotein sequence at most sites, with the synonymous evolution of the corresponding DNA sequence, anddiversity limited to a few sites in the protein, is the predominant pattern of evolution in the DNA record.
DNA sequences that encode the same protein sequence but that are substantially different areunmistakable evidence of natural selection allowing mutations that do not change protein function, whileacting to eliminate mutations that would. The preservation of genes among different species over vastperiods of time is thus definitive proof of one face of natural selection—its power, in Darwin’s words, to“rigidly destroy injurious variations.”
But the evolving genomes of species provide more than signatures of natural selection. In the DNArecord, there is more information than just the history of a particular gene—there is information about thespecies that carries it, and about all of the preceding species that also carried it, right back through eonsof life’s history. Because of the power of natural selection to preserve information that would otherwisebe erased in time, genomes contain a record of the history of life. The new wealth of data from genomesoffers unique insights into the deep past that could not be deciphered from any other source. I will closethis chapter with the story of the evolution of the domain we belong to (eukaryotes), and the uniquecontributions that archaea and bacteria appear to have made to our ancestry.
The Making of Eukaryotes: A Marriage of Two Very Different Parents?
The time will come, I believe, though I shall not live to see it, when we shall have fairly true
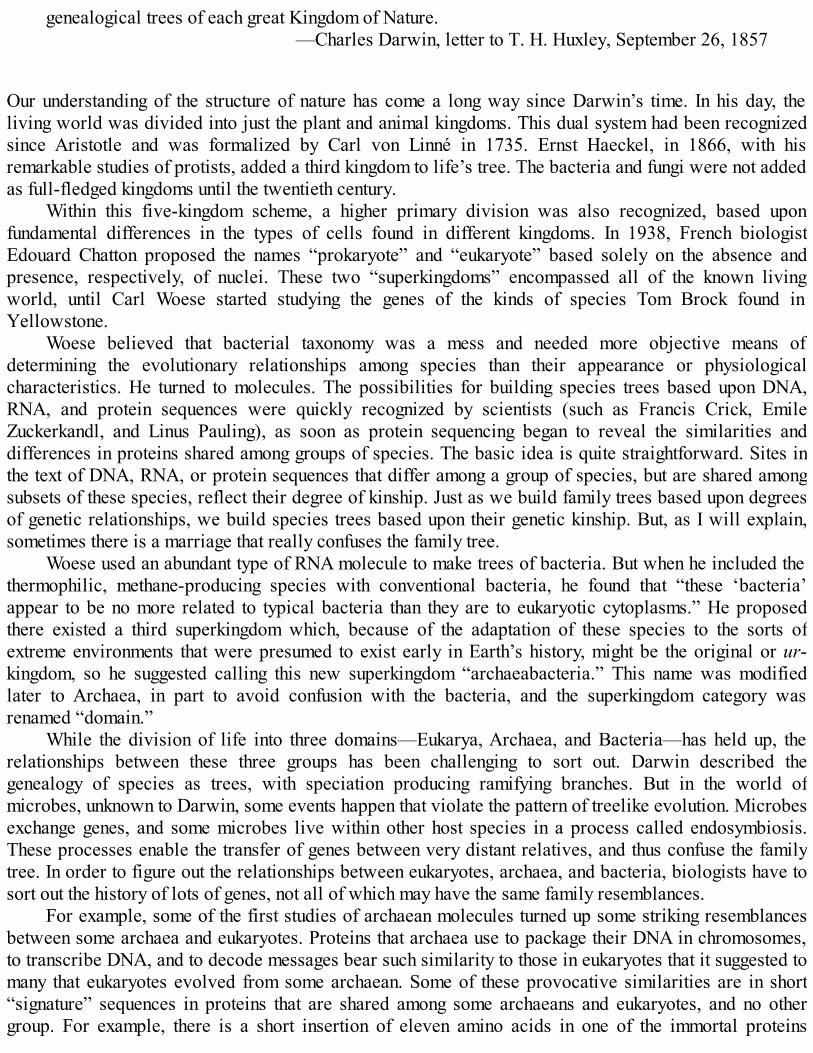
genealogical trees of each great Kingdom of Nature.—Charles Darwin, letter to T. H. Huxley, September 26, 1857
Our understanding of the structure of nature has come a long way since Darwin’s time. In his day, theliving world was divided into just the plant and animal kingdoms. This dual system had been recognizedsince Aristotle and was formalized by Carl von Linné in 1735. Ernst Haeckel, in 1866, with hisremarkable studies of protists, added a third kingdom to life’s tree. The bacteria and fungi were not addedas full-fledged kingdoms until the twentieth century.
Within this five-kingdom scheme, a higher primary division was also recognized, based uponfundamental differences in the types of cells found in different kingdoms. In 1938, French biologistEdouard Chatton proposed the names “prokaryote” and “eukaryote” based solely on the absence andpresence, respectively, of nuclei. These two “superkingdoms” encompassed all of the known livingworld, until Carl Woese started studying the genes of the kinds of species Tom Brock found inYellowstone.
Woese believed that bacterial taxonomy was a mess and needed more objective means ofdetermining the evolutionary relationships among species than their appearance or physiologicalcharacteristics. He turned to molecules. The possibilities for building species trees based upon DNA,RNA, and protein sequences were quickly recognized by scientists (such as Francis Crick, EmileZuckerkandl, and Linus Pauling), as soon as protein sequencing began to reveal the similarities anddifferences in proteins shared among groups of species. The basic idea is quite straightforward. Sites inthe text of DNA, RNA, or protein sequences that differ among a group of species, but are shared amongsubsets of these species, reflect their degree of kinship. Just as we build family trees based upon degreesof genetic relationships, we build species trees based upon their genetic kinship. But, as I will explain,sometimes there is a marriage that really confuses the family tree.
Woese used an abundant type of RNA molecule to make trees of bacteria. But when he included thethermophilic, methane-producing species with conventional bacteria, he found that “these ‘bacteria’appear to be no more related to typical bacteria than they are to eukaryotic cytoplasms.” He proposedthere existed a third superkingdom which, because of the adaptation of these species to the sorts ofextreme environments that were presumed to exist early in Earth’s history, might be the original or ur-kingdom, so he suggested calling this new superkingdom “archaeabacteria.” This name was modifiedlater to Archaea, in part to avoid confusion with the bacteria, and the superkingdom category wasrenamed “domain.”
While the division of life into three domains—Eukarya, Archaea, and Bacteria—has held up, therelationships between these three groups has been challenging to sort out. Darwin described thegenealogy of species as trees, with speciation producing ramifying branches. But in the world ofmicrobes, unknown to Darwin, some events happen that violate the pattern of treelike evolution. Microbesexchange genes, and some microbes live within other host species in a process called endosymbiosis.These processes enable the transfer of genes between very distant relatives, and thus confuse the familytree. In order to figure out the relationships between eukaryotes, archaea, and bacteria, biologists have tosort out the history of lots of genes, not all of which may have the same family resemblances.
For example, some of the first studies of archaean molecules turned up some striking resemblancesbetween some archaea and eukaryotes. Proteins that archaea use to package their DNA in chromosomes,to transcribe DNA, and to decode messages bear such similarity to those in eukaryotes that it suggested tomany that eukaryotes evolved from some archaean. Some of these provocative similarities are in short“signature” sequences in proteins that are shared among some archaeans and eukaryotes, and no othergroup. For example, there is a short insertion of eleven amino acids in one of the immortal proteins
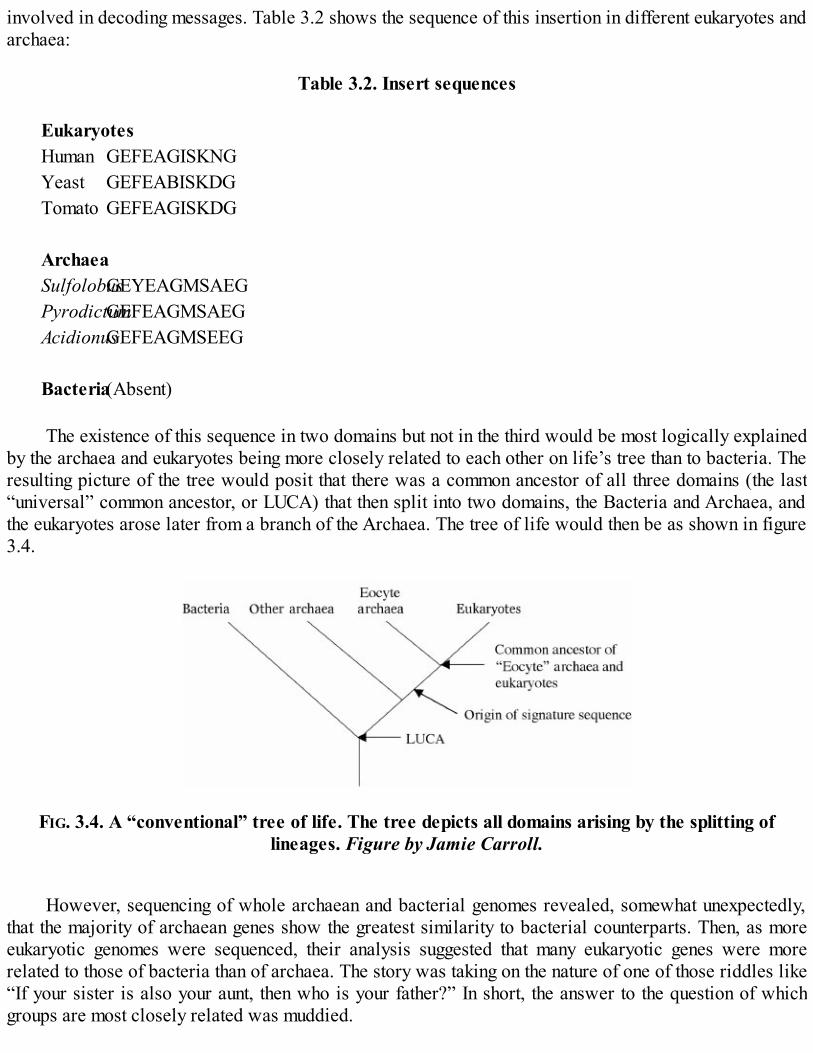
involved in decoding messages. Table 3.2 shows the sequence of this insertion in different eukaryotes andarchaea:
Table 3.2. Insert sequences
Eukaryotes Human GEFEAGISKNGYeast GEFEABISKDGTomato GEFEAGISKDG
Archaea SulfolobusGEYEAGMSAEGPyrodictumGEFEAGMSAEGAcidionusGEFEAGMSEEG
Bacteria(Absent)
The existence of this sequence in two domains but not in the third would be most logically explained
by the archaea and eukaryotes being more closely related to each other on life’s tree than to bacteria. Theresulting picture of the tree would posit that there was a common ancestor of all three domains (the last“universal” common ancestor, or LUCA) that then split into two domains, the Bacteria and Archaea, andthe eukaryotes arose later from a branch of the Archaea. The tree of life would then be as shown in figure3.4.
FIG. 3.4. A “conventional” tree of life. The tree depicts all domains arising by the splitting oflineages. Figure by Jamie Carroll.
However, sequencing of whole archaean and bacterial genomes revealed, somewhat unexpectedly,that the majority of archaean genes show the greatest similarity to bacterial counterparts. Then, as moreeukaryotic genomes were sequenced, their analysis suggested that many eukaryotic genes were morerelated to those of bacteria than of archaea. The story was taking on the nature of one of those riddles like“If your sister is also your aunt, then who is your father?” In short, the answer to the question of whichgroups are most closely related was muddied.
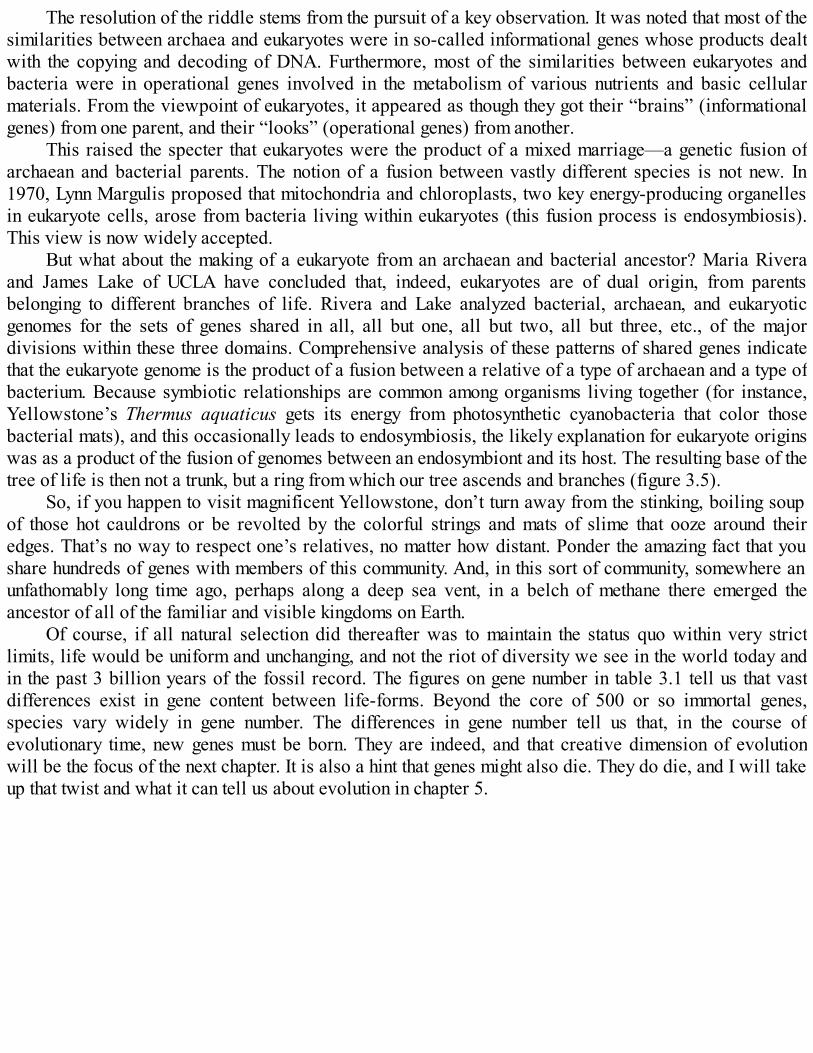
The resolution of the riddle stems from the pursuit of a key observation. It was noted that most of thesimilarities between archaea and eukaryotes were in so-called informational genes whose products dealtwith the copying and decoding of DNA. Furthermore, most of the similarities between eukaryotes andbacteria were in operational genes involved in the metabolism of various nutrients and basic cellularmaterials. From the viewpoint of eukaryotes, it appeared as though they got their “brains” (informationalgenes) from one parent, and their “looks” (operational genes) from another.
This raised the specter that eukaryotes were the product of a mixed marriage—a genetic fusion ofarchaean and bacterial parents. The notion of a fusion between vastly different species is not new. In1970, Lynn Margulis proposed that mitochondria and chloroplasts, two key energy-producing organellesin eukaryote cells, arose from bacteria living within eukaryotes (this fusion process is endosymbiosis).This view is now widely accepted.
But what about the making of a eukaryote from an archaean and bacterial ancestor? Maria Riveraand James Lake of UCLA have concluded that, indeed, eukaryotes are of dual origin, from parentsbelonging to different branches of life. Rivera and Lake analyzed bacterial, archaean, and eukaryoticgenomes for the sets of genes shared in all, all but one, all but two, all but three, etc., of the majordivisions within these three domains. Comprehensive analysis of these patterns of shared genes indicatethat the eukaryote genome is the product of a fusion between a relative of a type of archaean and a type ofbacterium. Because symbiotic relationships are common among organisms living together (for instance,Yellowstone’s Thermus aquaticus gets its energy from photosynthetic cyanobacteria that color thosebacterial mats), and this occasionally leads to endosymbiosis, the likely explanation for eukaryote originswas as a product of the fusion of genomes between an endosymbiont and its host. The resulting base of thetree of life is then not a trunk, but a ring from which our tree ascends and branches (figure 3.5).
So, if you happen to visit magnificent Yellowstone, don’t turn away from the stinking, boiling soupof those hot cauldrons or be revolted by the colorful strings and mats of slime that ooze around theiredges. That’s no way to respect one’s relatives, no matter how distant. Ponder the amazing fact that youshare hundreds of genes with members of this community. And, in this sort of community, somewhere anunfathomably long time ago, perhaps along a deep sea vent, in a belch of methane there emerged theancestor of all of the familiar and visible kingdoms on Earth.
Of course, if all natural selection did thereafter was to maintain the status quo within very strictlimits, life would be uniform and unchanging, and not the riot of diversity we see in the world today andin the past 3 billion years of the fossil record. The figures on gene number in table 3.1 tell us that vastdifferences exist in gene content between life-forms. Beyond the core of 500 or so immortal genes,species vary widely in gene number. The differences in gene number tell us that, in the course ofevolutionary time, new genes must be born. They are indeed, and that creative dimension of evolutionwill be the focus of the next chapter. It is also a hint that genes might also die. They do die, and I will takeup that twist and what it can tell us about evolution in chapter 5.
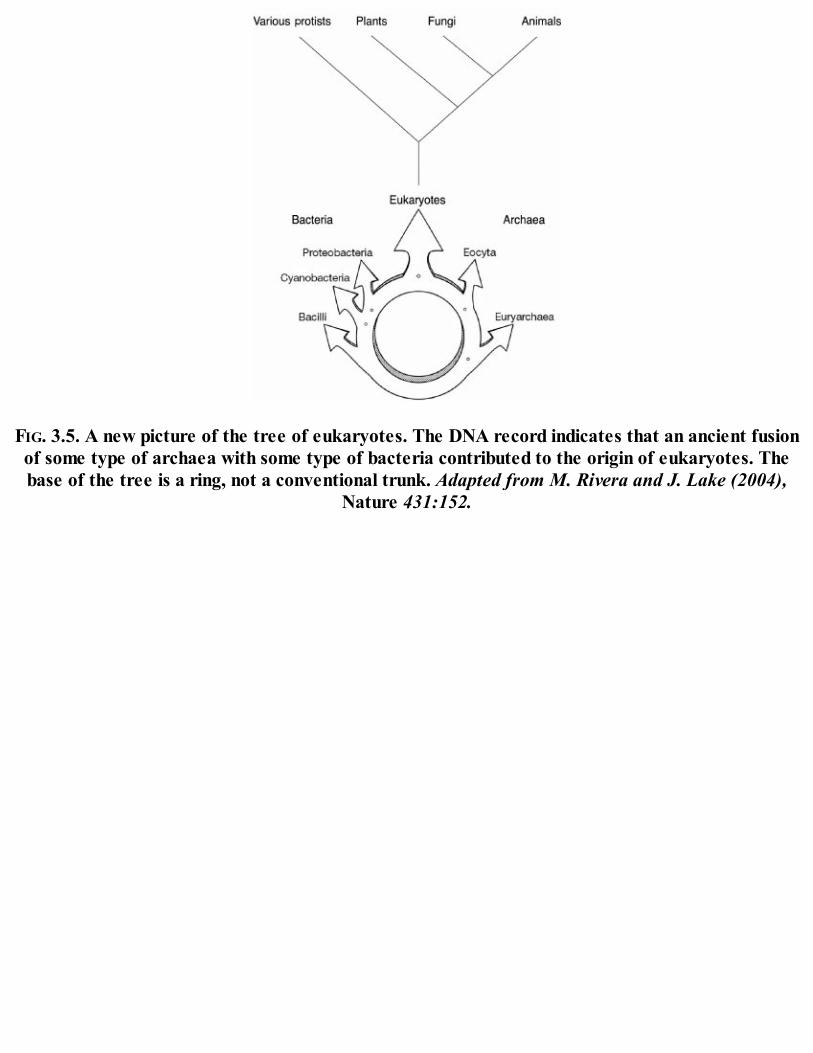
FIG. 3.5. A new picture of the tree of eukaryotes. The DNA record indicates that an ancient fusionof some type of archaea with some type of bacteria contributed to the origin of eukaryotes. Thebase of the tree is a ring, not a conventional trunk. Adapted from M. Rivera and J. Lake (2004),
Nature 431:152.

Colobus monkey in Kibale Forest, Uganda. This monkey can see the more nutritious leaves anddigest them because of two key evolutionary innovations, full color vision and a ruminating stomach.
Photograph by Cagan Sekercioglu.
Chapter 4
Making the New from the Old
Preserve the old, but know the new.—Chinese proverb
IT IS BREAKFAST TIME IN KIBALE FOREST.High above the forest floor, a troop of magnificently painted black and white colobus monkeys hurl
their way through the canopy toward a fresh meal. Surrounded by the dense foliage of this Ugandan rainforest, it would seem that the menu choices are limitless. But the colobus pass by the abundant greeneryand set their eyes on plants bearing reddish leaves. The only monkey that lacks thumbs (their name comesfrom the Greek kolobus, meaning “mutilated” or “docked”), the colobus pull the branches bearing thetender young leaves to their mouths with their four agile, long fingers.
Lower down, nearer to the forest floor, a few of the five hundred resident chimpanzees are noisilymaking their way to some Natal fig trees. They grab a few leaves for chewing, but it is the ripe yellowand red fruits they are after. Eschewing the immature green fruits, the chimps pluck a few choice samplesand find a comfy perch nearby.
The colobus monkeys and the chimpanzees are selecting their breakfasts using a sense thatnonprimate mammals lack—full color vision. All apes and Old World (African and Asian) monkeys havetrichromatic vision, which allows them to see across the visible spectrum from blue to green to red. Mostother mammals are dichromats—they can see blue and yellow hues but cannot perceive or distinguish redfrom green. Trichromatic vision is important because it is the younger leaves that are most nutritious andtender, and easier to digest. In the tropics, over half of all plant species bear young leaves that are red.This color difference, invisible to other browsers, is exploited by primates to harvest the more nutritiousleaves in the forest.
The colobus monkey will digest his leaf breakfast using a capability that neither the chimp nor otherapes have, and that only his very closest monkey relatives possess. The colobus is a ruminant. He canspecialize on a diet of leaves because he has an unusually large stomach with multiple chambers. A thirty-pound adult will consume four to six pounds of leaves a day, which gives him quite a pronouncedpotbelly when he sits and rests. Bacteria in the colobus’s gut help to digest the large bolus of leaves as ittravels slowly through his digestive system, and unique enzymes break down key nutrients that arereleased from the bacteria.
The visual and digestive systems of these primates raise one of the greatest questions in biology:How do new capabilities arise? In this chapter, we are going to explore the ways through which speciesacquire new abilities and modify existing talents. The main message of the chapter will be about how newfunctions and genes are made from “old” genes. I will explain how the accidental, chance duplication ofgenes provides spare genetic parts for the evolution of new functions, and how both new and old parts arefine-tuned to species lifestyles.
I could have picked many different kinds of examples of the invention and fine-tuning of speciescapabilities. However, I am going to focus almost entirely on the origin and evolution of color vision, for
several very important reason. First, the utility of this sense to its owners is obvious. Second, animals thatlive in different habitats (ocean, savannah, forest, caves, underground, etc.) have visual systems that areamazingly well adapted to life in these habitats. Third, we understand the biology and physics of colorvision very well, so that we understand the large and small differences in species abilities and in thecolors that they see. We have learned that there is a wide world of color—the ultraviolet—that humanscannot see, but that birds, insects, and many other animals use to find food, mates, and one another.Fourth, the genes underlying color vision and its evolution have been studied perhaps more intensely thanthose affecting any other trait. Together, the combination of these elements has produced the deepest bodyof knowledge linking differences in specific genes to differences in ecology and to the evolution ofspecies.
The body of new knowledge I will discuss in this chapter provides concrete, direct evidence ofthree elements of the evolutionary process—natural selection, sexual selection, and the descent of specieswith modification. This trifecta comes from tracing the steps of evolution in DNA. In order to see thesteps of evolution, we will identify important differences among particular species, determine when thesedifferences arose, and decipher how specific changes at the DNA level relate to specific abilities innature. We will track two kinds of information in DNA. First, in order to know when and in what speciesevents occurred, we will track newly discovered, unique landmarks in DNA that give us a clear picture ofspecies relationships. And second, we will scrutinize the DNA code of genes that determine color vision.The signature of natural selection is written in the code of these genes.
Journalist Rex Dalton, remarking on the world that birds see but which is invisible to us, wrote, “Ifyou want to get inside an animal’s mind, it helps to see the world through its eyes.” I will begin byexplaining how animals see colors, and then we’ll watch evolution unfold through those very eyes.
Seeing the Rainbow
Humans’ vision of the natural world is unique. We see the colors and hues we do because of the fine-tuning of sets of molecules that detect light in the cells of our retinas, and the wiring of these cells to ourbrains. Other animals have different sets of molecules and/or they are tuned to detect different parts of therainbow. In order to understand what we or other animals see, we have to know about light and color, themolecules that detect light, and the cells in the eye that gather color images.
Our eyes are very sensitive to what we anthropocentrically call visible light, which is a narrowband of the entire spectrum of electromagnetic radiation. White light is a mixture of the colors of thevisible spectrum that ranges from violet to blue, green, yellow, orange, and red. These colors havedifferent wavelengths ranging from about 400 nanometers (nm) (violet) to about 700 nm (red) (figure 4.1).The colors of objects are due to the wavelengths of light that are absorbed or reflected, and this dependsupon their molecular composition. Grass is green, for example, because it absorbs all wavelengths oflight except green; the green light, whose wavelength is about 520 nm, is reflected. The sky appears blueto us because the shorter wavelengths of sunlight, most of which are blue, are scattered by the atmosphere.The remaining light appears yellowish because this is the color of white light minus the blue. Sunsetsappear orange because when the sun nears the horizon, light travels a longer distance through theatmosphere before it reaches our eyes, and more of the blue light is scattered, leaving the orange color.Sunlight also contains shorter wavelengths of light that we cannot see, such as ultraviolet radiation that isscattered by the ozone in the atmosphere. That which still gets through and is absorbed by our skin causessunburns in pale folks like me, tanning in those more fortunate. Longer wavelength light such as the heatproduced by fires, is infrared radiation. Again, this can’t be seen by the naked eye, but it can with the aid
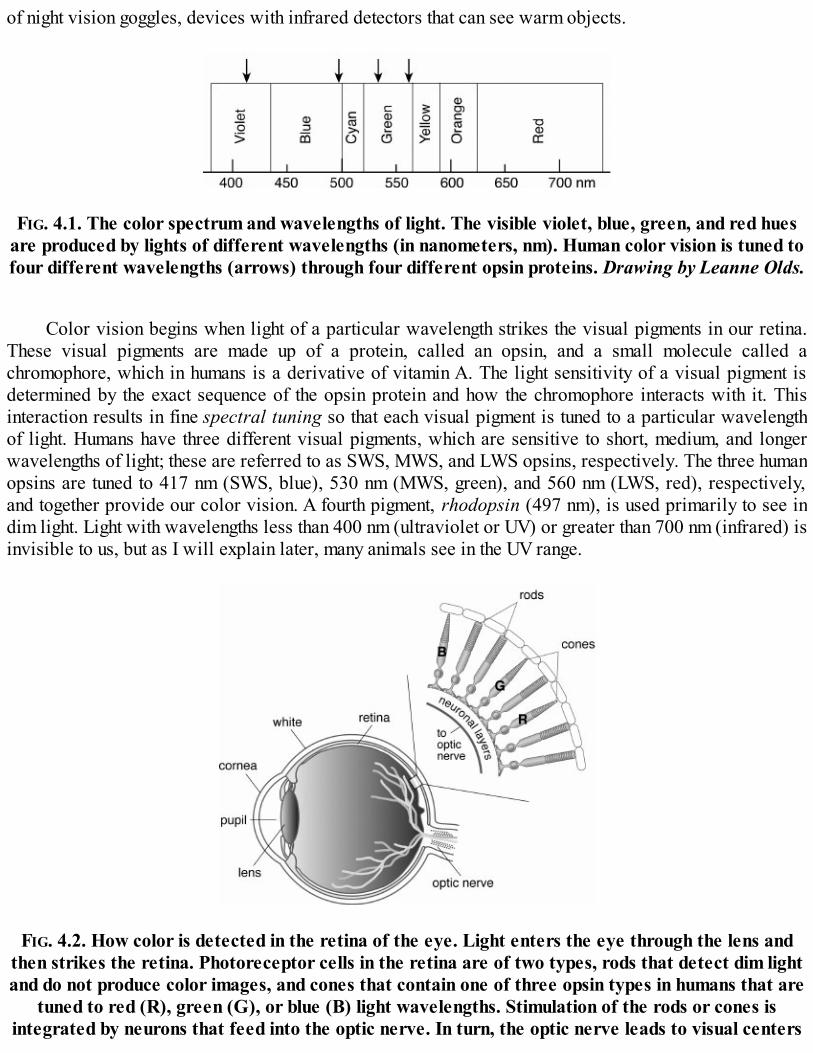
of night vision goggles, devices with infrared detectors that can see warm objects.
FIG. 4.1. The color spectrum and wavelengths of light. The visible violet, blue, green, and red huesare produced by lights of different wavelengths (in nanometers, nm). Human color vision is tuned tofour different wavelengths (arrows) through four different opsin proteins. Drawing by Leanne Olds.
Color vision begins when light of a particular wavelength strikes the visual pigments in our retina.These visual pigments are made up of a protein, called an opsin, and a small molecule called achromophore, which in humans is a derivative of vitamin A. The light sensitivity of a visual pigment isdetermined by the exact sequence of the opsin protein and how the chromophore interacts with it. Thisinteraction results in fine spectral tuning so that each visual pigment is tuned to a particular wavelengthof light. Humans have three different visual pigments, which are sensitive to short, medium, and longerwavelengths of light; these are referred to as SWS, MWS, and LWS opsins, respectively. The three humanopsins are tuned to 417 nm (SWS, blue), 530 nm (MWS, green), and 560 nm (LWS, red), respectively,and together provide our color vision. A fourth pigment, rhodopsin (497 nm), is used primarily to see indim light. Light with wavelengths less than 400 nm (ultraviolet or UV) or greater than 700 nm (infrared) isinvisible to us, but as I will explain later, many animals see in the UV range.
FIG. 4.2. How color is detected in the retina of the eye. Light enters the eye through the lens andthen strikes the retina. Photoreceptor cells in the retina are of two types, rods that detect dim lightand do not produce color images, and cones that contain one of three opsin types in humans that are
tuned to red (R), green (G), or blue (B) light wavelengths. Stimulation of the rods or cones isintegrated by neurons that feed into the optic nerve. In turn, the optic nerve leads to visual centers
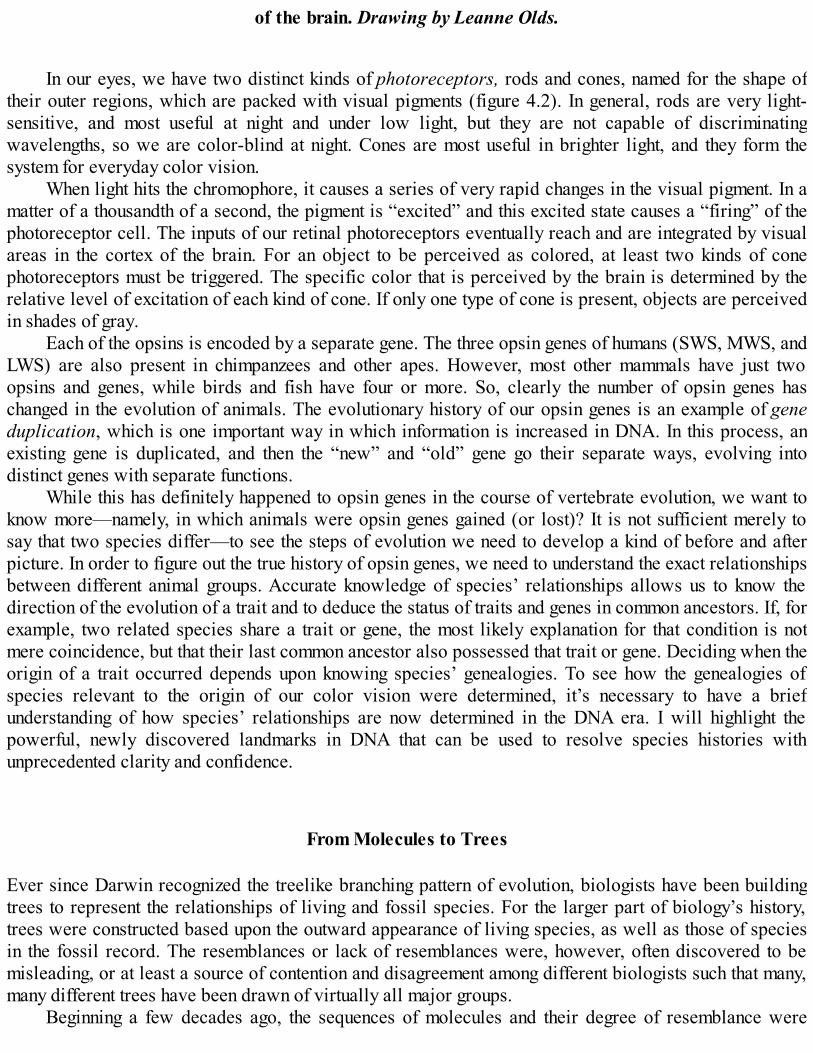
of the brain. Drawing by Leanne Olds.
In our eyes, we have two distinct kinds of photoreceptors, rods and cones, named for the shape oftheir outer regions, which are packed with visual pigments (figure 4.2). In general, rods are very light-sensitive, and most useful at night and under low light, but they are not capable of discriminatingwavelengths, so we are color-blind at night. Cones are most useful in brighter light, and they form thesystem for everyday color vision.
When light hits the chromophore, it causes a series of very rapid changes in the visual pigment. In amatter of a thousandth of a second, the pigment is “excited” and this excited state causes a “firing” of thephotoreceptor cell. The inputs of our retinal photoreceptors eventually reach and are integrated by visualareas in the cortex of the brain. For an object to be perceived as colored, at least two kinds of conephotoreceptors must be triggered. The specific color that is perceived by the brain is determined by therelative level of excitation of each kind of cone. If only one type of cone is present, objects are perceivedin shades of gray.
Each of the opsins is encoded by a separate gene. The three opsin genes of humans (SWS, MWS, andLWS) are also present in chimpanzees and other apes. However, most other mammals have just twoopsins and genes, while birds and fish have four or more. So, clearly the number of opsin genes haschanged in the evolution of animals. The evolutionary history of our opsin genes is an example of geneduplication, which is one important way in which information is increased in DNA. In this process, anexisting gene is duplicated, and then the “new” and “old” gene go their separate ways, evolving intodistinct genes with separate functions.
While this has definitely happened to opsin genes in the course of vertebrate evolution, we want toknow more—namely, in which animals were opsin genes gained (or lost)? It is not sufficient merely tosay that two species differ—to see the steps of evolution we need to develop a kind of before and afterpicture. In order to figure out the true history of opsin genes, we need to understand the exact relationshipsbetween different animal groups. Accurate knowledge of species’ relationships allows us to know thedirection of the evolution of a trait and to deduce the status of traits and genes in common ancestors. If, forexample, two related species share a trait or gene, the most likely explanation for that condition is notmere coincidence, but that their last common ancestor also possessed that trait or gene. Deciding when theorigin of a trait occurred depends upon knowing species’ genealogies. To see how the genealogies ofspecies relevant to the origin of our color vision were determined, it’s necessary to have a briefunderstanding of how species’ relationships are now determined in the DNA era. I will highlight thepowerful, newly discovered landmarks in DNA that can be used to resolve species histories withunprecedented clarity and confidence.
From Molecules to Trees
Ever since Darwin recognized the treelike branching pattern of evolution, biologists have been buildingtrees to represent the relationships of living and fossil species. For the larger part of biology’s history,trees were constructed based upon the outward appearance of living species, as well as those of speciesin the fossil record. The resemblances or lack of resemblances were, however, often discovered to bemisleading, or at least a source of contention and disagreement among different biologists such that many,many different trees have been drawn of virtually all major groups.
Beginning a few decades ago, the sequences of molecules and their degree of resemblance were
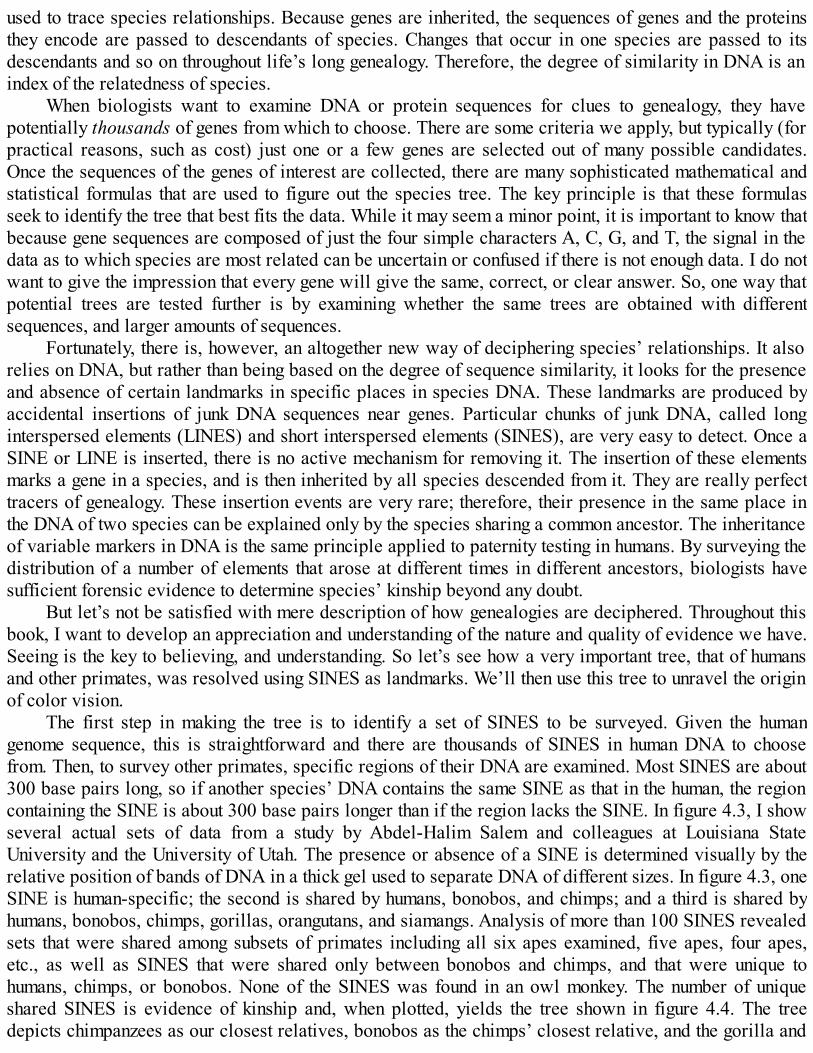
used to trace species relationships. Because genes are inherited, the sequences of genes and the proteinsthey encode are passed to descendants of species. Changes that occur in one species are passed to itsdescendants and so on throughout life’s long genealogy. Therefore, the degree of similarity in DNA is anindex of the relatedness of species.
When biologists want to examine DNA or protein sequences for clues to genealogy, they havepotentially thousands of genes from which to choose. There are some criteria we apply, but typically (forpractical reasons, such as cost) just one or a few genes are selected out of many possible candidates.Once the sequences of the genes of interest are collected, there are many sophisticated mathematical andstatistical formulas that are used to figure out the species tree. The key principle is that these formulasseek to identify the tree that best fits the data. While it may seem a minor point, it is important to know thatbecause gene sequences are composed of just the four simple characters A, C, G, and T, the signal in thedata as to which species are most related can be uncertain or confused if there is not enough data. I do notwant to give the impression that every gene will give the same, correct, or clear answer. So, one way thatpotential trees are tested further is by examining whether the same trees are obtained with differentsequences, and larger amounts of sequences.
Fortunately, there is, however, an altogether new way of deciphering species’ relationships. It alsorelies on DNA, but rather than being based on the degree of sequence similarity, it looks for the presenceand absence of certain landmarks in specific places in species DNA. These landmarks are produced byaccidental insertions of junk DNA sequences near genes. Particular chunks of junk DNA, called longinterspersed elements (LINES) and short interspersed elements (SINES), are very easy to detect. Once aSINE or LINE is inserted, there is no active mechanism for removing it. The insertion of these elementsmarks a gene in a species, and is then inherited by all species descended from it. They are really perfecttracers of genealogy. These insertion events are very rare; therefore, their presence in the same place inthe DNA of two species can be explained only by the species sharing a common ancestor. The inheritanceof variable markers in DNA is the same principle applied to paternity testing in humans. By surveying thedistribution of a number of elements that arose at different times in different ancestors, biologists havesufficient forensic evidence to determine species’ kinship beyond any doubt.
But let’s not be satisfied with mere description of how genealogies are deciphered. Throughout thisbook, I want to develop an appreciation and understanding of the nature and quality of evidence we have.Seeing is the key to believing, and understanding. So let’s see how a very important tree, that of humansand other primates, was resolved using SINES as landmarks. We’ll then use this tree to unravel the originof color vision.
The first step in making the tree is to identify a set of SINES to be surveyed. Given the humangenome sequence, this is straightforward and there are thousands of SINES in human DNA to choosefrom. Then, to survey other primates, specific regions of their DNA are examined. Most SINES are about300 base pairs long, so if another species’ DNA contains the same SINE as that in the human, the regioncontaining the SINE is about 300 base pairs longer than if the region lacks the SINE. In figure 4.3, I showseveral actual sets of data from a study by Abdel-Halim Salem and colleagues at Louisiana StateUniversity and the University of Utah. The presence or absence of a SINE is determined visually by therelative position of bands of DNA in a thick gel used to separate DNA of different sizes. In figure 4.3, oneSINE is human-specific; the second is shared by humans, bonobos, and chimps; and a third is shared byhumans, bonobos, chimps, gorillas, orangutans, and siamangs. Analysis of more than 100 SINES revealedsets that were shared among subsets of primates including all six apes examined, five apes, four apes,etc., as well as SINES that were shared only between bonobos and chimps, and that were unique tohumans, chimps, or bonobos. None of the SINES was found in an owl monkey. The number of uniqueshared SINES is evidence of kinship and, when plotted, yields the tree shown in figure 4.4. The treedepicts chimpanzees as our closest relatives, bonobos as the chimps’ closest relative, and the gorilla and
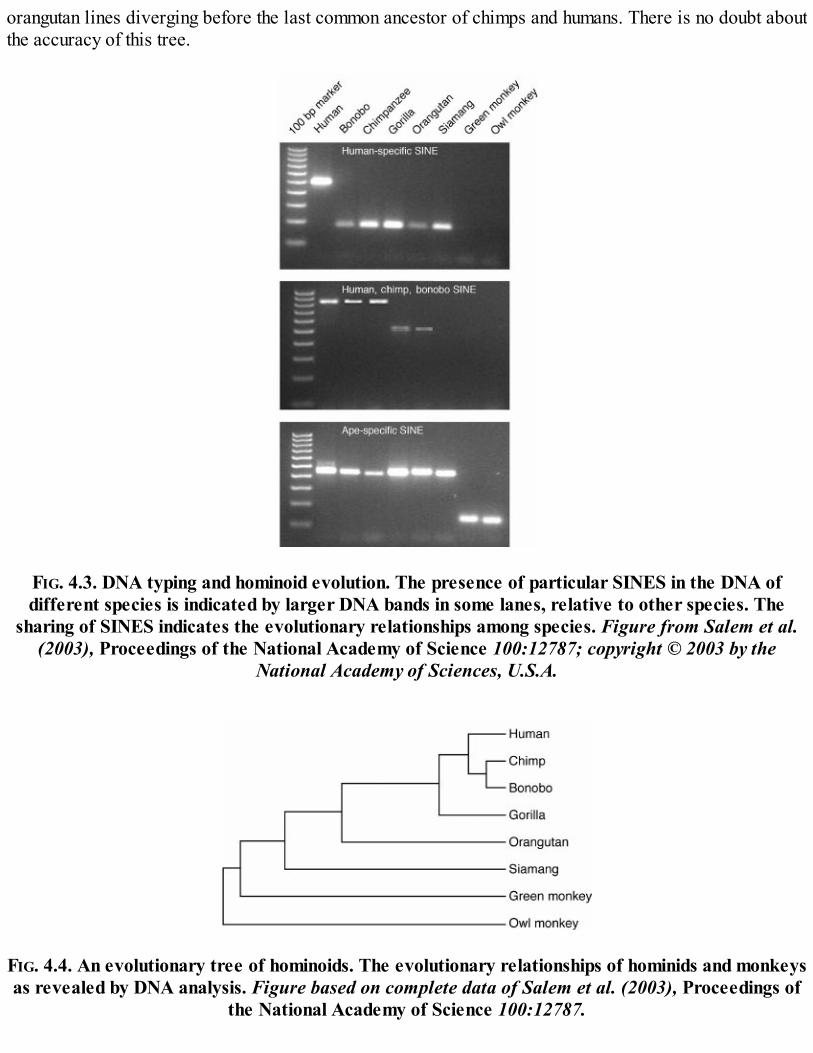
orangutan lines diverging before the last common ancestor of chimps and humans. There is no doubt aboutthe accuracy of this tree.
FIG. 4.3. DNA typing and hominoid evolution. The presence of particular SINES in the DNA ofdifferent species is indicated by larger DNA bands in some lanes, relative to other species. The
sharing of SINES indicates the evolutionary relationships among species. Figure from Salem et al.(2003), Proceedings of the National Academy of Science 100:12787; copyright © 2003 by the
National Academy of Sciences, U.S.A.
FIG. 4.4. An evolutionary tree of hominoids. The evolutionary relationships of hominids and monkeysas revealed by DNA analysis. Figure based on complete data of Salem et al. (2003), Proceedings of
the National Academy of Science 100:12787.
Now, given this tree, let’s consider the distribution of color vision and opsin genes.
The Meandering History of Color Vision
All of the Old World (African and Asian) apes and monkeys have trichromatic color vision and threecone opsin genes, while the New World monkeys, as well as rodents and other mammals, generally havedichromatic vision and two opsin genes. Given the tree in figure 4.4, we can deduce that full color visionarose in an ancestor of the Old World primates, after the separation of the Old World and New Worldlineages. Furthermore, because the Old World primates possess a third cone pigment, this opsin gene musthave arisen after this split as well. This tells us that human color vision dates from a deep, Old Worldancestor and was not invented independently during the recent course of hominid evolution.
The existence of two cone opsins in other mammals—squirrels, cats, dogs, etc.—suggests that thepresence of two cone opsins and dichromatic vision was the condition in a common ancestor of mammals.But before we leap to the conclusion that full color vision in primates is a unique “advance,” we have toconsider the vision status of other vertebrates besides mammals. And here’s the rub. Birds have fabulouscolor vision; so do reptiles and many fish, such as the goldfish. Members of these groups have at leastfour opsin genes. Indeed, in more primitive groups of vertebrates, such as the jawless lamprey, we findfive opsin genes; this indicates the presence of color vision very early in vertebrate evolution, before thesplit between the lines of jawless and jawed vertebrates. So, when considered in the context of the wholeevolutionary tree of vertebrates, the nonprimate mammals are impoverished with respect to color visionand opsin genes. From the distribution of color vision and opsin genes throughout vertebrates, we candeduce that the pattern of opsin gene evolution in our history was one of initial abundance, then a loss inthe ancestors of mammals, and then expansion again in an ancestor of Old World primates.
You might be wondering: If color vision is so great, why would it ever be lost? The most likelyexplanation has to do with the evolution of nocturnality in mammals. Early mammals were small and liveda cryptic, nocturnal lifestyle in ecosystems dominated by bigger animals, such as the dinosaurs. Theevolution of nocturnality shifted the dependence of these animals from color vision in bright light tovision in dim light and darkness, and full color vision was lost. (We will see many instances in the nextchapter how such shifts lead to loss of genes, including color vision genes.)
We can say for certain when, relative to primate and mammal evolution, our third opsin geneevolved. But there remains the question of how? How did this new gene expand the spectrum of colorvision? We can see the steps taken in the evolution of color vision in the code of the opsin gene. So, wewill look at the actual code of the opsin protein and how our two red-green opsins are different from eachother, and the exact differences that make them sensitive to different colors. The “tuning” of opsins in theadaptation to specific environments is a general phenomenon in color vision. I will first show how ouropsins are tuned and the evidence for their adaptiveness in primates. I will then describe some examplesof how different species opsins have been tuned to light of other wavelengths as they adapted to differentenvironments and stimuli.
The Red/Green Show
Rats, mice, squirrels, rabbits, goats, and other mammals have one MWS/LWS opsin whose maximalabsorbance is at wavelengths from about 510–550 nm. This opsin is encoded by a single gene. In contrast,humans have two opsins (one for MWS, one for LWS), encoded by two genes on our X-chromosome that
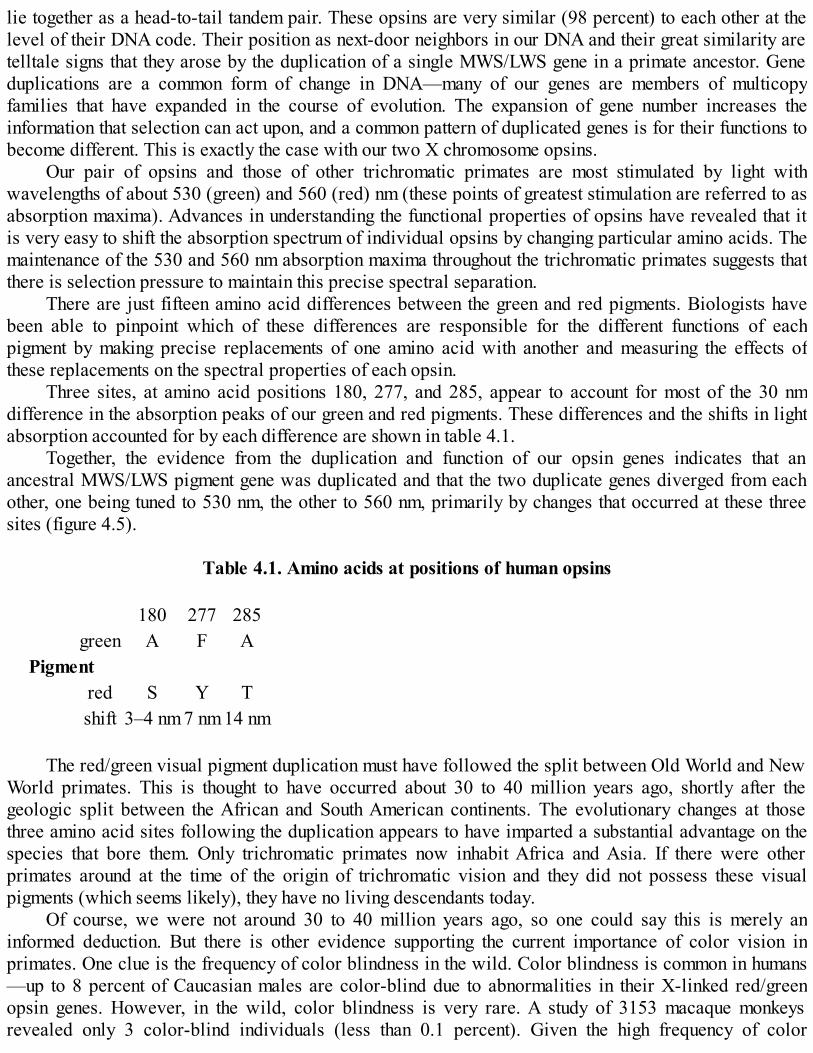
lie together as a head-to-tail tandem pair. These opsins are very similar (98 percent) to each other at thelevel of their DNA code. Their position as next-door neighbors in our DNA and their great similarity aretelltale signs that they arose by the duplication of a single MWS/LWS gene in a primate ancestor. Geneduplications are a common form of change in DNA—many of our genes are members of multicopyfamilies that have expanded in the course of evolution. The expansion of gene number increases theinformation that selection can act upon, and a common pattern of duplicated genes is for their functions tobecome different. This is exactly the case with our two X chromosome opsins.
Our pair of opsins and those of other trichromatic primates are most stimulated by light withwavelengths of about 530 (green) and 560 (red) nm (these points of greatest stimulation are referred to asabsorption maxima). Advances in understanding the functional properties of opsins have revealed that itis very easy to shift the absorption spectrum of individual opsins by changing particular amino acids. Themaintenance of the 530 and 560 nm absorption maxima throughout the trichromatic primates suggests thatthere is selection pressure to maintain this precise spectral separation.
There are just fifteen amino acid differences between the green and red pigments. Biologists havebeen able to pinpoint which of these differences are responsible for the different functions of eachpigment by making precise replacements of one amino acid with another and measuring the effects ofthese replacements on the spectral properties of each opsin.
Three sites, at amino acid positions 180, 277, and 285, appear to account for most of the 30 nmdifference in the absorption peaks of our green and red pigments. These differences and the shifts in lightabsorption accounted for by each difference are shown in table 4.1.
Together, the evidence from the duplication and function of our opsin genes indicates that anancestral MWS/LWS pigment gene was duplicated and that the two duplicate genes diverged from eachother, one being tuned to 530 nm, the other to 560 nm, primarily by changes that occurred at these threesites (figure 4.5).
Table 4.1. Amino acids at positions of human opsins
180 277 285 green A F A
Pigment red S Y T shift 3–4 nm 7 nm 14 nm
The red/green visual pigment duplication must have followed the split between Old World and New
World primates. This is thought to have occurred about 30 to 40 million years ago, shortly after thegeologic split between the African and South American continents. The evolutionary changes at thosethree amino acid sites following the duplication appears to have imparted a substantial advantage on thespecies that bore them. Only trichromatic primates now inhabit Africa and Asia. If there were otherprimates around at the time of the origin of trichromatic vision and they did not possess these visualpigments (which seems likely), they have no living descendants today.
Of course, we were not around 30 to 40 million years ago, so one could say this is merely aninformed deduction. But there is other evidence supporting the current importance of color vision inprimates. One clue is the frequency of color blindness in the wild. Color blindness is common in humans—up to 8 percent of Caucasian males are color-blind due to abnormalities in their X-linked red/greenopsin genes. However, in the wild, color blindness is very rare. A study of 3153 macaque monkeysrevealed only 3 color-blind individuals (less than 0.1 percent). Given the high frequency of color
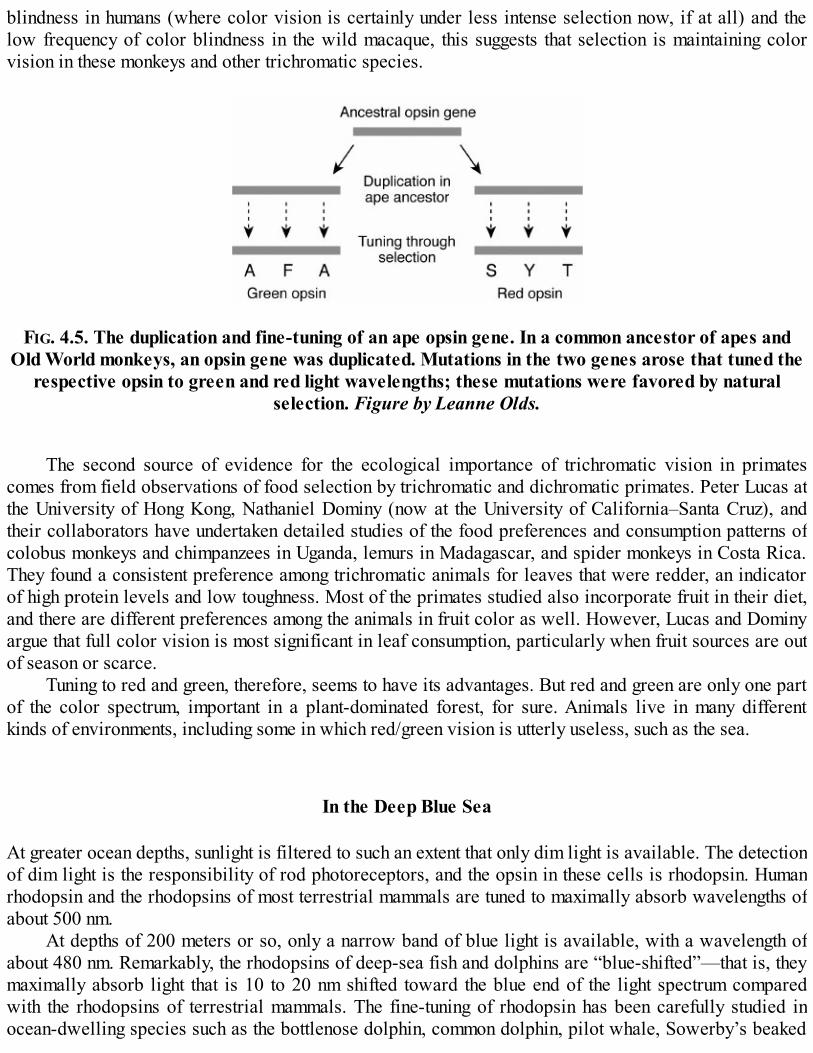
blindness in humans (where color vision is certainly under less intense selection now, if at all) and thelow frequency of color blindness in the wild macaque, this suggests that selection is maintaining colorvision in these monkeys and other trichromatic species.
FIG. 4.5. The duplication and fine-tuning of an ape opsin gene. In a common ancestor of apes andOld World monkeys, an opsin gene was duplicated. Mutations in the two genes arose that tuned the
respective opsin to green and red light wavelengths; these mutations were favored by naturalselection. Figure by Leanne Olds.
The second source of evidence for the ecological importance of trichromatic vision in primatescomes from field observations of food selection by trichromatic and dichromatic primates. Peter Lucas atthe University of Hong Kong, Nathaniel Dominy (now at the University of California–Santa Cruz), andtheir collaborators have undertaken detailed studies of the food preferences and consumption patterns ofcolobus monkeys and chimpanzees in Uganda, lemurs in Madagascar, and spider monkeys in Costa Rica.They found a consistent preference among trichromatic animals for leaves that were redder, an indicatorof high protein levels and low toughness. Most of the primates studied also incorporate fruit in their diet,and there are different preferences among the animals in fruit color as well. However, Lucas and Dominyargue that full color vision is most significant in leaf consumption, particularly when fruit sources are outof season or scarce.
Tuning to red and green, therefore, seems to have its advantages. But red and green are only one partof the color spectrum, important in a plant-dominated forest, for sure. Animals live in many differentkinds of environments, including some in which red/green vision is utterly useless, such as the sea.
In the Deep Blue Sea
At greater ocean depths, sunlight is filtered to such an extent that only dim light is available. The detectionof dim light is the responsibility of rod photoreceptors, and the opsin in these cells is rhodopsin. Humanrhodopsin and the rhodopsins of most terrestrial mammals are tuned to maximally absorb wavelengths ofabout 500 nm.
At depths of 200 meters or so, only a narrow band of blue light is available, with a wavelength ofabout 480 nm. Remarkably, the rhodopsins of deep-sea fish and dolphins are “blue-shifted”—that is, theymaximally absorb light that is 10 to 20 nm shifted toward the blue end of the light spectrum comparedwith the rhodopsins of terrestrial mammals. The fine-tuning of rhodopsin has been carefully studied inocean-dwelling species such as the bottlenose dolphin, common dolphin, pilot whale, Sowerby’s beaked
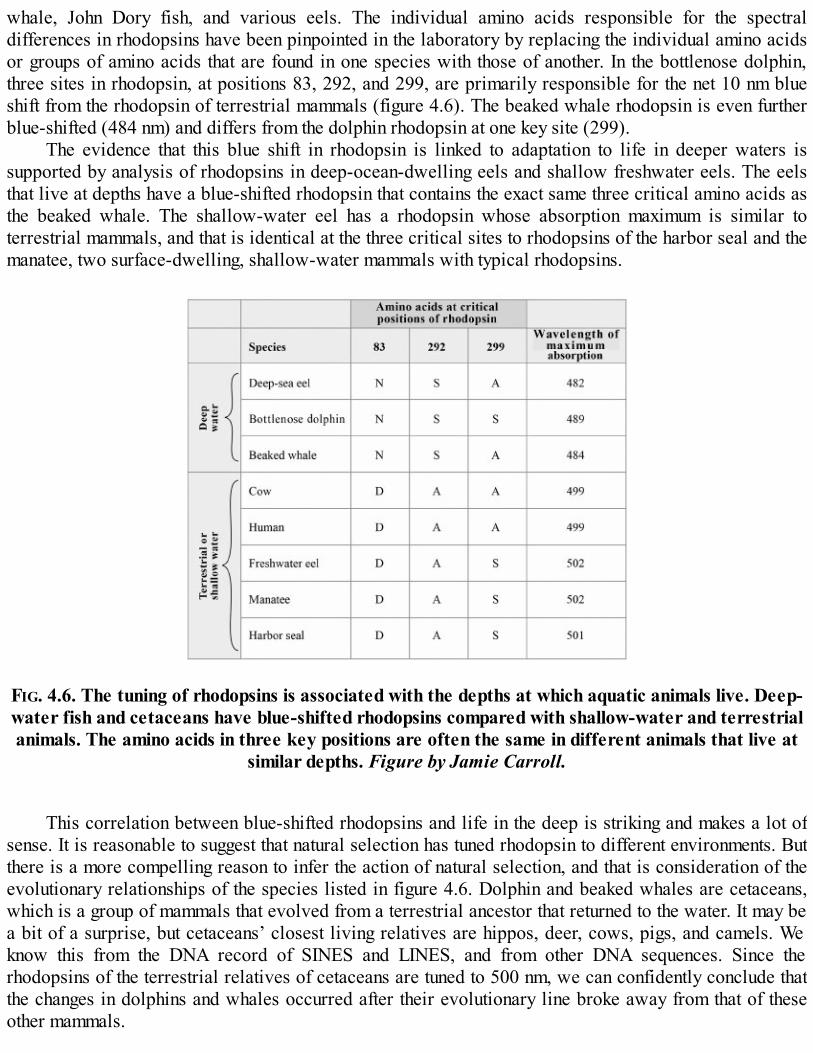
whale, John Dory fish, and various eels. The individual amino acids responsible for the spectraldifferences in rhodopsins have been pinpointed in the laboratory by replacing the individual amino acidsor groups of amino acids that are found in one species with those of another. In the bottlenose dolphin,three sites in rhodopsin, at positions 83, 292, and 299, are primarily responsible for the net 10 nm blueshift from the rhodopsin of terrestrial mammals (figure 4.6). The beaked whale rhodopsin is even furtherblue-shifted (484 nm) and differs from the dolphin rhodopsin at one key site (299).
The evidence that this blue shift in rhodopsin is linked to adaptation to life in deeper waters issupported by analysis of rhodopsins in deep-ocean-dwelling eels and shallow freshwater eels. The eelsthat live at depths have a blue-shifted rhodopsin that contains the exact same three critical amino acids asthe beaked whale. The shallow-water eel has a rhodopsin whose absorption maximum is similar toterrestrial mammals, and that is identical at the three critical sites to rhodopsins of the harbor seal and themanatee, two surface-dwelling, shallow-water mammals with typical rhodopsins.
FIG. 4.6. The tuning of rhodopsins is associated with the depths at which aquatic animals live. Deep-water fish and cetaceans have blue-shifted rhodopsins compared with shallow-water and terrestrialanimals. The amino acids in three key positions are often the same in different animals that live at
similar depths. Figure by Jamie Carroll.
This correlation between blue-shifted rhodopsins and life in the deep is striking and makes a lot ofsense. It is reasonable to suggest that natural selection has tuned rhodopsin to different environments. Butthere is a more compelling reason to infer the action of natural selection, and that is consideration of theevolutionary relationships of the species listed in figure 4.6. Dolphin and beaked whales are cetaceans,which is a group of mammals that evolved from a terrestrial ancestor that returned to the water. It may bea bit of a surprise, but cetaceans’ closest living relatives are hippos, deer, cows, pigs, and camels. Weknow this from the DNA record of SINES and LINES, and from other DNA sequences. Since therhodopsins of the terrestrial relatives of cetaceans are tuned to 500 nm, we can confidently conclude thatthe changes in dolphins and whales occurred after their evolutionary line broke away from that of theseother mammals.

But eels are fish, whose lines of evolution split off from other kinds of vertebrates several hundredmillion years ago. This means that the same precise differences in the deep-and shallow-water eels andterrestrial and marine mammals evolved independently. When two species or groups of species evolvethe same exact amino acids in a protein in adapting to similar environments, as the cetaceans and deep-water eel have here, this is very strong evidence of natural selection for the same adaptation. (Thisexample of rhodopsin evolution is just a glimpse of many more examples of evolution repeating itself,which will be the entire focus of chapter 6.)
Now let’s go beyond red, green, and blue to colors we don’t see, and a whole world of animalinteractions based on ultraviolet vision.
Beyond the Rainbow
A dozen years after the On the Origin of Species, Darwin published The Descent of Man and Selectionin Relation to Sex. This was Darwin’s first detailed treatment of human evolution, but perhaps even moreimportant than that topic was his presentation of a new and fundamental insight into evolution: theimportance of the role of the opposite sex in the evolution of traits, which he called “sexual selection.”Both sexual selection and Darwin’s development of the theory are generally less well-known than histheory of natural selection, but biologists view sexual selection as one of the most important andinteresting forces in the evolution of animals—an arena where the assessment of the “fittest” is directlytied to mating success.
Darwin was captivated by bird plumage patterns and gave considerable thought and many pages ofdescription to the gaudy colors and fancy feather patterns of all sorts of species. He was especiallyinterested in how female mating preferences could lead to the evolution of elaborate ornaments in males,such as the peacock’s tail. Ever since Darwin, birds have been a favorite subject for the study of sexualselection. But until very recently, such studies were often flawed for one reason: humans were assessingthe colors of birds. As you now appreciate that we see the world differently from most mammals, we alsosee the world differently than birds see it, or one another. Many birds possess ultraviolet vision, and seecolors that we cannot, and this capability plays many roles—in mating, finding food, and even the feedingof young nestlings.
Many birds have tuned an opsin to detect ultraviolet light, and have evolved body markings thatreflect light in the ultraviolet part of the spectrum (color plates D–K). Ultraviolet light has wavelengthsless than 400 nm, which is shorter than violet, and is detected by the SWS opsin. Our SWS opsin is tunedto 417 nm. Various species of birds have SWS opsins that are tuned to wavelengths around 370 nm andcan see in the ultraviolet. Other birds have SWS opsins tuned to the violet range of the visible spectrum,with absorption maxima around 405 nm, and those birds, like us, cannot see in the ultraviolet. Again,molecular studies in the laboratory have been able to pinpoint the precise changes in bird SWS opsinsthat determine whether the particular species is sensitive to violet or ultraviolet light.
One specific site, at position 90 in the bird SWS opsin, shows a perfect correlation with violet orultraviolet vision, depending upon the amino acid found there. Birds with the amino acid serine in thisposition see in the violet range, birds with the amino acid cysteine in this position see in the ultravioletrange (figure 4.7). Furthermore, Shozo Yokoyama, one of the leading scientists studying color vision, andhis colleagues at Emory University have shown directly that if serine is replaced with cysteine, a violetpigment becomes ultraviolet-sensitive, and if cysteine is replaced with serine in an ultraviolet pigment, itbecomes violet-sensitive. Just this single amino acid difference shifts the absorption maximum by 35 to38 nm, a very dramatic shift. These studies show that a single change may alter the function of the SWS

opsin, and therefore the evolution of either a violet-or ultraviolet-detecting opsin could be a relativelysimple, one-step process.
FIG. 4.7. The evolution of ultraviolet vision in birds. The detection of violet or ultravioletwavelengths by bird SWS opsins depends critically on whether the amino acid at position 90 is serine
(S) or cysteine (C). Changes at this position have occurred at least four times in different birdorders. Figure by Jamie Carroll.
The different birds that possess ultraviolet vision belong to nine different families in four differentorders. Based upon their relationships to one another, it appears that ultraviolet vision has evolved atleast four separate times in birds. All of the bird orders that have ultraviolet-sensitive species alsocontain violet-sensitive species, so it appears that the mutation that changed the serine to cysteine in aviolet pigment happened multiple times. Here again, in ultraviolet vision, evolution has repeated itself.This is compelling evidence that selection has acted on opsin genes. In this case, it may well be that thenature of the selection was sexual, as there is abundant evidence now that mating preference inultraviolet-sensitive species is affected by colors and patterns that are visible only in the ultraviolet range(color plates D–K).
For example, in starlings, female mating preference is determined by ultraviolet plumage colors, notby the plumage in the color range visible to humans. This was discovered by placing test birds in anapparatus in which the wavelengths of available light could be filtered. Females ranked males differentlywhen UV light was available, and showed a preference for males that had ultraviolet markings on theirthroat feather tips.
Similarly, the male blue tit differs from the female in the ultraviolet reflectance of the blue featherson the crest of their heads (plates D–G). In laboratory experiments, females prefer males with thebrightest ultraviolet-reflecting crests. This prompted the University of Bristol researchers who did thestudy to declare, in the title of their paper, “Blue tits are really ultraviolet tits.”
The utility of ultraviolet vision goes beyond mating preferences. Recently, it was shown that themouths of chicks from eight different birds species are highly reflective in the ultraviolet band,

particularly along the rim of their mouths. This means that parents returning to the dark nest can see themouths of their nestlings. Furthermore, it appears that the stronger nestlings reflect more UV light, so inthe competition among nestlings, the fittest appear to stand out by virtue of these UV-reflecting mouths,which are presented to a feeding parent.
There is also evidence that ultraviolet vision is used in hunting prey. Blue tits use their UV vision tohelp detect caterpillars that are camouflaged with visible colors. Kestrels, a type of raptor, hunt voles byhoning in on the voles’ scent marks, which are UV-reflecting, to locate areas of high prey density.
Ultraviolet vision is by no means limited to birds. Some fish, amphibians, reptiles, and mammals,such as bats, are known to use ultraviolet vision, and each UV-sensitive species has an SWS opsin tunedto around 360–370 nm. The widespread evolution and use of this capability suggests that it can play manyroles. This is a general theme in evolution, that one innovation creates the opportunity to evolveadditional innovations. I will close this chapter by returning to the colobus monkey, and an additional setof innovations it evolved that built upon its talent for identifying the most nutritious leaves in the forest. Itis another very clear case of making something new from an “old” gene.
Ruminating Monkeys
While most primate diets focus on fruits and insects, colobus monkeys have specialized as leaf-eaters.And similar to those eaten by familiar barnyard ruminants, the leaves are fermented by bacteria that livein the foregut, one of the chambers of the colobus’s multichambered digestive system. Just like cows andother ruminants, colobus extract the nutrients from that stew by breaking down and digesting the bacteriawith a variety of enzymes. One such important enzyme, ribonuclease, is made in the pancreas and secretedinto the small intestine, and it breaks down RNA. The ribonuclease helps to harvest the large amounts ofnitrogen in the RNA of the fermenting bacteria. The colobus and conventional ruminants have greateramounts of ribonuclease in their pancreas than other mammals, which raises the question of how thisdigestive enzyme has evolved.
The key discovery was that, while most mammals and other monkeys have only one copy of thepancreatic ribonuclease gene, the colobus monkey has three such genes. The ribonuclease gene wasduplicated in the evolution of these monkeys. Detailed study of the genes and the enzymes they encode byJianzhi Zhang (of the University of Michigan) has revealed that while one gene has continued to producean enzyme virtually identical to that found in nonruminating monkeys, the two “new” genes haveundergone several changes that have fine-tuned them to the digestive system and needs of the colobus.
Overall, there are ten and thirteen changes in the protein sequences of the two “new” enzymes. Onemarked difference in the behavior of the new enzymes is that their optimal activities are in a more acidicenvironment than the optimal activity of the “old” enzyme. This difference correlates with differences inthe digestive process between colobus and other primates.
This is a good correlation, but that is not the only evidence that natural selection has acted onribonuclease evolution. More compelling evidence comes from analysis of the DNA and protein sequenceof the new ribonucleases. Recall from the last chapter that most changes in DNA are synonymous. Thereis a much higher ratio of nonsynonymous to synonymous changes (about 4:1, whereas other proteins showa ratio of about 1:5) in the new ribonuclease genes. This is good evidence of natural selection acting tofavor these specific changes in the protein.
Inventing and Adapting
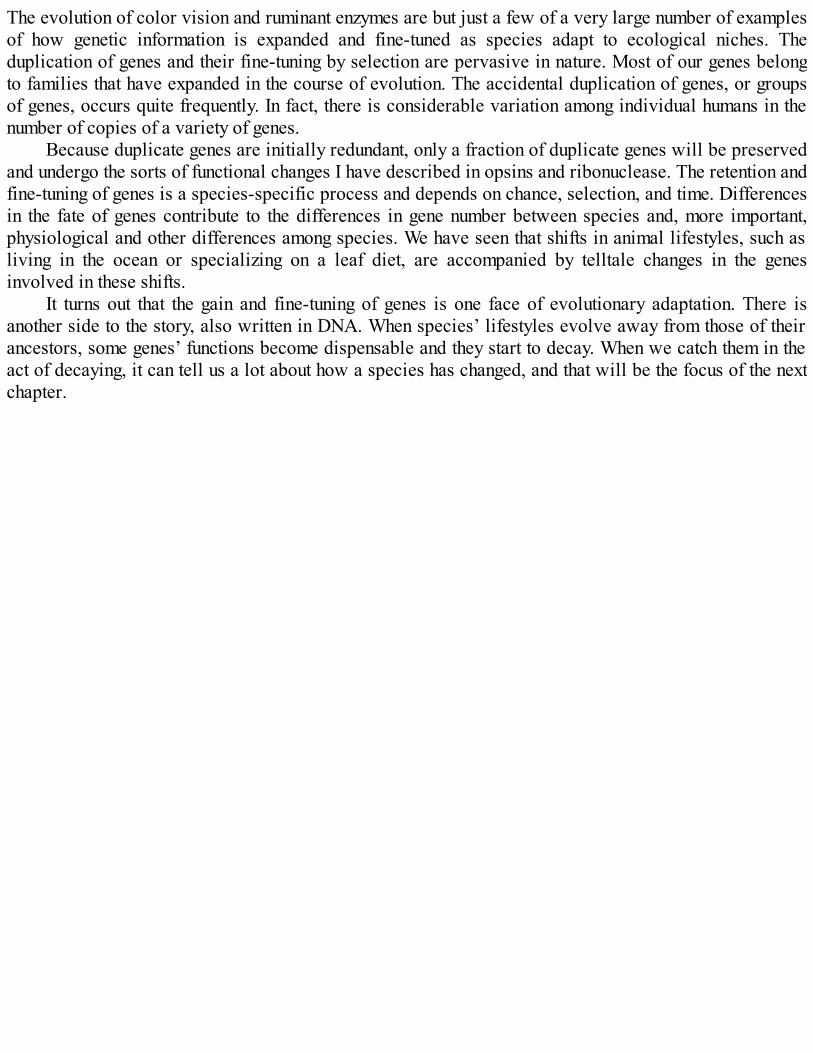
The evolution of color vision and ruminant enzymes are but just a few of a very large number of examplesof how genetic information is expanded and fine-tuned as species adapt to ecological niches. Theduplication of genes and their fine-tuning by selection are pervasive in nature. Most of our genes belongto families that have expanded in the course of evolution. The accidental duplication of genes, or groupsof genes, occurs quite frequently. In fact, there is considerable variation among individual humans in thenumber of copies of a variety of genes.
Because duplicate genes are initially redundant, only a fraction of duplicate genes will be preservedand undergo the sorts of functional changes I have described in opsins and ribonuclease. The retention andfine-tuning of genes is a species-specific process and depends on chance, selection, and time. Differencesin the fate of genes contribute to the differences in gene number between species and, more important,physiological and other differences among species. We have seen that shifts in animal lifestyles, such asliving in the ocean or specializing on a leaf diet, are accompanied by telltale changes in the genesinvolved in these shifts.
It turns out that the gain and fine-tuning of genes is one face of evolutionary adaptation. There isanother side to the story, also written in DNA. When species’ lifestyles evolve away from those of theirancestors, some genes’ functions become dispensable and they start to decay. When we catch them in theact of decaying, it can tell us a lot about how a species has changed, and that will be the focus of the nextchapter.
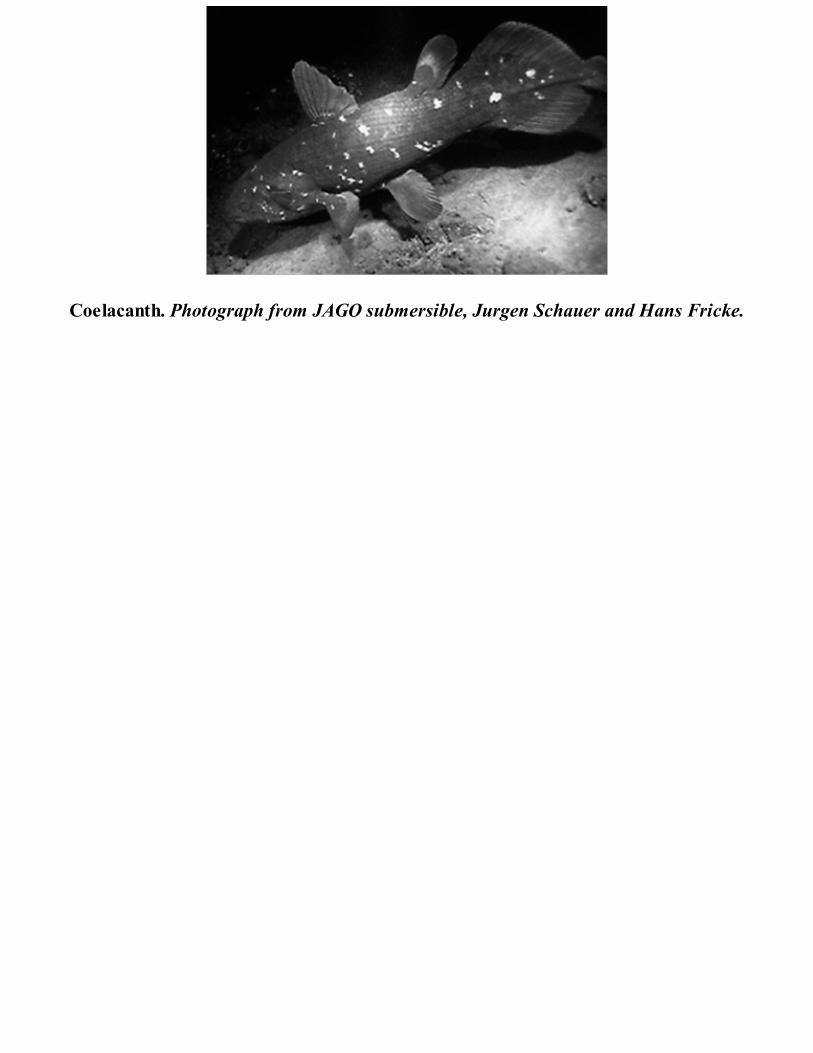
Coelacanth. Photograph from JAGO submersible, Jurgen Schauer and Hans Fricke.

Chapter 5
Fossil Genes: Broken Pieces of Yesterday’s Life
Nature is, after all, the only book that offers important content on every page.—Johann Wolfgang von Goethe
IT WAS A MAGNIFICENT EARLY CHRISTMAS PRESENT.Midmorning on December 22, 1938, Marjorie Courtenay-Latimer received a message from the
manager of the local fleet—the Nerine had docked and it might have some fish for her collection. MissLatimer was the first curator of the East London Natural History Museum, in the Cape Province of SouthAfrica, and she was busy that day trying to put together a dinosaur skeleton she had excavated, not tomention getting ready for the holiday.
The fleet manager did not call very often, so she decided to set aside her work and go down to thedock. Hitching up her cotton dress, she boarded the trawler and surveyed the stinking pile of sharks,sponges, and other familiar creatures lying out in the heat of the sun. She was about to return to themuseum when it caught her eye. As she pulled away a bunch of carcasses she saw “the most beautiful fishI had ever seen…. It was five feet long and a pale mauve-blue with iridescent markings.”
It was also unlike any other fish she had ever seen. It was covered in hard scales, had four limblikefins, and a strange puppy-dog tail. She knew it had to be preserved. The fish weighed 127 pounds, sogetting the dead and decomposing creature back to the museum was no small task. It took quite a bit ofpersuasion for a taxi driver to allow it into his trunk.
Once back at her post, she showed off her prize to the museum’s director. He promptly dismissed itas a rock cod. Miss Latimer, virtually self-taught in natural history, thought differently, but none of herreference books helped her to identify the rotting hulk on her examination table. Miss Latimer decided toseek outside assistance in the form of Dr. J. L. B. Smith, a chemistry lecturer and amateur ichthyologist atRhodes University, one hundred miles away. When she could not reach Smith by phone, she sent him aletter the very next day, enclosing a description and a drawing of the fish.
Smith did not get the letter until after the new year. He was recovering from an illness, and when hefinally had the chance to study it he was bewildered. “And then a bomb seemed to burst in my brain, andbeyond that sketch and the paper of the letter I was looking at a series of fishy creatures that flashed up ason a screen, fishes no longer there, fishes that had lived in dim past ages gone, and of which onlyfragmentary remains in rocks are known.”
Smith immediately wired Miss Latimer: MOST IMPORTANT PRESERVE SKELETON AND GILLS FISHDESCRIBED.
Miss Latimer had managed in the meantime to get a taxidermist to preserve what he could.Smith was positively riled by a possibility that his brain kept telling him was impossible. Yet the
sketch, and then some scales he received later, told him that this fish was a coelacanth, a member of agroup of fish with paired fins thought to be closely related to the first four-legged vertebrates andbelieved to be extinct since the end of the Cretaceous period 65 million years ago.
Smith finally got the chance to see the fish in person, which removed all doubt—as well as his
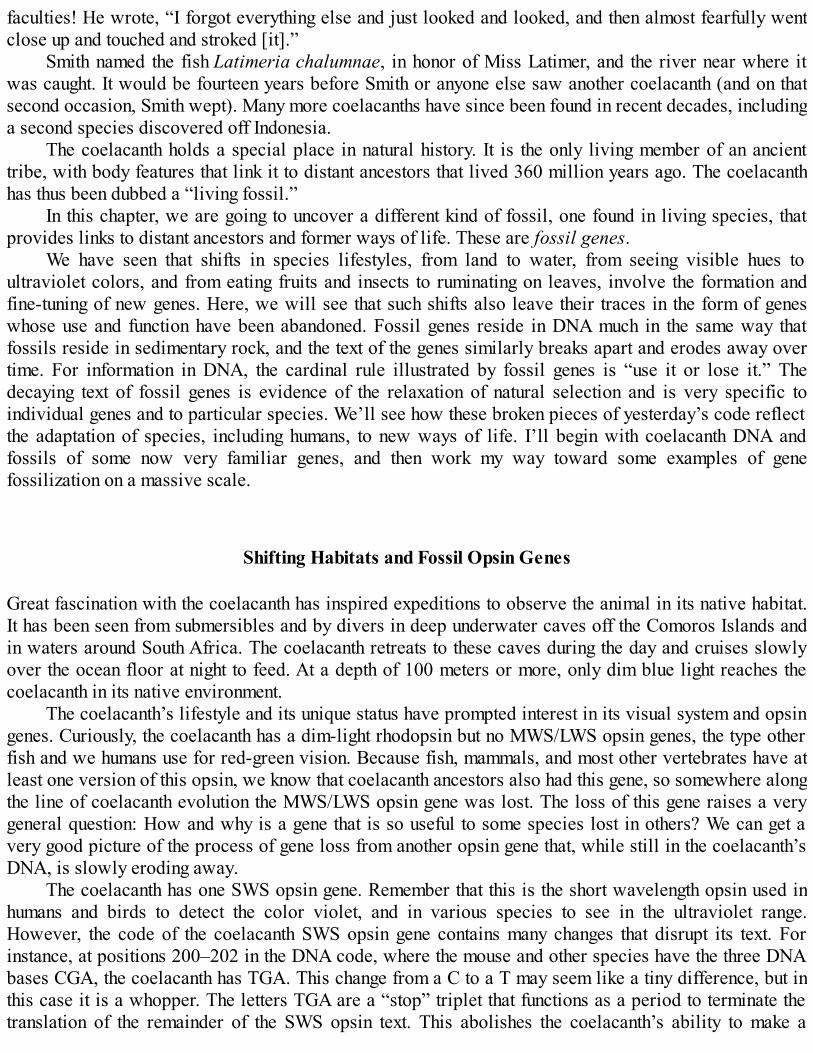
faculties! He wrote, “I forgot everything else and just looked and looked, and then almost fearfully wentclose up and touched and stroked [it].”
Smith named the fish Latimeria chalumnae, in honor of Miss Latimer, and the river near where itwas caught. It would be fourteen years before Smith or anyone else saw another coelacanth (and on thatsecond occasion, Smith wept). Many more coelacanths have since been found in recent decades, includinga second species discovered off Indonesia.
The coelacanth holds a special place in natural history. It is the only living member of an ancienttribe, with body features that link it to distant ancestors that lived 360 million years ago. The coelacanthhas thus been dubbed a “living fossil.”
In this chapter, we are going to uncover a different kind of fossil, one found in living species, thatprovides links to distant ancestors and former ways of life. These are fossil genes.
We have seen that shifts in species lifestyles, from land to water, from seeing visible hues toultraviolet colors, and from eating fruits and insects to ruminating on leaves, involve the formation andfine-tuning of new genes. Here, we will see that such shifts also leave their traces in the form of geneswhose use and function have been abandoned. Fossil genes reside in DNA much in the same way thatfossils reside in sedimentary rock, and the text of the genes similarly breaks apart and erodes away overtime. For information in DNA, the cardinal rule illustrated by fossil genes is “use it or lose it.” Thedecaying text of fossil genes is evidence of the relaxation of natural selection and is very specific toindividual genes and to particular species. We’ll see how these broken pieces of yesterday’s code reflectthe adaptation of species, including humans, to new ways of life. I’ll begin with coelacanth DNA andfossils of some now very familiar genes, and then work my way toward some examples of genefossilization on a massive scale.
Shifting Habitats and Fossil Opsin Genes
Great fascination with the coelacanth has inspired expeditions to observe the animal in its native habitat.It has been seen from submersibles and by divers in deep underwater caves off the Comoros Islands andin waters around South Africa. The coelacanth retreats to these caves during the day and cruises slowlyover the ocean floor at night to feed. At a depth of 100 meters or more, only dim blue light reaches thecoelacanth in its native environment.
The coelacanth’s lifestyle and its unique status have prompted interest in its visual system and opsingenes. Curiously, the coelacanth has a dim-light rhodopsin but no MWS/LWS opsin genes, the type otherfish and we humans use for red-green vision. Because fish, mammals, and most other vertebrates have atleast one version of this opsin, we know that coelacanth ancestors also had this gene, so somewhere alongthe line of coelacanth evolution the MWS/LWS opsin gene was lost. The loss of this gene raises a verygeneral question: How and why is a gene that is so useful to some species lost in others? We can get avery good picture of the process of gene loss from another opsin gene that, while still in the coelacanth’sDNA, is slowly eroding away.
The coelacanth has one SWS opsin gene. Remember that this is the short wavelength opsin used inhumans and birds to detect the color violet, and in various species to see in the ultraviolet range.However, the code of the coelacanth SWS opsin gene contains many changes that disrupt its text. Forinstance, at positions 200–202 in the DNA code, where the mouse and other species have the three DNAbases CGA, the coelacanth has TGA. This change from a C to a T may seem like a tiny difference, but inthis case it is a whopper. The letters TGA are a “stop” triplet that functions as a period to terminate thetranslation of the remainder of the SWS opsin text. This abolishes the coelacanth’s ability to make a

functional SWS opsin protein. Elsewhere in the code of the gene there are other deletions and changes thatseverely disrupt the opsin text. The many disruptions in the coelacanth opsin code tell us that it hasbecome nonfunctional—it is a fossil gene (biologists call these “pseudogenes,” but I will stick with the“fossil” label). It was functional in ancestors of the coelacanth, but no longer works in the fish today. Thegene is still recognizable by the fragments of its parts. But, because it is not functional, it will continue toaccumulate additional mutations and deletions that will erode it further, and will eventually erase it fromthe DNA forever, just as the coelacanth’s MWS/LWS opsin was erased (and one of the globin genes waserased in the icefish ancestor I described in chapter 1).
FIG. 5.1. A fossil opsin gene in a dolphin. Short portions of the sequences of a dolphin and a cowSWS opsin gene. The shaded regions show the positions of deleted bases (asterisks) that disrupt the
code of the dolphin gene. Figure by Jamie Carroll.
You are probably wondering by now why a good gene would be allowed to decay. Are fossil genesa rare kind of mistake just found in weird animals like coelacanths and icefish? Before I explain further, Iwill mention one more illuminating example.
Inspection of the SWS opsin gene of dolphins and whales reveals that, just as in the coelacanth, thesecetaceans’ SWS opsin gene has become a fossil. For example, the SWS gene of the bottlenose dolphin ismissing one base at one position and four bases at another position near the beginning of the text (figure5.1). The missing bases throw off the three-base-at-a-time decoding of the gene’s text, shifting the readingframe and making the gene nonfunctional. Examination of other cetaceans reveals a number of changes intheir SWS opsin gene that have rendered them nonfunctional. All dolphins and whales have a fossil SWSopsin gene.
FIG. 5.2. The same opsin gene has been fossilized twice. The distribution of different mutationsfound in the coelacanth and cetacean SWS opsins and the evolutionary relationship of these species
indicates that the SWS opsin was fossilized at least twice (asterisk). Figure by Jamie Carroll.

So, here, we have two examples of fossil SWS opsin genes, in the coelacanth and cetaceans. Is thereanything in common or any connection between these animals that could explain why their SWS opsinsare fossilized?
The first thing we can say is that the genes were fossilized independently. We know this from wherethese animals sit in the evolutionary tree of vertebrates (figure 5.2). The coelacanth belongs to a primitivegroup of fish that split off from a line that gave rise to four-legged vertebrates. Because amphibians,reptiles, birds, and many mammals have intact SWS opsin genes, we know that the fossilization of thecoelacanth gene occurred during the evolution of the coelacanth lineage. Because hippos and cows, twoclose relatives of dolphins and whales, have functional SWS opsins, while all cetaceans do not, we candeduce that the function of the cetacean SWS opsin was lost in an ancestor of all dolphins and whales.The lack of functional SWS opsin in modern dolphins and whales is due to inheritance of this fossil genefrom ancestors that lived more than 40 million years ago.
The best explanation for why the gene became fossilized comes from consideration of the animals’ecology. Surely, there must be some link to not using SWS opsin and these animals living in a marinehabitat. Dolphins and whales are fully aquatic and belong to the only order of mammals that lacks thepotential for any form of color vision (because its members have only one cone opsin, whereas most othermammals have two). As we saw in the last chapter, dolphins have tuned their dim-light-type rhodopsin tothe bluer range of the light spectrum. The coelacanth is also a deep-dwelling animal. It, too, apparentlyhas no use for color vision. The ecological rationale for the loss of the SWS opsin function is that itbecame dispensable to the ancestors of these species.
The dispensability of SWS opsin explains what we see happening in the DNA code. If the opsin isno longer needed, then natural selection, which would normally preserve the opsin’s text, is relaxed.When natural selection is relaxed, there is no mechanism for purging genes of mutations that disrupt theirfunction. The random process of mutation assures that all genes experience mutation. Most of the time,disruptive mutations are purged by the competitive process of natural selection because individuals andoffspring bearing them are less fit. But when a trait is no longer under selection, in this case because of ashift in habitat, the genes that were essential in one lifestyle can become dispensable, and mutations canaccumulate in them.
Use it or lose it.In more formal terms, fossil genes are exactly what we would predict to evolve as a consequence
of the continuing action of mutation, over time, in the absence of natural selection. The unmistakablesignature of genes’ dispensability is the accumulation of text-disrupting mutations. The resulting fossilgenes are thus marks of changes in lifestyle from those of ancestors, and when we can spot and trackfossil genes, these are valuable clues to reconstructing natural history.
I will highlight several more examples of opsin gene fossils linked to other kinds of changes inlifestyle and then expand the discussion of fossil genes to more genes, and many more species.
Living in Darkness
One leading theory to explain the reduction in the number of opsin genes and the loss of full color visionthat occurred in the ancestors of mammals is that early mammals were nocturnal, and that color visionwas dispensable for these rodentlike creatures’ lifestyles. Nocturnality has evolved repeatedly inmammals, so one way of testing this theory, and the general idea of gene fossilization linked to shifts inlifestyle, is to examine more recent species with markedly different lifestyles.
The owl monkey, for example, is the only nocturnal species among higher primates (figure 5.3). And
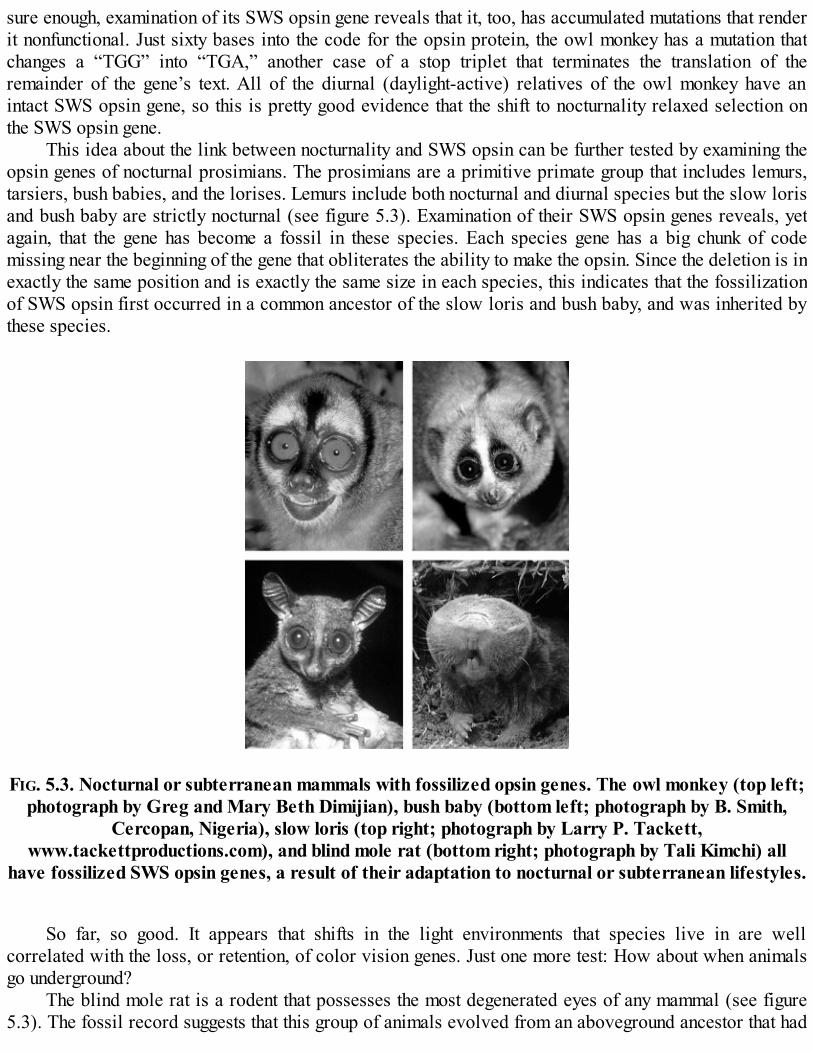
sure enough, examination of its SWS opsin gene reveals that it, too, has accumulated mutations that renderit nonfunctional. Just sixty bases into the code for the opsin protein, the owl monkey has a mutation thatchanges a “TGG” into “TGA,” another case of a stop triplet that terminates the translation of theremainder of the gene’s text. All of the diurnal (daylight-active) relatives of the owl monkey have anintact SWS opsin gene, so this is pretty good evidence that the shift to nocturnality relaxed selection onthe SWS opsin gene.
This idea about the link between nocturnality and SWS opsin can be further tested by examining theopsin genes of nocturnal prosimians. The prosimians are a primitive primate group that includes lemurs,tarsiers, bush babies, and the lorises. Lemurs include both nocturnal and diurnal species but the slow lorisand bush baby are strictly nocturnal (see figure 5.3). Examination of their SWS opsin genes reveals, yetagain, that the gene has become a fossil in these species. Each species gene has a big chunk of codemissing near the beginning of the gene that obliterates the ability to make the opsin. Since the deletion is inexactly the same position and is exactly the same size in each species, this indicates that the fossilizationof SWS opsin first occurred in a common ancestor of the slow loris and bush baby, and was inherited bythese species.
FIG. 5.3. Nocturnal or subterranean mammals with fossilized opsin genes. The owl monkey (top left;photograph by Greg and Mary Beth Dimijian), bush baby (bottom left; photograph by B. Smith,
Cercopan, Nigeria), slow loris (top right; photograph by Larry P. Tackett,www.tackettproductions.com), and blind mole rat (bottom right; photograph by Tali Kimchi) all
have fossilized SWS opsin genes, a result of their adaptation to nocturnal or subterranean lifestyles.
So far, so good. It appears that shifts in the light environments that species live in are wellcorrelated with the loss, or retention, of color vision genes. Just one more test: How about when animalsgo underground?
The blind mole rat is a rodent that possesses the most degenerated eyes of any mammal (see figure5.3). The fossil record suggests that this group of animals evolved from an aboveground ancestor that had
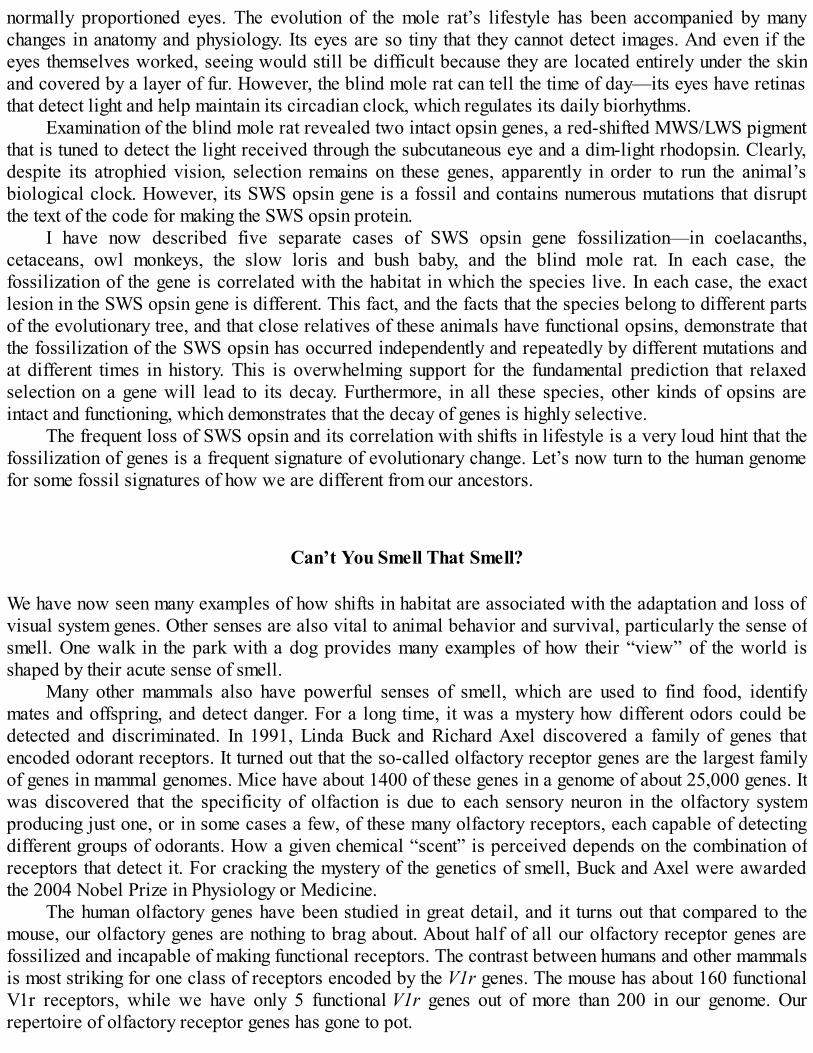
normally proportioned eyes. The evolution of the mole rat’s lifestyle has been accompanied by manychanges in anatomy and physiology. Its eyes are so tiny that they cannot detect images. And even if theeyes themselves worked, seeing would still be difficult because they are located entirely under the skinand covered by a layer of fur. However, the blind mole rat can tell the time of day—its eyes have retinasthat detect light and help maintain its circadian clock, which regulates its daily biorhythms.
Examination of the blind mole rat revealed two intact opsin genes, a red-shifted MWS/LWS pigmentthat is tuned to detect the light received through the subcutaneous eye and a dim-light rhodopsin. Clearly,despite its atrophied vision, selection remains on these genes, apparently in order to run the animal’sbiological clock. However, its SWS opsin gene is a fossil and contains numerous mutations that disruptthe text of the code for making the SWS opsin protein.
I have now described five separate cases of SWS opsin gene fossilization—in coelacanths,cetaceans, owl monkeys, the slow loris and bush baby, and the blind mole rat. In each case, thefossilization of the gene is correlated with the habitat in which the species live. In each case, the exactlesion in the SWS opsin gene is different. This fact, and the facts that the species belong to different partsof the evolutionary tree, and that close relatives of these animals have functional opsins, demonstrate thatthe fossilization of the SWS opsin has occurred independently and repeatedly by different mutations andat different times in history. This is overwhelming support for the fundamental prediction that relaxedselection on a gene will lead to its decay. Furthermore, in all these species, other kinds of opsins areintact and functioning, which demonstrates that the decay of genes is highly selective.
The frequent loss of SWS opsin and its correlation with shifts in lifestyle is a very loud hint that thefossilization of genes is a frequent signature of evolutionary change. Let’s now turn to the human genomefor some fossil signatures of how we are different from our ancestors.
Can’t You Smell That Smell?
We have now seen many examples of how shifts in habitat are associated with the adaptation and loss ofvisual system genes. Other senses are also vital to animal behavior and survival, particularly the sense ofsmell. One walk in the park with a dog provides many examples of how their “view” of the world isshaped by their acute sense of smell.
Many other mammals also have powerful senses of smell, which are used to find food, identifymates and offspring, and detect danger. For a long time, it was a mystery how different odors could bedetected and discriminated. In 1991, Linda Buck and Richard Axel discovered a family of genes thatencoded odorant receptors. It turned out that the so-called olfactory receptor genes are the largest familyof genes in mammal genomes. Mice have about 1400 of these genes in a genome of about 25,000 genes. Itwas discovered that the specificity of olfaction is due to each sensory neuron in the olfactory systemproducing just one, or in some cases a few, of these many olfactory receptors, each capable of detectingdifferent groups of odorants. How a given chemical “scent” is perceived depends on the combination ofreceptors that detect it. For cracking the mystery of the genetics of smell, Buck and Axel were awardedthe 2004 Nobel Prize in Physiology or Medicine.
The human olfactory genes have been studied in great detail, and it turns out that compared to themouse, our olfactory genes are nothing to brag about. About half of all our olfactory receptor genes arefossilized and incapable of making functional receptors. The contrast between humans and other mammalsis most striking for one class of receptors encoded by the V1r genes. The mouse has about 160 functionalV1r receptors, while we have only 5 functional V1r genes out of more than 200 in our genome. Ourrepertoire of olfactory receptor genes has gone to pot.
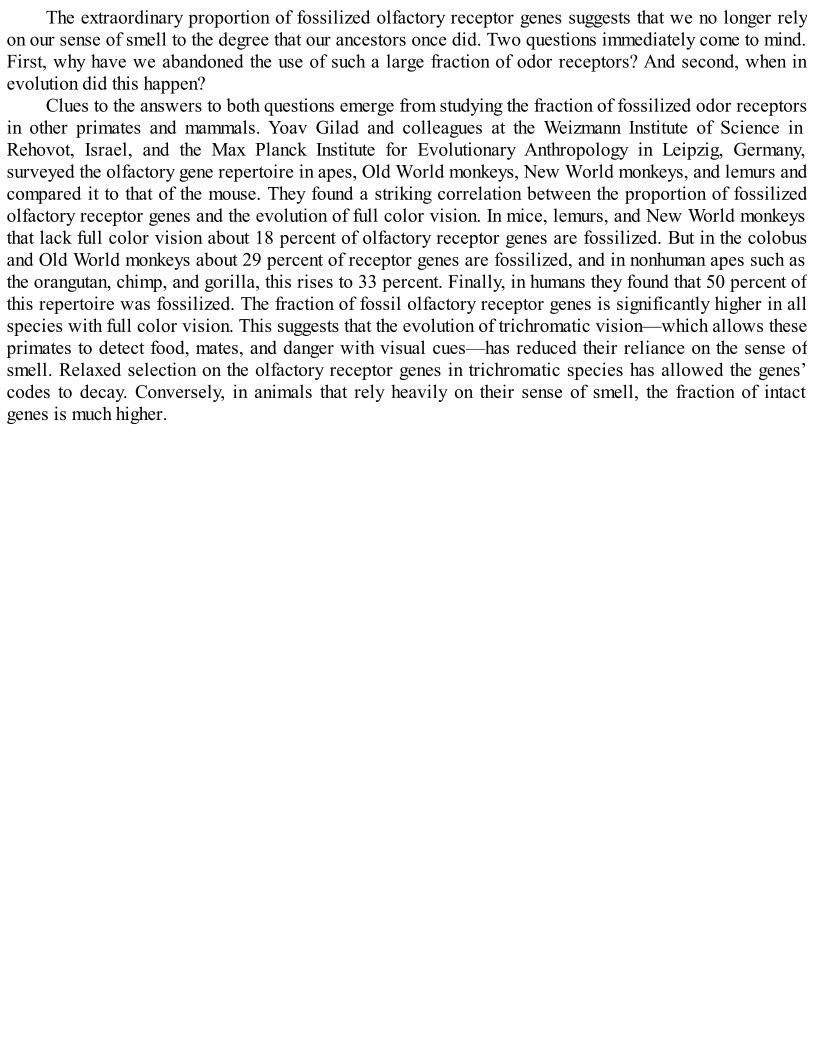
The extraordinary proportion of fossilized olfactory receptor genes suggests that we no longer relyon our sense of smell to the degree that our ancestors once did. Two questions immediately come to mind.First, why have we abandoned the use of such a large fraction of odor receptors? And second, when inevolution did this happen?
Clues to the answers to both questions emerge from studying the fraction of fossilized odor receptorsin other primates and mammals. Yoav Gilad and colleagues at the Weizmann Institute of Science inRehovot, Israel, and the Max Planck Institute for Evolutionary Anthropology in Leipzig, Germany,surveyed the olfactory gene repertoire in apes, Old World monkeys, New World monkeys, and lemurs andcompared it to that of the mouse. They found a striking correlation between the proportion of fossilizedolfactory receptor genes and the evolution of full color vision. In mice, lemurs, and New World monkeysthat lack full color vision about 18 percent of olfactory receptor genes are fossilized. But in the colobusand Old World monkeys about 29 percent of receptor genes are fossilized, and in nonhuman apes such asthe orangutan, chimp, and gorilla, this rises to 33 percent. Finally, in humans they found that 50 percent ofthis repertoire was fossilized. The fraction of fossil olfactory receptor genes is significantly higher in allspecies with full color vision. This suggests that the evolution of trichromatic vision—which allows theseprimates to detect food, mates, and danger with visual cues—has reduced their reliance on the sense ofsmell. Relaxed selection on the olfactory receptor genes in trichromatic species has allowed the genes’codes to decay. Conversely, in animals that rely heavily on their sense of smell, the fraction of intactgenes is much higher.

A Juvenile icefish. The transparent appearance is due to evolutionary loss of scales and red bloodcells. (Photograph by Flip Micklin.)

B Adult mackeral icefish, Champsocephalus gunnari.
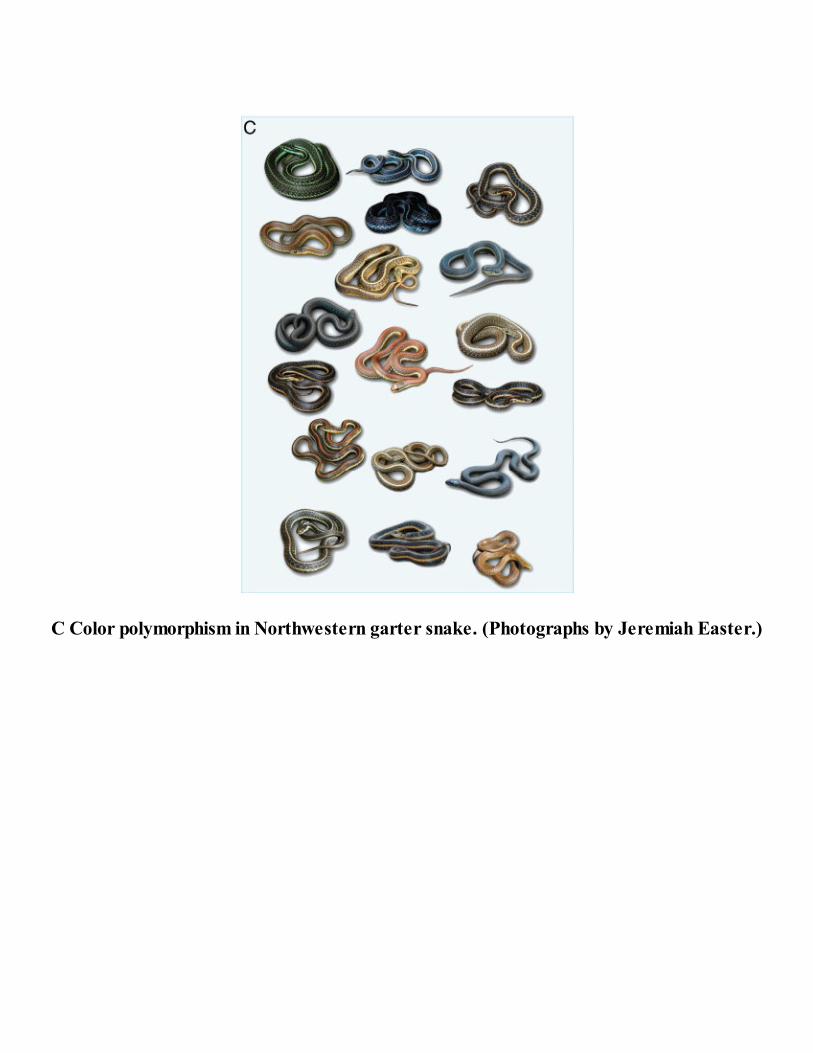
C Color polymorphism in Northwestern garter snake. (Photographs by Jeremiah Easter.)
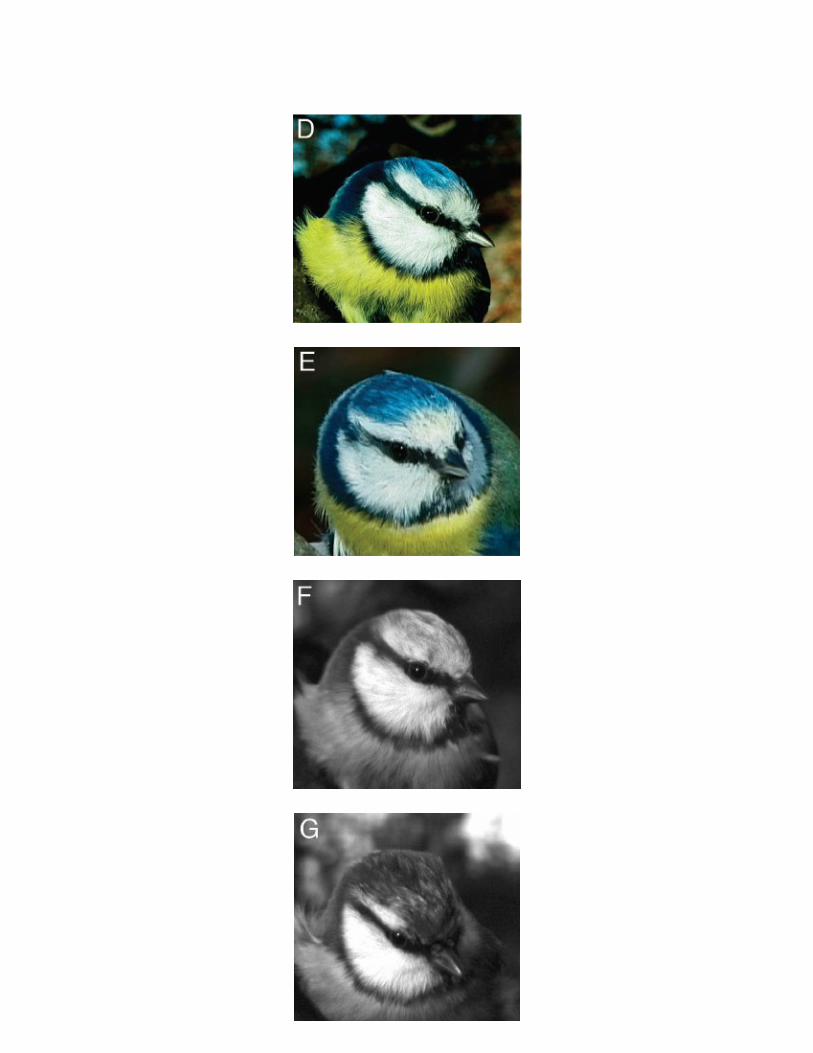

D-G UV-reflecting feathers in the blue tit.
D, F Male blue tit as seen in visible (D) and ultraviolet (F) light. Note that the blue crown patch ishighly reflective in the UV. (Photographs courtesy of Staffan Andersson, University of Goteborg,
Sweden.)
E, G Application of UV-filtering sunscreen has no effect on blue patch in visible light (E) but blocksUV reflectance of the blue crown (G), and reduces male mating success. (Photographs courtesy of
Staffan Andersson, University of Goteborg, Sweden.)
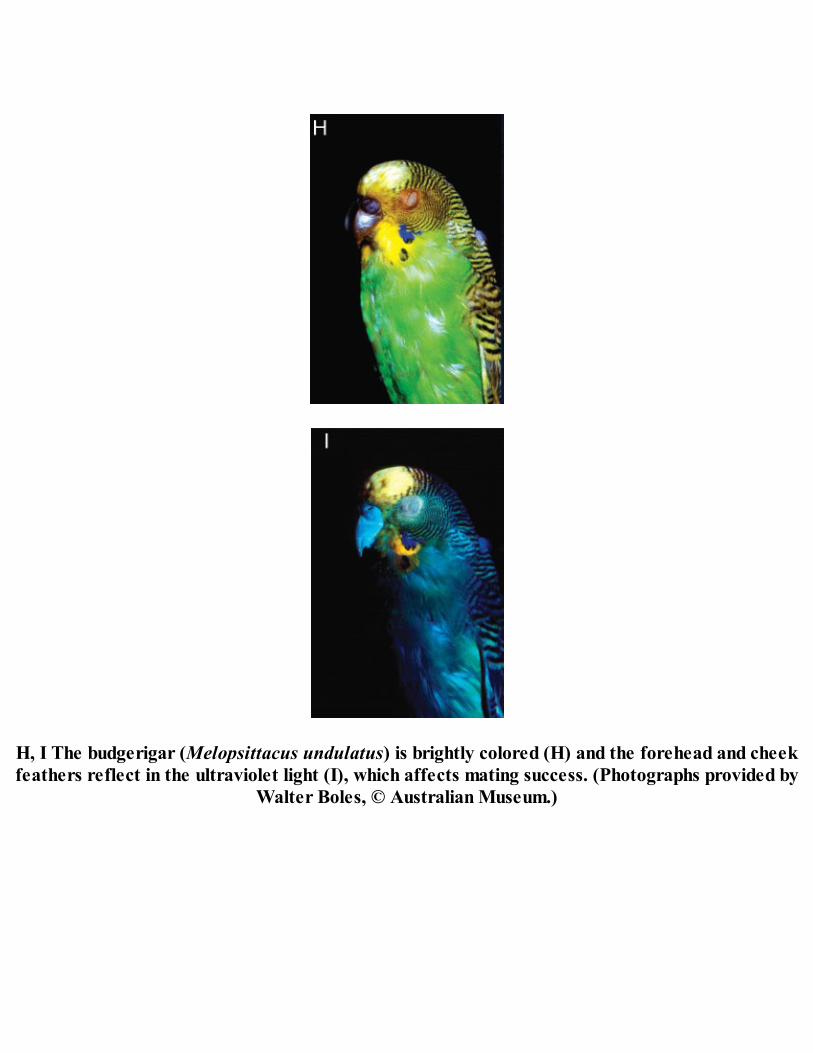
H, I The budgerigar (Melopsittacus undulatus) is brightly colored (H) and the forehead and cheekfeathers reflect in the ultraviolet light (I), which affects mating success. (Photographs provided by
Walter Boles, © Australian Museum.)
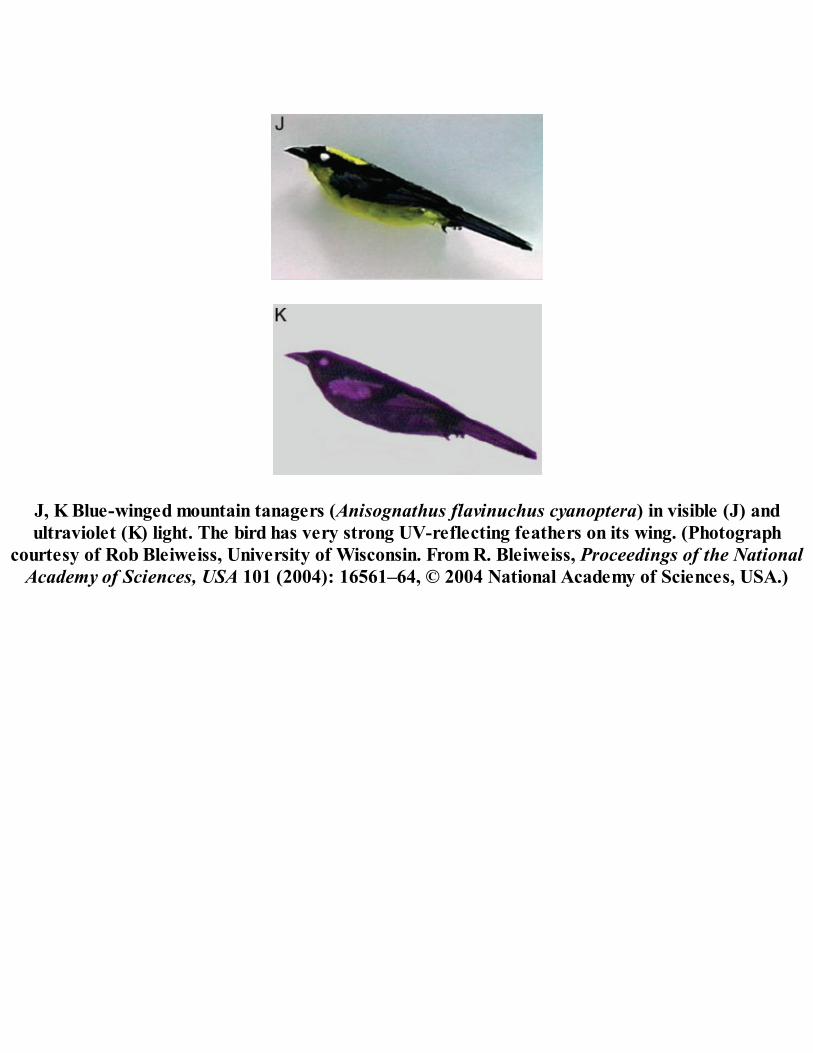
J, K Blue-winged mountain tanagers (Anisognathus flavinuchus cyanoptera) in visible (J) andultraviolet (K) light. The bird has very strong UV-reflecting feathers on its wing. (Photograph
courtesy of Rob Bleiweiss, University of Wisconsin. From R. Bleiweiss, Proceedings of the NationalAcademy of Sciences, USA 101 (2004): 16561–64, © 2004 National Academy of Sciences, USA.)
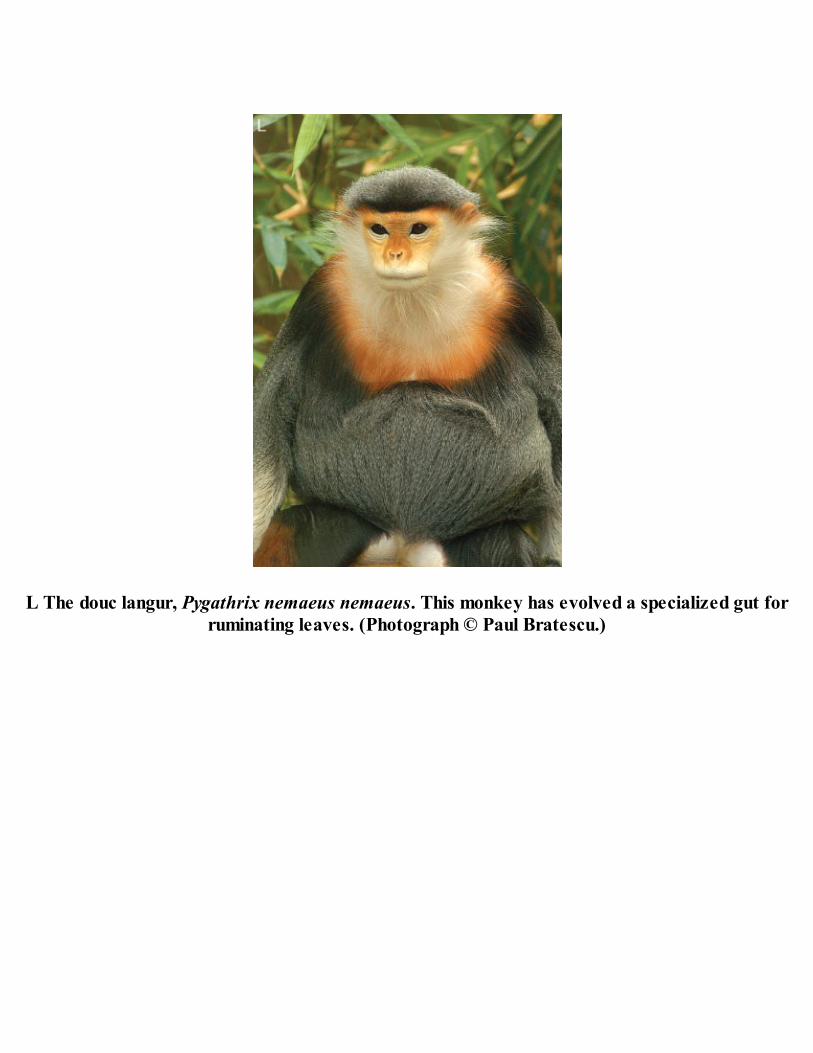
L The douc langur, Pygathrix nemaeus nemaeus. This monkey has evolved a specialized gut forruminating leaves. (Photograph © Paul Bratescu.)

M The white form of the lesser snow goose. (Photograph by Frans Lanting.)

N The melanic “blue” form of the lesser snow goose. The color difference between the blue andwhite forms is determined by the MC1R gene. (Photograph by Thomas Mangelson.)

O The arctic skua is found in both melanic (left) and lighter forms (right). The difference betweenthe two forms is determined by the MC1R gene. (Photograph by Torbjörn Persson.)
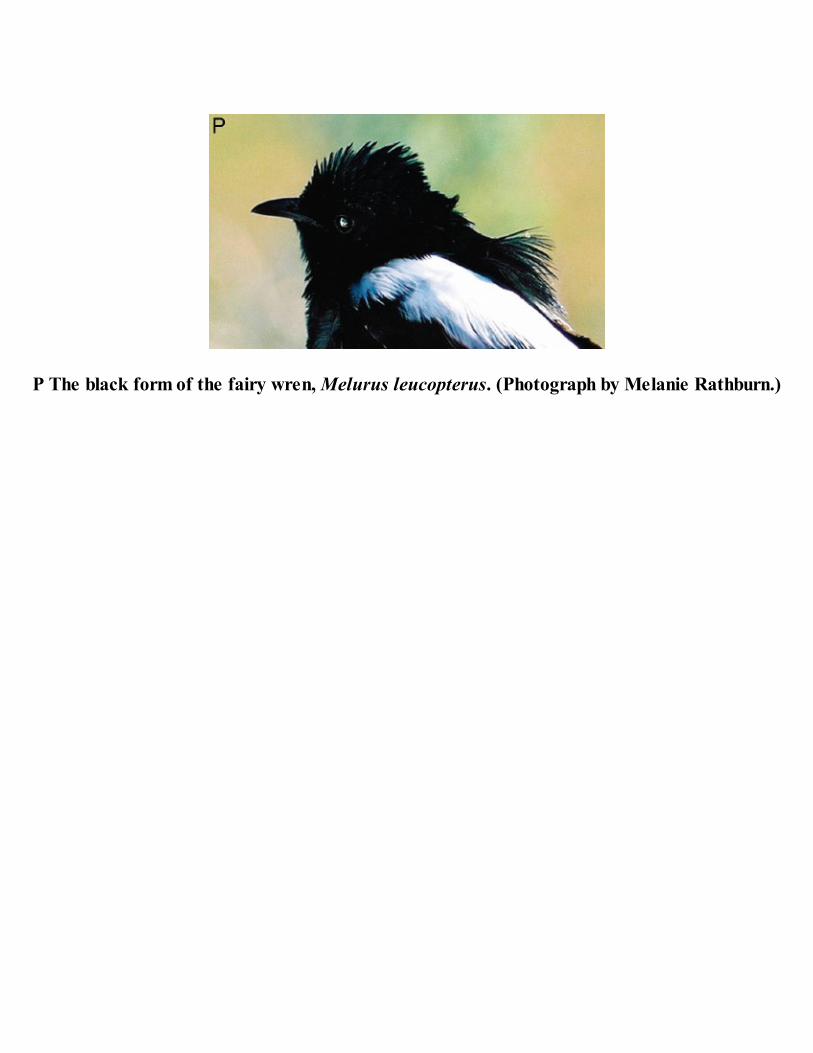
P The black form of the fairy wren, Melurus leucopterus. (Photograph by Melanie Rathburn.)
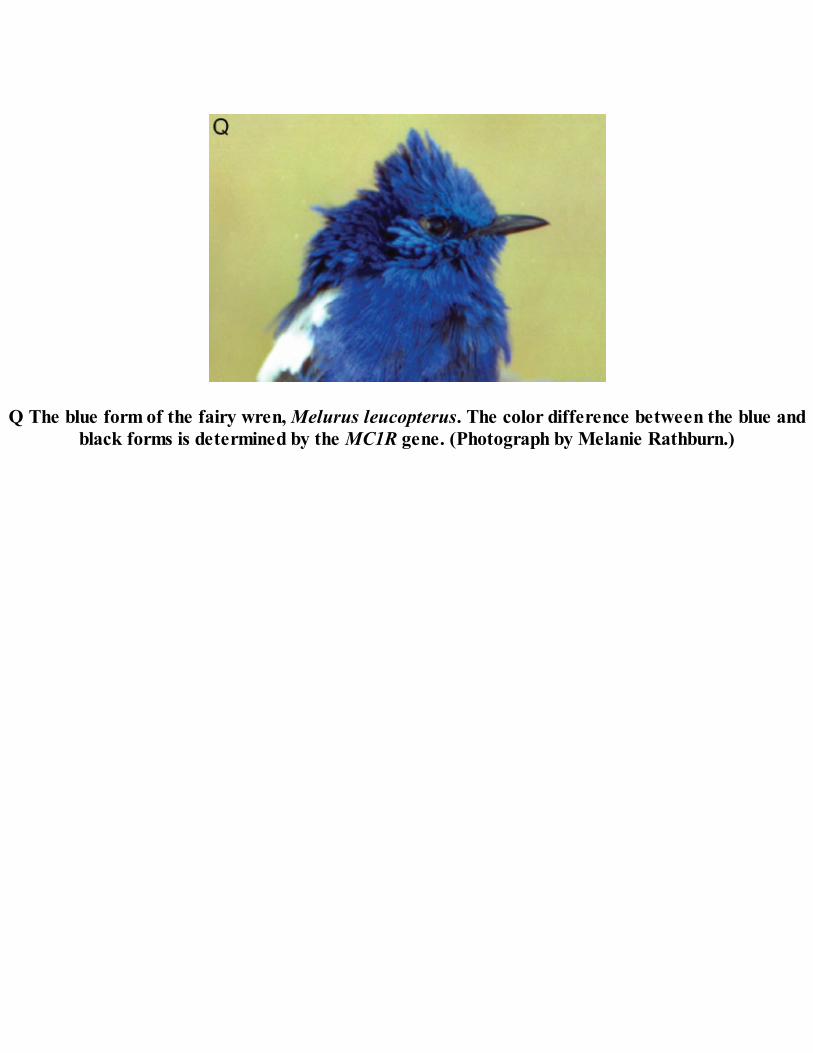
Q The blue form of the fairy wren, Melurus leucopterus. The color difference between the blue andblack forms is determined by the MC1R gene. (Photograph by Melanie Rathburn.)
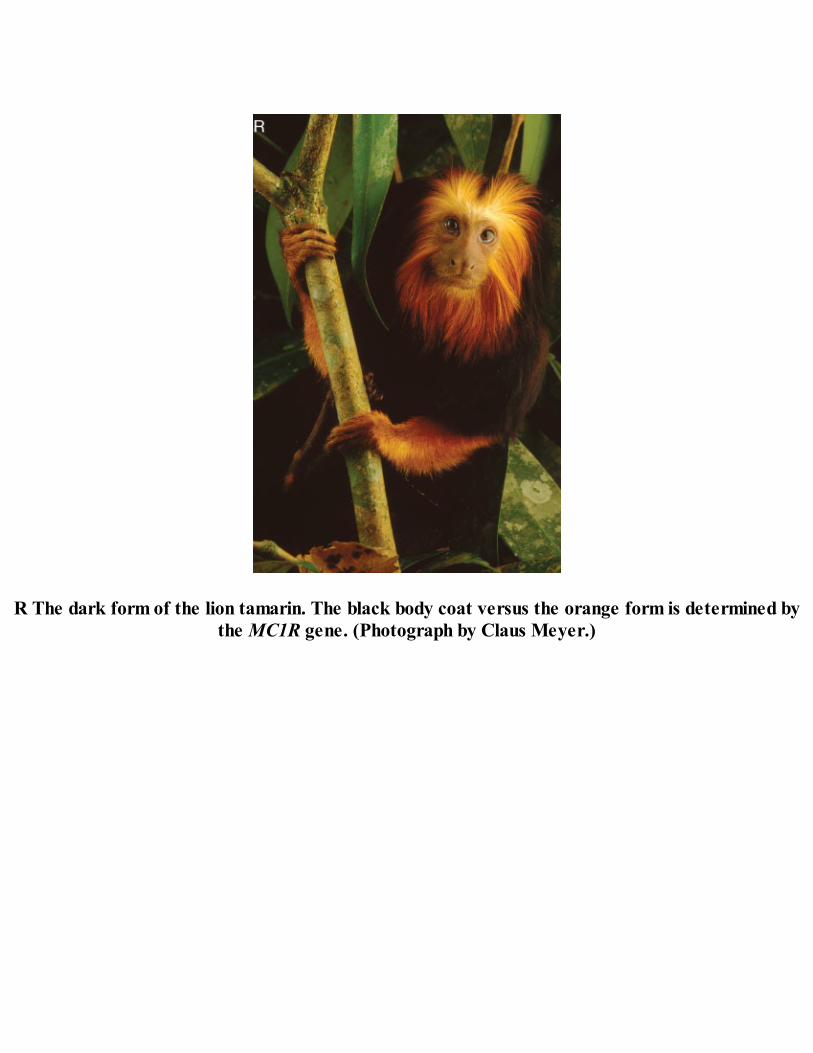
R The dark form of the lion tamarin. The black body coat versus the orange form is determined bythe MC1R gene. (Photograph by Claus Meyer.)
There are other physical, behavioral, and genetic signs of this reduced reliance on the sense of smell
in humans and other primates. The vomeronasal organ, a cigar-shaped sensory organ located toward thefront of the nasal cavity, detects pheromones in most land vertebrates. But this again is greatly reduced inhumans and higher primates in comparison with other species. The V1r receptors I mentioned above playa critical role in pheromone detection. So it appears that we are also less reliant on pheromones thanother mammals, again perhaps because our ancestors relied more on visual signals in mating and otherbehaviors.
Because the vomeronasal organ and V1r receptors are so reduced in humans and other higherprimates, we might also predict that other machinery involved in the transmission of information from theolfactory system would degenerate. This is exactly the case. Another gene that plays a specific role invomeronasal organ function is called TRPC2 and encodes a protein that regulates the trafficking of ions insensory cells. In mice, TRPC2 is fully functional and required for normal behaviors in response topheromones. But in humans, and all of the higher primates with trichromatic vision and larger numbers offossilized olfactory receptors, the TRPC2 gene contains a bunch of mutations that have rendered it a fossilgene.
The fact that different kinds of genes with different jobs in the nose are fossilized is a very strikingand satisfying fulfillment of the prediction about the effect of relaxed selection on species traits. That is,when an entire organ or process falls into disuse, different genes responsible for different steps in aprocess may all experience relaxed selection and then undergo fossilization. The evolution of thevomeronasal organ and parts of its machinery raises the possibility that whole pathways of genes maybecome dispensable, decay, and eventually disappear. This is exactly what we see happening in somespecies, sometimes on a massive scale. I’ll describe two examples from other kingdoms that vividlyillustrate how evolution throws away what is no longer useful.
Use It or Lose It
Yeasts and other fungi play important roles in human affairs. We use yeasts to ferment beer and wine andin bread-making, while fungi were the source of the first antibiotics. Because it is so easy to culture, thebaker’s and brewer’s yeast Saccharomyces cerevisiae has been a favorite laboratory organism for manyyears. Through experiments with yeast, much has been learned about how cells grow and divide, howgenes are used, and the biochemistry of life.
But there are many more yeast species than just good old baker’s yeast. Under the microscope mostof them look very similar. However, there are often detectable differences in species’ abilities tometabolize nutrients and to grow in different environments. The breakdown of many nutrients into theiruseful components often occurs through a sequence of steps, or a pathway. One of the best studied nutrientpathways in any living organism is the galactose pathway of baker’s yeast. Most organisms use the sugarglucose as an energy source. When it is not available, either stored sugars (starches) or alternatives mustbe used. Baker’s yeast can utilize the sugar galactose as an alternative source because it can convertgalactose into a usable form of glucose through a series of enzymatic steps. These steps require fourdifferent enzymes, encoded by four different genes. Furthermore, to ensure that the yeast makes theseenzymes only when they are needed and galactose is available, three other proteins control the making of
the enzymes. Altogether then, seven genes are devoted to running the galactose pathway in baker’s yeast.Most close relatives of baker’s yeast can also utilize galactose, except for one. This species,
Saccharomyces kudriavzevii (try saying that quickly several times), was discovered on decaying leavesin Japan, unlike the sugar-rich places where most other yeast species live in the field. When my graduatestudent Chris Hittinger looked at S. kudriavzevii’s seven genes of the galactose pathway, he quickly foundout why this species can’t utilize galactose—each gene was shot to hell. Each of the seven genes hadvarious-sized chunks of code missing that obliterated the integrity of their text.
There is a very striking contrast between the state of the seven galactose genes and their immediateneighbors in the S. kudriavzevii DNA. The neighboring genes are perfectly intact, just as they are inbaker’s yeast and other related species. If one thinks of each gene’s code as about one large paragraph oftext, the text of each galactose gene’s code in S. kudriavzevii is obliterated in many places, but thepreceding and following paragraphs encoding other genes are untouched. This pattern reveals howexquisitely specific the fossilization of genes is. A gene that is no longer needed or used accumulatesmany mutations, while the codes of neighboring genes that are used are perfectly maintained. The fate ofgenes in S. kudriavzevii demonstrates how natural selection maintains what is needed, but it cannotmaintain what is no longer needed. This species adapted to living on other sugar sources, and itsgalactose pathway was no longer needed and fell into disuse. Without the constant surveillance of naturalselection to purge the galactose genes of inactivating mutations, the genes fossilized and are well on theirway to being erased.
The selective decay of seven functionally related genes is a great example of how a substantialnumber of genes are abandoned by the relaxation of natural selection, but it pales in comparison to whathas happened in some other microbes, such as the species Mycobacterium leprae, the pathogenresponsible for the disease leprosy.
Sequencing of the M. leprae genome revealed that it contains about 1600 functional genes, andalmost 1100 fossil genes—an enormous fraction of dead genes, and far greater than that of any otherknown species. M. leprae is closely related to M. tuberculosis, the species responsible for pulmonarytuberculosis. But M. tuberculosis has about 4000 intact, functional genes and only about 6 fossil genes.The difference between the two species reveals that M. leprae has fossilized or lost about 2000 genes inthe course of its evolution. What explains the vast difference in the numbers of functional and fossil genesbetween the two organisms?
M. leprae has a very different lifestyle from its cousin. It can live only within cells of its host. Itresides within cells called macrophages and infects cells of the peripheral nervous system, whoseeventual destruction leads to the physical disfigurement typical of the disease. It is the slowest-growingbacteria of all known species (it takes about two weeks to divide, while the E. coli in our gut can divideevery twenty minutes). Despite decades of effort, it has never been grown on its own in the laboratory.The specialization of living within host cells has allowed M. leprae to rely on the host for manymetabolic processes. With the host cell genes doing much of the work, this has relaxed selection for themaintenance of many M. leprae genes. The massive decay of genes seen in M. leprae has also occurred inother intracellular parasites and pathogens. Species with vastly reduced numbers of functional genesdemonstrate that a large fraction of all genes can become dispensable upon shifts in organisms’ lifestyles.
The fossilization of individual genes, sets of genes in pathways, or larger groups of genes in specieshas important consequences for the future evolution of their descendants. Because decaying genesgenerally accumulate multiple defects, their inactivation cannot be easily reversed. This means that theloss of gene functions is generally a one-way street. Once gone, these functions will not return. Just asnew species of icefish will not have or use hemoglobin, species that evolve from S. kudriavzevii will notbe able to use galactose. Gene fossilization and loss imposes constraints on the future direction ofevolution in lineages.

“Use it or lose it” is an absolute rule imposed by the fact that surveillance by natural selection actsonly in the present—it cannot plan for the future. The downside to this rule is that if circumstances change,even over long periods of time, species that have lost particular genes will not have those genes availableto adapt to new circumstances. This may be an important factor in the success or extinction of species.Keep in mind that biologists think that over 99 percent of all species that ever existed are now extinct.
Cause or Effect?
The prevalence of fossil genes offers powerful new means of viewing the process of evolution. However,it also raises questions about cause and effect. Is the fossilization of genes a cause of evolutionary changebrought about by natural selection, or is fossilization largely an effect—a by-product of natural selectionfor other features? The answer appears to be that it can be either, depending upon the circumstances. Iwill explore this issue with examples of recently evolved fossil genes in a flowering plant and in humansthat are most likely examples of cause and effect, respectively.
In plants, flower colors are often used to attract pollinators, particularly bees or birds. There aremany well-documented cases of evolutionary shifts in pollinator species. It is easy to imagine howchanges in climate or the abundance of pollinators could select for variations in flower colors.Furthermore, because flowers that provide nectar to hummingbirds or bees may be visited by unwelcomepests, there is selection on other structural features of flowers that fine-tune flower anatomy to differentpollinators. For example, bird-pollinated species tend to produce larger amounts of nectar and havenarrow floral tubes while bee-pollinated species produce small amounts of nectar and have broad floraltubes.
In the morning glory genus Ipomoea, the ancestral flower color was blue or purple. This group istypically pollinated by bees, but one species, Ipomoea quamoclit, has red flowers and is pollinated byhummingbirds. The red color appears to be an adaptation for attracting hummingbirds.
The production of red, blue, or purple flower color is determined by an enzymatic pathway inmorning glories. Beginning with a common precursor, different sets of enzymes produce either the blueand purple or the red pigments. Recently, Rebecca Zufall and Mark Rausher at Duke University showedthat the pathway for making blue and purple pigments has degenerated in the red I. quamoclit. Oneenzyme in the blue/purple part of the pathway appears to be completely impaired while a second isaltered such that it can contribute to red but not blue/purple pigment synthesis.
Because the evolution of red flower color is adaptive, and its evolution in the morning glory is mostlikely directly due to changes in these two enzymes, it appears that gene inactivation in this instance is acause of evolution. Natural selection may well have favored the inactivation of the blue/purple-promotingenzymes and the evolution of red coloration, as opposed to the enzymes’ disuse evolving as a by-productof selection for some other trait.
More often, however, gene inactivation and fossilization is likely to be a consequence of relaxedselection on genes, where gene inactivation is among the last in a series of changes that have rendered agene dispensable. This is probably the case for the opsin genes I have described and for a fascinatingcase of gene fossilization that occurred specifically in the human lineage, after our line split off from ourlast common ancestor shared with chimpanzees.
THE HUMAN GENE that was fossilized is called MYH16. In humans there is a two-base deletion in theMYH16 code that disrupts the proper reading of its text (a relevant portion of the text is shown in figure
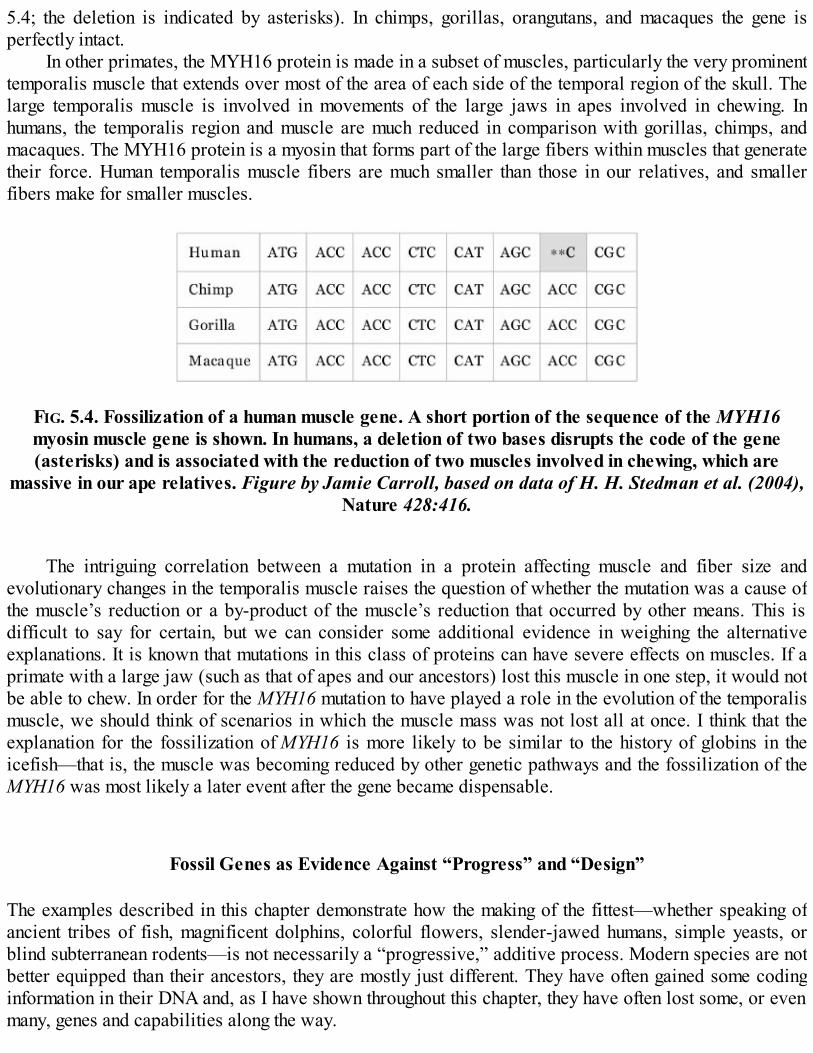
5.4; the deletion is indicated by asterisks). In chimps, gorillas, orangutans, and macaques the gene isperfectly intact.
In other primates, the MYH16 protein is made in a subset of muscles, particularly the very prominenttemporalis muscle that extends over most of the area of each side of the temporal region of the skull. Thelarge temporalis muscle is involved in movements of the large jaws in apes involved in chewing. Inhumans, the temporalis region and muscle are much reduced in comparison with gorillas, chimps, andmacaques. The MYH16 protein is a myosin that forms part of the large fibers within muscles that generatetheir force. Human temporalis muscle fibers are much smaller than those in our relatives, and smallerfibers make for smaller muscles.
FIG. 5.4. Fossilization of a human muscle gene. A short portion of the sequence of the MYH16myosin muscle gene is shown. In humans, a deletion of two bases disrupts the code of the gene(asterisks) and is associated with the reduction of two muscles involved in chewing, which are
massive in our ape relatives. Figure by Jamie Carroll, based on data of H. H. Stedman et al. (2004),Nature 428:416.
The intriguing correlation between a mutation in a protein affecting muscle and fiber size andevolutionary changes in the temporalis muscle raises the question of whether the mutation was a cause ofthe muscle’s reduction or a by-product of the muscle’s reduction that occurred by other means. This isdifficult to say for certain, but we can consider some additional evidence in weighing the alternativeexplanations. It is known that mutations in this class of proteins can have severe effects on muscles. If aprimate with a large jaw (such as that of apes and our ancestors) lost this muscle in one step, it would notbe able to chew. In order for the MYH16 mutation to have played a role in the evolution of the temporalismuscle, we should think of scenarios in which the muscle mass was not lost all at once. I think that theexplanation for the fossilization of MYH16 is more likely to be similar to the history of globins in theicefish—that is, the muscle was becoming reduced by other genetic pathways and the fossilization of theMYH16 was most likely a later event after the gene became dispensable.
Fossil Genes as Evidence Against “Progress” and “Design”
The examples described in this chapter demonstrate how the making of the fittest—whether speaking ofancient tribes of fish, magnificent dolphins, colorful flowers, slender-jawed humans, simple yeasts, orblind subterranean rodents—is not necessarily a “progressive,” additive process. Modern species are notbetter equipped than their ancestors, they are mostly just different. They have often gained some codinginformation in their DNA and, as I have shown throughout this chapter, they have often lost some, or evenmany, genes and capabilities along the way.

The fossilization and loss of genes are powerful arguments against notions of “design” or intent inthe making of species. In the evolution of the leprosy bacterium, for example, we don’t see evidence thatthis pathogen was designed. Rather, we see that the organism is a stripped-down version of amycobacterium, which still carries around over a thousand useless, broken genes that are vestiges of itsancestry. Similarly, we carry around the genetic vestiges of an olfactory system that was once much moreacute than what we have today.
The patterns of gain and loss seen in species’ DNA are exactly what we should expect if naturalselection acts only in the present, and not as an engineer or designer would. Natural selection cannotpreserve what is not being used, and it cannot plan for the future. The fossilization and loss of genes areexactly what is predicted to evolve in the absence of natural selection. Over time, chance mutations willaccumulate, eventually disrupting the text of unused or unnecessary genes.
Furthermore, the repetition of gene fossilization in different ancestors of entirely different groups ofanimals is striking evidence that, when selection is relaxed on a particular trait, the same events willrepeat themselves in DNA. The repetition of the independent fossilization of the SWS opsin genedescribed in this chapter is a profound demonstration of this principle. It is also a foretaste of the broadermessage of the next chapter, about the predictability and reproducibility of evolution in general, and themany amazing instances in which evolution has repeated itself.
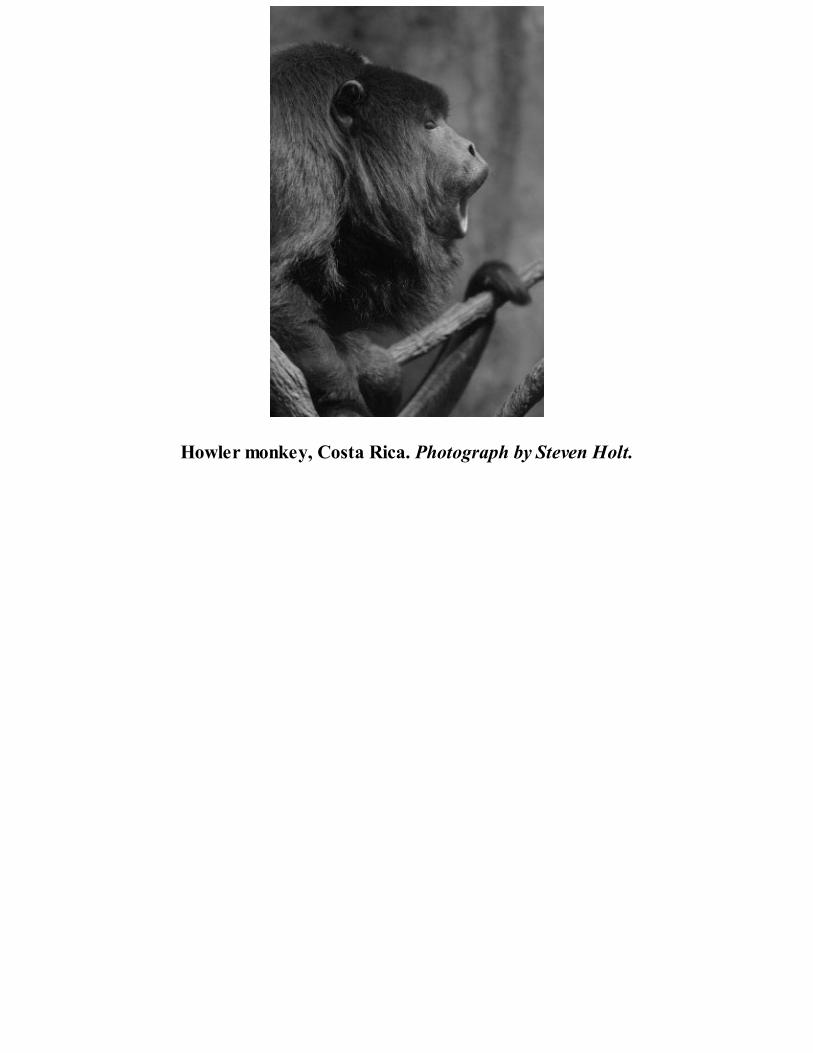
Howler monkey, Costa Rica. Photograph by Steven Holt.

Chapter 6
Déjà Vu: How and Why Evolution Repeats Itself
It is no great wonder if in the long process of time, while fortune takes her course hither andthither, numerous coincidences should spontaneously occur. If the number and variety ofsubjects to be wrought upon be infinite, it is all the more easy for fortune, with such anabundance of material, to effect this similarity of results.
—Plutarch, Life of Sertorius
THE BUSH PLANE FLEW LOW ALONG THE RUGGED, lush green Costa Rican coastline before veering inland tomake a perfect landing on a tiny strip near the Rio Sierpe. We piled into a van and bounced our waythrough palm plantations to the river landing, then hopped aboard a boat and headed downstream. Flankedby thick mangrove jungle as far as the eye could see, the wide river eventually poured into the openPacific Ocean. Pounding through rough surf at the river’s mouth, we landed on a beach at the edge ofCorcovado National Park on the Osa peninsula, one of the last remaining large tracts of wilderness inCentral America. After the long, spectacular journey we were completely exhausted and settled down forthe night in the quiet of the rain forest.
Our well-earned slumber was shattered by the “dawn chorus”—the loud, low throaty calls of araucous troop of howler monkeys cavorting overhead in the canopy. So much for the tranquillity ofNature.
Audible for up to three miles, the howlers have enlarged throats and extralarge voice boxes thatenable them to broadcast their location to nearby, and not so nearby, troops (and tourists). The howler’scall is unique, but the monkey has another attribute that sets it apart from the capuchin and squirrelmonkeys, and all other New World monkeys with whom it shares the rain forest. The howler monkey hasfull trichromatic color vision.
We know from howler DNA that it acquired this sense in a similar way as its more distant OldWorld relatives, but at a different time in an entirely independent series of events. And what’s more, thehowlers feed on various sorts of tender young leaves, just as other trichromatic primates do. Theindependent repetition of monkey evolution does not end with these traits. The howler, like its distantAfrican and Asian cousins, has a higher proportion of fossilized olfactory receptor genes than all of itclosest relatives in the New World. It, too, has traded some of its sense of smell for seeing in color.
Astonishing.The evolution of color vision, leaf-feeding habits, and loss of olfactory genes in howler monkeys
occurred on a different continent, 20 to 25 million years after these traits evolved in the ancestor ofAfrican and Asian monkeys and apes. The natural history of these primates suggests that similarconditions in different parts of the world can favor the gain and loss of similar traits at different times indifferent species.
The howler monkey is a poster species for a pervasive phenomenon in nature called convergentevolution. In all sorts of animals, we see similar traits that evolved as independent inventions. Theflippers of penguins, seals, and dolphins, for example, all serve a similar purpose in swimming, but each
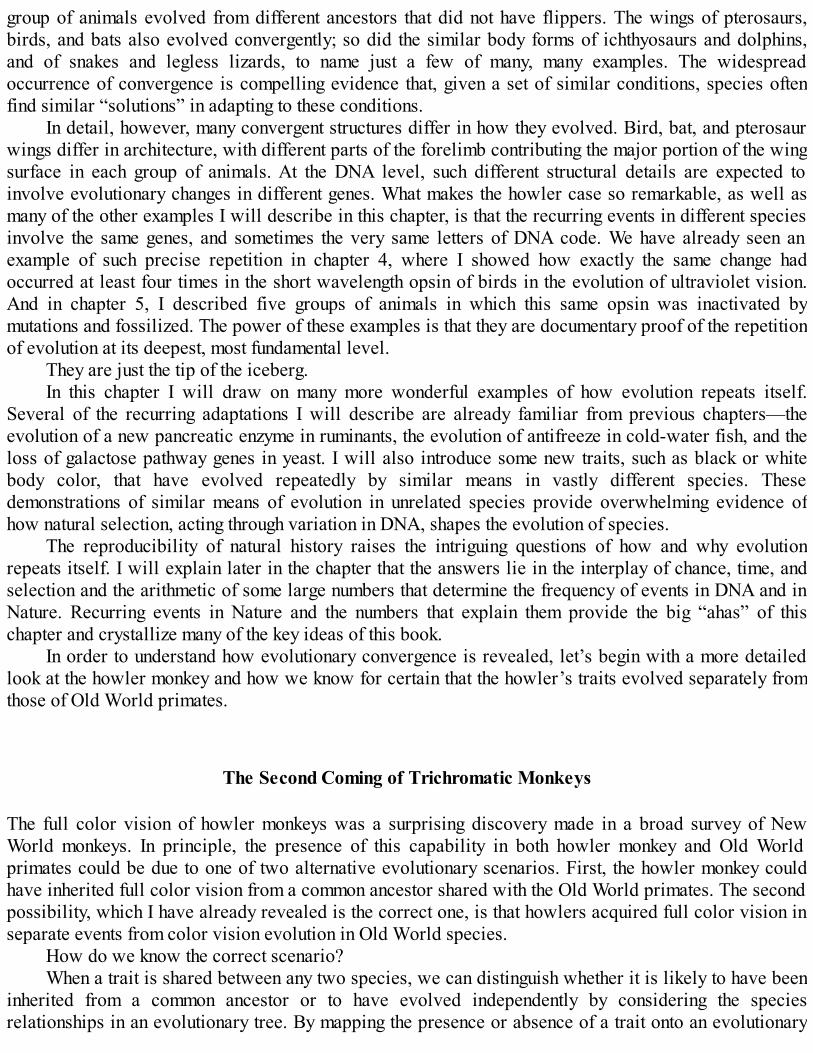
group of animals evolved from different ancestors that did not have flippers. The wings of pterosaurs,birds, and bats also evolved convergently; so did the similar body forms of ichthyosaurs and dolphins,and of snakes and legless lizards, to name just a few of many, many examples. The widespreadoccurrence of convergence is compelling evidence that, given a set of similar conditions, species oftenfind similar “solutions” in adapting to these conditions.
In detail, however, many convergent structures differ in how they evolved. Bird, bat, and pterosaurwings differ in architecture, with different parts of the forelimb contributing the major portion of the wingsurface in each group of animals. At the DNA level, such different structural details are expected toinvolve evolutionary changes in different genes. What makes the howler case so remarkable, as well asmany of the other examples I will describe in this chapter, is that the recurring events in different speciesinvolve the same genes, and sometimes the very same letters of DNA code. We have already seen anexample of such precise repetition in chapter 4, where I showed how exactly the same change hadoccurred at least four times in the short wavelength opsin of birds in the evolution of ultraviolet vision.And in chapter 5, I described five groups of animals in which this same opsin was inactivated bymutations and fossilized. The power of these examples is that they are documentary proof of the repetitionof evolution at its deepest, most fundamental level.
They are just the tip of the iceberg.In this chapter I will draw on many more wonderful examples of how evolution repeats itself.
Several of the recurring adaptations I will describe are already familiar from previous chapters—theevolution of a new pancreatic enzyme in ruminants, the evolution of antifreeze in cold-water fish, and theloss of galactose pathway genes in yeast. I will also introduce some new traits, such as black or whitebody color, that have evolved repeatedly by similar means in vastly different species. Thesedemonstrations of similar means of evolution in unrelated species provide overwhelming evidence ofhow natural selection, acting through variation in DNA, shapes the evolution of species.
The reproducibility of natural history raises the intriguing questions of how and why evolutionrepeats itself. I will explain later in the chapter that the answers lie in the interplay of chance, time, andselection and the arithmetic of some large numbers that determine the frequency of events in DNA and inNature. Recurring events in Nature and the numbers that explain them provide the big “ahas” of thischapter and crystallize many of the key ideas of this book.
In order to understand how evolutionary convergence is revealed, let’s begin with a more detailedlook at the howler monkey and how we know for certain that the howler’s traits evolved separately fromthose of Old World primates.
The Second Coming of Trichromatic Monkeys
The full color vision of howler monkeys was a surprising discovery made in a broad survey of NewWorld monkeys. In principle, the presence of this capability in both howler monkey and Old Worldprimates could be due to one of two alternative evolutionary scenarios. First, the howler monkey couldhave inherited full color vision from a common ancestor shared with the Old World primates. The secondpossibility, which I have already revealed is the correct one, is that howlers acquired full color vision inseparate events from color vision evolution in Old World species.
How do we know the correct scenario?When a trait is shared between any two species, we can distinguish whether it is likely to have been
inherited from a common ancestor or to have evolved independently by considering the speciesrelationships in an evolutionary tree. By mapping the presence or absence of a trait onto an evolutionary
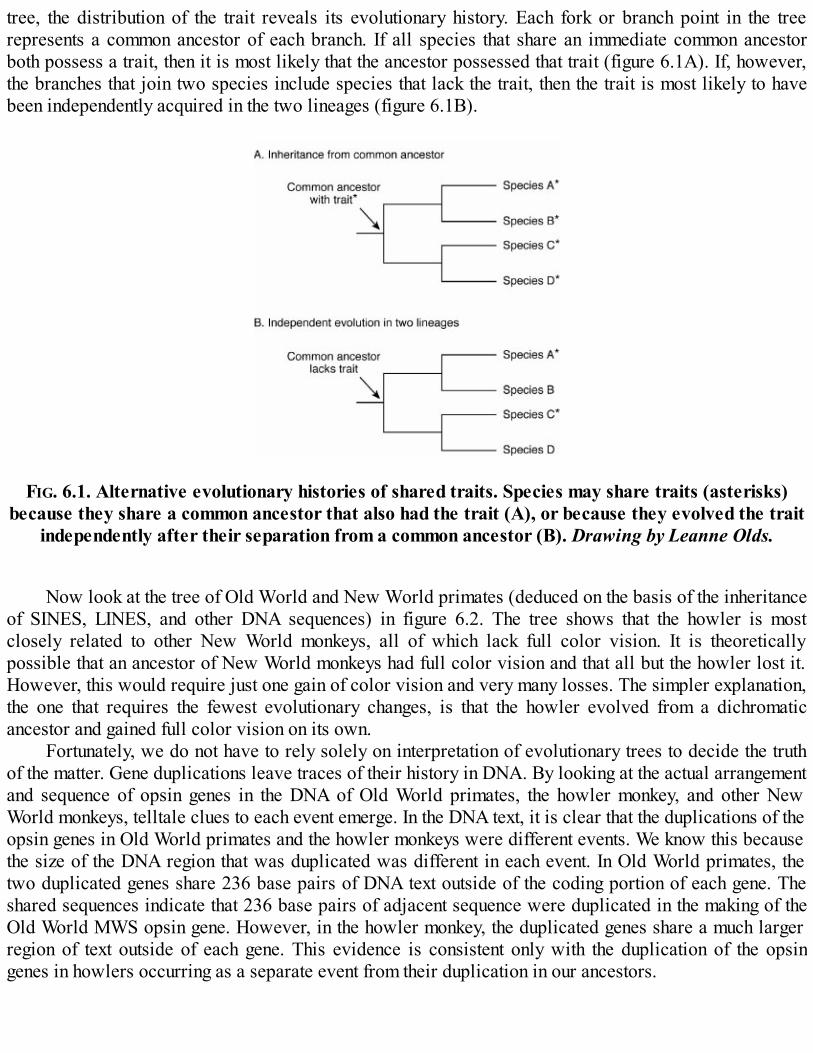
tree, the distribution of the trait reveals its evolutionary history. Each fork or branch point in the treerepresents a common ancestor of each branch. If all species that share an immediate common ancestorboth possess a trait, then it is most likely that the ancestor possessed that trait (figure 6.1A). If, however,the branches that join two species include species that lack the trait, then the trait is most likely to havebeen independently acquired in the two lineages (figure 6.1B).
FIG. 6.1. Alternative evolutionary histories of shared traits. Species may share traits (asterisks)because they share a common ancestor that also had the trait (A), or because they evolved the trait
independently after their separation from a common ancestor (B). Drawing by Leanne Olds.
Now look at the tree of Old World and New World primates (deduced on the basis of the inheritanceof SINES, LINES, and other DNA sequences) in figure 6.2. The tree shows that the howler is mostclosely related to other New World monkeys, all of which lack full color vision. It is theoreticallypossible that an ancestor of New World monkeys had full color vision and that all but the howler lost it.However, this would require just one gain of color vision and very many losses. The simpler explanation,the one that requires the fewest evolutionary changes, is that the howler evolved from a dichromaticancestor and gained full color vision on its own.
Fortunately, we do not have to rely solely on interpretation of evolutionary trees to decide the truthof the matter. Gene duplications leave traces of their history in DNA. By looking at the actual arrangementand sequence of opsin genes in the DNA of Old World primates, the howler monkey, and other NewWorld monkeys, telltale clues to each event emerge. In the DNA text, it is clear that the duplications of theopsin genes in Old World primates and the howler monkeys were different events. We know this becausethe size of the DNA region that was duplicated was different in each event. In Old World primates, thetwo duplicated genes share 236 base pairs of DNA text outside of the coding portion of each gene. Theshared sequences indicate that 236 base pairs of adjacent sequence were duplicated in the making of theOld World MWS opsin gene. However, in the howler monkey, the duplicated genes share a much largerregion of text outside of each gene. This evidence is consistent only with the duplication of the opsingenes in howlers occurring as a separate event from their duplication in our ancestors.
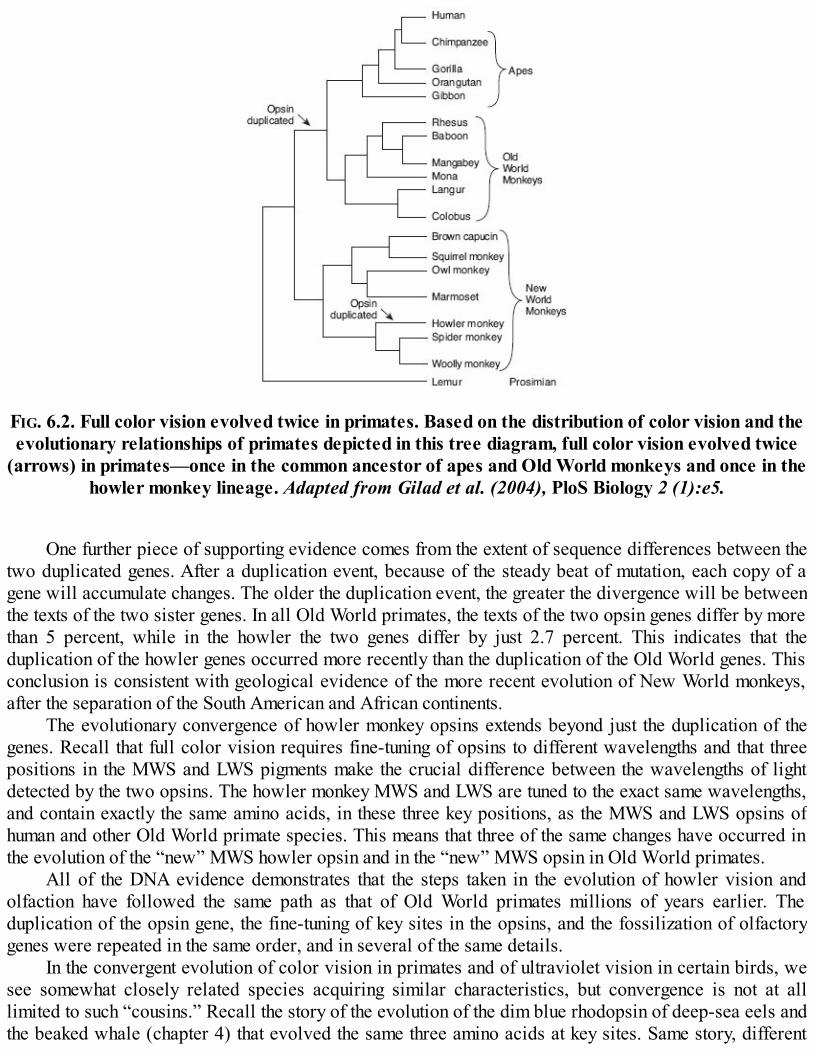
FIG. 6.2. Full color vision evolved twice in primates. Based on the distribution of color vision and theevolutionary relationships of primates depicted in this tree diagram, full color vision evolved twice
(arrows) in primates—once in the common ancestor of apes and Old World monkeys and once in thehowler monkey lineage. Adapted from Gilad et al. (2004), PloS Biology 2 (1):e5.
One further piece of supporting evidence comes from the extent of sequence differences between thetwo duplicated genes. After a duplication event, because of the steady beat of mutation, each copy of agene will accumulate changes. The older the duplication event, the greater the divergence will be betweenthe texts of the two sister genes. In all Old World primates, the texts of the two opsin genes differ by morethan 5 percent, while in the howler the two genes differ by just 2.7 percent. This indicates that theduplication of the howler genes occurred more recently than the duplication of the Old World genes. Thisconclusion is consistent with geological evidence of the more recent evolution of New World monkeys,after the separation of the South American and African continents.
The evolutionary convergence of howler monkey opsins extends beyond just the duplication of thegenes. Recall that full color vision requires fine-tuning of opsins to different wavelengths and that threepositions in the MWS and LWS pigments make the crucial difference between the wavelengths of lightdetected by the two opsins. The howler monkey MWS and LWS are tuned to the exact same wavelengths,and contain exactly the same amino acids, in these three key positions, as the MWS and LWS opsins ofhuman and other Old World primate species. This means that three of the same changes have occurred inthe evolution of the “new” MWS howler opsin and in the “new” MWS opsin in Old World primates.
All of the DNA evidence demonstrates that the steps taken in the evolution of howler vision andolfaction have followed the same path as that of Old World primates millions of years earlier. Theduplication of the opsin gene, the fine-tuning of key sites in the opsins, and the fossilization of olfactorygenes were repeated in the same order, and in several of the same details.
In the convergent evolution of color vision in primates and of ultraviolet vision in certain birds, wesee somewhat closely related species acquiring similar characteristics, but convergence is not at alllimited to such “cousins.” Recall the story of the evolution of the dim blue rhodopsin of deep-sea eels andthe beaked whale (chapter 4) that evolved the same three amino acids at key sites. Same story, different
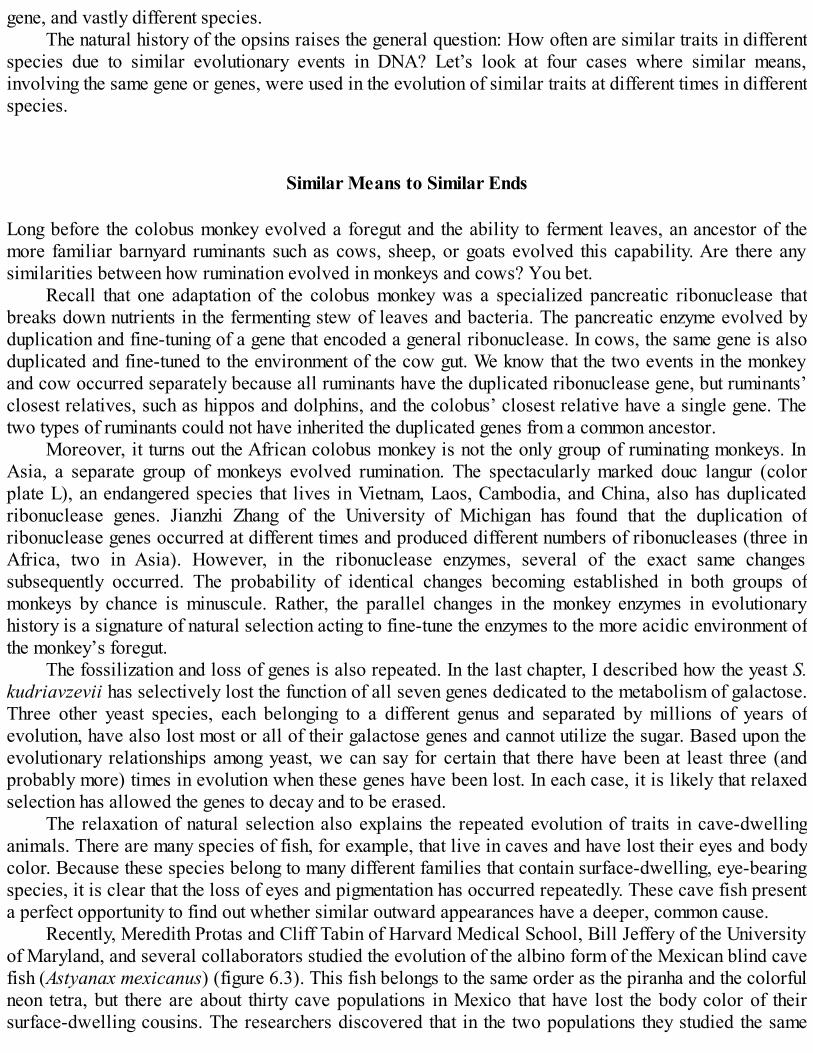
gene, and vastly different species.The natural history of the opsins raises the general question: How often are similar traits in different
species due to similar evolutionary events in DNA? Let’s look at four cases where similar means,involving the same gene or genes, were used in the evolution of similar traits at different times in differentspecies.
Similar Means to Similar Ends
Long before the colobus monkey evolved a foregut and the ability to ferment leaves, an ancestor of themore familiar barnyard ruminants such as cows, sheep, or goats evolved this capability. Are there anysimilarities between how rumination evolved in monkeys and cows? You bet.
Recall that one adaptation of the colobus monkey was a specialized pancreatic ribonuclease thatbreaks down nutrients in the fermenting stew of leaves and bacteria. The pancreatic enzyme evolved byduplication and fine-tuning of a gene that encoded a general ribonuclease. In cows, the same gene is alsoduplicated and fine-tuned to the environment of the cow gut. We know that the two events in the monkeyand cow occurred separately because all ruminants have the duplicated ribonuclease gene, but ruminants’closest relatives, such as hippos and dolphins, and the colobus’ closest relative have a single gene. Thetwo types of ruminants could not have inherited the duplicated genes from a common ancestor.
Moreover, it turns out the African colobus monkey is not the only group of ruminating monkeys. InAsia, a separate group of monkeys evolved rumination. The spectacularly marked douc langur (colorplate L), an endangered species that lives in Vietnam, Laos, Cambodia, and China, also has duplicatedribonuclease genes. Jianzhi Zhang of the University of Michigan has found that the duplication ofribonuclease genes occurred at different times and produced different numbers of ribonucleases (three inAfrica, two in Asia). However, in the ribonuclease enzymes, several of the exact same changessubsequently occurred. The probability of identical changes becoming established in both groups ofmonkeys by chance is minuscule. Rather, the parallel changes in the monkey enzymes in evolutionaryhistory is a signature of natural selection acting to fine-tune the enzymes to the more acidic environment ofthe monkey’s foregut.
The fossilization and loss of genes is also repeated. In the last chapter, I described how the yeast S.kudriavzevii has selectively lost the function of all seven genes dedicated to the metabolism of galactose.Three other yeast species, each belonging to a different genus and separated by millions of years ofevolution, have also lost most or all of their galactose genes and cannot utilize the sugar. Based upon theevolutionary relationships among yeast, we can say for certain that there have been at least three (andprobably more) times in evolution when these genes have been lost. In each case, it is likely that relaxedselection has allowed the genes to decay and to be erased.
The relaxation of natural selection also explains the repeated evolution of traits in cave-dwellinganimals. There are many species of fish, for example, that live in caves and have lost their eyes and bodycolor. Because these species belong to many different families that contain surface-dwelling, eye-bearingspecies, it is clear that the loss of eyes and pigmentation has occurred repeatedly. These cave fish presenta perfect opportunity to find out whether similar outward appearances have a deeper, common cause.
Recently, Meredith Protas and Cliff Tabin of Harvard Medical School, Bill Jeffery of the Universityof Maryland, and several collaborators studied the evolution of the albino form of the Mexican blind cavefish (Astyanax mexicanus) (figure 6.3). This fish belongs to the same order as the piranha and the colorfulneon tetra, but there are about thirty cave populations in Mexico that have lost the body color of theirsurface-dwelling cousins. The researchers discovered that in the two populations they studied the same
pigmentation gene was inactivated by a deletion of DNA text, but that the exact deletion was different ineach population. This is definitive evidence that the different cave populations lost their colorindependently.
FIG. 6.3. The evolution of albinism in blind cave fish. While surface forms of the fish Astyanaxmexicanus appear normal, cave populations of the fish have repeatedly evolved blindness and
albinism, such as the two forms shown here from Molino and Pachon caves, through mutations in thesame gene. Photographs courtesy of Meredith Protas and Cliff Tabin, Harvard Medical School.
Albinism in cave fish is most easily explained by the relaxation of natural selection on body color;in the dark who cares what you look like? But in many other animals body color is important in matechoice, predator evasion, and other behaviors affected by sexual or natural selection. One of the mostcommon body colors is black. Many species have some black coloration of their fur, scales, or feathers.Variation within species is also common, where either the different sexes or different populations vary inthe amount of black coloration. In many cases, natural selection or sexual selection has operated on thesame gene involved in vertebrate body color.
For example, lesser snow geese may be either white or “blue” the latter appears so because of blackpigment in their feathers (color plates M and N). The distribution of geese colors varies across theirrange, with blue individuals most common in eastern Canada and white individuals most common in thewestern part of their range, in eastern Siberia. The differences in color are important in mate choice.Young snow geese learn their parent’s color at an early age and later prefer to mate with individuals ofthe same color. A single genetic difference is responsible for the two types. The gene responsible iscalled the melanocortin-1 receptor, or MC1R for short. The white snow geese MC1R gene differs fromthat of the blue snow geese at just the one triplet that encodes amino acid 85.
In other birds, variation in the sequence of the MC1R gene is also perfectly correlated withcoloration. The dark form of the banana-quit has a single change in its MC1R gene that differentiates itfrom yellow birds. This single change is in a different position in the gene than the position that
determines the white/blue color of snow geese. It is also different from the position that determines thelight versus dark color of a third bird species, the arctic skua (plate O). In arctic skuas, too, plumagecolor affects mate choice and is under sexual selection. The dramatic color differences of the fairy wrenare also determined by MC1R (plates P and Q).
The role of MC1R in body color evolution extends well beyond birds. Variation in MC1R isresponsible for the difference between the orange and black color phases of the jaguar, the white versusblack forms of the black bear in western North America, light and dark forms of various lizards, as wellas coat color variation in domestic dog, horse, and cat breeds.
One of the best studied examples of the MC1R gene’s role in evolution in the wild is in the rockpocket mouse of the southwestern deserts of the United States. In chapter 2, I used the known genetics ofMC1R in mice and the evolution of light and dark forms of the pocket mouse to illustrate the interplay ofchance mutations and selection and the timescale of evolution. These mice inhabit sandy desert and blacklava outcrops in Arizona and New Mexico. Their alternate coat colors afford protection against predatorswhen color-matched on different backgrounds. Michael Nachman, Hopi Hoekstra, and collaborators at theUniversity of Arizona have shown that, in the Pinacate region, the dark form of the mouse differs from thelight form at four positions in the MC1R protein. Interestingly, these dark pocket mice have exactly thesame change at position 230 as the arctic skua. Thus, not only is the same gene involved in body colorevolution in certain species of birds, reptiles, and mammals, in some cases the same changes have arisenin the MC1R genes of different kinds of animals.
A second example of such precise repetition involves the jaguarundi and the golden-headed liontamarin. Dark forms of the jaguarundi have a twenty-four-base deletion in their MC1R gene; the samedeletion is present in the golden-headed lion tamarin, whose main body is all black, unlike other liontamarins (plate R).
The evolution of rumination in mammals, galactose use in yeast, albinism in cave fish, and dark bodycolor in various birds, reptiles, and mammals all demonstrate the reproducibility of evolution at thefundamental level of individual genes.
While in the many examples of convergent evolution in the opsins I described, the repetition ofevolution was very often exact to the very same base pair, the changes in the genes involved in these othertraits usually are not quite so precise. Detailed biochemical studies of ribonucleases and the MC1Rreceptor indicate that there are many different sites in each protein that can be changed to produce similarfunctional properties.
The contrast between the exact repetition of opsin evolution and the less precise repetition ofevolution in other proteins underscores the fact that there may be multiple solutions to some evolutionary“problems” (adaptations), and only one or a few solutions to others. The structure of opsins is such thatthe exact amino acid in just a few key sites tunes the wavelengths of the visual pigment. Selection is mosteffective upon these sites. The structure and activity of the ribonuclease and MC1R are moreaccommodating and there are many different ways to change each of their activities. In other words, forsome genes and traits the DNA code does not have to change in precisely the same way to have the samebiological effect.
It also turns out that, for some traits, evolutionary convergence can also arise entirely from differentgenetic starting points.
Different Means to Similar Ends
One of the key inventions of Antarctic fish was antifreeze, which is made up of proteins with an unusual

repeating structure of just three amino acids, usually threonine-alanine-alanine or threonine-proline-alanine. The core repeat arose from part of the code of a digestive enzyme that contained the sequence.The ancestry of the antifreeze could be traced to the enzyme gene by virtue of its noncoding sequences.Because the text immediately adjacent to the antifreeze gene is so strikingly similar to that at the enzymegene, it is clear that antifreeze arose from a piece of DNA encoding part of the enzyme as well as someneighboring code.
Arctic fish also thrive in very cold water and have antifreeze in their bloodstream and tissues. TheArctic antifreeze proteins are also made up of repeating sequences of threonine-alanine-alanine orthreonine-proline-alanine. Surely, the simplest explanation would be that a common ancestor of Antarcticand Arctic fish invented this protein and each group of species inherited their antifreezes from thisancestor.
But, in this case, the similar appearances of the antifreezes are deceiving.The Arctic fish antifreeze evolved in a different way and at a different time from the Antarctic fish
antifreeze. We know this from many pieces of evidence. First, in the fish evolutionary tree, the Antarcticand Arctic groups are distant from each other and belong to different orders. Second, the freezing of theNorth Atlantic and North Pacific oceans occurred much more recently, about 2.5 million years ago,indicating that the driving force for evolution of antifreeze was separate from that in the Southern Ocean,which dropped to freezing temperatures about 10 to 14 million years ago. Of course, the latter fact doesnot rule out the possibility that some Antarctic fish could have migrated north and given rise to Arctictypes. But we can eliminate that scenario based upon the traces of antifreeze origins in DNA.
Two key clues reveal that the Arctic antifreeze had a separate origin. First, there is no trace of anysimilarity to the digestive enzyme gene that was the source of the code for the Antarctic antifreeze.Second, and more decisive, the two antifreezes are produced by entirely different processes. In theAntarctic fish, repeats of threonine-alanine-alanine or threonine-proline-alanine are encoded in multipletracts, which are separated by the sequence leucine-isoleucine-phenylalanine. These spacers are positionswhere the protein is processed into smaller antifreeze peptides. In the Arctic fish, the spacers have anentirely different sequence and are processed by a different enzyme. So, while the antifreeze peptides areincredibly similar, they are produced from proteins with different internal spacers that must have haddifferent origins. The antifreezes are analogues, not homologues.
The explanation for the remarkable convergence in the sequence of the Arctic and Antarcticantifreeze peptides must be natural selection for their performance in preventing ice formation in theanimal. Extensive biochemical studies have shown that the antifreeze peptides work by adsorbing to icecrystals and preventing their growth. These peptides are linked to carbohydrates via their threonines, andthe carbohydrates play a critical role in the interaction with ice crystals. The simple repeat threonine-alanine-alanine appears to be best suited to forming a repeating structure that can interact with the regularrepeating structure of ice crystals. The evolutionary convergence of the Arctic and Antarctic antifreezesillustrates that there was more than one way to generate this repetitive code and a functional antifreeze.
The remarkable similarity of the antifreezes, given their different origins, raises the question ofwhether it is generally true that to have similar functions, molecules must have similar sequences.
To answer that riddle, I am going to propose a little game. Below are the sequences of four smallproteins found in nature. Look carefully at their sequences (shown using the single-letter abbreviations forthe twenty amino acids).
1. VCRDWFKETACRHAKSLGNCRTSQKYRANCAKTCELC2. ZFTNVSCTTSKECWSVCQRLHNTSRGKCMNKKCRCYS3. CRIONQKCFQHLDDCCSRKCNRFNKCG
4. ZPLRKLCILHRNPGRCYQKIPAFYYNGKKKQCEGFTWSGGCGGNSNRFKTIEECRRTCIRKD
Do any similarities pop out at you?No?Well, don’t feel bad. I don’t see any either, but they do have something in common.Here is a clue to the story. The fourth protein comes from a snake. I have been interested in snakes
all my life and I have always taken the opportunity to look for snakes when I travel to places withinteresting species. This protein sequence comes from the only snake that ever truly terrified me. I visiteda very small reptile collection near Lake Baringo in Kenya and one of the keepers was delighted to bringout a very jumpy nine-or ten-foot-long black mamba to show me. The snake was so fast and agile. I kepttrying to back farther away, but the handler just brought him closer.
Had the handler made a mistake, neither he nor I would have had long to think about it. A blackmamba bite can be fatal in thirty minutes. The venom contains potent neurotoxins (the sequence of a majortoxin is the fourth protein sequence in the list above). The neurotoxin kills by blocking so-calledpotassium channels. These channels play a critical role in the electrical signals that pass among neuronsand muscles. When their function is blocked, so are nerve and muscle function. Victims of black mambabites typically display neurological and muscle problems and, if untreated, die of respiratory paralysis.
The other three proteins in the list are also potassium channel blockers found in venom. Here is theamazing part of the story—the first protein comes from a sea anemone, the second protein is from ascorpion, and the third protein is from a marine cone shell snail. Each of these animals, as well as theblack mamba, belongs to a different animal phylum—the anemone is a cnidarian, the scorpion is anarthropod, the cone shell is a mollusk, and the snake a vertebrate. Each of these venom toxins evolvedindependently of one another and represent different molecular solutions for the binding to and blockingof potassium channels of their prey. They are different molecules with different origins but a common,deadly purpose.
I HOPE that you are more than just a little impressed, perhaps even dazzled, by the evolution of thesevenom toxins, as well as by the other examples of evolution repeating itself in this and earlier chapters. Ibelieve that they are among the most powerful and important demonstrations of how evolution works innature. They derive their special significance from two elements—repetition and detail.
There is a variation of an old Latin proverb that states “repetitio est mater doctrinae”—repetitionis the mother of learning. What is true for education holds true for science. While individual examples ofspecies adaptations are instructive, the repetition of events, sometimes in precise detail, teaches us thatwhen similar forces converge, similar results emerge. Evolution is remarkably reproducible.
Thus far, my descriptions of evolution repeating itself have focused on the “how”—on the stepsinvolved in the making of similar adaptations, or in the loss of traits. There remains the question of“why”—why is it that evolution can and does repeat itself? The answers to that question boil down to thethree key ingredients—chance, selection, and time—and the everyday math we first learned in chapter 2.That arithmetic might be fuzzy at this point (or may have been fuzzy from the start), but the interplay ofthese three ingredients and their impact on the text of DNA reveal exactly why the same events can and dohappen again and again.
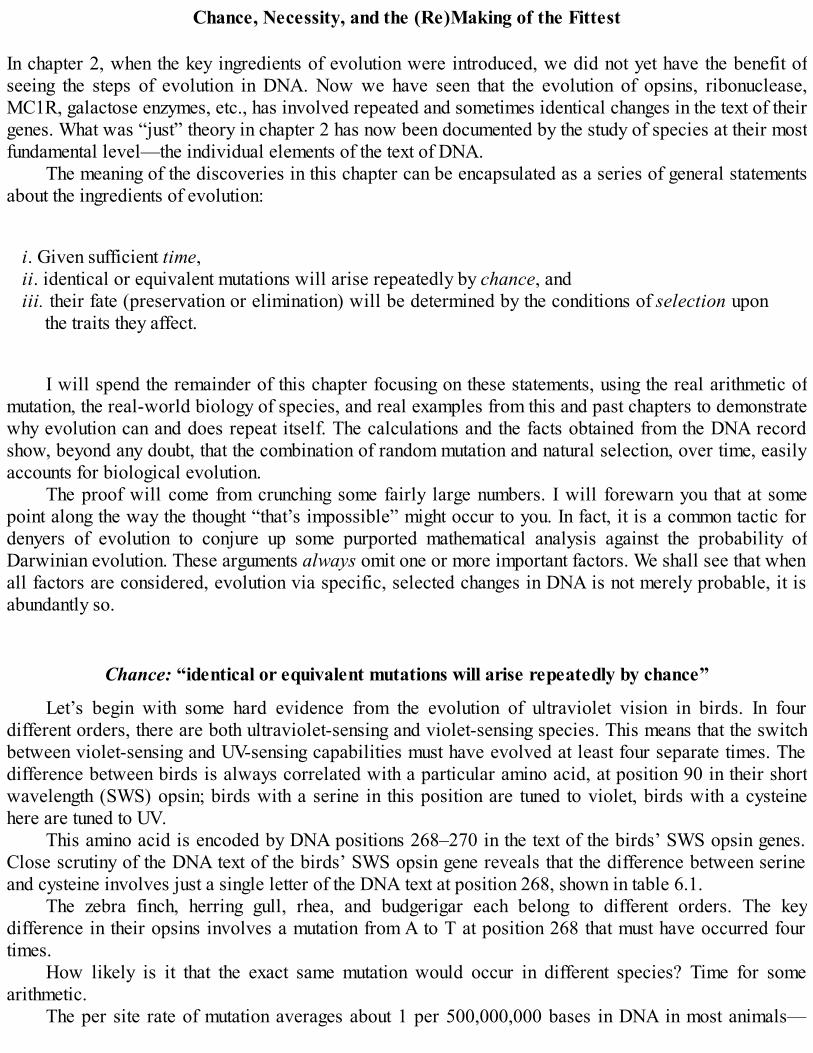
Chance, Necessity, and the (Re)Making of the Fittest
In chapter 2, when the key ingredients of evolution were introduced, we did not yet have the benefit ofseeing the steps of evolution in DNA. Now we have seen that the evolution of opsins, ribonuclease,MC1R, galactose enzymes, etc., has involved repeated and sometimes identical changes in the text of theirgenes. What was “just” theory in chapter 2 has now been documented by the study of species at their mostfundamental level—the individual elements of the text of DNA.
The meaning of the discoveries in this chapter can be encapsulated as a series of general statementsabout the ingredients of evolution:
i. Given sufficient time,ii. identical or equivalent mutations will arise repeatedly by chance, andiii. their fate (preservation or elimination) will be determined by the conditions of selection upon
the traits they affect.
I will spend the remainder of this chapter focusing on these statements, using the real arithmetic ofmutation, the real-world biology of species, and real examples from this and past chapters to demonstratewhy evolution can and does repeat itself. The calculations and the facts obtained from the DNA recordshow, beyond any doubt, that the combination of random mutation and natural selection, over time, easilyaccounts for biological evolution.
The proof will come from crunching some fairly large numbers. I will forewarn you that at somepoint along the way the thought “that’s impossible” might occur to you. In fact, it is a common tactic fordenyers of evolution to conjure up some purported mathematical analysis against the probability ofDarwinian evolution. These arguments always omit one or more important factors. We shall see that whenall factors are considered, evolution via specific, selected changes in DNA is not merely probable, it isabundantly so.
Chance: “identical or equivalent mutations will arise repeatedly by chance”
Let’s begin with some hard evidence from the evolution of ultraviolet vision in birds. In fourdifferent orders, there are both ultraviolet-sensing and violet-sensing species. This means that the switchbetween violet-sensing and UV-sensing capabilities must have evolved at least four separate times. Thedifference between birds is always correlated with a particular amino acid, at position 90 in their shortwavelength (SWS) opsin; birds with a serine in this position are tuned to violet, birds with a cysteinehere are tuned to UV.
This amino acid is encoded by DNA positions 268–270 in the text of the birds’ SWS opsin genes.Close scrutiny of the DNA text of the birds’ SWS opsin gene reveals that the difference between serineand cysteine involves just a single letter of the DNA text at position 268, shown in table 6.1.
The zebra finch, herring gull, rhea, and budgerigar each belong to different orders. The keydifference in their opsins involves a mutation from A to T at position 268 that must have occurred fourtimes.
How likely is it that the exact same mutation would occur in different species? Time for somearithmetic.
The per site rate of mutation averages about 1 per 500,000,000 bases in DNA in most animals—
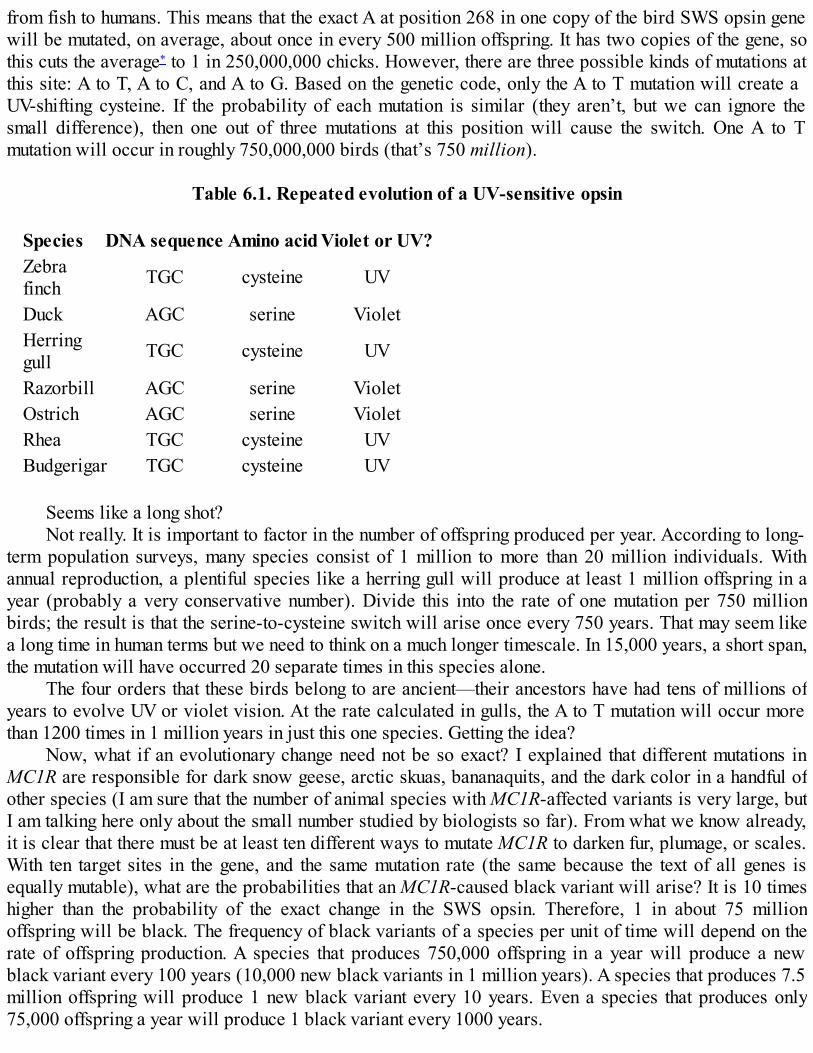
from fish to humans. This means that the exact A at position 268 in one copy of the bird SWS opsin genewill be mutated, on average, about once in every 500 million offspring. It has two copies of the gene, sothis cuts the average* to 1 in 250,000,000 chicks. However, there are three possible kinds of mutations atthis site: A to T, A to C, and A to G. Based on the genetic code, only the A to T mutation will create aUV-shifting cysteine. If the probability of each mutation is similar (they aren’t, but we can ignore thesmall difference), then one out of three mutations at this position will cause the switch. One A to Tmutation will occur in roughly 750,000,000 birds (that’s 750 million).
Table 6.1. Repeated evolution of a UV-sensitive opsin
Species DNA sequence Amino acid Violet or UV?Zebrafinch TGC cysteine UV
Duck AGC serine VioletHerringgull TGC cysteine UV
Razorbill AGC serine VioletOstrich AGC serine VioletRhea TGC cysteine UVBudgerigar TGC cysteine UV
Seems like a long shot?Not really. It is important to factor in the number of offspring produced per year. According to long-
term population surveys, many species consist of 1 million to more than 20 million individuals. Withannual reproduction, a plentiful species like a herring gull will produce at least 1 million offspring in ayear (probably a very conservative number). Divide this into the rate of one mutation per 750 millionbirds; the result is that the serine-to-cysteine switch will arise once every 750 years. That may seem likea long time in human terms but we need to think on a much longer timescale. In 15,000 years, a short span,the mutation will have occurred 20 separate times in this species alone.
The four orders that these birds belong to are ancient—their ancestors have had tens of millions ofyears to evolve UV or violet vision. At the rate calculated in gulls, the A to T mutation will occur morethan 1200 times in 1 million years in just this one species. Getting the idea?
Now, what if an evolutionary change need not be so exact? I explained that different mutations inMC1R are responsible for dark snow geese, arctic skuas, bananaquits, and the dark color in a handful ofother species (I am sure that the number of animal species with MC1R-affected variants is very large, butI am talking here only about the small number studied by biologists so far). From what we know already,it is clear that there must be at least ten different ways to mutate MC1R to darken fur, plumage, or scales.With ten target sites in the gene, and the same mutation rate (the same because the text of all genes isequally mutable), what are the probabilities that an MC1R-caused black variant will arise? It is 10 timeshigher than the probability of the exact change in the SWS opsin. Therefore, 1 in about 75 millionoffspring will be black. The frequency of black variants of a species per unit of time will depend on therate of offspring production. A species that produces 750,000 offspring in a year will produce a newblack variant every 100 years (10,000 new black variants in 1 million years). A species that produces 7.5million offspring will produce 1 new black variant every 10 years. Even a species that produces only75,000 offspring a year will produce 1 black variant every 1000 years.
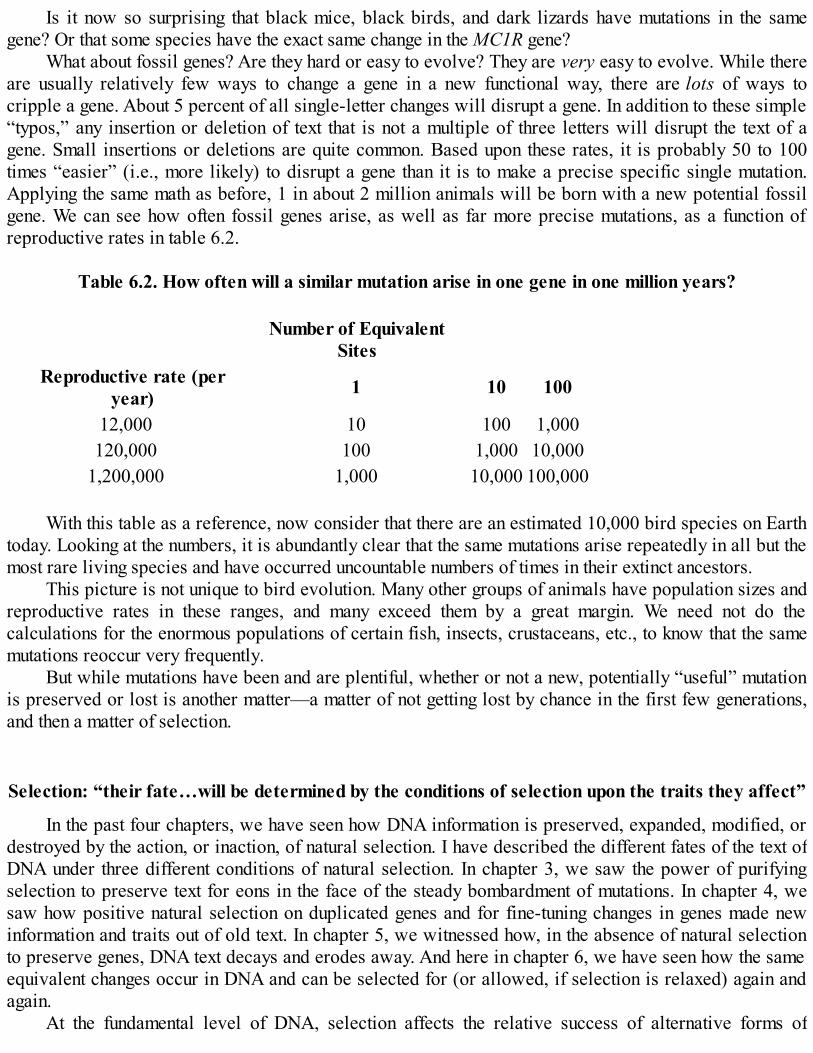
Is it now so surprising that black mice, black birds, and dark lizards have mutations in the samegene? Or that some species have the exact same change in the MC1R gene?
What about fossil genes? Are they hard or easy to evolve? They are very easy to evolve. While thereare usually relatively few ways to change a gene in a new functional way, there are lots of ways tocripple a gene. About 5 percent of all single-letter changes will disrupt a gene. In addition to these simple“typos,” any insertion or deletion of text that is not a multiple of three letters will disrupt the text of agene. Small insertions or deletions are quite common. Based upon these rates, it is probably 50 to 100times “easier” (i.e., more likely) to disrupt a gene than it is to make a precise specific single mutation.Applying the same math as before, 1 in about 2 million animals will be born with a new potential fossilgene. We can see how often fossil genes arise, as well as far more precise mutations, as a function ofreproductive rates in table 6.2.
Table 6.2. How often will a similar mutation arise in one gene in one million years?
Number of EquivalentSites
Reproductive rate (peryear) 1 10 100
12,000 10 100 1,000120,000 100 1,000 10,000
1,200,000 1,000 10,000 100,000
With this table as a reference, now consider that there are an estimated 10,000 bird species on Earthtoday. Looking at the numbers, it is abundantly clear that the same mutations arise repeatedly in all but themost rare living species and have occurred uncountable numbers of times in their extinct ancestors.
This picture is not unique to bird evolution. Many other groups of animals have population sizes andreproductive rates in these ranges, and many exceed them by a great margin. We need not do thecalculations for the enormous populations of certain fish, insects, crustaceans, etc., to know that the samemutations reoccur very frequently.
But while mutations have been and are plentiful, whether or not a new, potentially “useful” mutationis preserved or lost is another matter—a matter of not getting lost by chance in the first few generations,and then a matter of selection.
Selection: “their fate…will be determined by the conditions of selection upon the traits they affect”
In the past four chapters, we have seen how DNA information is preserved, expanded, modified, ordestroyed by the action, or inaction, of natural selection. I have described the different fates of the text ofDNA under three different conditions of natural selection. In chapter 3, we saw the power of purifyingselection to preserve text for eons in the face of the steady bombardment of mutations. In chapter 4, wesaw how positive natural selection on duplicated genes and for fine-tuning changes in genes made newinformation and traits out of old text. In chapter 5, we witnessed how, in the absence of natural selectionto preserve genes, DNA text decays and erodes away. And here in chapter 6, we have seen how the sameequivalent changes occur in DNA and can be selected for (or allowed, if selection is relaxed) again andagain.
At the fundamental level of DNA, selection affects the relative success of alternative forms of
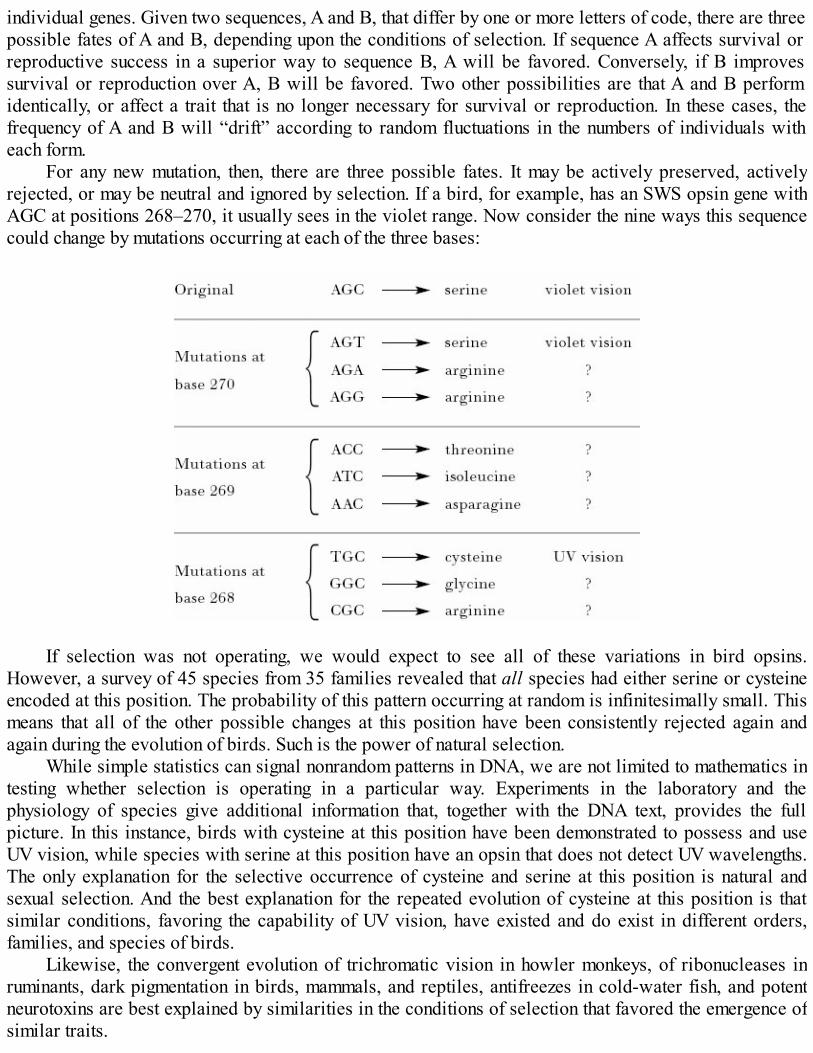
individual genes. Given two sequences, A and B, that differ by one or more letters of code, there are threepossible fates of A and B, depending upon the conditions of selection. If sequence A affects survival orreproductive success in a superior way to sequence B, A will be favored. Conversely, if B improvessurvival or reproduction over A, B will be favored. Two other possibilities are that A and B performidentically, or affect a trait that is no longer necessary for survival or reproduction. In these cases, thefrequency of A and B will “drift” according to random fluctuations in the numbers of individuals witheach form.
For any new mutation, then, there are three possible fates. It may be actively preserved, activelyrejected, or may be neutral and ignored by selection. If a bird, for example, has an SWS opsin gene withAGC at positions 268–270, it usually sees in the violet range. Now consider the nine ways this sequencecould change by mutations occurring at each of the three bases:
If selection was not operating, we would expect to see all of these variations in bird opsins.However, a survey of 45 species from 35 families revealed that all species had either serine or cysteineencoded at this position. The probability of this pattern occurring at random is infinitesimally small. Thismeans that all of the other possible changes at this position have been consistently rejected again andagain during the evolution of birds. Such is the power of natural selection.
While simple statistics can signal nonrandom patterns in DNA, we are not limited to mathematics intesting whether selection is operating in a particular way. Experiments in the laboratory and thephysiology of species give additional information that, together with the DNA text, provides the fullpicture. In this instance, birds with cysteine at this position have been demonstrated to possess and useUV vision, while species with serine at this position have an opsin that does not detect UV wavelengths.The only explanation for the selective occurrence of cysteine and serine at this position is natural andsexual selection. And the best explanation for the repeated evolution of cysteine at this position is thatsimilar conditions, favoring the capability of UV vision, have existed and do exist in different orders,families, and species of birds.
Likewise, the convergent evolution of trichromatic vision in howler monkeys, of ribonucleases inruminants, dark pigmentation in birds, mammals, and reptiles, antifreezes in cold-water fish, and potentneurotoxins are best explained by similarities in the conditions of selection that favored the emergence ofsimilar traits.

While the advantages of antifreezes and of prey-killing toxins are obvious, their evolutiondemonstrates how selection acts on the materials that are available. It has fashioned two nearly identicalantifreezes from two entirely different pieces of code, as well as deadly toxins from many differentstarting materials. In these examples, necessity was clearly the mother of invention, but it was thecombination of random mutation and selection that forged these inventions.
If, however, a trait becomes unnecessary through some shift in lifestyle, selection will be blind to thegenes that affect it. Mutations that disrupt the gene are inevitable and may occur anywhere in the text. Wehave seen that the SWS opsin has been disrupted at least five different times, in five different ways, incertain vertebrates and that the seven genes of the galactose pathway have been disrupted at least threetimes in yeast. Again, similar conditions (dispensability) have led to similar outcomes.
Not every time a potentially “useful” mutation arises will it spread completely through a species. Infact, most of the time, new mutations are lost by chance before they reach a significant frequency. Only afraction of new mutations, depending upon the magnitude of the advantage they confer, will be spread byselection. The figures in table 6.2 on the recurrence of mutations demonstrate that the frequency ofmutations provides ample opportunities for evolution, even if those opportunities are seized onlyoccasionally.
It is very important to stress that because species often occupy multiple habitats, a mutation may befavored in some locales and selected against or ignored in others. This results in species, like the rockpocket mice, jaguar, or snow geese, being variable in many traits across their range. While I havedescribed how frequently new mutations arise, it is usually the case that two or more alternative forms ofa gene are present at substantial frequencies in a population or species. Evolution is then not a matter of“waiting” for a new mutation, but the preferential increase or decrease of alternative forms in responseto changes in conditions. As we saw in chapter 2, the timescale of selection is such that, onceestablished, particular traits can spread quickly or disappear rapidly.
ALMOST TWO THOUSAND years ago, the writer-philosopher Plutarch came very close to describing thenature of evolution, and the likelihood of repetition, in his Life of Sertorius (quoted at the front of thechapter). He astutely emphasized the length of time available (“the long process of time”), chance(“fortune”), and the large number and diversity of material available (“the number and variety of subjectsto be wrought upon be infinite”), and concluded that events should be repeated in history (“numerouscoincidences should spontaneously occur” and “effect this similarity of results”).
Plutarch aptly described the probabilistic dimension of history, but not the deterministic part of theevolutionary process—that is, selection. Out of the vast numbers of possible events that do occur in therandom scrambling of DNA, selection weeds out the majority and favors but a few. The making of thefittest is not merely a matter of chance but, as the great biologist Jacques Monod put it over thirty yearsago, it is a matter of chance and necessity. The repeated evolution of traits is a product of both forces, theprobability of equivalent mutations and the similarity of the conditions of selection.
We have now come a long way since the theoretical arithmetic of chapter 2. However, you may bewondering “this is all well and good for mice and yeast and parakeets, but what about humans?”
The interplay of chance and necessity is not restricted to history nor to “lower species.” We can seemutation and selection occurring in real time in our own species. That will be the focus of the nextchapter.

The very toxic Oregon rough-skinned newt. Photograph by Steven Holt.
Chapter 7
Our Flesh and Blood: Arms Races, the Human Race, and Natural Selection
The mortal enemies of man are not his fellows of another continent or race; they are the aspectsof the physical world which limit or challenge his control, the disease germs that attack him andhis domesticated plants and animals, and the insects that carry many of these germs….
—W. C. Allee, The Social Life of Insects (1939)
IT IS RUMORED THAT THE MOST COMMON LAST words humans utter are “Hey, hold my beer and watch this!”For one unfortunate Oregon man in 1979, they probably were. After a day of heavy drinking, and
prompted by a buddy’s dare, this otherwise healthy twenty-nine-year old swallowed an eight-inch-longnewt. Within ten minutes his lips tingled. Then he began feeling numb and weak, and told his friends hethought he was going to die. He refused to go to a hospital and then promptly went into cardiac arrest.Although his heart was restarted, all other medical efforts failed and he died in less than twenty-fourhours. For being the first and only human known to die from newt poisoning, and for voluntarily removinghis genes from the human gene pool, I nominate this pioneering gourmand for a Darwin Award.
Docile, soft, and downright cute, newts do not inspire much fear. But the Oregon rough-skinned newt(Taricha granulosa) packs one hell of a wallop. Its skin is loaded with a toxin called tetrodotoxin (TTXfor short), enough to kill several humans. TTX is a potent blocker of another type of ion channel, sodiumchannels, that are critical for nerve function. TTX causes paralysis, respiratory distress, abnormalheartbeats, and in modest doses, death. The toxin is better known from the practice of eating puffer fish inAsia, which also contain high levels of TTX. For $400 or more per person, a licensed, “expert” chef willprepare this delicacy in such a way that the diner can savor the supposedly wonderful flavor of the fleshwithout ingesting any of the toxin. Nonetheless, from 1974 to 1983 there were 646 reported cases ofpuffer fish poisoning in Japan, 179 of them fatal. I’ve traveled to Japan—my advice is to stick to theteriyaki and tempura.
Why would a newt weighing half an ounce pack enough poison to kill a 170-pound human? TheOregon man was a victim of, in addition to his own stupidity, an evolutionary “arms race.” The newt islocked into a life-or-death battle with the common garter snake, Thamnophis sirtalis. While newts canescape unharmed after being swallowed by bullfrogs and other animals, the only predator known to beresistant to the newt’s TTX is the garter snake.
The level of resistance varies among individual snakes, as does the level of TTX production amongindividual newts. And different populations of snakes and newts exhibit different degrees of resistanceand toxicity, respectively. The variation in predator and prey sets the stage for a “coevolutionary” armsrace in which selection favors increasingly resistant snakes and increasingly toxic newts. The escalationof the arms race through the evolutionary process results in preposterously toxic newts that easily killother predators, and highly resistant snakes that have survived newt dinners.
Arms races are examples of evolution in a fast-forward mode. The intense selection on each partyaccelerates the rate of evolutionary change such that biologists can catch species in the process ofevolving.
All snakes that try to eat a newt exhibit some signs of TTX poisoning: they cannot hold their headssteady, and they become flaccid and unable to right themselves. In laboratory studies, most snakes releasethe newt and recover. But even the largest snakes that manage to swallow a whole animal can beparalyzed and succumb to the poison. Only a fraction of snakes are able to successfully consume a newt.
You must be wondering, why do the snakes even go after such a difficult and dangerous meal? Theanswer is familiar to all of us who have overeaten a rich meal. There is a trade-off between takingadvantage of an abundant food source and feeling lousy for a while. Those snakes with greater resistancecan feed on newts, others cannot. While the snakes may get woozy, that beats not eating at all. And,because resistance is inherited, their young will also have this “advantage” over less resistant snakes.Maybe an analogy is the marshmallow and Jell-O salad at a picnic. It makes me throw up, but the rareaficionado gets to feast on as much as he or she wants.
If newts or puffer fish were important items on our menu, we, too, might be in an arms race withthem. Unfortunately for the Oregon newt swallower, we are not. However, we humans have been and areengaged in arms races with deadly foes. Some of these battles have left very strong marks on the geneticmakeup of populations of our species. And some battles are yet to be won.
In this chapter, I will focus on seeing the evolutionary process at work in humans—in our own flesh,blood, and DNA. I will first illustrate how our physical environment affects human evolution and ourgenetic makeup. Then I will discuss how arms races with infectious agents have shaped human history andhuman genes. We are the descendants of the fittest who have survived malaria, plague, poxes, and scoresof other scourges, and some of our genes show the scars from these battles. Finally, I will explain howcancers arise in our bodies through a type of evolutionary process, and how knowledge of that process isleading to the design of new weapons to battle the disease. Throughout the examples in this chapter, wewill see that the process of selection operates everywhere there is variation and competition in life. Wewill also see that mutation and selection are hardly mere “theory”—they have been and continue to be amatter of life and death.
Man Against the Sun
One of the most obvious characteristics that differentiates people from the various parts of the world isskin color. Are color differences a product of evolution, brought about by selection? Or, alternatively, isskin color “just” a reflection of relatedness among people found in the same region?
These questions have been contemplated for a very long time. In fact, ideas about human skin colorand fitness predate Darwin. Although Darwin was unaware of it at the time of On the Origin of Species,William Charles Wells, an American-born physician, had some forty years earlier articulated the essenceof the principle of natural selection in remarkably clear terms. Furthermore, he connected it to some of theforces affecting human diversity.
Wells was born in South Carolina to Scottish immigrants in 1757. He was sent to Scotland forschooling and at age thirteen entered the University of Edinburgh, but then soon returned in 1771 toCharleston to apprentice under a Dr. Alexander, a distinguished botany enthusiast and devotee of Carl vonLinné. After completing his medical training, Wells struggled as a physician, but he achieved exceptionalsuccess with various scientific contributions ranging from studies of how muscles contract to the treatmentof vision problems. He also made the first correct explanation of how dew is formed, for which he wonthe Rumford Medal of the Royal Society.
In 1813, he presented a paper entitled (in the style and language of the day) “An Account of a Femaleof the White Race of Mankind, Part of Whose Skin Resembles That of a Negro.” This paper was finally
published in 1818, after his death and as part of a longer body of work, including Wells’s autobiography(figure 7.1). Wells did not merely report his findings, but made “Some Observations on the Causes of theDifferences in Colour and Form Between the White and Negro Races of Men.”
Wells noted that “negroes and mulattos” enjoy immunity from certain tropical diseases. He alsoobserved that all animals tend to vary in some degree and that breeders improve their domesticatedanimals by selection. He then made the same leap that Darwin would make forty years later, noting thatwhat breeders do
by art, seems to be done with equal efficacy, though more slowly, by nature, in the formation ofvarieties of mankind, fitted for the country which they inhabit. Of the accidental varieties ofman, which would occur among the first few and scattered inhabitants of the middle regions ofAfrica, some one would be better fitted than others to bear the diseases of the country. Thisrace would consequently multiply, while the others would decrease; not only from theirinability to sustain the attacks of the disease, but from their incapacity of contending with theirmore vigorous neighbours. The colour of the vigorous race I take for granted, from what hasbeen already said, would be dark. But the same disposition to form varieties still existing, adarker and a darker race would in the course of time occur; and as the darkest would be thebest fitted for the climate, this would at length become the most prevalent, if not the only race,in the particular country in which it had originated.
Darwin learned of Wells’s work a few years after publication of On the Origin of Species. In latereditions, Darwin reviewed the many works concerning evolution that preceded The Origin in “AnHistorical Sketch.” In the fourth edition of On the Origin of Species, in 1866, Darwin credited Wells ashaving “distinctly” recognized “the principles of natural selection,” and “this is the first recognitionwhich has been indicated.” Darwin was right to acknowledge Wells, but was Wells right about selectionon skin color? In order to evaluate Wells’s hypothesis, we have to consider the physiology and geneticsof skin color and to scrutinize the genes of different ethnic groups.
FIG. 7.1. Frontispiece of William C. Wells pamphlet published posthumously in 1818. Wellsarticulated the first accurate description of the concept of natural selection. Image courtesy of the
University of Wisconsin Library.
The lightness or darkness of skin (and hair) is primarily a matter of the relative amount of a pigmentcalled melanin that is produced by specialized cells in the skin called melanocytes. The process ofmelanin formation is fairly well understood in biochemical terms, and a central component of this processis already familiar, the melanocortin-1 receptor (MC1R), the same receptor involved in fur, plumage, andscale color. Melanin production is controlled by a hormone made in one part of the pituitary gland, called
-melanocyte-stimulating hormone ( MSH), which binds to the MC1 receptor of melanocytes andstimulates the production of melanin. The melanin is then transferred from the specialized melanocytes toskin cells and hair.
A second pathway of melanin synthesis is induced by ultraviolet irradiation. UV light induces thesynthesis of MC1R and MSH, which in turn leads to the production of increased levels of melanin. Thisis the basis of tanning in response to sunlight.
The melanin pigment is a natural sunscreen. It is very efficient at absorbing the various wavelengthsof sunlight. Because of its structure, it absorbs UV radiation. UV light causes damage to cells, and worse,it acts directly on the bases of the DNA code and induces alterations that lead to permanent changes in thetext—UV is a potent mutagen. Chemicals used in commercial sunscreens are selected for their UV-screening properties. It is also important to know that not all UV radiation is bad. UV is essential toinduce the production of vitamin D3 in the skin, which plays a critical role in calcium absorption, whichin turn is important for bone formation and maintenance. Vitamin D deficiency causes osteoporosis and,when severe, rickets. This is why milk is fortified with vitamin D.
The amount of UV radiation that hits the Earth varies from region to region. A number of factors
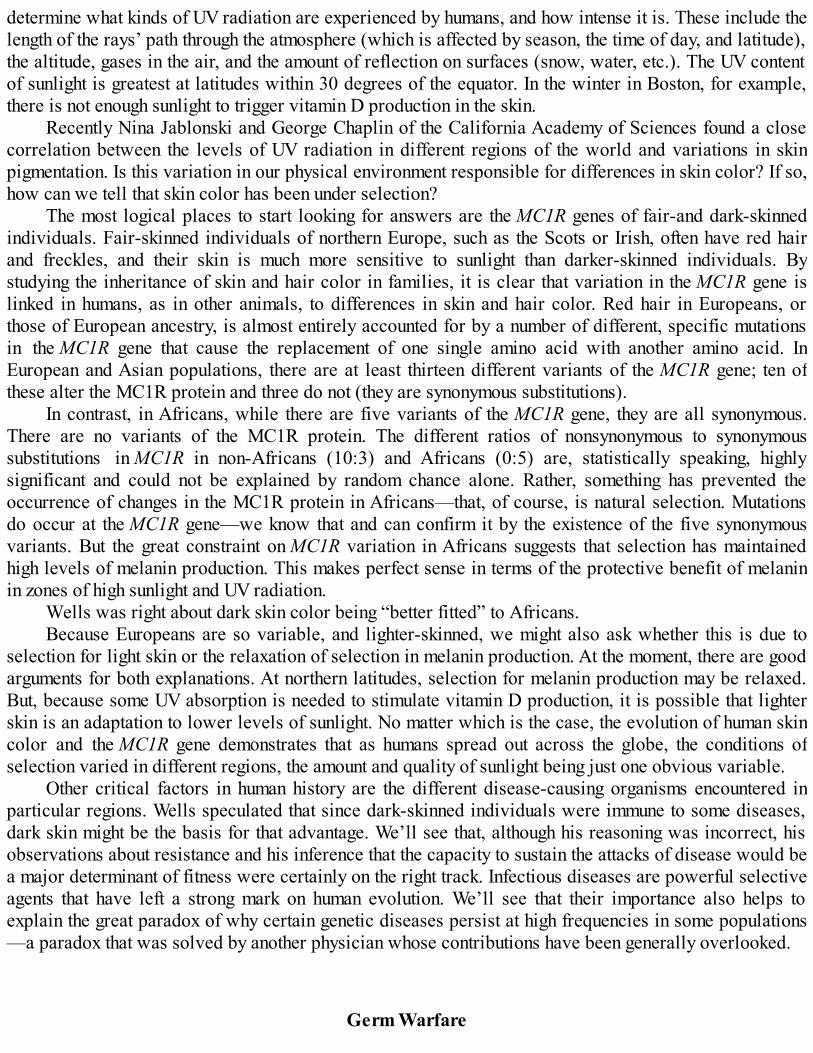
determine what kinds of UV radiation are experienced by humans, and how intense it is. These include thelength of the rays’ path through the atmosphere (which is affected by season, the time of day, and latitude),the altitude, gases in the air, and the amount of reflection on surfaces (snow, water, etc.). The UV contentof sunlight is greatest at latitudes within 30 degrees of the equator. In the winter in Boston, for example,there is not enough sunlight to trigger vitamin D production in the skin.
Recently Nina Jablonski and George Chaplin of the California Academy of Sciences found a closecorrelation between the levels of UV radiation in different regions of the world and variations in skinpigmentation. Is this variation in our physical environment responsible for differences in skin color? If so,how can we tell that skin color has been under selection?
The most logical places to start looking for answers are the MC1R genes of fair-and dark-skinnedindividuals. Fair-skinned individuals of northern Europe, such as the Scots or Irish, often have red hairand freckles, and their skin is much more sensitive to sunlight than darker-skinned individuals. Bystudying the inheritance of skin and hair color in families, it is clear that variation in the MC1R gene islinked in humans, as in other animals, to differences in skin and hair color. Red hair in Europeans, orthose of European ancestry, is almost entirely accounted for by a number of different, specific mutationsin the MC1R gene that cause the replacement of one single amino acid with another amino acid. InEuropean and Asian populations, there are at least thirteen different variants of the MC1R gene; ten ofthese alter the MC1R protein and three do not (they are synonymous substitutions).
In contrast, in Africans, while there are five variants of the MC1R gene, they are all synonymous.There are no variants of the MC1R protein. The different ratios of nonsynonymous to synonymoussubstitutions in MC1R in non-Africans (10:3) and Africans (0:5) are, statistically speaking, highlysignificant and could not be explained by random chance alone. Rather, something has prevented theoccurrence of changes in the MC1R protein in Africans—that, of course, is natural selection. Mutationsdo occur at the MC1R gene—we know that and can confirm it by the existence of the five synonymousvariants. But the great constraint on MC1R variation in Africans suggests that selection has maintainedhigh levels of melanin production. This makes perfect sense in terms of the protective benefit of melaninin zones of high sunlight and UV radiation.
Wells was right about dark skin color being “better fitted” to Africans.Because Europeans are so variable, and lighter-skinned, we might also ask whether this is due to
selection for light skin or the relaxation of selection in melanin production. At the moment, there are goodarguments for both explanations. At northern latitudes, selection for melanin production may be relaxed.But, because some UV absorption is needed to stimulate vitamin D production, it is possible that lighterskin is an adaptation to lower levels of sunlight. No matter which is the case, the evolution of human skincolor and the MC1R gene demonstrates that as humans spread out across the globe, the conditions ofselection varied in different regions, the amount and quality of sunlight being just one obvious variable.
Other critical factors in human history are the different disease-causing organisms encountered inparticular regions. Wells speculated that since dark-skinned individuals were immune to some diseases,dark skin might be the basis for that advantage. We’ll see that, although his reasoning was incorrect, hisobservations about resistance and his inference that the capacity to sustain the attacks of disease would bea major determinant of fitness were certainly on the right track. Infectious diseases are powerful selectiveagents that have left a strong mark on human evolution. We’ll see that their importance also helps toexplain the great paradox of why certain genetic diseases persist at high frequencies in some populations—a paradox that was solved by another physician whose contributions have been generally overlooked.
Germ Warfare
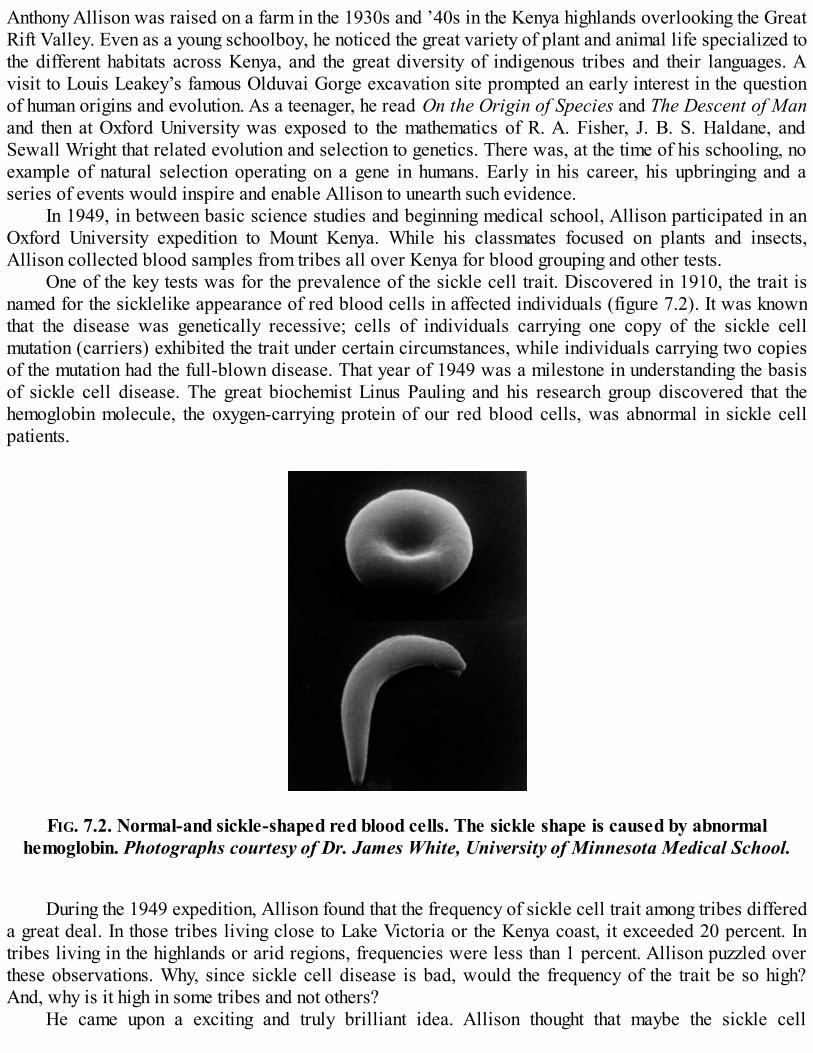
Anthony Allison was raised on a farm in the 1930s and ’40s in the Kenya highlands overlooking the GreatRift Valley. Even as a young schoolboy, he noticed the great variety of plant and animal life specialized tothe different habitats across Kenya, and the great diversity of indigenous tribes and their languages. Avisit to Louis Leakey’s famous Olduvai Gorge excavation site prompted an early interest in the questionof human origins and evolution. As a teenager, he read On the Origin of Species and The Descent of Manand then at Oxford University was exposed to the mathematics of R. A. Fisher, J. B. S. Haldane, andSewall Wright that related evolution and selection to genetics. There was, at the time of his schooling, noexample of natural selection operating on a gene in humans. Early in his career, his upbringing and aseries of events would inspire and enable Allison to unearth such evidence.
In 1949, in between basic science studies and beginning medical school, Allison participated in anOxford University expedition to Mount Kenya. While his classmates focused on plants and insects,Allison collected blood samples from tribes all over Kenya for blood grouping and other tests.
One of the key tests was for the prevalence of the sickle cell trait. Discovered in 1910, the trait isnamed for the sicklelike appearance of red blood cells in affected individuals (figure 7.2). It was knownthat the disease was genetically recessive; cells of individuals carrying one copy of the sickle cellmutation (carriers) exhibited the trait under certain circumstances, while individuals carrying two copiesof the mutation had the full-blown disease. That year of 1949 was a milestone in understanding the basisof sickle cell disease. The great biochemist Linus Pauling and his research group discovered that thehemoglobin molecule, the oxygen-carrying protein of our red blood cells, was abnormal in sickle cellpatients.
FIG. 7.2. Normal-and sickle-shaped red blood cells. The sickle shape is caused by abnormalhemoglobin. Photographs courtesy of Dr. James White, University of Minnesota Medical School.
During the 1949 expedition, Allison found that the frequency of sickle cell trait among tribes differeda great deal. In those tribes living close to Lake Victoria or the Kenya coast, it exceeded 20 percent. Intribes living in the highlands or arid regions, frequencies were less than 1 percent. Allison puzzled overthese observations. Why, since sickle cell disease is bad, would the frequency of the trait be so high?And, why is it high in some tribes and not others?
He came upon a exciting and truly brilliant idea. Allison thought that maybe the sickle cell
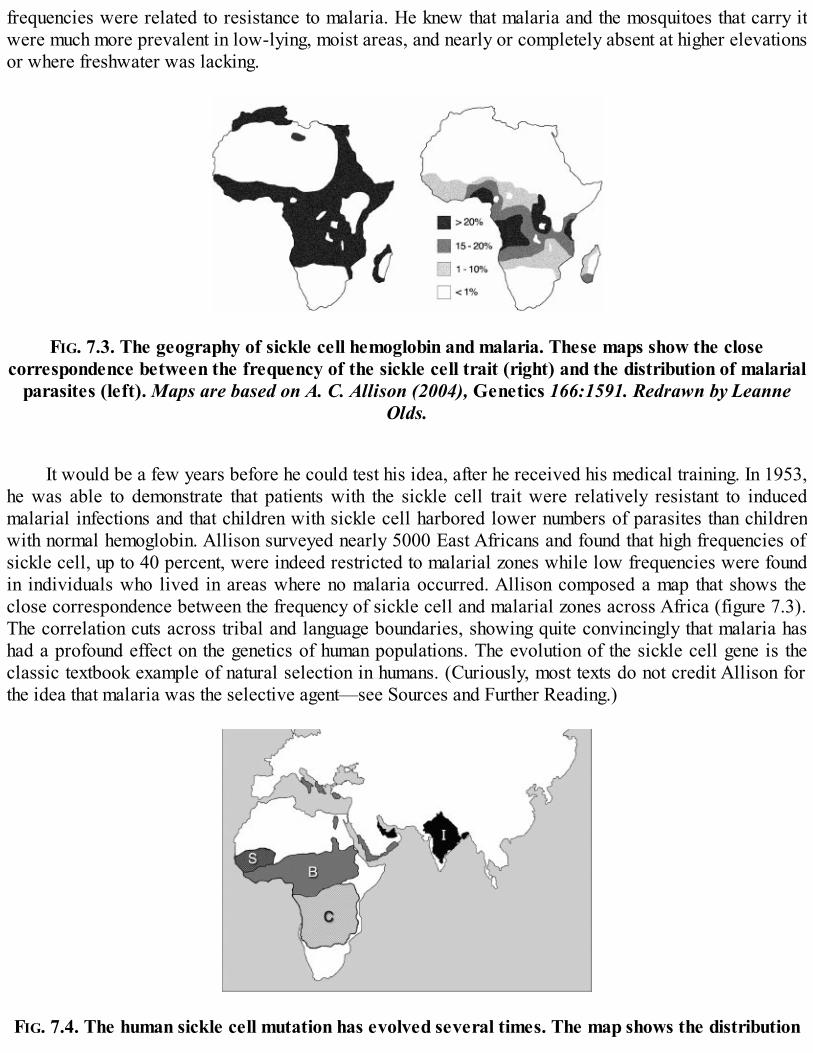
frequencies were related to resistance to malaria. He knew that malaria and the mosquitoes that carry itwere much more prevalent in low-lying, moist areas, and nearly or completely absent at higher elevationsor where freshwater was lacking.
FIG. 7.3. The geography of sickle cell hemoglobin and malaria. These maps show the closecorrespondence between the frequency of the sickle cell trait (right) and the distribution of malarial
parasites (left). Maps are based on A. C. Allison (2004), Genetics 166:1591. Redrawn by LeanneOlds.
It would be a few years before he could test his idea, after he received his medical training. In 1953,he was able to demonstrate that patients with the sickle cell trait were relatively resistant to inducedmalarial infections and that children with sickle cell harbored lower numbers of parasites than childrenwith normal hemoglobin. Allison surveyed nearly 5000 East Africans and found that high frequencies ofsickle cell, up to 40 percent, were indeed restricted to malarial zones while low frequencies were foundin individuals who lived in areas where no malaria occurred. Allison composed a map that shows theclose correspondence between the frequency of sickle cell and malarial zones across Africa (figure 7.3).The correlation cuts across tribal and language boundaries, showing quite convincingly that malaria hashad a profound effect on the genetics of human populations. The evolution of the sickle cell gene is theclassic textbook example of natural selection in humans. (Curiously, most texts do not credit Allison forthe idea that malaria was the selective agent—see Sources and Further Reading.)
FIG. 7.4. The human sickle cell mutation has evolved several times. The map shows the distribution
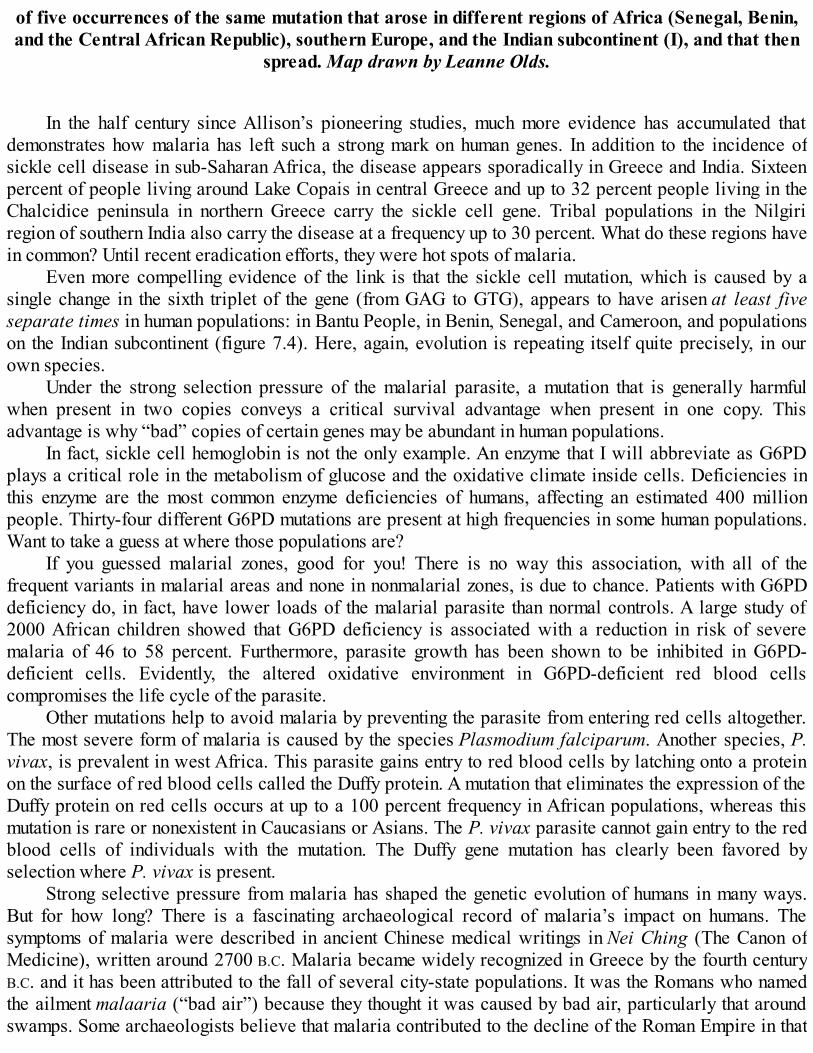
of five occurrences of the same mutation that arose in different regions of Africa (Senegal, Benin,and the Central African Republic), southern Europe, and the Indian subcontinent (I), and that then
spread. Map drawn by Leanne Olds.
In the half century since Allison’s pioneering studies, much more evidence has accumulated thatdemonstrates how malaria has left such a strong mark on human genes. In addition to the incidence ofsickle cell disease in sub-Saharan Africa, the disease appears sporadically in Greece and India. Sixteenpercent of people living around Lake Copais in central Greece and up to 32 percent people living in theChalcidice peninsula in northern Greece carry the sickle cell gene. Tribal populations in the Nilgiriregion of southern India also carry the disease at a frequency up to 30 percent. What do these regions havein common? Until recent eradication efforts, they were hot spots of malaria.
Even more compelling evidence of the link is that the sickle cell mutation, which is caused by asingle change in the sixth triplet of the gene (from GAG to GTG), appears to have arisen at least fiveseparate times in human populations: in Bantu People, in Benin, Senegal, and Cameroon, and populationson the Indian subcontinent (figure 7.4). Here, again, evolution is repeating itself quite precisely, in ourown species.
Under the strong selection pressure of the malarial parasite, a mutation that is generally harmfulwhen present in two copies conveys a critical survival advantage when present in one copy. Thisadvantage is why “bad” copies of certain genes may be abundant in human populations.
In fact, sickle cell hemoglobin is not the only example. An enzyme that I will abbreviate as G6PDplays a critical role in the metabolism of glucose and the oxidative climate inside cells. Deficiencies inthis enzyme are the most common enzyme deficiencies of humans, affecting an estimated 400 millionpeople. Thirty-four different G6PD mutations are present at high frequencies in some human populations.Want to take a guess at where those populations are?
If you guessed malarial zones, good for you! There is no way this association, with all of thefrequent variants in malarial areas and none in nonmalarial zones, is due to chance. Patients with G6PDdeficiency do, in fact, have lower loads of the malarial parasite than normal controls. A large study of2000 African children showed that G6PD deficiency is associated with a reduction in risk of severemalaria of 46 to 58 percent. Furthermore, parasite growth has been shown to be inhibited in G6PD-deficient cells. Evidently, the altered oxidative environment in G6PD-deficient red blood cellscompromises the life cycle of the parasite.
Other mutations help to avoid malaria by preventing the parasite from entering red cells altogether.The most severe form of malaria is caused by the species Plasmodium falciparum. Another species, P.vivax, is prevalent in west Africa. This parasite gains entry to red blood cells by latching onto a proteinon the surface of red blood cells called the Duffy protein. A mutation that eliminates the expression of theDuffy protein on red cells occurs at up to a 100 percent frequency in African populations, whereas thismutation is rare or nonexistent in Caucasians or Asians. The P. vivax parasite cannot gain entry to the redblood cells of individuals with the mutation. The Duffy gene mutation has clearly been favored byselection where P. vivax is present.
Strong selective pressure from malaria has shaped the genetic evolution of humans in many ways.But for how long? There is a fascinating archaeological record of malaria’s impact on humans. Thesymptoms of malaria were described in ancient Chinese medical writings in Nei Ching (The Canon ofMedicine), written around 2700 B.C. Malaria became widely recognized in Greece by the fourth centuryB.C. and it has been attributed to the fall of several city-state populations. It was the Romans who namedthe ailment malaaria (“bad air”) because they thought it was caused by bad air, particularly that aroundswamps. Some archaeologists believe that malaria contributed to the decline of the Roman Empire in that
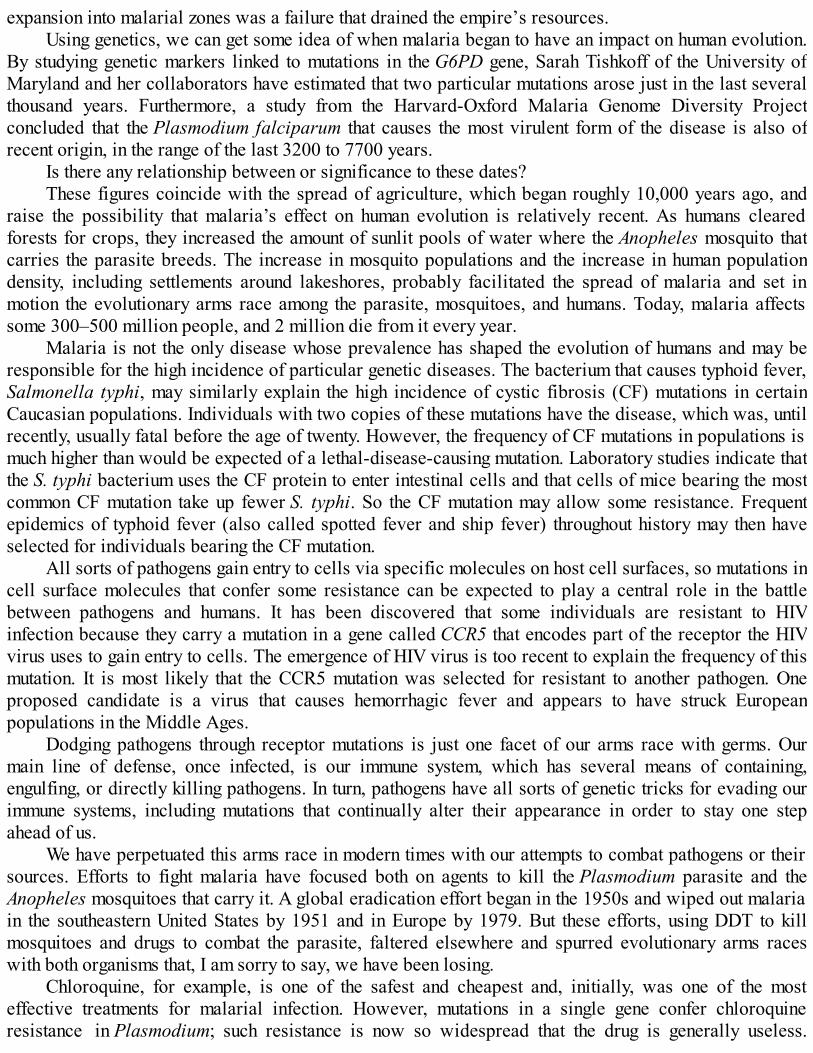
expansion into malarial zones was a failure that drained the empire’s resources.Using genetics, we can get some idea of when malaria began to have an impact on human evolution.
By studying genetic markers linked to mutations in the G6PD gene, Sarah Tishkoff of the University ofMaryland and her collaborators have estimated that two particular mutations arose just in the last severalthousand years. Furthermore, a study from the Harvard-Oxford Malaria Genome Diversity Projectconcluded that the Plasmodium falciparum that causes the most virulent form of the disease is also ofrecent origin, in the range of the last 3200 to 7700 years.
Is there any relationship between or significance to these dates?These figures coincide with the spread of agriculture, which began roughly 10,000 years ago, and
raise the possibility that malaria’s effect on human evolution is relatively recent. As humans clearedforests for crops, they increased the amount of sunlit pools of water where the Anopheles mosquito thatcarries the parasite breeds. The increase in mosquito populations and the increase in human populationdensity, including settlements around lakeshores, probably facilitated the spread of malaria and set inmotion the evolutionary arms race among the parasite, mosquitoes, and humans. Today, malaria affectssome 300–500 million people, and 2 million die from it every year.
Malaria is not the only disease whose prevalence has shaped the evolution of humans and may beresponsible for the high incidence of particular genetic diseases. The bacterium that causes typhoid fever,Salmonella typhi, may similarly explain the high incidence of cystic fibrosis (CF) mutations in certainCaucasian populations. Individuals with two copies of these mutations have the disease, which was, untilrecently, usually fatal before the age of twenty. However, the frequency of CF mutations in populations ismuch higher than would be expected of a lethal-disease-causing mutation. Laboratory studies indicate thatthe S. typhi bacterium uses the CF protein to enter intestinal cells and that cells of mice bearing the mostcommon CF mutation take up fewer S. typhi. So the CF mutation may allow some resistance. Frequentepidemics of typhoid fever (also called spotted fever and ship fever) throughout history may then haveselected for individuals bearing the CF mutation.
All sorts of pathogens gain entry to cells via specific molecules on host cell surfaces, so mutations incell surface molecules that confer some resistance can be expected to play a central role in the battlebetween pathogens and humans. It has been discovered that some individuals are resistant to HIVinfection because they carry a mutation in a gene called CCR5 that encodes part of the receptor the HIVvirus uses to gain entry to cells. The emergence of HIV virus is too recent to explain the frequency of thismutation. It is most likely that the CCR5 mutation was selected for resistant to another pathogen. Oneproposed candidate is a virus that causes hemorrhagic fever and appears to have struck Europeanpopulations in the Middle Ages.
Dodging pathogens through receptor mutations is just one facet of our arms race with germs. Ourmain line of defense, once infected, is our immune system, which has several means of containing,engulfing, or directly killing pathogens. In turn, pathogens have all sorts of genetic tricks for evading ourimmune systems, including mutations that continually alter their appearance in order to stay one stepahead of us.
We have perpetuated this arms race in modern times with our attempts to combat pathogens or theirsources. Efforts to fight malaria have focused both on agents to kill the Plasmodium parasite and theAnopheles mosquitoes that carry it. A global eradication effort began in the 1950s and wiped out malariain the southeastern United States by 1951 and in Europe by 1979. But these efforts, using DDT to killmosquitoes and drugs to combat the parasite, faltered elsewhere and spurred evolutionary arms raceswith both organisms that, I am sorry to say, we have been losing.
Chloroquine, for example, is one of the safest and cheapest and, initially, was one of the mosteffective treatments for malarial infection. However, mutations in a single gene confer chloroquineresistance in Plasmodium; such resistance is now so widespread that the drug is generally useless.

Resistance to mefloquine, quinine, sulfadoxine/pyremethamine, and other drugs has also evolved.Similarly, efforts to eradicate the mosquito with DDT led to the evolution of DDT resistance bymosquitoes (and catastrophic effects on animals such as raptors that were higher up on the food chain).
The situation is critical, but not hopeless. In fact, the malaria evolutionary arms race is a goodexample of how the application of evolutionary principles to medicine, so-called evolutionary medicine,may lift us out of the perpetual cycle of new drug/new resistance/newer drug/more resistance, etc. Thekey idea considers the interaction of mutation and selection. We know that with almost any drug thattargets a particular parasite protein, drug-resistant mutations will evolve sooner or later. When a drug iswidely used, that creates a selective condition where only resistant forms thrive and are transmitted. So,after some initial period of success, the disease comes roaring back and available drugs are ineffective.
The newer approach is to use combinations of drugs. The key idea is that the chance of an organismharboring resistant mutations to two or more drugs is a product of the frequency of resistance to eachdrug. So let’s say 1 in 100 million parasites are resistant to either drug X or drug Y; then it is expectedthat 1 in 10,000 trillion (100 million × 100 million) parasites will be resistant to both drugs. In otherwords, there is a much slimmer chance of the rise of resistance to drug combinations. Combination drugtherapy has been the strategy that has made all of the difference in combating the HIV virus. A newmalarial combination therapy, based upon the active ingredient in a remedy first described in China in thesecond century B.C., hits the parasite with multiple drugs (for which resistance to each is unlikely) andappears to work well. This new regimen is, however, more expensive than chloroquine, and cost remainsthe main impediment to the widespread availability of effective medicines in Africa.
The modern arms race, between pesticides and pest or drugs and parasites, demonstrates thatunderstanding the interplay of mutation and selection is no mere abstract or academic indulgence—it is avery serious and important real-world problem. Hopefully, using our brains (another product of an armsrace), biotechnology (which has evolved in an explosive Darwinian fashion), and knowledge ofevolutionary principles, we will eventually control, and maybe eradicate, malaria. I will close thischapter with one more vivid example of the relevance of evolution to medicine.
The Enemy Within
One of the trade-offs of being large, long-lived complex organisms, composed of trillions of cells, is thatwe must continuously replenish certain kinds of cells in our bodies, such as our skin, blood, and gut cells.In the production of new cells, DNA must be copied and that means sometimes mistakes are made. Whilemutations in all cells except our germ cells (sperm, egg) will not be passed on to the next generation,some mutations can ignite a type of evolutionary arms race within our bodies that is a leading cause ofdeath in humans—this is cancer.
Tumors arise through a process that involves the three key ingredients of evolution in nature—chance mutations, selection, and time. The initial events in cancer formation are mutations thatcompromise the mechanisms that control how cells multiply and how they interact with their neighbors.Some combinations of mutations bestow selective advantages upon cells that enable them to proliferateunchecked. As these tumors grow, additional mutations occur that may give cells the ability to leave theiroriginal location and travel to, invade, and proliferate in other body tissues (metastasis).
Over the past thirty years or so, biologists have sought to understand the genetic and molecularmechanisms of cancer formation. One critical set of advances has come from identifying specific genesthat are often or always mutated in particular types of cancers. A prominent example is the so-calledPhiladelphia chromosome, which is associated with chronic myelogenous leukemia (CML). In these

cancers, breakage and attachment of chromosomes has occurred, a process that fuses one gene to another.This fusion disrupts the normal control of a potent regulatory protein called the ABL kinase. This eventpredisposes cells to become cancerous, and about 4400 new cases of CML occur in the United Stateseach year.
Historically, treatment of most cancers has been rather nonspecific and has employed broadly toxicdrugs and radiation. These treatments are blunt instruments that destroy rapidly dividing cells, bothhealthy and cancer cells, and cause many serious side effects. But the discovery of particular alteredgenes in various cancers raised the prospect of new therapies targeted at specific molecules involved inthe disease, and a new generation of “rational” chemotherapeutic drugs are now being used to treat avariety of cancers.
One such drug has been developed that targets the ABL kinase in CML tumors and has shown greatefficacy and safety. The drug, which goes by the name Gleevec or Imatinib, latches on to a particular partof the ABL kinase protein, inhibiting its activity. Gleevec is frontline therapy for CML and has produceddisease remission in a large number of patients.
You have learned enough about mutation and selection that you can predict what happened asGleevec was administered to patients. Resistance. Gleevec is essentially a toxin for CML cells, and justthe garter snakes of Oregon evolve resistance to TTX or malarial parasites evolve drug resistance, someCML cells will be more resistant to Gleevec, because of additional mutations that have occurred in thosecells.
Recently, Charles Sawyers and his colleagues at the Howard Hughes Medical Institute at UCLAexamined how resistance evolved in CML patients treated with Gleevec. By looking directly at the ABLkinase gene in resistant patients, they found that these leukemia cells have additional mutations in the ABLkinase gene. In fact, in six different patients the exact same mutation occurred—yet anotherdemonstration of evolution repeating itself (figure 7.5). The C-to-T mutation in the ABL gene in thesecancers causes the replacement of a threonine in the ABL protein with an isoleucine. Because we knowthe exact chemistry of how the Gleevec drug latches on to the ABL kinase, we know that this change altersthe pocket that Gleevec normally can fit into so that the drug can no longer bind there and block theprotein function. While the original tumor cells are controlled and killed by Gleevec, cells carrying thissingle mutation escape Gleevec’s action, and cancer relapses.
This is, of course, bad news. But it is just the initial battle, not the whole war.Now, knowing that Gleevec resistance will emerge in some fraction of patients, and that some of the
resistance mutations will occur in the same places, new agents can be designed to circumvent theGleevec-resistant ABL kinases. Indeed, Sawyers and collaborators at the Bristol-Myers Squibb Companyhave shown that another ABL kinase inhibitor (currently called BMS-354825) is active against fourteenout of fifteen different Gleevec-resistant kinases. This discovery raises the hope that patients who relapseafter Gleevec treatment will have an effective second-line therapy available. The discovery also raises anadditional strategy—combination therapy. Just as for malaria or HIV, by understanding mutation,selection, and evolution we have a new rational plan for beating one form of cancer.
Detailed studies of CML patients have revealed the presence of Gleevec-resistant mutations incancer cells before the administration of the Gleevec drug. This is a key point. Drugs or toxins do notinduce resistance; remember that mutation is random. What drugs do is create a selective condition inwhich only resistant parasites, bacteria, viruses, or, in this case, cancer cells can thrive. As a cancergrows, it becomes genetically heterogeneous because the steady beat of mutation continues. Somesubpopulation of cancer cells (if the cancer is large enough) will, by chance, be drug-resistant. So, newstudies are ongoing using two (and in the future perhaps a third) ABL-specific drugs in order to wipe outCML cancers before resistance can evolve. The best strategy is clearly “hit it early and hit it hard” inorder to have the best chance of a complete and lasting cure.
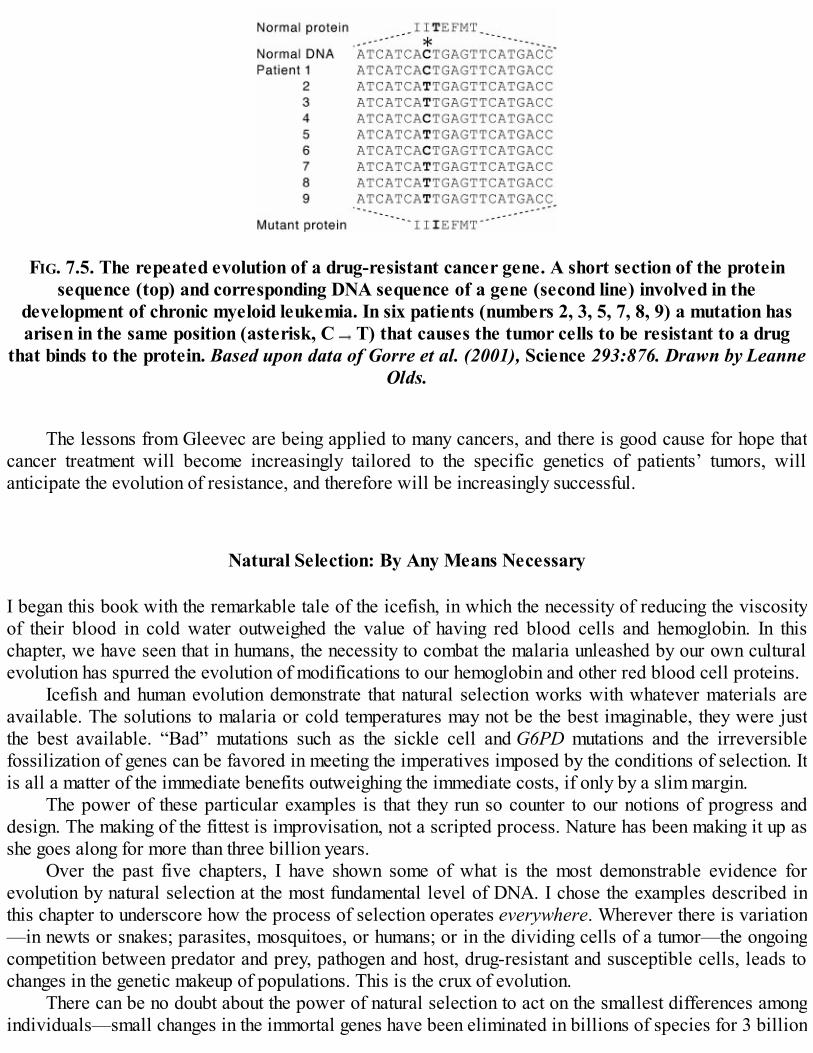
FIG. 7.5. The repeated evolution of a drug-resistant cancer gene. A short section of the proteinsequence (top) and corresponding DNA sequence of a gene (second line) involved in the
development of chronic myeloid leukemia. In six patients (numbers 2, 3, 5, 7, 8, 9) a mutation hasarisen in the same position (asterisk, C T) that causes the tumor cells to be resistant to a drug
that binds to the protein. Based upon data of Gorre et al. (2001), Science 293:876. Drawn by LeanneOlds.
The lessons from Gleevec are being applied to many cancers, and there is good cause for hope thatcancer treatment will become increasingly tailored to the specific genetics of patients’ tumors, willanticipate the evolution of resistance, and therefore will be increasingly successful.
Natural Selection: By Any Means Necessary
I began this book with the remarkable tale of the icefish, in which the necessity of reducing the viscosityof their blood in cold water outweighed the value of having red blood cells and hemoglobin. In thischapter, we have seen that in humans, the necessity to combat the malaria unleashed by our own culturalevolution has spurred the evolution of modifications to our hemoglobin and other red blood cell proteins.
Icefish and human evolution demonstrate that natural selection works with whatever materials areavailable. The solutions to malaria or cold temperatures may not be the best imaginable, they were justthe best available. “Bad” mutations such as the sickle cell and G6PD mutations and the irreversiblefossilization of genes can be favored in meeting the imperatives imposed by the conditions of selection. Itis all a matter of the immediate benefits outweighing the immediate costs, if only by a slim margin.
The power of these particular examples is that they run so counter to our notions of progress anddesign. The making of the fittest is improvisation, not a scripted process. Nature has been making it up asshe goes along for more than three billion years.
Over the past five chapters, I have shown some of what is the most demonstrable evidence forevolution by natural selection at the most fundamental level of DNA. I chose the examples described inthis chapter to underscore how the process of selection operates everywhere. Wherever there is variation—in newts or snakes; parasites, mosquitoes, or humans; or in the dividing cells of a tumor—the ongoingcompetition between predator and prey, pathogen and host, drug-resistant and susceptible cells, leads tochanges in the genetic makeup of populations. This is the crux of evolution.
There can be no doubt about the power of natural selection to act on the smallest differences amongindividuals—small changes in the immortal genes have been eliminated in billions of species for 3 billion

years, and a single change in a hemoglobin gene has enabled members of our species to survive malaria.But there is one aspect of the long-term action of natural selection I have not addressed—its cumulativecreative power. Can natural selection on small variations really add up to forge the vast differences incomplexity between life-forms?
Once again, the DNA record contains key new insights and the next chapter will complete the meal.

Many different kinds of animals build and inhabit the Great Barrier Reef of Australia. Photographby Antonia Valentine.

Chapter 8
The Making and Evolution of Complexity
The simplicity of nature is not to be measured by that of our conceptions. Infinitely varied in itseffects, nature is simple only in its causes, and its economy consists in producing a greatnumber of phenomena, often very complicated, by means of a small number of general laws.
—Pierre-Simon Laplace, Exposition du système du monde (1796)
EVEN WITH A SNORKEL PROVIDING AMPLE AIR, THE sights below me take my breath away.Drifting above the yellow, purple, and brown coral forest and boulders, the pageant of animal life
surrounding the reef is a riot of colors, shapes, and sizes—schools of neon fish, brilliant sea stars,mottled octopi, spiny urchins, green sea turtles, black-tipped sharks, giant clams with vivid turquoise ormagenta mantles, striped crabs, spotted rays, and cream-colored anemones.
The Great Barrier Reef of Australia is no doubt one of the great natural wonders of the world.Extending some 1200 miles along that continent’s east coast, the Reef is the largest structure on Earth builtby living organisms and the only one that is visible from the moon.
Such a great natural wonder has made many great naturalists wonder: How did the reef form? Andhow has such a great diversity of animal forms evolved?
In the early part of the nineteenth century, as geology found its footing and sought naturalexplanations for landforms, the prevailing view of coral reef formation was that they grew on top ofsubmarine volcanic craters. The appearance of the idyllic atolls of the South Pacific, where circular reefssurround crystal blue lagoons, would seem to be accounted for by such a mechanism. But in geology and,as we will see shortly, in biology as well, looks can be deceiving. The submarine crater explanation ofcoral reef formation was overturned by…well, guess who?
If you said Darwin, well done.Yes, twenty years before On the Origin of Species, in two books—first in his Journal of
Researches into the Geology and Natural History of the Various Countries Visited during the voyageround the world of H.M.S. Beagle (1839) (commonly known as The Voyage of the Beagle) and then atlength in The Structure and Distribution of Coral Reefs (1842)—Darwin provided a new explanation toaccount for the formation of all kinds of coral reefs, including the Great Barrier Reef. The significance ofDarwin’s coral reef theory is at least twofold. First, he was correct. Darwin’s proposal wascontroversial and opposed for many decades, but eventually the evidence proved him right (again!). Andsecond, his boldness and ability to theorize about a long-term process that no one had seen or couldwitness, and to extrapolate from small individual observations to comprehensive explanations, were aportent of the reasoning he would apply to the formation of the living world.
Darwin doubted the submarine crater theory because he thought it was unlikely that there werevolcanic craters large enough to account for certain large atolls, or that so many large volcanic craterswould be crowded together beneath the sea where chains of atolls existed. Darwin also pointed out thecrater theory was too atoll-centric and neglected two other common forms of reefs: the fringing reefs thatsurround oceanic islands, and barrier reefs that surround island lagoons. Instead, Darwin proposed a
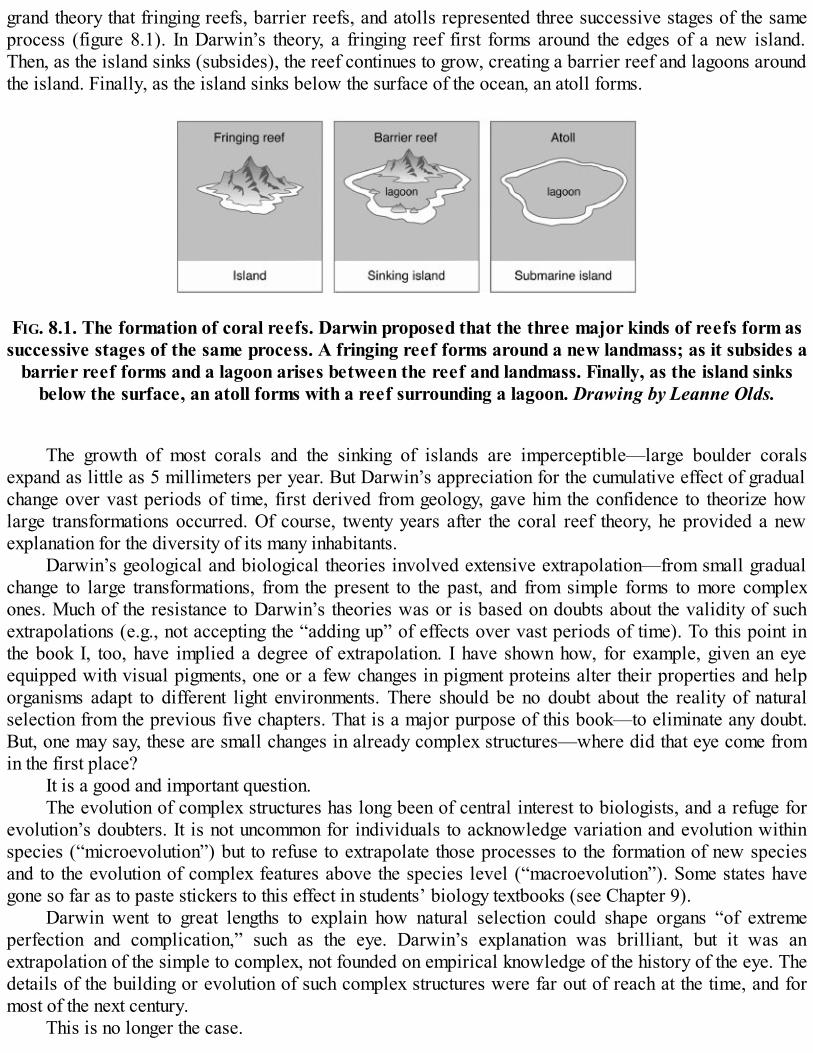
grand theory that fringing reefs, barrier reefs, and atolls represented three successive stages of the sameprocess (figure 8.1). In Darwin’s theory, a fringing reef first forms around the edges of a new island.Then, as the island sinks (subsides), the reef continues to grow, creating a barrier reef and lagoons aroundthe island. Finally, as the island sinks below the surface of the ocean, an atoll forms.
FIG. 8.1. The formation of coral reefs. Darwin proposed that the three major kinds of reefs form assuccessive stages of the same process. A fringing reef forms around a new landmass; as it subsides a
barrier reef forms and a lagoon arises between the reef and landmass. Finally, as the island sinksbelow the surface, an atoll forms with a reef surrounding a lagoon. Drawing by Leanne Olds.
The growth of most corals and the sinking of islands are imperceptible—large boulder coralsexpand as little as 5 millimeters per year. But Darwin’s appreciation for the cumulative effect of gradualchange over vast periods of time, first derived from geology, gave him the confidence to theorize howlarge transformations occurred. Of course, twenty years after the coral reef theory, he provided a newexplanation for the diversity of its many inhabitants.
Darwin’s geological and biological theories involved extensive extrapolation—from small gradualchange to large transformations, from the present to the past, and from simple forms to more complexones. Much of the resistance to Darwin’s theories was or is based on doubts about the validity of suchextrapolations (e.g., not accepting the “adding up” of effects over vast periods of time). To this point inthe book I, too, have implied a degree of extrapolation. I have shown how, for example, given an eyeequipped with visual pigments, one or a few changes in pigment proteins alter their properties and helporganisms adapt to different light environments. There should be no doubt about the reality of naturalselection from the previous five chapters. That is a major purpose of this book—to eliminate any doubt.But, one may say, these are small changes in already complex structures—where did that eye come fromin the first place?
It is a good and important question.The evolution of complex structures has long been of central interest to biologists, and a refuge for
evolution’s doubters. It is not uncommon for individuals to acknowledge variation and evolution withinspecies (“microevolution”) but to refuse to extrapolate those processes to the formation of new speciesand to the evolution of complex features above the species level (“macroevolution”). Some states havegone so far as to paste stickers to this effect in students’ biology textbooks (see Chapter 9).
Darwin went to great lengths to explain how natural selection could shape organs “of extremeperfection and complication,” such as the eye. Darwin’s explanation was brilliant, but it was anextrapolation of the simple to complex, not founded on empirical knowledge of the history of the eye. Thedetails of the building or evolution of such complex structures were far out of reach at the time, and formost of the next century.
This is no longer the case.
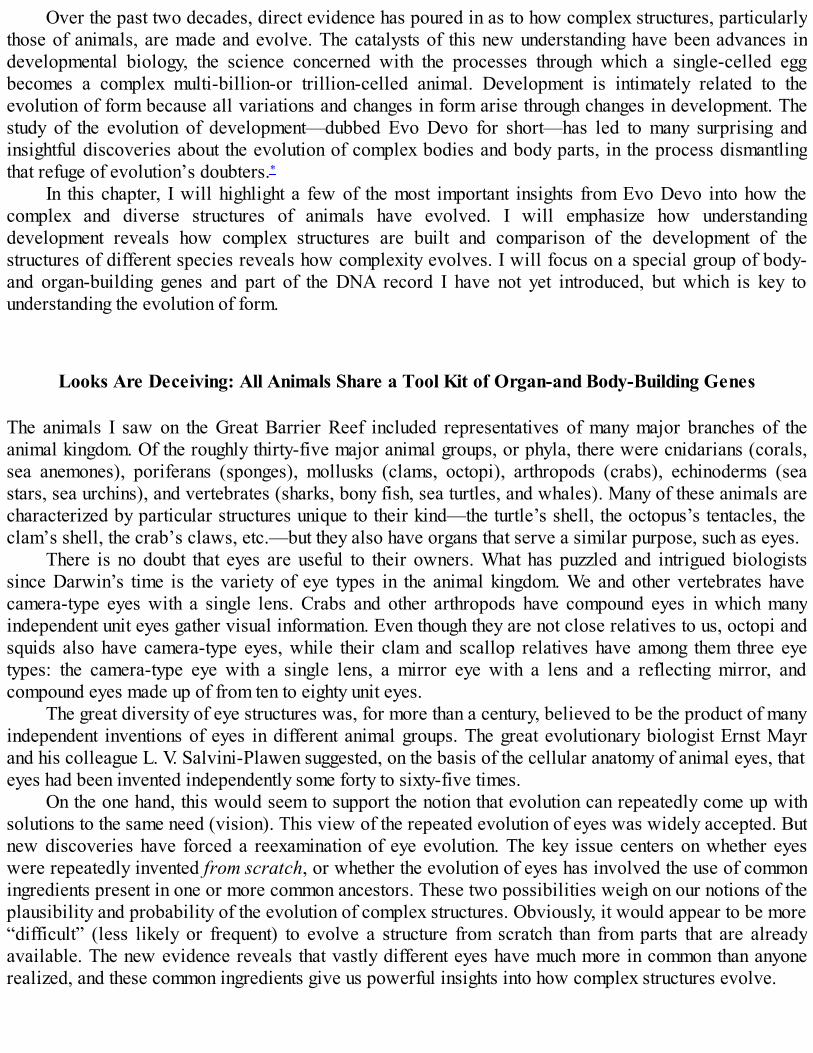
Over the past two decades, direct evidence has poured in as to how complex structures, particularlythose of animals, are made and evolve. The catalysts of this new understanding have been advances indevelopmental biology, the science concerned with the processes through which a single-celled eggbecomes a complex multi-billion-or trillion-celled animal. Development is intimately related to theevolution of form because all variations and changes in form arise through changes in development. Thestudy of the evolution of development—dubbed Evo Devo for short—has led to many surprising andinsightful discoveries about the evolution of complex bodies and body parts, in the process dismantlingthat refuge of evolution’s doubters.*
In this chapter, I will highlight a few of the most important insights from Evo Devo into how thecomplex and diverse structures of animals have evolved. I will emphasize how understandingdevelopment reveals how complex structures are built and comparison of the development of thestructures of different species reveals how complexity evolves. I will focus on a special group of body-and organ-building genes and part of the DNA record I have not yet introduced, but which is key tounderstanding the evolution of form.
Looks Are Deceiving: All Animals Share a Tool Kit of Organ-and Body-Building Genes
The animals I saw on the Great Barrier Reef included representatives of many major branches of theanimal kingdom. Of the roughly thirty-five major animal groups, or phyla, there were cnidarians (corals,sea anemones), poriferans (sponges), mollusks (clams, octopi), arthropods (crabs), echinoderms (seastars, sea urchins), and vertebrates (sharks, bony fish, sea turtles, and whales). Many of these animals arecharacterized by particular structures unique to their kind—the turtle’s shell, the octopus’s tentacles, theclam’s shell, the crab’s claws, etc.—but they also have organs that serve a similar purpose, such as eyes.
There is no doubt that eyes are useful to their owners. What has puzzled and intrigued biologistssince Darwin’s time is the variety of eye types in the animal kingdom. We and other vertebrates havecamera-type eyes with a single lens. Crabs and other arthropods have compound eyes in which manyindependent unit eyes gather visual information. Even though they are not close relatives to us, octopi andsquids also have camera-type eyes, while their clam and scallop relatives have among them three eyetypes: the camera-type eye with a single lens, a mirror eye with a lens and a reflecting mirror, andcompound eyes made up of from ten to eighty unit eyes.
The great diversity of eye structures was, for more than a century, believed to be the product of manyindependent inventions of eyes in different animal groups. The great evolutionary biologist Ernst Mayrand his colleague L. V. Salvini-Plawen suggested, on the basis of the cellular anatomy of animal eyes, thateyes had been invented independently some forty to sixty-five times.
On the one hand, this would seem to support the notion that evolution can repeatedly come up withsolutions to the same need (vision). This view of the repeated evolution of eyes was widely accepted. Butnew discoveries have forced a reexamination of eye evolution. The key issue centers on whether eyeswere repeatedly invented from scratch, or whether the evolution of eyes has involved the use of commoningredients present in one or more common ancestors. These two possibilities weigh on our notions of theplausibility and probability of the evolution of complex structures. Obviously, it would appear to be more“difficult” (less likely or frequent) to evolve a structure from scratch than from parts that are alreadyavailable. The new evidence reveals that vastly different eyes have much more in common than anyonerealized, and these common ingredients give us powerful insights into how complex structures evolve.
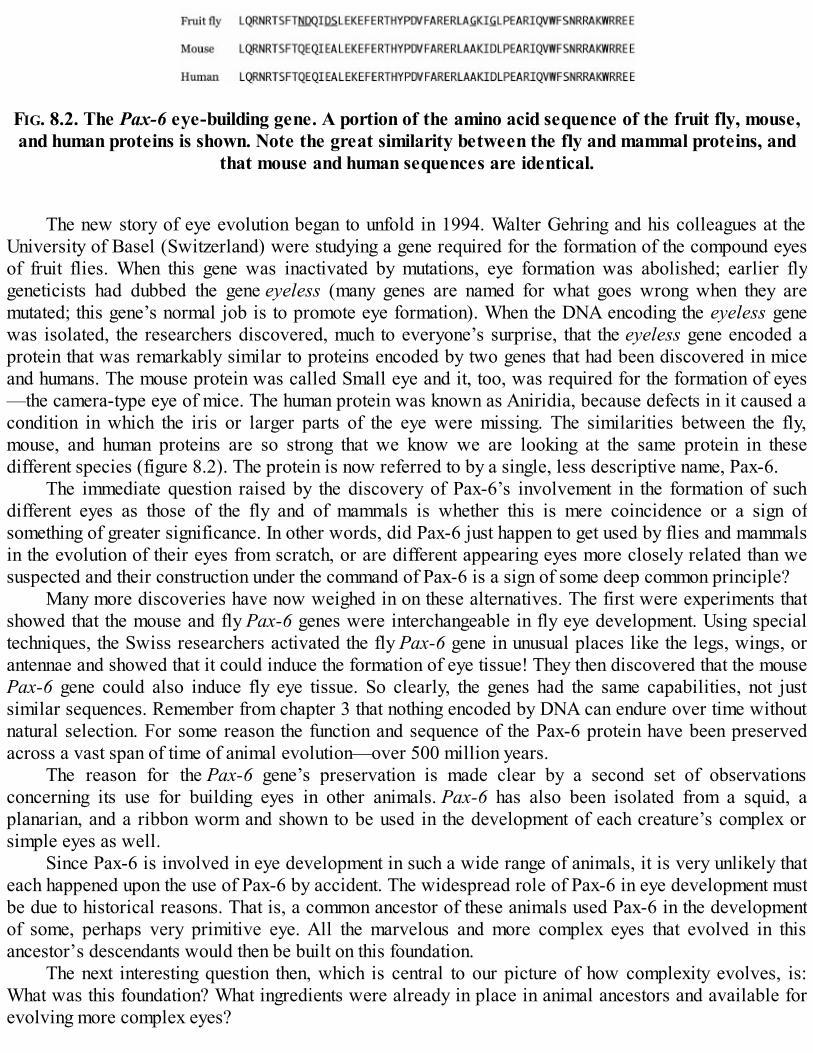
FIG. 8.2. The Pax-6 eye-building gene. A portion of the amino acid sequence of the fruit fly, mouse,and human proteins is shown. Note the great similarity between the fly and mammal proteins, and
that mouse and human sequences are identical.
The new story of eye evolution began to unfold in 1994. Walter Gehring and his colleagues at theUniversity of Basel (Switzerland) were studying a gene required for the formation of the compound eyesof fruit flies. When this gene was inactivated by mutations, eye formation was abolished; earlier flygeneticists had dubbed the gene eyeless (many genes are named for what goes wrong when they aremutated; this gene’s normal job is to promote eye formation). When the DNA encoding the eyeless genewas isolated, the researchers discovered, much to everyone’s surprise, that the eyeless gene encoded aprotein that was remarkably similar to proteins encoded by two genes that had been discovered in miceand humans. The mouse protein was called Small eye and it, too, was required for the formation of eyes—the camera-type eye of mice. The human protein was known as Aniridia, because defects in it caused acondition in which the iris or larger parts of the eye were missing. The similarities between the fly,mouse, and human proteins are so strong that we know we are looking at the same protein in thesedifferent species (figure 8.2). The protein is now referred to by a single, less descriptive name, Pax-6.
The immediate question raised by the discovery of Pax-6’s involvement in the formation of suchdifferent eyes as those of the fly and of mammals is whether this is mere coincidence or a sign ofsomething of greater significance. In other words, did Pax-6 just happen to get used by flies and mammalsin the evolution of their eyes from scratch, or are different appearing eyes more closely related than wesuspected and their construction under the command of Pax-6 is a sign of some deep common principle?
Many more discoveries have now weighed in on these alternatives. The first were experiments thatshowed that the mouse and fly Pax-6 genes were interchangeable in fly eye development. Using specialtechniques, the Swiss researchers activated the fly Pax-6 gene in unusual places like the legs, wings, orantennae and showed that it could induce the formation of eye tissue! They then discovered that the mousePax-6 gene could also induce fly eye tissue. So clearly, the genes had the same capabilities, not justsimilar sequences. Remember from chapter 3 that nothing encoded by DNA can endure over time withoutnatural selection. For some reason the function and sequence of the Pax-6 protein have been preservedacross a vast span of time of animal evolution—over 500 million years.
The reason for the Pax-6 gene’s preservation is made clear by a second set of observationsconcerning its use for building eyes in other animals. Pax-6 has also been isolated from a squid, aplanarian, and a ribbon worm and shown to be used in the development of each creature’s complex orsimple eyes as well.
Since Pax-6 is involved in eye development in such a wide range of animals, it is very unlikely thateach happened upon the use of Pax-6 by accident. The widespread role of Pax-6 in eye development mustbe due to historical reasons. That is, a common ancestor of these animals used Pax-6 in the developmentof some, perhaps very primitive eye. All the marvelous and more complex eyes that evolved in thisancestor’s descendants would then be built on this foundation.
The next interesting question then, which is central to our picture of how complexity evolves, is:What was this foundation? What ingredients were already in place in animal ancestors and available forevolving more complex eyes?
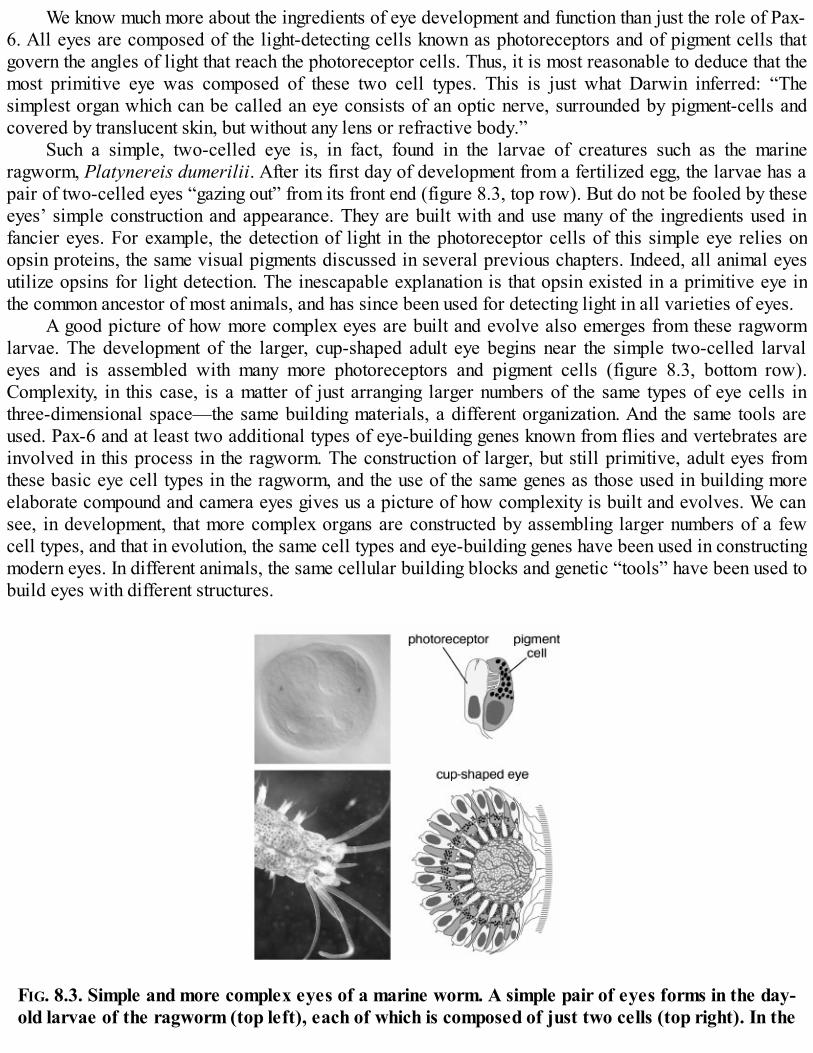
We know much more about the ingredients of eye development and function than just the role of Pax-6. All eyes are composed of the light-detecting cells known as photoreceptors and of pigment cells thatgovern the angles of light that reach the photoreceptor cells. Thus, it is most reasonable to deduce that themost primitive eye was composed of these two cell types. This is just what Darwin inferred: “Thesimplest organ which can be called an eye consists of an optic nerve, surrounded by pigment-cells andcovered by translucent skin, but without any lens or refractive body.”
Such a simple, two-celled eye is, in fact, found in the larvae of creatures such as the marineragworm, Platynereis dumerilii. After its first day of development from a fertilized egg, the larvae has apair of two-celled eyes “gazing out” from its front end (figure 8.3, top row). But do not be fooled by theseeyes’ simple construction and appearance. They are built with and use many of the ingredients used infancier eyes. For example, the detection of light in the photoreceptor cells of this simple eye relies onopsin proteins, the same visual pigments discussed in several previous chapters. Indeed, all animal eyesutilize opsins for light detection. The inescapable explanation is that opsin existed in a primitive eye inthe common ancestor of most animals, and has since been used for detecting light in all varieties of eyes.
A good picture of how more complex eyes are built and evolve also emerges from these ragwormlarvae. The development of the larger, cup-shaped adult eye begins near the simple two-celled larvaleyes and is assembled with many more photoreceptors and pigment cells (figure 8.3, bottom row).Complexity, in this case, is a matter of just arranging larger numbers of the same types of eye cells inthree-dimensional space—the same building materials, a different organization. And the same tools areused. Pax-6 and at least two additional types of eye-building genes known from flies and vertebrates areinvolved in this process in the ragworm. The construction of larger, but still primitive, adult eyes fromthese basic eye cell types in the ragworm, and the use of the same genes as those used in building moreelaborate compound and camera eyes gives us a picture of how complexity is built and evolves. We cansee, in development, that more complex organs are constructed by assembling larger numbers of a fewcell types, and that in evolution, the same cell types and eye-building genes have been used in constructingmodern eyes. In different animals, the same cellular building blocks and genetic “tools” have been used tobuild eyes with different structures.
FIG. 8.3. Simple and more complex eyes of a marine worm. A simple pair of eyes forms in the day-old larvae of the ragworm (top left), each of which is composed of just two cells (top right). In the
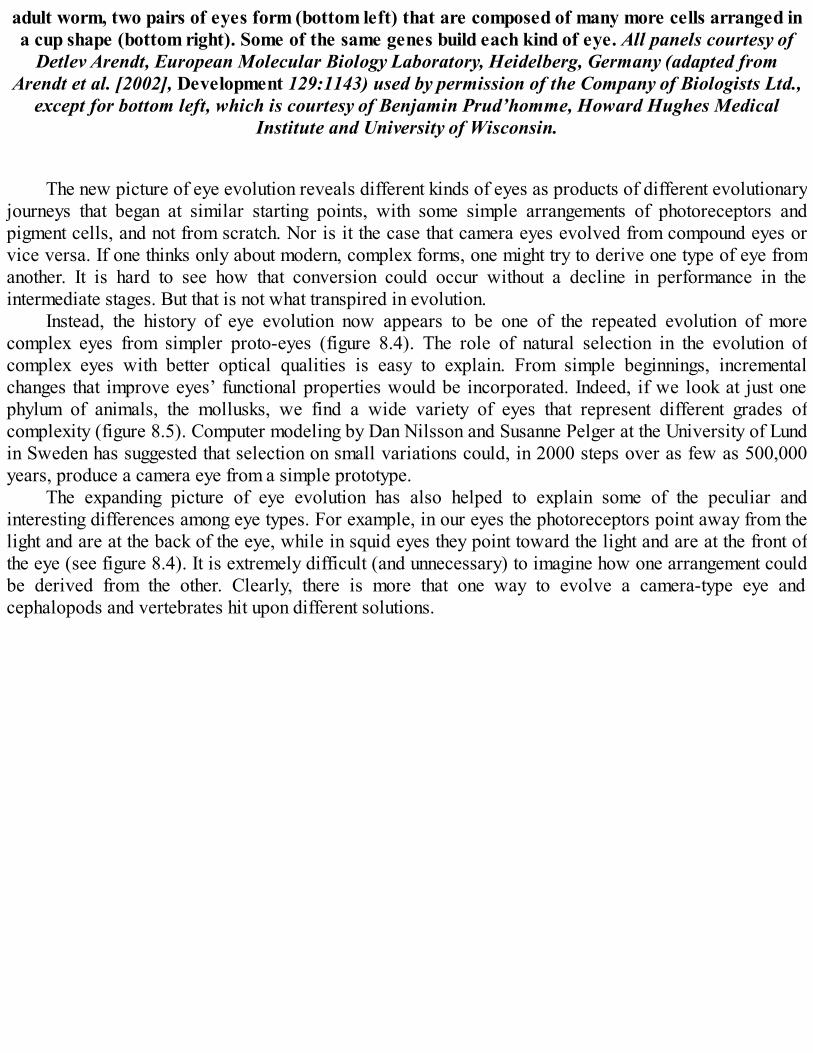
adult worm, two pairs of eyes form (bottom left) that are composed of many more cells arranged ina cup shape (bottom right). Some of the same genes build each kind of eye. All panels courtesy of
Detlev Arendt, European Molecular Biology Laboratory, Heidelberg, Germany (adapted fromArendt et al. [2002], Development 129:1143) used by permission of the Company of Biologists Ltd.,
except for bottom left, which is courtesy of Benjamin Prud’homme, Howard Hughes MedicalInstitute and University of Wisconsin.
The new picture of eye evolution reveals different kinds of eyes as products of different evolutionaryjourneys that began at similar starting points, with some simple arrangements of photoreceptors andpigment cells, and not from scratch. Nor is it the case that camera eyes evolved from compound eyes orvice versa. If one thinks only about modern, complex forms, one might try to derive one type of eye fromanother. It is hard to see how that conversion could occur without a decline in performance in theintermediate stages. But that is not what transpired in evolution.
Instead, the history of eye evolution now appears to be one of the repeated evolution of morecomplex eyes from simpler proto-eyes (figure 8.4). The role of natural selection in the evolution ofcomplex eyes with better optical qualities is easy to explain. From simple beginnings, incrementalchanges that improve eyes’ functional properties would be incorporated. Indeed, if we look at just onephylum of animals, the mollusks, we find a wide variety of eyes that represent different grades ofcomplexity (figure 8.5). Computer modeling by Dan Nilsson and Susanne Pelger at the University of Lundin Sweden has suggested that selection on small variations could, in 2000 steps over as few as 500,000years, produce a camera eye from a simple prototype.
The expanding picture of eye evolution has also helped to explain some of the peculiar andinteresting differences among eye types. For example, in our eyes the photoreceptors point away from thelight and are at the back of the eye, while in squid eyes they point toward the light and are at the front ofthe eye (see figure 8.4). It is extremely difficult (and unnecessary) to imagine how one arrangement couldbe derived from the other. Clearly, there is more that one way to evolve a camera-type eye andcephalopods and vertebrates hit upon different solutions.
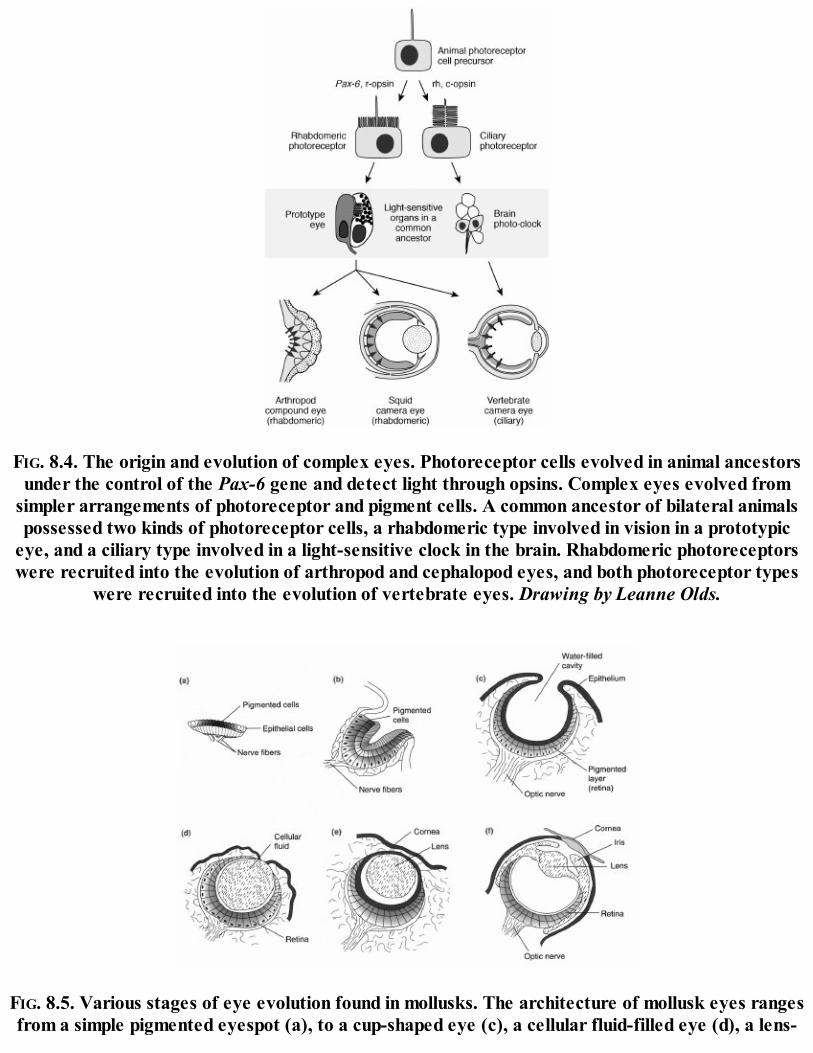
FIG. 8.4. The origin and evolution of complex eyes. Photoreceptor cells evolved in animal ancestorsunder the control of the Pax-6 gene and detect light through opsins. Complex eyes evolved from
simpler arrangements of photoreceptor and pigment cells. A common ancestor of bilateral animalspossessed two kinds of photoreceptor cells, a rhabdomeric type involved in vision in a prototypic
eye, and a ciliary type involved in a light-sensitive clock in the brain. Rhabdomeric photoreceptorswere recruited into the evolution of arthropod and cephalopod eyes, and both photoreceptor types
were recruited into the evolution of vertebrate eyes. Drawing by Leanne Olds.
FIG. 8.5. Various stages of eye evolution found in mollusks. The architecture of mollusk eyes rangesfrom a simple pigmented eyespot (a), to a cup-shaped eye (c), a cellular fluid-filled eye (d), a lens-
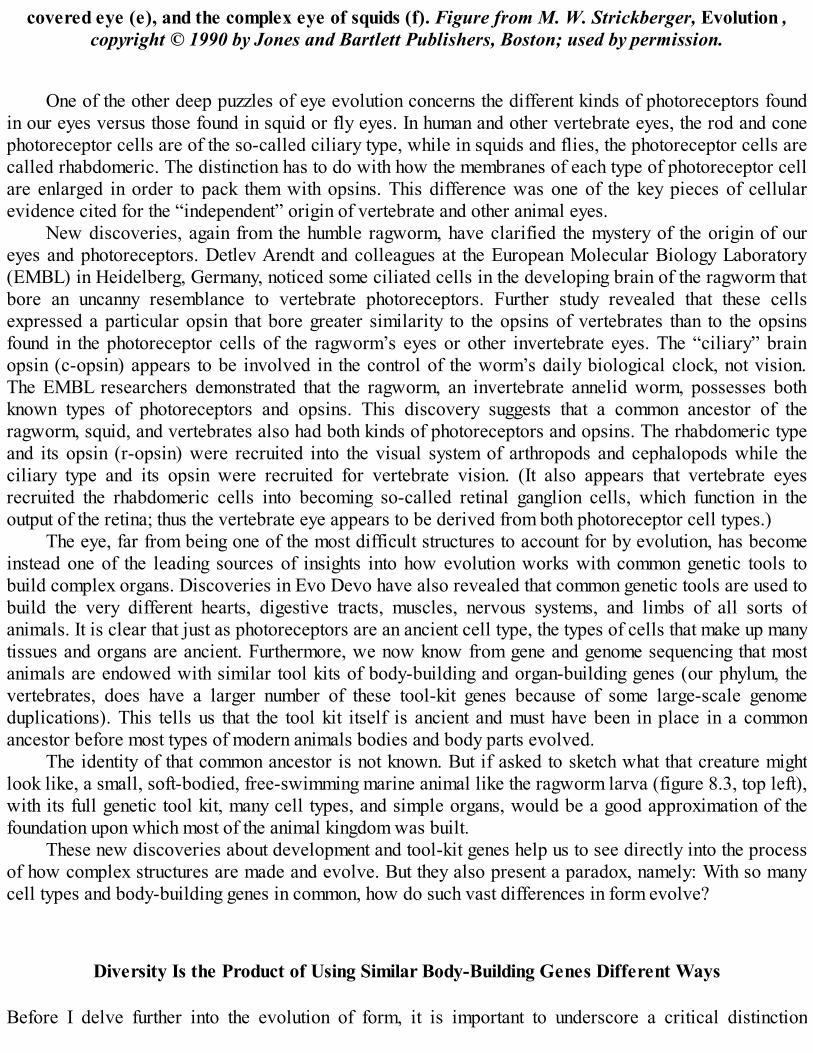
covered eye (e), and the complex eye of squids (f). Figure from M. W. Strickberger, Evolution ,copyright © 1990 by Jones and Bartlett Publishers, Boston; used by permission.
One of the other deep puzzles of eye evolution concerns the different kinds of photoreceptors foundin our eyes versus those found in squid or fly eyes. In human and other vertebrate eyes, the rod and conephotoreceptor cells are of the so-called ciliary type, while in squids and flies, the photoreceptor cells arecalled rhabdomeric. The distinction has to do with how the membranes of each type of photoreceptor cellare enlarged in order to pack them with opsins. This difference was one of the key pieces of cellularevidence cited for the “independent” origin of vertebrate and other animal eyes.
New discoveries, again from the humble ragworm, have clarified the mystery of the origin of oureyes and photoreceptors. Detlev Arendt and colleagues at the European Molecular Biology Laboratory(EMBL) in Heidelberg, Germany, noticed some ciliated cells in the developing brain of the ragworm thatbore an uncanny resemblance to vertebrate photoreceptors. Further study revealed that these cellsexpressed a particular opsin that bore greater similarity to the opsins of vertebrates than to the opsinsfound in the photoreceptor cells of the ragworm’s eyes or other invertebrate eyes. The “ciliary” brainopsin (c-opsin) appears to be involved in the control of the worm’s daily biological clock, not vision.The EMBL researchers demonstrated that the ragworm, an invertebrate annelid worm, possesses bothknown types of photoreceptors and opsins. This discovery suggests that a common ancestor of theragworm, squid, and vertebrates also had both kinds of photoreceptors and opsins. The rhabdomeric typeand its opsin (r-opsin) were recruited into the visual system of arthropods and cephalopods while theciliary type and its opsin were recruited for vertebrate vision. (It also appears that vertebrate eyesrecruited the rhabdomeric cells into becoming so-called retinal ganglion cells, which function in theoutput of the retina; thus the vertebrate eye appears to be derived from both photoreceptor cell types.)
The eye, far from being one of the most difficult structures to account for by evolution, has becomeinstead one of the leading sources of insights into how evolution works with common genetic tools tobuild complex organs. Discoveries in Evo Devo have also revealed that common genetic tools are used tobuild the very different hearts, digestive tracts, muscles, nervous systems, and limbs of all sorts ofanimals. It is clear that just as photoreceptors are an ancient cell type, the types of cells that make up manytissues and organs are ancient. Furthermore, we now know from gene and genome sequencing that mostanimals are endowed with similar tool kits of body-building and organ-building genes (our phylum, thevertebrates, does have a larger number of these tool-kit genes because of some large-scale genomeduplications). This tells us that the tool kit itself is ancient and must have been in place in a commonancestor before most types of modern animals bodies and body parts evolved.
The identity of that common ancestor is not known. But if asked to sketch what that creature mightlook like, a small, soft-bodied, free-swimming marine animal like the ragworm larva (figure 8.3, top left),with its full genetic tool kit, many cell types, and simple organs, would be a good approximation of thefoundation upon which most of the animal kingdom was built.
These new discoveries about development and tool-kit genes help us to see directly into the processof how complex structures are made and evolve. But they also present a paradox, namely: With so manycell types and body-building genes in common, how do such vast differences in form evolve?
Diversity Is the Product of Using Similar Body-Building Genes Different Ways
Before I delve further into the evolution of form, it is important to underscore a critical distinction
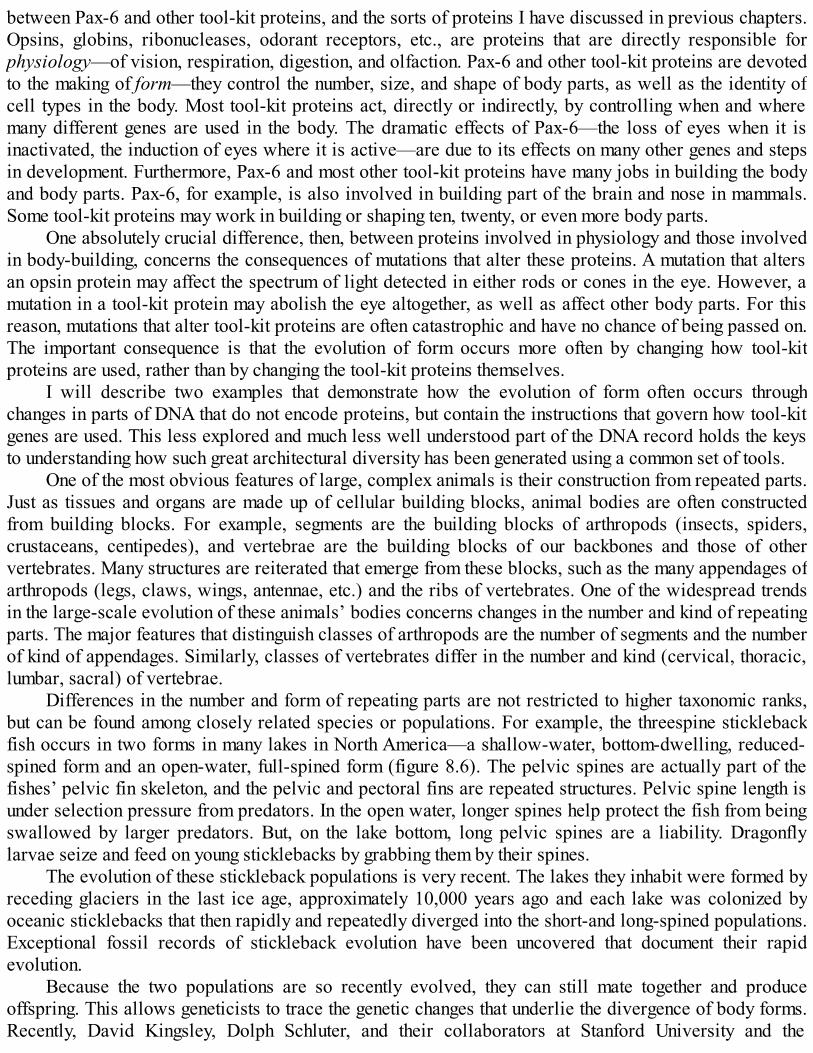
between Pax-6 and other tool-kit proteins, and the sorts of proteins I have discussed in previous chapters.Opsins, globins, ribonucleases, odorant receptors, etc., are proteins that are directly responsible forphysiology—of vision, respiration, digestion, and olfaction. Pax-6 and other tool-kit proteins are devotedto the making of form—they control the number, size, and shape of body parts, as well as the identity ofcell types in the body. Most tool-kit proteins act, directly or indirectly, by controlling when and wheremany different genes are used in the body. The dramatic effects of Pax-6—the loss of eyes when it isinactivated, the induction of eyes where it is active—are due to its effects on many other genes and stepsin development. Furthermore, Pax-6 and most other tool-kit proteins have many jobs in building the bodyand body parts. Pax-6, for example, is also involved in building part of the brain and nose in mammals.Some tool-kit proteins may work in building or shaping ten, twenty, or even more body parts.
One absolutely crucial difference, then, between proteins involved in physiology and those involvedin body-building, concerns the consequences of mutations that alter these proteins. A mutation that altersan opsin protein may affect the spectrum of light detected in either rods or cones in the eye. However, amutation in a tool-kit protein may abolish the eye altogether, as well as affect other body parts. For thisreason, mutations that alter tool-kit proteins are often catastrophic and have no chance of being passed on.The important consequence is that the evolution of form occurs more often by changing how tool-kitproteins are used, rather than by changing the tool-kit proteins themselves.
I will describe two examples that demonstrate how the evolution of form often occurs throughchanges in parts of DNA that do not encode proteins, but contain the instructions that govern how tool-kitgenes are used. This less explored and much less well understood part of the DNA record holds the keysto understanding how such great architectural diversity has been generated using a common set of tools.
One of the most obvious features of large, complex animals is their construction from repeated parts.Just as tissues and organs are made up of cellular building blocks, animal bodies are often constructedfrom building blocks. For example, segments are the building blocks of arthropods (insects, spiders,crustaceans, centipedes), and vertebrae are the building blocks of our backbones and those of othervertebrates. Many structures are reiterated that emerge from these blocks, such as the many appendages ofarthropods (legs, claws, wings, antennae, etc.) and the ribs of vertebrates. One of the widespread trendsin the large-scale evolution of these animals’ bodies concerns changes in the number and kind of repeatingparts. The major features that distinguish classes of arthropods are the number of segments and the numberof kind of appendages. Similarly, classes of vertebrates differ in the number and kind (cervical, thoracic,lumbar, sacral) of vertebrae.
Differences in the number and form of repeating parts are not restricted to higher taxonomic ranks,but can be found among closely related species or populations. For example, the threespine sticklebackfish occurs in two forms in many lakes in North America—a shallow-water, bottom-dwelling, reduced-spined form and an open-water, full-spined form (figure 8.6). The pelvic spines are actually part of thefishes’ pelvic fin skeleton, and the pelvic and pectoral fins are repeated structures. Pelvic spine length isunder selection pressure from predators. In the open water, longer spines help protect the fish from beingswallowed by larger predators. But, on the lake bottom, long pelvic spines are a liability. Dragonflylarvae seize and feed on young sticklebacks by grabbing them by their spines.
The evolution of these stickleback populations is very recent. The lakes they inhabit were formed byreceding glaciers in the last ice age, approximately 10,000 years ago and each lake was colonized byoceanic sticklebacks that then rapidly and repeatedly diverged into the short-and long-spined populations.Exceptional fossil records of stickleback evolution have been uncovered that document their rapidevolution.
Because the two populations are so recently evolved, they can still mate together and produceoffspring. This allows geneticists to trace the genetic changes that underlie the divergence of body forms.Recently, David Kingsley, Dolph Schluter, and their collaborators at Stanford University and the
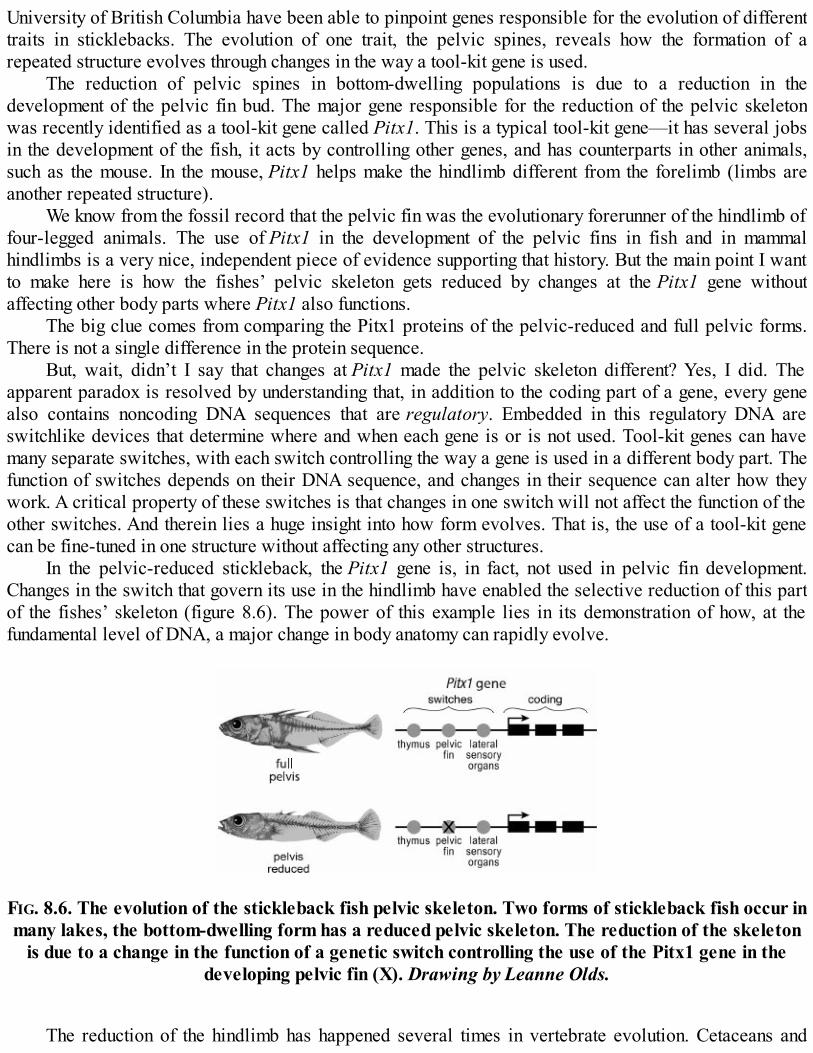
University of British Columbia have been able to pinpoint genes responsible for the evolution of differenttraits in sticklebacks. The evolution of one trait, the pelvic spines, reveals how the formation of arepeated structure evolves through changes in the way a tool-kit gene is used.
The reduction of pelvic spines in bottom-dwelling populations is due to a reduction in thedevelopment of the pelvic fin bud. The major gene responsible for the reduction of the pelvic skeletonwas recently identified as a tool-kit gene called Pitx1. This is a typical tool-kit gene—it has several jobsin the development of the fish, it acts by controlling other genes, and has counterparts in other animals,such as the mouse. In the mouse, Pitx1 helps make the hindlimb different from the forelimb (limbs areanother repeated structure).
We know from the fossil record that the pelvic fin was the evolutionary forerunner of the hindlimb offour-legged animals. The use of Pitx1 in the development of the pelvic fins in fish and in mammalhindlimbs is a very nice, independent piece of evidence supporting that history. But the main point I wantto make here is how the fishes’ pelvic skeleton gets reduced by changes at the Pitx1 gene withoutaffecting other body parts where Pitx1 also functions.
The big clue comes from comparing the Pitx1 proteins of the pelvic-reduced and full pelvic forms.There is not a single difference in the protein sequence.
But, wait, didn’t I say that changes at Pitx1 made the pelvic skeleton different? Yes, I did. Theapparent paradox is resolved by understanding that, in addition to the coding part of a gene, every genealso contains noncoding DNA sequences that are regulatory. Embedded in this regulatory DNA areswitchlike devices that determine where and when each gene is or is not used. Tool-kit genes can havemany separate switches, with each switch controlling the way a gene is used in a different body part. Thefunction of switches depends on their DNA sequence, and changes in their sequence can alter how theywork. A critical property of these switches is that changes in one switch will not affect the function of theother switches. And therein lies a huge insight into how form evolves. That is, the use of a tool-kit genecan be fine-tuned in one structure without affecting any other structures.
In the pelvic-reduced stickleback, the Pitx1 gene is, in fact, not used in pelvic fin development.Changes in the switch that govern its use in the hindlimb have enabled the selective reduction of this partof the fishes’ skeleton (figure 8.6). The power of this example lies in its demonstration of how, at thefundamental level of DNA, a major change in body anatomy can rapidly evolve.
FIG. 8.6. The evolution of the stickleback fish pelvic skeleton. Two forms of stickleback fish occur inmany lakes, the bottom-dwelling form has a reduced pelvic skeleton. The reduction of the skeleton
is due to a change in the function of a genetic switch controlling the use of the Pitx1 gene in thedeveloping pelvic fin (X). Drawing by Leanne Olds.
The reduction of the hindlimb has happened several times in vertebrate evolution. Cetaceans and

manatees have evolved greatly reduced hindlimbs as they evolved from land-dwelling ancestors intoaquatic forms, and snakes and legless lizards have also reduced their limbs. The sticklebacks, and a largebody of work on other animals that I will not describe here, are revealing how such changes in body formand complex structures are achieved.
The reduction and loss of structures is just one facet of the evolution of form. Of course, we alsowant to know how new features evolve, and the evolution of switches is again center stage.
Endless Flies Most Beautiful
While tropical fish, butterflies, and birds probably hold the top rankings for color and beauty in theanimal kingdom, in the kingdom of biological research few animals rival the fruit fly. The discovery offruit fly body-building genes sparked the resurgence of developmental biology and the emergence of EvoDevo. More recently, the diversity of fruit fly wing patterns, albeit less colorful than those of birds orbutterflies, has helped illuminate how new traits evolve.
The laboratory fruit fly Drosophila melanogaster has pale wings but its many cousins in the largefamily to which it belongs display a great variety of black pigment patterns (figure 8.7). In many species,the pigment patterns are restricted to males and are displayed during elaborate courtship dances as themale sways or preens in front of the female. A common pattern is a black spot near the tip of the wing.
In my laboratory at the University of Wisconsin, we have been tracing how such spots are made andevolve. These spots are an excellent illustration of the general phenomenon that new patterns evolve when“old” genes learn new tricks.
The making of the black spots involves enzymes that synthesize melanin, the black pigment describedin chapter 7. Think of these enzymes as paintbrushes in the tool kit. In species that have black patterns onthe wing, these paintbrushes are used in patterns that foreshadow the black pigment areas. The patternsare controlled by switches that surround the coding part of each paintbrush gene. In the evolution of blackspots on the wing, several changes have occurred in switches of paintbrush genes. The evolution of a darkblack spot with sharp borders was not a one-step “now you don’t see it, now you do” event, but amultistep series of changes during which the intensity and the shape of the spot evolved. Thus, this“simple” spot is really a complex character, built up over time by the “adding up” of many variations—aswe think most physical traits are.
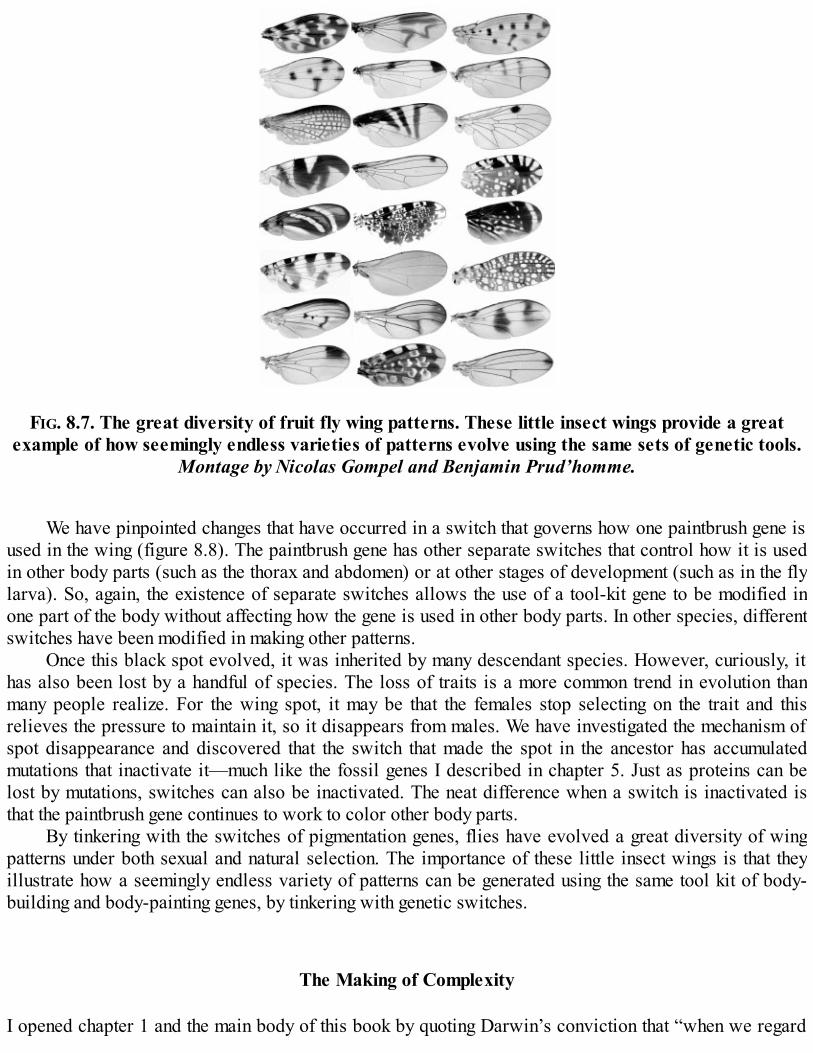
FIG. 8.7. The great diversity of fruit fly wing patterns. These little insect wings provide a greatexample of how seemingly endless varieties of patterns evolve using the same sets of genetic tools.
Montage by Nicolas Gompel and Benjamin Prud’homme.
We have pinpointed changes that have occurred in a switch that governs how one paintbrush gene isused in the wing (figure 8.8). The paintbrush gene has other separate switches that control how it is usedin other body parts (such as the thorax and abdomen) or at other stages of development (such as in the flylarva). So, again, the existence of separate switches allows the use of a tool-kit gene to be modified inone part of the body without affecting how the gene is used in other body parts. In other species, differentswitches have been modified in making other patterns.
Once this black spot evolved, it was inherited by many descendant species. However, curiously, ithas also been lost by a handful of species. The loss of traits is a more common trend in evolution thanmany people realize. For the wing spot, it may be that the females stop selecting on the trait and thisrelieves the pressure to maintain it, so it disappears from males. We have investigated the mechanism ofspot disappearance and discovered that the switch that made the spot in the ancestor has accumulatedmutations that inactivate it—much like the fossil genes I described in chapter 5. Just as proteins can belost by mutations, switches can also be inactivated. The neat difference when a switch is inactivated isthat the paintbrush gene continues to work to color other body parts.
By tinkering with the switches of pigmentation genes, flies have evolved a great diversity of wingpatterns under both sexual and natural selection. The importance of these little insect wings is that theyillustrate how a seemingly endless variety of patterns can be generated using the same tool kit of body-building and body-painting genes, by tinkering with genetic switches.
The Making of Complexity
I opened chapter 1 and the main body of this book by quoting Darwin’s conviction that “when we regard
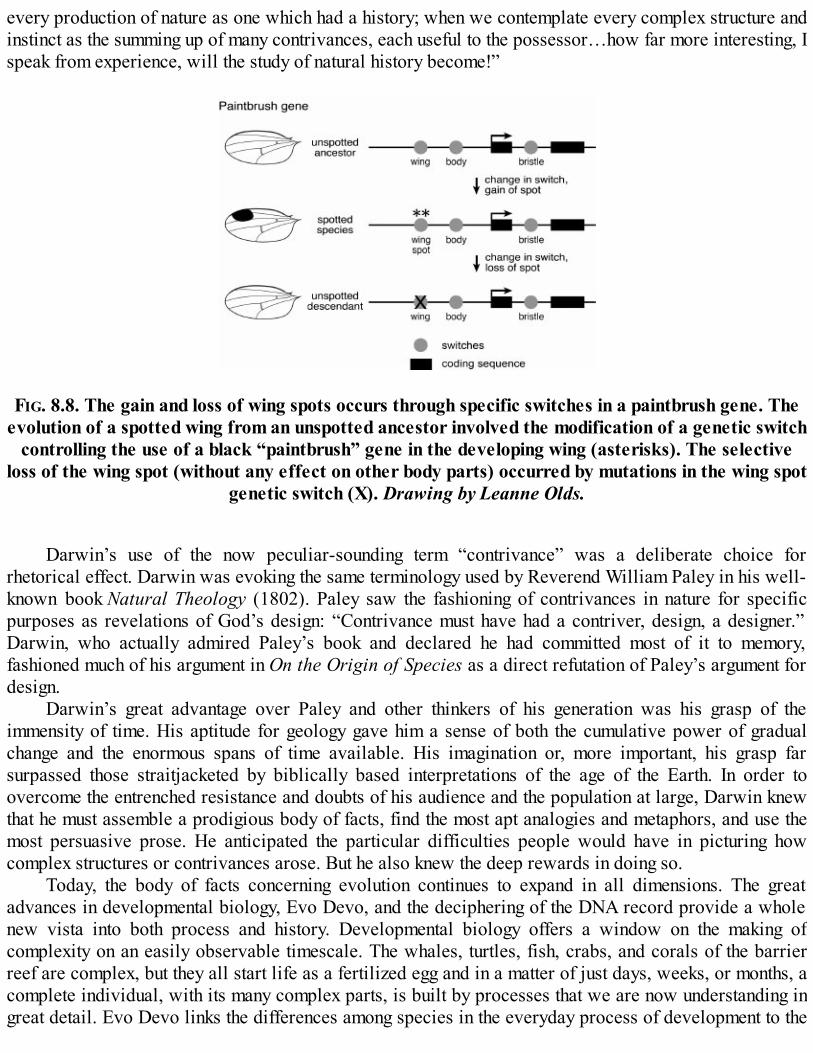
every production of nature as one which had a history; when we contemplate every complex structure andinstinct as the summing up of many contrivances, each useful to the possessor…how far more interesting, Ispeak from experience, will the study of natural history become!”
FIG. 8.8. The gain and loss of wing spots occurs through specific switches in a paintbrush gene. Theevolution of a spotted wing from an unspotted ancestor involved the modification of a genetic switch
controlling the use of a black “paintbrush” gene in the developing wing (asterisks). The selectiveloss of the wing spot (without any effect on other body parts) occurred by mutations in the wing spot
genetic switch (X). Drawing by Leanne Olds.
Darwin’s use of the now peculiar-sounding term “contrivance” was a deliberate choice forrhetorical effect. Darwin was evoking the same terminology used by Reverend William Paley in his well-known book Natural Theology (1802). Paley saw the fashioning of contrivances in nature for specificpurposes as revelations of God’s design: “Contrivance must have had a contriver, design, a designer.”Darwin, who actually admired Paley’s book and declared he had committed most of it to memory,fashioned much of his argument in On the Origin of Species as a direct refutation of Paley’s argument fordesign.
Darwin’s great advantage over Paley and other thinkers of his generation was his grasp of theimmensity of time. His aptitude for geology gave him a sense of both the cumulative power of gradualchange and the enormous spans of time available. His imagination or, more important, his grasp farsurpassed those straitjacketed by biblically based interpretations of the age of the Earth. In order toovercome the entrenched resistance and doubts of his audience and the population at large, Darwin knewthat he must assemble a prodigious body of facts, find the most apt analogies and metaphors, and use themost persuasive prose. He anticipated the particular difficulties people would have in picturing howcomplex structures or contrivances arose. But he also knew the deep rewards in doing so.
Today, the body of facts concerning evolution continues to expand in all dimensions. The greatadvances in developmental biology, Evo Devo, and the deciphering of the DNA record provide a wholenew vista into both process and history. Developmental biology offers a window on the making ofcomplexity on an easily observable timescale. The whales, turtles, fish, crabs, and corals of the barrierreef are complex, but they all start life as a fertilized egg and in a matter of just days, weeks, or months, acomplete individual, with its many complex parts, is built by processes that we are now understanding ingreat detail. Evo Devo links the differences among species in the everyday process of development to the
long-term process of the evolutionary change of form—the “summing up” of all of the changesaccumulated in development over many thousands or millions of generations. And the DNA recordenables us to reconstruct individual steps in evolution.
The argument for design by some external intelligence is eviscerated.It is hard to imagine how anyone in command of these facts could harbor any reasonable doubt.
These facts are derived from the very same science and technology that has deciphered the genetic causeof hundreds of diseases, invented dozens of new gene-derived medicines, and revolutionized forensicsand agriculture. Yet, in the face of all of the evidence, there remains much doubt and outright denial of thereality of biological evolution. To understand this doubt and denial, we’ll leave the realm of scientificevidence, because the reasons for such doubt could not be, and are not, scientific. They are cultural. Andthey can best be understood in light of the many instances in history when certain groups, out of self-interest and ideology, have denied new scientific knowledge.
It is time to move on to the afterdinner conversation.
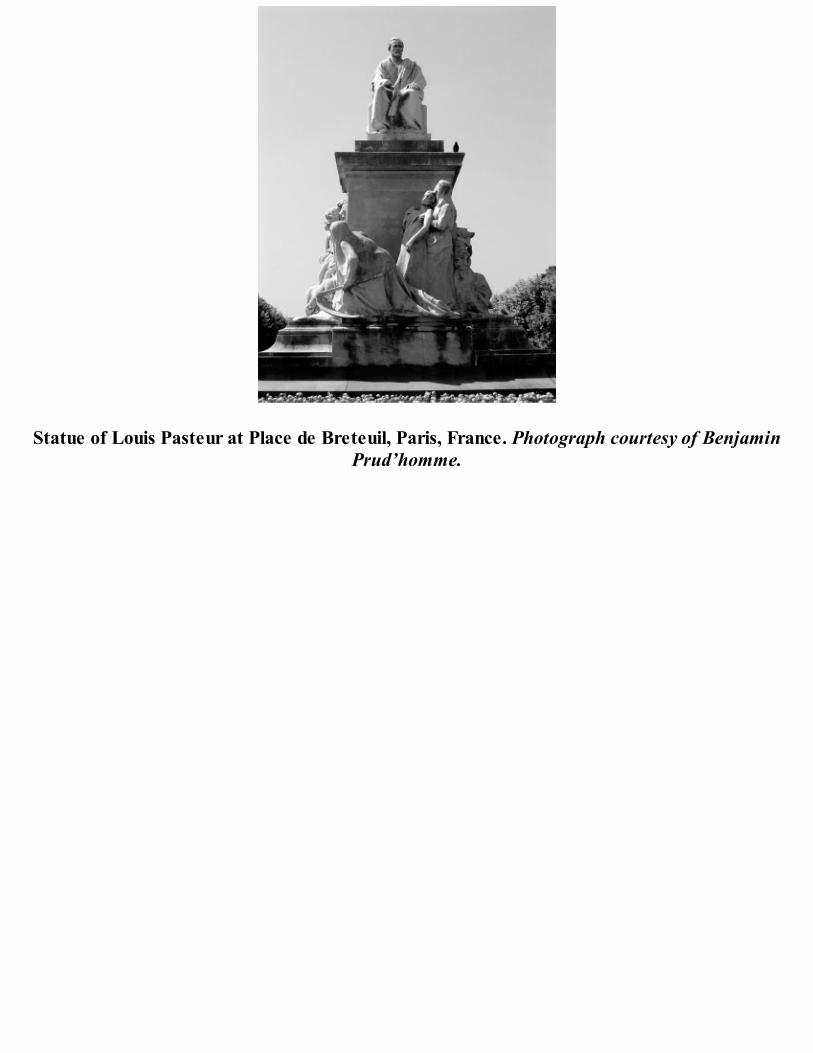
Statue of Louis Pasteur at Place de Breteuil, Paris, France. Photograph courtesy of BenjaminPrud’homme.
Chapter 9
Seeing and Believing
Thinking is seeing…every human science is based on deduction, which is a slow process ofseeing by which we work up from the effect to the cause.
—Honoré de Balzac, La Comédie humaine (1845)
IT WAS CALLED THE HOUSE OF CRIME.The clinic in the French countryside lost so many of its female patients to infection, sixteen out of
sixteen in one stretch, that its founder declared that whoever solved the problem deserved to be honoredwith a gold statue. At the Academy of Medicine in Paris, the profession was stumped. As one physicianscoffed at the notion of disease being spread by doctor’s hands, an audience member rose in anger, “Thething that kills women…is you doctors that carry deadly microbes from sick women to healthy ones.”
The man in audience was Louis Pasteur.This was 1879, thirty years after the physicians Oliver Wendell Holmes and Ignaz Semmelweis had
suggested handwashing to prevent “childbed fever.” It was more than twenty years after Pasteur haddemonstrated that the air was full of microbes that would grow under the right conditions, thus debunkingthe widely accepted myth of spontaneous generation. The germ theory had still not yet been accepted norhad its simplest application been adopted.
Some European doctors and clergy thought that childbed fever was God’s punishment to women forthe act of childbirth. Changing this point of view meant accepting not only that the lethal infection wascaused by something invisible, but that the doctors themselves were carrying it to their patients.
This stubborn disbelief could be overcome only with more evidence, and that was what Pasteur andseveral contemporaries provided. The German Robert Koch used new, more powerful microscopes tosee and identify the microbes that caused anthrax, cholera, and tuberculosis. Joseph Lister, a Scottishsurgeon, extrapolated from Pasteur’s work on germ theory and fermentation to invent means of sterilizingwounds and instruments, and thus reduced the mortality from surgery by over 70 percent.
Pasteur’s own demonstrations were perhaps the most persuasive. In the 1870s as many as half of allsheep and cattle in France were dying of anthrax. Despite great difficulties in culturing the bacterium,Pasteur succeeded in producing a vaccine and demonstrated its success in the field in 1881.
The germ theory was the foundation of many improvements to human health, including pasteurization,as well as the prevention and control of infectious diseases. Pasteur is honored not just for thesecontributions but for his embodiment of the scientific method. He had a great ability to survey all of theavailable data and to incorporate it into hypotheses, he was driven to design rigorous experiments thatwould test them, and he had the creative spark to synthesize theory and experiment into new knowledge.
Pasteur articulated the critical role of experimental evidence:
Imagination should give wings to our thoughts but we should always need decisiveexperimental proof, and when the moment comes to draw conclusions and to interpret the
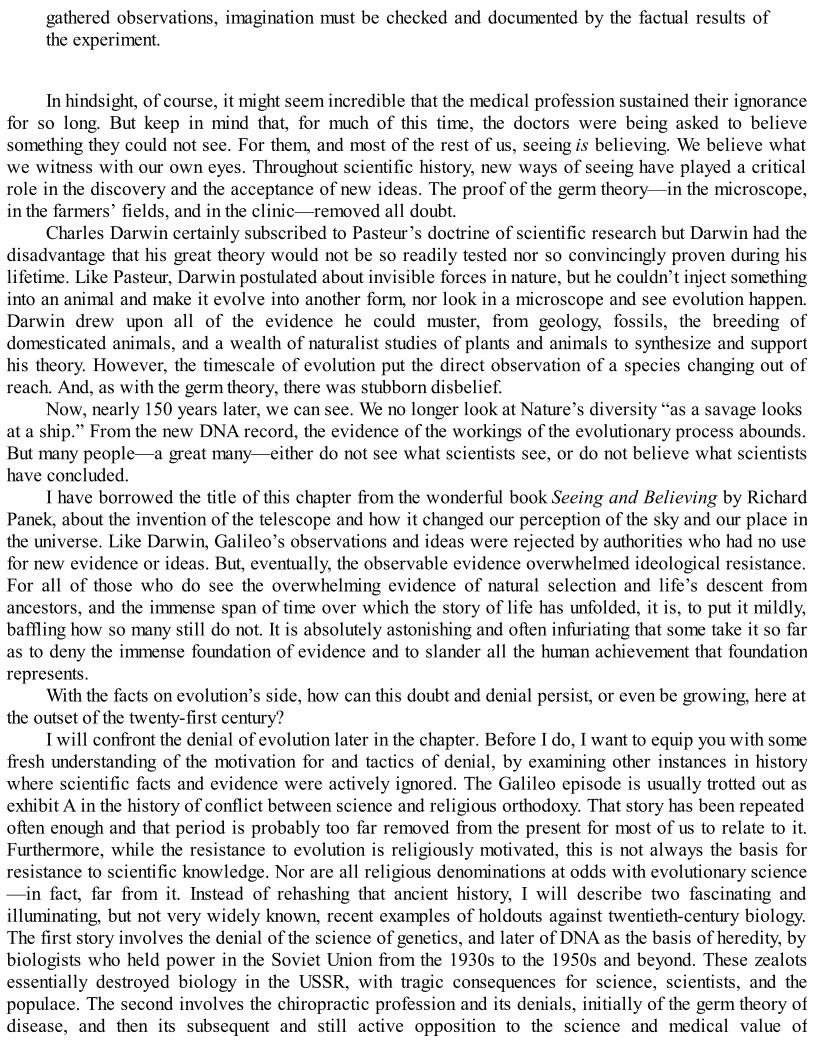
gathered observations, imagination must be checked and documented by the factual results ofthe experiment.
In hindsight, of course, it might seem incredible that the medical profession sustained their ignorancefor so long. But keep in mind that, for much of this time, the doctors were being asked to believesomething they could not see. For them, and most of the rest of us, seeing is believing. We believe whatwe witness with our own eyes. Throughout scientific history, new ways of seeing have played a criticalrole in the discovery and the acceptance of new ideas. The proof of the germ theory—in the microscope,in the farmers’ fields, and in the clinic—removed all doubt.
Charles Darwin certainly subscribed to Pasteur’s doctrine of scientific research but Darwin had thedisadvantage that his great theory would not be so readily tested nor so convincingly proven during hislifetime. Like Pasteur, Darwin postulated about invisible forces in nature, but he couldn’t inject somethinginto an animal and make it evolve into another form, nor look in a microscope and see evolution happen.Darwin drew upon all of the evidence he could muster, from geology, fossils, the breeding ofdomesticated animals, and a wealth of naturalist studies of plants and animals to synthesize and supporthis theory. However, the timescale of evolution put the direct observation of a species changing out ofreach. And, as with the germ theory, there was stubborn disbelief.
Now, nearly 150 years later, we can see. We no longer look at Nature’s diversity “as a savage looksat a ship.” From the new DNA record, the evidence of the workings of the evolutionary process abounds.But many people—a great many—either do not see what scientists see, or do not believe what scientistshave concluded.
I have borrowed the title of this chapter from the wonderful book Seeing and Believing by RichardPanek, about the invention of the telescope and how it changed our perception of the sky and our place inthe universe. Like Darwin, Galileo’s observations and ideas were rejected by authorities who had no usefor new evidence or ideas. But, eventually, the observable evidence overwhelmed ideological resistance.For all of those who do see the overwhelming evidence of natural selection and life’s descent fromancestors, and the immense span of time over which the story of life has unfolded, it is, to put it mildly,baffling how so many still do not. It is absolutely astonishing and often infuriating that some take it so faras to deny the immense foundation of evidence and to slander all the human achievement that foundationrepresents.
With the facts on evolution’s side, how can this doubt and denial persist, or even be growing, here atthe outset of the twenty-first century?
I will confront the denial of evolution later in the chapter. Before I do, I want to equip you with somefresh understanding of the motivation for and tactics of denial, by examining other instances in historywhere scientific facts and evidence were actively ignored. The Galileo episode is usually trotted out asexhibit A in the history of conflict between science and religious orthodoxy. That story has been repeatedoften enough and that period is probably too far removed from the present for most of us to relate to it.Furthermore, while the resistance to evolution is religiously motivated, this is not always the basis forresistance to scientific knowledge. Nor are all religious denominations at odds with evolutionary science—in fact, far from it. Instead of rehashing that ancient history, I will describe two fascinating andilluminating, but not very widely known, recent examples of holdouts against twentieth-century biology.The first story involves the denial of the science of genetics, and later of DNA as the basis of heredity, bybiologists who held power in the Soviet Union from the 1930s to the 1950s and beyond. These zealotsessentially destroyed biology in the USSR, with tragic consequences for science, scientists, and thepopulace. The second involves the chiropractic profession and its denials, initially of the germ theory ofdisease, and then its subsequent and still active opposition to the science and medical value of
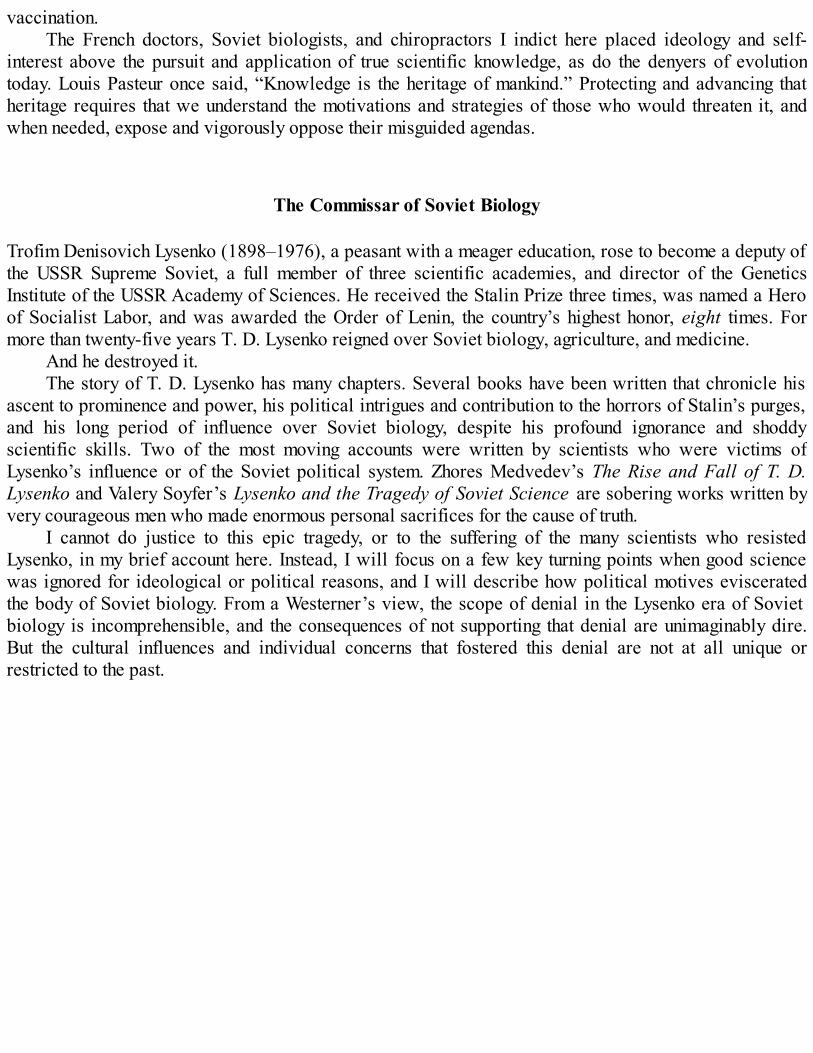
vaccination.The French doctors, Soviet biologists, and chiropractors I indict here placed ideology and self-
interest above the pursuit and application of true scientific knowledge, as do the denyers of evolutiontoday. Louis Pasteur once said, “Knowledge is the heritage of mankind.” Protecting and advancing thatheritage requires that we understand the motivations and strategies of those who would threaten it, andwhen needed, expose and vigorously oppose their misguided agendas.
The Commissar of Soviet Biology
Trofim Denisovich Lysenko (1898–1976), a peasant with a meager education, rose to become a deputy ofthe USSR Supreme Soviet, a full member of three scientific academies, and director of the GeneticsInstitute of the USSR Academy of Sciences. He received the Stalin Prize three times, was named a Heroof Socialist Labor, and was awarded the Order of Lenin, the country’s highest honor, eight times. Formore than twenty-five years T. D. Lysenko reigned over Soviet biology, agriculture, and medicine.
And he destroyed it.The story of T. D. Lysenko has many chapters. Several books have been written that chronicle his
ascent to prominence and power, his political intrigues and contribution to the horrors of Stalin’s purges,and his long period of influence over Soviet biology, despite his profound ignorance and shoddyscientific skills. Two of the most moving accounts were written by scientists who were victims ofLysenko’s influence or of the Soviet political system. Zhores Medvedev’s The Rise and Fall of T. D.Lysenko and Valery Soyfer’s Lysenko and the Tragedy of Soviet Science are sobering works written byvery courageous men who made enormous personal sacrifices for the cause of truth.
I cannot do justice to this epic tragedy, or to the suffering of the many scientists who resistedLysenko, in my brief account here. Instead, I will focus on a few key turning points when good sciencewas ignored for ideological or political reasons, and I will describe how political motives evisceratedthe body of Soviet biology. From a Westerner’s view, the scope of denial in the Lysenko era of Sovietbiology is incomprehensible, and the consequences of not supporting that denial are unimaginably dire.But the cultural influences and individual concerns that fostered this denial are not at all unique orrestricted to the past.
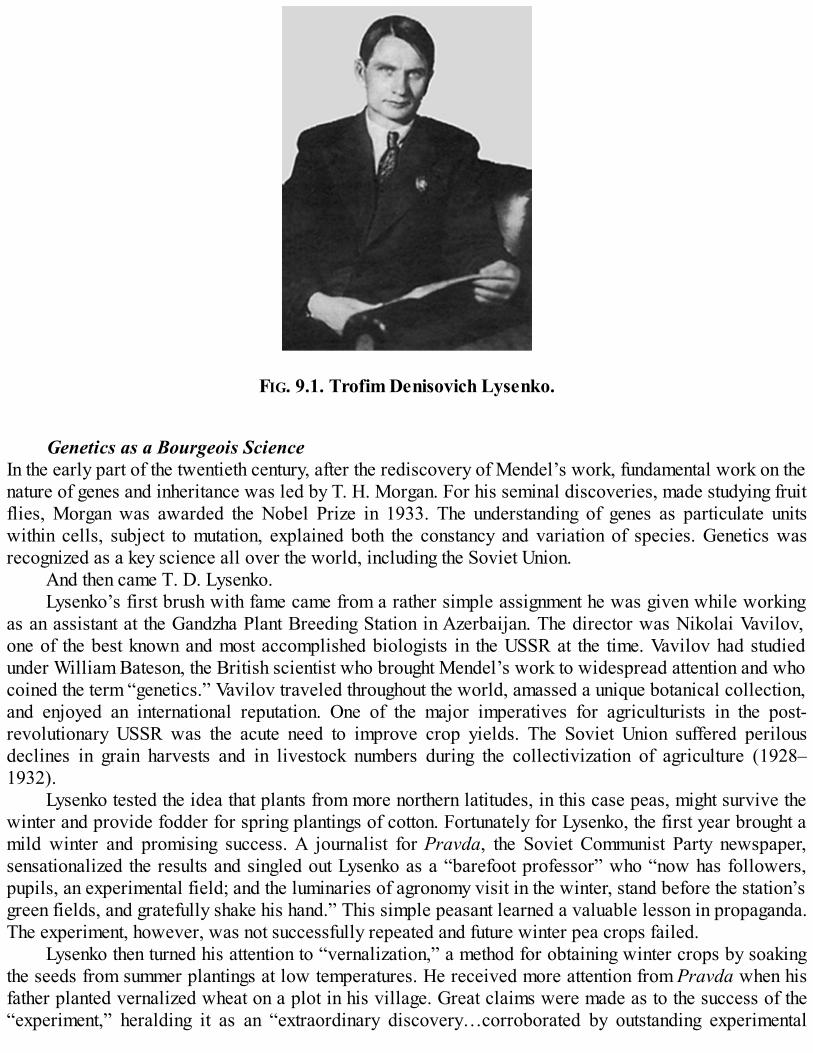
FIG. 9.1. Trofim Denisovich Lysenko.
Genetics as a Bourgeois ScienceIn the early part of the twentieth century, after the rediscovery of Mendel’s work, fundamental work on thenature of genes and inheritance was led by T. H. Morgan. For his seminal discoveries, made studying fruitflies, Morgan was awarded the Nobel Prize in 1933. The understanding of genes as particulate unitswithin cells, subject to mutation, explained both the constancy and variation of species. Genetics wasrecognized as a key science all over the world, including the Soviet Union.
And then came T. D. Lysenko.Lysenko’s first brush with fame came from a rather simple assignment he was given while working
as an assistant at the Gandzha Plant Breeding Station in Azerbaijan. The director was Nikolai Vavilov,one of the best known and most accomplished biologists in the USSR at the time. Vavilov had studiedunder William Bateson, the British scientist who brought Mendel’s work to widespread attention and whocoined the term “genetics.” Vavilov traveled throughout the world, amassed a unique botanical collection,and enjoyed an international reputation. One of the major imperatives for agriculturists in the post-revolutionary USSR was the acute need to improve crop yields. The Soviet Union suffered perilousdeclines in grain harvests and in livestock numbers during the collectivization of agriculture (1928–1932).
Lysenko tested the idea that plants from more northern latitudes, in this case peas, might survive thewinter and provide fodder for spring plantings of cotton. Fortunately for Lysenko, the first year brought amild winter and promising success. A journalist for Pravda, the Soviet Communist Party newspaper,sensationalized the results and singled out Lysenko as a “barefoot professor” who “now has followers,pupils, an experimental field; and the luminaries of agronomy visit in the winter, stand before the station’sgreen fields, and gratefully shake his hand.” This simple peasant learned a valuable lesson in propaganda.The experiment, however, was not successfully repeated and future winter pea crops failed.
Lysenko then turned his attention to “vernalization,” a method for obtaining winter crops by soakingthe seeds from summer plantings at low temperatures. He received more attention from Pravda when hisfather planted vernalized wheat on a plot in his village. Great claims were made as to the success of the“experiment,” heralding it as an “extraordinary discovery…corroborated by outstanding experimental
data” whose “prospects…are so great they are beyond immediate calculation.” Valery Soyfer concludesfrom the available evidence that the reports of a large harvest were false and explains the impetus toaccept such claims:
It was as though all at once they believed in the power of a miracle and decided that they hadthe firebird in their hands. Indeed it was no accident that they were seduced by myths promisingto solve all problems at one stroke, rather than facing the real and serious work of puttingagriculture on a sound foundation. All Soviet life was permeated by myths, by expectations ofthe imminent approach of communism, a bright future just ahead. The notion of ordinaryworking people achieving miracles…perfectly matched the mood.
Lysenko promoted vernalization, and was in turn promoted to a newly created department forvernalization at an institute in Odessa. There he began to develop a theory to explain vernalization.Lysenko postulated that hereditary changes occurred in plants in response to environmental influences.This idea was a fully Lamarckian theory, the notion that organisms could pass on to their offspringcharacteristics acquired during their life. This theory had great philosophical appeal in the politicalclimate of the Soviet struggle, for it suggested that Nature, and man, could be shaped in any desirableway, and were not constrained by history or heredity.
But Lysenko’s ideas flew in the face of emerging understanding of genetics. And so, the die was cast.The conflict between Lysenko and geneticists, including his former mentor Vavilov, would define the nexttwo decades of Soviet biology.
Lysenko’s fame spread. The commissars of agriculture and Party functionaries heard only what theywanted to hear. And Lysenko’s subordinates quickly learned to give him only the results he wanted. Underhis direction, large-scale vernalization of many crops was planned, without any prior research at all.Before the failure of one crop was recorded, other crops were initiated. The positive results he reportedwere often based on small samples and/or inaccurate or falsified data, and almost always lackedexperimental controls.
His “success” created particularly thorny problems for the breeders who applied genetic methods tocrop improvement. The small but steady incremental advances produced through breeding would notsatisfy the Party bosses, who were demanding immediate dramatic results.
There was escalating tension between Lysenko and his allies who touted immediate “practical”results, and those doing “pure research” on species such as fruit flies. The “problem” with genetics, so itwas said, was not merely that genetics might be a distraction from the pressing needs of Sovietagriculture, but that it was invalid and, worse, reactionary and bourgeois—in fact, because geneticsimplied that there were hereditary constraints imposed on nature and man, it was viewed as contrary toSoviet philosophy.
Lysenko became a Party favorite and had frequent contacts with Party leaders. In a speech in 1935before agricultural workers at the Kremlin, he declared, “Both within the scientific world and outside it, aclass enemy is always an enemy, even if a scientist.”
Stalin jumped up clapping and shouted, “Bravo, Comrade Lysenko, bravo!”Stalin’s praise further elevated and emboldened Lysenko, and his attacks on and rejection of genetics
escalated. Lysenko’s “new theory” of heredity rejected the existence of genes and of self-replicatingmaterial.
Confrontations with geneticists became more open, frequent, and hostile. Party leaders joined thechorus, and linked genetics to the growing specter of fascism and Nazism. One prominent commissar
dubbed genetics the “handmaiden of Goebbels’s department,” referring to Hitler’s propaganda ministry.All the while, Lysenko’s agriculture programs were disasters. Yields from vernalized wheat were
poor, the vegetable supply declined, a potato program was a flop. The crop failures exacerbated theperpetual food shortages. The geneticists struck back, arguing that “if Academician Lysenko were to givegreater attention to the principles of modern genetics, it would facilitate his work…. While rejectinggenetics and the genetic foundation of selection, Academician Lysenko has not given genetics anythingtheoretically new in exchange”
The Party Central Committee sanctioned an “open” discussion between the two opposing camps in1939. Vavilov, Lysenko’s former mentor and supporter, pulled no punches: “Lysenko’s position not onlyruns counter to the group of Soviet geneticists, it runs counter to all of modern biology…. In the guise ofadvanced science, we are advised to turn back essentially to obsolete views out of the first half or themiddle of the nineteenth century…. What we are defending is the result of tremendous creative work, ofprecise experiments, of Soviet and foreign practice.”
Lysenko replied, “I do not recognize Mendelism…. I do not consider formal Mendelian–Morganistgenetics a science…”
Philosopher Pavel Yudin added, “The teaching of genetics must be eliminated from secondaryschools.”
One month after the meeting, Stalin summoned Vavilov to see him. When Vavilov tried to explain thescientific basis of his work, Stalin turned a deaf ear and dismissed him.
Arrests and ExecutionsAs World War II escalated in the spring of 1940, the USSR faced new and intense agricultural challenges.Somewhat surprisingly, in spite of his sagging support, Vavilov was selected to make an expedition toevaluate and make recommendations on agriculture. It was a ruse to get him out of sight.
While in the Ukraine, a black car arrived at Vavilov’s dormitory and four men ushered him into it onthe pretense of urgent business in Moscow. It was the NKVD, the secret police. Vavilov was under arrestfor “conducting a struggle against the theories and research of Lysenko…that possess decisive importancefor the agriculture of the USSR.”
Lysenko soon forced out all of the geneticists who worked with or under Vavilov. He also purgedthe biology department of Leningrad University. Many scientists were falsely accused, arrested, andsentenced to be shot. Many others lost their jobs and were forced into other areas of work. Institutes wereclosed, textbooks were revised. No Soviet scientists attended the International Congress of Genetics of1939 in Edinburgh, even though Vavilov was its president.
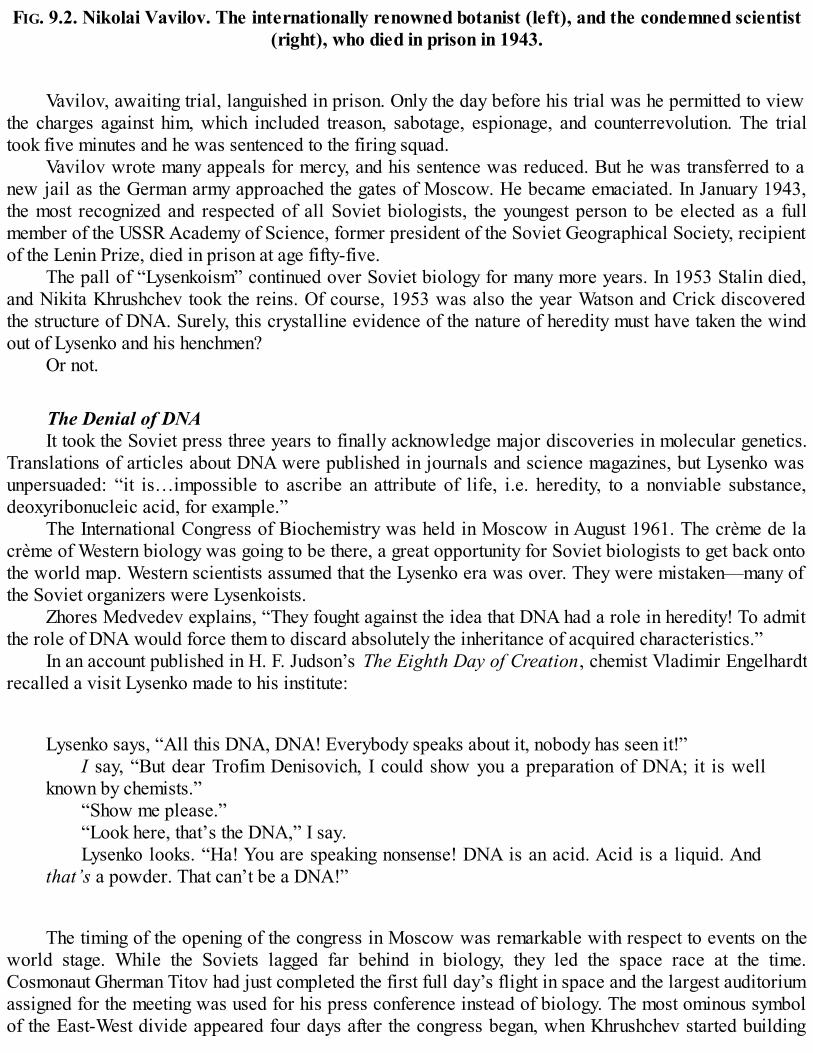
FIG. 9.2. Nikolai Vavilov. The internationally renowned botanist (left), and the condemned scientist(right), who died in prison in 1943.
Vavilov, awaiting trial, languished in prison. Only the day before his trial was he permitted to viewthe charges against him, which included treason, sabotage, espionage, and counterrevolution. The trialtook five minutes and he was sentenced to the firing squad.
Vavilov wrote many appeals for mercy, and his sentence was reduced. But he was transferred to anew jail as the German army approached the gates of Moscow. He became emaciated. In January 1943,the most recognized and respected of all Soviet biologists, the youngest person to be elected as a fullmember of the USSR Academy of Science, former president of the Soviet Geographical Society, recipientof the Lenin Prize, died in prison at age fifty-five.
The pall of “Lysenkoism” continued over Soviet biology for many more years. In 1953 Stalin died,and Nikita Khrushchev took the reins. Of course, 1953 was also the year Watson and Crick discoveredthe structure of DNA. Surely, this crystalline evidence of the nature of heredity must have taken the windout of Lysenko and his henchmen?
Or not.
The Denial of DNAIt took the Soviet press three years to finally acknowledge major discoveries in molecular genetics.
Translations of articles about DNA were published in journals and science magazines, but Lysenko wasunpersuaded: “it is…impossible to ascribe an attribute of life, i.e. heredity, to a nonviable substance,deoxyribonucleic acid, for example.”
The International Congress of Biochemistry was held in Moscow in August 1961. The crème de lacrème of Western biology was going to be there, a great opportunity for Soviet biologists to get back ontothe world map. Western scientists assumed that the Lysenko era was over. They were mistaken—many ofthe Soviet organizers were Lysenkoists.
Zhores Medvedev explains, “They fought against the idea that DNA had a role in heredity! To admitthe role of DNA would force them to discard absolutely the inheritance of acquired characteristics.”
In an account published in H. F. Judson’s The Eighth Day of Creation, chemist Vladimir Engelhardtrecalled a visit Lysenko made to his institute:
Lysenko says, “All this DNA, DNA! Everybody speaks about it, nobody has seen it!”I say, “But dear Trofim Denisovich, I could show you a preparation of DNA; it is well
known by chemists.”“Show me please.”“Look here, that’s the DNA,” I say.Lysenko looks. “Ha! You are speaking nonsense! DNA is an acid. Acid is a liquid. And
that’s a powder. That can’t be a DNA!”
The timing of the opening of the congress in Moscow was remarkable with respect to events on theworld stage. While the Soviets lagged far behind in biology, they led the space race at the time.Cosmonaut Gherman Titov had just completed the first full day’s flight in space and the largest auditoriumassigned for the meeting was used for his press conference instead of biology. The most ominous symbolof the East-West divide appeared four days after the congress began, when Khrushchev started building
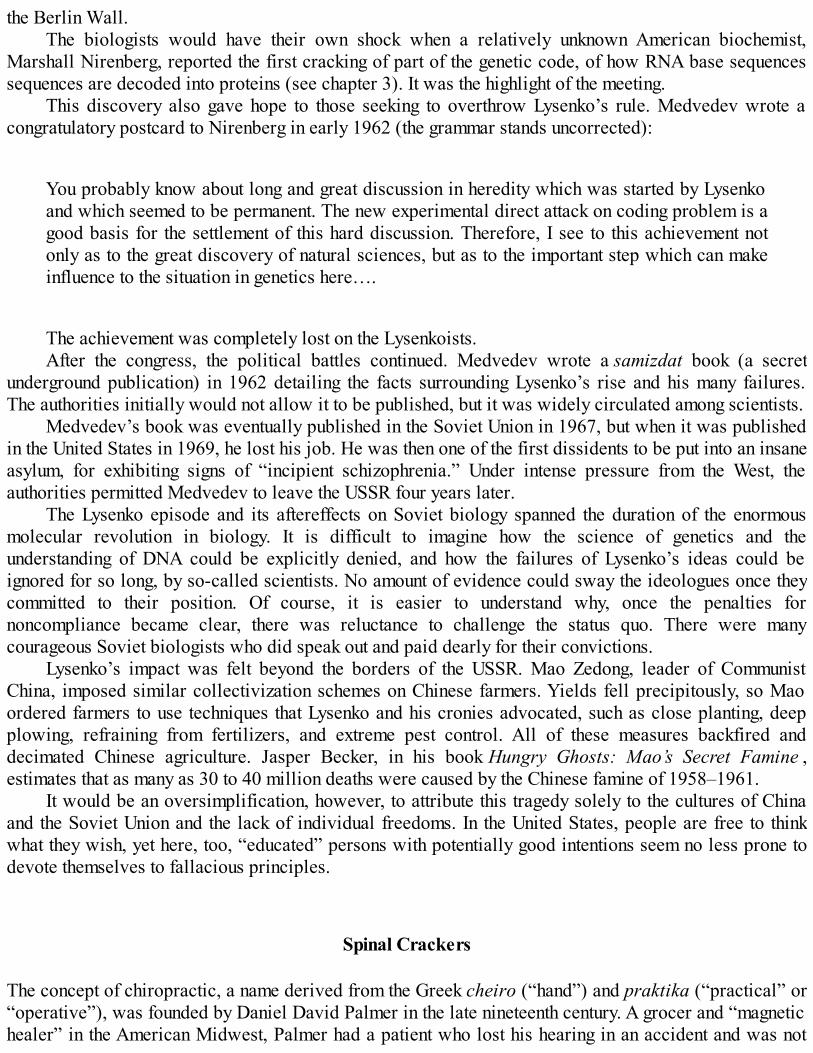
the Berlin Wall.The biologists would have their own shock when a relatively unknown American biochemist,
Marshall Nirenberg, reported the first cracking of part of the genetic code, of how RNA base sequencessequences are decoded into proteins (see chapter 3). It was the highlight of the meeting.
This discovery also gave hope to those seeking to overthrow Lysenko’s rule. Medvedev wrote acongratulatory postcard to Nirenberg in early 1962 (the grammar stands uncorrected):
You probably know about long and great discussion in heredity which was started by Lysenkoand which seemed to be permanent. The new experimental direct attack on coding problem is agood basis for the settlement of this hard discussion. Therefore, I see to this achievement notonly as to the great discovery of natural sciences, but as to the important step which can makeinfluence to the situation in genetics here….
The achievement was completely lost on the Lysenkoists.After the congress, the political battles continued. Medvedev wrote a samizdat book (a secret
underground publication) in 1962 detailing the facts surrounding Lysenko’s rise and his many failures.The authorities initially would not allow it to be published, but it was widely circulated among scientists.
Medvedev’s book was eventually published in the Soviet Union in 1967, but when it was publishedin the United States in 1969, he lost his job. He was then one of the first dissidents to be put into an insaneasylum, for exhibiting signs of “incipient schizophrenia.” Under intense pressure from the West, theauthorities permitted Medvedev to leave the USSR four years later.
The Lysenko episode and its aftereffects on Soviet biology spanned the duration of the enormousmolecular revolution in biology. It is difficult to imagine how the science of genetics and theunderstanding of DNA could be explicitly denied, and how the failures of Lysenko’s ideas could beignored for so long, by so-called scientists. No amount of evidence could sway the ideologues once theycommitted to their position. Of course, it is easier to understand why, once the penalties fornoncompliance became clear, there was reluctance to challenge the status quo. There were manycourageous Soviet biologists who did speak out and paid dearly for their convictions.
Lysenko’s impact was felt beyond the borders of the USSR. Mao Zedong, leader of CommunistChina, imposed similar collectivization schemes on Chinese farmers. Yields fell precipitously, so Maoordered farmers to use techniques that Lysenko and his cronies advocated, such as close planting, deepplowing, refraining from fertilizers, and extreme pest control. All of these measures backfired anddecimated Chinese agriculture. Jasper Becker, in his book Hungry Ghosts: Mao’s Secret Famine ,estimates that as many as 30 to 40 million deaths were caused by the Chinese famine of 1958–1961.
It would be an oversimplification, however, to attribute this tragedy solely to the cultures of Chinaand the Soviet Union and the lack of individual freedoms. In the United States, people are free to thinkwhat they wish, yet here, too, “educated” persons with potentially good intentions seem no less prone todevote themselves to fallacious principles.
Spinal Crackers
The concept of chiropractic, a name derived from the Greek cheiro (“hand”) and praktika (“practical” or“operative”), was founded by Daniel David Palmer in the late nineteenth century. A grocer and “magnetichealer” in the American Midwest, Palmer had a patient who lost his hearing in an accident and was not
responding to his techniques. He noticed an unusually large bump on the back of the patient’s neck, nearthe fourth cervical vertebra. Palmer reasoned that if the vertebra was put back in position, hearing shouldbe restored. Palmer “racked” the vertebra into position and reported that the man could soon hear. Whilethe claim is a bit astonishing, since the cochlear nerve of the ear does not pass through the neck, this wasnonetheless the “eureka” moment for Palmer and the birth of chiropractic.
Palmer developed the theory that nearly all diseases were primarily neurological in origin, andcaused by the pinching of nerves by misaligned vertebrae. In Iowa, he founded a school (which is stilloperational today) to teach his methods of spinal adjustments, and installed his son, Bartlett Joshua, to runit. The younger Palmer advanced his father’s ideas about how chiropractic healing works by removinginterference with a life force of “innate intelligence” in the body, thereby enabling the body to heal itself.
This founding principle conflicted with the medically accepted view of infectious diseases as beingcaused by germs. Young Palmer rejected the then prevailing picture of contagious diseases:“Chiropractors have found in every disease that is supposed to be contagious, a cause in the spine.” Theopposition of chiropractors to the germ theory of disease led to a resolute opposition to vaccination,opposition that continues among a substantial fraction of chiropractors today. One particularly dark andtelling episode surrounded the advent of the polio vaccine.
In 1954, the year before the Salk polio vaccine became available, there were 38,476 cases of polioin the United States. In 1955, there were 28,985 cases; in 1956, the figure dropped to 15,140 cases; andby 1961, there were 1312 cases.
As public health authorities ramped up their efforts to encourage vaccination, chiropractorscountered with their own campaign. A sample of some communications from various representativescontain some astonishingly ignorant and dangerous statements and claims. Some challenged the efficacy ofthe vaccine, with the Journal of the National Chiropractic Association asking in an article, “Has theTest Tube Fight Against Polio Failed?” Rather than take the vaccine, the article urged that “chiropracticadjustments should be given of the entire spine the first three days of acute polio.”
According to the U.S. surgeon general, nine out of ten of the new polio cases occurred amongindividuals who had not received the vaccine (the Salk vaccine required a series of shots).
Chiropractors claimed successful treatment of both acute and chronic polio, reporting completerecovery in 71 percent of acute cases. Their claims did not take into account that 60 percent of patientswho contracted the disease recovered without weakness or paralysis. The patients with more severepolio were treated by conventional doctors with extensive measures, including tracheotomy, feedingtubes, or an iron lung. Chiropractors offered none of these measures, only spinal adjustments.
Chiropractors’ lack of training in the diagnosis or causes of disease was no deterrent in discouragingpublic vaccination. One pamphlet circulated in Colorado stated, “Your thoughtful consideration should begiven to the fact that contamination of the human body through the injection of diseased animal cells mustbe abhorrent to the Creator who equipped us with cell life peculiarly our own, and is not miscible withthat of animals.”
ONE WOULD think that fifty years after the success of the polio campaign, this nonsense would be behindus. Sadly, it is not.
A 1994 survey of 171 chiropractors reported that one-third believed there was no scientific proofthat immunization prevents disease. A 1998 survey of Boston area chiropractors found that only 30percent actively recommended immunizations, 7 percent recommended against immunization, and 63percent made no recommendation. And a 2002 survey of Canadian chiropractic students revealed aprogressive decline of support for vaccination as students progressed through their years of schooling,
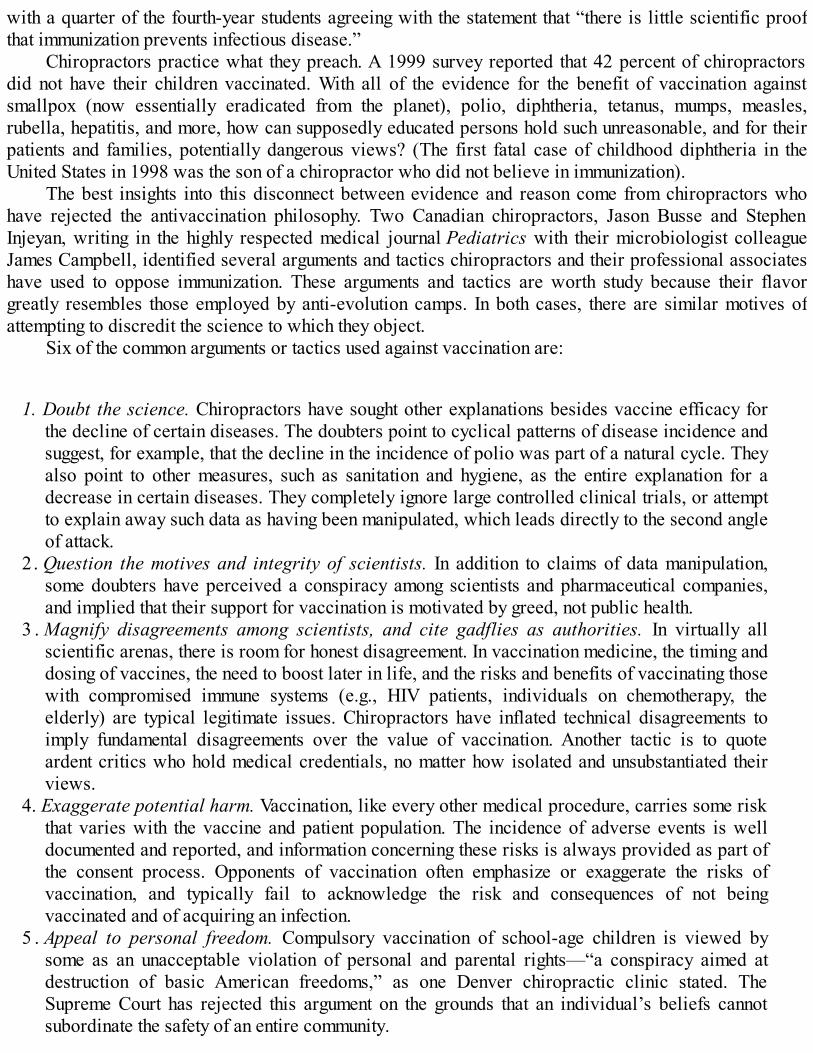
with a quarter of the fourth-year students agreeing with the statement that “there is little scientific proofthat immunization prevents infectious disease.”
Chiropractors practice what they preach. A 1999 survey reported that 42 percent of chiropractorsdid not have their children vaccinated. With all of the evidence for the benefit of vaccination againstsmallpox (now essentially eradicated from the planet), polio, diphtheria, tetanus, mumps, measles,rubella, hepatitis, and more, how can supposedly educated persons hold such unreasonable, and for theirpatients and families, potentially dangerous views? (The first fatal case of childhood diphtheria in theUnited States in 1998 was the son of a chiropractor who did not believe in immunization).
The best insights into this disconnect between evidence and reason come from chiropractors whohave rejected the antivaccination philosophy. Two Canadian chiropractors, Jason Busse and StephenInjeyan, writing in the highly respected medical journal Pediatrics with their microbiologist colleagueJames Campbell, identified several arguments and tactics chiropractors and their professional associateshave used to oppose immunization. These arguments and tactics are worth study because their flavorgreatly resembles those employed by anti-evolution camps. In both cases, there are similar motives ofattempting to discredit the science to which they object.
Six of the common arguments or tactics used against vaccination are:
1. Doubt the science. Chiropractors have sought other explanations besides vaccine efficacy forthe decline of certain diseases. The doubters point to cyclical patterns of disease incidence andsuggest, for example, that the decline in the incidence of polio was part of a natural cycle. Theyalso point to other measures, such as sanitation and hygiene, as the entire explanation for adecrease in certain diseases. They completely ignore large controlled clinical trials, or attemptto explain away such data as having been manipulated, which leads directly to the second angleof attack.
2 . Question the motives and integrity of scientists. In addition to claims of data manipulation,some doubters have perceived a conspiracy among scientists and pharmaceutical companies,and implied that their support for vaccination is motivated by greed, not public health.
3 . Magnify disagreements among scientists, and cite gadflies as authorities. In virtually allscientific arenas, there is room for honest disagreement. In vaccination medicine, the timing anddosing of vaccines, the need to boost later in life, and the risks and benefits of vaccinating thosewith compromised immune systems (e.g., HIV patients, individuals on chemotherapy, theelderly) are typical legitimate issues. Chiropractors have inflated technical disagreements toimply fundamental disagreements over the value of vaccination. Another tactic is to quoteardent critics who hold medical credentials, no matter how isolated and unsubstantiated theirviews.
4. Exaggerate potential harm. Vaccination, like every other medical procedure, carries some riskthat varies with the vaccine and patient population. The incidence of adverse events is welldocumented and reported, and information concerning these risks is always provided as part ofthe consent process. Opponents of vaccination often emphasize or exaggerate the risks ofvaccination, and typically fail to acknowledge the risk and consequences of not beingvaccinated and of acquiring an infection.
5 . Appeal to personal freedom. Compulsory vaccination of school-age children is viewed bysome as an unacceptable violation of personal and parental rights—“a conspiracy aimed atdestruction of basic American freedoms,” as one Denver chiropractic clinic stated. TheSupreme Court has rejected this argument on the grounds that an individual’s beliefs cannotsubordinate the safety of an entire community.

6. Acceptance repudiates key philosophy. Ultimately, once the fog of disinformation clears andthe efficacy of vaccines is demonstrated on a massive scale, most of the arguments provideweak refuge. The fallback position is that vaccination is at odds with the so-called majorpremise of chiropractic. The idea that all diseases stem from misalignment or subluxation ofvertebrae is, according to Campbell, Busse, and Injeyan, “taken as a matter of faith that is notopen to scientific scrutiny.” R. B. Phillips writes in Journal of Chiropractic Humanities:“This faith-based approach negates the need for inductive reasoning with its dependence onprobability because absolute truth is already known and only needs personal confirmationthrough individual observations.”
The great and telling irony is that chiropractors who deny the science of vaccination have never puttheir beliefs to similar double-blind controlled testing. Robert Anderson, an M.D. and a Doctor ofChiropractic, notes that chiropractors “tend to evaluate all things medical in symbolic terms as hostile andharmful” and points out that chiropractors’ “belief has not been subjected to testing in clinical trials orlaboratory experiments, and thus becomes a matter of belief rather than of scientific verity. A refusal toadvocate or submit to vaccines serves conservative chiropractors as an understandable cultural[emphasis added] symbol.”
Anderson captures the foundation of denial—a belief that is cultural, not a verifiable scientificconclusion.
As Busse, Injeyan, and Anderson demonstrate, not all chiropractors hold such beliefs. But for such asubstantial fraction to do so reflects the relative power of cultural ideology over verified science.
And that brings us to evolution.
The Denial of Evolution
The denial of evolution requires far more denial than the modest knowledge of genetics in the era of theSoviet biologists in the 1930s or the knowledge of immunology and virology denied by chiropractors inthe 1950s. The denial of evolution requires denial of the bedrock of two centuries of biology and geology.That is quite a feat that demands some explanation.
The denial of evolutionary science has, of course, a long history. My task here is not to recount thathistory (you will find several recommended books in Sources and Further Reading at the end of thisbook), but to boil the issues down to their basics in just a few pages. Again, my goal is to equip you withsome factual material for discussions that may arise at the dinner table, office, or, perhaps most important,in your or your children’s school.
My fundamental premise is that the denial of evolution, like the other instances of denial, is not aboutthe science. It can’t be. It is about ideology, in this case religious ideology. While denyers of evolutioncomplain about evidence and market purported scientific challenges to it, these are smoke screens—thevery same kind thrown up by the chiropractors who oppose vaccination. We have to pierce those screensto understand the motives behind them. I will rely on a number of direct quotations from evolution’sopponents to illustrate these tactics. This is partly a matter of ensuring accuracy and partly to convey theflavor of some of evolution’s most ardent critics. I will organize the arguments and tactics into the samesix categories as those used by the chiropractors.
1. Doubt the Science.
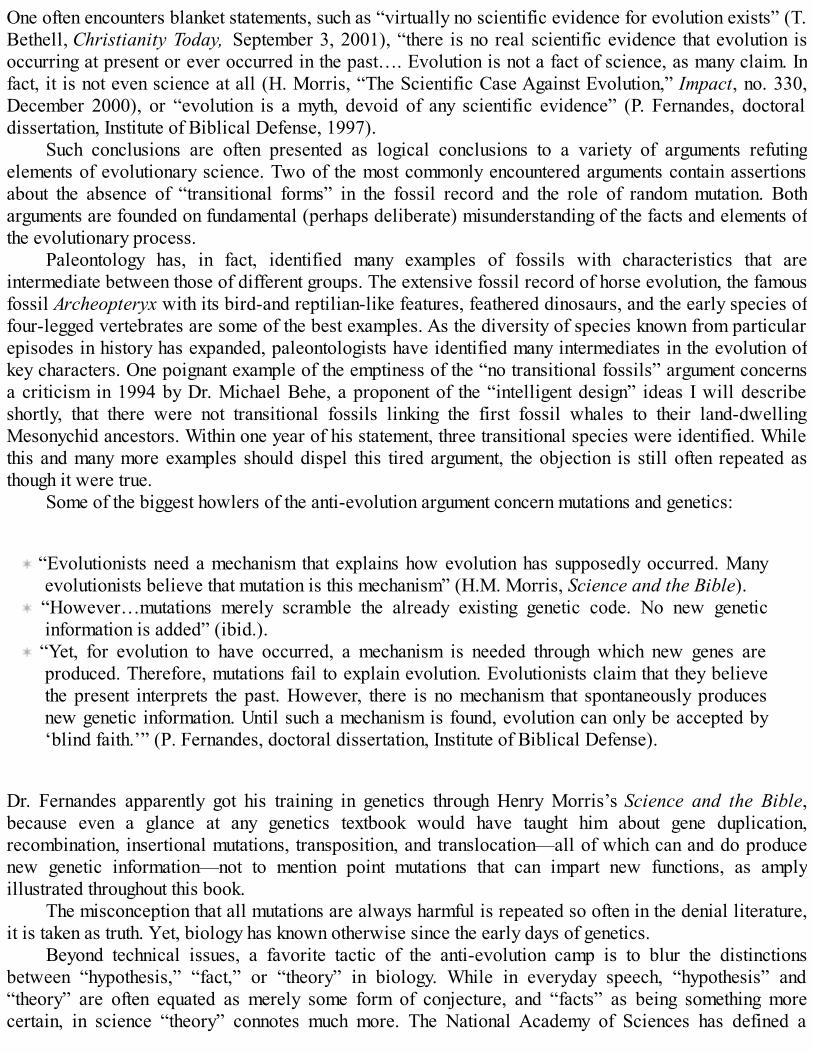
One often encounters blanket statements, such as “virtually no scientific evidence for evolution exists” (T.Bethell, Christianity Today, September 3, 2001), “there is no real scientific evidence that evolution isoccurring at present or ever occurred in the past…. Evolution is not a fact of science, as many claim. Infact, it is not even science at all (H. Morris, “The Scientific Case Against Evolution,” Impact, no. 330,December 2000), or “evolution is a myth, devoid of any scientific evidence” (P. Fernandes, doctoraldissertation, Institute of Biblical Defense, 1997).
Such conclusions are often presented as logical conclusions to a variety of arguments refutingelements of evolutionary science. Two of the most commonly encountered arguments contain assertionsabout the absence of “transitional forms” in the fossil record and the role of random mutation. Botharguments are founded on fundamental (perhaps deliberate) misunderstanding of the facts and elements ofthe evolutionary process.
Paleontology has, in fact, identified many examples of fossils with characteristics that areintermediate between those of different groups. The extensive fossil record of horse evolution, the famousfossil Archeopteryx with its bird-and reptilian-like features, feathered dinosaurs, and the early species offour-legged vertebrates are some of the best examples. As the diversity of species known from particularepisodes in history has expanded, paleontologists have identified many intermediates in the evolution ofkey characters. One poignant example of the emptiness of the “no transitional fossils” argument concernsa criticism in 1994 by Dr. Michael Behe, a proponent of the “intelligent design” ideas I will describeshortly, that there were not transitional fossils linking the first fossil whales to their land-dwellingMesonychid ancestors. Within one year of his statement, three transitional species were identified. Whilethis and many more examples should dispel this tired argument, the objection is still often repeated asthough it were true.
Some of the biggest howlers of the anti-evolution argument concern mutations and genetics:
“Evolutionists need a mechanism that explains how evolution has supposedly occurred. Manyevolutionists believe that mutation is this mechanism” (H.M. Morris, Science and the Bible).
“However…mutations merely scramble the already existing genetic code. No new geneticinformation is added” (ibid.).
“Yet, for evolution to have occurred, a mechanism is needed through which new genes areproduced. Therefore, mutations fail to explain evolution. Evolutionists claim that they believethe present interprets the past. However, there is no mechanism that spontaneously producesnew genetic information. Until such a mechanism is found, evolution can only be accepted by‘blind faith.’” (P. Fernandes, doctoral dissertation, Institute of Biblical Defense).
Dr. Fernandes apparently got his training in genetics through Henry Morris’s Science and the Bible,because even a glance at any genetics textbook would have taught him about gene duplication,recombination, insertional mutations, transposition, and translocation—all of which can and do producenew genetic information—not to mention point mutations that can impart new functions, as amplyillustrated throughout this book.
The misconception that all mutations are always harmful is repeated so often in the denial literature,it is taken as truth. Yet, biology has known otherwise since the early days of genetics.
Beyond technical issues, a favorite tactic of the anti-evolution camp is to blur the distinctionsbetween “hypothesis,” “fact,” or “theory” in biology. While in everyday speech, “hypothesis” and“theory” are often equated as merely some form of conjecture, and “facts” as being something morecertain, in science “theory” connotes much more. The National Academy of Sciences has defined a
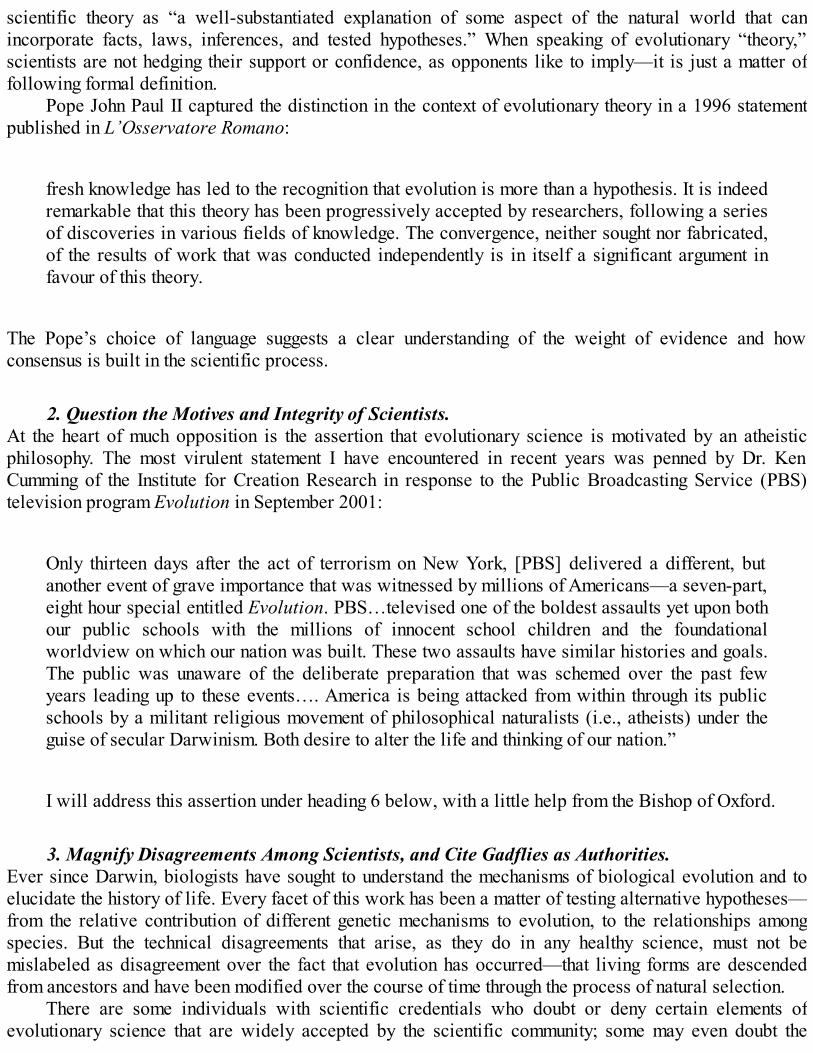
scientific theory as “a well-substantiated explanation of some aspect of the natural world that canincorporate facts, laws, inferences, and tested hypotheses.” When speaking of evolutionary “theory,”scientists are not hedging their support or confidence, as opponents like to imply—it is just a matter offollowing formal definition.
Pope John Paul II captured the distinction in the context of evolutionary theory in a 1996 statementpublished in L’Osservatore Romano:
fresh knowledge has led to the recognition that evolution is more than a hypothesis. It is indeedremarkable that this theory has been progressively accepted by researchers, following a seriesof discoveries in various fields of knowledge. The convergence, neither sought nor fabricated,of the results of work that was conducted independently is in itself a significant argument infavour of this theory.
The Pope’s choice of language suggests a clear understanding of the weight of evidence and howconsensus is built in the scientific process.
2. Question the Motives and Integrity of Scientists.At the heart of much opposition is the assertion that evolutionary science is motivated by an atheisticphilosophy. The most virulent statement I have encountered in recent years was penned by Dr. KenCumming of the Institute for Creation Research in response to the Public Broadcasting Service (PBS)television program Evolution in September 2001:
Only thirteen days after the act of terrorism on New York, [PBS] delivered a different, butanother event of grave importance that was witnessed by millions of Americans—a seven-part,eight hour special entitled Evolution. PBS…televised one of the boldest assaults yet upon bothour public schools with the millions of innocent school children and the foundationalworldview on which our nation was built. These two assaults have similar histories and goals.The public was unaware of the deliberate preparation that was schemed over the past fewyears leading up to these events…. America is being attacked from within through its publicschools by a militant religious movement of philosophical naturalists (i.e., atheists) under theguise of secular Darwinism. Both desire to alter the life and thinking of our nation.”
I will address this assertion under heading 6 below, with a little help from the Bishop of Oxford.
3. Magnify Disagreements Among Scientists, and Cite Gadflies as Authorities.Ever since Darwin, biologists have sought to understand the mechanisms of biological evolution and toelucidate the history of life. Every facet of this work has been a matter of testing alternative hypotheses—from the relative contribution of different genetic mechanisms to evolution, to the relationships amongspecies. But the technical disagreements that arise, as they do in any healthy science, must not bemislabeled as disagreement over the fact that evolution has occurred—that living forms are descendedfrom ancestors and have been modified over the course of time through the process of natural selection.
There are some individuals with scientific credentials who doubt or deny certain elements ofevolutionary science that are widely accepted by the scientific community; some may even doubt the
entire theory. But getting a doctoral degree and making negative arguments are relatively easy—makingnew, verifiable discoveries is an altogether different matter. The denyers specialize in rhetoric and themining of quotes, not in laboratory research.
4. Exaggerate Potential Harm.Opponents of evolution perceive great danger in evolutionary principles and lay much blame for society’sdifficulties on the influence of “Darwinism” in modern culture. Ken Ham, president and founder of thecreationist organization Answers in Genesis, sees a connection between the teaching of evolution andschool violence:
Evolutionary indoctrination declares that we are only animals in the struggle for survival. Thishas created a mindset in many of our young people that life lacks purpose…. Some students—who are brainwashed in evolution—believe that life is all about death, violence, andbloodshed because, after all, these are the processes by which they evolved.
Darwin has also been blamed for Soviet-style communism. Cal Thomas, a syndicated columnist,reacted to the Pope’s 1996 statement on evolution by alleging that the Pope “has accepted a philosophythat stands at the core of communism. Why would he want to accept the heart of a worldview that he spenthis life opposing?” This is a very curious statement in light of Lysenko’s antigenetic stance and rejectionof Darwinian evolution.
An association between the Holocaust and Darwin’s understanding of the competitive struggle forsurvival is another often repeated allegation. Jerry Bergman writes, “of the many factors that produced theNazi holocaust and World War II, one of the most important was Darwin’s notion that evolutionaryprogress occurs mainly as a result of the elimination of the weak in the struggle for survival.” Heconcludes, “If Darwinism is true, Hitler was our savior and we have crucified him…. If Darwinism is nottrue, what Hitler attempted to do must be ranked with the most heinous crimes of history and Darwin asthe father of one of the most destructive philosophies of history.”
By inflating evolutionary science into a political philosophy, Bergman and others seek to discreditthe science. Geneticist and author Steve Jones has referred to the hijacking of Darwin’s theory intopolitical causes as “vulgar Darwinism” and notes, “Evolution is a political sofa that molds itself to thebuttocks of the last to sit upon it.”
5. Appeal to Personal Freedom.The teaching of evolution in public schools is frequently viewed as an assault upon the religious freedomof those who oppose it. Those holding this view have advocated placing disclaimers in textbooks thatraise doubt about the claims of evolutionary science, and they have appealed for the teaching of“alternative” views of the history of life. The latter generally involves those alternatives embracing someversion of creationism and is often justified on the basis of a sense of “fairness” or “balance.” Bothtactics have been repeatedly struck down as unconstitutional in federal courts.
For example, a federal judge in Atlanta, Georgia, recently ruled that stickers placed on biologytextbooks in the Cobb County school district (figure 9.3) violated the “establishment clause” of the FirstAmendment of the U.S. Constitution, which states that “Congress shall make no law respecting anestablishment of religion, or prohibiting the free exercise thereof,” a prohibition that applies to statesthrough the Fourteenth Amendment. The judge’s decision relied on an extensive body of case law in
which the Supreme Court and lower federal courts have struck down anti-evolution statutes, policies, anddisclaimers, as well as balanced-treatment legislation.
The judge found in particular that the statement “Evolution is a theory, not a fact, regarding the originof living things” ran afoul of the establishment clause. Furthermore, he wrote that the sticker “misleadsstudents regarding the significance and value of evolution in the scientific community for the benefit ofreligious alternatives” and that “the sticker targets only evolution to be approached with an open mind,carefully studied and critically considered without explaining why it is the only theory being isolated assuch [emphasis added].”
FIG. 9.3. Evolution disclaimer on Cobb County, Georgia, textbooks. The stickers were orderedremoved by Federal Judge Clarence Cooper on January 13, 2005.
Despite the extensive and growing body of federal case law, school districts in many states areactively considering “balanced treatment” and other policies that should also run into constitutionalproblems.
6. Acceptance Repudiates Key Philosophy.The ultimate source of the conflict over evolutionary science is the same that we have seen over geneticsin the Soviet Union and vaccination in the conservative chiropractic community—it is viewed to be atodds with matters of faith that are not open to scientific evidence. As stated by the organization Answersin Genesis, “the real issue [is] the authority of the Bible as a trustworthy revelation from God, and hencethe integrity of its Gospel message.”
David Cloud of the Way of Life Fundamental Baptist Information Service argues that there are threereasons to reject evolution:
1. “First, we must reject evolution because it denies the Bible,” particularly statements inGenesis. Cloud suggests that “if the Bible does not mean what it says, there is no way to knowwhat it does mean.”
2. “We must reject evolution because it denies God.” Cloud argues that the “God of the Bible isinvolved with every detail of creation” and that “the god of evolution is not the God of theBible.”
3. “We must reject evolution because it denies salvation.” Cloud writes that “if Genesis 1–3 is notliteral history, the rest of the Bible and the doctrine of Christ and salvation is a fairy tale—because it is all based on a supposition that these were real historical events.”
I believe this is a fair representation of the concerns and convictions of a majority of evolution’sopponents and denyers. Similar concerns are echoed by many prominent members of that contingent. KenHam believes that “until our nation allows God to be the absolute authority, and accepts the Bible astruth,” all manner of difficulties will continue to proliferate.
But while these most vocal and politically active opponents of evolution have defined the positionsof Christianity and evolution as an either/or choice, and the popular press appears to promulgate thatview, it is clearly not correct. The conclusions concerning the irreconcilability of Christianity andevolutionary science are not shared by many scientists, theologians, leading clergy, or even entireChristian denominations.
Consider, for example, a recent statement by Reverend Richard Harries, the Bishop of Oxford; in aBBC radio “Thought for the Day,” he expressed his sadness and concerns over the treatment of evolution:
Do some people really think that the worldwide scientific community is engaged in a massiveconspiracy to hoodwink the rest of us? …The theory of evolution, far from undermining faith,deepens it. This was quickly seen by Frederick Temple, later Archbishop of Canterbury, whosaid that God doesn’t just make the world, he does something even more wonderful, he makesthe world make itself…. The second reason I feel sad about this attempt to see the Book ofGenesis as a rival to scientific truth is that it stops people taking the Bible seriously. The Bibleis a collection of books made up of very different kinds of literature, poetry, history, ethics,law, myth, theology, wise sayings and so on…. The Bible brings us precious, essential truthsabout who we are and what we might become. But biblical literalism hinders people fromseeing and responding to these truths…biblical literalism brings not only the Bible butChristianity itself into disrepute.
The bishop has a lot of distinguished company. The General Assembly of the Presbyterian Churchreaffirmed in 2002 that “there is no contradiction between an evolutionary theory of human origins and thedoctrine of God as Creator.” Similarly, the United Church Board for Homeland Ministries stated in 1992,“The assumption that the Bible contains scientific data about origins misreads a literature which emergedin a pre-scientific age.”
Thus, the fundamentalist Protestant position that insists on the rejection of evolution and the literaltruth of the Bible in all matters, including science, is at odds with not only two centuries of modernscience, but established doctrines and positions of the Catholic, Jewish, and a broad array of Protestantfaiths. Furthermore, the fundamentalist position ignores the fact that a significant proportion of scientistsalso hold mainstream religious views.
The principal means for evolution’s denyers to circumvent the vast body of evolutionary science hasbeen to employ the tactics of rhetoric and propaganda I have described above, which has succeeded inpromoting the idea that evolutionary science is at odds with all denominations. The second major efforthas been aimed at influencing the political process at local, state, and national levels. Given that all of theopponents and organizations I have cited have overtly religious aims and affiliations, this would seem tobe a difficult maneuver in light of the establishment clause of the U.S. Constitution. This impediment hasgiven birth to a new strategy—the attempt to wrap religious belief in the skin of scientific credibility.
Old Wine in a New Bottle: The Myth of Intelligent Design
The “newest” incarnation of alternatives to Darwinian evolution is dubbed intelligent design. The majorpremise of this movement is that some biological structures are too complex to have evolved in astepwise fashion under natural selection, and therefore, they must have been “designed” by an IntelligentDesigner. Who is this Designer? Well, proponents often take pains not to name Him or Her out loud, butGod would be a good guess.
The intelligent design idea traces back to William Paley, who articulated the general concept in hisNatural Theology 200 years ago. Simply put, the argument is that just as whenever one sees intricacy andcomplexity in man-made objects, one infers a designer, so, too, with the contrivances of Nature.
Interestingly, one of the most recognized proponents of intelligent design, Dr. Michael Behe, acceptsthe antiquity of the Earth, the descent of species from common ancestors, and the origin of some traits byDarwinian natural selection. His major thesis is that some structures and systems in organisms are“irreducibly complex” and supposedly nonfunctional if any of their parts are removed. These systems andstructures could not, in Behe’s view, have arisen by natural selection.
Behe’s acceptance of many facts of biology puts him in an awkward position in terms of explainingthe when and how of intelligent design. The material in this book on the interaction of mutation, selection,and time on the evolution of the text of DNA presents a stark contrast and devastating evidence againstBehe’s notions. In his book Darwin’s Black Box, Behe posits, “Suppose that nearly four billion years agothe designer made the first cell, already containing all of the irreducibly complex biochemical systemsdiscussed here and many others. (One can postulate that the design for systems that were to be used later,such as blood clotting, were present but not ‘turned on.’ In present-day organisms plenty of genes areturned off for a while, sometimes for generations, to be turned on at a later time).”
This is utter nonsense that disregards fundamentals of genetics. Dr. Ken Miller of Brown Universityhas described this scenario as “an absolutely hopeless genetic fantasy of ‘pre-formed’ genes waiting forthe organisms that might need them to gradually appear.” As we saw in chapter 5, the rule of DNA code isuse it or lose it. The constant bombardment of mutation will erode the text of genes that are not used, as ithas in icefish, yeast, humans, and virtually every other species. There is no mechanism for genes to bepreserved while awaiting the need for them to arise. Rather, as we saw in chapter 4, gene duplication, anobservable process in living species, is just one means available for expanding genetic information andcomplexity as life evolves, and the signature of gene duplication events throughout evolution abounds inthe DNA record.
As just one example, let’s consider the distribution of -globin genes that encode one of two chainsof the hemoglobin molecule. We humans have five -globin genes and they are all located right next toone another on chromosome 11. Different genes are used at different times of life with the so-calledepsilon ( ) genes active in embryonic life, the two gamma ( ) genes active in fetal life, the delta ( )globin expressed at low levels in adults, and the -globin most highly expressed in adults. Chickens havefour -globin genes; most fish have fewer -globin genes, which are arranged differently than those inbirds and humans—except for the icefish, which has no functional -globin genes at all.
What could account for this pattern of -globin gene distribution? Under the intelligent designpreformed gene model, all of the genes we use would have been designed long, long before humans orother mammals evolved to use them. If so, then why would there be fewer -globin genes in other groupsof vertebrates, and none at all in the icefish (a more recently evolved group of fish)? Shouldn’t thosesilent preformed genes still be there in other species, waiting to be called upon? And how did the icefishwind up with no globin genes, and a fragment of an -globin gene? What Designer designs partial,nonfunctional genes?
The evolutionary explanation of the distribution of globin genes is much simpler. Vertebrateancestors had fewer globin genes in a fish-like arrangement, and the duplication of these genes, followedby their divergence through mutation, produced the large, diverse set of genes used during our lifetimes.
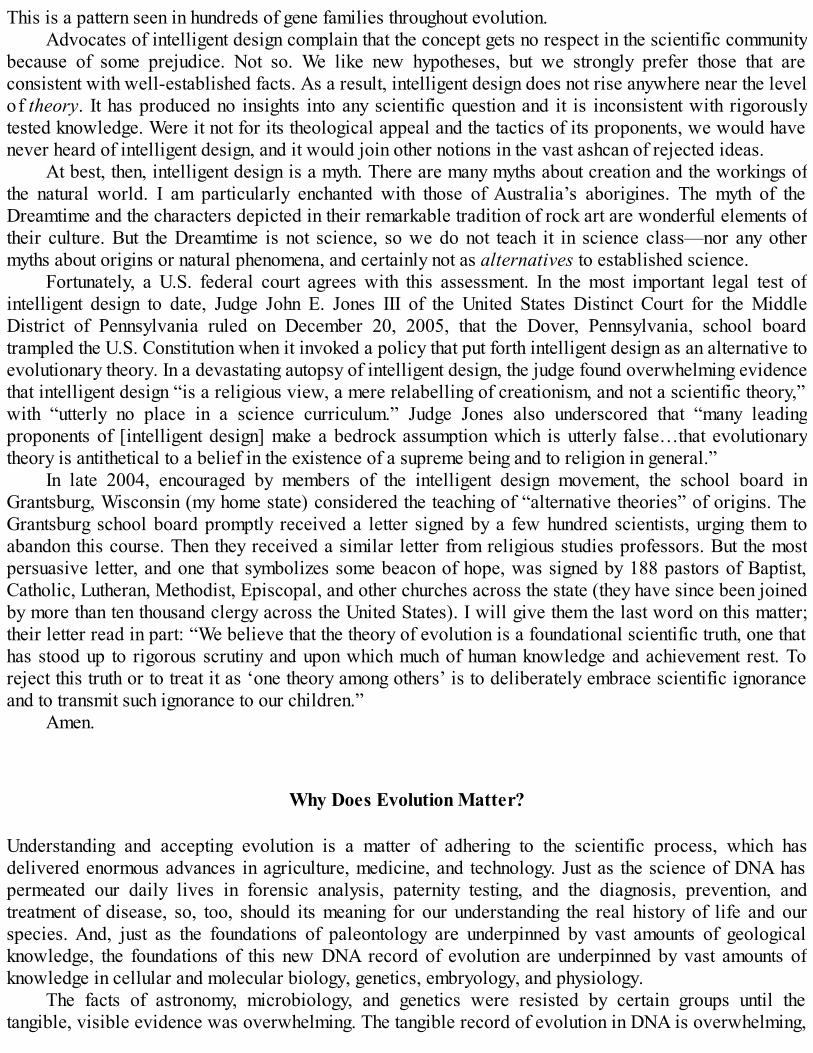
This is a pattern seen in hundreds of gene families throughout evolution.Advocates of intelligent design complain that the concept gets no respect in the scientific community
because of some prejudice. Not so. We like new hypotheses, but we strongly prefer those that areconsistent with well-established facts. As a result, intelligent design does not rise anywhere near the levelof theory. It has produced no insights into any scientific question and it is inconsistent with rigorouslytested knowledge. Were it not for its theological appeal and the tactics of its proponents, we would havenever heard of intelligent design, and it would join other notions in the vast ashcan of rejected ideas.
At best, then, intelligent design is a myth. There are many myths about creation and the workings ofthe natural world. I am particularly enchanted with those of Australia’s aborigines. The myth of theDreamtime and the characters depicted in their remarkable tradition of rock art are wonderful elements oftheir culture. But the Dreamtime is not science, so we do not teach it in science class—nor any othermyths about origins or natural phenomena, and certainly not as alternatives to established science.
Fortunately, a U.S. federal court agrees with this assessment. In the most important legal test ofintelligent design to date, Judge John E. Jones III of the United States Distinct Court for the MiddleDistrict of Pennsylvania ruled on December 20, 2005, that the Dover, Pennsylvania, school boardtrampled the U.S. Constitution when it invoked a policy that put forth intelligent design as an alternative toevolutionary theory. In a devastating autopsy of intelligent design, the judge found overwhelming evidencethat intelligent design “is a religious view, a mere relabelling of creationism, and not a scientific theory,”with “utterly no place in a science curriculum.” Judge Jones also underscored that “many leadingproponents of [intelligent design] make a bedrock assumption which is utterly false…that evolutionarytheory is antithetical to a belief in the existence of a supreme being and to religion in general.”
In late 2004, encouraged by members of the intelligent design movement, the school board inGrantsburg, Wisconsin (my home state) considered the teaching of “alternative theories” of origins. TheGrantsburg school board promptly received a letter signed by a few hundred scientists, urging them toabandon this course. Then they received a similar letter from religious studies professors. But the mostpersuasive letter, and one that symbolizes some beacon of hope, was signed by 188 pastors of Baptist,Catholic, Lutheran, Methodist, Episcopal, and other churches across the state (they have since been joinedby more than ten thousand clergy across the United States). I will give them the last word on this matter;their letter read in part: “We believe that the theory of evolution is a foundational scientific truth, one thathas stood up to rigorous scrutiny and upon which much of human knowledge and achievement rest. Toreject this truth or to treat it as ‘one theory among others’ is to deliberately embrace scientific ignoranceand to transmit such ignorance to our children.”
Amen.
Why Does Evolution Matter?
Understanding and accepting evolution is a matter of adhering to the scientific process, which hasdelivered enormous advances in agriculture, medicine, and technology. Just as the science of DNA haspermeated our daily lives in forensic analysis, paternity testing, and the diagnosis, prevention, andtreatment of disease, so, too, should its meaning for our understanding the real history of life and ourspecies. And, just as the foundations of paleontology are underpinned by vast amounts of geologicalknowledge, the foundations of this new DNA record of evolution are underpinned by vast amounts ofknowledge in cellular and molecular biology, genetics, embryology, and physiology.
The facts of astronomy, microbiology, and genetics were resisted by certain groups until thetangible, visible evidence was overwhelming. The tangible record of evolution in DNA is overwhelming,

and cannot be argued away. Those who have continued to oppose evolution in the face of the evidencecannot be allowed—like the incredulous French doctors, dictators of Soviet biology, or fundamentalistchiropractors—to silence or ignore science in order to accommodate their disbelief.
When the scientific process is abandoned, the lesson throughout history is failure or outright disasterin human affairs. In the next and final chapter, I will focus on the significance of evolution and theimportance of adhering to the scientific process in our responsibility as the stewards of our planet.
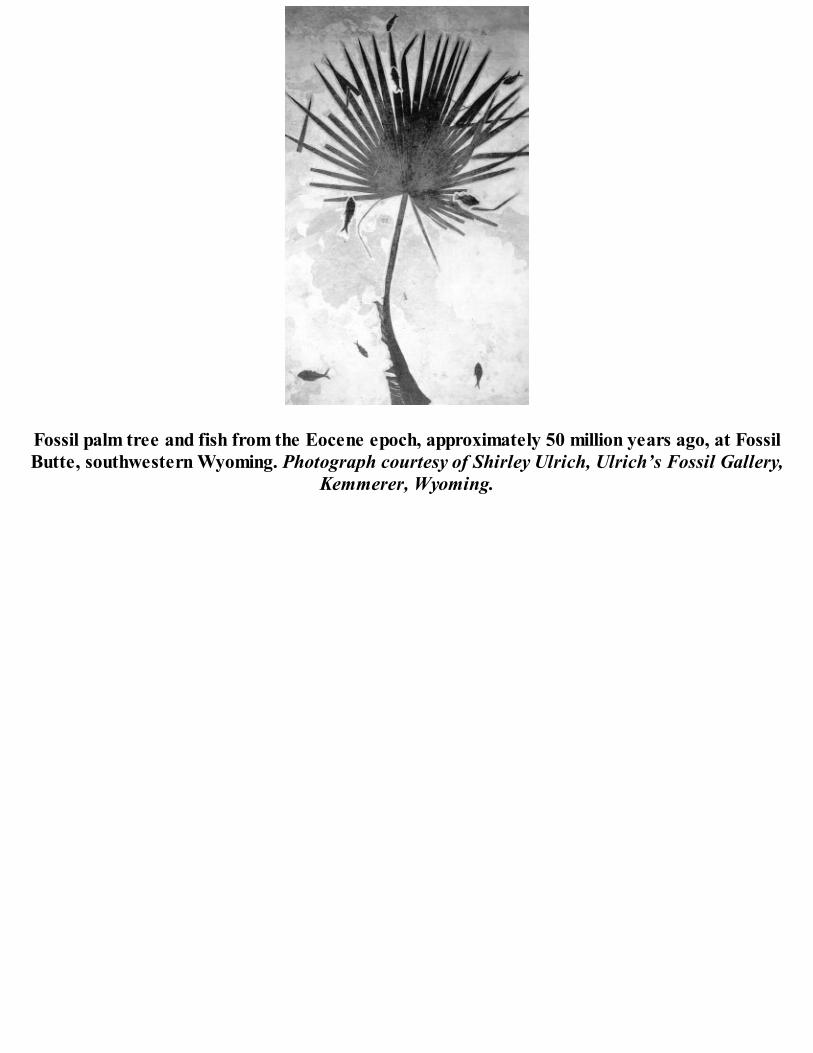
Fossil palm tree and fish from the Eocene epoch, approximately 50 million years ago, at FossilButte, southwestern Wyoming. Photograph courtesy of Shirley Ulrich, Ulrich’s Fossil Gallery,
Kemmerer, Wyoming.
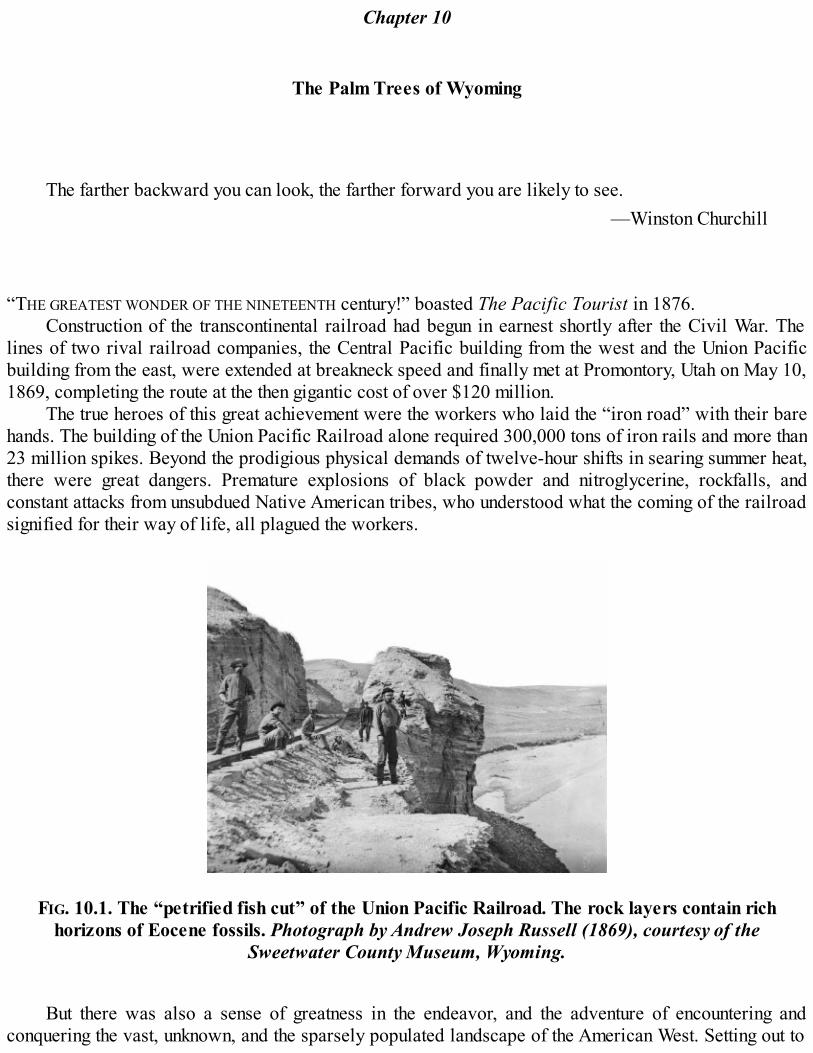
Chapter 10
The Palm Trees of Wyoming
The farther backward you can look, the farther forward you are likely to see.—Winston Churchill
“THE GREATEST WONDER OF THE NINETEENTH century!” boasted The Pacific Tourist in 1876.Construction of the transcontinental railroad had begun in earnest shortly after the Civil War. The
lines of two rival railroad companies, the Central Pacific building from the west and the Union Pacificbuilding from the east, were extended at breakneck speed and finally met at Promontory, Utah on May 10,1869, completing the route at the then gigantic cost of over $120 million.
The true heroes of this great achievement were the workers who laid the “iron road” with their barehands. The building of the Union Pacific Railroad alone required 300,000 tons of iron rails and more than23 million spikes. Beyond the prodigious physical demands of twelve-hour shifts in searing summer heat,there were great dangers. Premature explosions of black powder and nitroglycerine, rockfalls, andconstant attacks from unsubdued Native American tribes, who understood what the coming of the railroadsignified for their way of life, all plagued the workers.
FIG. 10.1. The “petrified fish cut” of the Union Pacific Railroad. The rock layers contain richhorizons of Eocene fossils. Photograph by Andrew Joseph Russell (1869), courtesy of the
Sweetwater County Museum, Wyoming.
But there was also a sense of greatness in the endeavor, and the adventure of encountering andconquering the vast, unknown, and the sparsely populated landscape of the American West. Setting out to
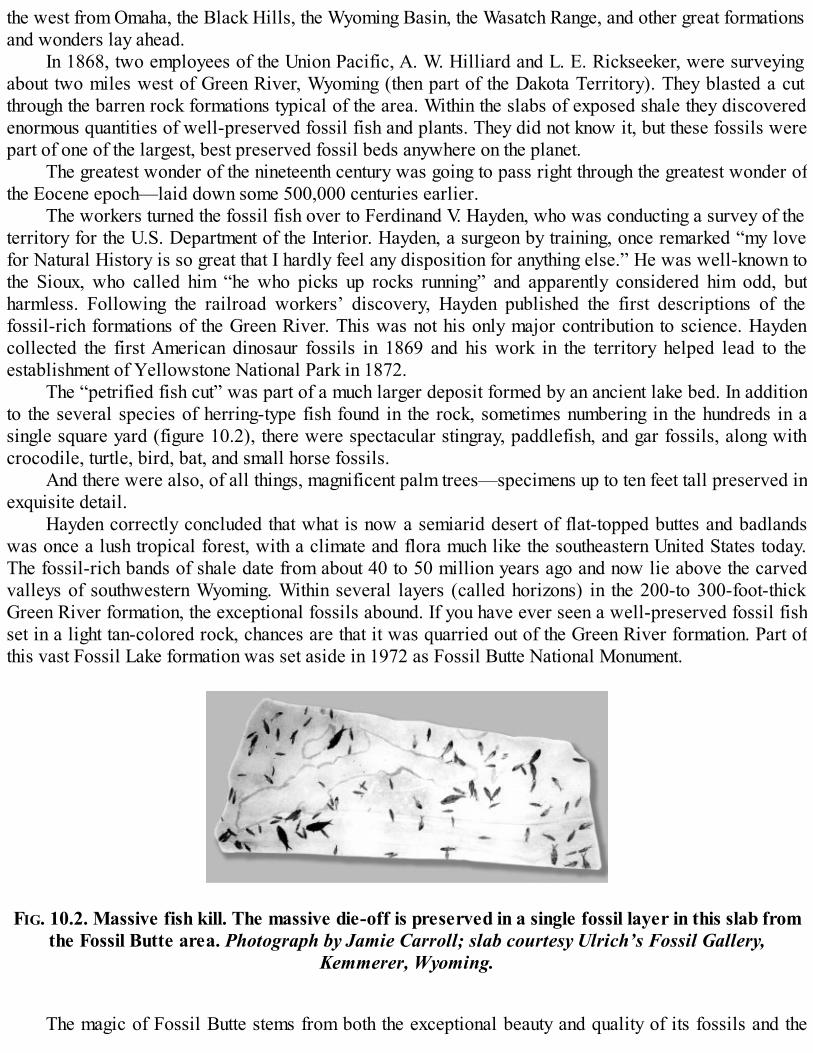
the west from Omaha, the Black Hills, the Wyoming Basin, the Wasatch Range, and other great formationsand wonders lay ahead.
In 1868, two employees of the Union Pacific, A. W. Hilliard and L. E. Rickseeker, were surveyingabout two miles west of Green River, Wyoming (then part of the Dakota Territory). They blasted a cutthrough the barren rock formations typical of the area. Within the slabs of exposed shale they discoveredenormous quantities of well-preserved fossil fish and plants. They did not know it, but these fossils werepart of one of the largest, best preserved fossil beds anywhere on the planet.
The greatest wonder of the nineteenth century was going to pass right through the greatest wonder ofthe Eocene epoch—laid down some 500,000 centuries earlier.
The workers turned the fossil fish over to Ferdinand V. Hayden, who was conducting a survey of theterritory for the U.S. Department of the Interior. Hayden, a surgeon by training, once remarked “my lovefor Natural History is so great that I hardly feel any disposition for anything else.” He was well-known tothe Sioux, who called him “he who picks up rocks running” and apparently considered him odd, butharmless. Following the railroad workers’ discovery, Hayden published the first descriptions of thefossil-rich formations of the Green River. This was not his only major contribution to science. Haydencollected the first American dinosaur fossils in 1869 and his work in the territory helped lead to theestablishment of Yellowstone National Park in 1872.
The “petrified fish cut” was part of a much larger deposit formed by an ancient lake bed. In additionto the several species of herring-type fish found in the rock, sometimes numbering in the hundreds in asingle square yard (figure 10.2), there were spectacular stingray, paddlefish, and gar fossils, along withcrocodile, turtle, bird, bat, and small horse fossils.
And there were also, of all things, magnificent palm trees—specimens up to ten feet tall preserved inexquisite detail.
Hayden correctly concluded that what is now a semiarid desert of flat-topped buttes and badlandswas once a lush tropical forest, with a climate and flora much like the southeastern United States today.The fossil-rich bands of shale date from about 40 to 50 million years ago and now lie above the carvedvalleys of southwestern Wyoming. Within several layers (called horizons) in the 200-to 300-foot-thickGreen River formation, the exceptional fossils abound. If you have ever seen a well-preserved fossil fishset in a light tan-colored rock, chances are that it was quarried out of the Green River formation. Part ofthis vast Fossil Lake formation was set aside in 1972 as Fossil Butte National Monument.
FIG. 10.2. Massive fish kill. The massive die-off is preserved in a single fossil layer in this slab fromthe Fossil Butte area. Photograph by Jamie Carroll; slab courtesy Ulrich’s Fossil Gallery,
Kemmerer, Wyoming.
The magic of Fossil Butte stems from both the exceptional beauty and quality of its fossils and the
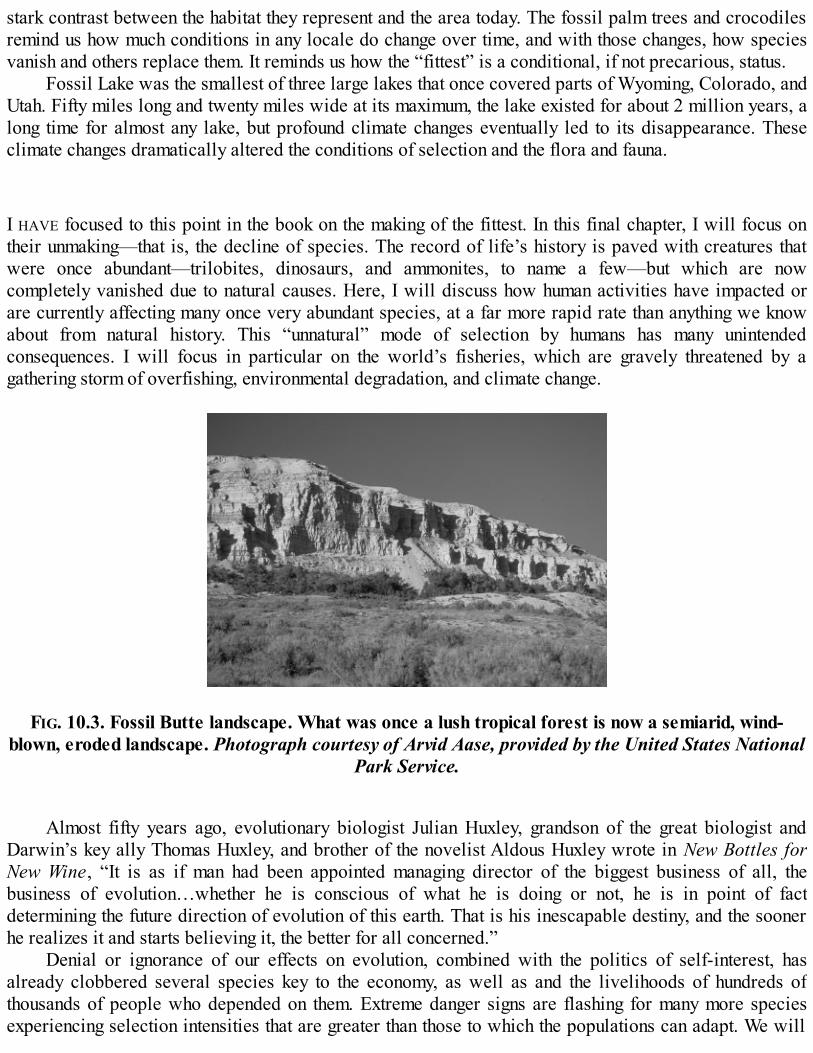
stark contrast between the habitat they represent and the area today. The fossil palm trees and crocodilesremind us how much conditions in any locale do change over time, and with those changes, how speciesvanish and others replace them. It reminds us how the “fittest” is a conditional, if not precarious, status.
Fossil Lake was the smallest of three large lakes that once covered parts of Wyoming, Colorado, andUtah. Fifty miles long and twenty miles wide at its maximum, the lake existed for about 2 million years, along time for almost any lake, but profound climate changes eventually led to its disappearance. Theseclimate changes dramatically altered the conditions of selection and the flora and fauna.
I HAVE focused to this point in the book on the making of the fittest. In this final chapter, I will focus ontheir unmaking—that is, the decline of species. The record of life’s history is paved with creatures thatwere once abundant—trilobites, dinosaurs, and ammonites, to name a few—but which are nowcompletely vanished due to natural causes. Here, I will discuss how human activities have impacted orare currently affecting many once very abundant species, at a far more rapid rate than anything we knowabout from natural history. This “unnatural” mode of selection by humans has many unintendedconsequences. I will focus in particular on the world’s fisheries, which are gravely threatened by agathering storm of overfishing, environmental degradation, and climate change.
FIG. 10.3. Fossil Butte landscape. What was once a lush tropical forest is now a semiarid, wind-blown, eroded landscape. Photograph courtesy of Arvid Aase, provided by the United States National
Park Service.
Almost fifty years ago, evolutionary biologist Julian Huxley, grandson of the great biologist andDarwin’s key ally Thomas Huxley, and brother of the novelist Aldous Huxley wrote in New Bottles forNew Wine, “It is as if man had been appointed managing director of the biggest business of all, thebusiness of evolution…whether he is conscious of what he is doing or not, he is in point of factdetermining the future direction of evolution of this earth. That is his inescapable destiny, and the soonerhe realizes it and starts believing it, the better for all concerned.”
Denial or ignorance of our effects on evolution, combined with the politics of self-interest, hasalready clobbered several species key to the economy, as well as and the livelihoods of hundreds ofthousands of people who depended on them. Extreme danger signs are flashing for many more speciesexperiencing selection intensities that are greater than those to which the populations can adapt. We will
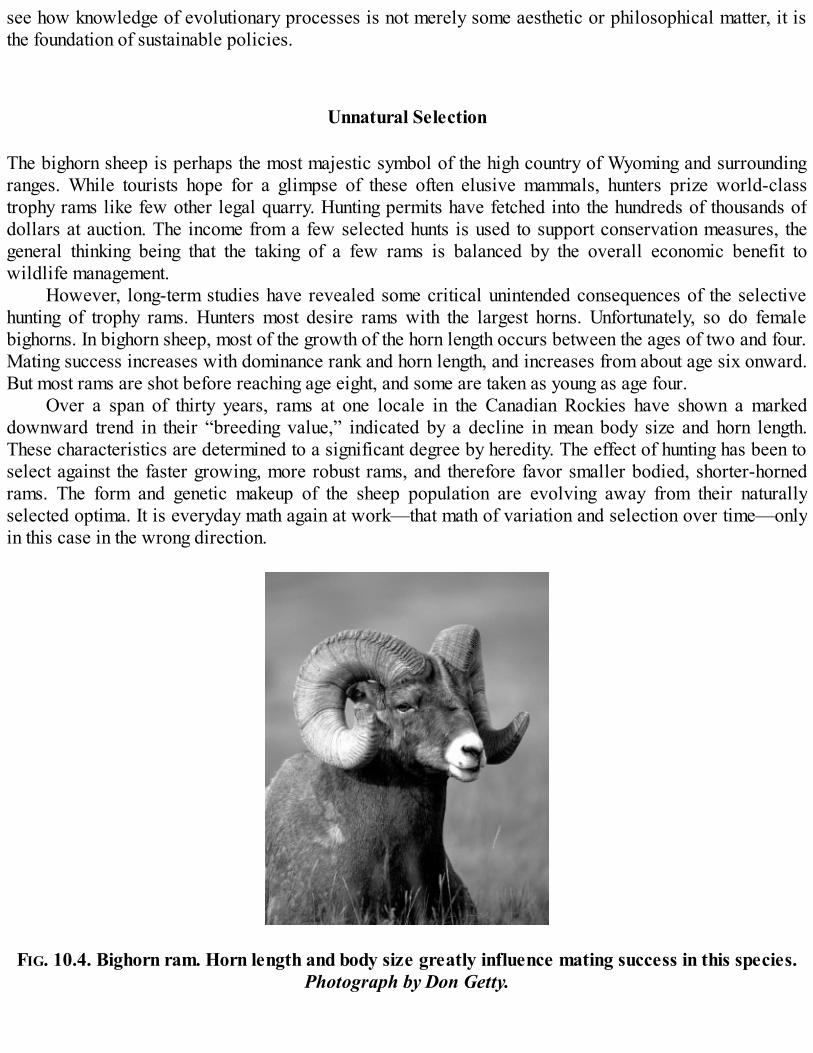
see how knowledge of evolutionary processes is not merely some aesthetic or philosophical matter, it isthe foundation of sustainable policies.
Unnatural Selection
The bighorn sheep is perhaps the most majestic symbol of the high country of Wyoming and surroundingranges. While tourists hope for a glimpse of these often elusive mammals, hunters prize world-classtrophy rams like few other legal quarry. Hunting permits have fetched into the hundreds of thousands ofdollars at auction. The income from a few selected hunts is used to support conservation measures, thegeneral thinking being that the taking of a few rams is balanced by the overall economic benefit towildlife management.
However, long-term studies have revealed some critical unintended consequences of the selectivehunting of trophy rams. Hunters most desire rams with the largest horns. Unfortunately, so do femalebighorns. In bighorn sheep, most of the growth of the horn length occurs between the ages of two and four.Mating success increases with dominance rank and horn length, and increases from about age six onward.But most rams are shot before reaching age eight, and some are taken as young as age four.
Over a span of thirty years, rams at one locale in the Canadian Rockies have shown a markeddownward trend in their “breeding value,” indicated by a decline in mean body size and horn length.These characteristics are determined to a significant degree by heredity. The effect of hunting has been toselect against the faster growing, more robust rams, and therefore favor smaller bodied, shorter-hornedrams. The form and genetic makeup of the sheep population are evolving away from their naturallyselected optima. It is everyday math again at work—that math of variation and selection over time—onlyin this case in the wrong direction.
FIG. 10.4. Bighorn ram. Horn length and body size greatly influence mating success in this species.Photograph by Don Getty.
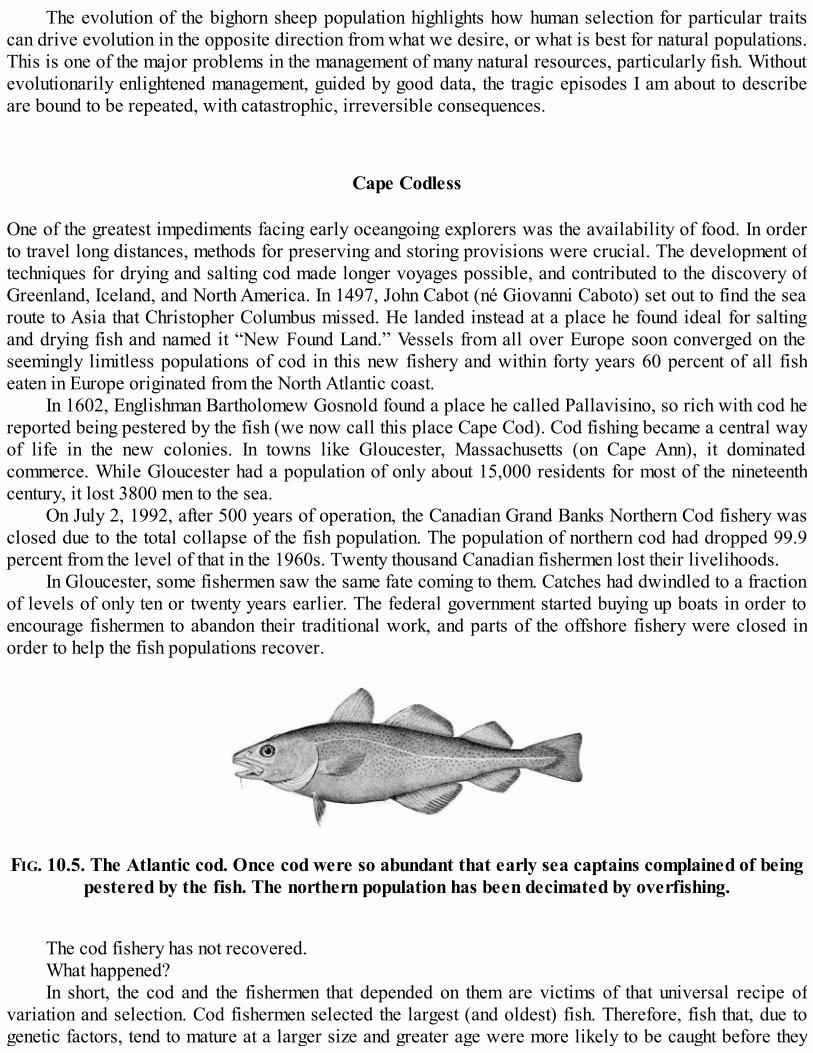
The evolution of the bighorn sheep population highlights how human selection for particular traitscan drive evolution in the opposite direction from what we desire, or what is best for natural populations.This is one of the major problems in the management of many natural resources, particularly fish. Withoutevolutionarily enlightened management, guided by good data, the tragic episodes I am about to describeare bound to be repeated, with catastrophic, irreversible consequences.
Cape Codless
One of the greatest impediments facing early oceangoing explorers was the availability of food. In orderto travel long distances, methods for preserving and storing provisions were crucial. The development oftechniques for drying and salting cod made longer voyages possible, and contributed to the discovery ofGreenland, Iceland, and North America. In 1497, John Cabot (né Giovanni Caboto) set out to find the searoute to Asia that Christopher Columbus missed. He landed instead at a place he found ideal for saltingand drying fish and named it “New Found Land.” Vessels from all over Europe soon converged on theseemingly limitless populations of cod in this new fishery and within forty years 60 percent of all fisheaten in Europe originated from the North Atlantic coast.
In 1602, Englishman Bartholomew Gosnold found a place he called Pallavisino, so rich with cod hereported being pestered by the fish (we now call this place Cape Cod). Cod fishing became a central wayof life in the new colonies. In towns like Gloucester, Massachusetts (on Cape Ann), it dominatedcommerce. While Gloucester had a population of only about 15,000 residents for most of the nineteenthcentury, it lost 3800 men to the sea.
On July 2, 1992, after 500 years of operation, the Canadian Grand Banks Northern Cod fishery wasclosed due to the total collapse of the fish population. The population of northern cod had dropped 99.9percent from the level of that in the 1960s. Twenty thousand Canadian fishermen lost their livelihoods.
In Gloucester, some fishermen saw the same fate coming to them. Catches had dwindled to a fractionof levels of only ten or twenty years earlier. The federal government started buying up boats in order toencourage fishermen to abandon their traditional work, and parts of the offshore fishery were closed inorder to help the fish populations recover.
FIG. 10.5. The Atlantic cod. Once cod were so abundant that early sea captains complained of beingpestered by the fish. The northern population has been decimated by overfishing.
The cod fishery has not recovered.What happened?In short, the cod and the fishermen that depended on them are victims of that universal recipe of
variation and selection. Cod fishermen selected the largest (and oldest) fish. Therefore, fish that, due togenetic factors, tend to mature at a larger size and greater age were more likely to be caught before they
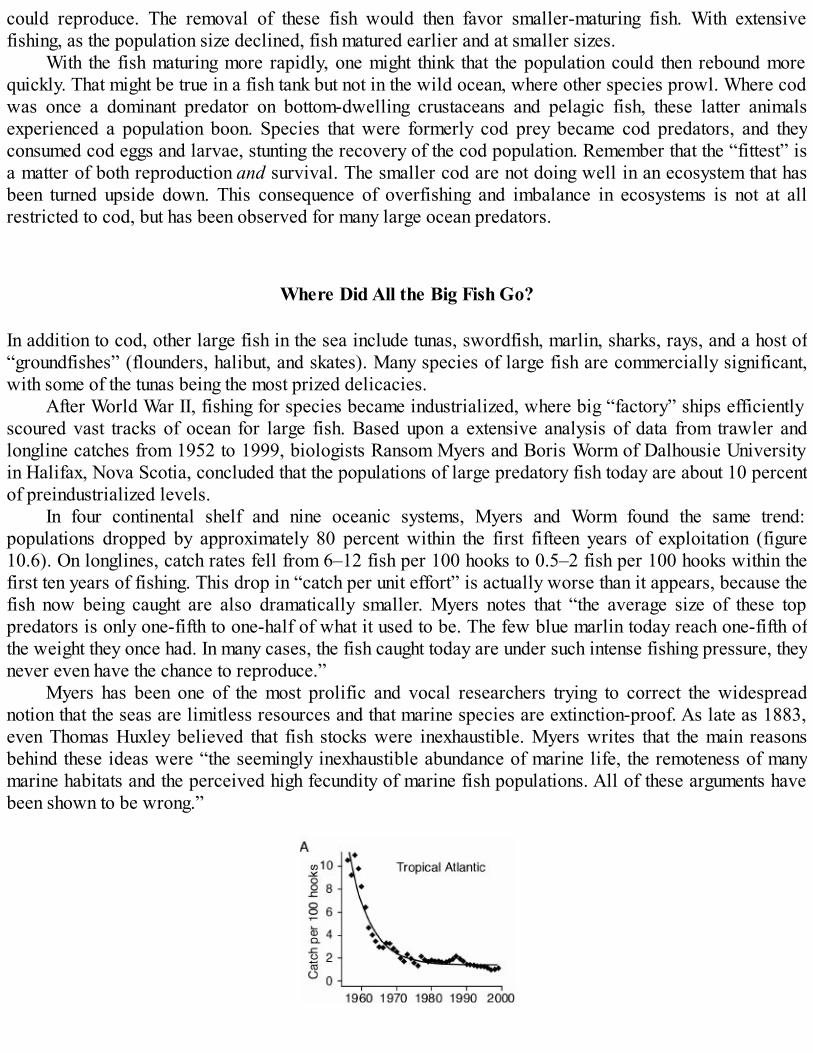
could reproduce. The removal of these fish would then favor smaller-maturing fish. With extensivefishing, as the population size declined, fish matured earlier and at smaller sizes.
With the fish maturing more rapidly, one might think that the population could then rebound morequickly. That might be true in a fish tank but not in the wild ocean, where other species prowl. Where codwas once a dominant predator on bottom-dwelling crustaceans and pelagic fish, these latter animalsexperienced a population boon. Species that were formerly cod prey became cod predators, and theyconsumed cod eggs and larvae, stunting the recovery of the cod population. Remember that the “fittest” isa matter of both reproduction and survival. The smaller cod are not doing well in an ecosystem that hasbeen turned upside down. This consequence of overfishing and imbalance in ecosystems is not at allrestricted to cod, but has been observed for many large ocean predators.
Where Did All the Big Fish Go?
In addition to cod, other large fish in the sea include tunas, swordfish, marlin, sharks, rays, and a host of“groundfishes” (flounders, halibut, and skates). Many species of large fish are commercially significant,with some of the tunas being the most prized delicacies.
After World War II, fishing for species became industrialized, where big “factory” ships efficientlyscoured vast tracks of ocean for large fish. Based upon a extensive analysis of data from trawler andlongline catches from 1952 to 1999, biologists Ransom Myers and Boris Worm of Dalhousie Universityin Halifax, Nova Scotia, concluded that the populations of large predatory fish today are about 10 percentof preindustrialized levels.
In four continental shelf and nine oceanic systems, Myers and Worm found the same trend:populations dropped by approximately 80 percent within the first fifteen years of exploitation (figure10.6). On longlines, catch rates fell from 6–12 fish per 100 hooks to 0.5–2 fish per 100 hooks within thefirst ten years of fishing. This drop in “catch per unit effort” is actually worse than it appears, because thefish now being caught are also dramatically smaller. Myers notes that “the average size of these toppredators is only one-fifth to one-half of what it used to be. The few blue marlin today reach one-fifth ofthe weight they once had. In many cases, the fish caught today are under such intense fishing pressure, theynever even have the chance to reproduce.”
Myers has been one of the most prolific and vocal researchers trying to correct the widespreadnotion that the seas are limitless resources and that marine species are extinction-proof. As late as 1883,even Thomas Huxley believed that fish stocks were inexhaustible. Myers writes that the main reasonsbehind these ideas were “the seemingly inexhaustible abundance of marine life, the remoteness of manymarine habitats and the perceived high fecundity of marine fish populations. All of these arguments havebeen shown to be wrong.”

FIG. 10.6. The decline of large fish populations. The number of large fish has declined in both theAtlantic (A) and Pacific (B) oceans as measured by longline catch rates (diamonds and boxes).
Hammerhead sharks show a decline typical of most shark species (C). Data is from R. Myers and B.Worm (2003), Nature 423:280, and J. K. Baum et al. (2003), Science 299:389; redrawn by Leanne
Olds.
We humans may have little concern for the livelihoods of hammerhead or white sharks, but inanother study (of which Myers and Worm were co-authors) it was found that their populations haddeclined by 75 percent, and all shark populations by 50 percent, over the past fifteen years. Some of thisdecline is due to so-called by-catch, the snaring of species on hooks or in trawls intended for otherspecies. As top predators, sharks have important influences on the structure of food webs in the ocean,and on the functioning of ecosystems. The reductions of shark populations thus changes the conditions ofselection in ecosystems, with some unpredictable consequences.
Trawling imposes another dimension of selection—on fish size. For example, the regulated meshsize on commercial fishing gear over the past several decades has ranged from 7 to 14 centimeters. Thismeans that some species are inadvertently caught in trawls while others slip through. The impact of thissize selection is well documented for skates in the North Atlantic.
Over the past several decades two small skate species, the thorny skate and smooth skate, haveactually increased in numbers. However, the barndoor skate, an animal that reaches up to 1 meter in widthand is about 20 centimeters long at hatching, is near extinction. The decline of the barndoor skate wentunnoticed for years, until Jill Casey at Memorial University in Newfoundland and Ransom Myersdiscovered that not a single animal had appeared in trawls off southern Newfoundland in the last twentyyears. Forty-five years ago, barndoor skates were caught in 10 percent of all trawls. The only recentfinding of the skate was at depths of 1000 meters offshore, in an area being considered as a new halibutfishery.
The decline of large predators, or the selective loss of other large fish, cannot be viewed simply aslosses of single species. It is crucial to understand the consequences of overfishing and by-catch in theecosystems in which they live (or lived).
Dominoes
There are several types of natural coastal marine habitats in the world, including coral reefs, kelp forests,sea-grass beds, and estuaries. In each of these communities, certain types of organisms are key to theirstructure and diversity, and complex webs of interaction exist between members. Overfishing and otherhuman activities disrupt these webs, with often catastrophic effects.
For example, kelp forests provide home to many fish, invertebrates, and certain mammals such assea otters. Sea urchins graze on the kelp, and the urchins are in turn food for the otters and groundfish suchas cod. Where the cod have been eliminated by overfishing, or the otters killed off by fur hunters, the seaurchins have overrun the kelp and “deforested” the area. This is the domino effect of removing topconsumers in the food web. If sea urchins are then harvested by fishing, the kelp returns, but the othermembers of the community are still missing, so the kelp forest is permanently impoverished.
Coral reefs are also home to diverse species of fish and invertebrates that are in turn preyed upon bylarger animals. The crown of thorns feeds on corals and appears to be held in check by certain species offish. In the 1980s, massive outbreaks of these starfish on the Great Barrier Reef led to a dramatic declinein coral populations, robbing many animals of their only habitat.
The health of the sea-grass beds that cover various bays, lagoons, and other coastal areas issimilarly dependent on the animals that forage on them, and the animals in turn depend on the sea grass.Sea turtles crop sea grass, a process that helps keep nutrients in the food chain and out of sea-bottomsediments. Turtle populations have been dramatically reduced or exterminated in most locales, which hascontributed to the die-off and decline of sea-grass beds.
Dugongs are also important tenders of sea-grass beds. Australian colonists reported vast herd ofdugongs in Moreton Bay on the Queensland coast in the late nineteenth century. Three-or four-mile-longherds numbering tens of thousands of animals have since been reduced to a total population of just 500individuals. Sought for their oil and flesh, the dugong “fishery” was rapidly exhausted in short order.
Jeremy Jackson of the Scripps Institution of Oceanography in La Jolla, California, and eighteenmarine scientist colleagues have analyzed the vast changes in coastal ecosystems since the dawn ofcivilization approximately 10,000 years ago. They see a similar pattern of decline in three stages acrossthe world. First, there was limited aboriginal use. Then, increased exploitation over the period ofEuropean expansion and colonization. And, finally the recent rapid exhaustion of populations andecosystems. They note that the baselines of marine populations of 1950 or 1960 used to calibrate recentchange are themselves but a fraction of populations before humans began exploiting them.
Jackson and colleagues caution that “few modern ecological studies take into account the formernatural abundances of large marine vertebrates” and remind us that so many places in the world—islands,towns, bays, etc.—are named after animals that either no longer exist there or are but a remnant of oncemassive populations. The tens of thousands of sea turtles that visit certain nesting areas may seem like agreat horde, until one considers that these populations numbered tens of millions a few centuries ago.
A Perfect Storm
While overfishing is no doubt to blame for the massive reduction of natural populations, the growth inhuman populations and industry since the Industrial Revolution has introduced additional stresses onalready depleted ecosystems. A perfect storm is brewing—of overfishing, pollution, and man-madeclimate change—that threatens to extinguish ecosystems beyond any chance of recovery. One need onlylook at habitats close to population centers for abundant evidence of the synergistic effects of these three
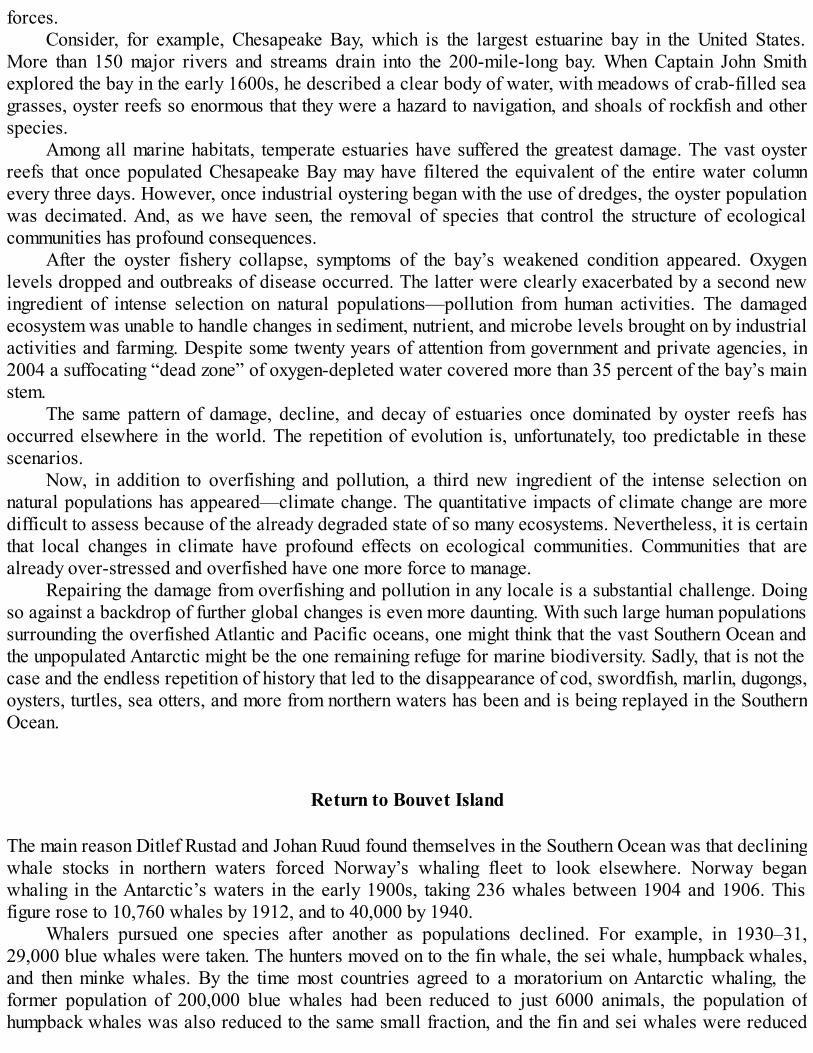
forces.Consider, for example, Chesapeake Bay, which is the largest estuarine bay in the United States.
More than 150 major rivers and streams drain into the 200-mile-long bay. When Captain John Smithexplored the bay in the early 1600s, he described a clear body of water, with meadows of crab-filled seagrasses, oyster reefs so enormous that they were a hazard to navigation, and shoals of rockfish and otherspecies.
Among all marine habitats, temperate estuaries have suffered the greatest damage. The vast oysterreefs that once populated Chesapeake Bay may have filtered the equivalent of the entire water columnevery three days. However, once industrial oystering began with the use of dredges, the oyster populationwas decimated. And, as we have seen, the removal of species that control the structure of ecologicalcommunities has profound consequences.
After the oyster fishery collapse, symptoms of the bay’s weakened condition appeared. Oxygenlevels dropped and outbreaks of disease occurred. The latter were clearly exacerbated by a second newingredient of intense selection on natural populations—pollution from human activities. The damagedecosystem was unable to handle changes in sediment, nutrient, and microbe levels brought on by industrialactivities and farming. Despite some twenty years of attention from government and private agencies, in2004 a suffocating “dead zone” of oxygen-depleted water covered more than 35 percent of the bay’s mainstem.
The same pattern of damage, decline, and decay of estuaries once dominated by oyster reefs hasoccurred elsewhere in the world. The repetition of evolution is, unfortunately, too predictable in thesescenarios.
Now, in addition to overfishing and pollution, a third new ingredient of the intense selection onnatural populations has appeared—climate change. The quantitative impacts of climate change are moredifficult to assess because of the already degraded state of so many ecosystems. Nevertheless, it is certainthat local changes in climate have profound effects on ecological communities. Communities that arealready over-stressed and overfished have one more force to manage.
Repairing the damage from overfishing and pollution in any locale is a substantial challenge. Doingso against a backdrop of further global changes is even more daunting. With such large human populationssurrounding the overfished Atlantic and Pacific oceans, one might think that the vast Southern Ocean andthe unpopulated Antarctic might be the one remaining refuge for marine biodiversity. Sadly, that is not thecase and the endless repetition of history that led to the disappearance of cod, swordfish, marlin, dugongs,oysters, turtles, sea otters, and more from northern waters has been and is being replayed in the SouthernOcean.
Return to Bouvet Island
The main reason Ditlef Rustad and Johan Ruud found themselves in the Southern Ocean was that decliningwhale stocks in northern waters forced Norway’s whaling fleet to look elsewhere. Norway beganwhaling in the Antarctic’s waters in the early 1900s, taking 236 whales between 1904 and 1906. Thisfigure rose to 10,760 whales by 1912, and to 40,000 by 1940.
Whalers pursued one species after another as populations declined. For example, in 1930–31,29,000 blue whales were taken. The hunters moved on to the fin whale, the sei whale, humpback whales,and then minke whales. By the time most countries agreed to a moratorium on Antarctic whaling, theformer population of 200,000 blue whales had been reduced to just 6000 animals, the population ofhumpback whales was also reduced to the same small fraction, and the fin and sei whales were reduced
to 20 percent of their original numbers.Rustad’s primary research was on krill, the short crustacean at the center of the Antarctic food web.
As the whaling industry faded, krill became a target for large-scale harvesting, beginning in 1972–73.Krill is processed into products for human consumption, for livestock, and for fish farming. It may be themost abundant animal on the planet. Vast swarms of krill may cover almost 200 square miles of ocean andcontain 2 million tons of animals. A single cubic meter of a swarm can contain 1 million animals. Thepeak krill catch was over 500,000 tons in 1982 and now averages about 100,000 tons per year. Theestimates of total krill stocks are in the tens to several hundred millions of tons, so the harvest rate at themoment does not appear to be a threat. However, long-term studies indicate that the density of krill hasdropped by 80 percent over the past seventy-five years. If that is not accounted for by harvesting, thenwhat is happening?
FIG. 10.7. The krill, Euphasia superba. This shrimp may be the most abundant animal on Earth andis critical to the Antarctic food web. Its density has declined by 80 percent over the past seventy-
five years.
Air temperature in the Antarctic Peninsula has risen by 4 to 5 degrees F in the last fifty years, morethan five times the average rise across the globe. With that rise, there has been a decline in the mass ofsea ice. Krill feed on algae that live on the sea ice, so it appears that the chain of dominoes is globalwarming leads to sea ice melting leads to less algae food leads to fewer krill.
Of course, as you are well aware, there are concerns that the rise of air and water temperature andthe loss of sea ice will continue unabated with global warming. Some scientists have forecasted a rise ofup to 4 to 5 degrees F in temperatures over the next 100 years. In the Antarctic, this would certainlyreduce the amount of sea ice available for algal growth, and stress both animal populations that depend onkrill as well as those that are cold-adapted.
What, then, is the fate of the marvelous icefish? These potential climate changes are worrisomeenough, but the icefish has already experienced catastrophe. As the whaling industry died, attention turnedto other Antarctic fisheries, including the icefish. The mackerel icefish Champsocephalus gunnari (colorplate B) was fished beginning in 1971. By 1978, the catch had peaked at 235,000 tons. And then the samesad history I have recounted throughout this chapter repeated itself, with the fishery’s collapse and thecatch dropping to 13,000 tons in 1991, and then to only 66 tons in 1992, with no subsequent recovery.
We might have saved the blue whale from extermination (after decades of dawdling and politicalwrangling), but we clearly did not learn the bigger lesson.
Whatever the fate of the icefish, it is clear that its recovery will require it to swim against the currentof overfishing, ecosystem disruption, and climate change. With its physiology so tuned to the subfreezingwater temperature, it is not clear whether its depleted populations could adapt to a substantial rise inwater temperature over a period as short as a century, compounded by the added stress of decreased foodsources.
The Jarring Gong
Want of foresight, unwillingness to act when action would be simple and effective, lack ofclear thinking, confusion of counsel until the emergency comes, until self-preservation strikesits jarring gong—these are the features which constitute the endless repetition of history.
—Winston Churchill, May 2, 1935 speech to the House of Commons
I realize that this chapter is ending our afterdinner conversation on a most downbeat note. But Ibelieve this is absolutely necessary. I am a professional biologist, yet I was largely unaware of the direstatistics I have just presented until I did the research for this chapter. You can at least be thankful that Idid not examine trends in the rain forests or other habitats here.
Winston Churchill’s words are the most apt parting message I can offer. The future of nature atpresent looks terribly gloomy, much as the state of geopolitics looked to Churchill in 1935. He saw thethreat of fascism, Nazism, and Soviet-style communism and issued countless warnings that went unheededfor years. Then, as now, most of the West’s leaders were in denial, guided by wishful thinking and blindoptimism. They made symbolic gestures in worthless treaties, empty platitudes, and spinelessappeasement. After France’s rapid collapse in 1940, Churchill’s Britain stood alone until the UnitedStates was finally pushed into the war by Japan’s surprise attack on Pearl Harbor. The war on Nature hasbeen waged with increasing intensity over the past fifty years, but few powerful allies have come to heraid.
The challenge to halt the decline of nature, let alone to reverse its decimation, lies ahead. RansomMyers laments, “We are in massive denial and continue to bicker over the last shrinking numbers ofsurvivors, employing satellites and sensors to catch the last fish left. We have to understand how close toextinction some of these populations really are. And we must act now, before they have reached the pointof no return. I want there to be hammerhead sharks and blue fin tuna around when my five-year-old songrows up. If present fishing levels persist, these great fish will go the way of the dinosaurs.”
Of course, a common response to such concerns is the familiar denial and rhetoric of self-interest.Myers was stifled by bureaucrats when he worked in his province’s Department of Fisheries and Oceans,reprimanded for disagreeing with the department when it tried to blame the cod collapse on cold water orincreasing numbers of seals, and was even sued for libel when he publicly criticized the department.
Concerns about the environment are often discounted as alarmist, or merely philosophical oraesthetic sentiment. But the cold hard data obliterates any question about motives. Just consider thepresent statistics and past experience as a practical matter of self-interest. Ransom Myers and BorisWorm write, “Today’s management decisions will determine whether we will enjoy biologically diverse,economically profitable fish communities twenty or fifty years from now, or whether we will have to lookback on a history of collapse and extinction that was not reversed in time.”
Yet, here we are at the opening of the twenty-first century, with the benefit of two centuries ofevolutionary science, still debating the existence of evolution. And with more than two centuries ofexperience of the consequences of overfishing, overhunting, and pollution, chasing what few fish are left.
The Huxley brothers remind us that “facts do not cease to exist because they are ignored” and thatwe are now “determining the future direction of evolution on this earth.” Will we heed these facts andaccept our responsibility, if only out of self-interest? Or will cod, tuna, marlin, blue whales, dugongs,icefish, and more become as rare as palm trees in Wyoming?

Sources and Further Reading
The discoveries and ideas I have described are the accomplishments of a very large number of biologists.Because this book is intended for a broad audience, I chose not to name every individual or laboratoryassociated with each specific discovery, nor to use footnotes in the text; instead, I provide two sets ofsources and references in this section. First, I offer some suggestions for books on evolution for furtherreading. And second, I detail a chapter-by-chapter summary of the original references upon which Irelied. In most cases, the titles of scientific journal articles are omitted because the citation includesenough information for interested readers to locate them. Abstracts of most biological research papers canbe accessed via a free government-sponsored database called PubMed athttp://www.ncbi.nlm.nih.gov/entrez/query.fcgi.
General Books on EvolutionOf the many excellent books on evolution, the following may be of particular interest to readers of thisbook.
Carroll, Sean. Endless Forms Most Beautiful: The New Science of Evo Devo and the Making of theAnimal Kingdom. New York: W. W. Norton, 2005.
Conway Morris, Simon. Life’s Solution: Inevitable Humans in a Lonely Universe. Cambridge:Cambridge University Press, 2003.
Dawkins, Richard. The Ancestor’s Tale: A Pilgrimage to the Dawn of Evolution. New York: HoughtonMifflin, 2004.
———. The Blind Watchmaker: Why the Evidence of Evolution Reveals a Universe Without Design.New York: W. W. Norton, 1986.
———. Climbing Mount Improbable. New York: W. W. Norton, 1996.Desmond, Adrian, and James Moore. Darwin: The Life of a Tormented Evolutionist. London: Michael
Joseph, 1991.Knoll, Andrew. Life on a Young Planet: The First Three Billion Years of Evolution on Earth. Princeton,
N.J: Princeton University Press, 2003.Palumbi, Stephen. The Evolution Explosion: How Humans Cause Rapid Evolutionary Change. New
York: W. W. Norton, 2001.Ridley, Matt. The Red Queen: Sex and the Evolution of Human Nature. London: Penguin, 1993.Weiner, Jonathan. The Beak of the Finch: A Story of Evolution in Our Time. New York: Alfred A.
Knopf, 1994.Zimmer, Carl. Evolution: The Triumph of an Idea. New York, HarperCollins, 2001.
Preface. Beyond Any Reasonable DoubtThe exoneration of Kevin Lee Green is mentioned in the report “What Every Law Enforcement OfficerShould Know About DNA Evidence” (National Institute of Justice, National Commission on the Future ofDNA Evidence, 1999) and in the case histories of the Innocence Project (www.innocenceproject.org).The increased use of DNA matching to solve cold cases is described in the “National Forensic DNA
Study Report” (Smith Alling Lane, P.S., and Washington State University, 2003).The rapid growth in the volume of DNA sequences in public databases is tracked at GenBank
(www.ncbi.nih.gov/genbank/genbankstats.html).
1. Introduction: The Bloodless Fish of Bouvet IslandThe voyage and work undertaken by Ditlef Rustad on the S.S. Norvegia, and his photographs, aredocumented in O. Holtedahl, ed., Scientific Results of the Norwegian Antarctic Expeditions, 1927–1928(Oslo: I Kommisjon Hos Jacob Dybwad, 1935).
Johan Ruud described his journeys to the Antarctic in Scientific American 213 (1965): 108–15. Hisoriginal paper on the absence of red blood cells in the icefish is in Nature 173 (1954): 848–50.
Descriptions of the globin genes of icefish are reported in G. di Prisco et al., Gene 295 (2002):185–91; E. Cocca et al., Proceedings of the National Academy of Sciences, USA 92 (1995): 1817–23;and Y. Zhao et al., Journal of Biological Chemistry 273 (1998): 14745–52. A general review of icefishbiology and genetics is B. D. Sidell, Gravitational and Space Biology Bulletin 13 (2000): 25–34. Thefunctional evolution of icefish microtubules is reported in H. W. Detrich et al., Journal of BiologicalChemistry 275 (2000): 37038–47. The origin of icefish antifreeze is reported in L. Chen, A. L. DeVries,and C.-H. C. Cheng, Proceedings of the National Academy of Sciences, USA 94 (1997): 3811–16, andthe fate of icefish myoglobin is detailed in B. D. Sidell et al., Proceedings of the National Academy ofSciences, USA 94 (1997): 3420–24; T. J. Moylan and B. D. Sidell, The Journal of Experimental Biology203 (2000): 1277–86; and D. J. Small et al., The Journal of Experimental Biology 206 (2003): 131–39.
The geology of the Antarctic and history of the Southern Ocean is reviewed in J. Zachos et al.,Science 292 (2001): 686–93; and ocean cooling is described in A. E. Shevenall, J. P. Kennett, and D. W.Lea, Science 305 (2004): 1766–70. The history of the notothenioid fishes is obtained from T. J. Near,Antarctic Science 16 (2004): 37–44; and T. J. Near, J. J. Pesavento, and C.-H.C. Cheng, MolecularPhylogenetics and Evolution 32 (2004): 881–91.
The histories of Darwin’s voyage, discoveries, life, and writings are available in a number ofsuperb biographies. For specific historical dates and details, I relied upon A. Desmond and J. Moore,Darwin: The Life of a Tormented Evolutionist (London: Michael Joseph, 1991). The passages from Onthe Origin of Species are taken from the first edition published in 1859. The phrase “survival of thefittest” first appeared in philosopher Herbert Spencer’s Social Statics (1851).
The quotation from Sir Peter Medawar are taken from J. A. Moore, Science as a Way of Knowing:The Foundation of Modern Biology (Cambridge, Mass.: Harvard University Press, 1993).
The decline in Antarctic krill is described in A. Atkinson et al., Nature 432 (2004): 100–103.
2. The Everyday Math of Evolution: Chance, Selection, and TimeCalifornia State University professor Mike Orkin discussed the odds of winning the lottery relative tohaving a car accident or other mishaps in an interview with CNN reporter Daryn Kagan on August 22,2001. The odds of dog bite, shark attack, and mountain lion mauling were reported by Scott Latee in theSan Diego Union-Tribune of February 22, 2004.
Darwin’s interest in pigeons is also evident in his The Variation of Animal and Plants UnderDomestication (London: John Murray, 1868). Information about William Castle, R. C. Punnett, H. T. J.Norton, J. B. S. Haldane, and others was drawn in part from a comprehensive and succinct history ofevolutionary genetics by William B. Provine, The Origins of Theoretical Population Genetics (Chicago:University of Chicago Press, 1971). General surveys of natural selection in the wild include: John A.

Endler, Natural Selection in the Wild (Princeton, N.J.: Princeton University Press, 1986); J. G.Kingsolver et al., The American Naturalist 157 (2001): 245–61; and A. P. Hendry and M. T. Kinnison,Evolution 53 (1999): 1637–53.
The evolution of the peppered moth is described in M. Majerus, Melanism: Evolution in Action(Oxford: Oxford University Press, 1998); B. S. Grant, Evolution 53 (1999): 980–84; and B. S. Grant, D.F. Owen, and C. A. Clarke, Journal of Heredity 87 (1996): 351–57; see also J. Mallet, Genetics SocietyNews, issue 50: 34–38, and J. Coyne, Nature 396 (1998): 35–36.
A summary of selection coefficients operating on animal coloration is given by H. Hoekstra, K. E.Drumm, and M. W. Nachman, Evolution 58 (2004): 1329–41. The long-term field study of peregrinefalcon predation on pigeons is by A. Palleroni et al., Nature 434 (2005): 973–74. The long-term study ofstickleback evolution in Loberg Lake is M. A. Bell, W. E. Aguirre, and N. J. Buck, Evolution 58 (2004):814–24.
Mutation rates in mammals are summarized in S. Kumer and S. Subramanian, Proceedings of theNational Academy of Sciences, USA 99 (2002): 803–8, and the estimated human mutation rate is from M.W. Nachman and S. L. Crowell, Genetics 154 (2000): 297–304. The rates of mutations causing black furcolor in pocket mice are estimated from estimates of natural mutation rates in the house mouse by G.Schlager and M.M. Dickie, Mutation Research 11 (1971): 89–96; and the number of mutable sites isfrom M. W. Nachman, H. E. Hoekstra, and S. L. D’Agostino, Proceedings of the National Academy ofSciences, USA 100 (2003): 5268–73, and references therein. The mathematical formulas for estimatingtimes required for evolutionary change are obtained from Wen-Hsiung Li, Molecular Evolution(Sunderland, Mass.: Sinauer Associates, 1997). Reproductive rates in pocket mice are taken from H. E.Hoekstra and M. W. Nachman, University of California Publications in Zoology 2005:61–81. The roleof migration and selection in rock pocket mice populations is discussed in M. W. Nachman, Genetica 123(2005): 125–36.
A general survey of rates of evolution is by P. D. Gingerich, Science 222 (1983): 159–61.Kimura’s classic works on the neutral theory include M. Kimura, Nature 217 (1968): 624–26; M.
Kimura, Proceedings of the National Academy of Sciences, USA 63 (1969): 1181–88; and M. Kimura,The Neutral Theory of Molecular Evolution (Cambridge: Cambridge University Press, 1983).
3. Immortal Genes: Running in Place for EonsT. D. Brock’s discoveries and experiences in Yellowstone National Park are described in T. D. Brock,Annual Review of Microbiology 49 (1995): 1–28; T. D. Brock, Genetics 145 (1997): 1207–10; and T. D.Brock, Life at High Temperatures (Yellowstone Association for Natural Science, History, andEducation, 1994). Carl Woese’s key works on establishing the domain Archaea include C. R. Woese andG. F. Fox, Proceedings of the National Academy of Sciences, USA 74 (1977): 5088–90; and C. R.Woese, O. Kandler, and M. L. Wheel, Proceedings of the National Academy of Sciences, USA 87(1990): 4576–79.
The comparison of sequenced genomes is now a very large literature. The data cited on specificspecies were obtained from E. V. Koonin, Nature Reviews Microbiology 1 (2003): 127–36; K. S.Makarova et al., Genome Research 9 (1999): 608–28; R. L. Tatusov et al., BMC Bioinformatics 4(2003): 41; G. M. Rubin et al., Science 287 (2000); 2204–15; K. S. Marakova and E. V. Koonin, GenomeBiology 4 (2003): 115; and O. Jaillon et al., Nature 431 (2004): 946–57.
The “immortal” core of proteins shared among all domains of life is discussed in E. V. Koonin,Nature Reviews Microbiology 1 (2003): 127–36. The estimate of roughly 500 core proteins was apersonal communication of E.V. Koonin to S. B. Carroll (November 2, 2004).
The evolution of eukaryotes from archaean and bacterial “parents” is detailed in M. C. Rivera and J.
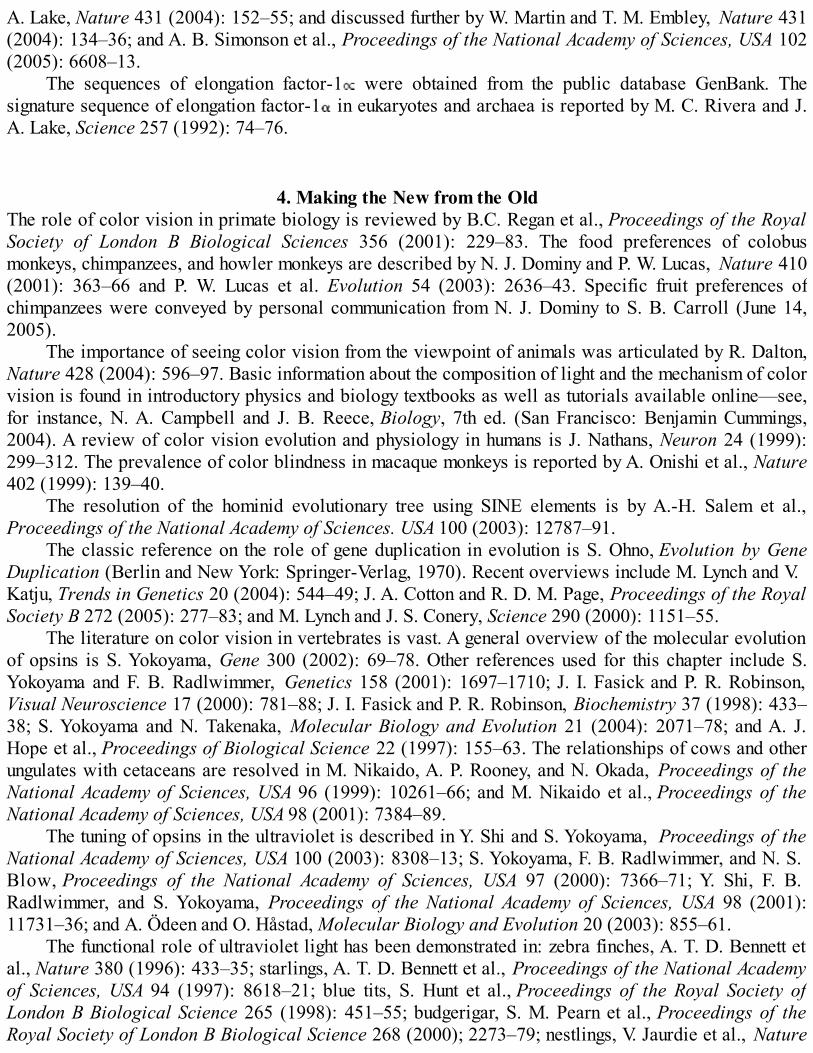
A. Lake, Nature 431 (2004): 152–55; and discussed further by W. Martin and T. M. Embley, Nature 431(2004): 134–36; and A. B. Simonson et al., Proceedings of the National Academy of Sciences, USA 102(2005): 6608–13.
The sequences of elongation factor-1 were obtained from the public database GenBank. Thesignature sequence of elongation factor-1 in eukaryotes and archaea is reported by M. C. Rivera and J.A. Lake, Science 257 (1992): 74–76.
4. Making the New from the OldThe role of color vision in primate biology is reviewed by B.C. Regan et al., Proceedings of the RoyalSociety of London B Biological Sciences 356 (2001): 229–83. The food preferences of colobusmonkeys, chimpanzees, and howler monkeys are described by N. J. Dominy and P. W. Lucas, Nature 410(2001): 363–66 and P. W. Lucas et al. Evolution 54 (2003): 2636–43. Specific fruit preferences ofchimpanzees were conveyed by personal communication from N. J. Dominy to S. B. Carroll (June 14,2005).
The importance of seeing color vision from the viewpoint of animals was articulated by R. Dalton,Nature 428 (2004): 596–97. Basic information about the composition of light and the mechanism of colorvision is found in introductory physics and biology textbooks as well as tutorials available online—see,for instance, N. A. Campbell and J. B. Reece, Biology, 7th ed. (San Francisco: Benjamin Cummings,2004). A review of color vision evolution and physiology in humans is J. Nathans, Neuron 24 (1999):299–312. The prevalence of color blindness in macaque monkeys is reported by A. Onishi et al., Nature402 (1999): 139–40.
The resolution of the hominid evolutionary tree using SINE elements is by A.-H. Salem et al.,Proceedings of the National Academy of Sciences. USA 100 (2003): 12787–91.
The classic reference on the role of gene duplication in evolution is S. Ohno, Evolution by GeneDuplication (Berlin and New York: Springer-Verlag, 1970). Recent overviews include M. Lynch and V.Katju, Trends in Genetics 20 (2004): 544–49; J. A. Cotton and R. D. M. Page, Proceedings of the RoyalSociety B 272 (2005): 277–83; and M. Lynch and J. S. Conery, Science 290 (2000): 1151–55.
The literature on color vision in vertebrates is vast. A general overview of the molecular evolutionof opsins is S. Yokoyama, Gene 300 (2002): 69–78. Other references used for this chapter include S.Yokoyama and F. B. Radlwimmer, Genetics 158 (2001): 1697–1710; J. I. Fasick and P. R. Robinson,Visual Neuroscience 17 (2000): 781–88; J. I. Fasick and P. R. Robinson, Biochemistry 37 (1998): 433–38; S. Yokoyama and N. Takenaka, Molecular Biology and Evolution 21 (2004): 2071–78; and A. J.Hope et al., Proceedings of Biological Science 22 (1997): 155–63. The relationships of cows and otherungulates with cetaceans are resolved in M. Nikaido, A. P. Rooney, and N. Okada, Proceedings of theNational Academy of Sciences, USA 96 (1999): 10261–66; and M. Nikaido et al., Proceedings of theNational Academy of Sciences, USA 98 (2001): 7384–89.
The tuning of opsins in the ultraviolet is described in Y. Shi and S. Yokoyama, Proceedings of theNational Academy of Sciences, USA 100 (2003): 8308–13; S. Yokoyama, F. B. Radlwimmer, and N. S.Blow, Proceedings of the National Academy of Sciences, USA 97 (2000): 7366–71; Y. Shi, F. B.Radlwimmer, and S. Yokoyama, Proceedings of the National Academy of Sciences, USA 98 (2001):11731–36; and A. Ödeen and O. Håstad, Molecular Biology and Evolution 20 (2003): 855–61.
The functional role of ultraviolet light has been demonstrated in: zebra finches, A. T. D. Bennett etal., Nature 380 (1996): 433–35; starlings, A. T. D. Bennett et al., Proceedings of the National Academyof Sciences, USA 94 (1997): 8618–21; blue tits, S. Hunt et al., Proceedings of the Royal Society ofLondon B Biological Science 265 (1998): 451–55; budgerigar, S. M. Pearn et al., Proceedings of theRoyal Society of London B Biological Science 268 (2000); 2273–79; nestlings, V. Jaurdie et al., Nature
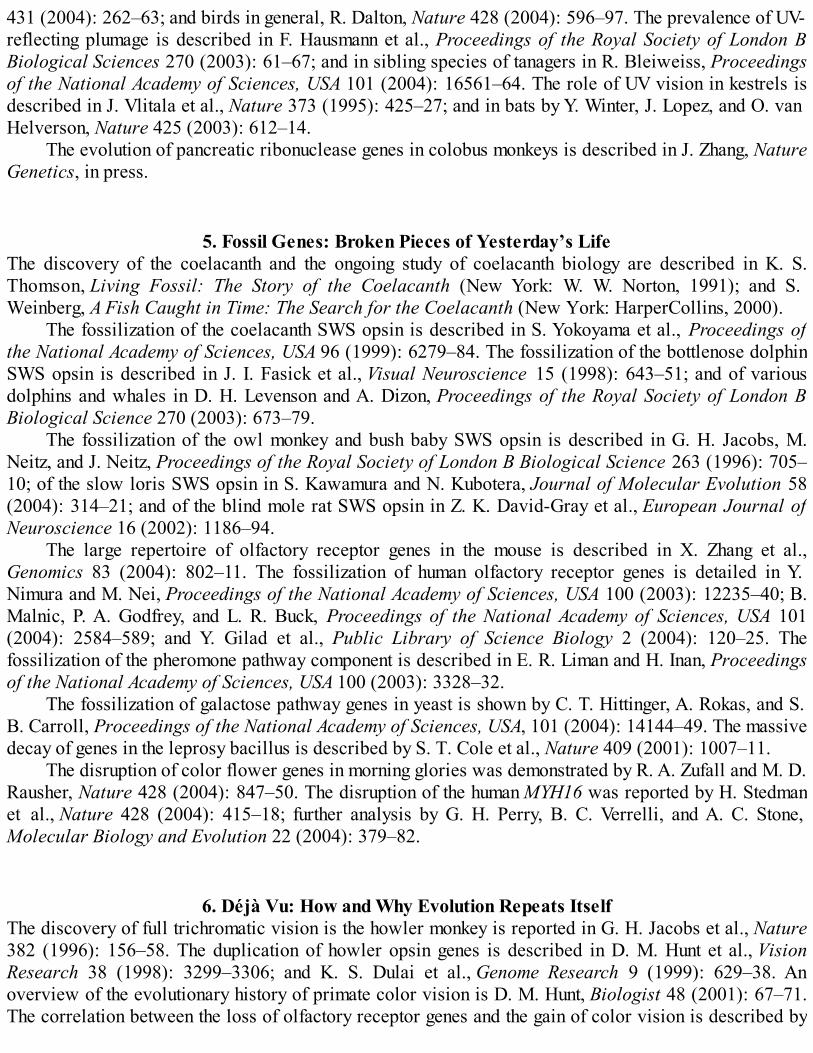
431 (2004): 262–63; and birds in general, R. Dalton, Nature 428 (2004): 596–97. The prevalence of UV-reflecting plumage is described in F. Hausmann et al., Proceedings of the Royal Society of London BBiological Sciences 270 (2003): 61–67; and in sibling species of tanagers in R. Bleiweiss, Proceedingsof the National Academy of Sciences, USA 101 (2004): 16561–64. The role of UV vision in kestrels isdescribed in J. Vlitala et al., Nature 373 (1995): 425–27; and in bats by Y. Winter, J. Lopez, and O. vanHelverson, Nature 425 (2003): 612–14.
The evolution of pancreatic ribonuclease genes in colobus monkeys is described in J. Zhang, NatureGenetics, in press.
5. Fossil Genes: Broken Pieces of Yesterday’s LifeThe discovery of the coelacanth and the ongoing study of coelacanth biology are described in K. S.Thomson, Living Fossil: The Story of the Coelacanth (New York: W. W. Norton, 1991); and S.Weinberg, A Fish Caught in Time: The Search for the Coelacanth (New York: HarperCollins, 2000).
The fossilization of the coelacanth SWS opsin is described in S. Yokoyama et al., Proceedings ofthe National Academy of Sciences, USA 96 (1999): 6279–84. The fossilization of the bottlenose dolphinSWS opsin is described in J. I. Fasick et al., Visual Neuroscience 15 (1998): 643–51; and of variousdolphins and whales in D. H. Levenson and A. Dizon, Proceedings of the Royal Society of London BBiological Science 270 (2003): 673–79.
The fossilization of the owl monkey and bush baby SWS opsin is described in G. H. Jacobs, M.Neitz, and J. Neitz, Proceedings of the Royal Society of London B Biological Science 263 (1996): 705–10; of the slow loris SWS opsin in S. Kawamura and N. Kubotera, Journal of Molecular Evolution 58(2004): 314–21; and of the blind mole rat SWS opsin in Z. K. David-Gray et al., European Journal ofNeuroscience 16 (2002): 1186–94.
The large repertoire of olfactory receptor genes in the mouse is described in X. Zhang et al.,Genomics 83 (2004): 802–11. The fossilization of human olfactory receptor genes is detailed in Y.Nimura and M. Nei, Proceedings of the National Academy of Sciences, USA 100 (2003): 12235–40; B.Malnic, P. A. Godfrey, and L. R. Buck, Proceedings of the National Academy of Sciences, USA 101(2004): 2584–589; and Y. Gilad et al., Public Library of Science Biology 2 (2004): 120–25. Thefossilization of the pheromone pathway component is described in E. R. Liman and H. Inan, Proceedingsof the National Academy of Sciences, USA 100 (2003): 3328–32.
The fossilization of galactose pathway genes in yeast is shown by C. T. Hittinger, A. Rokas, and S.B. Carroll, Proceedings of the National Academy of Sciences, USA, 101 (2004): 14144–49. The massivedecay of genes in the leprosy bacillus is described by S. T. Cole et al., Nature 409 (2001): 1007–11.
The disruption of color flower genes in morning glories was demonstrated by R. A. Zufall and M. D.Rausher, Nature 428 (2004): 847–50. The disruption of the human MYH16 was reported by H. Stedmanet al., Nature 428 (2004): 415–18; further analysis by G. H. Perry, B. C. Verrelli, and A. C. Stone,Molecular Biology and Evolution 22 (2004): 379–82.
6. Déjà Vu: How and Why Evolution Repeats ItselfThe discovery of full trichromatic vision is the howler monkey is reported in G. H. Jacobs et al., Nature382 (1996): 156–58. The duplication of howler opsin genes is described in D. M. Hunt et al., VisionResearch 38 (1998): 3299–3306; and K. S. Dulai et al., Genome Research 9 (1999): 629–38. Anoverview of the evolutionary history of primate color vision is D. M. Hunt, Biologist 48 (2001): 67–71.The correlation between the loss of olfactory receptor genes and the gain of color vision is described by
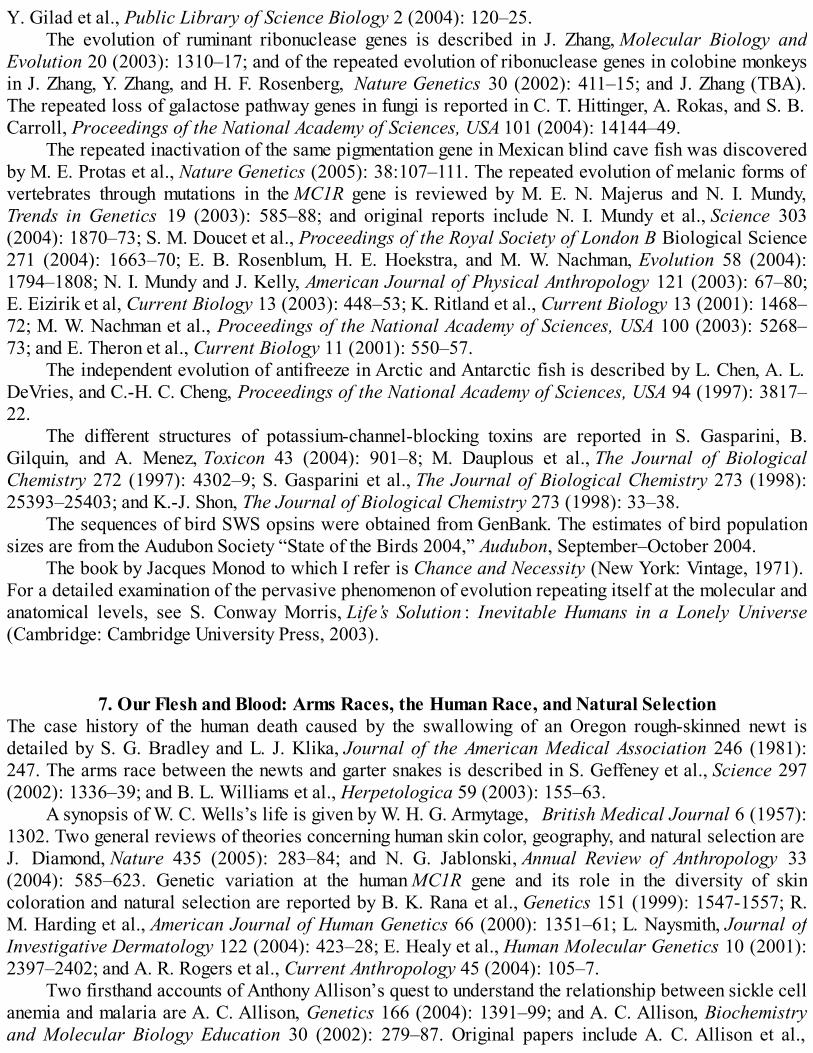
Y. Gilad et al., Public Library of Science Biology 2 (2004): 120–25.The evolution of ruminant ribonuclease genes is described in J. Zhang, Molecular Biology and
Evolution 20 (2003): 1310–17; and of the repeated evolution of ribonuclease genes in colobine monkeysin J. Zhang, Y. Zhang, and H. F. Rosenberg, Nature Genetics 30 (2002): 411–15; and J. Zhang (TBA).The repeated loss of galactose pathway genes in fungi is reported in C. T. Hittinger, A. Rokas, and S. B.Carroll, Proceedings of the National Academy of Sciences, USA 101 (2004): 14144–49.
The repeated inactivation of the same pigmentation gene in Mexican blind cave fish was discoveredby M. E. Protas et al., Nature Genetics (2005): 38:107–111. The repeated evolution of melanic forms ofvertebrates through mutations in the MC1R gene is reviewed by M. E. N. Majerus and N. I. Mundy,Trends in Genetics 19 (2003): 585–88; and original reports include N. I. Mundy et al., Science 303(2004): 1870–73; S. M. Doucet et al., Proceedings of the Royal Society of London B Biological Science271 (2004): 1663–70; E. B. Rosenblum, H. E. Hoekstra, and M. W. Nachman, Evolution 58 (2004):1794–1808; N. I. Mundy and J. Kelly, American Journal of Physical Anthropology 121 (2003): 67–80;E. Eizirik et al, Current Biology 13 (2003): 448–53; K. Ritland et al., Current Biology 13 (2001): 1468–72; M. W. Nachman et al., Proceedings of the National Academy of Sciences, USA 100 (2003): 5268–73; and E. Theron et al., Current Biology 11 (2001): 550–57.
The independent evolution of antifreeze in Arctic and Antarctic fish is described by L. Chen, A. L.DeVries, and C.-H. C. Cheng, Proceedings of the National Academy of Sciences, USA 94 (1997): 3817–22.
The different structures of potassium-channel-blocking toxins are reported in S. Gasparini, B.Gilquin, and A. Menez, Toxicon 43 (2004): 901–8; M. Dauplous et al., The Journal of BiologicalChemistry 272 (1997): 4302–9; S. Gasparini et al., The Journal of Biological Chemistry 273 (1998):25393–25403; and K.-J. Shon, The Journal of Biological Chemistry 273 (1998): 33–38.
The sequences of bird SWS opsins were obtained from GenBank. The estimates of bird populationsizes are from the Audubon Society “State of the Birds 2004,” Audubon, September–October 2004.
The book by Jacques Monod to which I refer is Chance and Necessity (New York: Vintage, 1971).For a detailed examination of the pervasive phenomenon of evolution repeating itself at the molecular andanatomical levels, see S. Conway Morris, Life’s Solution : Inevitable Humans in a Lonely Universe(Cambridge: Cambridge University Press, 2003).
7. Our Flesh and Blood: Arms Races, the Human Race, and Natural SelectionThe case history of the human death caused by the swallowing of an Oregon rough-skinned newt isdetailed by S. G. Bradley and L. J. Klika, Journal of the American Medical Association 246 (1981):247. The arms race between the newts and garter snakes is described in S. Geffeney et al., Science 297(2002): 1336–39; and B. L. Williams et al., Herpetologica 59 (2003): 155–63.
A synopsis of W. C. Wells’s life is given by W. H. G. Armytage, British Medical Journal 6 (1957):1302. Two general reviews of theories concerning human skin color, geography, and natural selection areJ. Diamond, Nature 435 (2005): 283–84; and N. G. Jablonski, Annual Review of Anthropology 33(2004): 585–623. Genetic variation at the human MC1R gene and its role in the diversity of skincoloration and natural selection are reported by B. K. Rana et al., Genetics 151 (1999): 1547-1557; R.M. Harding et al., American Journal of Human Genetics 66 (2000): 1351–61; L. Naysmith, Journal ofInvestigative Dermatology 122 (2004): 423–28; E. Healy et al., Human Molecular Genetics 10 (2001):2397–2402; and A. R. Rogers et al., Current Anthropology 45 (2004): 105–7.
Two firsthand accounts of Anthony Allison’s quest to understand the relationship between sickle cellanemia and malaria are A. C. Allison, Genetics 166 (2004): 1391–99; and A. C. Allison, Biochemistryand Molecular Biology Education 30 (2002): 279–87. Original papers include A. C. Allison et al.,
Anthropological Institute 82 (1952): 55–60; A. C. Allison, British Medical Journal 1 (1954): 290–94;and A. C. Allison, Transactions of the Royal Society for Tropical Medicine and Hygiene 48 (1954):312–18. J. B. S. Haldane mentioned a potential relationship between thalessemia and malaria inProceedings International Congress on Genetics and Heredity 35 (1949): 267–73 (supplement). Themultiple origins of the sickle cell mutation in Africa and Asia are reported by D. Labie et al., HumanBiology 61 (1989): 479–91; J. Pagnier et al., Proceedings of the National Academy of Sciences, USA 81(1984): 1771–73; A. E. Kulozik et al., American Journal of Human Genetics 39 (1986): 239–44; and C.Lapouméroulie et al., Human Genetics 89 (1992): 333–37.
A general overview of malaria and human history is R. Carter and K. N. Mendis, ClinicalMicrobiology Reviews 15 (2002): 564–94. The role of G6PD mutations in malarial resistance isdiscussed by L. Luzzotto and R. Notaro, Science 294 (2001): 442–43; and reported by S. A. Tishkoff etal., Science 293 (2001): 455–62. The resistance of west Africans to Plasmodium vivax is described byL. H. Miller et al., The New England Journal of Medicine 295 (1976): 302–4. A short synopsis ofmalarial disease and treatment is available at the Centers for Disease Control Web site,www.cdc.gov/malaria/history/. The recent origin of the P. falciparum parasite is reported by S. K.Volkman et al., Science 293 (2001): 482–84.
The possible role of the cystic fibrosis mutation in resistance to pathogens is put forth in G. B. Pier,M. Grant, and T. S. Zaidi, Proceedings of the National Academy of Sciences, USA 94 (1997): 12088–93;and G. B. Pier et al., Nature 393 (1998): 79–82. A synopsis of the role of the CCR5 receptor inresistance to HIV is by E. de Silva and M. P. H. Stumpf, FEMS Microbiology Letters 241 (2004): 1–12.
The search for more cost-effective malarial drugs and control strategies is described by S. Sternbergin USA Today, April 28, 2004.
The role of mutation and selection in cancer progression and its relationship to the evolutionaryprocess is described by F. Michor, Y. Iwasa, and M. A. Nowak, Nature Reviews Cancer 4 (2004): 197–206. The resistance of chronic myelogenous leukemias to Gleevec is reported by M. E. Gorre et al.,Science 293 (2001): 876–80; and C. Rouche-Lestienne and C. Prudhomme, Seminars in Hematology 40(2003): 80–82 (supplement). The strategy for overcoming Gleevec resistance is reported by N. P. Shah etal., Science 305 (2004): 399–401.
8. The Making and Evolution of ComplexityDarwin’s theory of coral reef formation was outlined in full in The Structure and Distribution of CoralReefs (1842). For an in-depth account of the controversy swirling around reef formation theory, see D.Dobbs, Reef Madness: Charles Darwin, Alexander Agassiz, and the Meaning of Coral (New York:Pantheon, 2005). I gathered information on the Great Barrier Reef geology and biology from materials andexhibits on Lady Elliot Island, Queensland, Australia.
The survey of eye evolution by L. V. Salvini-Plawen and E. Mayr is in Evolutionary Biology 10(1977): 207–63. The discovery of the similarity of the eyeless gene to vertebrate counterparts isdescribed by R. Quiring, et al., Science 265 (1994): 785–89. The ability of Pax-6 genes to induce eyetissue is reported by G. Halder, P. Callaerts, and W. J. Gehring, Science 267 (1995): 1788–92. Thedistribution and use of the Pax-6 gene in the animal kingdom is reviewed by W. J. Gehring and K. Ikeo,Trends in Genetics 15 (1999): 371–77. The development of the simple eyes of the ragworm is describedby D. Arendt et al., Development 129 (2002): 1143–54.
Estimates of the time required to evolve a complex eye are by D. E. Nilsson and S. Pelger,Proceedings of the Royal Society of London B Biological Science 256 (1994): 53–58. An extensivediscussion of eye types, optics, and evolution is presented by R. Dawkins in Climbing Mount Improbable(New York: W. W. Norton, 1996). See also R. Fernald, Current Opinion in Neurobiology 10 (2000):
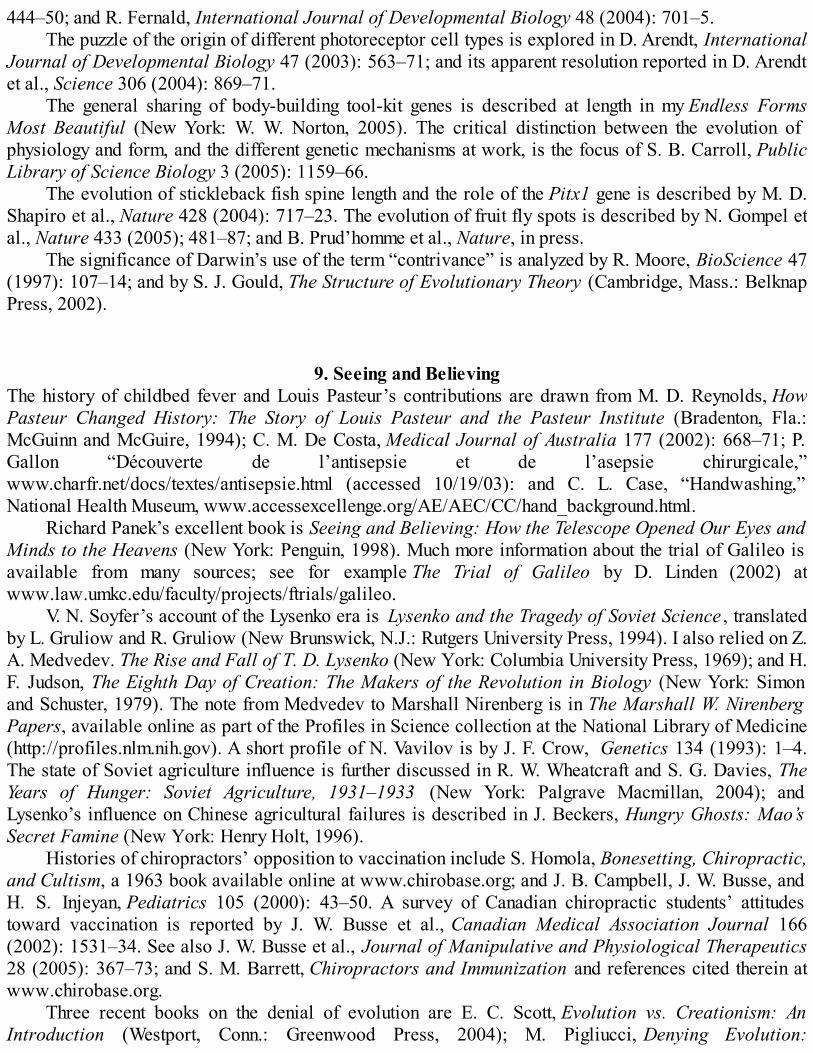
444–50; and R. Fernald, International Journal of Developmental Biology 48 (2004): 701–5.The puzzle of the origin of different photoreceptor cell types is explored in D. Arendt, International
Journal of Developmental Biology 47 (2003): 563–71; and its apparent resolution reported in D. Arendtet al., Science 306 (2004): 869–71.
The general sharing of body-building tool-kit genes is described at length in my Endless FormsMost Beautiful (New York: W. W. Norton, 2005). The critical distinction between the evolution ofphysiology and form, and the different genetic mechanisms at work, is the focus of S. B. Carroll, PublicLibrary of Science Biology 3 (2005): 1159–66.
The evolution of stickleback fish spine length and the role of the Pitx1 gene is described by M. D.Shapiro et al., Nature 428 (2004): 717–23. The evolution of fruit fly spots is described by N. Gompel etal., Nature 433 (2005); 481–87; and B. Prud’homme et al., Nature, in press.
The significance of Darwin’s use of the term “contrivance” is analyzed by R. Moore, BioScience 47(1997): 107–14; and by S. J. Gould, The Structure of Evolutionary Theory (Cambridge, Mass.: BelknapPress, 2002).
9. Seeing and BelievingThe history of childbed fever and Louis Pasteur’s contributions are drawn from M. D. Reynolds, HowPasteur Changed History: The Story of Louis Pasteur and the Pasteur Institute (Bradenton, Fla.:McGuinn and McGuire, 1994); C. M. De Costa, Medical Journal of Australia 177 (2002): 668–71; P.Gallon “Découverte de l’antisepsie et de l’asepsie chirurgicale,”www.charfr.net/docs/textes/antisepsie.html (accessed 10/19/03): and C. L. Case, “Handwashing,”National Health Museum, www.accessexcellenge.org/AE/AEC/CC/hand_background.html.
Richard Panek’s excellent book is Seeing and Believing: How the Telescope Opened Our Eyes andMinds to the Heavens (New York: Penguin, 1998). Much more information about the trial of Galileo isavailable from many sources; see for example The Trial of Galileo by D. Linden (2002) atwww.law.umkc.edu/faculty/projects/ftrials/galileo.
V. N. Soyfer’s account of the Lysenko era is Lysenko and the Tragedy of Soviet Science , translatedby L. Gruliow and R. Gruliow (New Brunswick, N.J.: Rutgers University Press, 1994). I also relied on Z.A. Medvedev. The Rise and Fall of T. D. Lysenko (New York: Columbia University Press, 1969); and H.F. Judson, The Eighth Day of Creation: The Makers of the Revolution in Biology (New York: Simonand Schuster, 1979). The note from Medvedev to Marshall Nirenberg is in The Marshall W. NirenbergPapers, available online as part of the Profiles in Science collection at the National Library of Medicine(http://profiles.nlm.nih.gov). A short profile of N. Vavilov is by J. F. Crow, Genetics 134 (1993): 1–4.The state of Soviet agriculture influence is further discussed in R. W. Wheatcraft and S. G. Davies, TheYears of Hunger: Soviet Agriculture, 1931–1933 (New York: Palgrave Macmillan, 2004); andLysenko’s influence on Chinese agricultural failures is described in J. Beckers, Hungry Ghosts: Mao’sSecret Famine (New York: Henry Holt, 1996).
Histories of chiropractors’ opposition to vaccination include S. Homola, Bonesetting, Chiropractic,and Cultism, a 1963 book available online at www.chirobase.org; and J. B. Campbell, J. W. Busse, andH. S. Injeyan, Pediatrics 105 (2000): 43–50. A survey of Canadian chiropractic students’ attitudestoward vaccination is reported by J. W. Busse et al., Canadian Medical Association Journal 166(2002): 1531–34. See also J. W. Busse et al., Journal of Manipulative and Physiological Therapeutics28 (2005): 367–73; and S. M. Barrett, Chiropractors and Immunization and references cited therein atwww.chirobase.org.
Three recent books on the denial of evolution are E. C. Scott, Evolution vs. Creationism: AnIntroduction (Westport, Conn.: Greenwood Press, 2004); M. Pigliucci, Denying Evolution:
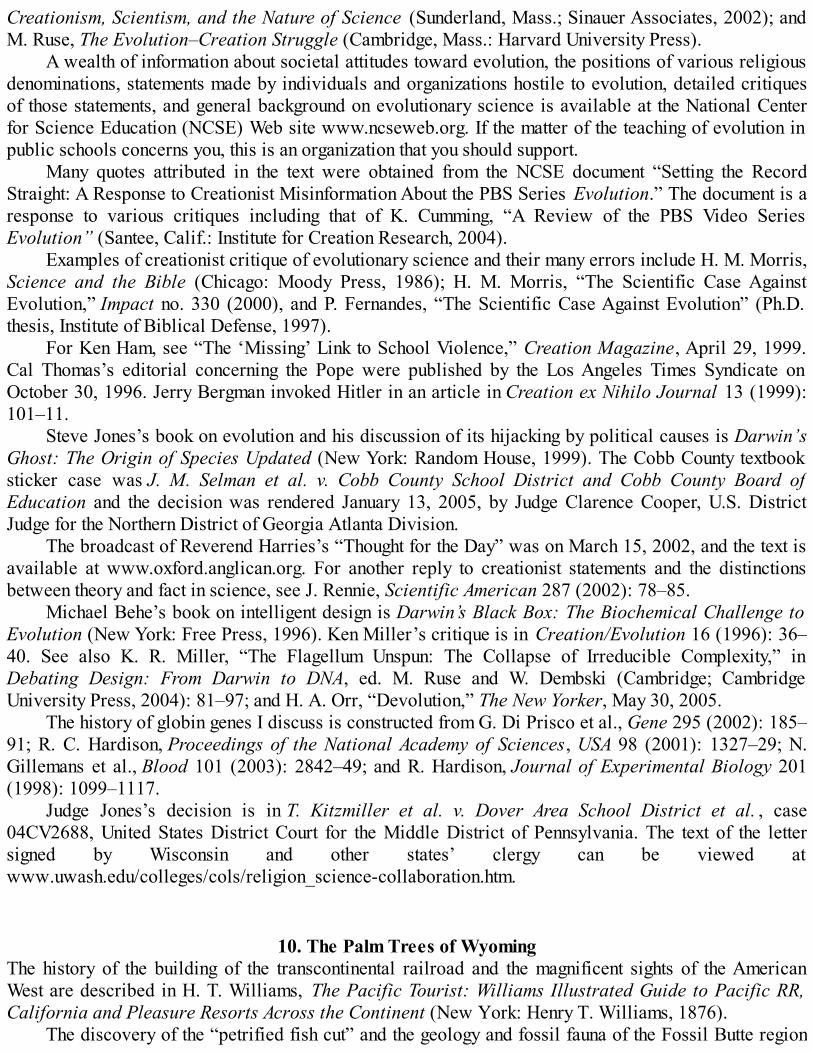
Creationism, Scientism, and the Nature of Science (Sunderland, Mass.; Sinauer Associates, 2002); andM. Ruse, The Evolution–Creation Struggle (Cambridge, Mass.: Harvard University Press).
A wealth of information about societal attitudes toward evolution, the positions of various religiousdenominations, statements made by individuals and organizations hostile to evolution, detailed critiquesof those statements, and general background on evolutionary science is available at the National Centerfor Science Education (NCSE) Web site www.ncseweb.org. If the matter of the teaching of evolution inpublic schools concerns you, this is an organization that you should support.
Many quotes attributed in the text were obtained from the NCSE document “Setting the RecordStraight: A Response to Creationist Misinformation About the PBS Series Evolution.” The document is aresponse to various critiques including that of K. Cumming, “A Review of the PBS Video SeriesEvolution” (Santee, Calif.: Institute for Creation Research, 2004).
Examples of creationist critique of evolutionary science and their many errors include H. M. Morris,Science and the Bible (Chicago: Moody Press, 1986); H. M. Morris, “The Scientific Case AgainstEvolution,” Impact no. 330 (2000), and P. Fernandes, “The Scientific Case Against Evolution” (Ph.D.thesis, Institute of Biblical Defense, 1997).
For Ken Ham, see “The ‘Missing’ Link to School Violence,” Creation Magazine, April 29, 1999.Cal Thomas’s editorial concerning the Pope were published by the Los Angeles Times Syndicate onOctober 30, 1996. Jerry Bergman invoked Hitler in an article in Creation ex Nihilo Journal 13 (1999):101–11.
Steve Jones’s book on evolution and his discussion of its hijacking by political causes is Darwin’sGhost: The Origin of Species Updated (New York: Random House, 1999). The Cobb County textbooksticker case was J. M. Selman et al. v. Cobb County School District and Cobb County Board ofEducation and the decision was rendered January 13, 2005, by Judge Clarence Cooper, U.S. DistrictJudge for the Northern District of Georgia Atlanta Division.
The broadcast of Reverend Harries’s “Thought for the Day” was on March 15, 2002, and the text isavailable at www.oxford.anglican.org. For another reply to creationist statements and the distinctionsbetween theory and fact in science, see J. Rennie, Scientific American 287 (2002): 78–85.
Michael Behe’s book on intelligent design is Darwin’s Black Box: The Biochemical Challenge toEvolution (New York: Free Press, 1996). Ken Miller’s critique is in Creation/Evolution 16 (1996): 36–40. See also K. R. Miller, “The Flagellum Unspun: The Collapse of Irreducible Complexity,” inDebating Design: From Darwin to DNA, ed. M. Ruse and W. Dembski (Cambridge; CambridgeUniversity Press, 2004): 81–97; and H. A. Orr, “Devolution,” The New Yorker, May 30, 2005.
The history of globin genes I discuss is constructed from G. Di Prisco et al., Gene 295 (2002): 185–91; R. C. Hardison, Proceedings of the National Academy of Sciences, USA 98 (2001): 1327–29; N.Gillemans et al., Blood 101 (2003): 2842–49; and R. Hardison, Journal of Experimental Biology 201(1998): 1099–1117.
Judge Jones’s decision is in T. Kitzmiller et al. v. Dover Area School District et al. , case04CV2688, United States District Court for the Middle District of Pennsylvania. The text of the lettersigned by Wisconsin and other states’ clergy can be viewed atwww.uwash.edu/colleges/cols/religion_science-collaboration.htm.
10. The Palm Trees of WyomingThe history of the building of the transcontinental railroad and the magnificent sights of the AmericanWest are described in H. T. Williams, The Pacific Tourist: Williams Illustrated Guide to Pacific RR,California and Pleasure Resorts Across the Continent (New York: Henry T. Williams, 1876).
The discovery of the “petrified fish cut” and the geology and fossil fauna of the Fossil Butte region
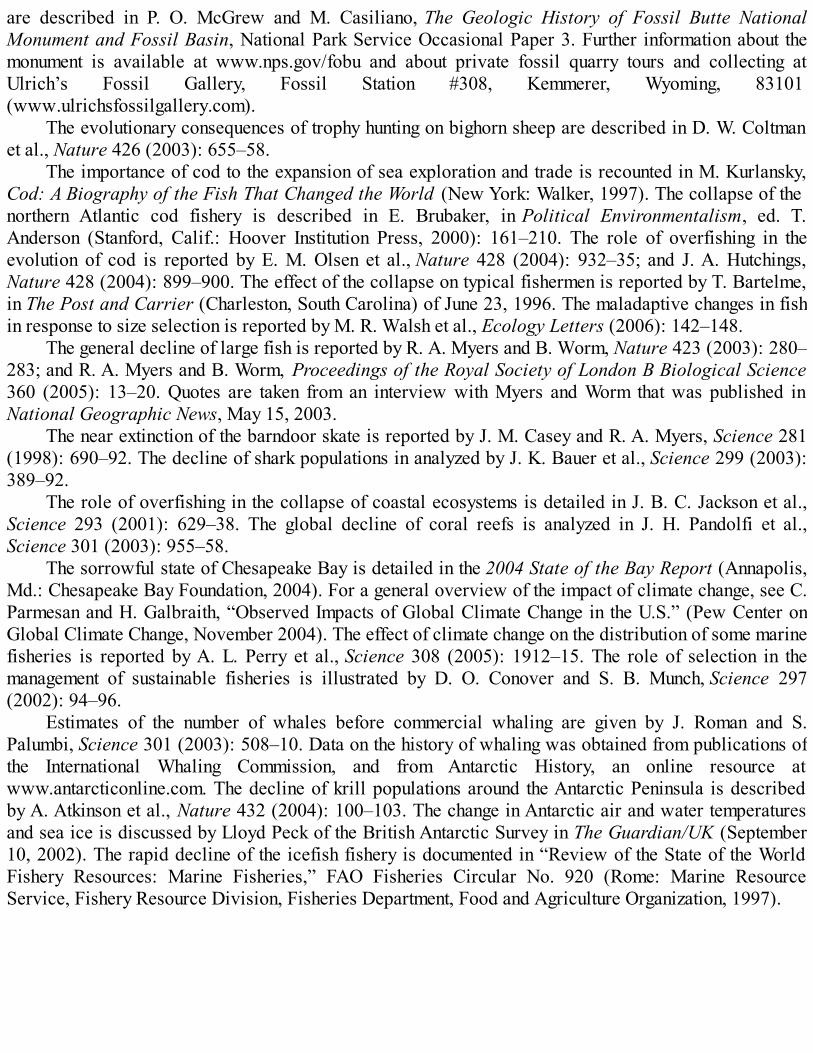
are described in P. O. McGrew and M. Casiliano, The Geologic History of Fossil Butte NationalMonument and Fossil Basin, National Park Service Occasional Paper 3. Further information about themonument is available at www.nps.gov/fobu and about private fossil quarry tours and collecting atUlrich’s Fossil Gallery, Fossil Station #308, Kemmerer, Wyoming, 83101(www.ulrichsfossilgallery.com).
The evolutionary consequences of trophy hunting on bighorn sheep are described in D. W. Coltmanet al., Nature 426 (2003): 655–58.
The importance of cod to the expansion of sea exploration and trade is recounted in M. Kurlansky,Cod: A Biography of the Fish That Changed the World (New York: Walker, 1997). The collapse of thenorthern Atlantic cod fishery is described in E. Brubaker, in Political Environmentalism, ed. T.Anderson (Stanford, Calif.: Hoover Institution Press, 2000): 161–210. The role of overfishing in theevolution of cod is reported by E. M. Olsen et al., Nature 428 (2004): 932–35; and J. A. Hutchings,Nature 428 (2004): 899–900. The effect of the collapse on typical fishermen is reported by T. Bartelme,in The Post and Carrier (Charleston, South Carolina) of June 23, 1996. The maladaptive changes in fishin response to size selection is reported by M. R. Walsh et al., Ecology Letters (2006): 142–148.
The general decline of large fish is reported by R. A. Myers and B. Worm, Nature 423 (2003): 280–283; and R. A. Myers and B. Worm, Proceedings of the Royal Society of London B Biological Science360 (2005): 13–20. Quotes are taken from an interview with Myers and Worm that was published inNational Geographic News, May 15, 2003.
The near extinction of the barndoor skate is reported by J. M. Casey and R. A. Myers, Science 281(1998): 690–92. The decline of shark populations in analyzed by J. K. Bauer et al., Science 299 (2003):389–92.
The role of overfishing in the collapse of coastal ecosystems is detailed in J. B. C. Jackson et al.,Science 293 (2001): 629–38. The global decline of coral reefs is analyzed in J. H. Pandolfi et al.,Science 301 (2003): 955–58.
The sorrowful state of Chesapeake Bay is detailed in the 2004 State of the Bay Report (Annapolis,Md.: Chesapeake Bay Foundation, 2004). For a general overview of the impact of climate change, see C.Parmesan and H. Galbraith, “Observed Impacts of Global Climate Change in the U.S.” (Pew Center onGlobal Climate Change, November 2004). The effect of climate change on the distribution of some marinefisheries is reported by A. L. Perry et al., Science 308 (2005): 1912–15. The role of selection in themanagement of sustainable fisheries is illustrated by D. O. Conover and S. B. Munch, Science 297(2002): 94–96.
Estimates of the number of whales before commercial whaling are given by J. Roman and S.Palumbi, Science 301 (2003): 508–10. Data on the history of whaling was obtained from publications ofthe International Whaling Commission, and from Antarctic History, an online resource atwww.antarcticonline.com. The decline of krill populations around the Antarctic Peninsula is describedby A. Atkinson et al., Nature 432 (2004): 100–103. The change in Antarctic air and water temperaturesand sea ice is discussed by Lloyd Peck of the British Antarctic Survey in The Guardian/UK (September10, 2002). The rapid decline of the icefish fishery is documented in “Review of the State of the WorldFishery Resources: Marine Fisheries,” FAO Fisheries Circular No. 920 (Rome: Marine ResourceService, Fishery Resource Division, Fisheries Department, Food and Agriculture Organization, 1997).
Acknowledgments
When I was twelve or thirteen, an uncle of mine—let’s call him Uncle Dick—asked me what I wanted tobe when I grew up. “A biologist!” I blurted out. Uncle Dick furrowed his exceptionally long forehead andgrimaced, “But there is no money in that.”
Fortunately, my parents were not bothered by such practical concerns and encouraged each of theirfour children to pursue whatever interested us—and so we did. I have since learned that many happypeople received the same parental advice that I heard. So, thanks Mom and Dad for allowing me to keepsnakes, newts, salamanders, and lizards in the house, and their various squirmy and disgusting food itemsin the refrigerator.
The burden of putting up with my peculiar interests now falls upon my own family; without theirsupport, encouragement, love, and sense of humor this project would be impossible and pointless. Mywife, Jamie, has done far more than tolerate a distracted husband—she designed and selected key artworkfor the book and worked hard to make the prose readable. My sons, Will and Patrick, have accompanied(or led) me to several of the magical places mentioned here, such as Yellowstone National Park andFossil Butte National Monument. The shouting match of my stepson, Chris, with howler monkeys on ourvisit to Costa Rica inspired the story in chapter 6.
I also thank my siblings, who have always supported me in every endeavor. My brothers, Peter andJim, helped shape a couple of chapters and my sister, Nancy, has continued our decade-long runningdiscussion of the history and insights of evolutionary biology’s pioneers.
I am very grateful for the generous creative and critical contributions of colleagues at the Universityof Wisconsin–Madison. Leanne Olds composed or adapted most of the schematic figures; ProfessorJames F. Crow, Drs. Antonis Rokas, Benjamin Prud’homme, and Steve Paddock, and Chris Hittinger readthe entire manuscript and provided detailed critiques and suggestions.
The discoveries described in the book are the fruits of the creativity and hard work of thousands ofscientists who have contributed to the invention of the methods used to decipher the DNA record and whohave analyzed many species’ genes and genomes. I thank the many scientists who provided illustrations oftheir work and shared their expertise and ideas. I especially want to thank Michael Nachman, MichaelLynch, Cliff Tabin, and Eugene Koonin for detailed discussions and information.
I am also particularly indebted to the individuals who have worked with and collaborated with meover the past two decades. I have continued to learn more from my postdocs and students than I teach inreturn. The dedication and efforts of my longtime staff have made our research laboratory an exciting andfun place to be every day. And my close colleagues around the world have been an endless source ofinspiraton and enlightenment. I have enjoyed an unusual degree of freedom in pursuing research ideasthanks to the generous support of the Howard Hughes Medical Institute.
I am especially grateful to my agent, Russ Galen, who provided crucial guidance at the conception ofthis book as well as great encouragement throughout its development, and to my editor, Jack Repcheck,for his infinite enthusiasm, critical input, and confidence in the importance of this book.

* I am simplifying the math by using “averages,” not formal probability.

* I wrote at length about many of these discoveries and their significance in my recent book Endless Forms Most Beautiful: The New Science of Evo Devo.