carlton, or - pdx.edu carlton profile.pdfcarlton, or: economic and demographic profile 6 northwest...
TRANSCRIPT
Northwest Economic Research Center College of Urban and Public Affairs
June 2017
Carlton, OR:
Economic and Demographic Profile
ACKNOWLEDGEMENTS
This report was researched and produced by the Northwest Economic Research Center (NERC) with support from the City of Carlton.
The Mission of the City of Carlton is to safeguard and enhance
the vitality and livability of the community by providing
essential services with professionalism and integrity.
NERC is based at Portland State University in the College of Urban and Public Affairs. The Center focuses on
economic research that supports public-policy decision-making, and relates to issues important to Oregon and the Portland Metropolitan Area. NERC serves the public, nonprofit, and private sector community with high quality, unbiased, and credible economic analysis. Dr. Tom Potiowsky is the Director of NERC, and also serves as the Chair of the Department of Economics at Portland State University. Dr. Jenny H. Liu is NERC’s Assistant Director and Assistant Professor in the Toulan School of Urban Studies and Planning. This report was researched and written by Emma Willingham and Peter Hulseman.
Northwest Economic Research Center
Portland State University College of Urban and Public Affairs PO Box 751 Portland, OR 97207-0751 503-725-8167 [email protected]
www.pdx.edu/NERC @nercpdx Cover image: By M.O. Stevens (Own work) [CC BY 3.0 (http://creativecommons.org/licenses/by/3.0)], via Wikimedia Commons Contents image: By Ian Poellet (Own work) [CC BY-SA 4.0 (http://creativecommons.org/licenses/by-sa/4.0)], via Wikimedia Commons
CARLTON, OR: ECONOMIC AND DEMOGRAPHIC PROFILE 1
Northwest Economic Research Center
Contents Background ................................................................................................................................................... 2
Population ..................................................................................................................................................... 3
Employment and Income ............................................................................................................................ 11
Conclusion ................................................................................................................................................... 16
Appendix I: Survey Methodology ................................................................................................................ 17
Appendix II: Population Research Center Current Estimates ..................................................................... 19
References .................................................................................................................................................. 21
CARLTON, OR: ECONOMIC AND DEMOGRAPHIC PROFILE 2
Northwest Economic Research Center
Background The Carlton Post Office was founded in 1874 along the railroad stretching from Portland to the
unincorporated settlement known as St. Joe’s. According to local lore, a Mr. Wilson Carl traveled to the
big city to ask for an intermediate stop in what became known as Carl’s town, and later Carlton. Located
in the heart of Yamhill County, Carlton enjoys a lively tourism industry for a town of its size, buoyed up
by the proliferation of farms and wineries that the mild climate invites.
Carlton is a small town, with a population of just over two thousand. It had a median age slightly below
that for Yamhill County and the state of Oregon in 2010, due to relative abundance in the youth cohorts,
but a larger share of working-age population than that observed in comparable small towns in Oregon.
The local economy is dominated by the wine industry, but a sizeable percent of the population in
Yamhill County is employed in the Education and Health Services sector, as well. Carlton has an above-
average net migration rate, compared to both Yamhill County and the state.
This report will use data from a variety of state and federal sources to describe the economic and
demographic attributes of the town, provide forecasts from a number of sources for several economic
and demographic factors, and outline factors to track going forwards. While small towns can be difficult
to analyze due to a paucity of local-level data, information on Yamhill County at large provides
considerable insight. Additionally, this report will discuss recommendations for future implementations
of the Carlton Satisfaction Survey, in order to provide the City with trackable indicators going forwards.
CARLTON, OR: ECONOMIC AND DEMOGRAPHIC PROFILE 3
Northwest Economic Research Center
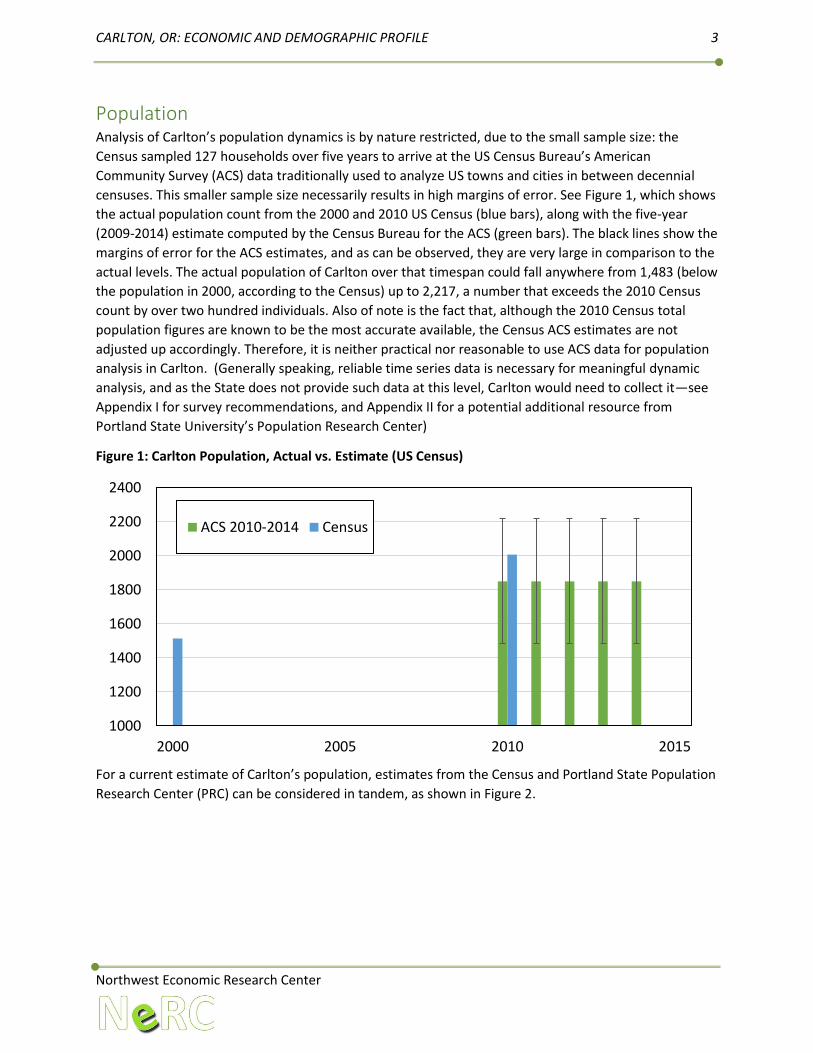
Population Analysis of Carlton’s population dynamics is by nature restricted, due to the small sample size: the
Census sampled 127 households over five years to arrive at the US Census Bureau’s American
Community Survey (ACS) data traditionally used to analyze US towns and cities in between decennial
censuses. This smaller sample size necessarily results in high margins of error. See Figure 1, which shows
the actual population count from the 2000 and 2010 US Census (blue bars), along with the five-year
(2009-2014) estimate computed by the Census Bureau for the ACS (green bars). The black lines show the
margins of error for the ACS estimates, and as can be observed, they are very large in comparison to the
actual levels. The actual population of Carlton over that timespan could fall anywhere from 1,483 (below
the population in 2000, according to the Census) up to 2,217, a number that exceeds the 2010 Census
count by over two hundred individuals. Also of note is the fact that, although the 2010 Census total
population figures are known to be the most accurate available, the Census ACS estimates are not
adjusted up accordingly. Therefore, it is neither practical nor reasonable to use ACS data for population
analysis in Carlton. (Generally speaking, reliable time series data is necessary for meaningful dynamic
analysis, and as the State does not provide such data at this level, Carlton would need to collect it—see
Appendix I for survey recommendations, and Appendix II for a potential additional resource from
Portland State University’s Population Research Center)
Figure 1: Carlton Population, Actual vs. Estimate (US Census)
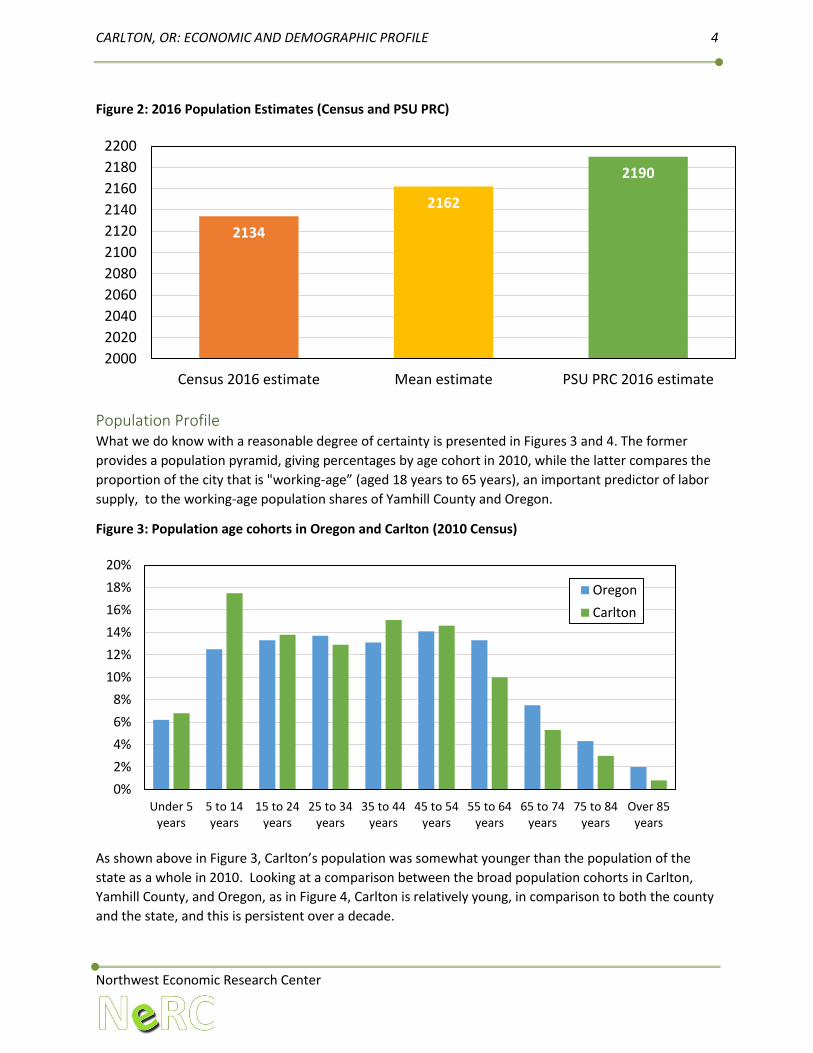
For a current estimate of Carlton’s population, estimates from the Census and Portland State Population
Research Center (PRC) can be considered in tandem, as shown in Figure 2.
1000
1200
1400
1600
1800
2000
2200
2400
2000 2005 2010 2015
ACS 2010-2014 Census
CARLTON, OR: ECONOMIC AND DEMOGRAPHIC PROFILE 4
Northwest Economic Research Center
Figure 2: 2016 Population Estimates (Census and PSU PRC)
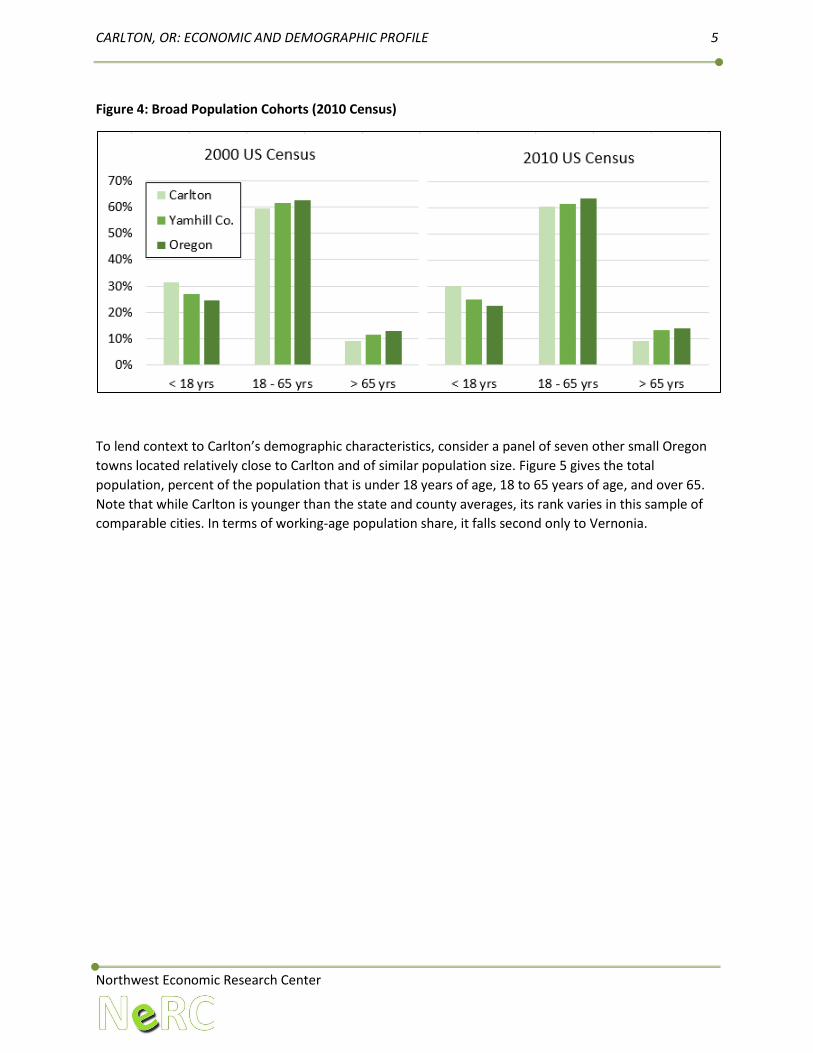
Population Profile What we do know with a reasonable degree of certainty is presented in Figures 3 and 4. The former
provides a population pyramid, giving percentages by age cohort in 2010, while the latter compares the
proportion of the city that is "working-age” (aged 18 years to 65 years), an important predictor of labor
supply, to the working-age population shares of Yamhill County and Oregon.
Figure 3: Population age cohorts in Oregon and Carlton (2010 Census)
As shown above in Figure 3, Carlton’s population was somewhat younger than the population of the
state as a whole in 2010. Looking at a comparison between the broad population cohorts in Carlton,
Yamhill County, and Oregon, as in Figure 4, Carlton is relatively young, in comparison to both the county
and the state, and this is persistent over a decade.
2134
2162
2190
2000
2020
2040
2060
2080
2100
2120
2140
2160
2180
2200
Census 2016 estimate Mean estimate PSU PRC 2016 estimate
0%
2%
4%
6%
8%
10%
12%
14%
16%
18%
20%
Under 5years
5 to 14years
15 to 24years
25 to 34years
35 to 44years
45 to 54years
55 to 64years
65 to 74years
75 to 84years
Over 85years
Oregon
Carlton
CARLTON, OR: ECONOMIC AND DEMOGRAPHIC PROFILE 5
Northwest Economic Research Center
Figure 4: Broad Population Cohorts (2010 Census)
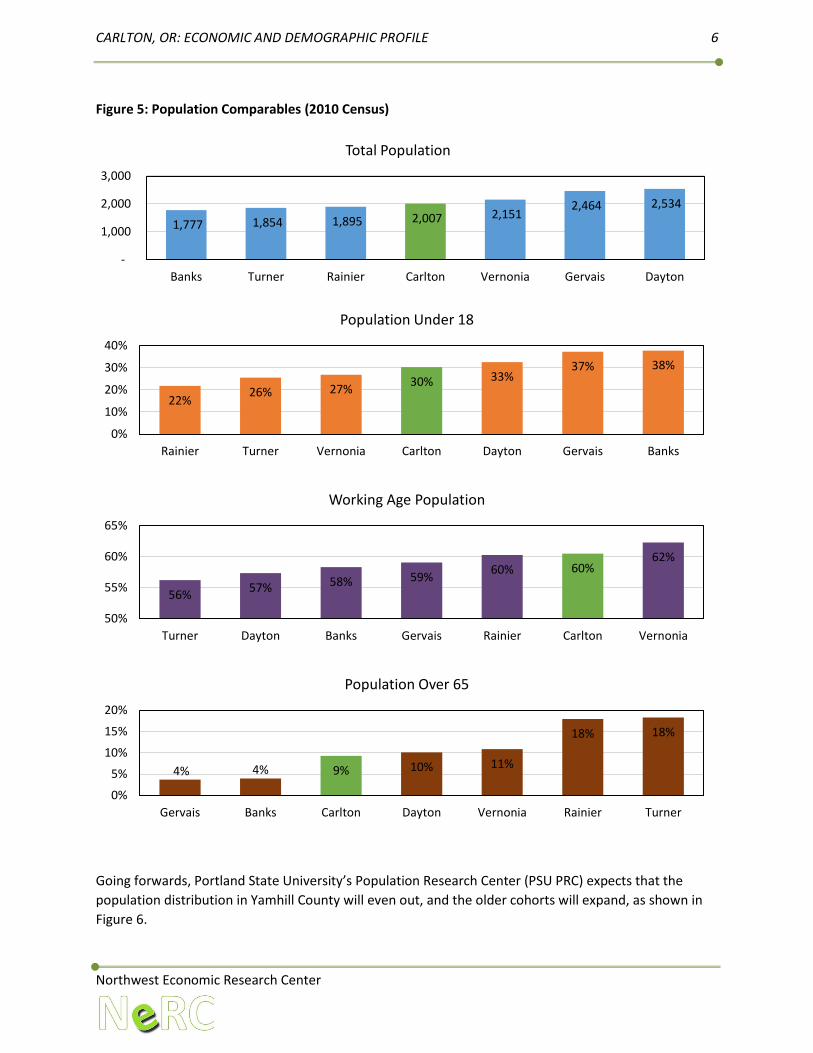
To lend context to Carlton’s demographic characteristics, consider a panel of seven other small Oregon
towns located relatively close to Carlton and of similar population size. Figure 5 gives the total
population, percent of the population that is under 18 years of age, 18 to 65 years of age, and over 65.
Note that while Carlton is younger than the state and county averages, its rank varies in this sample of
comparable cities. In terms of working-age population share, it falls second only to Vernonia.
CARLTON, OR: ECONOMIC AND DEMOGRAPHIC PROFILE 6
Northwest Economic Research Center
Figure 5: Population Comparables (2010 Census)
Going forwards, Portland State University’s Population Research Center (PSU PRC) expects that the
population distribution in Yamhill County will even out, and the older cohorts will expand, as shown in
Figure 6.
1,777 1,854 1,895 2,007 2,151 2,464 2,534
-
1,000
2,000
3,000
Banks Turner Rainier Carlton Vernonia Gervais Dayton
Total Population
22%26% 27%
30% 33%37% 38%
0%
10%
20%
30%
40%
Rainier Turner Vernonia Carlton Dayton Gervais Banks
Population Under 18
56%57% 58% 59%
60% 60%62%
50%
55%
60%
65%
Turner Dayton Banks Gervais Rainier Carlton Vernonia
Working Age Population
4% 4% 9% 10% 11%
18% 18%
0%
5%
10%
15%
20%
Gervais Banks Carlton Dayton Vernonia Rainier Turner
Population Over 65

CARLTON, OR: ECONOMIC AND DEMOGRAPHIC PROFILE 7
Northwest Economic Research Center
Figure 6: Yamhill County Population Cohort Forecast
Population Growth Looking first at the surrounding area, Yamhill County grew by 5.8% between 2010 and 2016, ranking
ninth in the state (PSU PRC). Within the county, there was a natural increase (births minus deaths) of
1,375 individuals, and a migratory increase of 3,062 net migrants. Within the county, Carlton had the
highest rate of growth of any incorporated town, as shown in Figure 7.
Figure 7: Population Growth 2010-2016, Carlton vs. Incorporated Towns in Yamhill Co. (PSU PRC)
When compared with the seven towns previously selected, Carlton’s historical rate of growth is the
highest by a margin of 3.4% (see Figure 8).
0.3% 0.6%
3.5% 3.8%4.7%
5.8% 5.9%
8.0%
0%
2%
4%
6%
8%
10%
CARLTON, OR: ECONOMIC AND DEMOGRAPHIC PROFILE 8
Northwest Economic Research Center
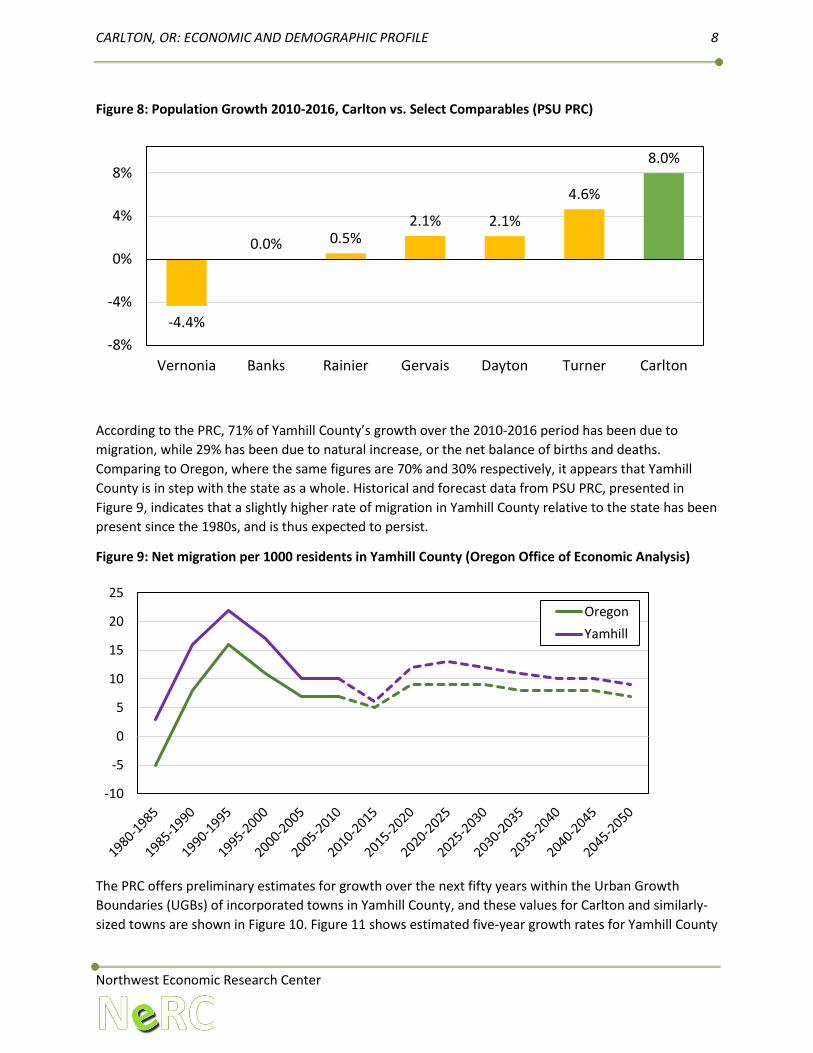
Figure 8: Population Growth 2010-2016, Carlton vs. Select Comparables (PSU PRC)
According to the PRC, 71% of Yamhill County’s growth over the 2010-2016 period has been due to
migration, while 29% has been due to natural increase, or the net balance of births and deaths.
Comparing to Oregon, where the same figures are 70% and 30% respectively, it appears that Yamhill
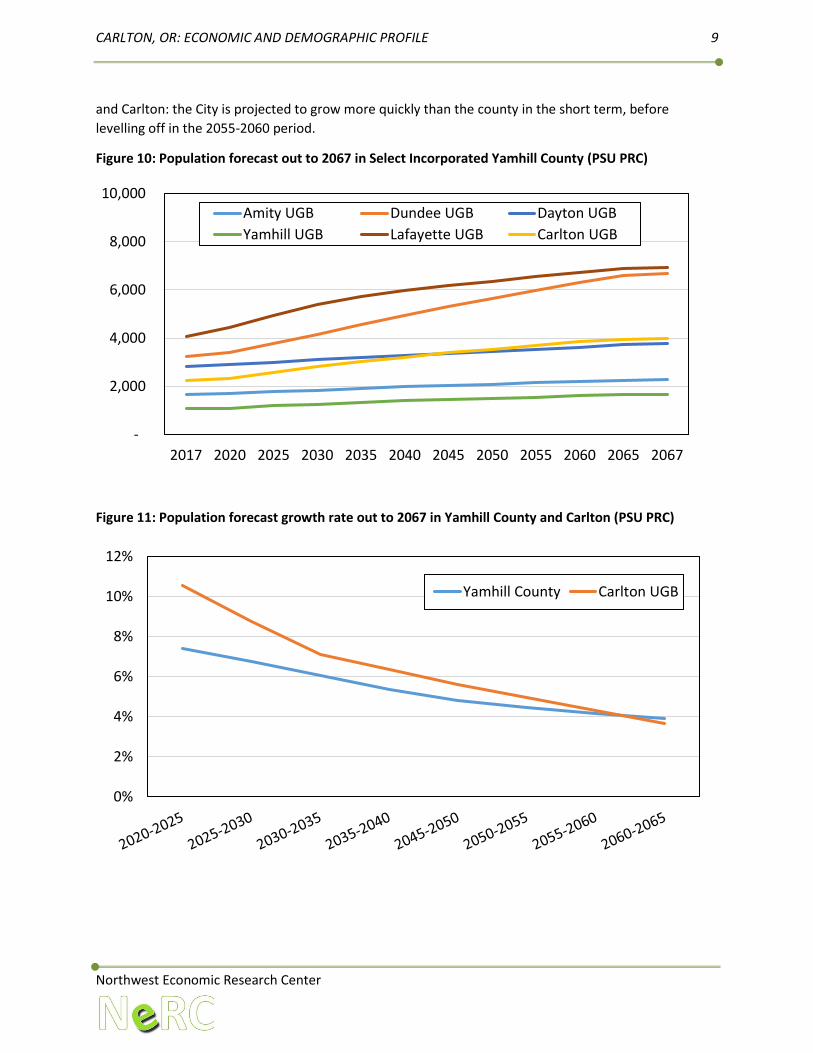
County is in step with the state as a whole. Historical and forecast data from PSU PRC, presented in
Figure 9, indicates that a slightly higher rate of migration in Yamhill County relative to the state has been
present since the 1980s, and is thus expected to persist.
Figure 9: Net migration per 1000 residents in Yamhill County (Oregon Office of Economic Analysis)
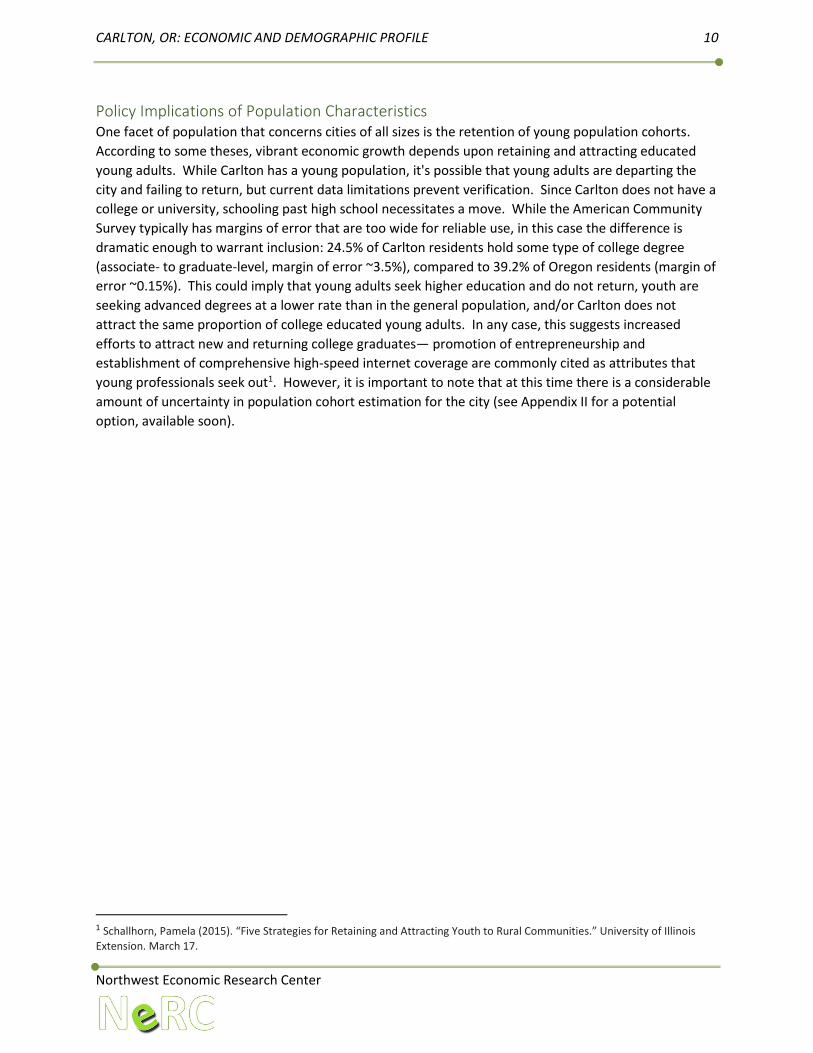
The PRC offers preliminary estimates for growth over the next fifty years within the Urban Growth
Boundaries (UGBs) of incorporated towns in Yamhill County, and these values for Carlton and similarly-
sized towns are shown in Figure 10. Figure 11 shows estimated five-year growth rates for Yamhill County
-4.4%
0.0% 0.5%2.1% 2.1%
4.6%
8.0%
-8%
-4%
0%
4%
8%
Vernonia Banks Rainier Gervais Dayton Turner Carlton
-10
-5
0
5
10
15
20
25
Oregon
Yamhill
CARLTON, OR: ECONOMIC AND DEMOGRAPHIC PROFILE 9
Northwest Economic Research Center
and Carlton: the City is projected to grow more quickly than the county in the short term, before
levelling off in the 2055-2060 period.
Figure 10: Population forecast out to 2067 in Select Incorporated Yamhill County (PSU PRC)
Figure 11: Population forecast growth rate out to 2067 in Yamhill County and Carlton (PSU PRC)
-
2,000
4,000
6,000
8,000
10,000
2017 2020 2025 2030 2035 2040 2045 2050 2055 2060 2065 2067
Amity UGB Dundee UGB Dayton UGB
Yamhill UGB Lafayette UGB Carlton UGB
0%
2%
4%
6%
8%
10%
12%
Yamhill County Carlton UGB
CARLTON, OR: ECONOMIC AND DEMOGRAPHIC PROFILE 10
Northwest Economic Research Center
Policy Implications of Population Characteristics One facet of population that concerns cities of all sizes is the retention of young population cohorts.
According to some theses, vibrant economic growth depends upon retaining and attracting educated
young adults. While Carlton has a young population, it's possible that young adults are departing the
city and failing to return, but current data limitations prevent verification. Since Carlton does not have a
college or university, schooling past high school necessitates a move. While the American Community
Survey typically has margins of error that are too wide for reliable use, in this case the difference is
dramatic enough to warrant inclusion: 24.5% of Carlton residents hold some type of college degree
(associate- to graduate-level, margin of error ~3.5%), compared to 39.2% of Oregon residents (margin of
error ~0.15%). This could imply that young adults seek higher education and do not return, youth are
seeking advanced degrees at a lower rate than in the general population, and/or Carlton does not
attract the same proportion of college educated young adults. In any case, this suggests increased
efforts to attract new and returning college graduates— promotion of entrepreneurship and
establishment of comprehensive high-speed internet coverage are commonly cited as attributes that
young professionals seek out1. However, it is important to note that at this time there is a considerable
amount of uncertainty in population cohort estimation for the city (see Appendix II for a potential
option, available soon).
1 Schallhorn, Pamela (2015). “Five Strategies for Retaining and Attracting Youth to Rural Communities.” University of Illinois
Extension. March 17.
CARLTON, OR: ECONOMIC AND DEMOGRAPHIC PROFILE 11
Northwest Economic Research Center
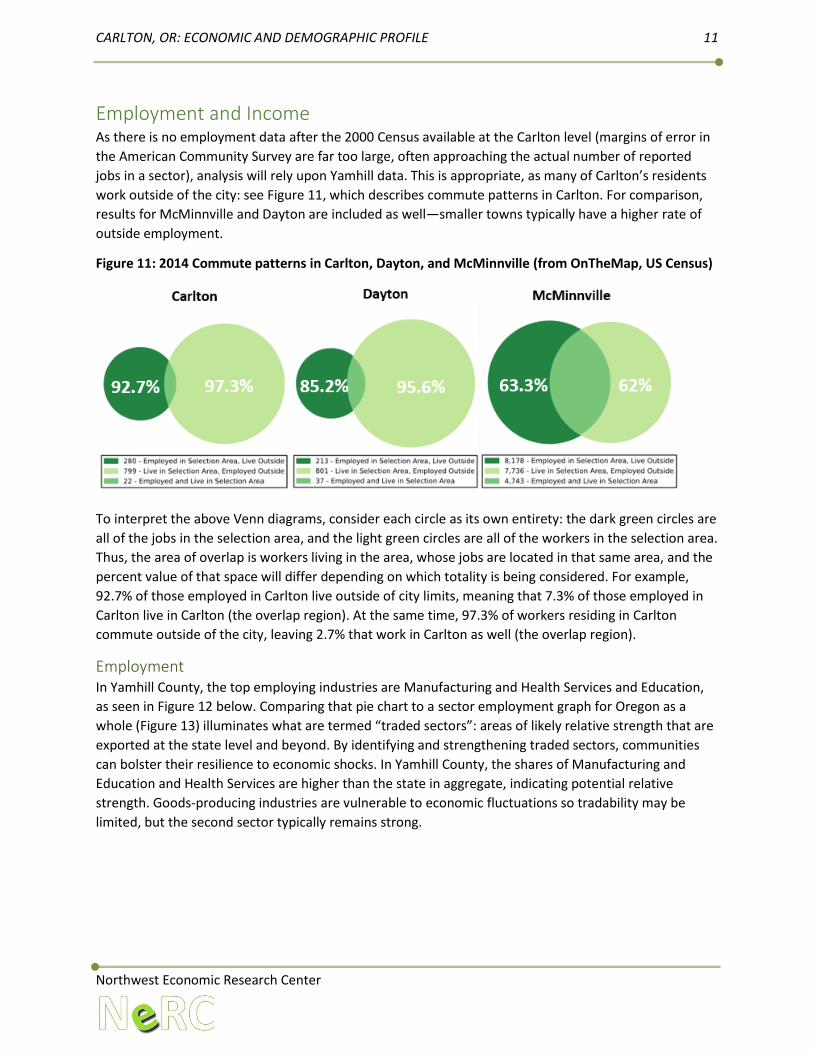
Employment and Income As there is no employment data after the 2000 Census available at the Carlton level (margins of error in
the American Community Survey are far too large, often approaching the actual number of reported
jobs in a sector), analysis will rely upon Yamhill data. This is appropriate, as many of Carlton’s residents
work outside of the city: see Figure 11, which describes commute patterns in Carlton. For comparison,
results for McMinnville and Dayton are included as well—smaller towns typically have a higher rate of
outside employment.
Figure 11: 2014 Commute patterns in Carlton, Dayton, and McMinnville (from OnTheMap, US Census)
To interpret the above Venn diagrams, consider each circle as its own entirety: the dark green circles are
all of the jobs in the selection area, and the light green circles are all of the workers in the selection area.
Thus, the area of overlap is workers living in the area, whose jobs are located in that same area, and the
percent value of that space will differ depending on which totality is being considered. For example,
92.7% of those employed in Carlton live outside of city limits, meaning that 7.3% of those employed in
Carlton live in Carlton (the overlap region). At the same time, 97.3% of workers residing in Carlton
commute outside of the city, leaving 2.7% that work in Carlton as well (the overlap region).
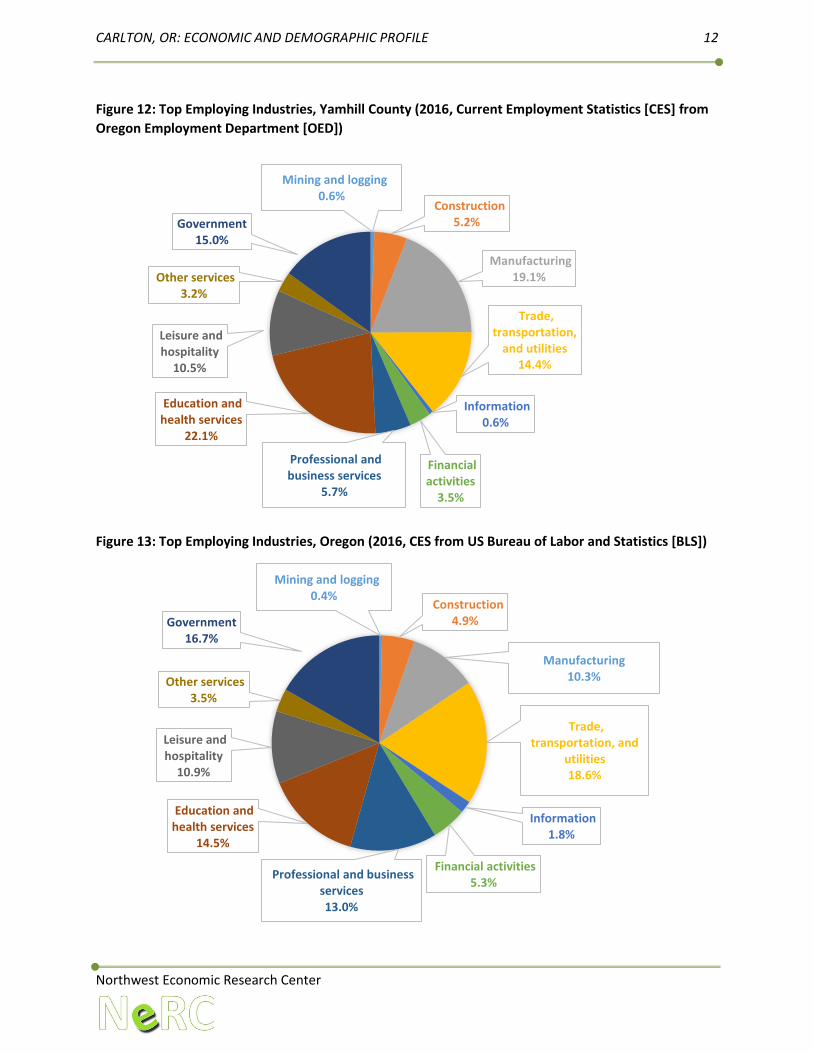
Employment In Yamhill County, the top employing industries are Manufacturing and Health Services and Education,
as seen in Figure 12 below. Comparing that pie chart to a sector employment graph for Oregon as a
whole (Figure 13) illuminates what are termed “traded sectors”: areas of likely relative strength that are
exported at the state level and beyond. By identifying and strengthening traded sectors, communities
can bolster their resilience to economic shocks. In Yamhill County, the shares of Manufacturing and
Education and Health Services are higher than the state in aggregate, indicating potential relative
strength. Goods-producing industries are vulnerable to economic fluctuations so tradability may be
limited, but the second sector typically remains strong.
CARLTON, OR: ECONOMIC AND DEMOGRAPHIC PROFILE 12
Northwest Economic Research Center
Figure 12: Top Employing Industries, Yamhill County (2016, Current Employment Statistics [CES] from
Oregon Employment Department [OED])
Figure 13: Top Employing Industries, Oregon (2016, CES from US Bureau of Labor and Statistics [BLS])
Mining and logging0.6%
Construction5.2%
Manufacturing19.1%
Trade, transportation,
and utilities14.4%
Information0.6%
Financial activities
3.5%
Professional and business services
5.7%
Education and health services
22.1%
Leisure and hospitality
10.5%
Other services3.2%
Government15.0%
Mining and logging0.4%
Construction4.9%
Manufacturing10.3%
Trade, transportation, and
utilities18.6%
Information1.8%
Financial activities5.3%
Professional and business services13.0%
Education and health services
14.5%
Leisure and hospitality
10.9%
Other services3.5%
Government16.7%
CARLTON, OR: ECONOMIC AND DEMOGRAPHIC PROFILE 13
Northwest Economic Research Center
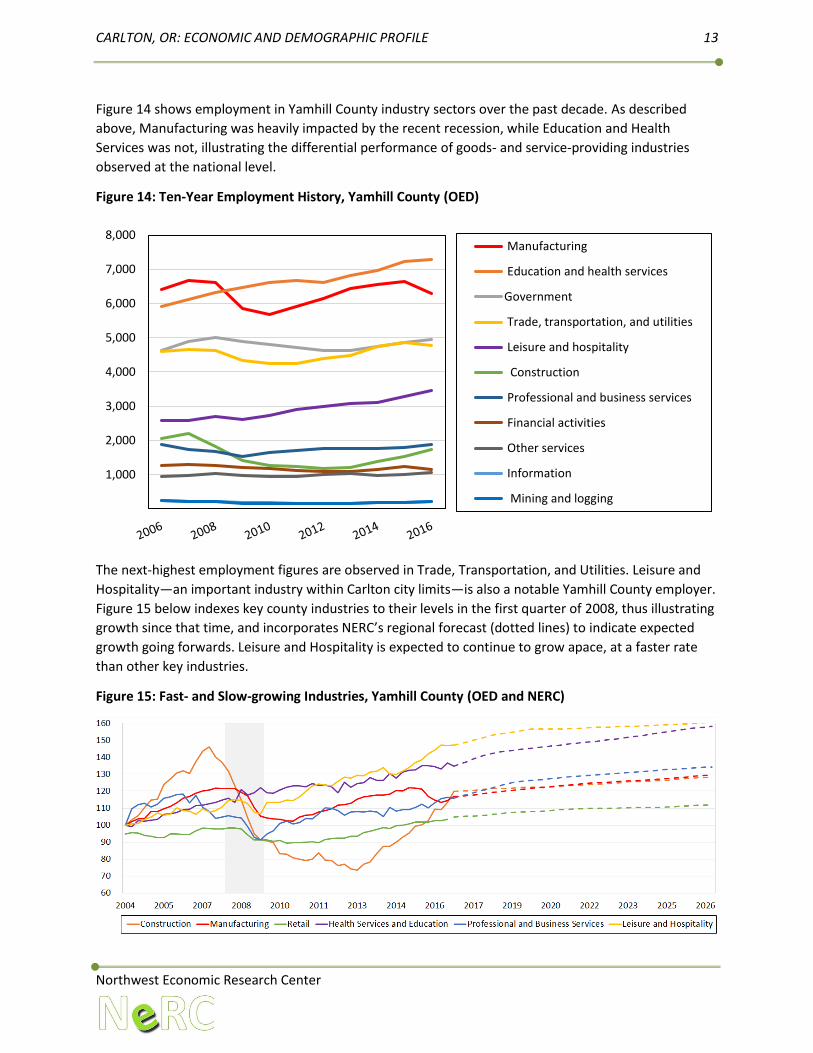
Figure 14 shows employment in Yamhill County industry sectors over the past decade. As described
above, Manufacturing was heavily impacted by the recent recession, while Education and Health
Services was not, illustrating the differential performance of goods- and service-providing industries
observed at the national level.
Figure 14: Ten-Year Employment History, Yamhill County (OED)
The next-highest employment figures are observed in Trade, Transportation, and Utilities. Leisure and
Hospitality—an important industry within Carlton city limits—is also a notable Yamhill County employer.
Figure 15 below indexes key county industries to their levels in the first quarter of 2008, thus illustrating
growth since that time, and incorporates NERC’s regional forecast (dotted lines) to indicate expected
growth going forwards. Leisure and Hospitality is expected to continue to grow apace, at a faster rate
than other key industries.
Figure 15: Fast- and Slow-growing Industries, Yamhill County (OED and NERC)
1,000
2,000
3,000
4,000
5,000
6,000
7,000
8,000 Manufacturing
Education and health services
Government
Trade, transportation, and utilities
Leisure and hospitality
Construction
Professional and business services
Financial activities
Other services
Information
Mining and logging
CARLTON, OR: ECONOMIC AND DEMOGRAPHIC PROFILE 14
Northwest Economic Research Center
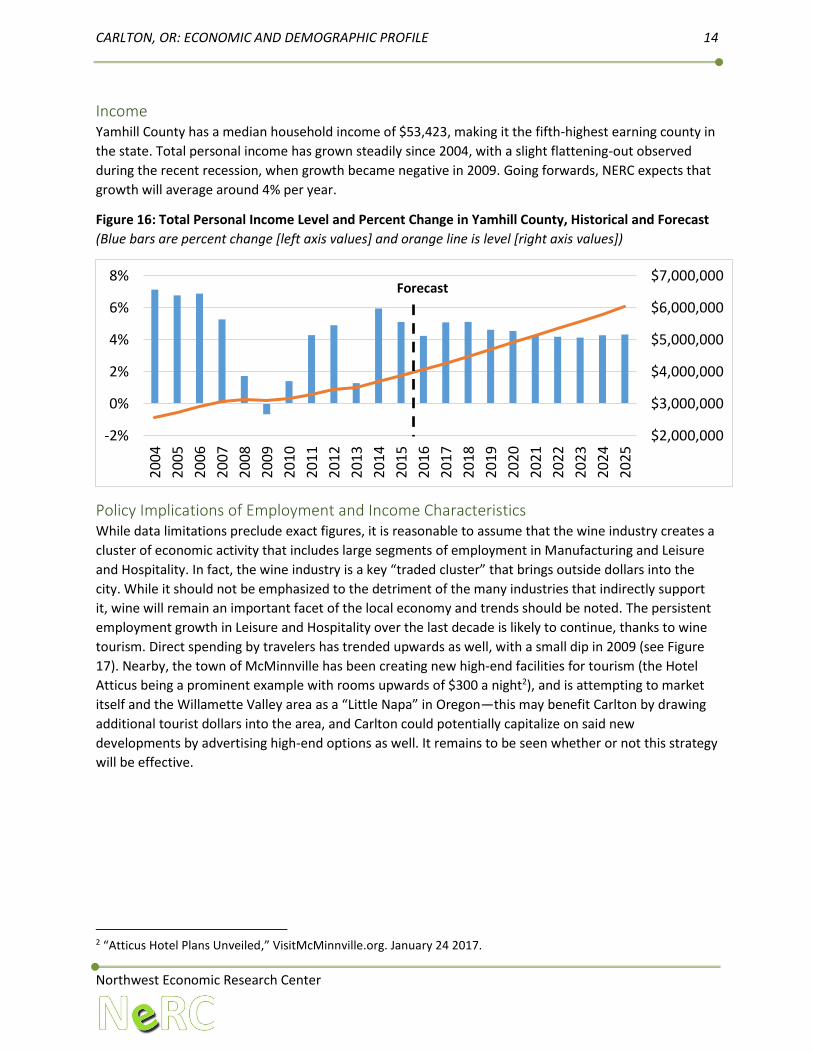
Income Yamhill County has a median household income of $53,423, making it the fifth-highest earning county in
the state. Total personal income has grown steadily since 2004, with a slight flattening-out observed
during the recent recession, when growth became negative in 2009. Going forwards, NERC expects that
growth will average around 4% per year.
Figure 16: Total Personal Income Level and Percent Change in Yamhill County, Historical and Forecast
(Blue bars are percent change [left axis values] and orange line is level [right axis values])
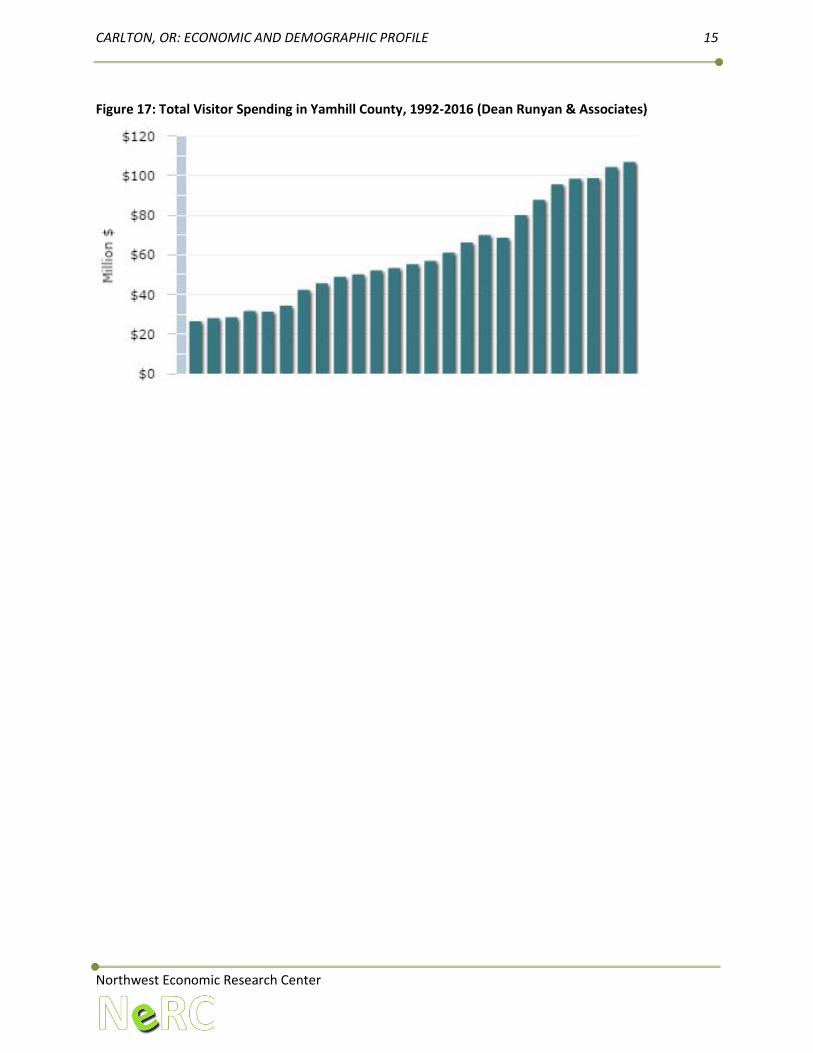
Policy Implications of Employment and Income Characteristics While data limitations preclude exact figures, it is reasonable to assume that the wine industry creates a
cluster of economic activity that includes large segments of employment in Manufacturing and Leisure
and Hospitality. In fact, the wine industry is a key “traded cluster” that brings outside dollars into the
city. While it should not be emphasized to the detriment of the many industries that indirectly support
it, wine will remain an important facet of the local economy and trends should be noted. The persistent
employment growth in Leisure and Hospitality over the last decade is likely to continue, thanks to wine
tourism. Direct spending by travelers has trended upwards as well, with a small dip in 2009 (see Figure
17). Nearby, the town of McMinnville has been creating new high-end facilities for tourism (the Hotel
Atticus being a prominent example with rooms upwards of $300 a night2), and is attempting to market
itself and the Willamette Valley area as a “Little Napa” in Oregon—this may benefit Carlton by drawing
additional tourist dollars into the area, and Carlton could potentially capitalize on said new
developments by advertising high-end options as well. It remains to be seen whether or not this strategy
will be effective.
2 “Atticus Hotel Plans Unveiled,” VisitMcMinnville.org. January 24 2017.
$2,000,000
$3,000,000
$4,000,000
$5,000,000
$6,000,000
$7,000,000
-2%
0%
2%
4%
6%
8%
20
04
20
05
20
06
20
07
20
08
20
09
20
10
20
11
20
12
20
13
20
14
20
15
20
16
20
17
20
18
20
19
20
20
20
21
20
22
20
23
20
24
20
25
Forecast
CARLTON, OR: ECONOMIC AND DEMOGRAPHIC PROFILE 15
Northwest Economic Research Center
Figure 17: Total Visitor Spending in Yamhill County, 1992-2016 (Dean Runyan & Associates)
CARLTON, OR: ECONOMIC AND DEMOGRAPHIC PROFILE 16
Northwest Economic Research Center
Conclusion Carlton has many positive indicators going forwards, such as a younger population and relatively
interactive economy that provides added resilience to economic shocks. The largest local industry
sectors are Education and Health Services and Manufacturing: the former typically grows even in times
of economic contraction, and the latter is more vulnerable to larger economic trends. Leisure and
Hospitality is the most rapidly growing sector, and that growth may be indicative of a relative advantage.
Survey responses indicate that there is a perception that local government places too much emphasis on
the wine industry, however, and with an eye to attracting college graduates to return, attention could
turn to bolstering Education and Health Services. This sector benefits local stakeholders outside of the
wine industry, and employs a swathe of skill sets including degree holders. Additionally, bolstering
available health services may attract more retirees to the community, strengthening the local economy
and raising demand within the sector.
Going forwards, NERC recommends that Carlton refine its Citizen Survey in order to provide data for
analysis not currently available. For example, NERC was unable to discuss housing, as the available data
was not sufficient for meaningful analysis. Appendix I provides recommendations to that end.
CARLTON, OR: ECONOMIC AND DEMOGRAPHIC PROFILE 17
Northwest Economic Research Center
Appendix I: Survey Methodology In order to effectively capture representative information, it is crucial that surveys a) reach as many
citizens as possible and b) ask questions in a format that does not influence responses. Below,
recommendations for each of these attributes are provided.
Maximizing Participation Choosing the mode through which a survey is administered is crucial. Different categories of individuals
respond to different survey types, and across the board, more civically-minded individuals are more
likely to respond: the same individuals who regularly show up at City Council meetings are those most
likely to participate, while those who keep more to themselves and feel more disenfranchised are less
likely to be heard. Younger individuals are more likely to respond to a digital medium, while older
individuals are more likely to respond to printed correspondence. Responses can also vary dramatically
based on the mode of administration: face-to-face conversation will solicit “gentler” responses, as will
telephone interviews. The most important aspect is the maximization of participation: the more people
respond, the better. However, the mode must be constant across an individual survey, or else there is
no way to control for the different response types that each mode obtains. With this in mind, NERC
recommends a paper questionnaire (encouraging openness) that can be sent by mail and handed out at
community events and hubs, and returned by mail or in person at designated locations. These
approaches are proven to bolster election participation.
Asking the Right Questions It can be difficult to separate feelings and values surrounding city services from usefulness of city
services. For example, the previous survey asked respondents what they felt were the most important
services, and responses indicated the police force was perceived as the most important civic element
(second only to water, which likely emerged as prevalent due to the 2015 water restrictions). Officers
are highly valued individuals within their communities, and serve a tremendously valued role in
maintaining social cohesion. Likewise, it is important to know what citizen perceive as most valuable in
their community. However, with regard to funding and policy, it might be more valuable to accompany
this question with others regarding frequency of use: for example, “Which services did you use most
over the past year?” followed by qualitative questions regarding satisfaction with those services
specifically: what went well and what didn’t. Additionally, as the population ages, it will be useful to
know how accessible citizens consider the nearby healthcare facilities, as retirees typically choose
homes based in part on proximity to medical care.
One of the primary limitations in this report was the lack of data. Census figures have very wide margins
of error for populations of this size, rendering them inadequate for meaningful inference. Carlton could
ask questions similar to those in Census questionnaires in order to obtain more useful results: explicit
questions about age, ages in household, location of work, type of job, family size, income sources,
housing type and tenure, and even method of commute might provide insight on the variables that the
city is interested in describing. Of course, the personal nature of such questions requires the city to
ensure anonymity, and the quality of the data collected will depend on the number and socioeconomic
breadth of respondents. Generally speaking, it is best to provide a multiple-choice format for questions
like these, in order to ease later analysis. The most important reason for these demographic questions is
that they can then be compared with US Census data in order to find whether or not the sample shows
CARLTON, OR: ECONOMIC AND DEMOGRAPHIC PROFILE 18
Northwest Economic Research Center
signs of bias towards one group or another, and potentially weight responses differently based on the
percent of the population that they are more likely to represent. For an alternative to demographic
survey, see Appendix II.
List of Example Questions
City Services 1. What city services and facilities have you used most over the past 12 months? [Provide a list]
a. Are you satisfied with the service you received? (Rate: 1-10)
b. What did you like about the experience?
c. What did you dislike?
2. Has the quality of the city services and facilities that you use most frequently increased,
decreased, or remained constant over the last five years?
Population 1. Record participant age, gender, marital status, veteran status, and race.
a. [If participant is at or approaching retirement age:] Do you consider healthcare
accessible to you, or will you consider moving to an area where it is more accessible?
b. [If participant is 18-25:] Do you plan on attaining a college degree? If yes, do you plan on
a) using an online program, b) moving, or c) commuting?
c. [If participant has high school age children:] Do/Does your children/child plan on
attaining a college degree? If yes, do they plan on a) using an online program, b) moving,
or c) commuting?
2. What is the highest level of education you have attained?
3. How many individuals are in your household?
a. Do you have children? If so, what are their ages?
b. Describe the other individuals that you share a household with. (Age, gender,
relationship to respondent.)
Employment and Income 1. Are you currently employed?
a. If so, what is your position and employer?
b. If not, are you seeking employment at this time? If yes, how long have you been seeking
employment?
2. What are your household’s income sources?
3. What is your annual income over the last twelve months?
4. Do you commute out of town to work?
Housing 1. Do you rent or own your residence?
2. What is your residence type? (House, apartment, mobile home, etc.)
3. How many bedrooms does your home have?
4. What is your rent or mortgage payment?
5. Do you have internet in your home?
a. If yes, how do you access it? (Computer, mobile phone, or other)
CARLTON, OR: ECONOMIC AND DEMOGRAPHIC PROFILE 19
Northwest Economic Research Center
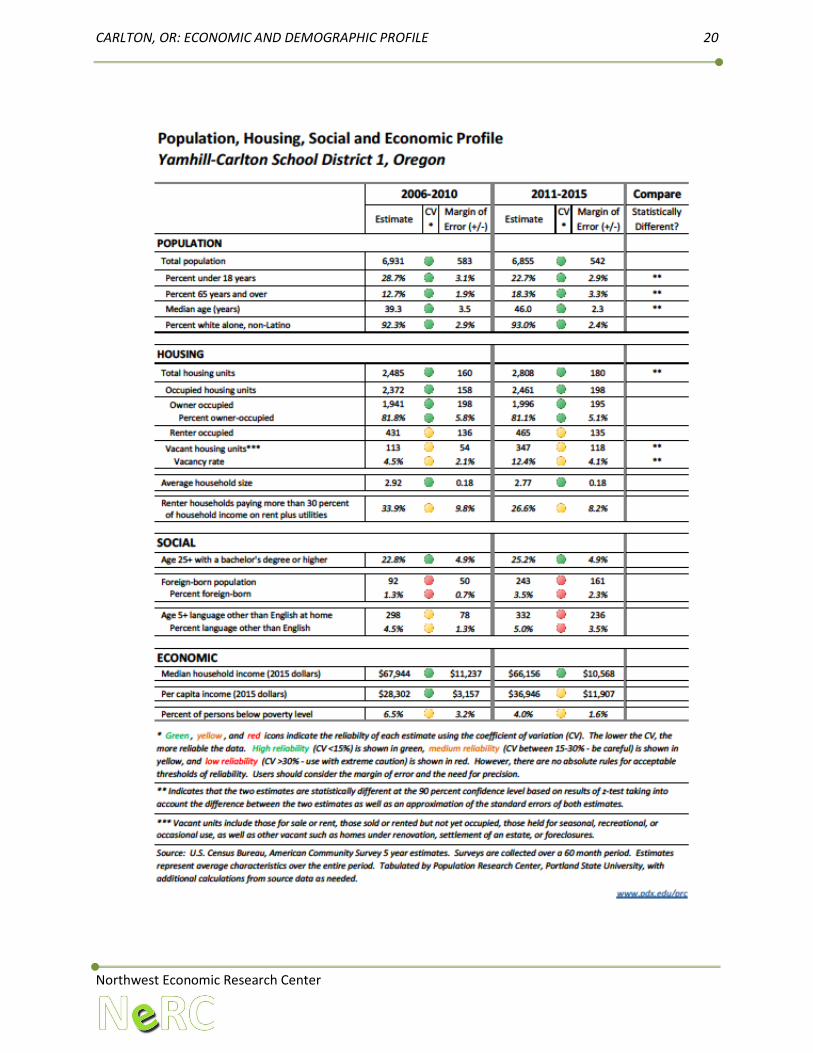
Appendix II: Population Research Center Current Estimates Portland State University’s Population Research Center has a new service available in the near future
that will likely be very helpful to the City of Carlton in policy and service planning. This program will
provide detailed current estimates across the state at the county, school district, and town level using
consistent methodology, providing exactly the kind of data granularity absent from the national
estimates. Information will be available at:
https://www.pdx.edu/prc/
On the next page is an example of one such current-level estimate, in this case for Yamhill-Carlton
School District 1. NERC recommends that the City initiate a conversation with Charles Rynerson, the
Oregon State Data Center Coordinator, who can be contacted at [email protected] with regard to
release dates and general questions.
CARLTON, OR: ECONOMIC AND DEMOGRAPHIC PROFILE 20
Northwest Economic Research Center
CARLTON, OR: ECONOMIC AND DEMOGRAPHIC PROFILE 21
Northwest Economic Research Center
References Dean Runyan and Associates. Oregon Travel Impacts Interactive Tool, Yamhill County. Retreived from
<deanrunyan.com/ORTravelImpacts/ORTravelImpacts.html> June 21 2017
Oregon Office of Economic Analysis, Demographic forecast, Long-term county forecast (2013 release).
Excel file retrieved from <oregon.gov/das/OEA/Pages/forecastdemographic.aspx> January 15 2016.
Oregon Employment Department, Current Employment Estimates Annual Data Sheet, Yamhill County
and Oregon. Excel file retrieved from <qualityinfo.org> June 21 2017
Portland State University Northwest Economic Research Center, Regional Economic and Population
Forecast (April 2017 and October 2016).
Portland State University Population Research Center, 2016 Annual Population Report Tables (April 15,
2017). Excel file retrieved from <pdx.edu/prc/population-reports-estimates> June 21 2017
Portland State University Population Research Center, Certified Population Estimates 2016 (April 15,
2017). Excel file retrieved from <pdx.edu/prc/population-reports-estimates> June 21 2017
Portland State University Population Research Center, Oregon Population Forecast Program Region 3
Documents, Yamhill County. Excel file retrieved from <pdx.edu/prc/region-3-documents> June 21 2017
Schallhorn, Pamela. “Five Strategies for Retaining and Attracting Youth to Rural Communities.”
University of Illinois Extension. March 17 2015.
U.S. Census Bureau; American Community Survey, 2010 American Community Survey 1-Year Estimates,
Table GCT0101; generated by John Smith; using American FactFinder; <http://factfinder2.census.gov>;
(7 January 2012).
U.S. Census Bureau; American Community Survey, 2010-2014 American Community Survey 5-Year
Estimates, Table DP05. Generated using American FactFinder <factfinder.census.gov> January 20 2017
U.S. Census Bureau; Decennial Census, 2010 Demographic Profile Data, Table DP-1. Generated using
American FactFinder <factfinder.census.gov> January 20 2017
U.S. Census Bureau. 2016. OnTheMap Application. Area Profile Analysis in 2014 by Primary Jobs
(Carlton, McMinnville, and Dayton, OR). Generated at <onthemap.ces.census.gov/> January 13 2017
U.S. Census Bureau; Population Estimates, 2016 Population Estimates, Table PEPANNRES. Generated
using American FactFinder <factfinder.census.gov> June 21 2017
“Atticus Hotel Plans Unveiled,” VisitMcMinnville.org. January 24 2017.

Northwest Economic Research Center