caribbean examinations council secondary … caribbean examinations council secondary education...
TRANSCRIPT

1
Caribbean Examinations Council Secondary Education Certificate
School Based Assessment
Additional Mathematics Project B
NAME OF CENTRE: Harrison College
CENTRE CODE: 030014
YEAR OF EXAM: 2015
NAME OF CANDIDATE: Kalaila L. Pais
CANDIDATE’S REGISTRATION NUMBER:

2
Table of Contents
Title Page
Hypothesis .......................................................................................... 3
Statement of Task ............................................................................... 3
Method of Data Collection .................................................................. 4
Presentation of Data............................................................................. 5
Mathematical Knowledge/ Analysis of Data ...................................... 15
Discussion of Findings ......................................................................... 22
Conclusion .…………………………………………………………… 27
Appendices …………………………………………………………… 28
Bibliography ………………………………………………………….. 34

3
Hypothesis
The use of social media will enhance the learning capabilities of persons.
Statement of Task
Aptitude is the ability to learn or develop a skill in a particular field or area. It has been
proven, by a research team at the University of Chicago, that the ability to learn is affected by the
subject’s environment. That is, the people they are associated with, the area in which they grow
and the flow of information they receive daily.
Social media are websites and applications which enable people to share, receive and
socially interact with others online.
Is it then safe to say that social media can be an influencing factor in a person’s aptitude?
After all, the time spent on social media by people of all ages is increasing as this means of
communication is important in both work and entertainment. Does this constant use now allow
us to assume that it can aid us in our manner of learning?
This experiment aims to determine if our use of social media can influence how we learn
by taking into account environment and the time spent per day on social media. It was carried out
by testing a subject’s ability to learn in terms of linguistic, mathematical, pattern, spatial, visual
and logical intelligence as per the theory of ‘multiple intelligence’, put forward by Howard
Gardener. All of the students tested, attended one school in order to eliminate the environmental
variable. Age and gender of the subjects were also investigated as variables in order to see how it
impacted the results.
4
Method of Collection
A test paper was compiled with questions to test different aspects of intelligence listed in
the statement of task. The test paper and marking scheme can be seen on pages 29 – 34.
The test was given to a total of twenty-six (26) students and teachers attending an urban
school. They were also asked to state their age, gender, the number of social media they use and
the time spent on it. Each participant was allowed to take as much time as they needed to finish
the test.
The papers were corrected and the results recorded in the form of graphs, tables, charts
and diagrams.
During analysis, the participants were divided into three age groups: 10-14, 15-18 and
over 18 years old and also by gender.
Eight (8) participants belonged to the 10-14 and over 18 age group while ten (10)
participants belonged to the 15-18 age group. An equal number, of thirteen (13) male and female
participants were tested.
The effect of social media on each type of intelligence taking into account the age and
gender of the individual was determined.

5
Presentation of Data
SOCIAL
MEDIA SCORE ON TEST
GENDER AGE
TIME
TAKEN
(mins)
NO.
USED
TIME
SPENT
(hrs)
LANGUAGE
(5)
MATH
(4)
PATTERN
(3)
SPATIAL
(3)
VISUAL
(2)
LOGICAL
(3)
TOTAL
(20)
M 13 17 0 0 2 1 1 1 0 1 6
M 13 30 0 0 3 3 3 1 0 0 10
F 11 25 6 1 2 2 2 1 1 1 9
M 12 31 2 1
6 2 3 2 0 0 1 8
M 12 15 3 1 4 4 3 2 1 2 16
F 12 32 2 2 4 2 1 2 1 1 11
F 14 25 2 4 5 3 3 2 1 3 17
F 13 33 4 6 3 3 3 1 0 1 11
M 15 11 3 1
6 4 1 0 2 0 0 7
F 15 40 0 0 2 2 3 2 0 2 11
F 15 20 2 1
6 4 3 1 2 1 1 12
F 17 15 2 1 4 1 0 2 1 2 10
M 15 39 3 2 5 2 2 2 0 0 11
F 15 30 5 3 4 4 1 1 0 0 10
M 15 26 3 3 4 3 3 3 1 3 17
M 16 30 3 5 4 2 2 2 1 3 14
M 15 26 2 13 5 4 3 2 2 2 18
F 16 30 6 22 5 3 2 1 2 2 15
M 50+ 25 0 0 5 4 2 0 0 2 13
F 20+ 30 0 0 3 3 3 1 1 1 12
F 30
+ 30 0 0 4 2 2 3 1 3 15
M 50+ 20 1 1 4 4 3 2 0 2 15
M 30+ 60 1 1 5 2 2 3 2 3 17
F 30+ 50 1 2 4 2 1 2 0 1 10
F 25 30 4 5 4 3 3 3 2 3 18
M 21 15 6 16 4 4 3 2 2 2 17

6
TABLE A: The Overall Results of the Test Given
Time Spent on Social
Media per Day Number of People Percentage
Less than 1 hour 9 35%
From 1 to 3 hours 10 38%
Over 3 hours 7 27%
TABLE B – The Percentage Time Spent on Social Media per Day
PIE CHART A – The Percentage Time Spent On Social Media per Day
35%
38%
27%
Less than 1 hr
1hr - 3hrs
More than 3 hrs

7
BAR CHART A – THE MOST COMMONLY USED SOCIAL MEDIA
Stem Leaf
0
3
6 0 1 2
9 0 1 1 1 1 2 2 2 2
12 0 0 1 2
15 0 0 0 1 2 2 2 2
18 0 0
Key: 6 0 means 6 marks
DIAGRAM A – A Stem and Leaf Diagram Showing the Overall Test Score of Each
Participant
0
2
4
6
8
10
12
Facebook Skype Whatsapp Twitter Snapchat Instagram Kik Tumblr
Nu
mb
er o
f P
eop
le
Types of Social Media

8
Q1 Q2 Q3
5
10
15
20
DIAGRAM B – A Box and Whiskers Diagram of the Overall Test Scores of the
Participants
AGE
BAR CHART B - A Comparison of the Average Results for Each Age Group on
Linguistic Intelligence Based on their Time Spent on Social Media
2.33
3.33
4
3.33
4.25
4.67
4 4.33
4
0
0.5
1
1.5
2
2.5
3
3.5
4
4.5
5
LESS THAN 1 HR 1-3HRS MORE THAN 3 HRS
Mar
k
Group
11 --14 15 - 18 18+

9
BAR CHART C - A Chart Comparing Average Results of Each Age Group on
Mathematical Intelligence, Out of 4 Marks, Based on Their Time Spent on Social Media
BAR CHART D - A Chart Showing the Average Results of Each Age Group on
Pattern Recognition, Out of 3 Marks, Based on Their Time Spent On Social Media
2.33
2.67
3
2
2.5
3 3
2.67
3.5
0
0.5
1
1.5
2
2.5
3
3.5
4
Less than 1 hr 1-3 hrs More than 3 hrs
Mar
k
Group
11 --14 15 - 18 18+
0
0.5
1
1.5
2
2.5
3
Less than 1hr 1 - 3 hrs More than 3 hrs
2 2
3
1.33 1.5
2.33 2.33
2
3
MA
RK
GROUP
Chart Title
11--14 15--18 18+

10
BAR CHART E - A Chart Showing the Average Results of Each Age Group on
Spatial Reasoning, Out of 3 Marks, Based on Their use of Social Media
BAR CHART F - A Chart Showing the Average Results of Each Age Group on
Visual Reasoning, Out of 2 Marks, Based on Their use of Social Media
0.667
1.67 1.5
2 2
1.67
1.33
2.33 2.5
0
0.5
1
1.5
2
2.5
3
Less than 1hr 1 - 3 hrs More than 3 hrs
Mar
k
Group
11--14 15--18 18+
0
1
0.5
0.333
0.5
1.67
0.667 0.667
2
0
0.5
1
1.5
2
2.5
Less than 1 hr 1 - 3 hr More than 3 hrs
Mar
k
Group
11--14 15--18 18+

11
BAR CHART G - A Chart Showing the Average Results of Each Age Group on Logical
Thinking, Out of 3 Marks, Based on Their use of Social Media
0
0.5
1
1.5
2
2.5
Less than 1hr 1 - 3hrs More than 3 hrs
0.67
1.33
2
1
1.25
2 2 2
2.5 M
ark
Group
10 -- 14 15--18 18+
12
GENDER
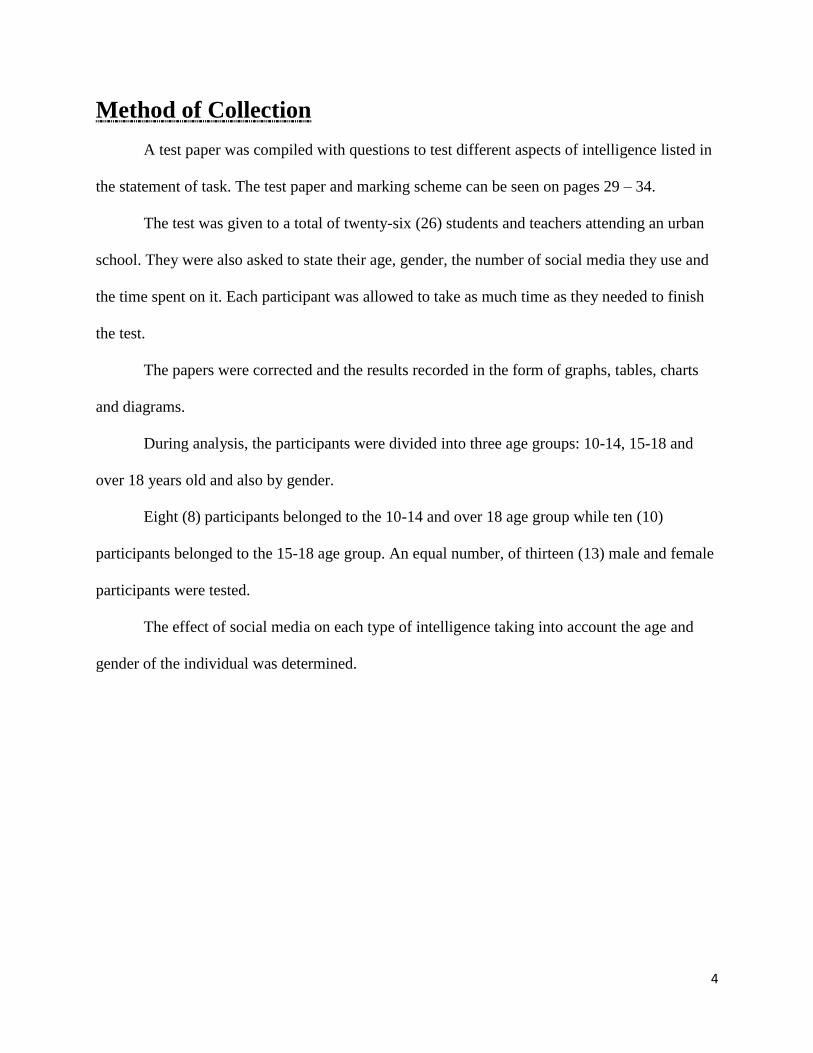
BAR CHART H - A Chart Comparing the Average Results for Males and Females
on Linguistic Intelligence, Out of 5 Marks, Based on the Time Spent on Social Media
BAR CHART I - A Chart Comparing the Results of Males and Females on
Mathematical Intelligence, Out of 4 Marks, Based on their Time Spent on Social Media
0
0.5
1
1.5
2
2.5
3
3.5
4
4.5
Less than 1 hr 1-3hrs More than 3 hrs
3.2
4.4 4.33
3.25
3.6
4.25 M
ark
Group
Male Female
0
0.5
1
1.5
2
2.5
3
3.5
LESS THAN 1 HR 1- 3 HRS MORE THAN 3 HRS
2.4
3
3.33
2.5
2.2
3
Mar
k
Group
Male Female
13
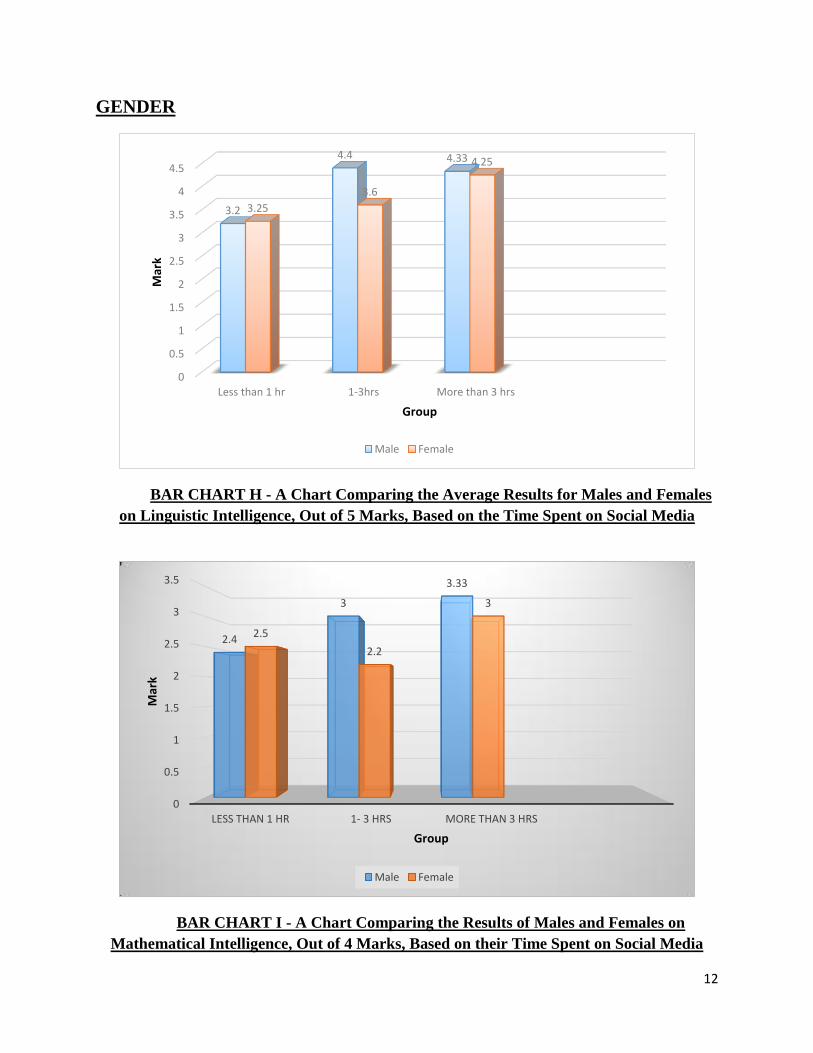
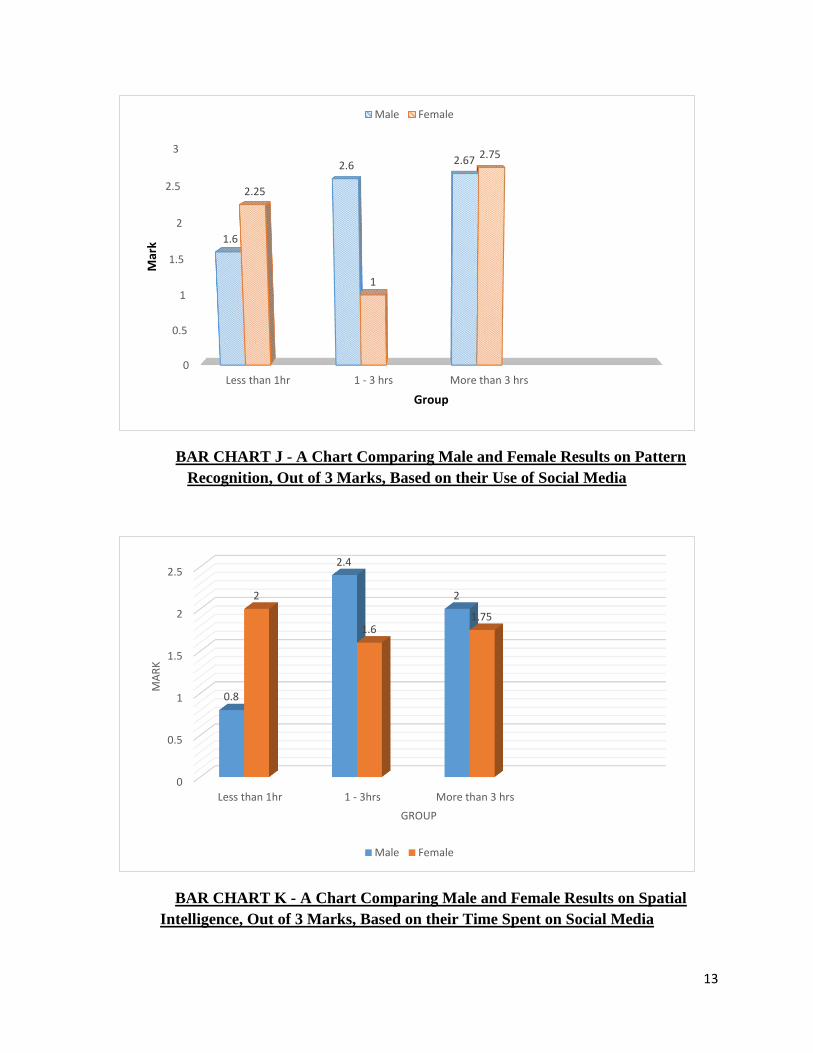
BAR CHART J - A Chart Comparing Male and Female Results on Pattern
Recognition, Out of 3 Marks, Based on their Use of Social Media
BAR CHART K - A Chart Comparing Male and Female Results on Spatial
Intelligence, Out of 3 Marks, Based on their Time Spent on Social Media
0
0.5
1
1.5
2
2.5
3
Less than 1hr 1 - 3 hrs More than 3 hrs
1.6
2.6 2.67
2.25
1
2.75 M
ark
Group
Male Female
0
0.5
1
1.5
2
2.5
Less than 1hr 1 - 3hrs More than 3 hrs
0.8
2.4
2 2
1.6 1.75
MA
RK
GROUP
Male Female

14
BAR CHART L - A Chart Comparing Male and Female Results on Visual
Intelligence, Out of 2 Marks Based on their Time Spent on Social Media
BAR CHART M - A Chart Comparing Male and Female Results in Logical
Reasoning, Out of 3 Marks, Based on their Time Spent on Social Media
0
0.8
1.67
0.75
0.6
1.25
LESS THAN 1HR 1 - 3 HRS MORE THAN 3 HRS
Mar
k
Group
Male Female
0.8
2
2.33
1.75
1
2.25
0
0.5
1
1.5
2
2.5
Less than 1hr 1 - 3 hrs More than 3 hrs
Mar
k
Group
Male Female

15
Mathematical Knowledge/ Analysis of Data:
The test was conducted in order to investigate the effect of social media on an
individual’s ability to learn. The test was divided into 5 categories of intelligence, as listed in the
Method of Collection (page 4). Without the presence of more in-depth and precise statistical
methods, how different age groups and each gender performed in various areas of intelligence,
based on their use of social media per day were examined.
We can analyse the results of the different age groups and genders in their performance
on the linguistic area of the test.
First, we must find the average mark obtained by each age group using the results from
Table A. The average or mean is the calculated ‘central’ value of a set of numbers and the
formula:
𝑀𝑒𝑎𝑛 = ∑𝑥
𝑛
Where:
𝑥 represents the sum of the data values and
𝑛 represents the number of data values
For the age group 10 – 14, the average mark (out of a total of 5) for those who use less
than one hour of social media per day, to three significant figures is:
2 + 3 + 2
3
= 7
3
= 2.33

16
For the same age group, the average mark for those who use from 1 to 3 hours of social
media per day is:
2 + 4 + 4
3
= 10
3
= 3.33
Again, for the same age group, the average mark for those who use over 3 hours of social
media daily, to three significant figures is:
5 + 3
2
= 8
2
= 4.00
This process was repeated for the four other areas in the test paper and the results were
tabulated (see page 18) and Charts B – G were drawn (see pages 8 – 11).
Again, using the method afore mentioned, the average results for males who use less than
1 hour of social media daily in the linguistic area of the test were calculated:
2 + 4 + 2 + 3 + 5
5
= 16
5
= 3.20

17
For the same group, the average mark for those who used 1 – 3 hours of social media per
day, to three significant figures is:
4 + 4 + 4 + 5 + 5
5
= 22
5
= 4.40
Again, for the males, the average mark for those who used more than 3 hours of social
media daily, to three significant figures is:
4 + 5 + 4
3
= 13
3
= 4.33
The process was repeated for males and females for the other areas of the test. The results
were tabulated (see page 18) and the data collected was used to draw Graphs H – M (see page 12
– 14).

18
Area 10 - 14 15 - 18 Over 18
Less
than
1hr
1hr –
3hrs
Over
3 hrs
Less
than
1hr
1hr –
3hrs
Over 3
hrs
Less
than 1
hr
1hr – 3
hrs
Over
3 hrs
Linguistic (5) 2.33 3.33 4.00 3.33 4.25 4.67 4.00 4.33 4.00
Mathematical
(4) 2.33 2.67 3.00 2.00 2.50 3.00 3.00 2.67 3.50
Pattern
Recognition (3) 2.00 2.00 3.00 1.33 1.50 2.33 2.33 2.00 3.00
Spatial (3) 0.667 1.67 1.50 2.00 2.00 1.67 1.33 2.33 2.50
Visual (2) 0 1.00 0.500 0.333 0.500 1.67 0.667 0.667 2.00
Logical (3) 0.667 1.33 2.00 1.00 1.25 2.33 2.00 2.00 2.50
TABLE O – Showing the Average Scores of Each Age Group in Each Area of Intelligence
Based on their Use of Social Media
Area Male Female
Less than
1hr 1hr – 3hrs Over 3 hrs
Less than 1hr
1hr – 3hrs Over 3 hrs
Linguistic (5) 3.20 4.40 4.33 3.25 3.60 4.25
Mathematical (4)
2.40 3.00 3.33 2.50 2.22 3.00
Pattern Recognition (3)
1.60 2.60 2.67 2.25 1.00 2.75
Spatial (3) 0.80 2.40 2.00 2.00 1.60 1.75
Visual (2) 0 0.80 1.67 0.75 0.60 1.25
Logical (3) 0.80 2.00 2.33 1.75 1.00 2.25
TABLE P – A Table Showing the Average Results for Males and Females Based on their
Use of Social Media in Each Area of Intelligence

19
By using the results just obtained we can find the standard deviation of the data by using
the following formula of standard deviation. Standard deviation is the degree to which data is
spread out relative to the mean of the data. It is denoted by σ or s.
𝑠 = √∑(𝑥 − �̅�)2
𝑛
Where:
𝑥 represents each data value
�̅� represents the mean and
𝑛 represents the number of data values
Using the formula, we first have to find ∑(𝑥 − �̅�)2 in order for the standard deviation to
be found.
𝑥 �̅� (𝑥 − �̅�) (𝑥 − �̅�)²
2 2.33 −0.33 0.1089
3 2.33 1.33 1.7689
2 2.33 −0.33 0.1089
∑ 1.9867
𝑠 = √∑(𝑥 − �̅�)2
𝑛
= √1.9867
3
= √0.656233
= 0.8101

20
This procedure was repeated, in order to find the other remaining values and the results
were tabulated in the Table Q (see page 21).
Again, the afore mentioned method was repeated to calculate the standard deviation of
the males who use less than 1 hour of social media per day in the linguistic area of the test.
𝑥 �̅� (𝑥 − �̅�) (𝑥 − �̅�)²
2 3.20 −1.2 1.44
2 3.20 −1.2 1.44
3 3.20 −0.2 0.04
4 3.20 0.8 0.64
5 3.20 1.8 3.24
∑ 6.8
𝑠 = √∑(𝑥 − �̅�)2
𝑛
= √6.8
5
= √1.36
= 1.17
The procedure was repeated to find the remaining values for the males and females and
the results were tabulated and Table R (see page 21) was drawn.

21
Area 10 – 14 15 - 18 Over 18
Less than 1hr
1hr – 3hrs
Over 3 hrs
Less than 1hr
1hr – 3hrs
Over 3 hrs
Less than 1
hr
1hr – 3 hrs
Over 3 hrs
Linguistic (5) 0.810 0.943 1 0.943 0.433 0.471 0.816
0.471 0
Mathematical (4)
0.943 0.943 0 0.816 1.12 0.816 0.816 0.943 0.5
Pattern Recognition (3)
0.816 0.816 0 1.25 1.12 0.471 0.471 0.816 0
Spatial (3) 0.471 0.471 0.5 0 0.707 0.471 1.25 0.471 0.5
Visual (2) 0 1 0.5 0.471 0.5 0.471 0.471 0.943 0
Logical (3) 0.471 0.471 1 0.816 1.29 0.471 0.816 0.816 0.5
TABLE Q – A Table Showing the Standard Deviation of the Scores of Each Age Group in
Each Area of Intelligence
Area Males Females
Less than
1hr 1hr – 3hrs Over 3 hrs
Less than 1hr
1hr – 3hrs
Over 3 hrs
Linguistic (5) 1.17 0.490 0.471 0.829 0.8 0.829
Mathematical (4) 1.2 0.894 0.943 0.5 0.980 0
Pattern Recognition (3) 1.02 0.490 0.471 0.829 0.632 0.433
Spatial (3) 0.748 0.489 0 0.707 0.490 0.829
Visual (2) 0 0.748 0.471 0.433 0.490 0.829
Logical (3) 0.748 1.10 0.471 0.829 0.632 0.829
TABLE R – A Table Showing the Standard Deviation of the Scores of Males and Females in
Each Area of Intelligence

22
Outliers are those values which lie outside the range of data values. The formula is as
follows:
Upper Boundary: Q3 + 1.5(Q3 – Q1)
Lower Boundary: Q1 - 1.5(Q3 – Q1)
Where:
Q1 represents the lower quartile
Q2 represents the median
Q3 represents the upper quartile
Using the Stem and Leaf Diagram, in Diagram A (see page 7), we can find the lower and
upper quartiles, mean and maximum and minimum values for the total score of all of the
subjects.
Q1 = 10 Q2 = 12 marks Q3 = 16
Maximum Value = 18 Minimum Value = 6
Therefore:
Lower boundary: 10 – 1.5(16 − 10) = 1
Upper boundary: 16 + 1.5(16 − 10) = 25
Therefore, there are no outliers amongst the data values. That is, no value lies outside of
the overall pattern of distribution.
A Box and Whiskers Diagram is a graph that displays a large amount of data in five
numbers: the lower quartile, median, upper quartile and minimum and maximum values. This is
done by ordering the data, identifying the five values necessary and plotting the graph. Using the
data above, Diagram B, a Box and Whiskers Diagram was drawn. (See page 8)

23
Discussion of Findings
As shown in Pie Chart A, most people spend one to three hours on social media per day.
Also, it is evident that most people who use social media lie in the age group 15 - 18 years and
an equal amount of males and females use social media with the most common social media
being Facebook as shown in Bar Chart A. Similarly, most people who are above 18 years old
tend not to use social media as often as those who are from 10 to 14 years old. A suggestion for
this may be that youth who have grown up in the presence of social media, tend to exploit it
more than those older.
Age Group 10 – 14
By studying Table C and Bar Charts B - G, we can see that those students who used over
3 hours of social media, performed best in mathematics and pattern recognition, scoring an
average of 3 marks in both, with no deviation, that is, the result was consistent. In linguistics and
logical reasoning, those using more than 3 hours also scored top results on average (4 and 2
marks respectively) however; there was a standard deviation of 1 showing that the results were
not consistent.
Individuals who used from 1 to 3 hours, performed better than the other categories in the
spatial and visual section of the test with mean scores of 1.67 and 1 and a standard deviation of
0.471 and 1. It can be said then that there was not much deviation for the results for the spatial
aspect of the test but the results for the visual section were not as consistent. Therefore, those
who used less than one hour of social media per day performed the worst in all the aspects.
Overall, those participants between the ages of 10 and 14 gained the lowest scores in
comparison to the other age groups. With the exception of two persons, both of whom used

24
between 1-3 hours of social media, no one scored over 11 out of 20. This could be blamed on
youth and limited knowledge of the participants.
Age Group 15 – 18
In comparing Table C and Bar Charts B – G, we can conclude that individuals age 15 to
18 who used over 3 hours of social media per day performed better, than those who used 1 to 3
hours or less, in the logical thinking, visual reasoning and pattern recognition areas on the test. In
the logical and pattern recognition area, an average score of 2.33 was obtained. While, in the
visual reasoning, 1.67 was the mean score. For all three, there was a deviation by 0.471 (showing
fairly steady results). In the mathematical area, the average score was 3 but there was a fairly
large deviation of 0.816.
To add to that, the average 15 to 18 year old using more than three hours of social media
per day performed best in the linguistic aspect of the test. They scored a mean of 4.67 with a
rather small standard deviation of 0.471 meaning the results were quite consistent. Those 15 – 18
year olds who spent 1 to 3 hours on social media per day, along with those who used less than
one hour recorded the best results in spatial reasoning. Both scored an average of 2 marks but the
former had a somewhat large deviation of 0.707 while there was very steady results from the
latter who gained a standard deviation of 0.
In all, the 15 – 18 age group performed better than those aged 10 – 14. With the
exception of one participant who used less than an hour of social media per day, no one scored
less than 10 out of 20. In fact, within the group, the highest score, 18, was found by a participant
who spent 2 hours per day on social media.

25
Age Group Over 18
After studying Table C and Bar Charts B – G, it can be deduced that individuals over 18
years old, who used more than 3 hours of social media each day, performed best in the
mathematical and spatial reasoning scoring 3.5 and 2.5 on average respectively with a standard
deviation of 0.5 for both. That is, the results were quite consistent. In the pattern recognition and
visual reasoning areas of the test, those who used over 3 hours per day scored an average of 3
and 2 respectively with no deviation. Yet in the linguistic aspect, those who used social media
for over 3 hours, performed the worst with a constant result of 4 as there was a standard
deviation of 0.
Those who spent less than an hour per day also scored 4 but there was quite a large
deviation of 0.816 meaning the results were not as steady. In the area of linguistic intelligence
those who used 1 to 3 hours of social media scored a mean of 4.33; however, the results were
fairly constant since there was a standard deviation of 0.471. Those who used a similar amount
of social media, in the logical aspect of the test scored 2.00 with quite a large deviation of 0.816.
On a whole, as age increased, so did the improvements in the test. Those over 18
performed best on the test. No one scored less than 10 out of 20 and the highest mark, 18, was
scored by a participant who used over 3 hours of social media per day. It can be said, therefore,
that their basic knowledge put them on par with those who use more social media.
In conclusion, participants from all ages who used more social media, performed better
than those who used a lesser amount. This can be seen by the results acquired by an individual
aged 10 to 14 years old who used less than 1 hours of social media performed most poorly in all
aspects of intelligence. This proves similar to those within the ages 15 and 18. The participants

26
over 18 years old who used less than one hour of social media performed worst in every aspect
of the test besides linguistic intelligence.
To add to that, those whose time spent on social media ranges from more than 3 hours,
performed best in a majority of the areas of the test, in all age groups. It can be said then, that no
matter the age, use of social media helps that ability to learn in all fields of intelligence.
Males
On studying Graphs H – M and Table P, we can deduce that those males who used over 3
hours of social media per day performed best in pattern recognition, visual and logical reasoning
scoring averages of 2.67, 1.67, 2.33 respectively, all with a relatively small standard deviation
0.471. The average mark in the mathematical area was 3.33 but there was a large deviation of
0.943 denoting that the results were not consistent.
On average, all of the males who used less than 1 hour of social media per day
performed worst in every aspect of the test while those who used between 1 to 3 hours scored
best on average in linguistic and spatial intelligence. They scored an average of 4.4 and 2.4 with
a standard deviation of 0.490 for both. Their scores were fairly consistent.
Females
Using Graphs H – M and Table P it can be concluded that females who spent over 3
hours on social media daily scored highest on average in every aspect of intelligence. In the
linguistic area a mean score of 4.25 was obtained with a deviation of 0.829. This indicated that
the result was relatively skewed. In mathematical reasoning, the average score was 3 with no
deviation from the mean signifying that the result was constant. For pattern recognition the

27
average score for those who used more than 3 hours per day was 2.75 a relatively small standard
deviation of 0.433 showing that the result was not consistent at all. Also, in spatial, visual and
logical reasoning mean scores of 1.75, 1.25 and 2.25 were obtained and a standard deviation of
0.829 for both. That is, the results were not very steady.
However, except for linguistic intelligence, those who used less than 1 hour of social
media performed better than those who used 1 to 3 hours. It can also be seen that females relied
quite largely on social media as the average female who used over 3 hours daily performed best
in every aspect of the test.
In conclusion, by studying the data above, it can be deduced that for all aspects, the males
who used between 1 to 3 hours of social media per day outperformed the females who used a
similar amount. This proved similar for those who used over 3 hours except in the pattern
recognition area, where the females outperformed the males; but only by 0.08. However, those
females who used less than an hour of social media gained average scores which were higher
than those males using a similar amount. Overall, for both sexes, using more than 3 hours of
social media daily benefitted them in how they learnt linguistically, mathematically and logically
as well as how they recognized patterns and visually and spatially thought.

28
Conclusion
In conclusion, from studying the data obtained through a test, it is safe to say that social
media impact one’s ability to learn by enhancing it. As expected, those who were older did
produce better results in the test as compared to those of younger ages but those who used more
social media, performed best overall. Also, males performed better than the females but no
matter the sex, those participants who used more social media, performed best.
In the experiment, participants were all taken from the same school so that environment
would not influence their results. Also, the participants were not allowed to cheat making the
authenticity of the results more accurate. However, there was a lack in the pool of data which
may have skewed the results. Additionally, since there was no time limit to the test, those who
took longer may have had an advantage over those who used less time.
Using this information, one can improve the way in which students are taught. By
integrating the use of social media within school assignments, better results may be obtained by
students. This theory can also be applied to work in businesses and companies.
Other areas which may be investigated for future analysis include social media’s effect
on a person’s ability to interact with others physically or on how it effects someone’s short term
memory.

29
Appendices
This is a test to determine the intelligence and ability of an individual to learn based on a
variety of factors in accordance with the number of social media they use. Please do your best
and try to answer all questions as the results will be used for further data analysis.
Age: _____ Gender: ____ Time started_____ Time ended____
Time spent using Social Media: _______
List Social Media
Used:_________________________________________________________________________
______________________________________________________________________________
______________________________________________________________________________
Chose and circle the letter which best answers the question.
1 - Verbal Intelligence
1. Which answer would best fit next to stagnant?
Flow: River: Stagnant:?
A. Rain B. Stream C. Pool D. Canal
2. Choose the word which is different from the rest.
A. Chicken B. Snake C. Swan D. Crocodile
3. Select one of the following words which you think best defines the word in bold. QWERTY
A. Optimistic B. The first 6 letters on a keyboard C. Strange D. Royalty
4. Which is the correct spelling of the word:
A. acqueus B. aqueous C. acueous D. aqueuos

30
5. The sentence below may have a grammatical or spelling error in it. If it does, circle the letter
where the error lies, if not, chose A
Neither Mary nor Susan had the least interest in snorkeling
B C D
A. B. C. D.
2 - Mathematical ability
1. If one-third of one-fourth of a number is 15, then three-tenth of that number is:
A. 35 B. 36 C. 45 D. 54
2. 2. Father is aged three times more than his son Ronit. After 8 years, he would be two and a
half times of Ronit's age. After further 8 years, how many times would he be of Ronit's age?
A. 2 times B. 2 ½ times C. 23
4 times D. 3 times
3. Mary, who is sixteen years old, is four times as old as her brother. How old will Mary be
when she is twice as old as her brother?
A. 24 B. 25 C. 26 D. 28
4. There are 60 sweets in a jar. The first person took one sweet, and each consecutive person
took more sweets than the person before, until the jar was empty.
What is the largest number of people that could have eaten sweets from the jar?
A. 60 B. 11 C. 20 D. 10

31
3 - Pattern Recognition
1. Please enter the missing figure: 4, 5, 8, 17, 44,
A. 80 B. 125 C. 112 D. 60 E. 84
2. Find the picture that follows logically from the diagrams to the right.
3. Which number should come next in the series?
2----3----5----9----17----33----65
A. 85 B. 129 C. 205 D. 150
4 - Spatial Reasoning
1. Which diagram results from folding the diagram on the left?
2. Which one of the Rubik's cube below can be part of the sequence?
A B C D

32
3. Which cube cannot be made based on the unfolded cube on the left?
A. B C D
5 - Visual Intelligence
1. Pick the piece that's missing from the diagram below
A B C D

33
2. How many four sided shapes does this diagram have?
A. 5 - 10 B. 11 - 15 C. 16 - 20 D. 26 - 30
6 - Logical Thinking
1. At the end of a banquet 10 people shake hands with each other. How many handshakes will
there be in total?
A. 100 B. 20 C. 45 D. 50 E. 90
2. The day before the day before yesterday is three days after Saturday. What day is it today?
A. Monday B. Tuesday C. Wednesday D. Thursday E. Friday
3. All mangoes are golden coloured. Nothing golden in colour is cheap.
I. All mangoes are cheap
II. Golden coloured mangoes are not cheap
A. Only I is true B. Only II is true C. Both I and II is true D. Neither is true

34
Answers Sheet:
Linguistic:
1) C
2) B
3) B
4) B
5) D
Mathematical
1) D
2) A
3) A
4) B
Pattern
1) B
2) C
3) B
Spatial
1) A
2) C
3) A
Visual
1) A
2) D
Logical
1) C
2) E
3) B

35
Bibliography
http://www.indiabix.com/verbal-reasoning/analogy/
http://www.indiabix.com/aptitude/problems-on-numbers/
http://psychology.ucdavis.edu/faculty_sites/sommerb/sommerdemo/stantests/mental.htm
http://www2.trentu.ca/cgi-bin/aptitude.pl
http://www.iq-test.com/spatial-ability-test.php
http://skyview.vansd.org/lschmidt/Projects/The%20Nine%20Types%20of%20Intelligence.htm
http://www-news.uchicago.edu/releases/98/980811.huttenlocher.shtml
http://library.concordia.ca/help/howto/apa.php
http://www.mathsisfun.com/definitions/mean.html
http://mathworld.wolfram.com/Outlier.html
www.madamasr.com
www.site-seeker.com
en.wikepidia.org
fontmeme.com