cardiomyocyte subdomain contractility arising from ... subdomain contractility arising from ... eric...
TRANSCRIPT
Biomech Model Mechanobiol (2015) 14:589–602DOI 10.1007/s10237-014-0624-2
ORIGINAL PAPER
Cardiomyocyte subdomain contractility arising frommicroenvironmental stiffness and topography
Kathleen M. Broughton · Brenda Russell
Received: 17 March 2014 / Accepted: 19 September 2014 / Published online: 2 October 2014© Springer-Verlag Berlin Heidelberg 2014
Abstract Cellular structure and function are interdepen-dent. To understand this relationship in beating heart cells,individual neonatal rat ventricular myocytes (NRVMs) wereanalyzed one and 3days after plating when cultured on dif-ferent stiffness (100, 400kPa) and surface structures (flator 15µm high, 15µm diameter, microposts spaced 75µmapart) manufactured from polydimethylsiloxane. Myofibrilstructure seen by immunohistochemistry was organized inthree dimensions when NRVMs were attached to microp-osts. On day three, paxillin distribution near the post serv-ing as cellular anchorage was quantified on both soft posts(12.04% of total voxel count) and stiff posts (8.16%). Liv-ing NRVMs were analyzed using line scans for sarcom-eric shortening and shortening velocity, and traction forcemicroscopy for surface stress and surface tension. Oneday after plating, NRVMs shortened more on soft posts(1.08µmat 4.75µm/s) compared to either soft flat (0.84µmat 3.41µm/s), stiff posts (0.66µm at 2.88µm/s) or stiffflat (0.48µm at 1.44µm/s). NRVMs have decreased short-ening and shortening velocity on soft posts (1.04µm at3.85µm/s) compared to soft flat (0.72µm at 2.36µm/s)substrates. The surface stress and surface tension increasedover time for both soft post (29.12 kN/m2 and 30.10µN/mmto 42.87 kN/m2 and 51.68µN/mm) and flat (15.36 kN/m2
Electronic supplementary material The online version of thisarticle (doi:10.1007/s10237-014-0624-2) contains supplementarymaterial, which is available to authorized users.
K. M. BroughtonDepartment of Bioengineering, University of Illinois at Chicago,Chicago, IL, USA
B. Russell (B)Department of Physiology and Biophysics, University of Illinoisat Chicago, Chicago, IL 60612, USAe-mail: [email protected]
and 19.00µN/mm to 32.87 kN/m2 and 37.38µN/mm) sub-strates. Paxillin displacement during contraction on day threewas significantly greater in NRVMs attached to soft posts(1.39µm) compared to flat (1.16µm) substrates. The vol-ume and time creating four-dimensional data, interpreted bystructural engineering theory, demonstrate subdomain struc-ture is maintained by the counterbalance between the exter-nal load acting upon and the internal forces generated by thecardiomyocyte. These findings provide further insight intolocalized regulation of cellular mechanical function.
Keywords 4D Imaging · Anisotropic elastic deformation ·Kymograph · Shortening · Shortening velocity · Tractionforce · Surface stress · Surface tension
1 Introduction
Heart disorders that affect contractility properties of the car-diomyocyte, including ischemia and hypertrophic cardiomy-opathy, can lead to extensive health care costs, lost workproductivity and even mortality (Go et al. 2014). When amyocardial infarction (MI) occurs, cardiomyocytes are notdelivered the necessary oxygen and many die. The healthycardiomyocytes that survive anMI are then surrounded by anincreased collagen extracellular matrix, which subsequentlyhas decreased elasticity (Borbely et al. 2005). This regional-ized stiffened tissuematrix impacts the external forces actingupon the remaining healthy cells, and then, the cardiomy-ocyte internally responds to these localized external mechan-ical cues.
Variation in cell and tissue stiffness occurs during the con-traction/relaxation cycle in healthy and diseased hearts. Themaximum heart cell and tissue stiffness are at the end ofthe systolic shortening during a contraction when blood is
123
590 K. M. Broughton, B. Russell
ejected. The heart also becomes stiffer with age and disease,which loads all phases of the expansion–contraction process.The cardiac output of the entire heart is a function of the vari-ation in the matrix stiffness (Berk et al. 2007). The stiffness(modulus of elasticity) of the normal adult human heart tissuetypically ranges from 10 to 50kPa (Berry et al. 2006; Bhanaet al. 2010; Borbely et al. 2005; Omens 1998) and diseasedtissue stiffness from 50 to 500kPa (Fomovsky and Holmes2010; Fomovsky et al. 2010; Holmes et al. 2005). Tissueproperties have beenmimicked by varying the substrate stiff-ness and found to affect cardiomyocyte phenotype (Bhana etal. 2010; Discher et al. 2005; Engler et al. 2008). Substratestiffness additionally influences the contraction performanceof a cardiomyocyte (Engler et al. 2008; Jacot et al. 2008).The external microenvironment stiffness then affects NRVMsignaling, and the response by contractile sarcomeres occursin a continuous feedback loop (Berk et al. 2007).
At the sarcomeric level, the cardiomyocyte is composed ofprotein complexes, such as the sarcomere, composed of thinand thick filaments, titin and the Z-disk, that determine con-tractile performance of the individual cardiomyocyte. (Hanftet al. 2008) In the aggregate, these contribute to the wholeheart function (Solaro and deTombe 2008). Cardiomyocyteperformance is based on the total tension generated inter-nally based on a number of factors, including the externalload forces acting upon it. The diseased heart has contractiledysfunction that affects the force–velocity relationship andblood pressure changes (Solaro and deTombe 2008).
Although some research has been presented on the useof tuning elastomeric material to mimic extracellular matrixand tissue stiffness related to cardiomyocyte function, theimpact on performance is not well understood. Cardiomy-ocytes have been shown to generate more force on stiffer,compared to softer, two-dimensional (2D) substrates (Hazel-tine et al. 2012; Hersh et al. 2013; Rodriquez et al. 2011;Wang et al. 2011) but few studies have addressed cellularmorphology or function when cardiomyocytes are config-ured in three dimensions (3D) of scaffolds of varying stiff-ness. Additionally, a clear understanding of the relationshipbetween the external and internal force balancing within sub-domains of the NRVM has not been well explained usingexperimental techniques.
Wepresent here the use ofmicrotopographymanufacturedfrom a stiffness-tunable elastomeric material providing thecardiomyocyte with a 3D microenvironment. Both live andfixed NRVM studies were conducted to demonstrate how3D remodeling affects the functional performance over time,known as a four-dimensional (4D) system. In these exper-iments, the micromechanics of NRVM subdomains wereassessed by line scan and traction force microscopy to under-stand the contractility properties and the internal balance offorce generatedwithin the cardiomyocyte in response to com-plex external cues of stiffness and microtopography. These
experiments lead to a better understanding of the structure-function relationship in muscle.
2 Materials and methods
2.1 BioMEMS substrate fabrication
Fabrication of microtopography substrate surfaces has pre-viously been described by our laboratory (Motlagh et al.2003). First, a UV photolithography process using SU-8photoresist (MicroChem, Newton, MA) on silicon waferswas conducted. The wafers with the manufactured topog-raphy surface becomes an initial template thereafter for aparylene template made using a chemical vapor depositionprocess. Theparylenewas removed from thewafer and servesas a secondary template to mold topography substrate sur-faces on polydimethylsiloxane (PDMS) (DowCorning,Mid-land, MI). PDMS was rapidly mixed in a 10:1 or 50:1 elas-tomer base to curing agent ratio for approximately 5min. Airbubbles in the bulk PDMS were degassed using a vacuumdesiccator for approximately 30min. The bulk PDMS wasspun onto cell culture-compatible plates (MatTek, Ashland,MA), which creates a PDMS thickness of approximately 50microns. For the microtopography substrates, the paryleneis placed on PDMS and degassed again for approximately10min. The PDMS substrates were then cured for 24h in a60◦C oven. After curing the PDMS, it was cooled and theparylene template was removed leaving PDMS substrateswith either a flat or microtopography surface (Fig. 1a, c).
2.2 Substrate material stiffness testing
Testing of the PDMS substrate stiffness (Young’s modulusof elasticity) was conducted using Atomic ForceMicroscopy(AFM) techniques. Briefly, a new borosilicate glass particle(10µm) on silicon nitride (0.12N/m) cantilever tip (Novas-can, Ames, IA)was used for each experiment session. The tipwas first calibrated with respect to a glass surface. Then, sixAFM measurements were taken in a region of cured PDMSmaterial along the flat surface of the substrates before relocat-ing the cantilever to a different region for six more measure-ments, which was repeated three or more times per substrate.Testing of each PDMS elastomer to curing agent mixtureto determine the stress–strain properties of the material asrelated by Young’s Modulus of elasticity occurred on a min-imum of three samples, from three different mixing batchesper PDMS mixture using AFM with a total count of 53 sam-ple points measured for the 50:1 elastomer to curing agentratio mixture and 41 sample points measured for the 10:1ratio mixture. To analyze micropost-related data, the stiff-ness of the microposts is assumed to be equivalent to thebulk material.
123
Cardiomyocyte subdomain contractility arising 591
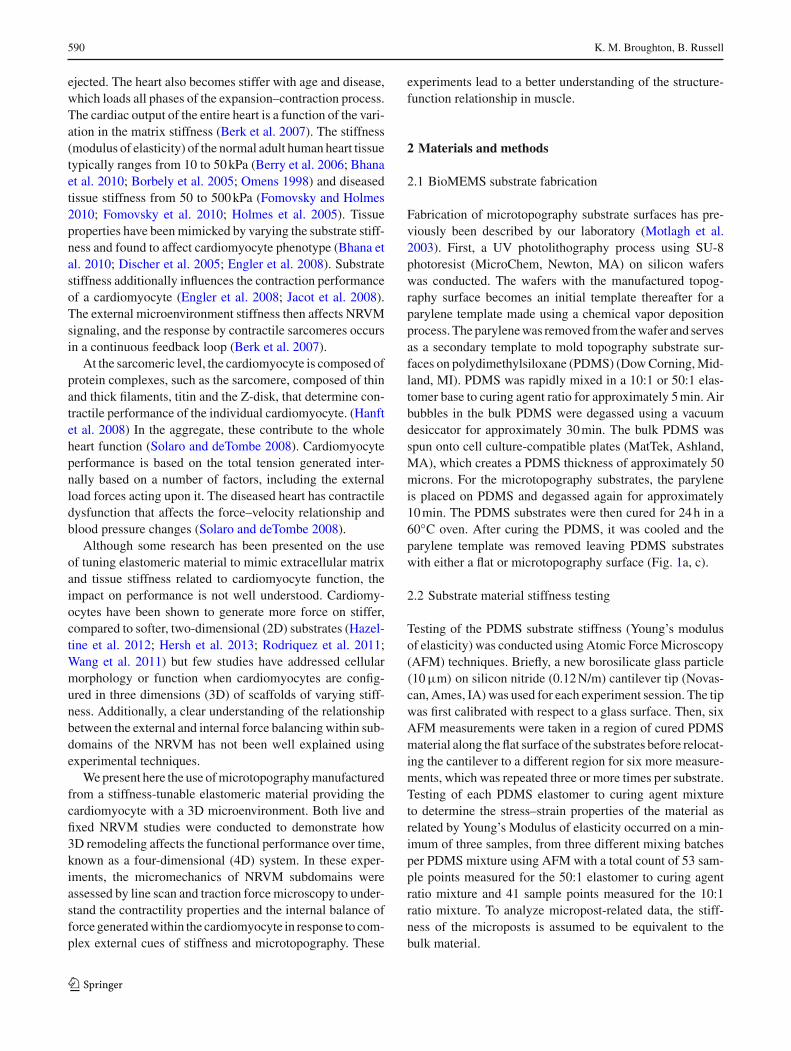
Fig. 1 Experimental setup using PDMS with or without microp-osts for contractility experiments of neonatal rat ventricular myocytes(NRVM). a Flat PDMS, bNRVMseeded on flat PDMSwith fluorescent
microbeads attached to the substrate, cmicropost topography PDMS, dNRVM seeded and attached to micropost with fluorescent microbeadsattached to the substrate, a, c scale = 75µm. b, d scale = 15µm
2.3 Substrate preparation for cell plating
Substrateswerefirst treatedwith 5%APTES (3-aminopropy-ltrimethoxysilane) in a 5% water, 200 proof isopropyl alco-hol mixture for 10min. The APTES mixture was aspiratedand flushed with 200 proof isopropyl alcohol. The substrateswere heated for 25 min in a 60 ◦C oven then cooled for 5minbefore flushing the substrates with a 5%water, 200 proof iso-propyl alcohol mixture. When preparing substrates for trac-tion force experiments, an additional step of adding fluores-cent microspheres (Life Technologies, Carlsbad, CA) with a0.5µm diameter to the surface, as previously described, wasapplicable (Lateef et al. 2005). Briefly, the beads were com-bined with a 3.3 mM potassium hydroxide/sterilized watermixture and applied to the substrates for 10 min followedby aspiration of remaining liquid to create an approximate150 beads per 100 square micron adherence (Fig. 1b, d). Thesubstrates were then coated with a fibronectin (20µg/ml) inDulbecco’s modified Eagle’s medium (DMEM) solution andleft in a 37 ◦C, 5% CO2 incubator for 2h prior to seedingcells.
2.4 Cardiomyocyte culture
Primary cardiomyocyte cultures were obtained from neona-tal rat ventricular myocytes (NRVM) according to Institu-tional Animal Care and Use and NIH guidelines for the careand use of laboratory animals. Hearts were removed, andcells were isolated from 1- to 2-day-old neonatal Sprague-Dawley rats with collagenase (Worthington) as previouslydescribed (Boateng et al. 2003; Curtis et al. 2013). The cellswere re-suspended, filtered through a metal sieve to remove
large material and plated at low density (250,000 cells/dish)in a chemically defined, serum-freemedium for primary cells(PC-1) (Biowhittaker/Cambrex) on the fibronectin-coatedsubstrate surfaces. Cells were left undisturbed for 24h ina 37 ◦C, 5% CO2 incubator. Unattached cells were removedby aspiration, and PC-1 media was replenished daily.
2.5 Real-time phase imaging
NRVM were imaged under phase microscopy using a ZeissLaser TIRF 3 Microscope (Zeiss, Peabody, MA) under a40x objective lens and a 37 ◦C, 5% CO2 incubator attach-ment. Cardiomyocytes were filmed with phase microscopyand recorded one frame every 5 min for 24h between 18and 42h after plating to view initial attachment and earlystage cardiomyocyte remodeling to the micropost. The filmwas then converted from a 24-h movie to a playback movieshown over 22s (Online Resource 1).
2.6 Immunohistochemistry
NRVMs were fixed in 10.0% paraformaldehyde for 10min,followed by a 0.3Mglycine/phosphate-buffered saline (PBS)(Media Tech, Manassas, VA) rinse. NRVMs were then incu-bated in 0.5%TritonX-100 (SigmaSt. Louis,MO) for 10minto permeabilize NRVM membranes. NRVMs were labeledwith a primary antibody for sarcomeric α-actinin (mousemonoclonal ab9465, Abcam, Cambridge, MA) diluted 1/200and paxillin (rabbit monoclonal ab32084, Abcam, Cam-bridge, MA) diluted 1/250 in 1% Tris-buffered saline—Tween 20 (TBST) (Sigma St. Louis, MO), /1% Bovineserum albumin (BSA) (Sigma St. Louis, MO) /PBS and left
123
592 K. M. Broughton, B. Russell
overnight in a 4 ◦F refrigerator. NRVMs were then flushedmultiple times with PBS and incubated with mouse anti-rabbit Alexa Fluor IgG 488 and goat anti-mouse Alexa FluorIgG 568 secondary antibody (Invitrogen) diluted 1/1,000 for45 min in room temperature. All samples were flushed withPBS then preserved in 1nM 4’,6-diamidino-2-phenylindole(DAPI)/PBS (Vector Labs, Burlingame, CA) and stored in a4◦F refrigerator until imaged.
2.7 Fluorescence microscopy
NRVM images were captured as 1,024×1,024 pixel imagesusing a Zeiss LSMObserver Z1microscope (Zeiss, Peabody,MA)with a 63× objective lens for assessment of NRVM sur-face area using ImageJ (NIH, Bethesda, MA). Z-stacks weregathered with 0.5µm optical slices and 1,024× 1,024 pixelresolution using a Zeiss 710 Confocal Microscope (Zeiss,Peabody, MA) with a 40× or 63× objective lens with laserwavelengths of either 358, 488 or 568nm, dependent uponthe need. Renditions of the Z-stacks to determine variation inNRVM structure with respect to the flat or topography sur-face were created using Volocity 3D Image Analysis Soft-ware (Perkin Elmer, Waltham, MA).
2.8 Fluorescence voxel quantification
To quantify focal adhesion localization around microposts,renditions of the Z-stacks were analyzed using Volocity 3DImaging Analysis Software (Perkin Elmer, Waltham, MA).Briefly, the paxillin fluorescence in cubic micron voxelslocated around the post (approximately within 2 microns ofthe post) were regions of interest selected for measurements.The localized paxillin fluorescence voxels were then normal-ized to the total fluorescence voxels within the cell. Betweensix and seven cells were measured from three independentexperiments per condition.
2.9 Kymograph analysis for shortening and shorteningvelocity
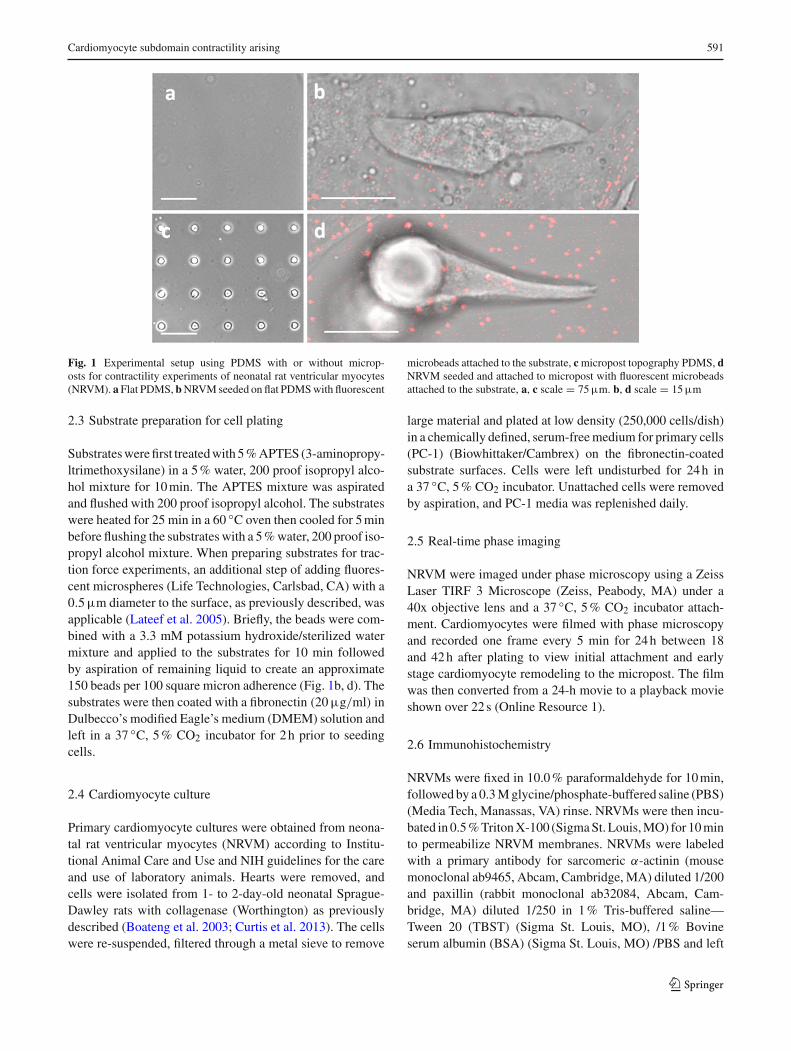
The use of a line scan to gain detailed information aboutmyofibrillar contractility was reported by our laboratory(Curtis et al. 2013). Similar to whole field capture of liveNRVMs, spontaneously beating cardiomyocytes were cen-tered in focus under a Zeiss 710ConfocalMicroscope (Zeiss,Peabody, MA) with a 25× objective (Zeiss) (Fig. 2a). Cellswere selected based on the following criteria: Clusters of two
Fig. 2 Measuring shorteningand shortening velocity using akymograph. aMotion recordedwithin a single NRVM on a100-kPa Post, 1 day afterplating, via a line scan (redline). b Kymograph of axial celldisplacements (red line scannedover time) yields maximumshortening, at which maximumshortening time is measured
123
Cardiomyocyte subdomain contractility arising 593
or more were rejected; single cells have a major axis that isvisually greater than the minor axis; on micropost substratacells must be attached at the anchorage site of a major axis.With use of ZEN software (Zeiss), a line scanwas taken alongthe major axis of the cell in the mid-height of the myofibrillayer. Transmitted light from a differential interference con-trast channel was captured from each line every 7.56 ms overthe course of 5,000ms, thereby recording multiple completeand regular cycles of NRVM contraction.
From the NRVM-generated motion, peaks of contractioncould be easily rendered and used tomark states ofmaximumshortening and relate such distance to time, as an indicatorof shortening velocity, as described by our laboratory previ-ously (Curtis et al. 2013). Image processing software (LSMBrowser, Zeiss) was used to scale the pixel tomicron distanceas well as the time to obtain the shortening and the associatedvelocity in single NRVM contractions (Fig. 2b). To calculatemaximum shortening, the distance from the start of the con-traction to the peak (maximum) shortening was measuredand converted from pixel to micron distance. To calculateshortening velocity, the maximum shortening was divided bythe time from the start of the contraction to the peak (max-imum) shortening. Measurements of shortening and short-ening velocity were taken one day after plating for soft andstiff, flat and topography, PDMS substrates. Measurement ofthe scanned myofibril length was also measured with ImageJsoftware to produce a scaled value to normalize the short-ening and shortening velocity with respect to the myofib-ril length. Measurements comparing NRVMs plated on softsubstrates molded from flat and topography PDMSwere alsotaken at 3days after plating. The maximum shortening andassociated velocity for NRVMwith a major myofibrillar axiswas measured for three contractions per NRVM, and a totalof at least fifteen NRVMs over the course of at least threeindependent experiments per condition were measured.
2.10 Mapping diagram of subdomain shortening andshortening velocity
Tounderstand theNRVMsubdomain shortening and shorten-ing velocity, an analysis was performed on a cell that did nothave a visually recognizable major myofibrillar axis. Withcellular geometry that indicated no dominant major or minoraxis, three line scanmeasurementswere taken on three differ-ent myofibrils within the cell. Each kymograph was analyzedat five micron increments to determine subdomain shorten-ing and shortening velocity. Each resulting subdomain mea-surement was transposed onto a visual map as a five micronsquared pixelwith an incremental color scale to show the sub-domain variation. Eachmeasured point is shownwith a blackoutline surrounding the color depicting the respective short-ening and shortening velocity range of the subdomain. Theadjacent regions to the subdomain pixels are interpreted as
having similar subdomain shortening and shortening veloc-ity as a precursor to a finite element analysis approach tomodeling the shortening and shortening velocity.
2.11 Traction force microscopy for surface stress andsurface tension
To understand the NRVM force generation, the force perarea and force per length at the surface interface between thesubstrate and single NRVM with a major myofibrillar axiswere measured using traction force microscopy techniques.NRVMswere compared on 100kPa topography or flat PDMSat one and 3days after plating and the maximum force perarea or length was measured. The force per area (surfacestress) and the force per length (surface tension) describethe balance of forces at the interface between the substrateand the cell. It is from understanding both of these fea-tures that one can characterize the internal–external relation-ship of forces. Cardiomyocyte contractions were recordedat the interface between the NRVM and substrate surfacewhere 0.5µm diameter fluorescent beads were plated priorto fibronectin coating on the substrates.
Filming was recorded for 15 images on single scan modeusing a 63× magnification, Zeiss LSM Observer Z1 micro-scope (Zeiss, Peabody, MA). From this time series, a pair ofimages representing states of rest (diastole) and peak contrac-tion (systole) was selected for later analysis. Images result-ing from the data permitted analysis on the force generationrelated to surface stress and surface tension created by thespontaneous contraction of the cardiomyocyte. Force wasmeasured for three contractions per NRVM, and a total ofat least fifteen NRVMs were measured over the course ofat least three independent experiments per condition. Analy-sis of the fluorescent bead displacement to define NRVMboundary conditions was conducted with LIBTRC software(Boston U, Boston, MA).
2.12 Paxillin-GFP transfection and displacement analysis
Cells plated on 100 kPa flat or microtopography were trans-fected with paxillin-GFP (Melendez et al. 2004), by meth-ods previously described for NRVM (Chu et al. 2011).Briefly, after 2days after plating, NRVMs were transfectedwith paxillin-GFP to result in an MOI = 10. On day three,NRVM contractions were recorded using a Zeiss 710 Confo-cal Microscope (Zeiss, Peabody, MA) with a 40x objective(Zeiss). Experiments were conducted on singleNRVM trans-fected with paxillin-GFP, which was clearly visible on thebottom of all cells and near the attachment sites of the micro-post (for microtopography substrata). Paxillin displacementwas detectable and contraction cycles were filmed in thetime series scan mode with a pixel dwell time of 1.27ms perpixel. Cellswere additionally imaged for line scan analysis as
123
594 K. M. Broughton, B. Russell
described above. To analyze paxillin displacement, LIBTRCsoftware (Boston U, Boston, MA) was first used to calculatethe displacement distances of the paxillin as related by vectorarrow distances. The maximum paxillin displacement vectorwas then measured with ImageJ software to produce a scaledvalue based on the actual vector arrow. A total of ten cellswith at least three comparative contractions were analyzedfrom three independent experiments per condition.
2.13 Statistical analysis
Data were organized using Excel software (Microsoft, Red-mond, CA), and statistical analysis was performed usingGraphPad Prism (GraphPad Software, La Jolla, CA). Dif-ferences in quantifiable variables were determined by usingeither two-tailed Student’s t test or n-way ANOVA. PDMSstiffness statistics were based on aminimumof three samplesper condition, and a total of at least 30 sample points weretaken. Cellular statistics were based on a minimum samplesize of fifteen NRVMs per condition total from a minimumof three experiments per sample set. All NRVM data wereexpressed as mean ± standard error of the mean (SEM).
3 Results
3.1 Substrate stiffness
Using the curing time and temperature described in themeth-ods, results define a 50:1 ratio to yield a Young’s Modulus of98.4 ± 7.36 kPa, while a 10:1 ratio yields a 397.4 ± 30.79,which are rounded off to 100 and 400 kPa, respectively. The50:1 ratio was the softest PDMS substrate that will moldmicroposts and retain the micropost shape after removingthe parylene and also mimics the upper boundary of normalheart tissue stiffness (Berry et al. 2006; Bhana et al. 2010;Borbely et al. 2005;Omens 1998). The 10:1 ratio has no issueretaining shape after removing the parylene and mimickedtissue stiffness similar to diseased heart tissue (Fomovsky etal. 2010; Fomovsky et al. 2010; Holmes et al. 2005). Stiff-ness of the two substratummixtures are significantly different(p < 0.0001).
3.2 Subcellular structural influence from microposts
Real-time imaging of cardiomyocytes after plating was usedto observe the adherence of cells to the microtopographyin comparison to the behavior on a flat substrate. This isshown with an example of an NRVM attaching to a 100-kPaPDMS micropost, filmed between 18 and 42h after plating(Online Resource 1). A thin layer of myofibrils was seenusing Z-stack reconfiguration techniques in fixed, immunos-tained cardiomyocytes on flat substrates for both 100 and 400
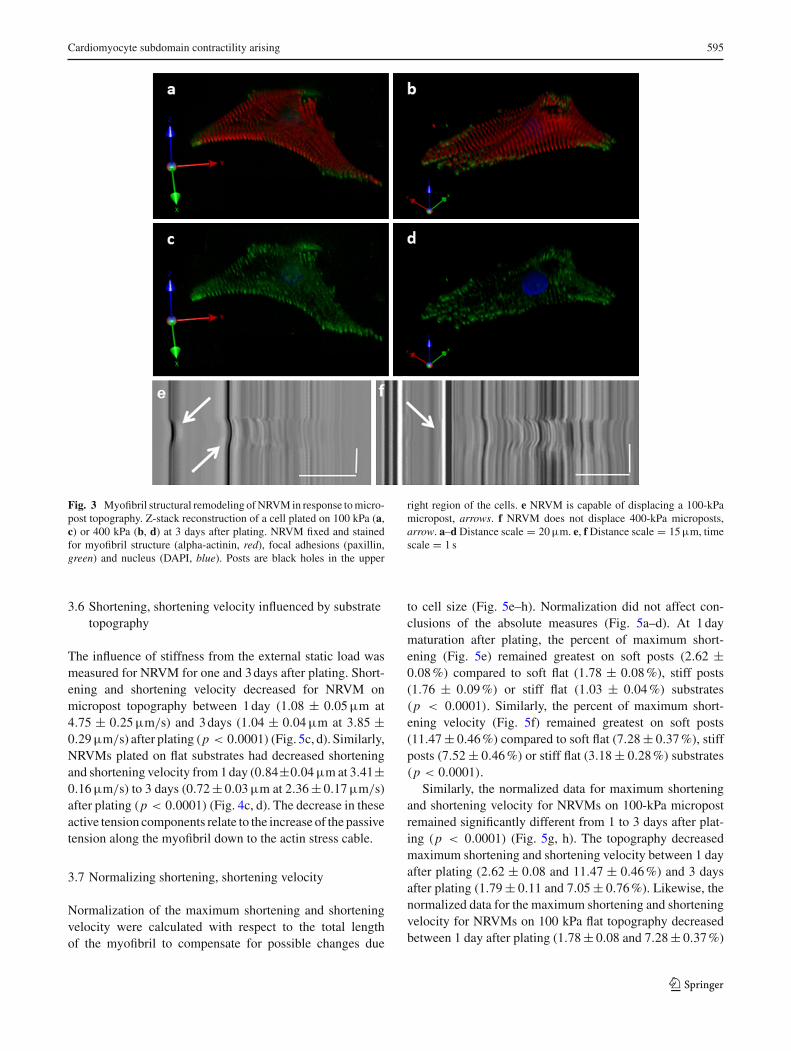
kPa stiffnesses (data not shown). However, a deep myofib-ril layer was observed in the third dimension when the car-diomyocytewas attached to themicropost in both the 100 and400kPa substrates (Fig. 3a–d).The focal adhesions anchoredalongside the micropost were able to support the external–internal static load in 3D (Online Resource 2). Furthermore,the NRVM were anchored and generated enough force tomove 100-kPa microposts (Fig. 3e), but not the 400-kPamicroposts (Fig. 3f), during the contraction cycle.
3.3 Cellular growth of NRVMs
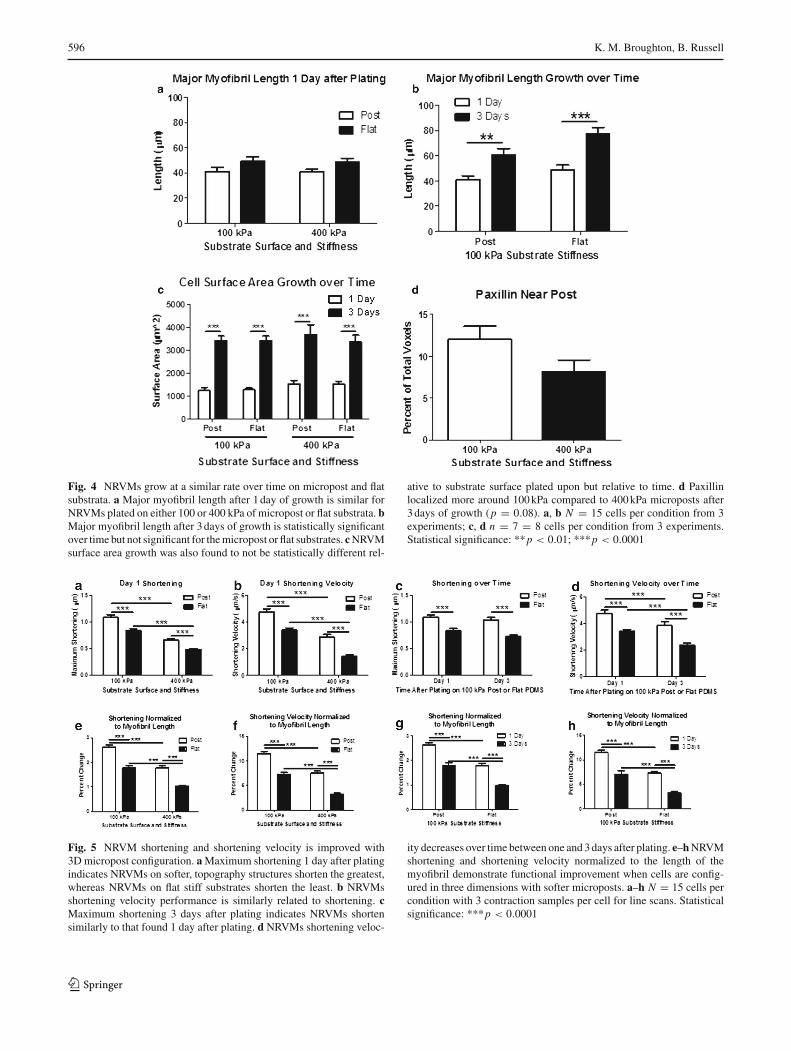
On day one after plating, myofibril length of NRVMs on 100-kPamicroposts (41.13±3.03µm) andflat (49.07±3.54µm)
substrates was similar to those on 400 kPa microposts(40.64 ± 2.19µm) and flat (48.73 ± 2.91µm) substrates,respectively (Fig. 4a). By day three after plating, growthof NRVMs was shown by the myofibril length on 100-kPamicroposts (60.69 ± 5.10µm) and flat (77.73 ± 4.88µm)
substrates, which were significantly different from day one(p = 0.0022 and p < 0.0001, respectively) (Fig. 4b).NRVMsgrew at a similar rate on both the soft and stiff PDMSfor both flat and micropost conditions regardless of substrata(Fig. 4c). There was a statistically significant (p < 0.0001)hypertrophic growth found from one and 3days after platingfor both substrate stiffness and topography surface charac-teristics.
3.4 Localization of paxillin around microposts
Paxillin localization, measured in cubic micron voxels from3D rendered Z-stacks of NRVMs after 3days of growth, wasfound to be greater in NRVMs attached to soft microposts(12.04±1.57%) compared to stiffmicroposts (8.18±1.37%)(p = 0.08) (Fig. 4d).
3.5 Shortening and shortening velocity influenced bysubstrate stiffness
Cardiomyocyte maximum shortening and shortening veloc-ity occur along themajormyofibril axis in an inward directionto a centroid region in the NRVM.Maximum shortening wastypically the greatest in the region between the anchoragesite and the centroid of the NRVM. Cardiomyocyte maxi-mum shortening was greatest on soft posts (1.08 ± 0.05µmat 4.75± 0.25µm/s) compared to soft flat (0.84± 0.04µmat 3.41 ± 0.16µm/s), stiff posts (0.66 ± 0.03µm at 2.88 ±0.19µm/s) or stiff flat (0.48±0.02µmat 1.44±0.10µm/s)substrates (Fig. 5a, b) at 1day after plating (p < 0.0001).
123
Cardiomyocyte subdomain contractility arising 595
Fig. 3 Myofibril structural remodeling ofNRVM in response tomicro-post topography. Z-stack reconstruction of a cell plated on 100 kPa (a,c) or 400 kPa (b, d) at 3 days after plating. NRVM fixed and stainedfor myofibril structure (alpha-actinin, red), focal adhesions (paxillin,green) and nucleus (DAPI, blue). Posts are black holes in the upper
right region of the cells. e NRVM is capable of displacing a 100-kPamicropost, arrows. f NRVM does not displace 400-kPa microposts,arrow. a–dDistance scale = 20µm. e, fDistance scale = 15µm, timescale = 1 s
3.6 Shortening, shortening velocity influenced by substratetopography
The influence of stiffness from the external static load wasmeasured for NRVM for one and 3days after plating. Short-ening and shortening velocity decreased for NRVM onmicropost topography between 1day (1.08 ± 0.05µm at4.75 ± 0.25µm/s) and 3days (1.04 ± 0.04µm at 3.85 ±0.29µm/s) after plating (p < 0.0001) (Fig. 5c, d). Similarly,NRVMs plated on flat substrates had decreased shorteningand shortening velocity from 1day (0.84±0.04µmat 3.41±0.16µm/s) to 3 days (0.72± 0.03µm at 2.36± 0.17µm/s)after plating (p < 0.0001) (Fig. 4c, d). The decrease in theseactive tension components relate to the increase of the passivetension along the myofibril down to the actin stress cable.
3.7 Normalizing shortening, shortening velocity
Normalization of the maximum shortening and shorteningvelocity were calculated with respect to the total lengthof the myofibril to compensate for possible changes due
to cell size (Fig. 5e–h). Normalization did not affect con-clusions of the absolute measures (Fig. 5a–d). At 1daymaturation after plating, the percent of maximum short-ening (Fig. 5e) remained greatest on soft posts (2.62 ±0.08%) compared to soft flat (1.78 ± 0.08%), stiff posts(1.76 ± 0.09%) or stiff flat (1.03 ± 0.04%) substrates(p < 0.0001). Similarly, the percent of maximum short-ening velocity (Fig. 5f) remained greatest on soft posts(11.47± 0.46%) compared to soft flat (7.28± 0.37%), stiffposts (7.52 ± 0.46%) or stiff flat (3.18± 0.28%) substrates(p < 0.0001).
Similarly, the normalized data for maximum shorteningand shortening velocity for NRVMs on 100-kPa micropostremained significantly different from 1 to 3 days after plat-ing (p < 0.0001) (Fig. 5g, h). The topography decreasedmaximum shortening and shortening velocity between 1 dayafter plating (2.62 ± 0.08 and 11.47 ± 0.46%) and 3 daysafter plating (1.79± 0.11 and 7.05± 0.76%). Likewise, thenormalized data for the maximum shortening and shorteningvelocity for NRVMs on 100 kPa flat topography decreasedbetween 1 day after plating (1.78± 0.08 and 7.28± 0.37%)
123
596 K. M. Broughton, B. Russell
Fig. 4 NRVMs grow at a similar rate over time on micropost and flatsubstrata. a Major myofibril length after 1day of growth is similar forNRVMs plated on either 100 or 400 kPa of micropost or flat substrata. bMajor myofibril length after 3days of growth is statistically significantover time but not significant for themicropost or flat substrates. cNRVMsurface area growth was also found to not be statistically different rel-
ative to substrate surface plated upon but relative to time. d Paxillinlocalized more around 100kPa compared to 400kPa microposts after3days of growth (p = 0.08). a, b N = 15 cells per condition from 3experiments; c, d n = 7 = 8 cells per condition from 3 experiments.Statistical significance: **p < 0.01; ***p < 0.0001
Fig. 5 NRVM shortening and shortening velocity is improved with3D micropost configuration. aMaximum shortening 1 day after platingindicates NRVMs on softer, topography structures shorten the greatest,whereas NRVMs on flat stiff substrates shorten the least. b NRVMsshortening velocity performance is similarly related to shortening. cMaximum shortening 3 days after plating indicates NRVMs shortensimilarly to that found 1 day after plating. d NRVMs shortening veloc-
ity decreases over time between one and 3days after plating. e–hNRVMshortening and shortening velocity normalized to the length of themyofibril demonstrate functional improvement when cells are config-ured in three dimensions with softer microposts. a–h N = 15 cells percondition with 3 contraction samples per cell for line scans. Statisticalsignificance: ***p < 0.0001
123
Cardiomyocyte subdomain contractility arising 597
to 3days after plating (0.98 ± 0.05 and 3.26 ± 0.30%)(p < 0.001).
3.8 Cardiomyocyte micromechanics are subdomainregulated
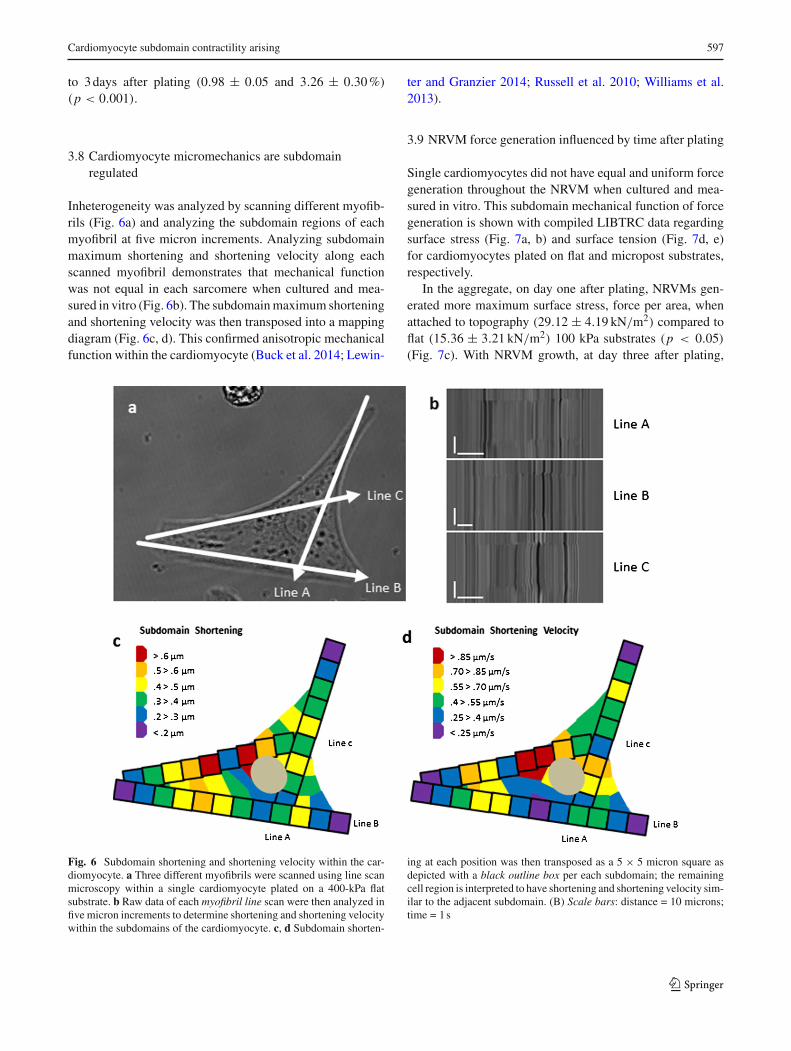
Inheterogeneity was analyzed by scanning different myofib-rils (Fig. 6a) and analyzing the subdomain regions of eachmyofibril at five micron increments. Analyzing subdomainmaximum shortening and shortening velocity along eachscanned myofibril demonstrates that mechanical functionwas not equal in each sarcomere when cultured and mea-sured in vitro (Fig. 6b). The subdomainmaximum shorteningand shortening velocity was then transposed into a mappingdiagram (Fig. 6c, d). This confirmed anisotropic mechanicalfunction within the cardiomyocyte (Buck et al. 2014; Lewin-
ter and Granzier 2014; Russell et al. 2010; Williams et al.2013).
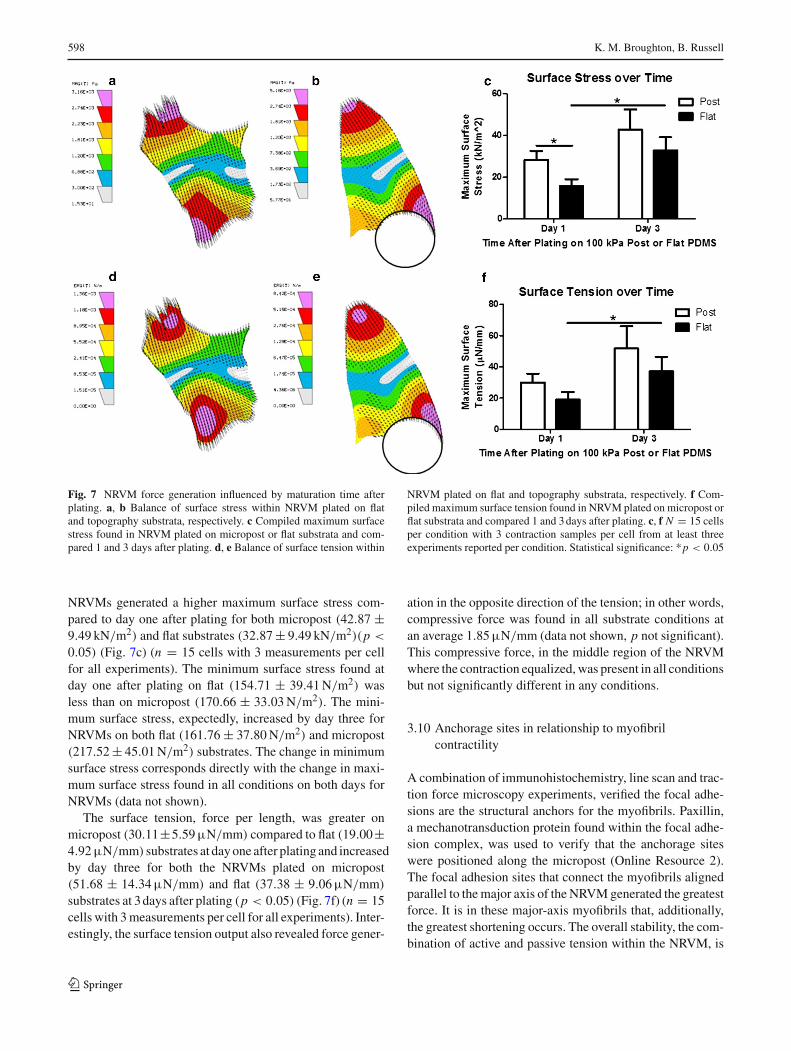
3.9 NRVM force generation influenced by time after plating
Single cardiomyocytes did not have equal and uniform forcegeneration throughout the NRVM when cultured and mea-sured in vitro. This subdomain mechanical function of forcegeneration is shown with compiled LIBTRC data regardingsurface stress (Fig. 7a, b) and surface tension (Fig. 7d, e)for cardiomyocytes plated on flat and micropost substrates,respectively.
In the aggregate, on day one after plating, NRVMs gen-erated more maximum surface stress, force per area, whenattached to topography (29.12 ± 4.19 kN/m2) compared toflat (15.36 ± 3.21 kN/m2) 100 kPa substrates (p < 0.05)(Fig. 7c). With NRVM growth, at day three after plating,
Fig. 6 Subdomain shortening and shortening velocity within the car-diomyocyte. a Three different myofibrils were scanned using line scanmicroscopy within a single cardiomyocyte plated on a 400-kPa flatsubstrate. b Raw data of each myofibril line scan were then analyzed infive micron increments to determine shortening and shortening velocitywithin the subdomains of the cardiomyocyte. c, d Subdomain shorten-
ing at each position was then transposed as a 5 × 5 micron square asdepicted with a black outline box per each subdomain; the remainingcell region is interpreted to have shortening and shortening velocity sim-ilar to the adjacent subdomain. (B) Scale bars: distance = 10 microns;time = 1s
123
598 K. M. Broughton, B. Russell
Fig. 7 NRVM force generation influenced by maturation time afterplating. a, b Balance of surface stress within NRVM plated on flatand topography substrata, respectively. c Compiled maximum surfacestress found in NRVM plated on micropost or flat substrata and com-pared 1 and 3 days after plating. d, e Balance of surface tension within
NRVM plated on flat and topography substrata, respectively. f Com-piled maximum surface tension found in NRVM plated on micropost orflat substrata and compared 1 and 3days after plating. c, f N = 15 cellsper condition with 3 contraction samples per cell from at least threeexperiments reported per condition. Statistical significance: *p < 0.05
NRVMs generated a higher maximum surface stress com-pared to day one after plating for both micropost (42.87 ±9.49 kN/m2) and flat substrates (32.87± 9.49 kN/m2)(p <
0.05) (Fig. 7c) (n = 15 cells with 3 measurements per cellfor all experiments). The minimum surface stress found atday one after plating on flat (154.71 ± 39.41N/m2) wasless than on micropost (170.66 ± 33.03N/m2). The mini-mum surface stress, expectedly, increased by day three forNRVMs on both flat (161.76 ± 37.80N/m2) and micropost(217.52± 45.01N/m2) substrates. The change in minimumsurface stress corresponds directly with the change in maxi-mum surface stress found in all conditions on both days forNRVMs (data not shown).
The surface tension, force per length, was greater onmicropost (30.11±5.59µN/mm) compared to flat (19.00±4.92µN/mm) substrates at dayone after plating and increasedby day three for both the NRVMs plated on micropost(51.68 ± 14.34µN/mm) and flat (37.38 ± 9.06µN/mm)
substrates at 3days after plating (p < 0.05) (Fig. 7f) (n = 15cells with 3measurements per cell for all experiments). Inter-estingly, the surface tension output also revealed force gener-
ation in the opposite direction of the tension; in other words,compressive force was found in all substrate conditions atan average 1.85µN/mm (data not shown, p not significant).This compressive force, in the middle region of the NRVMwhere the contraction equalized,was present in all conditionsbut not significantly different in any conditions.
3.10 Anchorage sites in relationship to myofibrilcontractility
A combination of immunohistochemistry, line scan and trac-tion force microscopy experiments, verified the focal adhe-sions are the structural anchors for the myofibrils. Paxillin,a mechanotransduction protein found within the focal adhe-sion complex, was used to verify that the anchorage siteswere positioned along the micropost (Online Resource 2).The focal adhesion sites that connect the myofibrils alignedparallel to themajor axis of the NRVMgenerated the greatestforce. It is in these major-axis myofibrils that, additionally,the greatest shortening occurs. The overall stability, the com-bination of active and passive tension within the NRVM, is
123
Cardiomyocyte subdomain contractility arising 599
therefore anchored at the focal adhesion sites. Although thesecontractility principles occurred in all the cardiomyocytes,most NRVMs demonstrated localized variability between themaximum andminimum force generation within the NRVM,suggesting that cellular mechanics and the balance of forcesare locally regulated.
3.11 Focal adhesion displacement related to subdomainmicromechanics
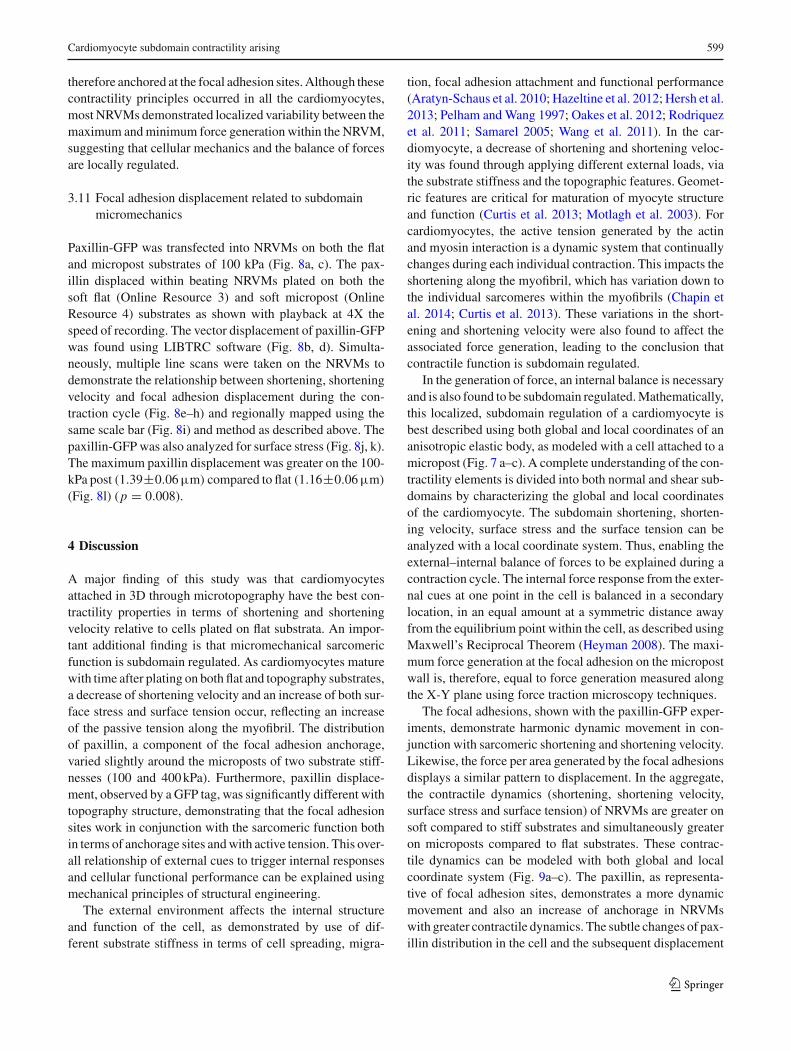
Paxillin-GFP was transfected into NRVMs on both the flatand micropost substrates of 100 kPa (Fig. 8a, c). The pax-illin displaced within beating NRVMs plated on both thesoft flat (Online Resource 3) and soft micropost (OnlineResource 4) substrates as shown with playback at 4X thespeed of recording. The vector displacement of paxillin-GFPwas found using LIBTRC software (Fig. 8b, d). Simulta-neously, multiple line scans were taken on the NRVMs todemonstrate the relationship between shortening, shorteningvelocity and focal adhesion displacement during the con-traction cycle (Fig. 8e–h) and regionally mapped using thesame scale bar (Fig. 8i) and method as described above. Thepaxillin-GFPwas also analyzed for surface stress (Fig. 8j, k).The maximum paxillin displacement was greater on the 100-kPa post (1.39±0.06µm) compared to flat (1.16±0.06µm)
(Fig. 8l) (p = 0.008).
4 Discussion
A major finding of this study was that cardiomyocytesattached in 3D through microtopography have the best con-tractility properties in terms of shortening and shorteningvelocity relative to cells plated on flat substrata. An impor-tant additional finding is that micromechanical sarcomericfunction is subdomain regulated. As cardiomyocytes maturewith time after plating on both flat and topography substrates,a decrease of shortening velocity and an increase of both sur-face stress and surface tension occur, reflecting an increaseof the passive tension along the myofibril. The distributionof paxillin, a component of the focal adhesion anchorage,varied slightly around the microposts of two substrate stiff-nesses (100 and 400kPa). Furthermore, paxillin displace-ment, observed by a GFP tag, was significantly different withtopography structure, demonstrating that the focal adhesionsites work in conjunction with the sarcomeric function bothin terms of anchorage sites andwith active tension. This over-all relationship of external cues to trigger internal responsesand cellular functional performance can be explained usingmechanical principles of structural engineering.
The external environment affects the internal structureand function of the cell, as demonstrated by use of dif-ferent substrate stiffness in terms of cell spreading, migra-
tion, focal adhesion attachment and functional performance(Aratyn-Schaus et al. 2010; Hazeltine et al. 2012; Hersh et al.2013; Pelham and Wang 1997; Oakes et al. 2012; Rodriquezet al. 2011; Samarel 2005; Wang et al. 2011). In the car-diomyocyte, a decrease of shortening and shortening veloc-ity was found through applying different external loads, viathe substrate stiffness and the topographic features. Geomet-ric features are critical for maturation of myocyte structureand function (Curtis et al. 2013; Motlagh et al. 2003). Forcardiomyocytes, the active tension generated by the actinand myosin interaction is a dynamic system that continuallychanges during each individual contraction. This impacts theshortening along the myofibril, which has variation down tothe individual sarcomeres within the myofibrils (Chapin etal. 2014; Curtis et al. 2013). These variations in the short-ening and shortening velocity were also found to affect theassociated force generation, leading to the conclusion thatcontractile function is subdomain regulated.
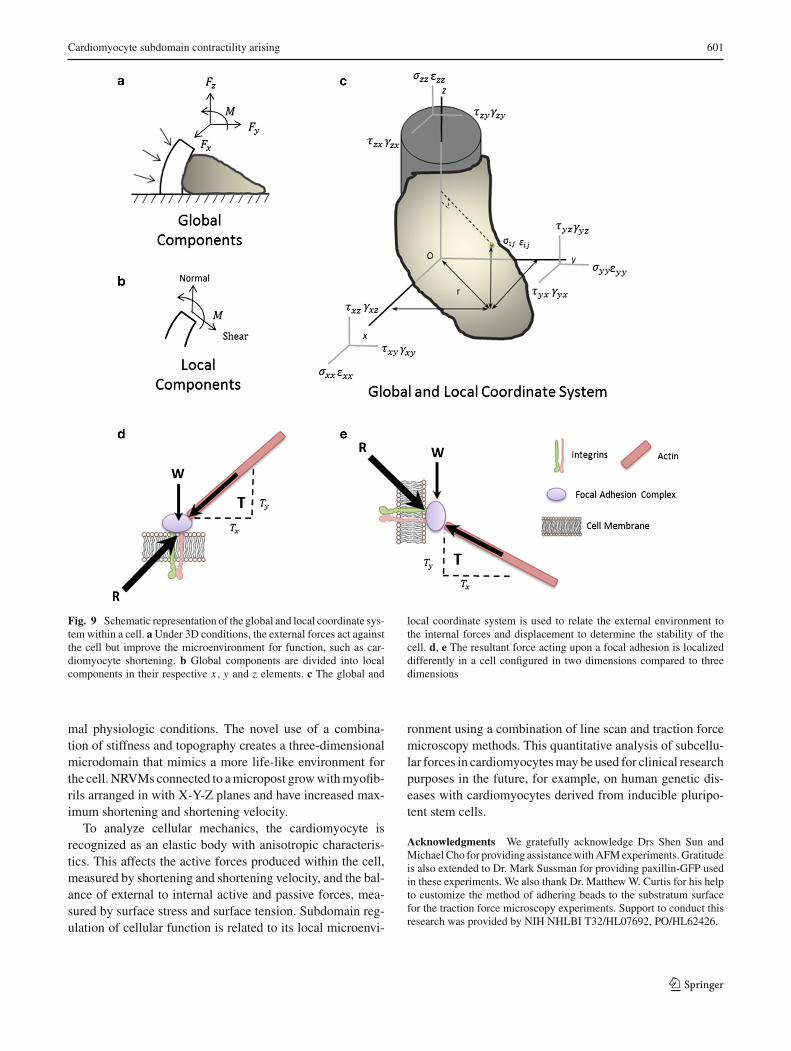
In the generation of force, an internal balance is necessaryand is also found to be subdomain regulated.Mathematically,this localized, subdomain regulation of a cardiomyocyte isbest described using both global and local coordinates of ananisotropic elastic body, as modeled with a cell attached to amicropost (Fig. 7 a–c). A complete understanding of the con-tractility elements is divided into both normal and shear sub-domains by characterizing the global and local coordinatesof the cardiomyocyte. The subdomain shortening, shorten-ing velocity, surface stress and the surface tension can beanalyzed with a local coordinate system. Thus, enabling theexternal–internal balance of forces to be explained during acontraction cycle. The internal force response from the exter-nal cues at one point in the cell is balanced in a secondarylocation, in an equal amount at a symmetric distance awayfrom the equilibrium point within the cell, as described usingMaxwell’s Reciprocal Theorem (Heyman 2008). The maxi-mum force generation at the focal adhesion on the micropostwall is, therefore, equal to force generation measured alongthe X-Y plane using force traction microscopy techniques.
The focal adhesions, shown with the paxillin-GFP exper-iments, demonstrate harmonic dynamic movement in con-junction with sarcomeric shortening and shortening velocity.Likewise, the force per area generated by the focal adhesionsdisplays a similar pattern to displacement. In the aggregate,the contractile dynamics (shortening, shortening velocity,surface stress and surface tension) of NRVMs are greater onsoft compared to stiff substrates and simultaneously greateron microposts compared to flat substrates. These contrac-tile dynamics can be modeled with both global and localcoordinate system (Fig. 9a–c). The paxillin, as representa-tive of focal adhesion sites, demonstrates a more dynamicmovement and also an increase of anchorage in NRVMswith greater contractile dynamics. The subtle changes of pax-illin distribution in the cell and the subsequent displacement
123
600 K. M. Broughton, B. Russell
Fig. 8 Paxillin displacement related to subdomain contractility. a, cPaxillin-GFP was transfected into NRVMs plated on 100 kPa flat ormicropost (P) topography substrata, respectively, and measured after3days of growth. b, d Paxillin-GFP displacement was measured usingLIBTRCsoftware. e–hLine scanswere taken tomeasure shortening andshortening velocity in the same cell. i Using an identical scale, short-ening velocity was greater in the NRVM plated on micropost topog-raphy. j, k Force per area within NRVMs was greater in subdomain
regions where paxillin-GFP displaced and shortening/shortening veloc-ity was more active, as defined with a surface stress magnitude similarto that observed using microbeads. lMaximum paxillin-GFP displace-ment was greater in NRVMs configured on microposts compared to flatsubstrates, N = 10 cells with 3 contraction samples per cell from atleast three experiments reported per condition. Statistical significance:**p = 0.008
of the focal adhesions during contraction show a correla-tion between anchorage formation and the relationship withrespect to myofibril subdomain structure and function. Thus,the counterbalance of forces between the external load actingthrough the focal adhesions and the internal force generatedby myofibrils in the cardiomyocyte permits feedback andinterplay of structures and their function resulting in subdo-main reorganization within the cell (Fig. 9d, e).
Physiologically, the balance of forces acting upon andwithin the cardiomyocyte is critical for effective function.When the mechanics within subcellular zones of muscle cellare asynchronous, the shear stress increases and disruptsthe overall myofibril architecture (Yu and Russell 2005). Inresponse, the muscle and/or the surrounding connective tis-sues may attempt to balance the internal force by myofibril
assembly and/or by increasing thematrix stiffness externally.Local imbalance, however, may lead to a downstream effectof calcium sparking and eventually to cardiac arrhythmia orheart failure (Cheng andLederer 2008). Structuralmechanicsmay further the advancement for understanding the relation-ship between cellular form and function.
5 Summary
Mechanical attributes of the cardiomyocyte are critical tounderstand the functional mechanisms in which the cellbehaves and responds to its surrounding microenvironment.With changing substrate stiffness, results show that car-diomyocytes contract better on substrates that mimic nor-
123
Cardiomyocyte subdomain contractility arising 601
Fig. 9 Schematic representation of the global and local coordinate sys-tem within a cell. aUnder 3D conditions, the external forces act againstthe cell but improve the microenvironment for function, such as car-diomyocyte shortening. b Global components are divided into localcomponents in their respective x, y and z elements. c The global and
local coordinate system is used to relate the external environment tothe internal forces and displacement to determine the stability of thecell. d, e The resultant force acting upon a focal adhesion is localizeddifferently in a cell configured in two dimensions compared to threedimensions
mal physiologic conditions. The novel use of a combina-tion of stiffness and topography creates a three-dimensionalmicrodomain that mimics a more life-like environment forthe cell. NRVMs connected to amicropost growwithmyofib-rils arranged in with X-Y-Z planes and have increased max-imum shortening and shortening velocity.
To analyze cellular mechanics, the cardiomyocyte isrecognized as an elastic body with anisotropic characteris-tics. This affects the active forces produced within the cell,measured by shortening and shortening velocity, and the bal-ance of external to internal active and passive forces, mea-sured by surface stress and surface tension. Subdomain reg-ulation of cellular function is related to its local microenvi-
ronment using a combination of line scan and traction forcemicroscopy methods. This quantitative analysis of subcellu-lar forces in cardiomyocytesmay be used for clinical researchpurposes in the future, for example, on human genetic dis-eases with cardiomyocytes derived from inducible pluripo-tent stem cells.
Acknowledgments We gratefully acknowledge Drs Shen Sun andMichael Cho for providing assistancewithAFMexperiments. Gratitudeis also extended to Dr. Mark Sussman for providing paxillin-GFP usedin these experiments. We also thank Dr. MatthewW. Curtis for his helpto customize the method of adhering beads to the substratum surfacefor the traction force microscopy experiments. Support to conduct thisresearch was provided by NIH NHLBI T32/HL07692, PO/HL62426.
123
602 K. M. Broughton, B. Russell
References
Aratyn-Schaus Y, Oakes PW, Stricker J, Winter SP, Gardel ML (2010)Preparation of complaint matrices for quantifying cellular contrac-tion. J Vis Exp 46(Pii):2173
Berk BC, Fujiwara K, Lehoux S (2007) ECM remodeling in hyperten-sive heart disease. J Clin Invest 117(3):568–575
Berry MF, Engler AJ, Woo YJ, Pirolli TJ, Bish LT, Jayasankar V,Morine KJ, Gardner TJ, Discher DE, Sweeney HL (2006) Mes-enchymal stem cell injection after myocardial infarction improvesmyocardial compliance. Am J Physiol Heart Circ Physiol 290(6):H2196–H2203
Bhana B, Iyer RK, Chen WL, Zhao R, Sider KL, LikhitpanichkulM, Simmons CA, Radisic M (2010) Influence of substrate stiff-ness on the phenotype of heart cells. Biotechnol Bioeng 105(6):1148–1160
Boateng SY, Hartman TJ, Ahluwalia N, Vidula H, Desai TA, RussellB (2003) Inhibition of fibroblast proliferation in cardiac myocytecultures by surface microtopography. Am J Physiol Cell Physiol285(1):C171–C182
Borbely A, van der Velden J, Papp Z, Bronzwaer JGF, Edes I, StienenGJM, PaulusWJ (2005) Cardiomyocyte stiffness in diastolic heartfailure. Circulation 111:774–781
Buck D, Smith JE III, Chung CS, Ono Y, Sorimachi H, Labeit S,Granzier HL (2014) Removal of immunoglobulin-like domainsfrom titin’s spring segment alters titin splicing in mouse skeletalmuscle and causes myopathy. J Gen Physiol 143(2):215–230
Chapin LM, Edgar LT, Blankman E, Beckerle MC, Shiu YT (2014)Mathematical modeling of the dynamic mechanical behavior ofneighboring sarcomeres in actin stress fibers. Cell Mol Bioeng7(1):73–85
Cheng H, Lederer WJ (2008) Calcium sparks. Physiol Rev 88(4):1491–1545
Chu M, Iyengar R, Koshman YE, Kim T, Russell B, Martin JL, HerouxAL, Robia SL, Samarel AM (2011) Serine-910 phosphorylationof focal adhesion kinase is critical for sarcomere reorganization incardiomyocyte hypertrophy. Cardiovasc Res 92:409–419
Curtis MW, Budyn E, Desai TA, Samarel AM, Russell B (2013)Microdomain heterogeneity in 3D affects the mechanics of neona-tal cardiac myocyte contraction. Biomech Model Mechanobiol12(1):95–109
Discher DE, Janmey P, Wang YL (2005) Tissue cells feel and respondto the stiffness of their substrate. Science 310:1139–1143
Engler AJ, Carag-Krieger C, Johnson CP, Raab M, Tang HY, SpeicherDW, Sanger JW, Sanger JM, Discher DE (2008) Embryonic car-diomyocytes beat best on a matrix with heartlike elasticity: scar-like rigidity inhibits beating. J Cell Sci 121(Pt 22):3794–3802
FomovskyGM,Holmes JW (2010) Evolution of scar structure,mechan-ics, and ventricular function after myocardial infarction in the rat.Am J Physiol Heart Circ Physiol 298(1):H221–H228
Fomovsky GM, Thomopoulos S, Holmes JW (2010) Contribution ofextracellular matrix to the mechanical properties of the heart. JMol Cell Cardiol 48(3):490–496
Go AS, Mozaffarina D, Roger VL, Benjamin EJ, Berry JD, BlahaMJ, Stroke SS (2014) Heart disease and stroke statistics—2014update: a report from the American Heart Association. Circula-tion 129(3):e28
Hanft LM, Korte FS, McDonald KS (2008) Cardiac function and mod-ulation of sarcomeric function by length. Cardiovasc Res 77(4):627–636
Hazeltine LB, Simmons CS, Salick MR, Lian X, Badur MG, Han W,Delgado SM, Wakatsuki T, Crone WC, Pruitt BL, Palecek SP(2012) Effects of substratemechanics on contractility of cardiomy-ocytes generated from human pluripotent stem cells. Int J Cell Biol2012:508294
Hersh N,Wolters B, Dreissen G, Springer R, Kirchgebner N, Merkel R,Hoffman B (2013) The constant beat: cardiomyocytes adapt theirforces by equal contraction upon environmental stiffening. BiolOpen 2(3):351–361
Heyman J (2008) Basic structural theory. Cambridge University Press,Cambridge
Holmes JW, Borg TK, Covell JW (2005) Structure and mechanics ofhealing myocardial infarcts. Annu Rev Biomed Eng 7:223–253
Jacot JG, McCulloch AD, Omens JH (2008) Substrate stiffness affectsthe functional maturation of neonatal rat ventricular myocytes.Biophys J 95(7):3479–3487
Lateef SS, Boateng S, Ahluwalia N, Hartman TJ, Russell B, HanleyL (2005) Three-dimensional chemical structures by protein func-tionalized micron-sized beads bound to polylysine-coated siliconesurfaces. J Biomed Mater Res A 72(4):373–380
Lewinter MM, Granzier HL (2014) Cardiac titin and heart disease. JCardiovasc Pharmacol 63(3):207–212
Melendez J, Turner C, Avraham H, Steinberg SF, Schaefer E,Sussman MA (2004) Cardiomyocyte apoptosis triggered byRAFTK/pyk2 via Src kinase is antagonized by paxillin. J BiolChem 279(51):53516–53523
Motlagh D, Senyo SE, Desai TA, Russell B (2003) Microtextured sub-strata alter gene expression, protein localization and the shape ofcardiac myocytes. Biomaterials 24(14):2463–2476
Oakes PW, Beckham Y, Stricker J, Gardel ML (2012) Tension isrequired but not sufficient for focal adhesion maturation without astress fiber template. J Cell Biol 196(3):363–374
Omens JH (1998) Stress and strain as regulators of myocardial growth.Prog Biophys Mol Biol 69(2–3):559–572
Pelham RJ, Wang YL (1997) Cell locomotion and focal adhesionsare regulated by substrate flexibility. Proc Natl Acad Sci 94:13661–13665
Rodriquez AG, Han SJ, RegnierM, Sniadecki NJ (2011) Substrate stiff-ness increases twitch power of neonatal cardiomyocytes in correla-tion with changes in myofibril structure and intracellular calcium.Biophys J 101(10):2455–2464
Russell B, Curtis MW, Koshman YE, Samarel AM (2010) Mechanicalstress-induced sarcomere assembly for cardiac muscle growth inlength and width. J Mol Cell Cardiol 48(5):817–823
Samarel AM (2005) Costameres, focal adhesions, and cardiomy-ocyte mechanotransduction. Am J Physiol Heart Circ Physiol289(6):H2291–H2301
Solaro RJ, deTombe P (2008) Review focus series: sarcomeric proteinsas key elements in integrated control of cardiac function. Cardio-vasc Res 77(4):616–618
Wang PY, Yu J, Lin JH, Tsai WB (2011) Modulation of alignment,elongation and contraction of cardiomyocyte through a combina-tion of nanotopography and rigidity of substrates. Acta Biomater7(9):3285–3293
Williams CD, Salcedo MK, Irving TC, Regnier M, Daniel TL (2013)The length-tension curve in muscle depends on lattice spacing.Proc Biol Sci 280(1776):20130697
Yu J, Russell B (2005) Cardiomyocyte remodeling and sarcomere addi-tion after uniaxial static strain in vitro. J Histochem Cytochem53(7):839–844
123