carcinoma of the corpus uteri carcinoma of the corpus uteri...
TRANSCRIPT
79
Carcinoma of the Corpus Uteri
WT CREASMAN, F ODICINO, P MAISONNEUVE, U BELLER, JL BENEDET, APM HEINTZ, HYS NGANand S PECORELLI
STAGING
Anatomy
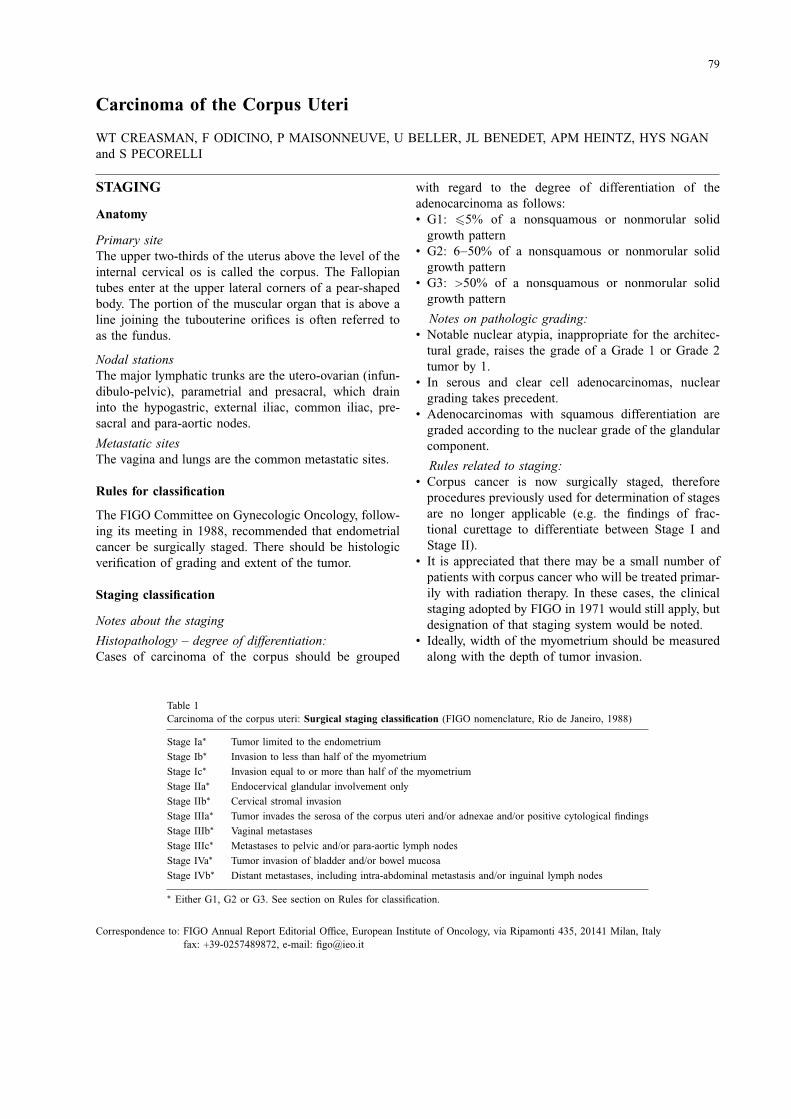
Primary siteThe upper two-thirds of the uterus above the level of theinternal cervical os is called the corpus. The Fallopiantubes enter at the upper lateral corners of a pear-shapedbody. The portion of the muscular organ that is above aline joining the tubouterine orifices is often referred toas the fundus.
Nodal stationsThe major lymphatic trunks are the utero-ovarian (infun-dibulo-pelvic), parametrial and presacral, which draininto the hypogastric, external iliac, common iliac, pre-sacral and para-aortic nodes.
Metastatic sitesThe vagina and lungs are the common metastatic sites.
Rules for classification
The FIGO Committee on Gynecologic Oncology, follow-ing its meeting in 1988, recommended that endometrialcancer be surgically staged. There should be histologicverification of grading and extent of the tumor.
Staging classification
Notes about the staging
Histopathology – degree of differentiation:Cases of carcinoma of the corpus should be grouped
with regard to the degree of differentiation of theadenocarcinoma as follows:• G1: �5% of a nonsquamous or nonmorular solidgrowth pattern
• G2: 6−50% of a nonsquamous or nonmorular solidgrowth pattern
• G3: >50% of a nonsquamous or nonmorular solidgrowth pattern
Notes on pathologic grading:• Notable nuclear atypia, inappropriate for the architec-tural grade, raises the grade of a Grade 1 or Grade 2tumor by 1.
• In serous and clear cell adenocarcinomas, nucleargrading takes precedent.
• Adenocarcinomas with squamous differentiation aregraded according to the nuclear grade of the glandularcomponent.
Rules related to staging:• Corpus cancer is now surgically staged, thereforeprocedures previously used for determination of stagesare no longer applicable (e.g. the findings of frac-tional curettage to differentiate between Stage I andStage II).
• It is appreciated that there may be a small number ofpatients with corpus cancer who will be treated primar-ily with radiation therapy. In these cases, the clinicalstaging adopted by FIGO in 1971 would still apply, butdesignation of that staging system would be noted.
• Ideally, width of the myometrium should be measuredalong with the depth of tumor invasion.
Table 1Carcinoma of the corpus uteri: Surgical staging classification (FIGO nomenclature, Rio de Janeiro, 1988)
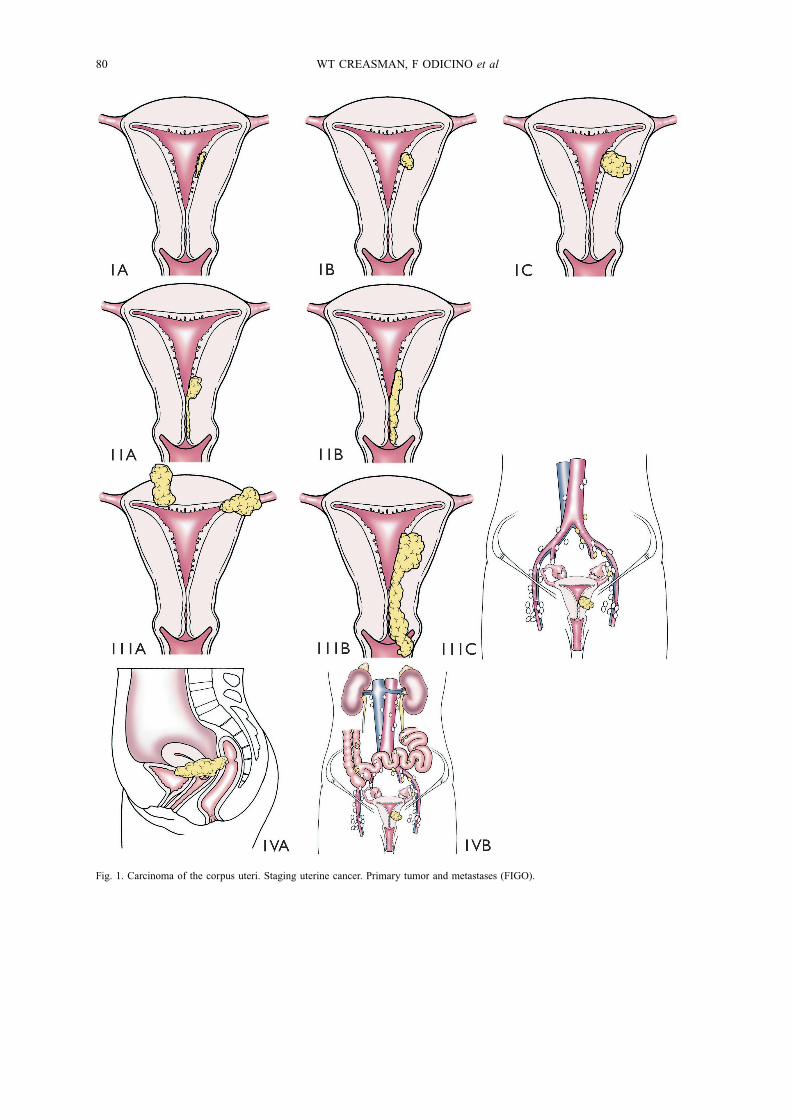
Stage Ia° Tumor limited to the endometrium
Stage Ib° Invasion to less than half of the myometrium
Stage Ic° Invasion equal to or more than half of the myometrium
Stage IIa° Endocervical glandular involvement only
Stage IIb° Cervical stromal invasion
Stage IIIa° Tumor invades the serosa of the corpus uteri and/or adnexae and/or positive cytological findings
Stage IIIb° Vaginal metastases
Stage IIIc° Metastases to pelvic and/or para-aortic lymph nodes
Stage IVa° Tumor invasion of bladder and/or bowel mucosa
Stage IVb° Distant metastases, including intra-abdominal metastasis and/or inguinal lymph nodes
° Either G1, G2 or G3. See section on Rules for classification.
Correspondence to: FIGO Annual Report Editorial Office, European Institute of Oncology, via Ripamonti 435, 20141 Milan, Italyfax: +39-0257489872, e-mail: [email protected]
80 WT CREASMAN, F ODICINO et al
Fig. 1. Carcinoma of the corpus uteri. Staging uterine cancer. Primary tumor and metastases (FIGO).
CARCINOMA OF THE CORPUS UTERI 81
Table 2Carcinoma of the corpus uteri: Stage grouping for corpus uteri
FIGOstage
UICCT N M
0 Tis N0 M0
Ia T1a N0 M0
Ib T1b N0 M0
Ic T1c N0 M0
IIa T2a N0 M0
IIb T2b N0 M0
IIIa T3a N0 M0
IIIb T3b N0 M0
IIIc T1 N1 M0
T2 N1 M0
T3a N1 M0
T3b N1 M0
IVa T4 any N M0
IVb any T any N M1
Histopathology (according to WHO/ISGP1
classification)
All tumors are to be microscopically verified. Thehistopathologic types are:• Endometrioid carcinoma– Adenocarcinoma– Adenoacanthoma (adenocarcinoma with squamousmetaplasia)
– Adenosquamous carcinoma (mixed adenocarcinomaand squamous cell carcinoma)
• Mucinous adenocarcinoma• Papillary serous adenocarcinoma• Clear cell adenocarcinoma• Adenosquamous carcinoma
• Undifferentiated carcinoma• Mixed carcinoma
Histopathologic grade (G)• GX: Grade cannot be assessed• G1: Well differentiated• G2: Moderately differentiated• G3: Poorly or undifferentiated
DEFINITIONS OF TREATMENTS
Treatment definitions are given in Table 4.
DATA ANALYSIS
Summary and comments
The 25th Volume of the Annual Report (AR) noteda total of 8790 patients with corpus cancer submittedfor analysis. This is a substantial increase over the lasttwo volumes as the number of reporting institutionshave also increased. The reported data note that thecontinued acceptance of the 1988 FIGO staging haschanged reporting from clinical to surgical staging.Volume 21 was the first Annual Report after thestaging change and only 43% were surgically stagedcompared with 92% for this year (5% clinically stagedand 2% with missing data). It is appreciated that asmall number of patients may not be completely stageddue to obesity or comorbidities, but that number isvery small considering the patient population normallyseen with this malignancy. As previously documented,most (72%) patients with endometrial cancer have Stage Idisease when surgically staged compared with only 59%clinically staged (Fig. 2). Because the number of patients
Table 3Carcinoma of the corpus uteri: Clinical staging classification (1971) (no longer adopted for FIGO classification)
Stage 0 Atypical endometrial hyperplasia. Carcinoma in situ
Stage Ia The carcinoma is confined to the corpus and the length of the uterine cavity is �8 cm
Stage Ib The carcinoma is confined to the corpus and the length of the uterine cavity is >8 cm
Stage II The carcinoma has involved the corpus and the cervix, but has not extended outside the uterus
Stage III The carcinoma has extended outside the uterus, but not outside the true pelvis
Stage IVa The carcinoma has extended outside the uterus and involves the mucosa of the bladder or rectum (a bullous edema assuch does not permit the case to be allotted to Stage IV)
Stage IVb The carcinoma has extended outside the true pelvis and spreads to distant organs
1 ISGP, International Society of Gynecological Pathology
82 WT CREASMAN, F ODICINO et al
Table 4Carcinoma of the corpus uteri: Definitions of treatments
Treatment Definition
None No treatment
Surgery alone Surgery as first therapy and no other therapy(ies) within 90 days from the date of surgery. Subsequently,patients can be given any further treatment.
Radiotherapy alone External radiotherapy and/or intracavitary irradiation as first therapy(ies) and no other therapy(ies) within90 days from the end of teletherapy/brachytherapy. Subsequently, patients can be given any furthertreatment.
Radio-surgery Intracavitary irradiation and/or external radiotherapy as first therapy(ies) and then surgery within 60 daysfrom the end of brachytherapy/teletherapy. Subsequently, patients can be given any further treatment.
Surgery + adjuvant radiotherapy Surgery as first therapy and then external radiotherapy and/or intracavitary irradiation within 90 daysfrom the date of surgery. Subsequently, patients can be given any further treatment.
Surgery + adjuvant chemotherapy Surgery as first therapy and then chemotherapy within 90 days from the date of surgery.
Adjuvant hormonal therapy Surgery or radiotherapy or chemo-radiotherapy as first therapy and then hormonal therapy within 90 daysfrom the end of surgery/radiotherapy/chemo-radiotherapy. Subsequently, patients can be given any furthertreatment.
with clinical staging is very small, further references willmainly refer to those who were surgically staged.Multiple factors are again appreciated to be important
prognostically. Age increases with stage. Those patientsclinically staged were considerably older than thosesurgically staged which may explain the reason forclinical staging only in the older population. This almostdecade difference in age per stage is also present in thedata from Volume 24.Grade, and in particular myometrial invasion, appeared
to be related to stage as these prognostic factors increasewith age (Tables 12 and 14). Whether or not this is atime sequence in progression of disease or just a laterage occurrence is unknown.Endometrioid carcinoma histotype is present in 85%
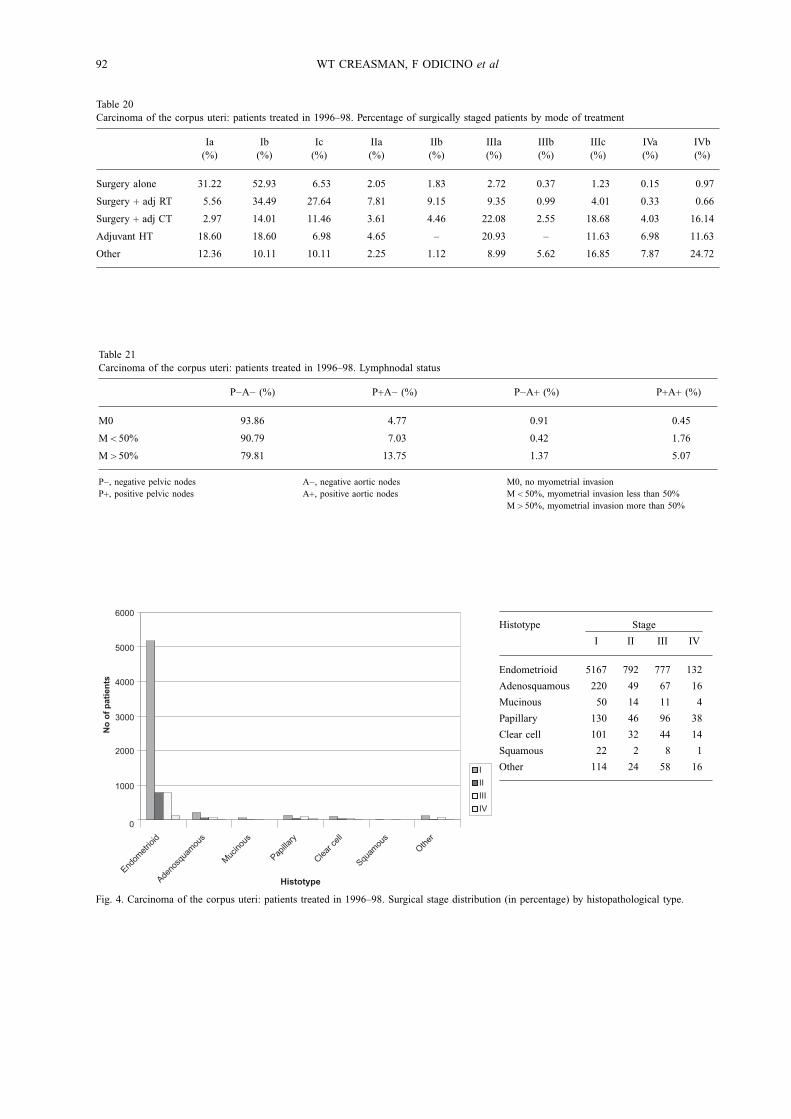
of patients reported (Table 17). Poor prognostic cell types(papillary and clear cell) represent only 6% of surgicallystaged patients, although the 501 reported cases probablyrepresent the largest reported number of these histotypes.Of all endometrioid types, 86% are early stage (I or II)compared with 57% for papillary and 70% with clear celltypes.Age has been appreciated as an important prognostic
factor. Younger patients at each stage have a considerablybetter prognosis than those who are older with thegreatest difference in those who are 80 years of age orolder (Table 18). The one exception is Stage IV in whichthe numbers are small, but even there an age differenceis present.In regards to treatment, the data suggest that as
stage increases adjunctive therapy in addition to surgeryis used (Tables 19, 20). It is interesting to note that
the use of postoperative radiation and chemotherapyremains relatively constant between data from Volumes24 and 25. Whether or not this will remain the samesubsequently, in view of the recent GOG data whichnote that chemotherapy appears to be more effective thanradiation therapy, remains to be seen.Since the classic surgical staging studies done in the
1970s and 1980s, lymph node metastasis has been amajor factor in staging and subsequent treatment inpatients with endometrial cancer. Nodal metastasis bothto the pelvic and para-aortic area are related to depthof the invasion and grade. Volume 25 data suggests thatthose patients with early disease (G1 endometrium only)may have metastasis to the pelvic nodes in 3.5% of caseswhere previous reports suggested it may be essentiallyzero. As grade and depth of invasion increases, thechance of pelvic and para-aortic node metastasis alsoincreases in a linear fashion (3.4% for G1, endometriumonly, to 28% in G3 deep muscle invasion) for pelvicnodes and a similar situation with para-aortic nodes butto a lesser degree (Tables 22−26).Survival is obviously stage related. This is true even
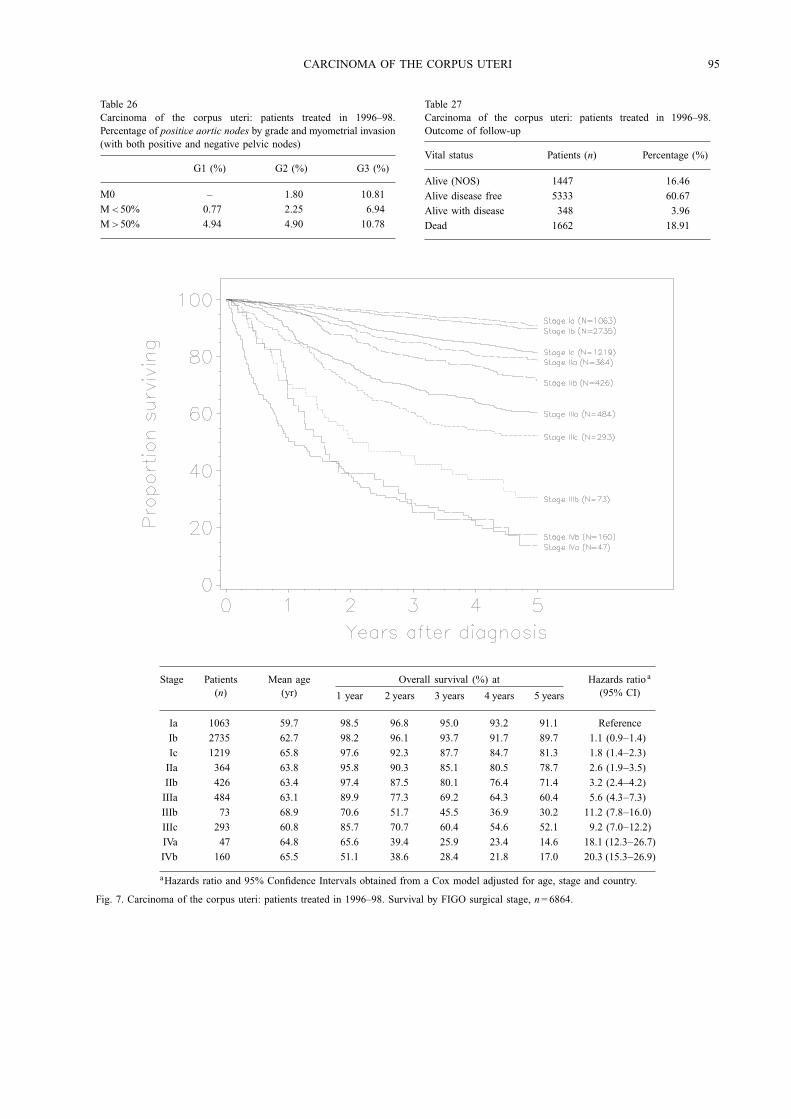
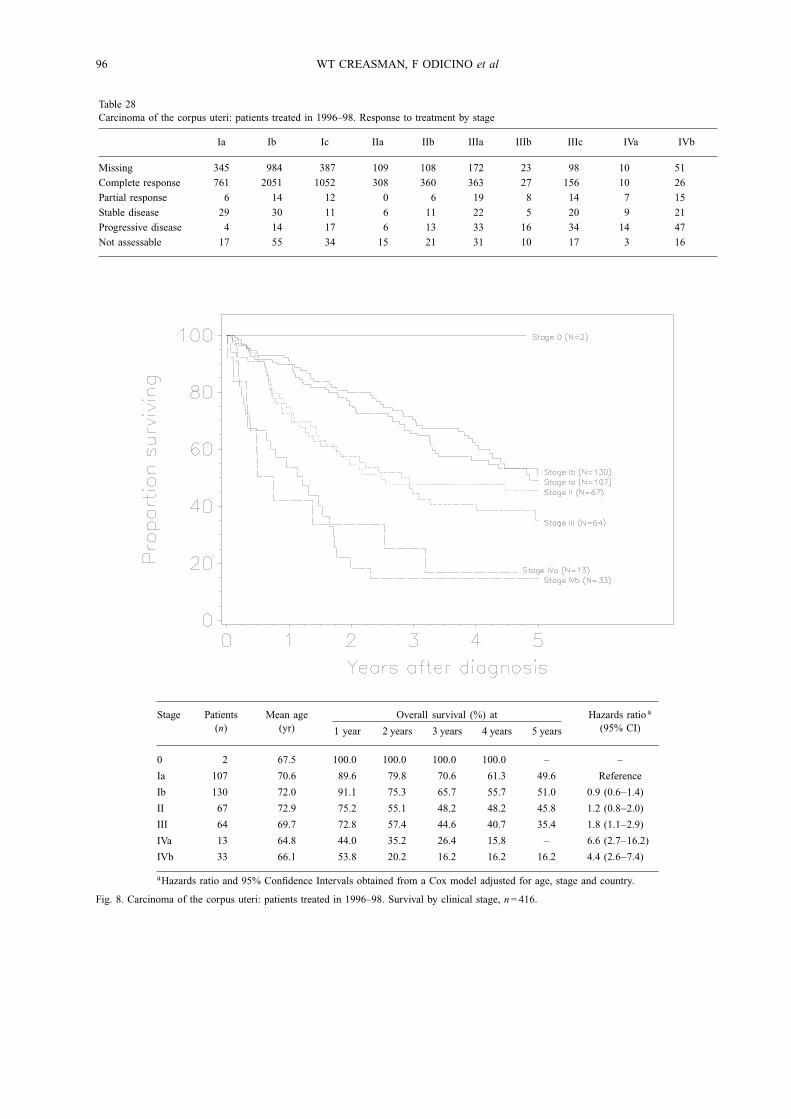
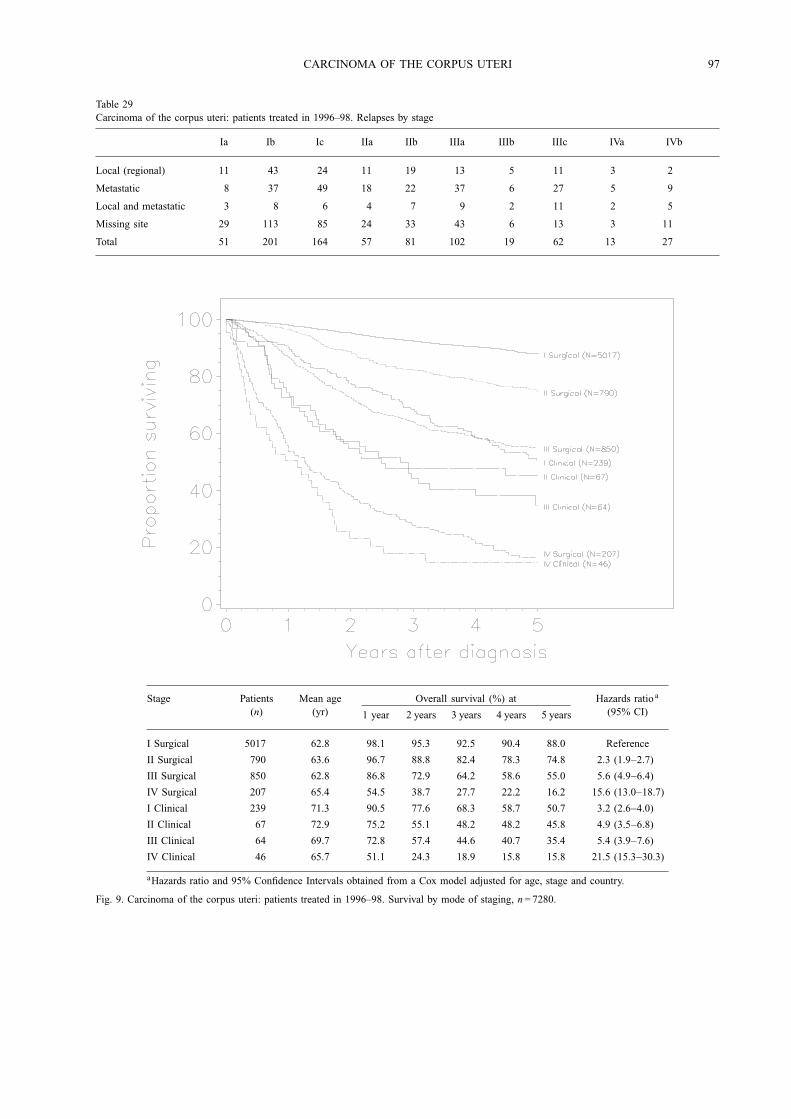
within a given stage (Fig. 7) as those with Stage Iahave a 91% 5-year survival compared with 81% forStage Ic. The importance of surgical staging is againnoted in comparison with clinical staging (Fig. 8). Stage Ipatients had a 5-year survival of 88% compared with only51% of those clinically staged. This strongly suggeststhat those who are clinically staged have occult diseasenot appreciated clinically. Well known data suggests thatabout 25% of clinical Stage I patients have disease extantto the uterus. This is also true for a grade within a given
CARCINOMA OF THE CORPUS UTERI 83
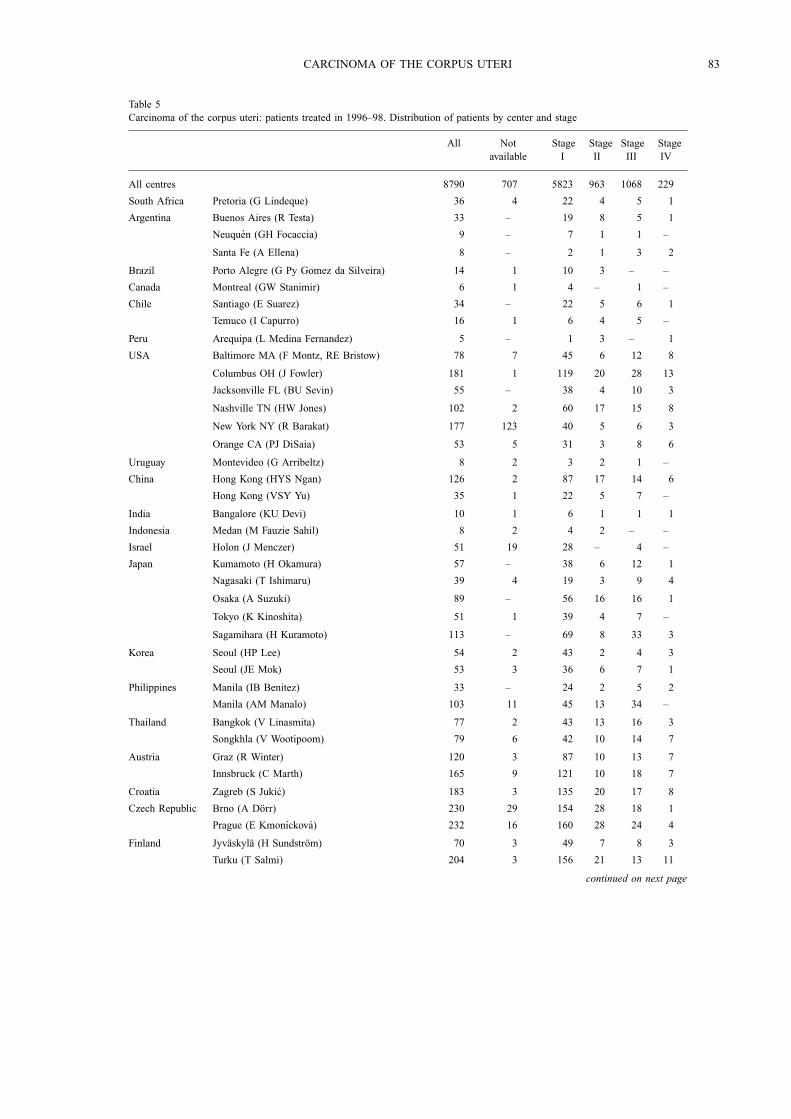
Table 5Carcinoma of the corpus uteri: patients treated in 1996–98. Distribution of patients by center and stage
All Notavailable
StageI
StageII
StageIII
StageIV
All centres 8790 707 5823 963 1068 229
South Africa Pretoria (G Lindeque) 36 4 22 4 5 1
Argentina Buenos Aires (R Testa) 33 – 19 8 5 1
Neuquen (GH Focaccia) 9 – 7 1 1 –
Santa Fe (A Ellena) 8 – 2 1 3 2
Brazil Porto Alegre (G Py Gomez da Silveira) 14 1 10 3 – –
Canada Montreal (GW Stanimir) 6 1 4 – 1 –
Chile Santiago (E Suarez) 34 – 22 5 6 1
Temuco (I Capurro) 16 1 6 4 5 –
Peru Arequipa (L Medina Fernandez) 5 – 1 3 – 1
USA Baltimore MA (F Montz, RE Bristow) 78 7 45 6 12 8
Columbus OH (J Fowler) 181 1 119 20 28 13
Jacksonville FL (BU Sevin) 55 – 38 4 10 3
Nashville TN (HW Jones) 102 2 60 17 15 8
New York NY (R Barakat) 177 123 40 5 6 3
Orange CA (PJ DiSaia) 53 5 31 3 8 6
Uruguay Montevideo (G Arribeltz) 8 2 3 2 1 –
China Hong Kong (HYS Ngan) 126 2 87 17 14 6
Hong Kong (VSY Yu) 35 1 22 5 7 –
India Bangalore (KU Devi) 10 1 6 1 1 1
Indonesia Medan (M Fauzie Sahil) 8 2 4 2 – –
Israel Holon (J Menczer) 51 19 28 – 4 –
Japan Kumamoto (H Okamura) 57 – 38 6 12 1
Nagasaki (T Ishimaru) 39 4 19 3 9 4
Osaka (A Suzuki) 89 – 56 16 16 1
Tokyo (K Kinoshita) 51 1 39 4 7 –
Sagamihara (H Kuramoto) 113 – 69 8 33 3
Korea Seoul (HP Lee) 54 2 43 2 4 3
Seoul (JE Mok) 53 3 36 6 7 1
Philippines Manila (IB Benitez) 33 – 24 2 5 2
Manila (AM Manalo) 103 11 45 13 34 –
Thailand Bangkok (V Linasmita) 77 2 43 13 16 3
Songkhla (V Wootipoom) 79 6 42 10 14 7
Austria Graz (R Winter) 120 3 87 10 13 7
Innsbruck (C Marth) 165 9 121 10 18 7
Croatia Zagreb (S Jukic) 183 3 135 20 17 8
Czech Republic Brno (A Dorr) 230 29 154 28 18 1
Prague (E Kmonıckova) 232 16 160 28 24 4
Finland Jyvaskyla (H Sundstrom) 70 3 49 7 8 3
Turku (T Salmi) 204 3 156 21 13 11
continued on next page
84 WT CREASMAN, F ODICINO et al
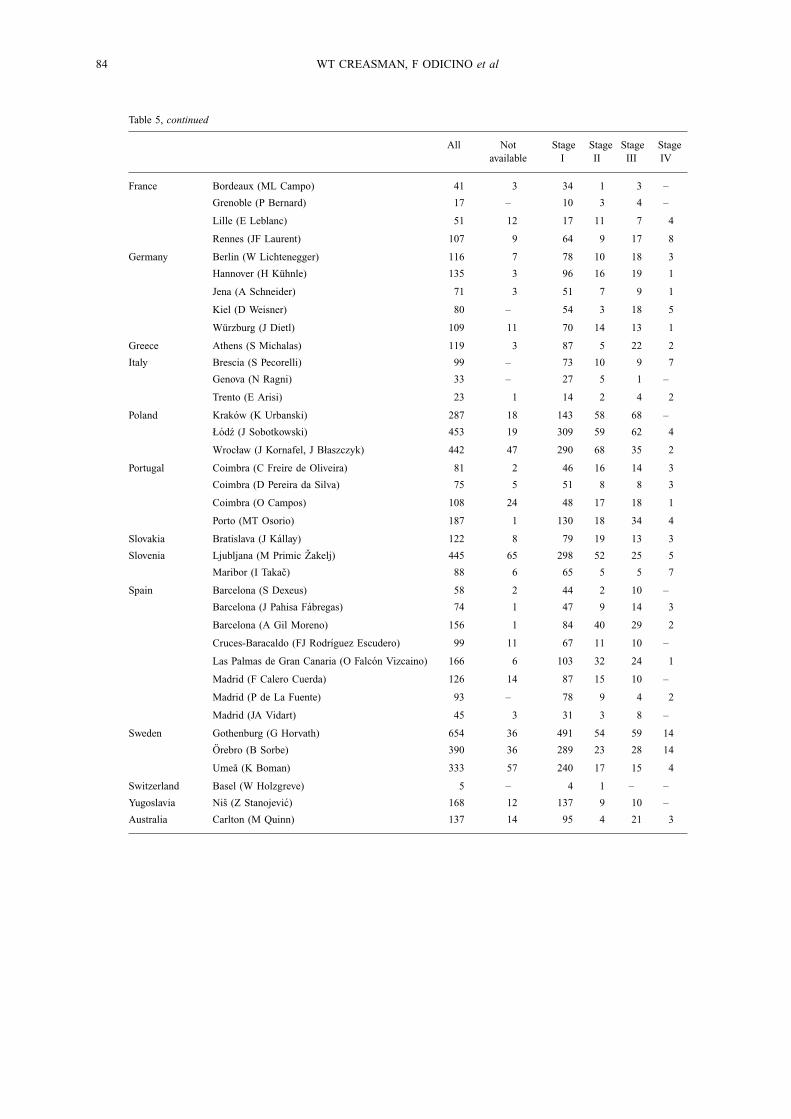
Table 5, continued
All Notavailable
StageI
StageII
StageIII
StageIV
France Bordeaux (ML Campo) 41 3 34 1 3 –
Grenoble (P Bernard) 17 – 10 3 4 –
Lille (E Leblanc) 51 12 17 11 7 4
Rennes (JF Laurent) 107 9 64 9 17 8
Germany Berlin (W Lichtenegger) 116 7 78 10 18 3
Hannover (H Kuhnle) 135 3 96 16 19 1
Jena (A Schneider) 71 3 51 7 9 1
Kiel (D Weisner) 80 – 54 3 18 5
Wurzburg (J Dietl) 109 11 70 14 13 1
Greece Athens (S Michalas) 119 3 87 5 22 2
Italy Brescia (S Pecorelli) 99 – 73 10 9 7
Genova (N Ragni) 33 – 27 5 1 –
Trento (E Arisi) 23 1 14 2 4 2
Poland Krakow (K Urbanski) 287 18 143 58 68 –
Łodz (J Sobotkowski) 453 19 309 59 62 4
Wrocław (J Kornafel, J Błaszczyk) 442 47 290 68 35 2
Portugal Coimbra (C Freire de Oliveira) 81 2 46 16 14 3
Coimbra (D Pereira da Silva) 75 5 51 8 8 3
Coimbra (O Campos) 108 24 48 17 18 1
Porto (MT Osorio) 187 1 130 18 34 4
Slovakia Bratislava (J Kallay) 122 8 79 19 13 3
Slovenia Ljubljana (M Primic Zakelj) 445 65 298 52 25 5
Maribor (I Takac) 88 6 65 5 5 7
Spain Barcelona (S Dexeus) 58 2 44 2 10 –
Barcelona (J Pahisa Fabregas) 74 1 47 9 14 3
Barcelona (A Gil Moreno) 156 1 84 40 29 2
Cruces-Baracaldo (FJ Rodrıguez Escudero) 99 11 67 11 10 –
Las Palmas de Gran Canaria (O Falcon Vizcaino) 166 6 103 32 24 1
Madrid (F Calero Cuerda) 126 14 87 15 10 –
Madrid (P de La Fuente) 93 – 78 9 4 2
Madrid (JA Vidart) 45 3 31 3 8 –
Sweden Gothenburg (G Horvath) 654 36 491 54 59 14
Orebro (B Sorbe) 390 36 289 23 28 14
Umea (K Boman) 333 57 240 17 15 4
Switzerland Basel (W Holzgreve) 5 – 4 1 – –
Yugoslavia Nis (Z Stanojevic) 168 12 137 9 10 –
Australia Carlton (M Quinn) 137 14 95 4 21 3
CARCINOMA OF THE CORPUS UTERI 85
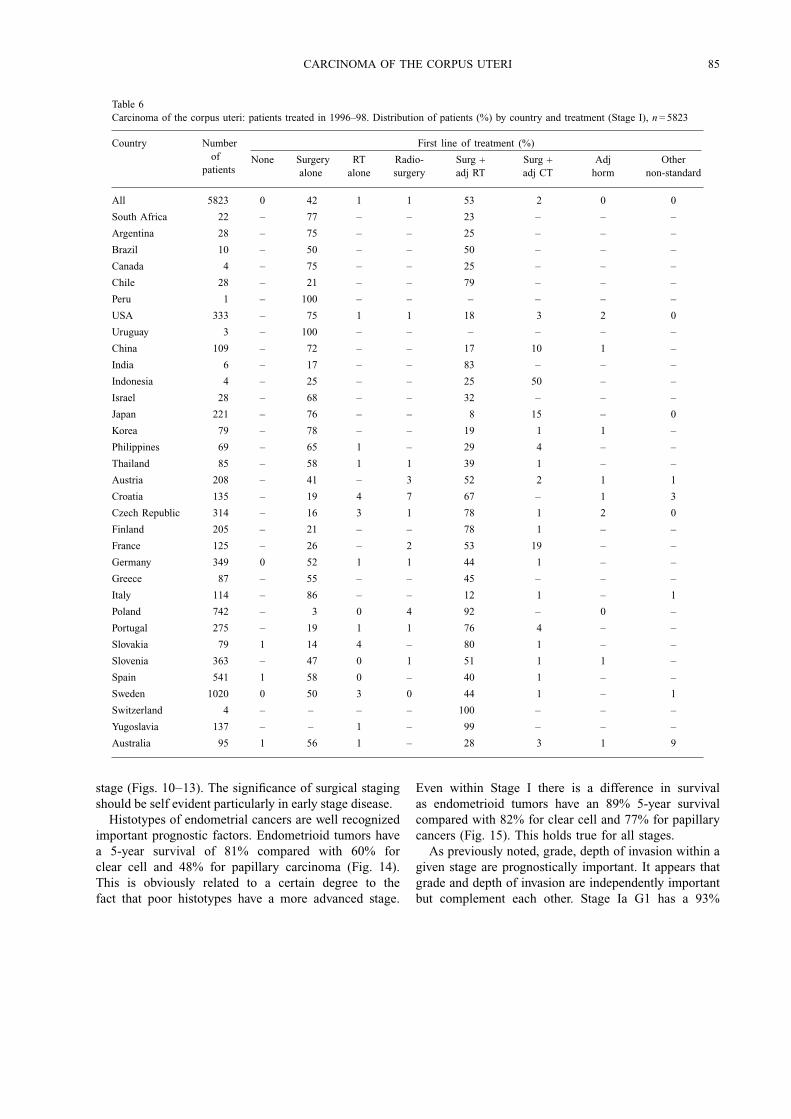
Table 6Carcinoma of the corpus uteri: patients treated in 1996–98. Distribution of patients (%) by country and treatment (Stage I), n= 5823
Country Numberof
patients
First line of treatment (%)
None Surgeryalone
RTalone
Radio-surgery
Surg +adj RT
Surg +adj CT
Adjhorm
Othernon-standard
All 5823 0 42 1 1 53 2 0 0
South Africa 22 – 77 – – 23 – – –
Argentina 28 – 75 – – 25 – – –
Brazil 10 – 50 – – 50 – – –
Canada 4 – 75 – – 25 – – –
Chile 28 – 21 – – 79 – – –
Peru 1 – 100 – – – – – –
USA 333 – 75 1 1 18 3 2 0
Uruguay 3 – 100 – – – – – –
China 109 – 72 – – 17 10 1 –
India 6 – 17 – – 83 – – –
Indonesia 4 – 25 – – 25 50 – –
Israel 28 – 68 – – 32 – – –
Japan 221 – 76 – – 8 15 – 0
Korea 79 – 78 – – 19 1 1 –
Philippines 69 – 65 1 – 29 4 – –
Thailand 85 – 58 1 1 39 1 – –
Austria 208 – 41 – 3 52 2 1 1
Croatia 135 – 19 4 7 67 – 1 3
Czech Republic 314 – 16 3 1 78 1 2 0
Finland 205 – 21 – – 78 1 – –
France 125 – 26 – 2 53 19 – –
Germany 349 0 52 1 1 44 1 – –
Greece 87 – 55 – – 45 – – –
Italy 114 – 86 – – 12 1 – 1
Poland 742 – 3 0 4 92 – 0 –
Portugal 275 – 19 1 1 76 4 – –
Slovakia 79 1 14 4 – 80 1 – –
Slovenia 363 – 47 0 1 51 1 1 –
Spain 541 1 58 0 – 40 1 – –
Sweden 1020 0 50 3 0 44 1 – 1
Switzerland 4 – – – – 100 – – –
Yugoslavia 137 – – 1 – 99 – – –
Australia 95 1 56 1 – 28 3 1 9
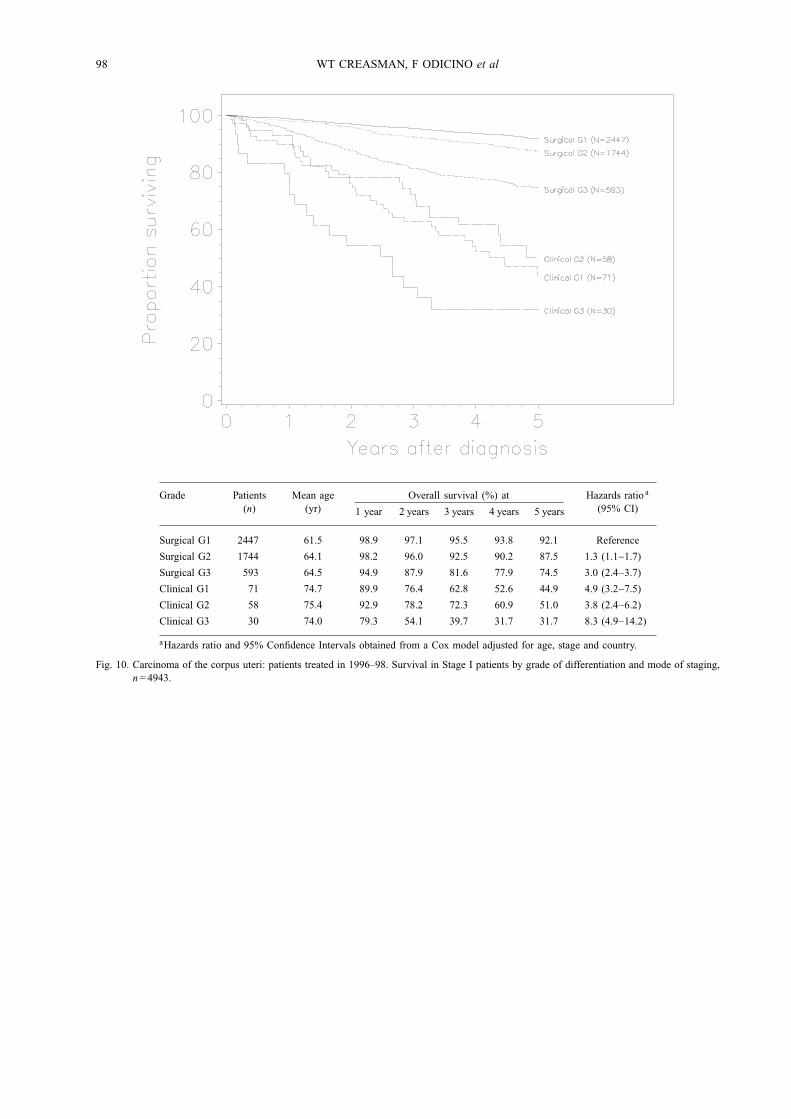
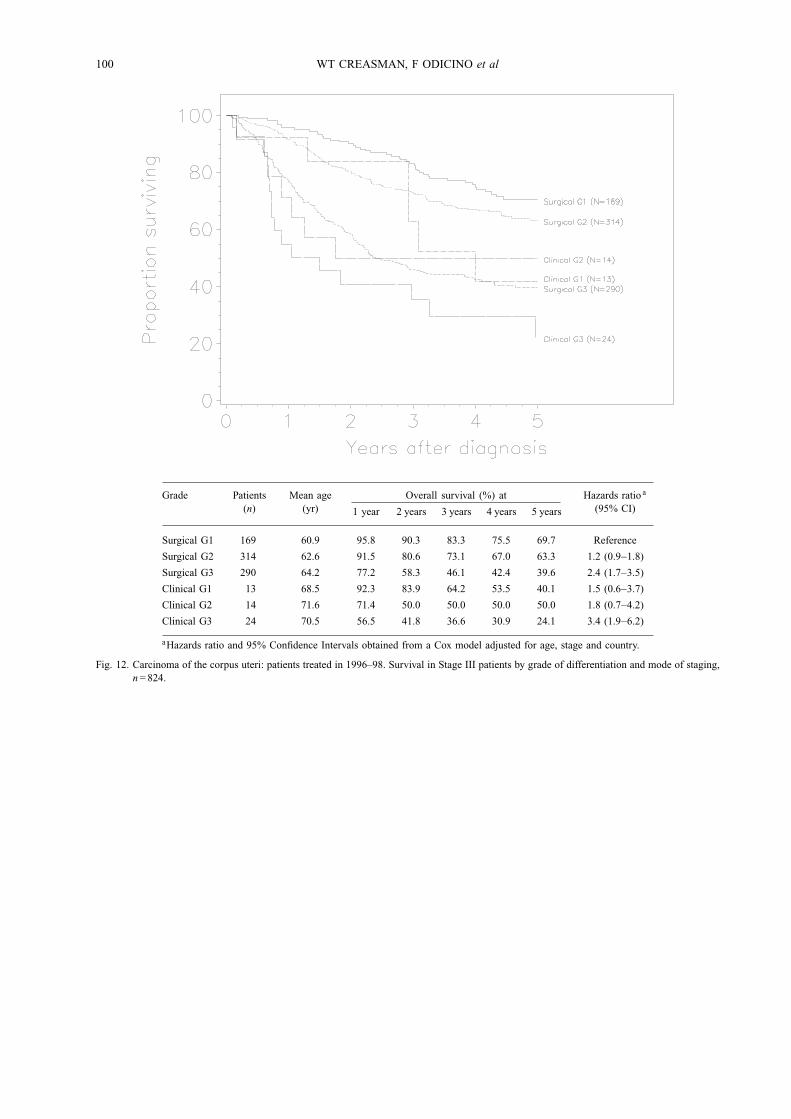
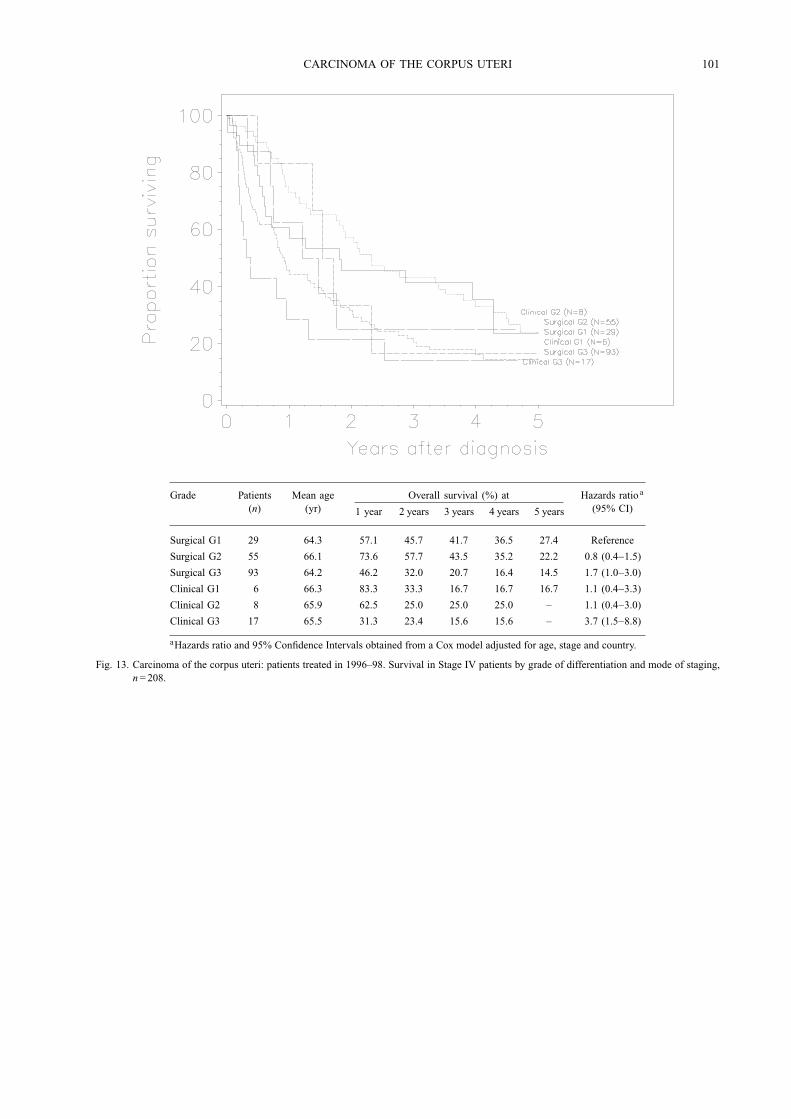
stage (Figs. 10−13). The significance of surgical stagingshould be self evident particularly in early stage disease.Histotypes of endometrial cancers are well recognized
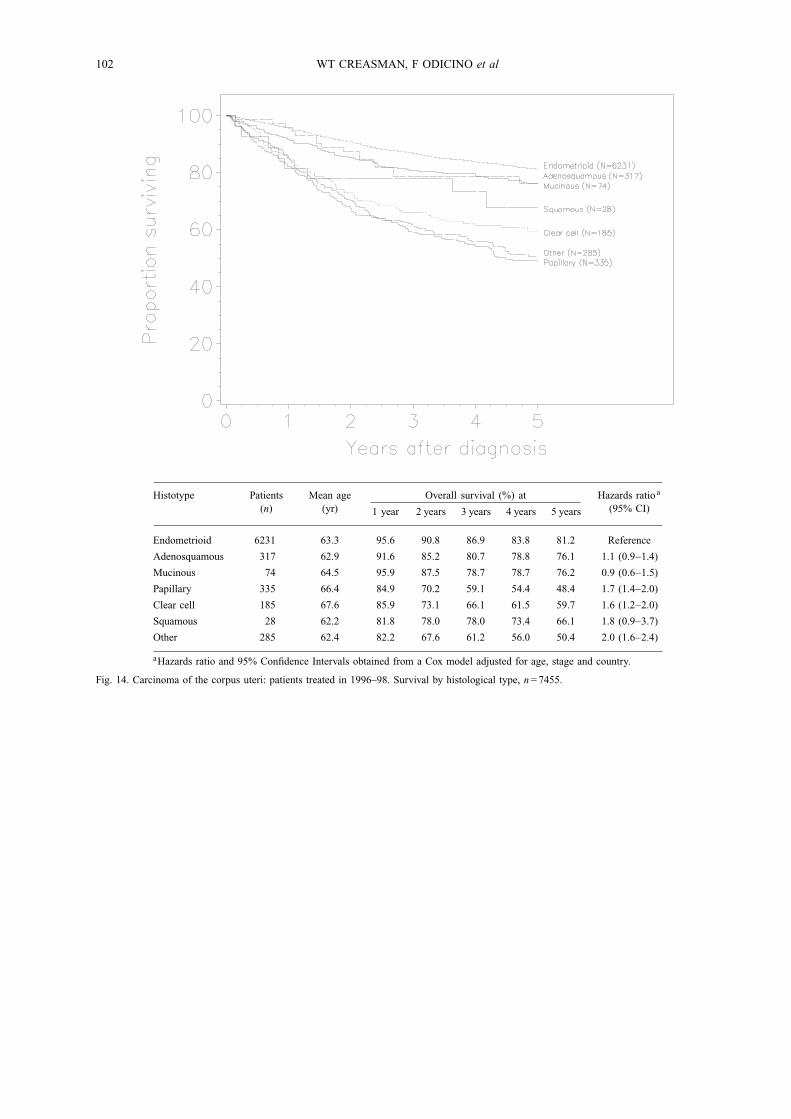
important prognostic factors. Endometrioid tumors havea 5-year survival of 81% compared with 60% forclear cell and 48% for papillary carcinoma (Fig. 14).This is obviously related to a certain degree to thefact that poor histotypes have a more advanced stage.
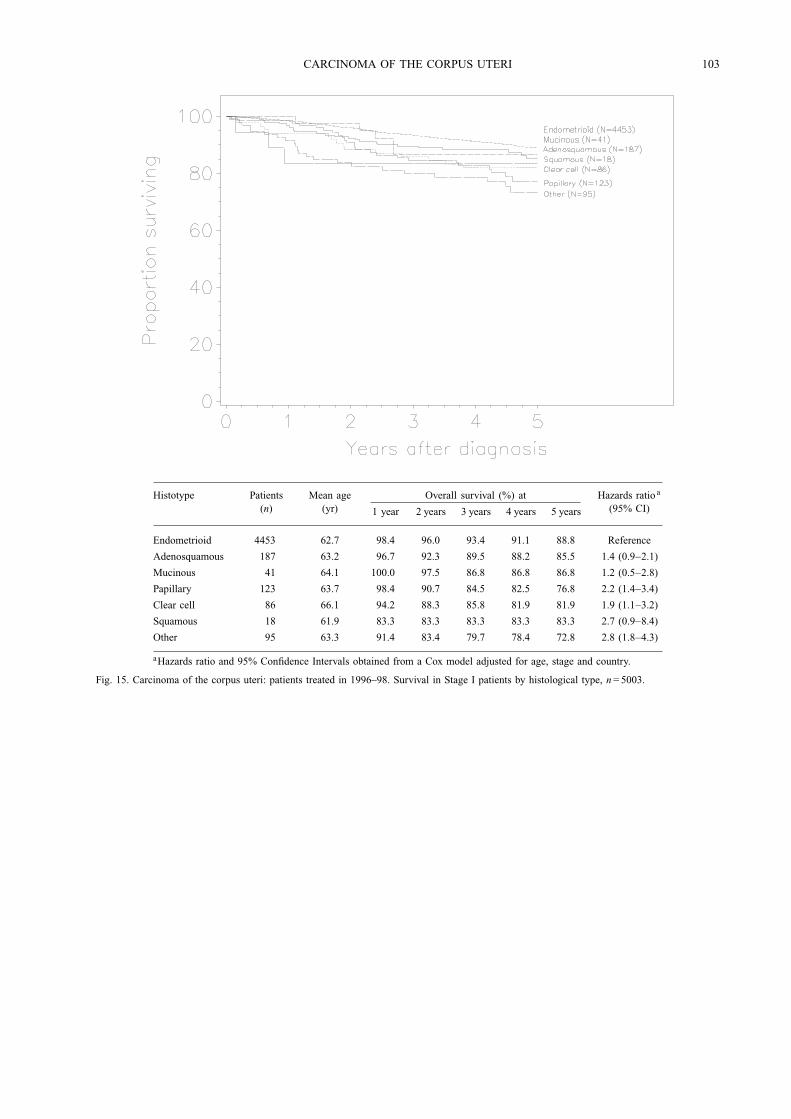
Even within Stage I there is a difference in survivalas endometrioid tumors have an 89% 5-year survivalcompared with 82% for clear cell and 77% for papillarycancers (Fig. 15). This holds true for all stages.As previously noted, grade, depth of invasion within a
given stage are prognostically important. It appears thatgrade and depth of invasion are independently importantbut complement each other. Stage Ia G1 has a 93%
86 WT CREASMAN, F ODICINO et al
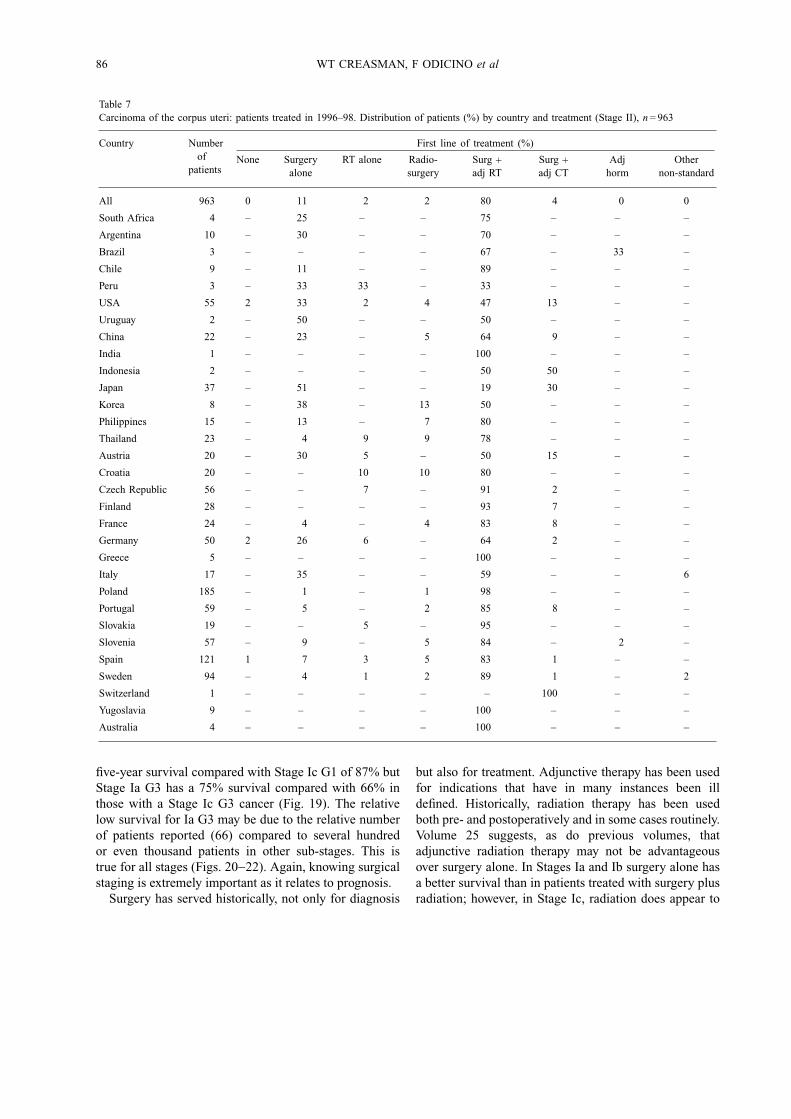
Table 7Carcinoma of the corpus uteri: patients treated in 1996–98. Distribution of patients (%) by country and treatment (Stage II), n= 963
Country Numberof
patients
First line of treatment (%)
None Surgeryalone
RT alone Radio-surgery
Surg +adj RT
Surg +adj CT
Adjhorm
Othernon-standard
All 963 0 11 2 2 80 4 0 0
South Africa 4 – 25 – – 75 – – –
Argentina 10 – 30 – – 70 – – –
Brazil 3 – – – – 67 – 33 –
Chile 9 – 11 – – 89 – – –
Peru 3 – 33 33 – 33 – – –
USA 55 2 33 2 4 47 13 – –
Uruguay 2 – 50 – – 50 – – –
China 22 – 23 – 5 64 9 – –
India 1 – – – – 100 – – –
Indonesia 2 – – – – 50 50 – –
Japan 37 – 51 – – 19 30 – –
Korea 8 – 38 – 13 50 – – –
Philippines 15 – 13 – 7 80 – – –
Thailand 23 – 4 9 9 78 – – –
Austria 20 – 30 5 – 50 15 – –
Croatia 20 – – 10 10 80 – – –
Czech Republic 56 – – 7 – 91 2 – –
Finland 28 – – – – 93 7 – –
France 24 – 4 – 4 83 8 – –
Germany 50 2 26 6 – 64 2 – –
Greece 5 – – – – 100 – – –
Italy 17 – 35 – – 59 – – 6
Poland 185 – 1 – 1 98 – – –
Portugal 59 – 5 – 2 85 8 – –
Slovakia 19 – – 5 – 95 – – –
Slovenia 57 – 9 – 5 84 – 2 –
Spain 121 1 7 3 5 83 1 – –
Sweden 94 – 4 1 2 89 1 – 2
Switzerland 1 – – – – – 100 – –
Yugoslavia 9 – – – – 100 – – –
Australia 4 – – – – 100 – – –
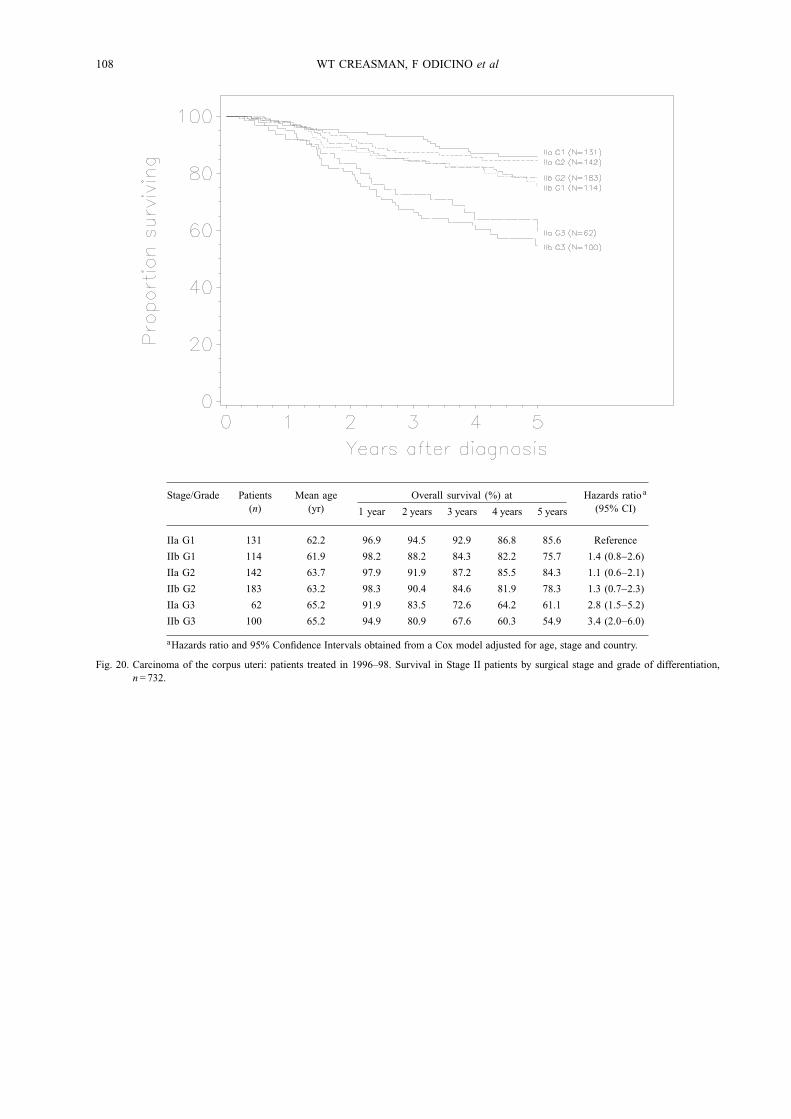
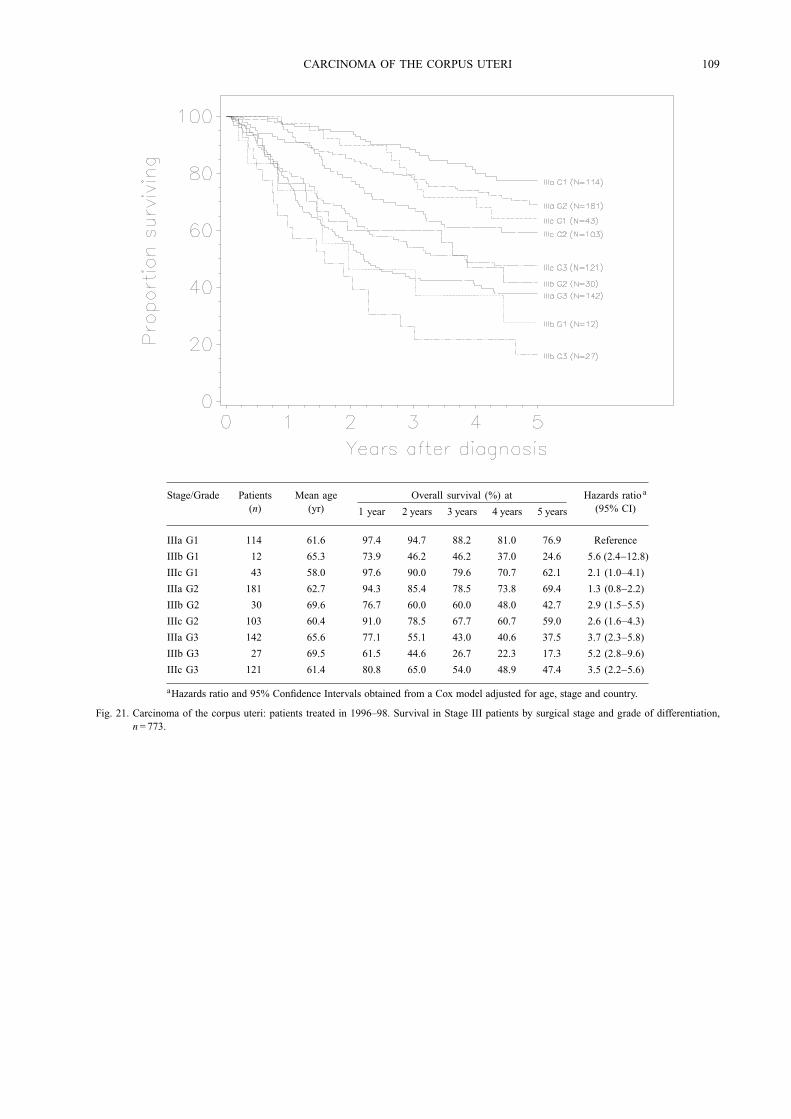
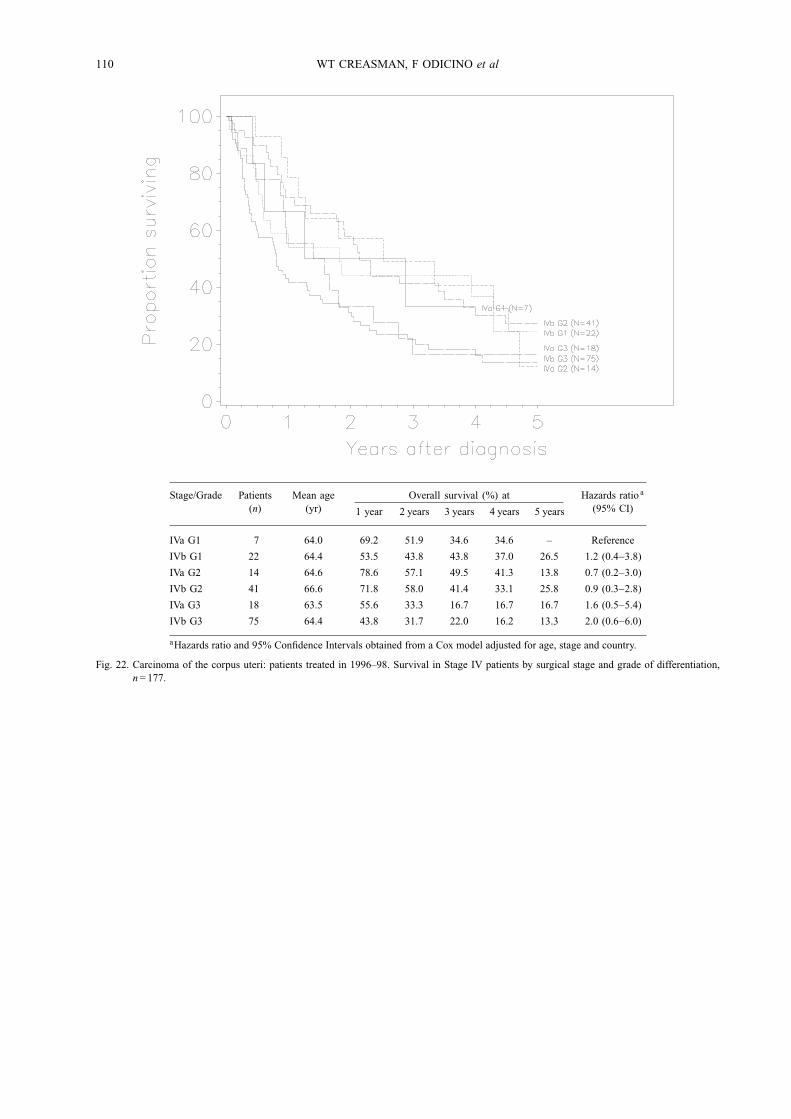
five-year survival compared with Stage Ic G1 of 87% butStage Ia G3 has a 75% survival compared with 66% inthose with a Stage Ic G3 cancer (Fig. 19). The relativelow survival for Ia G3 may be due to the relative numberof patients reported (66) compared to several hundredor even thousand patients in other sub-stages. This istrue for all stages (Figs. 20−22). Again, knowing surgicalstaging is extremely important as it relates to prognosis.Surgery has served historically, not only for diagnosis
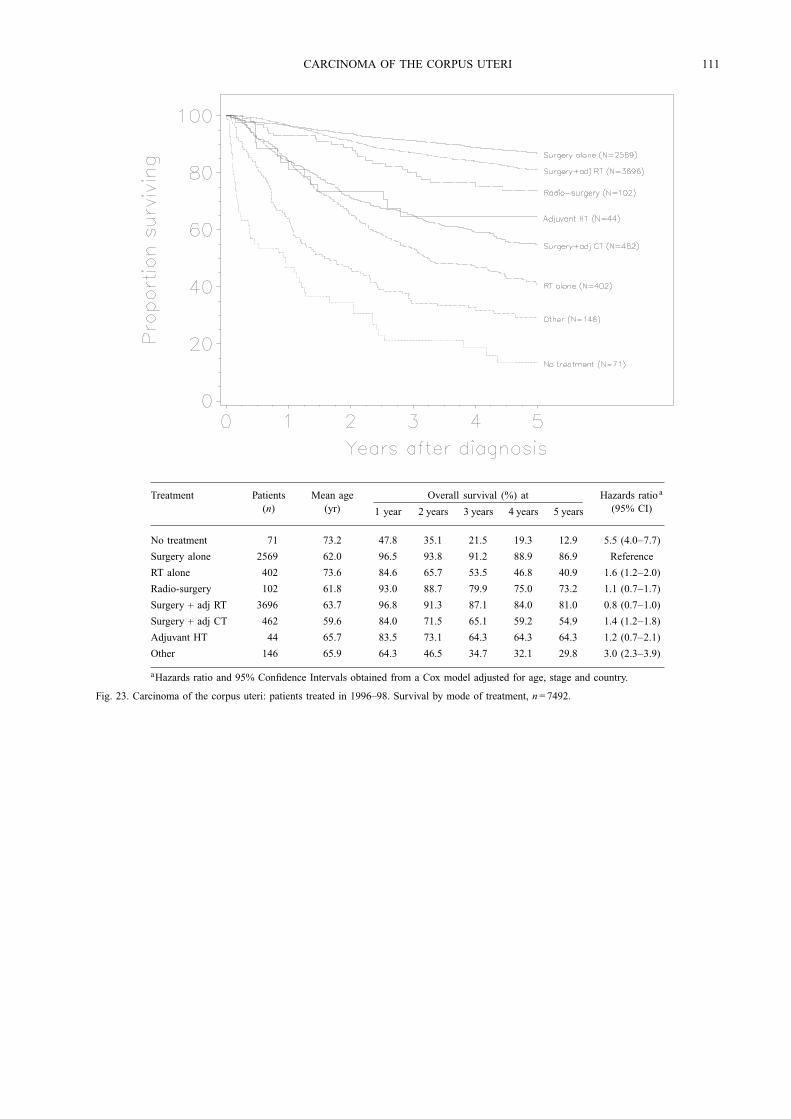
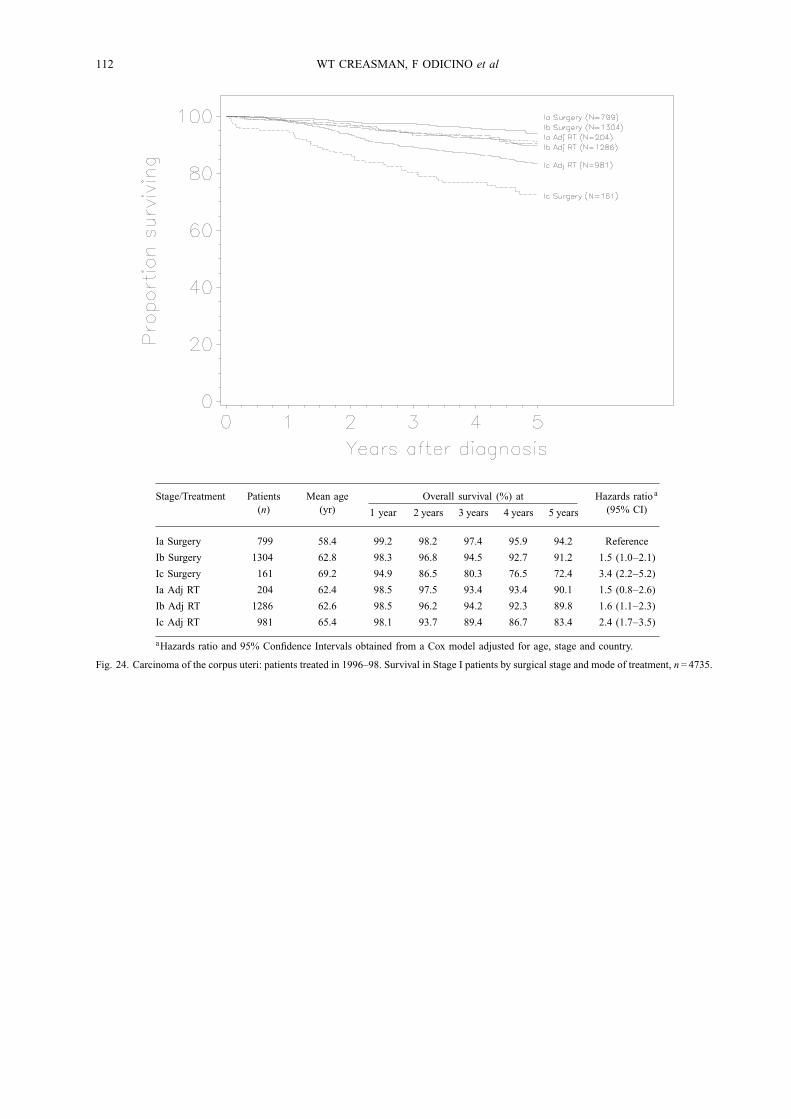
but also for treatment. Adjunctive therapy has been usedfor indications that have in many instances been illdefined. Historically, radiation therapy has been usedboth pre- and postoperatively and in some cases routinely.Volume 25 suggests, as do previous volumes, thatadjunctive radiation therapy may not be advantageousover surgery alone. In Stages Ia and Ib surgery alone hasa better survival than in patients treated with surgery plusradiation; however, in Stage Ic, radiation does appear to
CARCINOMA OF THE CORPUS UTERI 87
Table 8Carcinoma of the corpus uteri: patients treated in 1996–98. Distribution of patients (%) by country and treatment (Stage III), n= 1068
Country Numberof
patients
First line of treatment (%)
None Surgeryalone
RT alone Radio-surgery
Surg +adj RT
Surg +adj CT
Adjhorm
Othernon-standard
All 1068 1 11 3 2 61 19 1 3
South Africa 5 – – – – 100 – – –
Argentina 9 – 11 11 – 44 33 – –
Canada 1 – – – – – 100 – –
Chile 11 – 9 – – 91 – – –
USA 79 – 25 3 1 28 39 4 –
Uruguay 1 – 100 – – – – – –
China 21 5 10 – 5 81 – – –
India 1 – – – – – – 100 –
Israel 4 – – – – 100 – – –
Japan 77 – 12 – – 16 69 1 3
Korea 11 – 9 – 9 55 27 – –
Philippines 39 – 33 – 3 51 10 – 3
Thailand 30 – 13 – – 70 17 – –
Austria 31 – 19 – – 26 32 – 23
Croatia 17 – 12 18 6 47 18 – –
Czech Republic 42 – 2 5 2 74 10 – 7
Finland 21 – 10 – – 67 24 – –
France 31 – 6 – 10 48 29 6 –
Germany 77 1 13 5 – 61 14 3 3
Greece 22 – 27 – – 50 23 – –
Italy 14 – 21 7 7 29 29 7 –
Poland 165 – 1 1 2 88 8 – 1
Portugal 74 – 3 12 3 58 19 3 3
Slovakia 13 – 15 8 – 77 – – –
Slovenia 30 – 13 – – 70 13 3 –
Spain 109 3 17 3 2 67 6 – 2
Sweden 102 1 2 3 1 78 10 – 5
Yugoslavia 10 – – – – 90 10 – –
Australia 21 5 5 – – 52 19 5 14
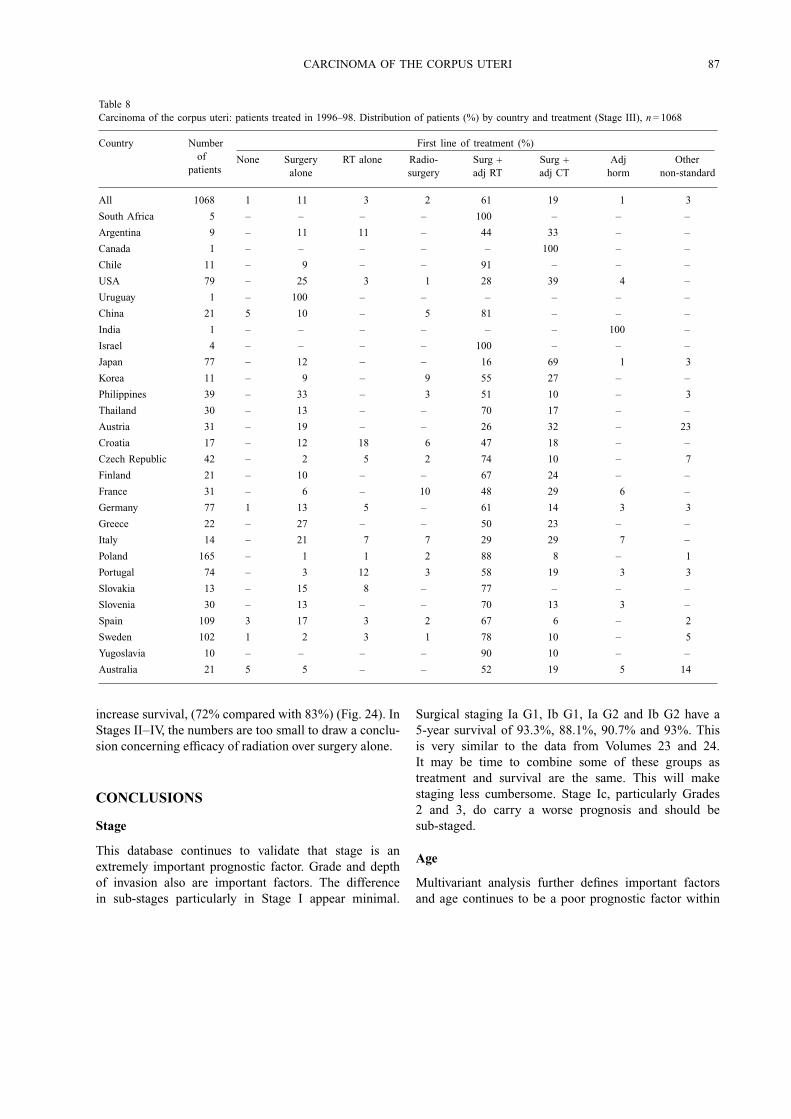
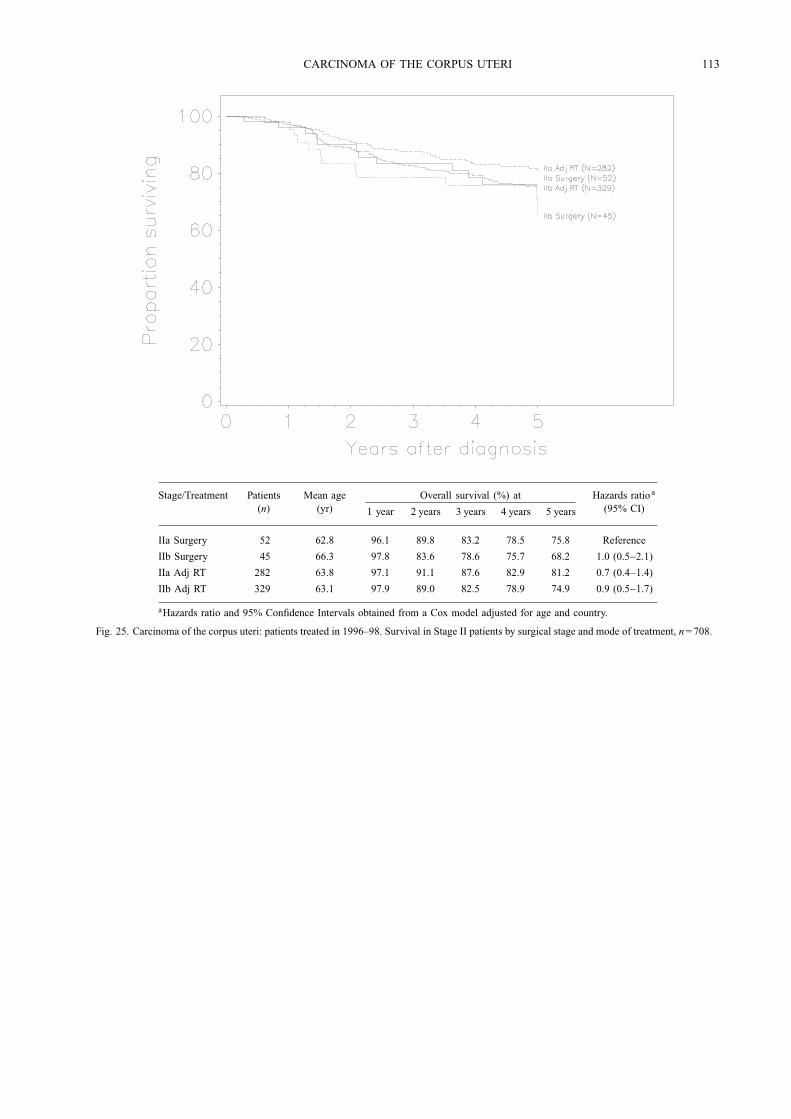
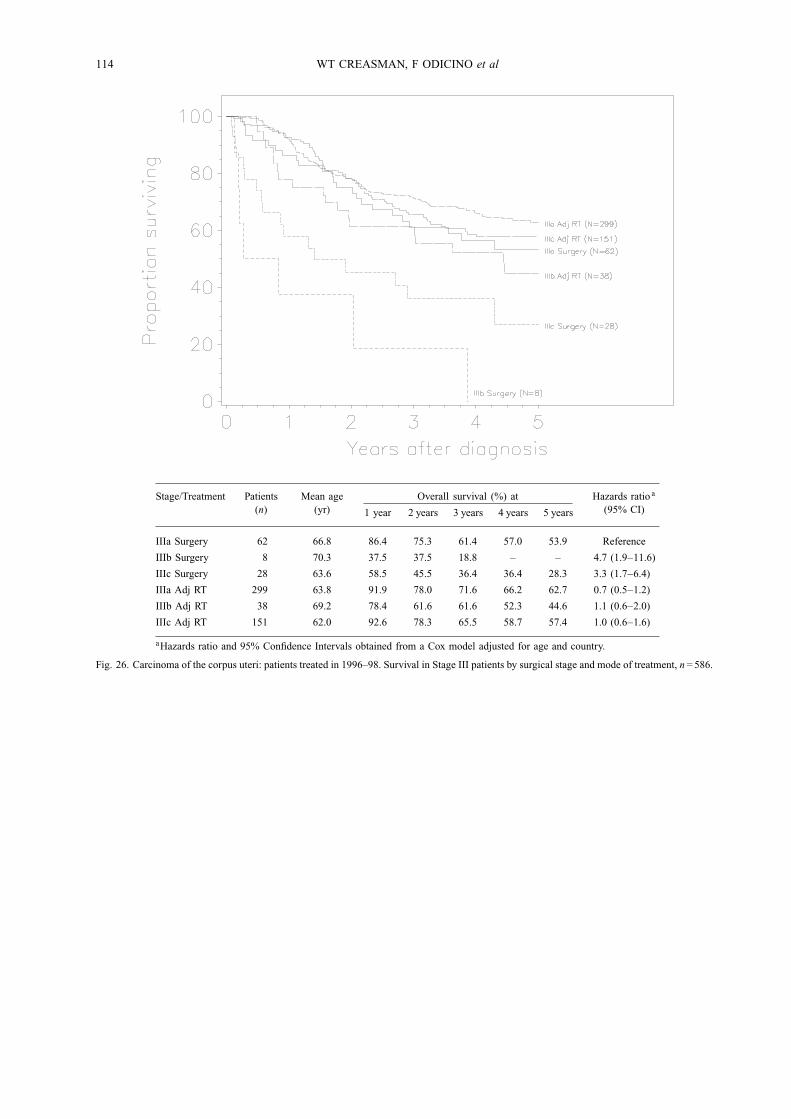
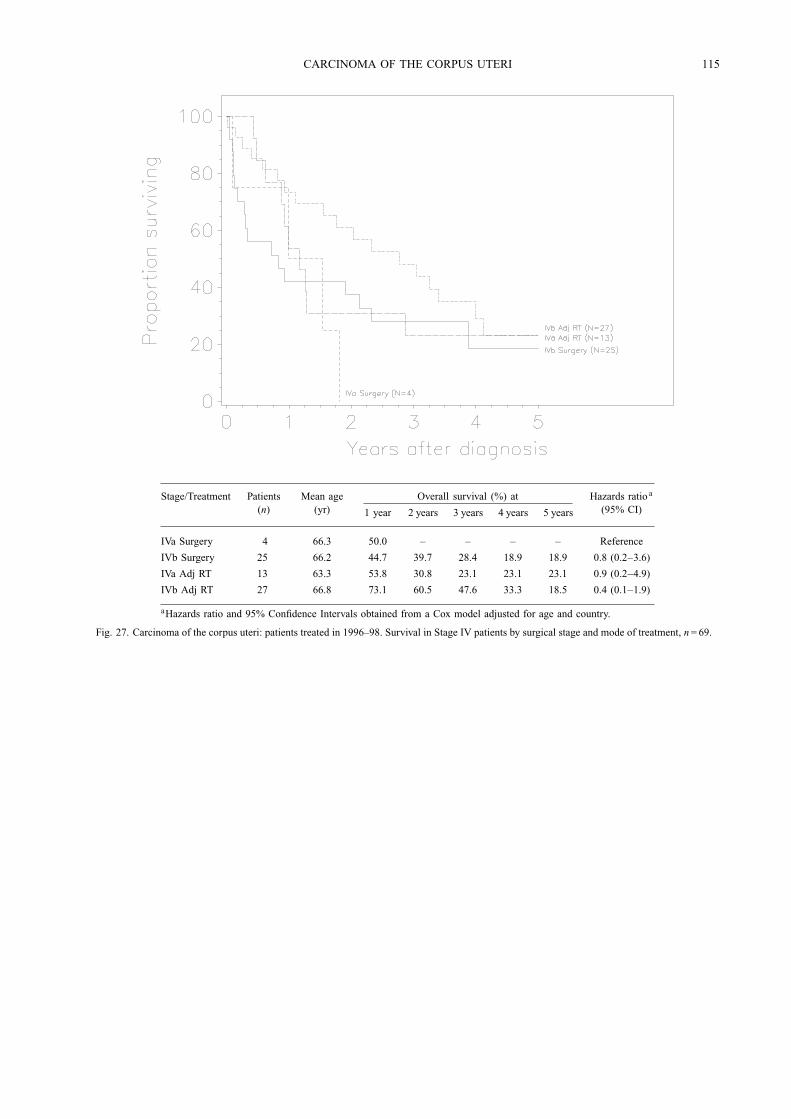
increase survival, (72% compared with 83%) (Fig. 24). InStages II−IV, the numbers are too small to draw a conclu-sion concerning efficacy of radiation over surgery alone.
CONCLUSIONS
Stage
This database continues to validate that stage is anextremely important prognostic factor. Grade and depthof invasion also are important factors. The differencein sub-stages particularly in Stage I appear minimal.
Surgical staging Ia G1, Ib G1, Ia G2 and Ib G2 have a5-year survival of 93.3%, 88.1%, 90.7% and 93%. Thisis very similar to the data from Volumes 23 and 24.It may be time to combine some of these groups astreatment and survival are the same. This will makestaging less cumbersome. Stage Ic, particularly Grades2 and 3, do carry a worse prognosis and should besub-staged.
Age
Multivariant analysis further defines important factorsand age continues to be a poor prognostic factor within
88 WT CREASMAN, F ODICINO et al
Table 9Carcinoma of the corpus uteri: patients treated in 1996–98. Distribution of patients (%) by country and treatment (Stage IV), n= 229
Country Numberof
patients
First line of treatment (%)
None Surgeryalone
RT alone Radio-surgery
Surg +adj RT
Surg +adj CT
Adjhorm
Othernon-standard
All 229 3 13 6 1 20 41 3 13
South Africa 1 – 100 – – – – – –
Argentina 3 – – 33 – – – – 67
Chile 1 – – – – – – 100 –
Peru 1 – – 100 – – – – –
USA 41 – 22 – – 10 61 – 7
China 6 – 67 – 17 – 17 – –
India 1 – – 100 – – – – –
Japan 9 – – – – – 78 – 22
Korea 4 – 50 – – 25 25 – –
Philippines 2 – – 100 – – – – –
Thailand 10 – 20 – – 50 30 – –
Austria 14 – 14 – – 7 50 – 29
Croatia 8 13 – 13 – 38 25 13 –
Czech Republic 5 – – – – 40 20 – 40
Finland 14 – 14 – 7 – 71 – 7
France 12 – 17 17 – 33 8 8 17
Germany 11 18 27 18 – 18 9 – 9
Greece 2 – – – – – – 100 –
Italy 9 – 11 – – – 67 11 11
Poland 6 – 17 17 – 33 33 – –
Portugal 11 18 – – – 45 36 – –
Slovakia 3 33 – 33 – – 33 – –
Slovenia 12 – – – – 42 25 17 17
Spain 8 13 13 13 – 25 25 – 13
Sweden 32 – – – – 28 50 – 22
Australia 3 – – – – – 67 – 33
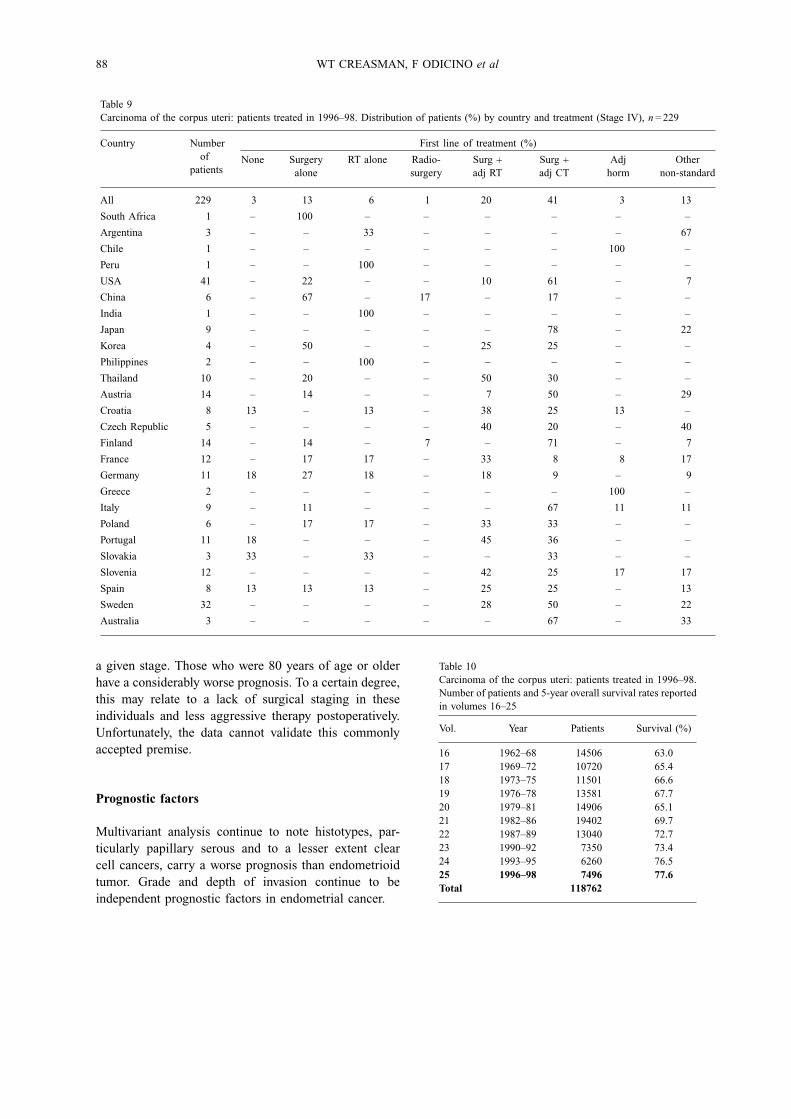
a given stage. Those who were 80 years of age or olderhave a considerably worse prognosis. To a certain degree,this may relate to a lack of surgical staging in theseindividuals and less aggressive therapy postoperatively.Unfortunately, the data cannot validate this commonlyaccepted premise.
Prognostic factors
Multivariant analysis continue to note histotypes, par-ticularly papillary serous and to a lesser extent clearcell cancers, carry a worse prognosis than endometrioidtumor. Grade and depth of invasion continue to beindependent prognostic factors in endometrial cancer.
Table 10Carcinoma of the corpus uteri: patients treated in 1996–98.Number of patients and 5-year overall survival rates reportedin volumes 16–25
Vol. Year Patients Survival (%)
16 1962–68 14506 63.017 1969–72 10720 65.418 1973–75 11501 66.619 1976–78 13581 67.720 1979–81 14906 65.121 1982–86 19402 69.722 1987–89 13040 72.723 1990–92 7350 73.424 1993–95 6260 76.525 1996–98 7496 77.6Total 118762
CARCINOMA OF THE CORPUS UTERI 89
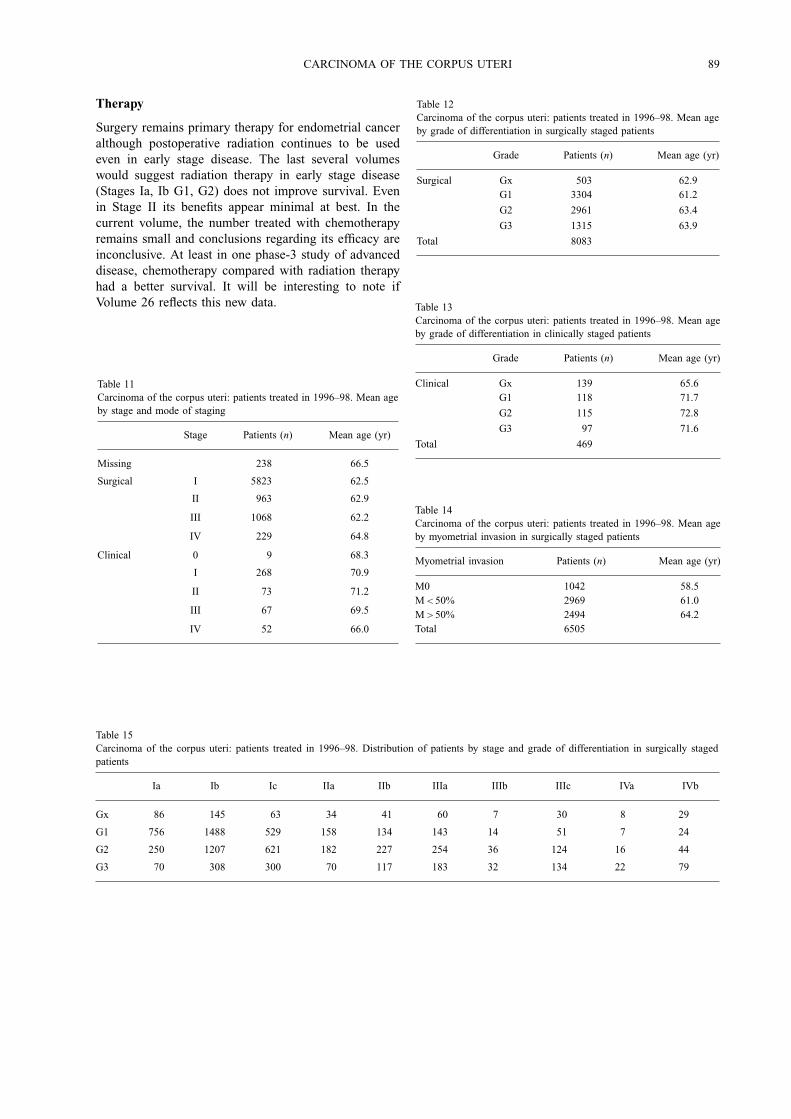
Therapy
Surgery remains primary therapy for endometrial canceralthough postoperative radiation continues to be usedeven in early stage disease. The last several volumeswould suggest radiation therapy in early stage disease(Stages Ia, Ib G1, G2) does not improve survival. Evenin Stage II its benefits appear minimal at best. In thecurrent volume, the number treated with chemotherapyremains small and conclusions regarding its efficacy areinconclusive. At least in one phase-3 study of advanceddisease, chemotherapy compared with radiation therapyhad a better survival. It will be interesting to note ifVolume 26 reflects this new data.
Table 11Carcinoma of the corpus uteri: patients treated in 1996–98. Mean ageby stage and mode of staging
Stage Patients (n) Mean age (yr)
Missing 238 66.5
Surgical I 5823 62.5
II 963 62.9
III 1068 62.2
IV 229 64.8
Clinical 0 9 68.3
I 268 70.9
II 73 71.2
III 67 69.5
IV 52 66.0
Table 12Carcinoma of the corpus uteri: patients treated in 1996–98. Mean ageby grade of differentiation in surgically staged patients
Grade Patients (n) Mean age (yr)
Surgical Gx 503 62.9G1 3304 61.2
G2 2961 63.4
G3 1315 63.9
Total 8083
Table 13Carcinoma of the corpus uteri: patients treated in 1996–98. Mean ageby grade of differentiation in clinically staged patients
Grade Patients (n) Mean age (yr)
Clinical Gx 139 65.6G1 118 71.7
G2 115 72.8
G3 97 71.6
Total 469
Table 14Carcinoma of the corpus uteri: patients treated in 1996–98. Mean ageby myometrial invasion in surgically staged patients
Myometrial invasion Patients (n) Mean age (yr)
M0 1042 58.5M< 50% 2969 61.0M> 50% 2494 64.2Total 6505
Table 15Carcinoma of the corpus uteri: patients treated in 1996–98. Distribution of patients by stage and grade of differentiation in surgically stagedpatients
Ia Ib Ic IIa IIb IIIa IIIb IIIc IVa IVb
Gx 86 145 63 34 41 60 7 30 8 29
G1 756 1488 529 158 134 143 14 51 7 24
G2 250 1207 621 182 227 254 36 124 16 44
G3 70 308 300 70 117 183 32 134 22 79
90 WT CREASMAN, F ODICINO et al
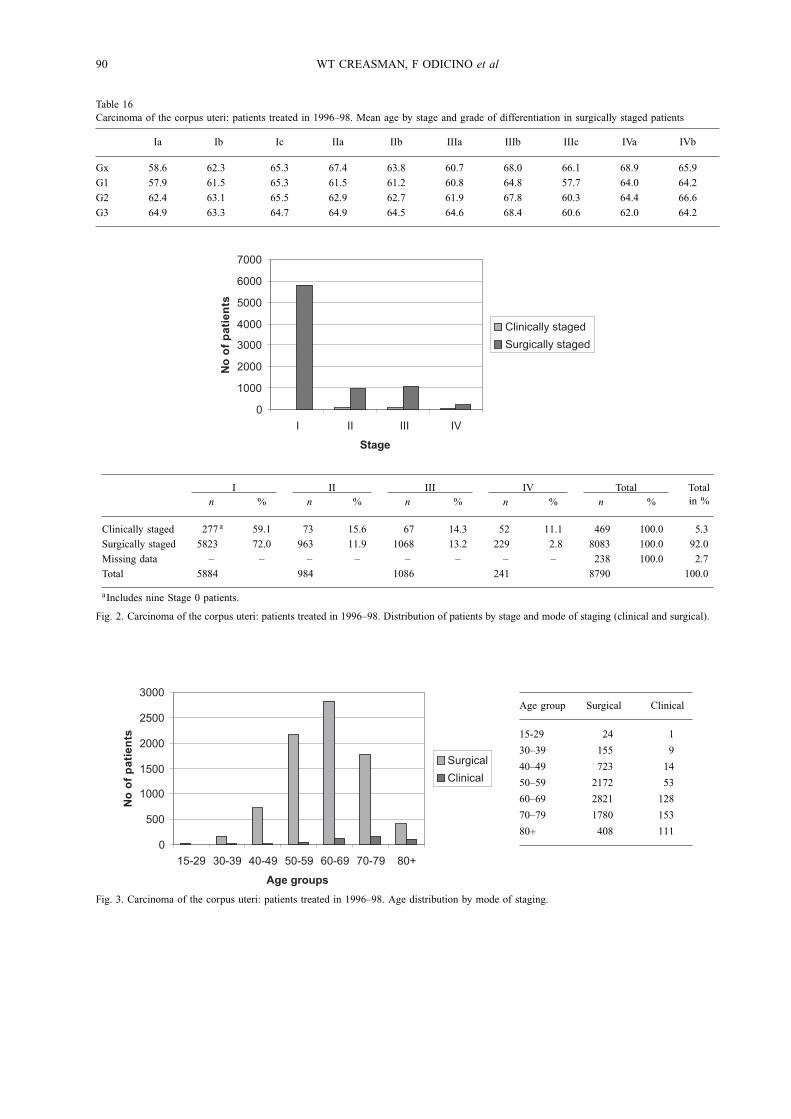
Table 16Carcinoma of the corpus uteri: patients treated in 1996–98. Mean age by stage and grade of differentiation in surgically staged patients
Ia Ib Ic IIa IIb IIIa IIIb IIIc IVa IVb
Gx 58.6 62.3 65.3 67.4 63.8 60.7 68.0 66.1 68.9 65.9
G1 57.9 61.5 65.3 61.5 61.2 60.8 64.8 57.7 64.0 64.2
G2 62.4 63.1 65.5 62.9 62.7 61.9 67.8 60.3 64.4 66.6
G3 64.9 63.3 64.7 64.9 64.5 64.6 68.4 60.6 62.0 64.2
0
1000
2000
3000
4000
5000
6000
7000
I II III IV
Stage
No
of
pa
tie
nts
Clinically staged
Surgically staged
In %
IIn %
IIIn %
IVn %
Totaln %
Totalin %
Clinically staged 277 a 59.1 73 15.6 67 14.3 52 11.1 469 100.0 5.3
Surgically staged 5823 72.0 963 11.9 1068 13.2 229 2.8 8083 100.0 92.0
Missing data – – – – – – – – 238 100.0 2.7
Total 5884 984 1086 241 8790 100.0
aIncludes nine Stage 0 patients.
Fig. 2. Carcinoma of the corpus uteri: patients treated in 1996–98. Distribution of patients by stage and mode of staging (clinical and surgical).
0
500
1000
1500
2000
2500
3000
15-29 30-39 40-49 50-59 60-69 70-79 80+
Age groups
No
of
pa
tie
nts
Surgical
Clinical
Age group Surgical Clinical
15-29 24 1
30–39 155 9
40–49 723 14
50–59 2172 53
60–69 2821 128
70–79 1780 153
80+ 408 111
Fig. 3. Carcinoma of the corpus uteri: patients treated in 1996–98. Age distribution by mode of staging.
CARCINOMA OF THE CORPUS UTERI 91
Table 17Carcinoma of the corpus uteri: patients treated in 1996–98. Percentage of histopathological type in early and advanced stages in surgicallystaged patients
Histotype Stage I−II Percentage a
%Percentage b
%Stage III−IV Percentage a
%Percentage b
%
Endometrioid 5959 88.11 86.8 909 70.90 13.2Adenosquamous 269 3.98 76.4 83 6.47 23.6Mucinous 64 0.95 81.0 15 1.17 19.0Papillary 176 2.60 56.8 134 0.45 43.2Clear cell 133 1.97 69.6 58 4.52 30.4Squamous 24 0.35 72.7 9 0.70 27.3Other 138 2.04 65.1 74 5.77 34.9
a Percentage within the same stage group. b Percentage within the same histological type.
Table 18Carcinoma of the corpus uteri: patients treated in 1996–98. 5-year survival by stage/age group/mode of staging
Age group Surgicalstaging (%)
Patients(n)
Clinicalstaging (%)
Patients(n)
Age group Surgicalstaging (%)
Patients(n)
Clinicalstaging (%)
Patients(n)
Stage I
15–29 93.8 15 6.3 1
30–39 96.5 109 3.5 4
40–49 98.6 499 1.4 7
50–59 97.8 1597 2.2 36
60–69 96.9 2051 3.1 65
70–79 93.3 1277 6.7 91
80+ 79.0 275 21.0 73
Stage II
15–29 100.0 4 – –
30–39 88.9 16 11.1 2
40–49 96.2 102 3.8 4
50–59 98.7 228 1.3 3
60–69 94.4 336 5.6 20
70–79 90.2 221 9.8 24
80+ 73.7 56 26.3 20
Stage III
15–29 100.0 4 – –
30–39 93.8 30 6.3 2
40–49 99.1 106 0.9 1
50–59 97.4 298 2.6 8
60–69 94.3 350 5.7 21
70–79 91.5 215 8.5 20
80+ 81.3 65 18.8 15
Stage IV
15–29 100.0 1 – –
30–39 – 0 100.0 1
40–49 88.9 16 11.1 2
50–59 89.1 49 10.9 6
60–69 79.2 84 20.8 22
70–79 78.8 67 21.2 18
80+ 80.0 12 20.0 3
Table 19Carcinoma of the corpus uteri: patients treated in 1996–98. Surgical stage distribution by mode of treatment
Ia Ib Ic IIa IIb IIIa IIIb IIIc IVa IVb
Surgery alone 837 1419 175 55 49 73 10 33 4 26
Surgery + adj RT 252 1564 1253 354 415 424 45 182 15 30
Surgery + adj CT 14 66 54 17 21 104 12 88 19 76
Adjuvant HT 8 8 3 2 0 9 0 5 3 5
Other 11 9 9 2 1 8 5 15 7 22
92 WT CREASMAN, F ODICINO et al
Table 20Carcinoma of the corpus uteri: patients treated in 1996–98. Percentage of surgically staged patients by mode of treatment
Ia(%)
Ib(%)
Ic(%)
IIa(%)
IIb(%)
IIIa(%)
IIIb(%)
IIIc(%)
IVa(%)
IVb(%)
Surgery alone 31.22 52.93 6.53 2.05 1.83 2.72 0.37 1.23 0.15 0.97
Surgery + adj RT 5.56 34.49 27.64 7.81 9.15 9.35 0.99 4.01 0.33 0.66
Surgery + adj CT 2.97 14.01 11.46 3.61 4.46 22.08 2.55 18.68 4.03 16.14
Adjuvant HT 18.60 18.60 6.98 4.65 – 20.93 – 11.63 6.98 11.63
Other 12.36 10.11 10.11 2.25 1.12 8.99 5.62 16.85 7.87 24.72
Table 21Carcinoma of the corpus uteri: patients treated in 1996–98. Lymphnodal status
P−A− (%) P+A− (%) P−A+ (%) P+A+ (%)
M0 93.86 4.77 0.91 0.45
M< 50% 90.79 7.03 0.42 1.76
M> 50% 79.81 13.75 1.37 5.07
P−, negative pelvic nodesP+, positive pelvic nodes
A−, negative aortic nodesA+, positive aortic nodes
M0, no myometrial invasionM< 50%, myometrial invasion less than 50%M> 50%, myometrial invasion more than 50%
0
1000
2000
3000
4000
5000
6000
End
omet
rioid
Ade
nosq
uam
ous
Muc
inou
s
Pap
illar
y
Clear
cell
Squ
amou
s
Oth
er
Histotype
No
of
pati
en
ts
I
II
III
IV
Histotype Stage
I II III IV
Endometrioid 5167 792 777 132
Adenosquamous 220 49 67 16
Mucinous 50 14 11 4
Papillary 130 46 96 38
Clear cell 101 32 44 14
Squamous 22 2 8 1
Other 114 24 58 16
Fig. 4. Carcinoma of the corpus uteri: patients treated in 1996–98. Surgical stage distribution (in percentage) by histopathological type.
CARCINOMA OF THE CORPUS UTERI 93
Table 22Carcinoma of the corpus uteri: patients treated in 1996–98.Lymphnodal status in G1 patients
P−A− (%) P+A− (%) P−A+ (%) P+A+ (%)
M0 96.56 3.44 – –
M< 50% 94.42 4.81 0.19 0.58
M> 50% 84.26 10.80 0.93 4.01
Table 23Carcinoma of the corpus uteri: patients treated in 1996–98.Lymphnodal status in G2 patients
P−A− (%) P+A− (%) P−A+ (%) P+A+ (%)
M0 94.59 3.60 1.80 –
M< 50% 88.29 9.46 0.68 1.58
M> 50% 83.06 12.04 0.82 4.08
0
500
1000
1500
2000
2500
3000
No
hist
olog
y
Endom
etrio
id
Adeno
squa
mou
s
Muc
inou
s
Papilla
ry
Clear
cell
Squam
ous
Oth
er
Histotype
No
of
pa
tie
nts
Ia
Ib
Ic
IIa
IIb
IIIa
IIIb
IIIc
IVa
IVb
Histotype Ia Ib Ic IIa IIb IIIa IIIb IIIc IVa IVb Total
No histology 11 5 3 2 3 3 2 2 1 7 38
Endometrioid 1016 2829 1322 381 411 485 61 231 32 100.0 6868
Adenosquamous 25 119 76 18 31 40 4 23 2 14 352
Mucinous 12 23 15 2 12 8 1 2 1 3 79
Papillary 36 62 32 22 24 48 7 41 11 27 310
Clear cell 31 42 28 11 21 24 5 15 1 13 191
Squamous 4 9 9 1 1 2 1 5 0 1 33
Other 27 59 28 7 17 30 8 20 5 11 212
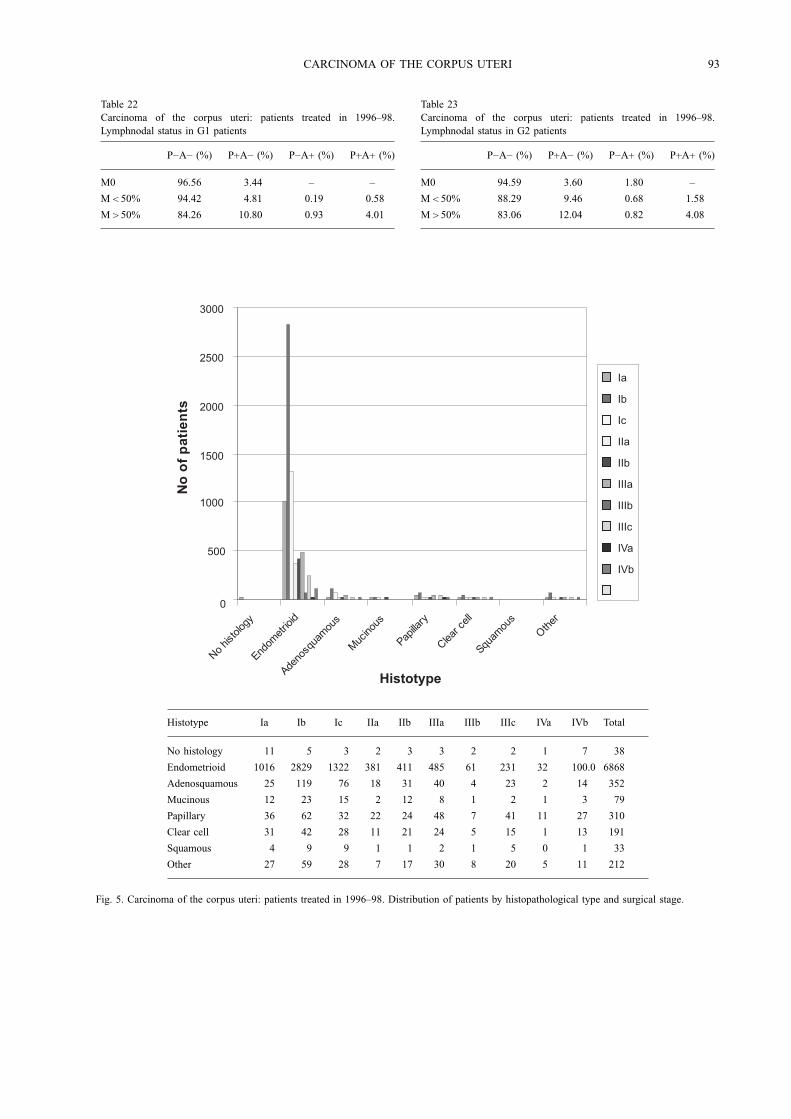
Fig. 5. Carcinoma of the corpus uteri: patients treated in 1996–98. Distribution of patients by histopathological type and surgical stage.

94 WT CREASMAN, F ODICINO et al
Table 24Carcinoma of the corpus uteri: patients treated in 1996–98.Lymphnodal status in G3 patients
P−A− (%) P+A− (%) P−A+ (%) P+A+ (%)
M0 75.68 13.51 5.41 5.41
M< 50% 84.97 8.09 0.58 6.36
M> 50% 69.28 19.93 2.61 8.17
Table 25Carcinoma of the corpus uteri: patients treated in 1996–98.Percentage of positive pelvic nodes by grade and myometrial invasion(with both positive and negative aortic nodes)
G1 (%) G2 (%) G3 (%)
M0 3.44 3.60 18.92
M< 50% 5.38 11.04 14.45
M> 50% 14.81 16.12 28.10
Patients(n)
Mean age(yr)
Overall survival (%) at
1 year 2 years 3 years 4 years 5 years
All subjects 7496 63.5 94.0 88.1 83.6 80.5 77.6
aHazards ratio and 95% Confidence Intervals obtained from a Cox model adjusted for age, stage and country.
Fig. 6. Carcinoma of the corpus uteri: patients treated in 1996–98. Overall survival, n= 7496.
CARCINOMA OF THE CORPUS UTERI 95
Table 26Carcinoma of the corpus uteri: patients treated in 1996–98.Percentage of positive aortic nodes by grade and myometrial invasion(with both positive and negative pelvic nodes)
G1 (%) G2 (%) G3 (%)
M0 – 1.80 10.81
M< 50% 0.77 2.25 6.94
M> 50% 4.94 4.90 10.78
Table 27Carcinoma of the corpus uteri: patients treated in 1996–98.Outcome of follow-up
Vital status Patients (n) Percentage (%)
Alive (NOS) 1447 16.46
Alive disease free 5333 60.67
Alive with disease 348 3.96
Dead 1662 18.91
Stage Patients(n)
Mean age(yr)
Overall survival (%) at
1 year 2 years 3 years 4 years 5 years
Hazards ratio a
(95% CI)
Ia 1063 59.7 98.5 96.8 95.0 93.2 91.1 Reference
Ib 2735 62.7 98.2 96.1 93.7 91.7 89.7 1.1 (0.9−1.4)
Ic 1219 65.8 97.6 92.3 87.7 84.7 81.3 1.8 (1.4−2.3)
IIa 364 63.8 95.8 90.3 85.1 80.5 78.7 2.6 (1.9−3.5)
IIb 426 63.4 97.4 87.5 80.1 76.4 71.4 3.2 (2.4−4.2)
IIIa 484 63.1 89.9 77.3 69.2 64.3 60.4 5.6 (4.3−7.3)
IIIb 73 68.9 70.6 51.7 45.5 36.9 30.2 11.2 (7.8−16.0)
IIIc 293 60.8 85.7 70.7 60.4 54.6 52.1 9.2 (7.0−12.2)
IVa 47 64.8 65.6 39.4 25.9 23.4 14.6 18.1 (12.3−26.7)
IVb 160 65.5 51.1 38.6 28.4 21.8 17.0 20.3 (15.3−26.9)
aHazards ratio and 95% Confidence Intervals obtained from a Cox model adjusted for age, stage and country.
Fig. 7. Carcinoma of the corpus uteri: patients treated in 1996–98. Survival by FIGO surgical stage, n= 6864.
96 WT CREASMAN, F ODICINO et al
Table 28Carcinoma of the corpus uteri: patients treated in 1996–98. Response to treatment by stage
Ia Ib Ic IIa IIb IIIa IIIb IIIc IVa IVb
Missing 345 984 387 109 108 172 23 98 10 51
Complete response 761 2051 1052 308 360 363 27 156 10 26
Partial response 6 14 12 0 6 19 8 14 7 15
Stable disease 29 30 11 6 11 22 5 20 9 21
Progressive disease 4 14 17 6 13 33 16 34 14 47
Not assessable 17 55 34 15 21 31 10 17 3 16
Stage Patients(n)
Mean age(yr)
Overall survival (%) at
1 year 2 years 3 years 4 years 5 years
Hazards ratio a
(95% CI)
0 2 67.5 100.0 100.0 100.0 100.0 – –
Ia 107 70.6 89.6 79.8 70.6 61.3 49.6 Reference
Ib 130 72.0 91.1 75.3 65.7 55.7 51.0 0.9 (0.6−1.4)
II 67 72.9 75.2 55.1 48.2 48.2 45.8 1.2 (0.8−2.0)
III 64 69.7 72.8 57.4 44.6 40.7 35.4 1.8 (1.1−2.9)
IVa 13 64.8 44.0 35.2 26.4 15.8 – 6.6 (2.7−16.2)
IVb 33 66.1 53.8 20.2 16.2 16.2 16.2 4.4 (2.6−7.4)
aHazards ratio and 95% Confidence Intervals obtained from a Cox model adjusted for age, stage and country.
Fig. 8. Carcinoma of the corpus uteri: patients treated in 1996–98. Survival by clinical stage, n= 416.
CARCINOMA OF THE CORPUS UTERI 97
Table 29Carcinoma of the corpus uteri: patients treated in 1996–98. Relapses by stage
Ia Ib Ic IIa IIb IIIa IIIb IIIc IVa IVb
Local (regional) 11 43 24 11 19 13 5 11 3 2
Metastatic 8 37 49 18 22 37 6 27 5 9
Local and metastatic 3 8 6 4 7 9 2 11 2 5
Missing site 29 113 85 24 33 43 6 13 3 11
Total 51 201 164 57 81 102 19 62 13 27
Stage Patients(n)
Mean age(yr)
Overall survival (%) at
1 year 2 years 3 years 4 years 5 years
Hazards ratio a
(95% CI)
I Surgical 5017 62.8 98.1 95.3 92.5 90.4 88.0 Reference
II Surgical 790 63.6 96.7 88.8 82.4 78.3 74.8 2.3 (1.9−2.7)
III Surgical 850 62.8 86.8 72.9 64.2 58.6 55.0 5.6 (4.9−6.4)
IV Surgical 207 65.4 54.5 38.7 27.7 22.2 16.2 15.6 (13.0−18.7)
I Clinical 239 71.3 90.5 77.6 68.3 58.7 50.7 3.2 (2.6−4.0)
II Clinical 67 72.9 75.2 55.1 48.2 48.2 45.8 4.9 (3.5−6.8)
III Clinical 64 69.7 72.8 57.4 44.6 40.7 35.4 5.4 (3.9−7.6)
IV Clinical 46 65.7 51.1 24.3 18.9 15.8 15.8 21.5 (15.3−30.3)
aHazards ratio and 95% Confidence Intervals obtained from a Cox model adjusted for age, stage and country.
Fig. 9. Carcinoma of the corpus uteri: patients treated in 1996–98. Survival by mode of staging, n= 7280.
98 WT CREASMAN, F ODICINO et al
Grade Patients(n)
Mean age(yr)
Overall survival (%) at
1 year 2 years 3 years 4 years 5 years
Hazards ratio a
(95% CI)
Surgical G1 2447 61.5 98.9 97.1 95.5 93.8 92.1 Reference
Surgical G2 1744 64.1 98.2 96.0 92.5 90.2 87.5 1.3 (1.1−1.7)
Surgical G3 593 64.5 94.9 87.9 81.6 77.9 74.5 3.0 (2.4−3.7)
Clinical G1 71 74.7 89.9 76.4 62.8 52.6 44.9 4.9 (3.2−7.5)
Clinical G2 58 75.4 92.9 78.2 72.3 60.9 51.0 3.8 (2.4−6.2)
Clinical G3 30 74.0 79.3 54.1 39.7 31.7 31.7 8.3 (4.9−14.2)
aHazards ratio and 95% Confidence Intervals obtained from a Cox model adjusted for age, stage and country.
Fig. 10. Carcinoma of the corpus uteri: patients treated in 1996–98. Survival in Stage I patients by grade of differentiation and mode of staging,n= 4943.
CARCINOMA OF THE CORPUS UTERI 99
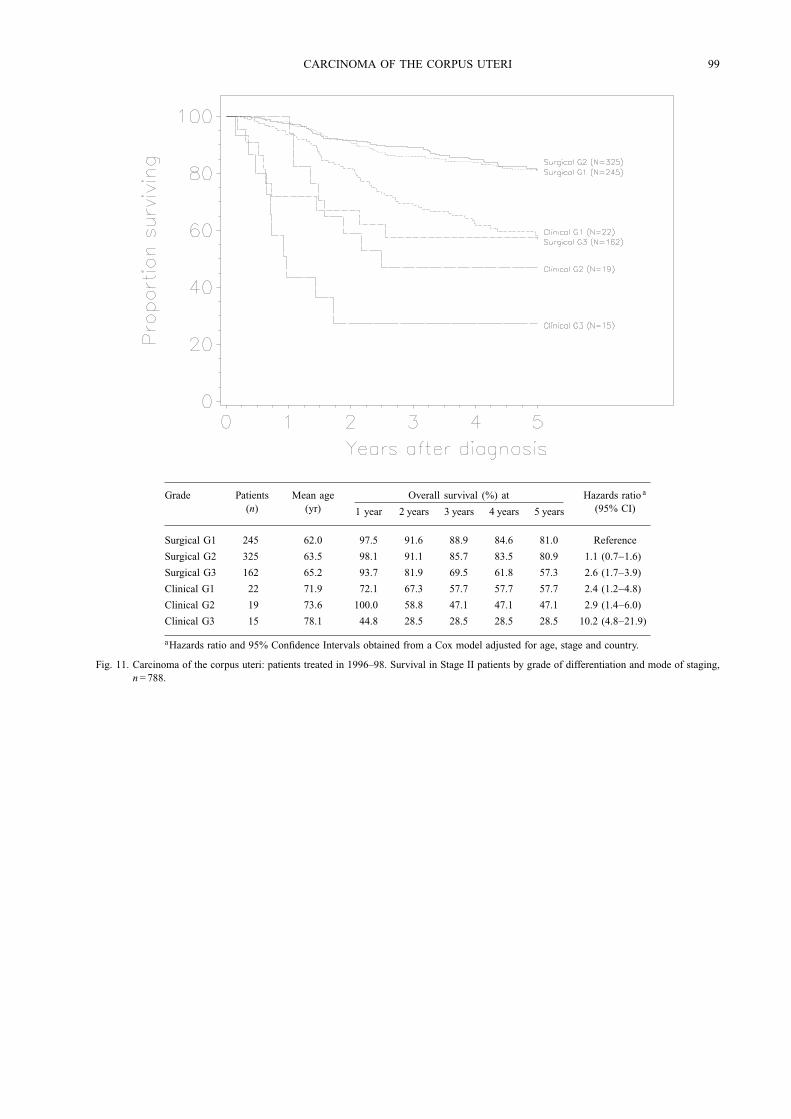
Grade Patients(n)
Mean age(yr)
Overall survival (%) at
1 year 2 years 3 years 4 years 5 years
Hazards ratio a
(95% CI)
Surgical G1 245 62.0 97.5 91.6 88.9 84.6 81.0 Reference
Surgical G2 325 63.5 98.1 91.1 85.7 83.5 80.9 1.1 (0.7−1.6)
Surgical G3 162 65.2 93.7 81.9 69.5 61.8 57.3 2.6 (1.7−3.9)
Clinical G1 22 71.9 72.1 67.3 57.7 57.7 57.7 2.4 (1.2−4.8)
Clinical G2 19 73.6 100.0 58.8 47.1 47.1 47.1 2.9 (1.4−6.0)
Clinical G3 15 78.1 44.8 28.5 28.5 28.5 28.5 10.2 (4.8−21.9)
aHazards ratio and 95% Confidence Intervals obtained from a Cox model adjusted for age, stage and country.
Fig. 11. Carcinoma of the corpus uteri: patients treated in 1996–98. Survival in Stage II patients by grade of differentiation and mode of staging,n= 788.
100 WT CREASMAN, F ODICINO et al
Grade Patients(n)
Mean age(yr)
Overall survival (%) at
1 year 2 years 3 years 4 years 5 years
Hazards ratio a
(95% CI)
Surgical G1 169 60.9 95.8 90.3 83.3 75.5 69.7 Reference
Surgical G2 314 62.6 91.5 80.6 73.1 67.0 63.3 1.2 (0.9−1.8)
Surgical G3 290 64.2 77.2 58.3 46.1 42.4 39.6 2.4 (1.7−3.5)
Clinical G1 13 68.5 92.3 83.9 64.2 53.5 40.1 1.5 (0.6−3.7)
Clinical G2 14 71.6 71.4 50.0 50.0 50.0 50.0 1.8 (0.7−4.2)
Clinical G3 24 70.5 56.5 41.8 36.6 30.9 24.1 3.4 (1.9−6.2)
aHazards ratio and 95% Confidence Intervals obtained from a Cox model adjusted for age, stage and country.
Fig. 12. Carcinoma of the corpus uteri: patients treated in 1996–98. Survival in Stage III patients by grade of differentiation and mode of staging,n= 824.
CARCINOMA OF THE CORPUS UTERI 101
Grade Patients(n)
Mean age(yr)
Overall survival (%) at
1 year 2 years 3 years 4 years 5 years
Hazards ratio a
(95% CI)
Surgical G1 29 64.3 57.1 45.7 41.7 36.5 27.4 Reference
Surgical G2 55 66.1 73.6 57.7 43.5 35.2 22.2 0.8 (0.4−1.5)
Surgical G3 93 64.2 46.2 32.0 20.7 16.4 14.5 1.7 (1.0−3.0)
Clinical G1 6 66.3 83.3 33.3 16.7 16.7 16.7 1.1 (0.4−3.3)
Clinical G2 8 65.9 62.5 25.0 25.0 25.0 – 1.1 (0.4−3.0)
Clinical G3 17 65.5 31.3 23.4 15.6 15.6 – 3.7 (1.5−8.8)
aHazards ratio and 95% Confidence Intervals obtained from a Cox model adjusted for age, stage and country.
Fig. 13. Carcinoma of the corpus uteri: patients treated in 1996–98. Survival in Stage IV patients by grade of differentiation and mode of staging,n= 208.
102 WT CREASMAN, F ODICINO et al
Histotype Patients(n)
Mean age(yr)
Overall survival (%) at
1 year 2 years 3 years 4 years 5 years
Hazards ratio a
(95% CI)
Endometrioid 6231 63.3 95.6 90.8 86.9 83.8 81.2 Reference
Adenosquamous 317 62.9 91.6 85.2 80.7 78.8 76.1 1.1 (0.9−1.4)
Mucinous 74 64.5 95.9 87.5 78.7 78.7 76.2 0.9 (0.6−1.5)
Papillary 335 66.4 84.9 70.2 59.1 54.4 48.4 1.7 (1.4−2.0)
Clear cell 185 67.6 85.9 73.1 66.1 61.5 59.7 1.6 (1.2−2.0)
Squamous 28 62.2 81.8 78.0 78.0 73.4 66.1 1.8 (0.9−3.7)
Other 285 62.4 82.2 67.6 61.2 56.0 50.4 2.0 (1.6−2.4)
aHazards ratio and 95% Confidence Intervals obtained from a Cox model adjusted for age, stage and country.
Fig. 14. Carcinoma of the corpus uteri: patients treated in 1996–98. Survival by histological type, n= 7455.
CARCINOMA OF THE CORPUS UTERI 103
Histotype Patients(n)
Mean age(yr)
Overall survival (%) at
1 year 2 years 3 years 4 years 5 years
Hazards ratio a
(95% CI)
Endometrioid 4453 62.7 98.4 96.0 93.4 91.1 88.8 Reference
Adenosquamous 187 63.2 96.7 92.3 89.5 88.2 85.5 1.4 (0.9−2.1)
Mucinous 41 64.1 100.0 97.5 86.8 86.8 86.8 1.2 (0.5−2.8)
Papillary 123 63.7 98.4 90.7 84.5 82.5 76.8 2.2 (1.4−3.4)
Clear cell 86 66.1 94.2 88.3 85.8 81.9 81.9 1.9 (1.1−3.2)
Squamous 18 61.9 83.3 83.3 83.3 83.3 83.3 2.7 (0.9−8.4)
Other 95 63.3 91.4 83.4 79.7 78.4 72.8 2.8 (1.8−4.3)
aHazards ratio and 95% Confidence Intervals obtained from a Cox model adjusted for age, stage and country.
Fig. 15. Carcinoma of the corpus uteri: patients treated in 1996–98. Survival in Stage I patients by histological type, n= 5003.
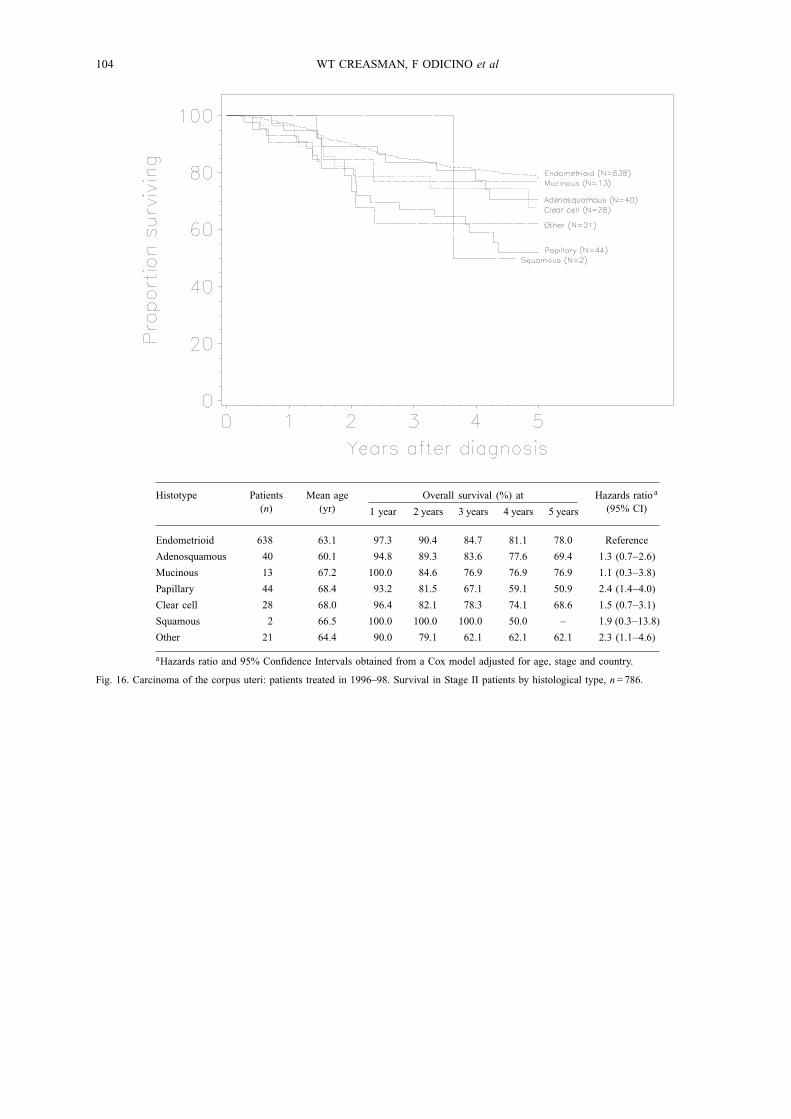
104 WT CREASMAN, F ODICINO et al
Histotype Patients(n)
Mean age(yr)
Overall survival (%) at
1 year 2 years 3 years 4 years 5 years
Hazards ratio a
(95% CI)
Endometrioid 638 63.1 97.3 90.4 84.7 81.1 78.0 Reference
Adenosquamous 40 60.1 94.8 89.3 83.6 77.6 69.4 1.3 (0.7−2.6)
Mucinous 13 67.2 100.0 84.6 76.9 76.9 76.9 1.1 (0.3−3.8)
Papillary 44 68.4 93.2 81.5 67.1 59.1 50.9 2.4 (1.4−4.0)
Clear cell 28 68.0 96.4 82.1 78.3 74.1 68.6 1.5 (0.7−3.1)
Squamous 2 66.5 100.0 100.0 100.0 50.0 – 1.9 (0.3−13.8)
Other 21 64.4 90.0 79.1 62.1 62.1 62.1 2.3 (1.1−4.6)
aHazards ratio and 95% Confidence Intervals obtained from a Cox model adjusted for age, stage and country.
Fig. 16. Carcinoma of the corpus uteri: patients treated in 1996–98. Survival in Stage II patients by histological type, n= 786.
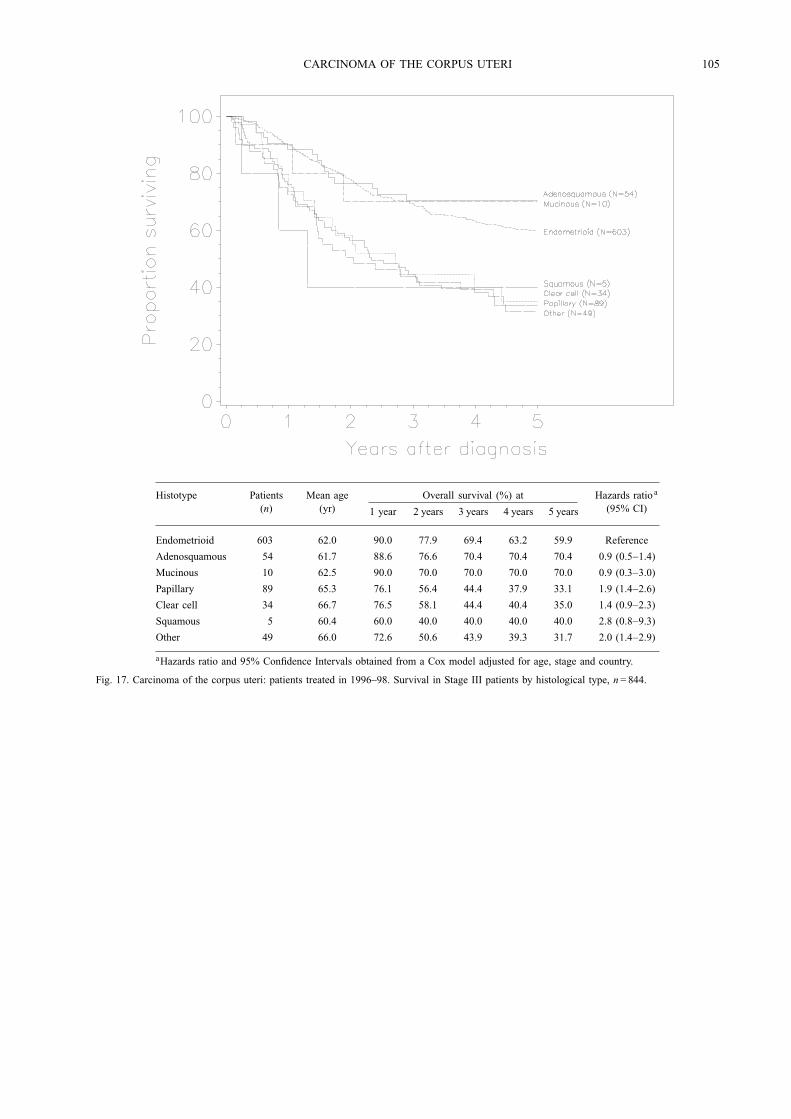
CARCINOMA OF THE CORPUS UTERI 105
Histotype Patients(n)
Mean age(yr)
Overall survival (%) at
1 year 2 years 3 years 4 years 5 years
Hazards ratio a
(95% CI)
Endometrioid 603 62.0 90.0 77.9 69.4 63.2 59.9 Reference
Adenosquamous 54 61.7 88.6 76.6 70.4 70.4 70.4 0.9 (0.5−1.4)
Mucinous 10 62.5 90.0 70.0 70.0 70.0 70.0 0.9 (0.3−3.0)
Papillary 89 65.3 76.1 56.4 44.4 37.9 33.1 1.9 (1.4−2.6)
Clear cell 34 66.7 76.5 58.1 44.4 40.4 35.0 1.4 (0.9−2.3)
Squamous 5 60.4 60.0 40.0 40.0 40.0 40.0 2.8 (0.8−9.3)
Other 49 66.0 72.6 50.6 43.9 39.3 31.7 2.0 (1.4−2.9)
aHazards ratio and 95% Confidence Intervals obtained from a Cox model adjusted for age, stage and country.
Fig. 17. Carcinoma of the corpus uteri: patients treated in 1996–98. Survival in Stage III patients by histological type, n= 844.
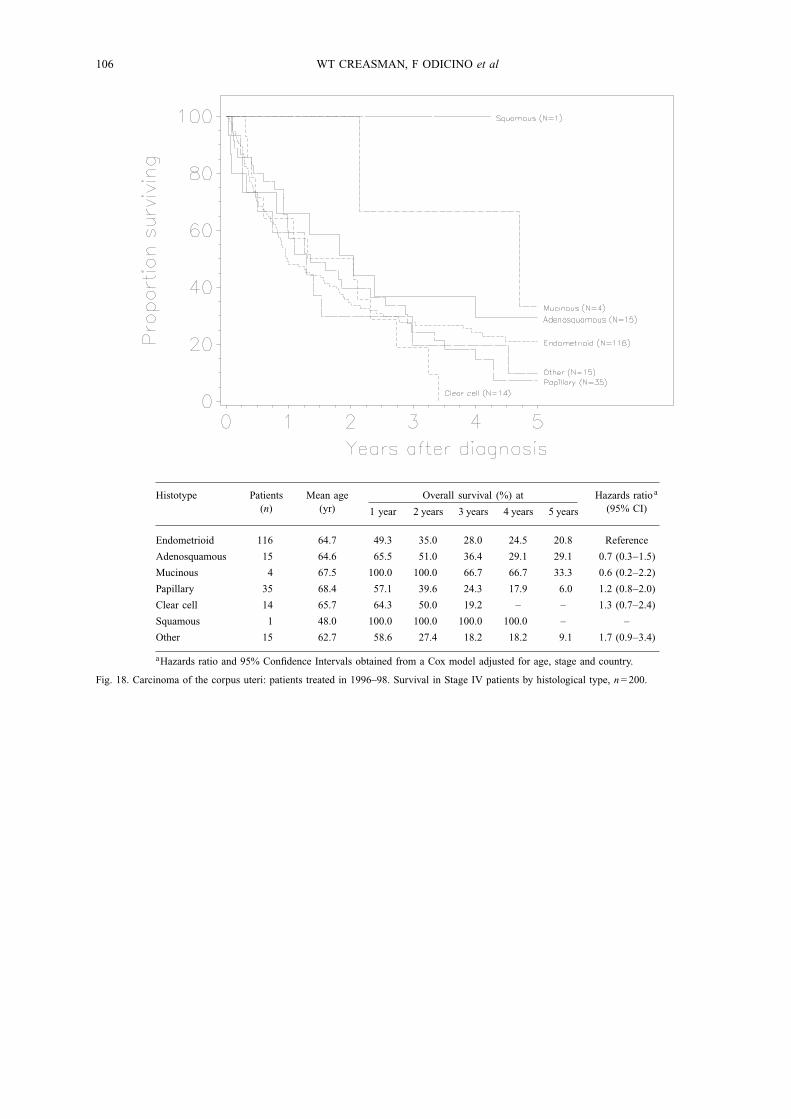
106 WT CREASMAN, F ODICINO et al
Histotype Patients(n)
Mean age(yr)
Overall survival (%) at
1 year 2 years 3 years 4 years 5 years
Hazards ratio a
(95% CI)
Endometrioid 116 64.7 49.3 35.0 28.0 24.5 20.8 Reference
Adenosquamous 15 64.6 65.5 51.0 36.4 29.1 29.1 0.7 (0.3−1.5)
Mucinous 4 67.5 100.0 100.0 66.7 66.7 33.3 0.6 (0.2−2.2)
Papillary 35 68.4 57.1 39.6 24.3 17.9 6.0 1.2 (0.8−2.0)
Clear cell 14 65.7 64.3 50.0 19.2 – – 1.3 (0.7−2.4)
Squamous 1 48.0 100.0 100.0 100.0 100.0 – –
Other 15 62.7 58.6 27.4 18.2 18.2 9.1 1.7 (0.9−3.4)
aHazards ratio and 95% Confidence Intervals obtained from a Cox model adjusted for age, stage and country.
Fig. 18. Carcinoma of the corpus uteri: patients treated in 1996–98. Survival in Stage IV patients by histological type, n= 200.
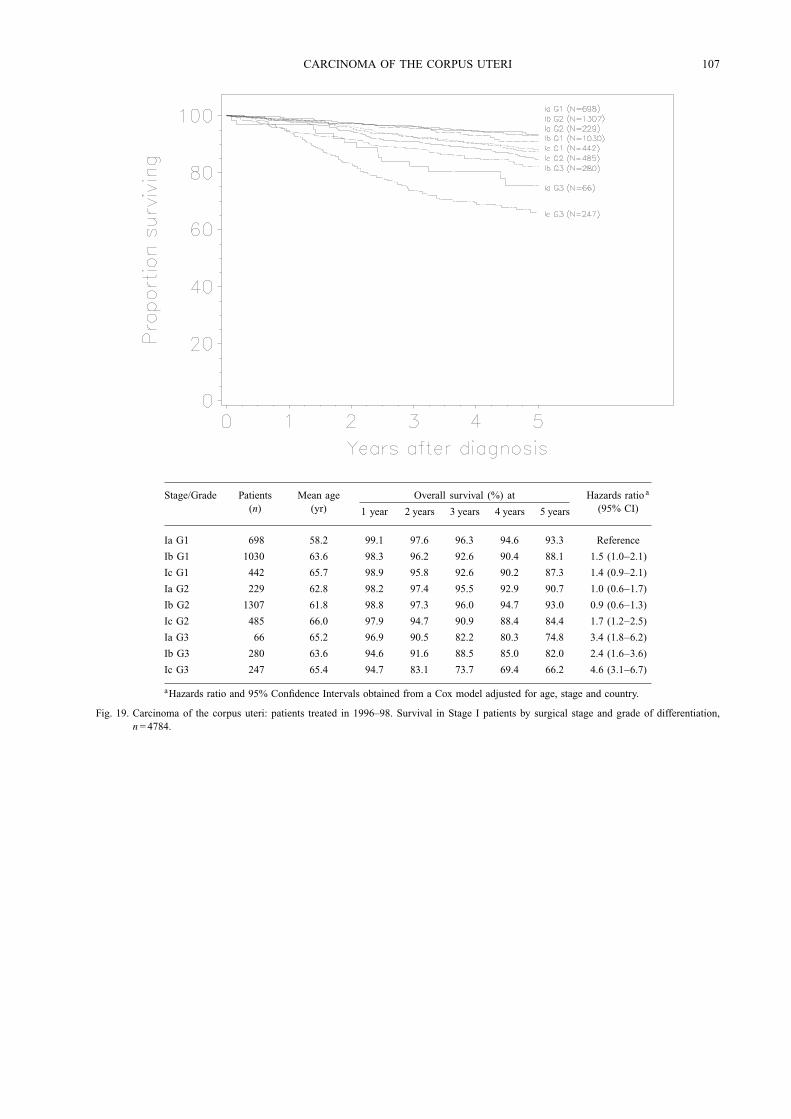
CARCINOMA OF THE CORPUS UTERI 107
Stage/Grade Patients(n)
Mean age(yr)
Overall survival (%) at
1 year 2 years 3 years 4 years 5 years
Hazards ratio a
(95% CI)
Ia G1 698 58.2 99.1 97.6 96.3 94.6 93.3 Reference
Ib G1 1030 63.6 98.3 96.2 92.6 90.4 88.1 1.5 (1.0−2.1)
Ic G1 442 65.7 98.9 95.8 92.6 90.2 87.3 1.4 (0.9−2.1)
Ia G2 229 62.8 98.2 97.4 95.5 92.9 90.7 1.0 (0.6−1.7)
Ib G2 1307 61.8 98.8 97.3 96.0 94.7 93.0 0.9 (0.6−1.3)
Ic G2 485 66.0 97.9 94.7 90.9 88.4 84.4 1.7 (1.2−2.5)
Ia G3 66 65.2 96.9 90.5 82.2 80.3 74.8 3.4 (1.8−6.2)
Ib G3 280 63.6 94.6 91.6 88.5 85.0 82.0 2.4 (1.6−3.6)
Ic G3 247 65.4 94.7 83.1 73.7 69.4 66.2 4.6 (3.1−6.7)
aHazards ratio and 95% Confidence Intervals obtained from a Cox model adjusted for age, stage and country.
Fig. 19. Carcinoma of the corpus uteri: patients treated in 1996–98. Survival in Stage I patients by surgical stage and grade of differentiation,n= 4784.
108 WT CREASMAN, F ODICINO et al
Stage/Grade Patients(n)
Mean age(yr)
Overall survival (%) at
1 year 2 years 3 years 4 years 5 years
Hazards ratio a
(95% CI)
IIa G1 131 62.2 96.9 94.5 92.9 86.8 85.6 Reference
IIb G1 114 61.9 98.2 88.2 84.3 82.2 75.7 1.4 (0.8−2.6)
IIa G2 142 63.7 97.9 91.9 87.2 85.5 84.3 1.1 (0.6−2.1)
IIb G2 183 63.2 98.3 90.4 84.6 81.9 78.3 1.3 (0.7−2.3)
IIa G3 62 65.2 91.9 83.5 72.6 64.2 61.1 2.8 (1.5−5.2)
IIb G3 100 65.2 94.9 80.9 67.6 60.3 54.9 3.4 (2.0−6.0)
aHazards ratio and 95% Confidence Intervals obtained from a Cox model adjusted for age, stage and country.
Fig. 20. Carcinoma of the corpus uteri: patients treated in 1996–98. Survival in Stage II patients by surgical stage and grade of differentiation,n= 732.
CARCINOMA OF THE CORPUS UTERI 109
Stage/Grade Patients(n)
Mean age(yr)
Overall survival (%) at
1 year 2 years 3 years 4 years 5 years
Hazards ratio a
(95% CI)
IIIa G1 114 61.6 97.4 94.7 88.2 81.0 76.9 Reference
IIIb G1 12 65.3 73.9 46.2 46.2 37.0 24.6 5.6 (2.4−12.8)
IIIc G1 43 58.0 97.6 90.0 79.6 70.7 62.1 2.1 (1.0−4.1)
IIIa G2 181 62.7 94.3 85.4 78.5 73.8 69.4 1.3 (0.8−2.2)
IIIb G2 30 69.6 76.7 60.0 60.0 48.0 42.7 2.9 (1.5−5.5)
IIIc G2 103 60.4 91.0 78.5 67.7 60.7 59.0 2.6 (1.6−4.3)
IIIa G3 142 65.6 77.1 55.1 43.0 40.6 37.5 3.7 (2.3−5.8)
IIIb G3 27 69.5 61.5 44.6 26.7 22.3 17.3 5.2 (2.8−9.6)
IIIc G3 121 61.4 80.8 65.0 54.0 48.9 47.4 3.5 (2.2−5.6)
aHazards ratio and 95% Confidence Intervals obtained from a Cox model adjusted for age, stage and country.
Fig. 21. Carcinoma of the corpus uteri: patients treated in 1996–98. Survival in Stage III patients by surgical stage and grade of differentiation,n= 773.
110 WT CREASMAN, F ODICINO et al
Stage/Grade Patients(n)
Mean age(yr)
Overall survival (%) at
1 year 2 years 3 years 4 years 5 years
Hazards ratio a
(95% CI)
IVa G1 7 64.0 69.2 51.9 34.6 34.6 – Reference
IVb G1 22 64.4 53.5 43.8 43.8 37.0 26.5 1.2 (0.4−3.8)
IVa G2 14 64.6 78.6 57.1 49.5 41.3 13.8 0.7 (0.2−3.0)
IVb G2 41 66.6 71.8 58.0 41.4 33.1 25.8 0.9 (0.3−2.8)
IVa G3 18 63.5 55.6 33.3 16.7 16.7 16.7 1.6 (0.5−5.4)
IVb G3 75 64.4 43.8 31.7 22.0 16.2 13.3 2.0 (0.6−6.0)
aHazards ratio and 95% Confidence Intervals obtained from a Cox model adjusted for age, stage and country.
Fig. 22. Carcinoma of the corpus uteri: patients treated in 1996–98. Survival in Stage IV patients by surgical stage and grade of differentiation,n= 177.
CARCINOMA OF THE CORPUS UTERI 111
Treatment Patients(n)
Mean age(yr)
Overall survival (%) at
1 year 2 years 3 years 4 years 5 years
Hazards ratio a
(95% CI)
No treatment 71 73.2 47.8 35.1 21.5 19.3 12.9 5.5 (4.0−7.7)
Surgery alone 2569 62.0 96.5 93.8 91.2 88.9 86.9 Reference
RT alone 402 73.6 84.6 65.7 53.5 46.8 40.9 1.6 (1.2−2.0)
Radio-surgery 102 61.8 93.0 88.7 79.9 75.0 73.2 1.1 (0.7−1.7)
Surgery + adj RT 3696 63.7 96.8 91.3 87.1 84.0 81.0 0.8 (0.7−1.0)
Surgery + adj CT 462 59.6 84.0 71.5 65.1 59.2 54.9 1.4 (1.2−1.8)
Adjuvant HT 44 65.7 83.5 73.1 64.3 64.3 64.3 1.2 (0.7−2.1)
Other 146 65.9 64.3 46.5 34.7 32.1 29.8 3.0 (2.3−3.9)
aHazards ratio and 95% Confidence Intervals obtained from a Cox model adjusted for age, stage and country.
Fig. 23. Carcinoma of the corpus uteri: patients treated in 1996–98. Survival by mode of treatment, n= 7492.
112 WT CREASMAN, F ODICINO et al
Stage/Treatment Patients(n)
Mean age(yr)
Overall survival (%) at
1 year 2 years 3 years 4 years 5 years
Hazards ratio a
(95% CI)
Ia Surgery 799 58.4 99.2 98.2 97.4 95.9 94.2 Reference
Ib Surgery 1304 62.8 98.3 96.8 94.5 92.7 91.2 1.5 (1.0−2.1)
Ic Surgery 161 69.2 94.9 86.5 80.3 76.5 72.4 3.4 (2.2−5.2)
Ia Adj RT 204 62.4 98.5 97.5 93.4 93.4 90.1 1.5 (0.8−2.6)
Ib Adj RT 1286 62.6 98.5 96.2 94.2 92.3 89.8 1.6 (1.1−2.3)
Ic Adj RT 981 65.4 98.1 93.7 89.4 86.7 83.4 2.4 (1.7−3.5)
aHazards ratio and 95% Confidence Intervals obtained from a Cox model adjusted for age, stage and country.
Fig. 24. Carcinoma of the corpus uteri: patients treated in 1996–98. Survival in Stage I patients by surgical stage and mode of treatment, n= 4735.
CARCINOMA OF THE CORPUS UTERI 113
Stage/Treatment Patients(n)
Mean age(yr)
Overall survival (%) at
1 year 2 years 3 years 4 years 5 years
Hazards ratio a
(95% CI)
IIa Surgery 52 62.8 96.1 89.8 83.2 78.5 75.8 Reference
IIb Surgery 45 66.3 97.8 83.6 78.6 75.7 68.2 1.0 (0.5−2.1)
IIa Adj RT 282 63.8 97.1 91.1 87.6 82.9 81.2 0.7 (0.4−1.4)
IIb Adj RT 329 63.1 97.9 89.0 82.5 78.9 74.9 0.9 (0.5−1.7)
aHazards ratio and 95% Confidence Intervals obtained from a Cox model adjusted for age and country.
Fig. 25. Carcinoma of the corpus uteri: patients treated in 1996–98. Survival in Stage II patients by surgical stage and mode of treatment, n= 708.
114 WT CREASMAN, F ODICINO et al
Stage/Treatment Patients(n)
Mean age(yr)
Overall survival (%) at
1 year 2 years 3 years 4 years 5 years
Hazards ratio a
(95% CI)
IIIa Surgery 62 66.8 86.4 75.3 61.4 57.0 53.9 Reference
IIIb Surgery 8 70.3 37.5 37.5 18.8 – – 4.7 (1.9−11.6)
IIIc Surgery 28 63.6 58.5 45.5 36.4 36.4 28.3 3.3 (1.7−6.4)
IIIa Adj RT 299 63.8 91.9 78.0 71.6 66.2 62.7 0.7 (0.5−1.2)
IIIb Adj RT 38 69.2 78.4 61.6 61.6 52.3 44.6 1.1 (0.6−2.0)
IIIc Adj RT 151 62.0 92.6 78.3 65.5 58.7 57.4 1.0 (0.6−1.6)
aHazards ratio and 95% Confidence Intervals obtained from a Cox model adjusted for age and country.
Fig. 26. Carcinoma of the corpus uteri: patients treated in 1996–98. Survival in Stage III patients by surgical stage and mode of treatment, n= 586.
CARCINOMA OF THE CORPUS UTERI 115
Stage/Treatment Patients(n)
Mean age(yr)
Overall survival (%) at
1 year 2 years 3 years 4 years 5 years
Hazards ratio a
(95% CI)
IVa Surgery 4 66.3 50.0 – – – – Reference
IVb Surgery 25 66.2 44.7 39.7 28.4 18.9 18.9 0.8 (0.2−3.6)
IVa Adj RT 13 63.3 53.8 30.8 23.1 23.1 23.1 0.9 (0.2−4.9)
IVb Adj RT 27 66.8 73.1 60.5 47.6 33.3 18.5 0.4 (0.1−1.9)
aHazards ratio and 95% Confidence Intervals obtained from a Cox model adjusted for age and country.
Fig. 27. Carcinoma of the corpus uteri: patients treated in 1996–98. Survival in Stage IV patients by surgical stage and mode of treatment, n= 69.
116 WT CREASMAN, F ODICINO et al
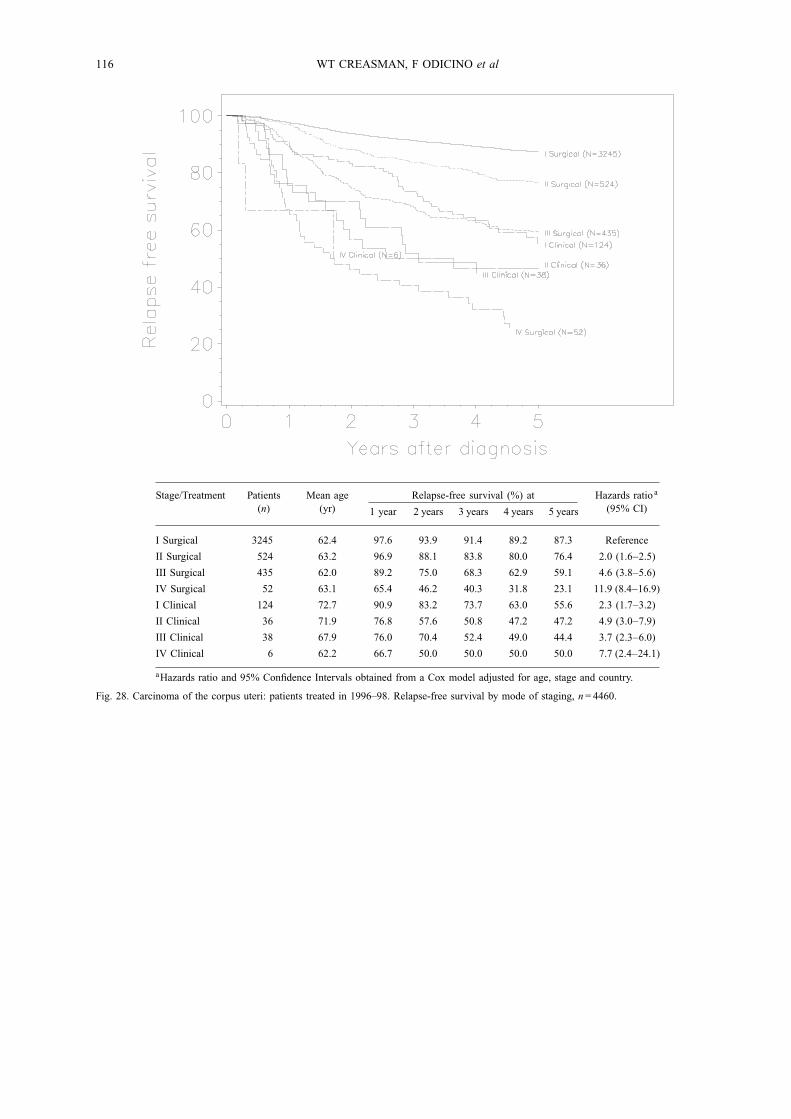
Stage/Treatment Patients(n)
Mean age(yr)
Relapse-free survival (%) at
1 year 2 years 3 years 4 years 5 years
Hazards ratio a
(95% CI)
I Surgical 3245 62.4 97.6 93.9 91.4 89.2 87.3 Reference
II Surgical 524 63.2 96.9 88.1 83.8 80.0 76.4 2.0 (1.6−2.5)
III Surgical 435 62.0 89.2 75.0 68.3 62.9 59.1 4.6 (3.8−5.6)
IV Surgical 52 63.1 65.4 46.2 40.3 31.8 23.1 11.9 (8.4−16.9)
I Clinical 124 72.7 90.9 83.2 73.7 63.0 55.6 2.3 (1.7−3.2)
II Clinical 36 71.9 76.8 57.6 50.8 47.2 47.2 4.9 (3.0−7.9)
III Clinical 38 67.9 76.0 70.4 52.4 49.0 44.4 3.7 (2.3−6.0)
IV Clinical 6 62.2 66.7 50.0 50.0 50.0 50.0 7.7 (2.4−24.1)
aHazards ratio and 95% Confidence Intervals obtained from a Cox model adjusted for age, stage and country.
Fig. 28. Carcinoma of the corpus uteri: patients treated in 1996–98. Relapse-free survival by mode of staging, n= 4460.
CARCINOMA OF THE CORPUS UTERI 117
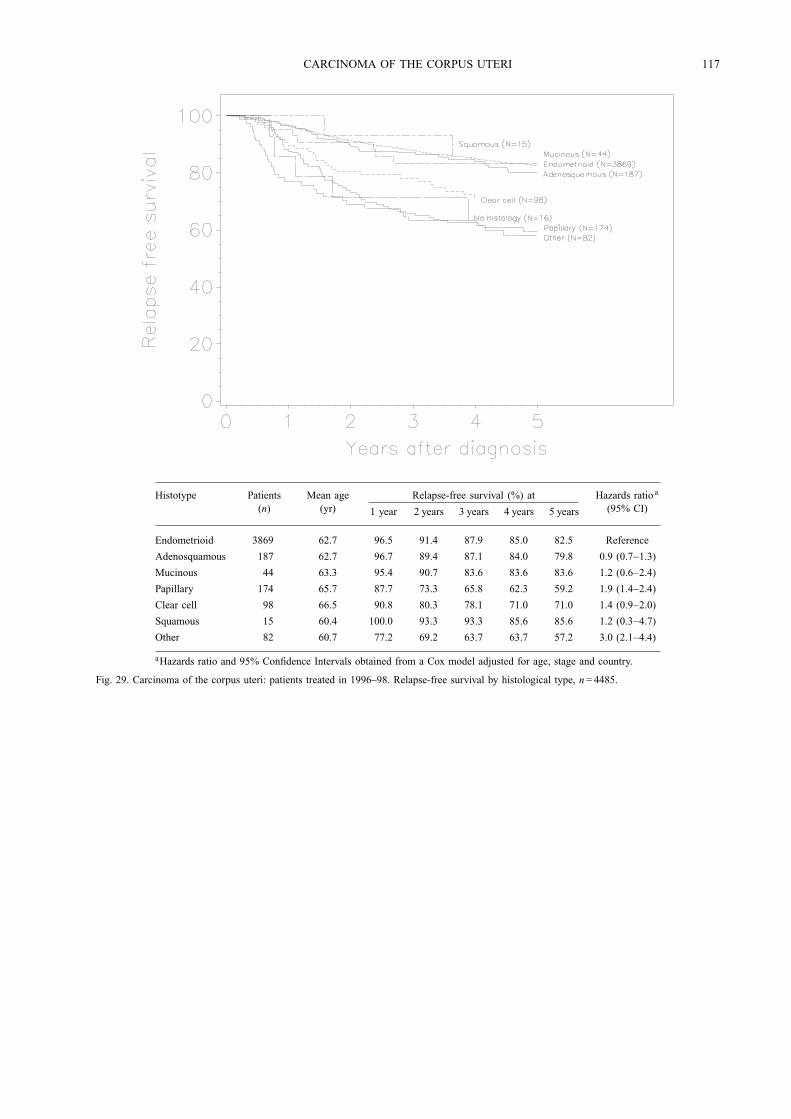
Histotype Patients(n)
Mean age(yr)
Relapse-free survival (%) at
1 year 2 years 3 years 4 years 5 years
Hazards ratio a
(95% CI)
Endometrioid 3869 62.7 96.5 91.4 87.9 85.0 82.5 Reference
Adenosquamous 187 62.7 96.7 89.4 87.1 84.0 79.8 0.9 (0.7−1.3)
Mucinous 44 63.3 95.4 90.7 83.6 83.6 83.6 1.2 (0.6−2.4)
Papillary 174 65.7 87.7 73.3 65.8 62.3 59.2 1.9 (1.4−2.4)
Clear cell 98 66.5 90.8 80.3 78.1 71.0 71.0 1.4 (0.9−2.0)
Squamous 15 60.4 100.0 93.3 93.3 85.6 85.6 1.2 (0.3−4.7)
Other 82 60.7 77.2 69.2 63.7 63.7 57.2 3.0 (2.1−4.4)
aHazards ratio and 95% Confidence Intervals obtained from a Cox model adjusted for age, stage and country.
Fig. 29. Carcinoma of the corpus uteri: patients treated in 1996–98. Relapse-free survival by histological type, n= 4485.
118 WT CREASMAN, F ODICINO et al
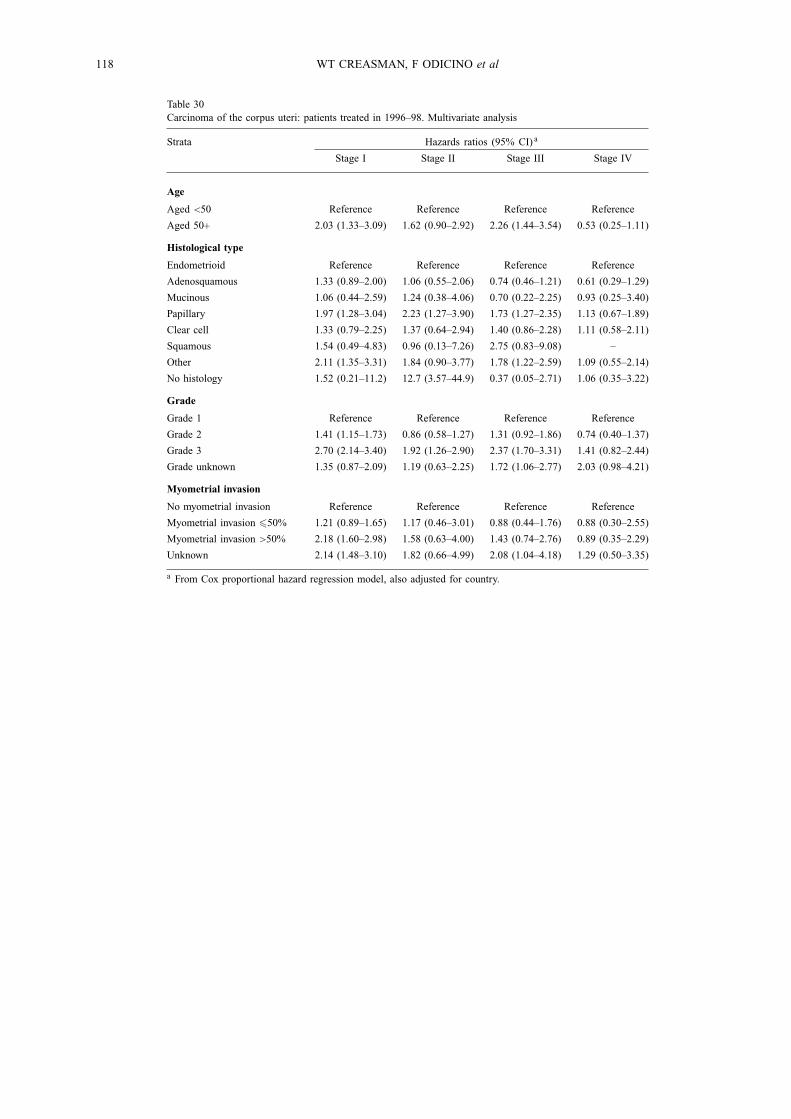
Table 30Carcinoma of the corpus uteri: patients treated in 1996–98. Multivariate analysis
Strata Hazards ratios (95% CI) a
Stage I Stage II Stage III Stage IV
Age
Aged <50 Reference Reference Reference Reference
Aged 50+ 2.03 (1.33–3.09) 1.62 (0.90–2.92) 2.26 (1.44–3.54) 0.53 (0.25–1.11)
Histological type
Endometrioid Reference Reference Reference Reference
Adenosquamous 1.33 (0.89–2.00) 1.06 (0.55–2.06) 0.74 (0.46–1.21) 0.61 (0.29–1.29)
Mucinous 1.06 (0.44–2.59) 1.24 (0.38–4.06) 0.70 (0.22–2.25) 0.93 (0.25–3.40)
Papillary 1.97 (1.28–3.04) 2.23 (1.27–3.90) 1.73 (1.27–2.35) 1.13 (0.67–1.89)
Clear cell 1.33 (0.79–2.25) 1.37 (0.64–2.94) 1.40 (0.86–2.28) 1.11 (0.58–2.11)
Squamous 1.54 (0.49–4.83) 0.96 (0.13–7.26) 2.75 (0.83–9.08) –
Other 2.11 (1.35–3.31) 1.84 (0.90–3.77) 1.78 (1.22–2.59) 1.09 (0.55–2.14)
No histology 1.52 (0.21–11.2) 12.7 (3.57–44.9) 0.37 (0.05–2.71) 1.06 (0.35–3.22)
Grade
Grade 1 Reference Reference Reference Reference
Grade 2 1.41 (1.15–1.73) 0.86 (0.58–1.27) 1.31 (0.92–1.86) 0.74 (0.40–1.37)
Grade 3 2.70 (2.14–3.40) 1.92 (1.26–2.90) 2.37 (1.70–3.31) 1.41 (0.82–2.44)
Grade unknown 1.35 (0.87–2.09) 1.19 (0.63–2.25) 1.72 (1.06–2.77) 2.03 (0.98–4.21)
Myometrial invasion
No myometrial invasion Reference Reference Reference Reference
Myometrial invasion �50% 1.21 (0.89–1.65) 1.17 (0.46–3.01) 0.88 (0.44–1.76) 0.88 (0.30–2.55)
Myometrial invasion >50% 2.18 (1.60–2.98) 1.58 (0.63–4.00) 1.43 (0.74–2.76) 0.89 (0.35–2.29)
Unknown 2.14 (1.48–3.10) 1.82 (0.66–4.99) 2.08 (1.04–4.18) 1.29 (0.50–3.35)
a From Cox proportional hazard regression model, also adjusted for country.