carbon loss from drained organic soils under grassland ... · carbon loss from drained organic...
TRANSCRIPT
www.epa.ie
Report No.
Carbon Loss from Drained Organic Soils under Grassland – CALISTO
Authors: Florence Renou-Wilson, David Wilson, Chris Barry, Bob Foy and Christoph Müller
141
EPA Research Programme 2014–2020
Carbon Loss from Drained Organic Soils under Grassland – CALISTO
(2010-CCRP-MS-1.3)
Final Report
Prepared for the Environmental Protection Agency
by
University College Dublin
Authors:
Florence Renou-Wilson,1 David Wilson,2 Chris Barry,3 Bob Foy3
and Christoph Müller1
1 School of Biology and Environmental Science, University College Dublin;
2 Earthy Matters Environmental Consultants, Glenvar, Co. Donegal;
3 Agri-Food & Biosciences Institute, Belfast
ENVIRONMENTAL PROTECTION AGENCY
An Ghníomhaireacht um Chaomhnú ComhshaoilPO Box 3000, Johnstown Castle, Co. Wexford, Ireland
Telephone: +353 53 916 0600 Fax: +353 53 916 0699 Email: [email protected] Website: www.epa.ie
ii
Environmental Protection Agency 2015
ACKNOWLEDGEMENTSThis report was published as part of the EPA Research Programme 2014–2020. The programme is financed by the Irish Government under the National Development Plan 2007–2013. It is administered on behalf of the Department of the Environment, Heritage and Local Government by the Environmental Protection Agency which has the statutory function of co-ordinating and promoting environmental research.
The authors would like to thank Phillip O’Brien (EPA) for his support and guidance and Gerald Moser (Justus Liebig Universität, Giessen) for help with the gas analysis. Grateful thanks to the farmers for the use of their fields. We are also grateful to Georg Wohlfahrt, Lars Elsgaard and two anonymous referees for their critical comments of our paper published in Biogeosciences.
DISCLAIMERAlthough every effort has been made to ensure the accuracy of the material contained in this publication, complete accuracy cannot be guaranteed. Neither the Environmental Protection Agency nor the author(s) accept any responsibility whatsoever for loss or damage occasioned or claimed to have been occasioned, in part or in full, as a consequence of any person acting, or refraining from acting, as a result of a matter contained in this publication. All or part of this publication may be reproduced without further permission, provided the source is acknowledged.
The EPA STRIVE Programme addresses the need for research in Ireland to inform policymakers and other stakeholders on a range of questions in relation to environmental protection. These reports are intended as contributions to the necessary debate on the protection of the environment.
EPA RESEARCH PROGRAMME 2014–2020
Published by the Environmental Protection Agency, Ireland
ISBN: 978-1-84095-571-2 Price: Free Online version

iii
Details of Project Partners
Dr Florence Renou-WilsonUniversity College Dublin (UCD) School of Biology and Environmental Resource Science WestUniversity College DublinBelfieldDublin 4IrelandEmail: [email protected] Professor Christoph MüllerUCD School of Biology and Environmental Resource Science WestUniversity College DublinBelfieldDublin 4IrelandEmail: [email protected]
Dr David WilsonEarthy Matters Environmental ConsultantsGlenvarKerrykeelCo. DonegalIrelandEmail: [email protected]
Drs Bob Foy and Chris BarryAgriculture, Food and Environmental Science Division (AFBI)Agri-Food & Biosciences Institute Newforge LaneBelfast BT9 5PXNorthern IrelandEmail: [email protected]


v
Table of Contents
Acknowledgements ii
Disclaimer ii
Details of Project Partners iii
Executive Summary vii
1 Introduction 11.1 Background 11.2 Objectives 2
2 Managed Organic Soils: State of Knowledge 42.1 Peat Soils, Organic Soils and Histosols 42.2 Extent of Organic Soils and Utilisation 52.3 Management of Organic Soils under Grassland 6
3 Study Sites 73.1 Climatic Conditions 73.2 Land Use and Soil Characteristics 93.3 Vegetation Profile 10
4 Greenhouse Gas Exchange in Drained Organic Soils under Grassland 114.1 State of Knowledge 114.2 Methodology for Measuring Greenhouse Gas 124.3 Results and Discussion 124.4 Biomass Production/Export 144.5 Methane Fluxes 154.6 Nitrous Oxide Fluxes 16
5 Fluvial Carbon Losses from Drained Organic Soils under Grassland 185.1 State of Knowledge 185.2 Methodology 185.3 Results and Discussion 18
6 Dissolved Organic Matter Bioavailability 206.1 State of Knowledge and Methodology 206.2 Results and Discussion 20
7 Net Ecosystem Carbon Budget of Drained Organic Soils under Grassland 227.1 Methodology 227.2 Complete Net Ecosystem Carbon Budget 22
vi
8 Global Warming Potential 24
9 Implications for Reporting: CO2, CH4, N2O and DOC Emission Factors 25
10 Implications for Climate Change Mitigation Measures 2710.1 Water Table Management as Mitigation Strategy 2710.2 Socio-economic Prospects of Climate-friendly Strategies 2710.3 Other Types of Drained Organic Soils and their Associated Carbon Balance 28
11 Final Observations and Recommendations 30
12 Conclusions 31
Bibliography 32
Acronyms and Annotations 38
vii
Executive Summary
Temperate grasslands on organic soils are diverse due to edaphic properties but also because of regional management practices, and this heterogeneity is reflected in the wide range of greenhouse gas (GHG) flux values reported in the literature. In Ireland, most grasslands on organic soils were drained several decades ago and are managed as extensive pastures with little or no fertilisation. This study describes a two-year study of the net ecosystem carbon balance (NECB) of two such sites and aims to deliver data to allow the Republic of Ireland (ROI) to progress towards a higher-tier reporting level for this land use category (LUC). It also provides a comprehensive overview of carbon (C) dynamics in organic soils by investigating all potential C imports and exports, including fluvial C loss.
Greenhouse gas (GHG) fluxes and waterborne C emissions in a nutrient-rich grassland were determined and compared with values measured from two nutrient-poor organic soils: (i) a deep-drained and (ii) a shallow-drained site.
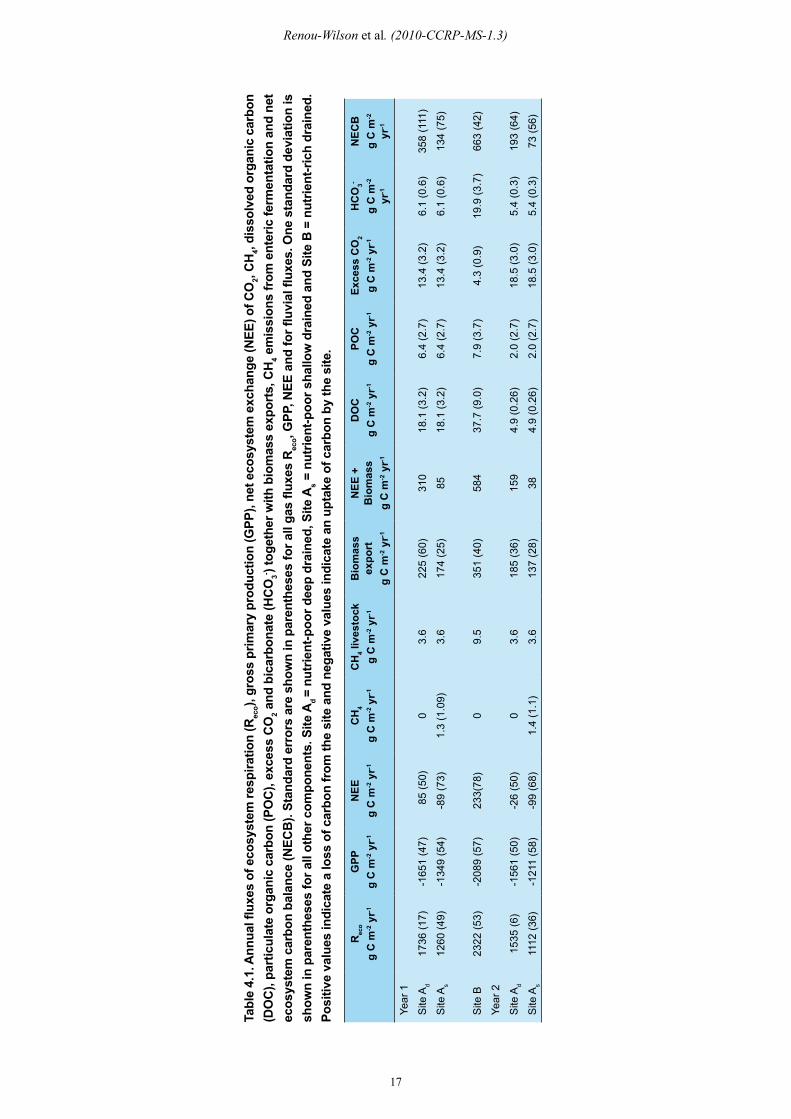
The nutrient-rich site was an annual source of CO2 (233 g C m-2 yr-1), CH4 neutral, and a small source of N2O (0.16 g N2O-N m-2 yr-1). Net ecosystem exchange (NEE) at the shallow-drained nutrient-poor site was -89 and -99 g C m-2 yr-1 in Years 1 and 2 respectively, and NEE at the deep-drained nutrient-poor site was 85 and -26 g C m-2 yr-1 respectively. Low CH4 emissions (1.3 g C m-2 yr-1) were recorded at the shallow-drained nutrient-poor site. Fluvial exports from the nutrient-rich site totalled 69.8 g C m-2 yr-1 with 54% as dissolved organic carbon (DOC). Waterborne C losses from the nutrient-poor site reflected differences in annual runoff totalling 44 g C m-2 yr-1 in Year 1 and 30.8 g C m-2 yr-1 in Year 2.
The NECB of the nutrient-rich grassland was 663 g C m-2 yr-1, with biomass exports being the major component. The NECB of the nutrient-poor deep-drained site was less than half of the nutrient-rich site. Although NEE at the nutrient-poor shallow-drained site was negative (‘C sink’) in both years, high biomass export meant it was a net ‘C source’ (2-year mean NECB 103 g C m-2 yr-1). While the impacts of the nutrient and drainage status on NEE, biomass exports and fluvial C losses were
confirmed, inter-regional differences in management practice and climate were also significant factors that impacted on the overall NECB of these ecosystems. Contrary to expectations, the NECB of nutrient-poor drained organic soils under grasslands is not necessarily a large C source and this has implications for Ireland’s choice of national GHG inventory reporting methodologies. This study can also aid the development of strategies to deliver reduced emissions tailored to local grassland types.
Final Observations and Recommendations
Observation 1: Our field research concluded that (i) nutrient status, (ii) drainage and (iii) local grassland-management practices impacted on GHG fluxes and fluvial C losses as well as biomass exports.
Recommendation 1: As well as using nutrient and drainage status, types of grassland-management practices provide significant additional information for more accurate regional extrapolation of C fluxes. These attributes are in turn intimately linked to past and current management practices in terms of drainage duration and intensity and inputs.
Observation 2: Most Irish grasslands over organic soils were drained several decades ago and are managed as extensively grazed pastures with little or no fertilisation. Nutrient-poor sites in Ireland may not exert appreciable impacts on the atmosphere in terms of NECB, particularly where the mean annual water table remains within -25 cm of the soil surface.
Recommendation 2: Nutrient-poor organic soils that are poorly drained should be targeted to remain wet (water table depth [WT] higher than -25cm) with a continued low input/output system.
Observation 3: Nutrient-rich organic soils under grasslands produce much higher GHG emissions and also represent hotspots for fluvial C losses.
Recommendation 3: Nutrient-rich organic soils should be targeted for rewetting as a strategy to mitigate C emissions.

viii
Observation 4: Current default emission factors (EF) may not be representative of the variety of grasslands over organic soils in Ireland. Our field-measured EF will help Ireland to refine EF and implement Tier 2 methodologies for IPCC inventories more effectively.
Recommendation 4: Continued monitoring to improve annual flux estimates to develop more robust emission factors by averaging inter-annual variability.
Observation 5: While the impacts of the nutrient and drainage status on CO2 exchanges, biomass exports and fluvial C losses were confirmed, inter-regional differences in management practice and climate are also significant factors that impact on the overall NECB of these ecosystems.
Recommendations 5: It is therefore critical to develop strategies to deliver reduced emissions tailored to local grassland types.
Renou-Wilson et al. (2010-CCRP-MS-1.3)
1
1 Introduction
1.1 Background
Climate change is a major threat to environmental and sustainable development and these concerns have resulted in the establishment of the United Nations Framework Convention on Climate Change (UNFCCC). Signs of the resultant adverse impacts of climate change are already evident in Ireland (Desmond et al. 2009). Under the UNFCCC and the Kyoto Protocol, Annex 1 countries, such as Ireland, are obliged to submit annual inventories of GHG emissions in the form of National Inventory Reports (NIR), detailing GHG emissions and sinks from six different sectors: (i) energy, (ii) industrial processes, (iii) solvents and other product use, (iv) agriculture, (v) Land use, Land Use Change and Forestry (LULUCF) and (vi) waste. The International Panel for Climate Change (IPCC) Good Practice Guidance has suggested three tier levels for the estimation of GHG emissions/removals. Tier 1 uses IPCC default emission factors (EFs) with limited separation of area data. Tier 2 uses country-specific EFs and finer-scale separation of data and Tier 3 uses more complex country-specific approaches (Penman et al. 2003). In order to provide a robust national inventory of emissions, the IPCC GPG recommends progression towards a higher tier methodology requiring certain gaps in data and in scientific understanding to be addressed.
In Ireland, agriculture is the largest contributor to overall national emissions, accounting for 32.1% in 2012 (Duffy et al. 2013), which is the greatest proportion among EU member states (Eurostat 2013). Grassland is the predominant land use in the temperate zone and covers 60% of the land area of Ireland (EPA 2008). The reclamation of raw peat soils or cutover peat soils for grassland was a direct result of population pressures in the nineteenth century which intensified in the twentieth century due to national drainage Acts and agricultural schemes (Feehan et al. 2008). Nowadays, some 300,000 ha of organic soils is under grassland (with negligible areas cultivated for crops), on a par with organic soils drained for forestry. Altogether, managed organic soils (including industrial cutaway peatlands) represent nearly half of the total peat soil area or 10% of the total land area (Wilson et al. 2013).
The use of organic soils for agriculture is a contentious land-use option in terms of atmospheric impacts. Organic soils are characterised by a high content of partially decomposed organic matter and are an important component of terrestrial carbon (C) storage (Gorham 1991, Garnett et al. 2001). Drained peatlands and peat fires are responsible for almost one-quarter of C emissions from the land-use sector with at least 2 gigatonnes (Gt) of carbon dioxide (CO2) emitted to the atmosphere globally each year (Parish et al. 2008, FAO 2013a). In Europe, 20% of all CO2 emissions between 1990 and 2010 originated from drained organic soils (FAO 2013b).
In Ireland, organic soils contain an estimated 1–1.5 Gt of C, which represents between 62% and 75% of the total soil C pool (Tomlinson 2005, Eaton et al. 2008, Renou-Wilson et al. 2011). However, this C store is under threat as centuries of peatland exploitation (peat extraction, agriculture and forestry) have left only c. 15% of peat soils in a natural state (Renou-Wilson et al. 2011). Carbon emissions and CH4 from Irish peat soils and related activities are estimated to account for c. 3 Mt C per annum (Wilson et al. 2013): this is equivalent to the emissions reported from the transport sector (Duffy et al. 2013). Therefore, managing organic soils as a means of mitigating greenhouse gas emissions (GHG) from agricultural systems can be an effective strategy for lowering national emissions (Dawson and Smith 2007, Smith et al. 2007). Of note, the new activity called ‘rewetting and drainage’ of organic soils has been included in the next post-Kyoto Protocol commitment period (2013–2017). The 2013 Wetland Supplement of the Intergovernmental Panel on Climate Change (IPCC, 2014) has developed new guidelines, together with default EFs for drained and rewetted organic soils, stratified by climate zone, nutrient status1 and in some cases by drainage class.2
1 Defined by the GPG-LULUCF and the 2006 IPCC Guidelines (Section 7.2.1.1, Chapter 7).
2 Defined as the mean annual water table averaged over a period of several years; the shallow-drained class is defined as the mean annual water table depth of less than 30 cm below the surface; the deep-drained class is defined as the mean annual water table depth of 30 cm and deeper below the surface.
Carbon Loss from Drained Organic Soils under Grassland – CALISTO
2
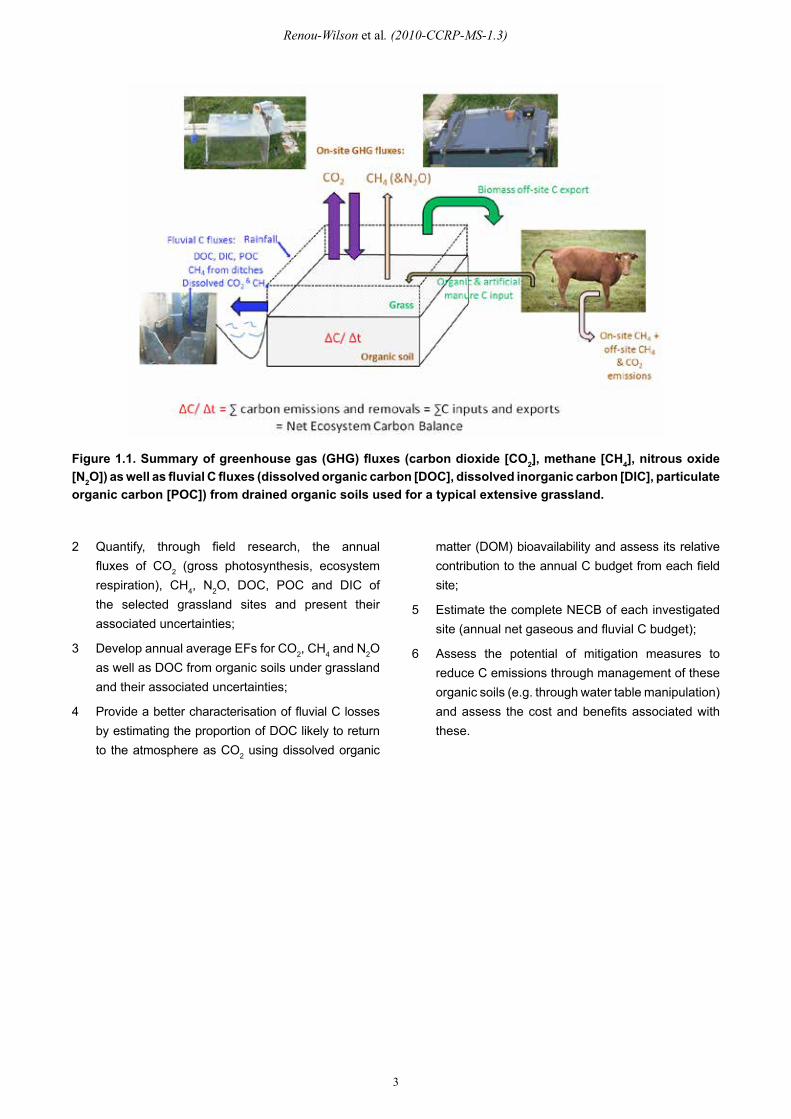
is an obvious need to fill the knowledge gap of actual N2O emissions from organic soils under grassland and investigate their spatial and temporal variability. This project not only delivers data to allow ROI to progress towards a higher tier reporting level for this LUC but also provides a comprehensive overview of C dynamics in organic soils by investigating all potential C imports and exports including fluvial C loss. While quantifying exported aquatic C from this organic soil is important and has only been done once in Ireland from a near-intact peatlands (Koehler et al. 2011), quantifying its bioavailability (ie. its actual contribution to CO2 emissions downstream) is a critically new research area in Ireland. If we consider the whole grassland system on organic soils, C exports in the form of off-site emissions from exported biomass, digesting and enteric fermentation by cattle of the cut herbage and meat and/or milk, together with C imports in the form of cattle manure, fertiliser and concentrate feed should also be included. Altogether, the results from this study allow us to present the first complete net ecosystem carbon balances (NECB) for managed organic soils under grassland in Ireland. Figure 1.1 represents all GHG fluxes and other C input and removal pathways.
Finally, management of organic soils has been proposed as a measure for mitigating GHG emissions from agricultural ecosystems. Therefore, this project reviews the most important mitigation practices available and tests the hypothesis that optimising the water table levels (i.e. the depth of drainage) would be an effective reduction/mitigation of C emissions at both the field and national level.
Using Tier 1 methodology of the 2013 Wetlands Supplement, instead of the 2006 GPG, would imply a significant increase in total emissions from drained organic soils because of the higher default EF for CO2 and N2O emissions as well as additional new default EFs reported for CH4 and dissolved organic carbon (DOC). These adjusted EFs have been compiled from an increasing large body of research which has demonstrated that drainage and management practices (e.g. fertilisation) of organic soils stimulate the aerobic oxidation of previously accumulated organic matter, promoting CO2 and nitrous oxide (N2O) emissions while reducing methanogenesis (Byrne et al. 2004, Freibauer et al. 2004, Nieveen et al. 2005, Jacobs et al. 2007, Elsgaard et al. 2012, Drösler et al. 2013, Schrier-Uijl et al. 2013). However, inter-regional spatio-temporal variability of all the GHG fluxes (but in particular CO2) is high, particularly in Western Europe. The implication is that physical and biogeochemical soil conditions (nutrient content, organic matter quality and water table levels) as well as local management practices and subtle climatic variations exert strong influences on C loss (Drösler et al. 2008). In addition, the drainage of temperate organic soils typically leads to higher DOC fluxes (Wallage et al. 2006, Urbanová et al. 2011), so that management practices may alter both contemporary photosynthetic C uptake rates, but also the stability of older soil stores of sequestered C. Further, although fluvial C exports are increasingly recognised as potentially significant components of terrestrial C balances, full accounting of all fluvial C forms remains the exception rather than the rule, notably for dissolved inorganic carbon (DIC) and particulate organic carbon (POC).
Therefore, improvement in terms of accuracy of the reporting of this land use category (LUC) in Ireland is necessary as both the total area and magnitude of emissions involved is significant. In addition, an EU review of the National GHG Inventory submissions (Consistency_report-IE_01_2009) concluded that Ireland’s use of default EFs for CO2 emissions for managed organic soils should be strongly reconsidered for future reporting. As such, more accurate quantification of all C fluxes (CO2, CH4, and fluvial C) is essential to allow reporting to move to Tier 2 levels, bringing Ireland’s reporting in line with other EU member states with a high proportion of organic soils. Moreover, given that agricultural soils are the main source of N2O emissions in the Republic of Ireland (ROI), there
1.2 Objectives
The project aimed to produce improved estimates of GHG emissions and fluvial C losses from organic soils under grassland. Hence, the main product of this project is the experimentally derived EFs for typological classes of this LUC that are most representative in Ireland, therefore giving practical tools for Tier 2 national inventory reporting.
The detailed objectives of this project were to:
1 Provide an overview of the most up-to-date state of knowledge regarding managed organic soils in Ireland, their land-uses and management practices as well as their associated C emissions (known and unknown) and implications for policy;
Renou-Wilson et al. (2010-CCRP-MS-1.3)
3
matter (DOM) bioavailability and assess its relative contribution to the annual C budget from each field site;
5 Estimate the complete NECB of each investigated site (annual net gaseous and fluvial C budget);
6 Assess the potential of mitigation measures to reduce C emissions through management of these organic soils (e.g. through water table manipulation) and assess the cost and benefits associated with these.
2 Quantify, through field research, the annual fluxes of CO2 (gross photosynthesis, ecosystem respiration), CH4, N2O, DOC, POC and DIC of the selected grassland sites and present their associated uncertainties;
3 Develop annual average EFs for CO2, CH4 and N2O as well as DOC from organic soils under grassland and their associated uncertainties;
4 Provide a better characterisation of fluvial C losses by estimating the proportion of DOC likely to return to the atmosphere as CO2 using dissolved organic
Figure 1.1. Summary of greenhouse gas (GHG) fluxes (carbon dioxide [CO2], methane [CH4], nitrous oxide [N2O]) as well as fluvial C fluxes (dissolved organic carbon [DOC], dissolved inorganic carbon [DIC], particulate organic carbon [POC]) from drained organic soils used for a typical extensive grassland.
Carbon Loss from Drained Organic Soils under Grassland – CALISTO
4
follows the 2006 definitions with the addition that ‘it is good practice that when a country uses another definition of organic soil in accordance with its national circumstances, the concept of organic soil applied is clearly defined and that the definition is applied consistently both across the entire national land area and over time’ (p. 1.7).
As part of the EPA-funded BOGLAND project (Renou-Wilson et al. 2011), the following scientific definition of ‘peat soil’ was agreed by a national expert group,3
based on the classification of peat soils by Gardiner and Radford (1980) and Hammond (1981) as well as international working groups such as the International Peat Society and the International Mire Conservation Group (Joosten and Clarke 2002):
Peat soil: organic soil materials which have sedentarily accumulated and have at least 30% (dry mass) organic matter over a depth of at least 45 cm on undrained land and 30 cm deep on drained land; the depth requirement does not apply in the event that the peat layer is over bedrock.
(Renou-Wilson et al. 2011, p.14)
This definition coincides with the FAO definition of ‘histosol’ with the notable exception that the FAO definition includes areas with shallow peat layers over ice or rock. Using the widely accepted ratio between organic carbon (OC) and organic matter (OM) – OC:OM of 1:1.72 – a content of 30% soil organic matter (SOM) would equate to ~17% soil organic carbon (SOC). According to the National Soils Database (Fay et al. 2007), the term ‘organic soils’ was used for all soils with a SOC content >15% (~25% SOM).
In the context of IPCC methodologies, the definition of organic soils is heterogeneous across the European Union (27) and not transparently provided in the national
3 Present were representatives of Teagasc, National Parks and Wildlife Service, Bord na Móna, Soil Science Department, University College Dublin (UCD) (including the late Bob Hammond), Bio-system Engineering-UCD, Biology and Environment-UCD, Environmental Engineering-Trinity College Dublin and National University of Ireland Galway.
2.1 Peat Soils, Organic Soils and Histosols
Organic soils and peat soils have been variously defined, depending on country and scientific discipline. Peat is included in soil classification systems across European countries under names such as ‘peat soils’, ‘muck soils’ and ‘organic soils’, but at an international level these are commonly referred to as ‘histosols’ (FAO-UNESCO 1974, FAO-UNESCO-ISRIC 1990, FAO 1998). The 2006 IPCC Guidelines also largely follow the FAO definition of ‘histosols’ and equate organic soils to peat soils. However, they omit the depth criterion from the FAO definition to allow for country-specific definitions of organic soils.
For the purpose of IPCC methodologies (2006 IPCC Guidelines and 2013 Wetland Supplement), an organic soil is a soil with a high concentration of organic matter and must satisfy Requirements 1 and 2 or 1 and 3 below (2013 Wetland Supplement, p. 1.7):
1 Thickness of organic horizon greater than or equal to 10 cm. A horizon of less than 20 cm must have 12 percent or more organic carbon when mixed to a depth of 20 cm.
2 Soils that are never saturated with water for more than a few days must contain more than 20 percent organic carbon by weight (i.e., about 35 percent organic matter).
3 Soils are subject to water saturation episodes and have either:
a. At least 12 percent organic carbon by weight (i.e., about 20 percent organic matter) if the soil has no clay;
or
b. At least 18 percent organic carbon by weight (i.e., about 30 percent organic matter) if the soil has 60% or more clay; or
c. An intermediate proportional amount of organic carbon for intermediate amounts of clay.
The 2006 IPCC Guidelines do not give any definition for peat or peatlands but it is considered to be included in ‘organic soils’. The 2013 Wetlands Supplement
2 Managed Organic Soils: State of Knowledge
Renou-Wilson et al. (2010-CCRP-MS-1.3)
5
[(McGettigan et al. 2009)]). This research confirmed that organic soils are a key soil type in Ireland, with the majority being ombrotrophic (nutrient poor) in nature. An analysis of main peatland land-use categories with a view to reporting their carbon emissions and removals estimated that cutover peatlands were the largest land-use category covering 612 kha followed by grassland (295 kha) and with similar area forestry (293 kha), leaving 269 kha of natural peatlands (Wilson et al. 2013). The latest estimation of organic soils under grassland cover is 282 kha (Common Reporting Format [CRF] Table 5.C, Inventory 2011–2013), which is a decrease from previous NRI estimations (295 kha in CRF Table 5.C, Inventory 2007–2009). The NIR (Duffy et al. 2013) acknowledges the high uncertainty associated with their method of overlaying a CORINE 1990 grassland cover data set over the General Soil Association Map of Ireland (Gardiner and Radford 1980). The majority of grasslands on organic soils are semi-natural wet grassland habitats.
Nearly all organic soils, including peat soils, have been impacted by anthropogenic activities over the course of history. Agriculture has been a common land use of peat soils for several centuries. Reclamation of peatlands for grassland was accelerated during the eighteenth and nineteenth centuries as a result of population pressures (Feehan et al. 2008). The reclamation and drainage of organic soils was intensified in the twentieth century as a result of several Acts and schemes, including the 1945 Arterial Drainage Act, the Farm Improvement Programme and the Programme for Western Development. Most of these reclaimed soils have been used for grassland. The twentieth century saw a sharp increase in the use of peat soils because of:
● The introduction of mechanised turf-extraction schemes (both industrial and domestic);
● Afforestation schemes;
● Intensification of agriculture through the Common Agriculture Policy; and
● Land reclamation through drainage schemes.
Overall, some 85% of Irish peatlands have been drained and converted to agriculture, forestry or extracted for fuel. Thus, organic soils now occur under different land uses: forest, grassland and a very small area under agricultural crops. According to national expert opinion (Teagasc), the drainage of organic soils for crops is
GHG inventory reports. In 2013 only four member states, including Ireland, provided a definition.
In Ireland, organic soils were defined as having high organic matter (greater than 20% OM). When the peat depth was greater than 30 cm they were classified as peat soils. If the organic or peat layer is less than 30 cm then the soil is classified as ‘organo-mineral’ (or ‘peaty-mineral’). These correspond to areas of natural wetlands that have been drained for the purpose of human exploitation (O’Brien 2007). ‘Wet organic soils’ are defined as those that have a water table between 0 and 30 cm.
Finland and Denmark have a very similar definition of organic soils with soils having >20% OM in the top 20 or 30 cm respectively.
In the Wetlands Supplement, a wet soil is not defined by the water table but as a soil that is inundated or saturated by water for all or part of the year to the extent that biota, particularly soil microbes and rooted plants, adapted to anaerobic conditions control the net annual GHG emissions and removals.
2.2 Extent of Organic Soils and Utilisation
Definitions of soil types are important when it comes to mapping their extent. It has been acknowledged that the distribution of peat soils is probably more accurately portrayed by the Map of Organic Carbon in Topsoils of Europe (Jones et al. 2004) than by the European Soil Map and Database (Commission of the European Communities [CEC] 1985). In Ireland, the first great survey of Ireland’s peatland was carried out between 1809 and 1814 (Commissioners 1814). Hammond’s Peatland Map of Ireland with its associated Soil Survey Bulletin was the first publication that classified the extent of the various peat types in the country (Hammond 1981). Using Hammond’s data together with other sources of spatial data in the form of the Indicative Soil Map of Ireland (R. Fealy, Teagasc, Pers. Comm.) and CORINE 2000 (EPA 2003) the spatial extent of peat soils in Ireland was estimated. A new Derived Irish Peat Map Version 2 (Connolly and Holden 2009) was produced showing that peat soils cover 1,466,469 ha or 20.6% of the national land area with an overall accuracy of 88% (in contrast to the 17% reported under ‘Wetland soils’ in National Inventory Rreport [NIR] 2009
Carbon Loss from Drained Organic Soils under Grassland – CALISTO
6
between the improved/unimproved grassland types, grasslands can occur in a range of water table levels and the occurrence of wet grassland is still relatively high despite widespread drainage (Hickie et al. 1999).
2.3.2 Drainage (Water Table Depth) While organic soils under grassland are either drained or ditched, that is the water table level is at least temporarily below natural levels, they nevertheless exhibit significant fluctuations in groundwater table during the year. Depending on precipitation, the ground water table may remain well below the drainage depth or close to the surface (inundation being common in those sites that are usually close to river systems). These variations in groundwater levels associated with weather patterns will directly affect the microbial decomposition of the SOM, shifting from aerobic to anaerobic and vice-versa, therefore influencing in turn the GHG balance. To date, there is no data available at a national scale regarding water table regimes.
2.3.3 Fertilisation (Mineral and Organic)Improved grasslands receive high amounts of mineral and organic fertilisers. Application varies according to stocking rate but intensively managed grassland typically receives between 200 and 300 kg N ha-1 year -1. A low rate of mineral fertiliser may be applied on the most productive semi-improved grassland (between 25 and 50 kg N ha-1 year-1) but dung from the animals is usually the sole annual fertiliser input in unimproved and semi-improved grasslands. Very little additional farm manure or slurry application occur on these pastures as the farm system is usually solely based on livestock production with winter animal dung from housing usually spread on the more productive, improved grassland.
2.3.4 Grazing/Cutting RegimeGrassland in Ireland is used solely for feeding livestock. Continuous livestock grazing is usually the only removal of biomass in unimproved and semi-improved grasslands. On rare occasions, biomass is removed from semi-improved or unimproved grassland with an initial silage cut followed by grazing during the growing season.
insignificant in Ireland but the NIR acknowledges a high uncertainty associated with this LUC, which should be resolved with additional research.
In addition, Bord na Móna successfully transformed approximately 2,500 ha of industrial cutaway peatlands into productive grasslands and these have been subsequently sold to individual farmers (under IPCC methodologies, previously exploited cutaway peatlands converted to grassland are assumed to be improved grassland). However, Bord na Móna has no plans to designate any future cutaways for grassland development (McNally 2008). In conclusion, the area of organic soils (including industrial cutaway peatlands) to be converted to grassland is now deemed to be very limited.
2.3 Management of Organic Soils under Grassland
2.3.1 Grassland TypesIrish grasslands over organic soils are managed for feeding domestic herbivores, mostly through direct grazing with only minimum areas used for forage production (either hay or silage). Most grasslands have been managed to some degree by grazing, mowing, fertilisation application or drainage. Therefore, the classification of grassland is usually made on the level of improvement or management, that is improved versus unimproved. Improved grasslands (usually species poor and intensively managed) are by far the most widespread type in Ireland. Improved grasslands are occasionally reseeded with biomass to increase the yield and are assumed to be artificially drained, fertilised and heavily grazed. Unimproved grassland may receive some inputs of fertiliser but usually this consists only of organic fertiliser through animal dung. They are not intensively managed and are not reseeded, therefore increasing their species richness with a high representation of ‘agricultural herbs’. Such management is likely to represent most grassland over organic soils. The inclusion of a new semi-improved grassland class has recently been proposed, most of which has been found predominantly in the west of Ireland (Sullivan et al. 2010). In addition to this continuum
Renou-Wilson et al. (2010-CCRP-MS-1.3)
7
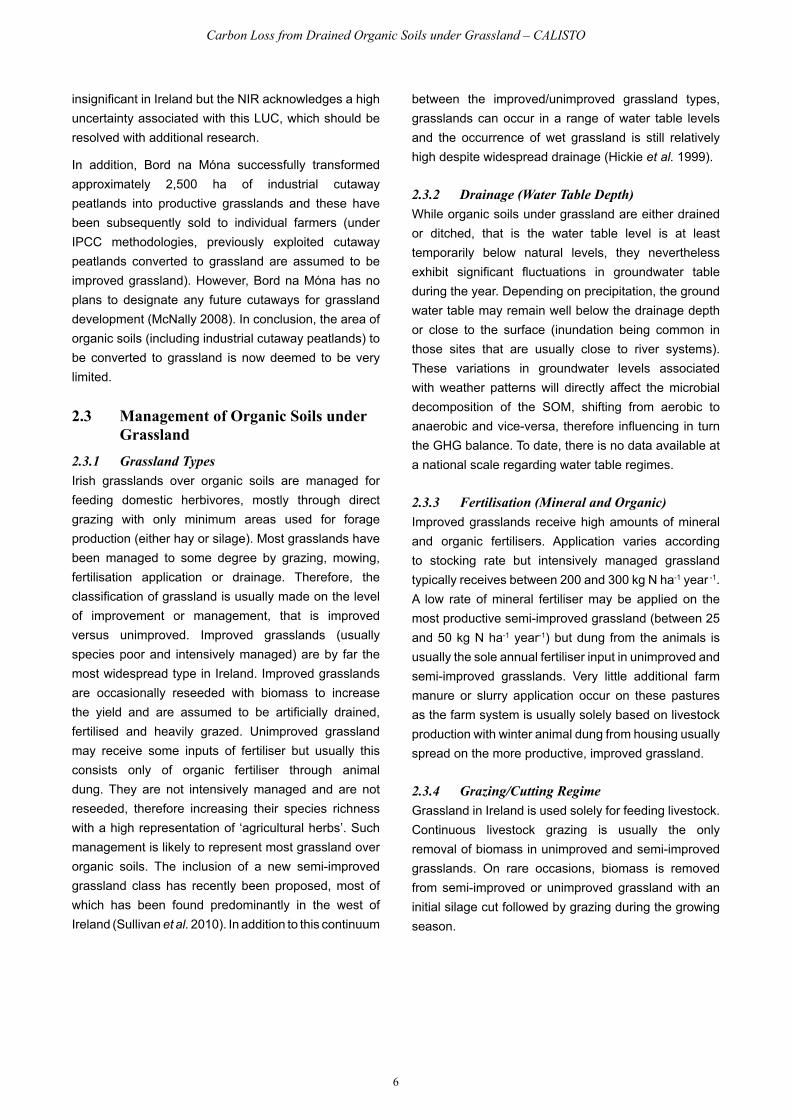
Longitude: 7° 56’ W) is also low-lying, situated at 38 m elevation but is typical of the Midlands landscape, with late spring frosts occurring as late as the beginning of June. Despite a comparable long-term annual mean temperature, lower minimum and higher maximum temperatures are typically recorded at Site B. A minor gradient in precipitation is also present with higher mean rainfall in Site A (Table 3.1). Potential evapo-transpiration in that region is estimated at 32%–36% of annual precipitation (estimated long-term annual runoff of c. 700 mm), compared to 44% (c. 586 mm) for Site B (Mills 2000).
3 Study Sites
3.1 Climatic Conditions
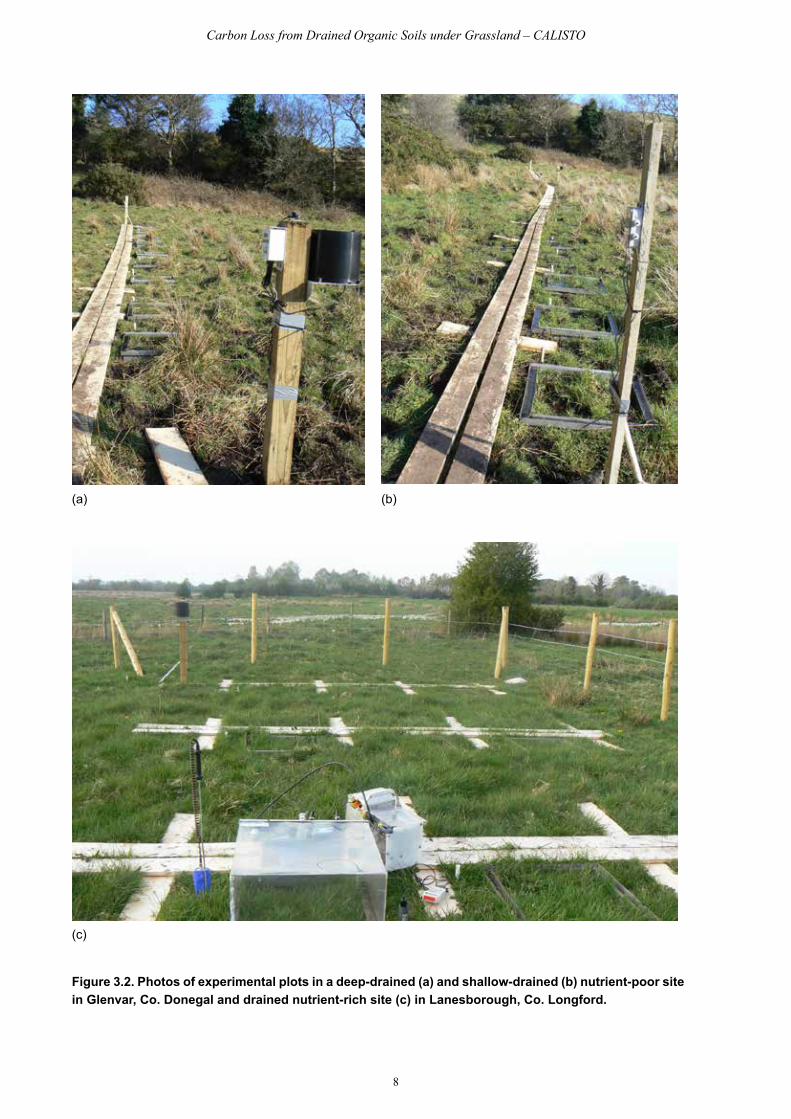
The study sites were located in a maritime temperate climate zone in two distinct Irish ecoregions, both characterised as landscapes rich in organic soils (Figs 3.1 and 3.2). Site A at Glenvar, Co. Donegal (Latitude: 55° 9’ N, Longitude: 7° 34’ W) is situated at 40 m elevation in the north-west of the country, less than 1 km from the sea shore. The climate here is typical of western maritime Ireland with warm winters (very few ground frosts) but cool summers. Site B in Lanesborough, Co. Longford (Latitude: 53° 39’ N,
Glenvar
Lanesborough
Figure 3.1. Locations of study sites on map of peat soils (re-copied from Connolly and Holden, 2009).
Carbon Loss from Drained Organic Soils under Grassland – CALISTO
8
(c)
(b)(a)
Figure 3.2. Photos of experimental plots in a deep-drained (a) and shallow-drained (b) nutrient-poor site in Glenvar, Co. Donegal and drained nutrient-rich site (c) in Lanesborough, Co. Longford.
Renou-Wilson et al. (2010-CCRP-MS-1.3)
9
2006 and 2013 guidelines (IPCC 2006, 2013). They are typical ‘earthy peat’, that is reclaimed drained peat soils characterised by a well-aerated structure and a relatively firm surface horizon containing few or no recognisable plant remains. The peat in Site A overlies bedrock of Precambrain schist and gneiss and contains on average 20% C (Table 3.2). The base geology of Site B is of limestone origin and the overlying peat has a higher pH (5.5) and almost double the C content (40%) and is situated over a thick layer of marl (pH 7.2). Despite similar C:N ratios (16–21), Sites A and B differ in nutrient status and, based on N, phosphorus (P) and potassium (K) content, Site A is nutrient poor while Site B is nutrient rich (Table 3.2).
Site B has a uniform hydrological soil profile throughout the experimental area. In contrast, Site A can be divided into two distinct sub-sites: a deep-drained area ‘Site Ad’ (defined in the 2006 IPCC guidelines as the mean annual water table depth of 30 cm and deeper below the surface) and a shallow-drained area ‘Site As’ (defined as the mean annual water table depth of less than 30 cm below the surface).
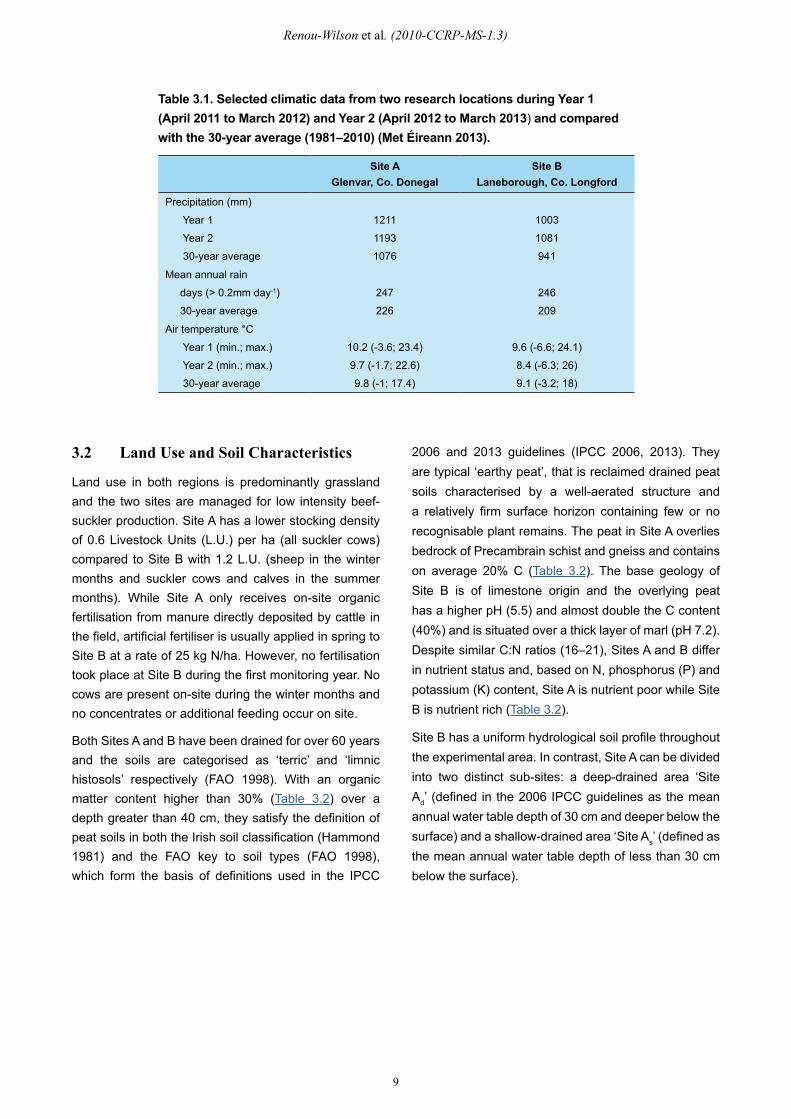
Table 3.1. Selected climatic data from two research locations during Year 1 (April 2011 to March 2012) and Year 2 (April 2012 to March 2013) and compared with the 30-year average (1981–2010) (Met Éireann 2013).
Site AGlenvar, Co. Donegal
Site BLaneborough, Co. Longford
Precipitation (mm)
Year 1
Year 2
30-year average
1211
1193
1076
1003
1081
941
Mean annual rain
days (> 0.2mm day-1)
30-year average
247
226
246
209
Air temperature °C
Year 1 (min.; max.)
Year 2 (min.; max.)
30-year average
10.2 (-3.6; 23.4)
9.7 (-1.7; 22.6)
9.8 (-1; 17.4)
9.6 (-6.6; 24.1)
8.4 (-6.3; 26)
9.1 (-3.2; 18)
3.2 Land Use and Soil Characteristics
Land use in both regions is predominantly grassland and the two sites are managed for low intensity beef- suckler production. Site A has a lower stocking density of 0.6 Livestock Units (L.U.) per ha (all suckler cows) compared to Site B with 1.2 L.U. (sheep in the winter months and suckler cows and calves in the summer months). While Site A only receives on-site organic fertilisation from manure directly deposited by cattle in the field, artificial fertiliser is usually applied in spring to Site B at a rate of 25 kg N/ha. However, no fertilisation took place at Site B during the first monitoring year. No cows are present on-site during the winter months and no concentrates or additional feeding occur on site.
Both Sites A and B have been drained for over 60 years and the soils are categorised as ‘terric’ and ‘limnic histosols’ respectively (FAO 1998). With an organic matter content higher than 30% (Table 3.2) over a depth greater than 40 cm, they satisfy the definition of peat soils in both the Irish soil classification (Hammond 1981) and the FAO key to soil types (FAO 1998), which form the basis of definitions used in the IPCC
Carbon Loss from Drained Organic Soils under Grassland – CALISTO
10
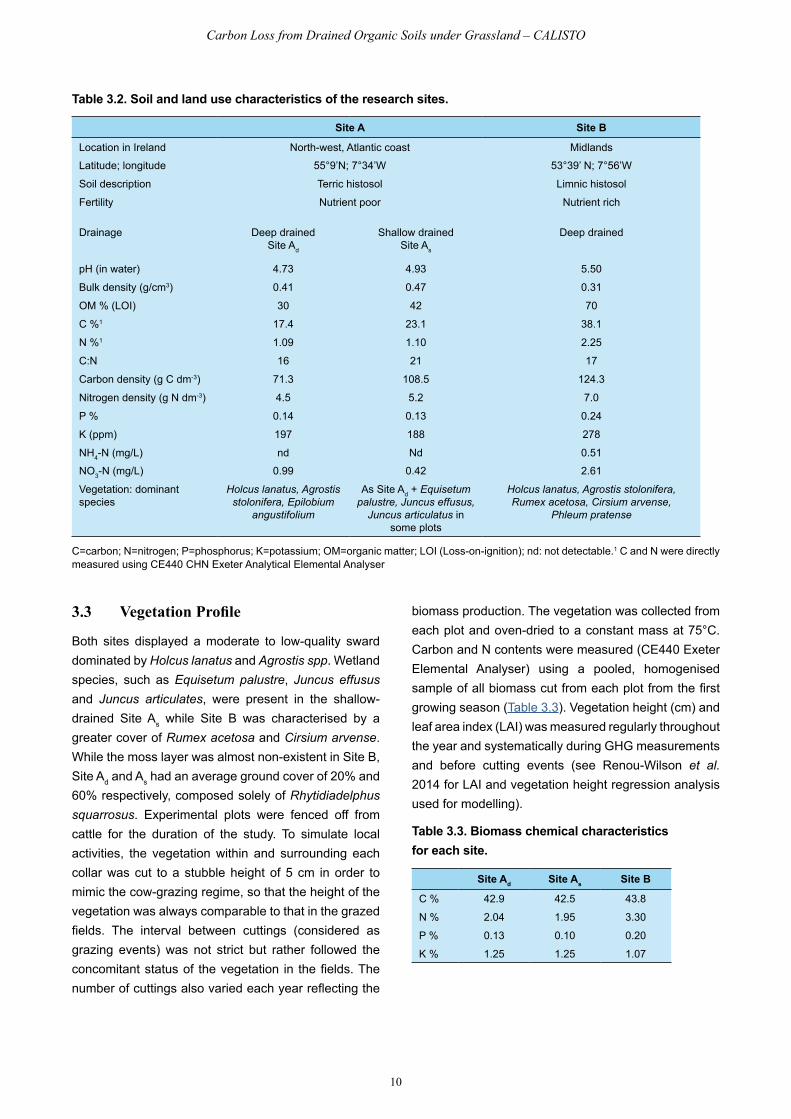
biomass production. The vegetation was collected from each plot and oven-dried to a constant mass at 75°C. Carbon and N contents were measured (CE440 Exeter Elemental Analyser) using a pooled, homogenised sample of all biomass cut from each plot from the first growing season (Table 3.3). Vegetation height (cm) and leaf area index (LAI) was measured regularly throughout the year and systematically during GHG measurements and before cutting events (see Renou-Wilson et al. 2014 for LAI and vegetation height regression analysis used for modelling).
Table 3.3. Biomass chemical characteristics for each site.
Site Ad Site As Site B
C % 42.9 42.5 43.8
N % 2.04 1.95 3.30
P % 0.13 0.10 0.20
K % 1.25 1.25 1.07
Table 3.2. Soil and land use characteristics of the research sites.
Site A Site B
Location in Ireland
Latitude; longitude
North-west, Atlantic coast
55°9’N; 7°34’W
Midlands
53°39’ N; 7°56’W
Soil description Terric histosol Limnic histosol
Fertility Nutrient poor Nutrient rich
Drainage Deep drained Site Ad
Shallow drained Site As
Deep drained
pH (in water) 4.73 4.93 5.50
Bulk density (g/cm3) 0.41 0.47 0.31
OM % (LOI) 30 42 70
C %1 17.4 23.1 38.1
N %1 1.09 1.10 2.25
C:N 16 21 17
Carbon density (g C dm-3) 71.3 108.5 124.3
Nitrogen density (g N dm-3) 4.5 5.2 7.0
P % 0.14 0.13 0.24
K (ppm) 197 188 278
NH4-N (mg/L)
NO3-N (mg/L)
nd
0.99
Nd
0.42
0.51
2.61
Vegetation: dominant species
Holcus lanatus, Agrostis stolonifera, Epilobium
angustifolium
As Site Ad + Equisetum palustre, Juncus effusus,
Juncus articulatus in some plots
Holcus lanatus, Agrostis stolonifera, Rumex acetosa, Cirsium arvense,
Phleum pratense
C=carbon; N=nitrogen; P=phosphorus; K=potassium; OM=organic matter; LOI (Loss-on-ignition); nd: not detectable.1 C and N were directly measured using CE440 CHN Exeter Analytical Elemental Analyser
3.3 Vegetation Profile
Both sites displayed a moderate to low-quality sward dominated by Holcus lanatus and Agrostis spp. Wetland species, such as Equisetum palustre, Juncus effusus and Juncus articulates, were present in the shallow-drained Site As while Site B was characterised by a greater cover of Rumex acetosa and Cirsium arvense. While the moss layer was almost non-existent in Site B, Site Ad and As had an average ground cover of 20% and 60% respectively, composed solely of Rhytidiadelphus squarrosus. Experimental plots were fenced off from cattle for the duration of the study. To simulate local activities, the vegetation within and surrounding each collar was cut to a stubble height of 5 cm in order to mimic the cow-grazing regime, so that the height of the vegetation was always comparable to that in the grazed fields. The interval between cuttings (considered as grazing events) was not strict but rather followed the concomitant status of the vegetation in the fields. The number of cuttings also varied each year reflecting the
Renou-Wilson et al. (2010-CCRP-MS-1.3)
11
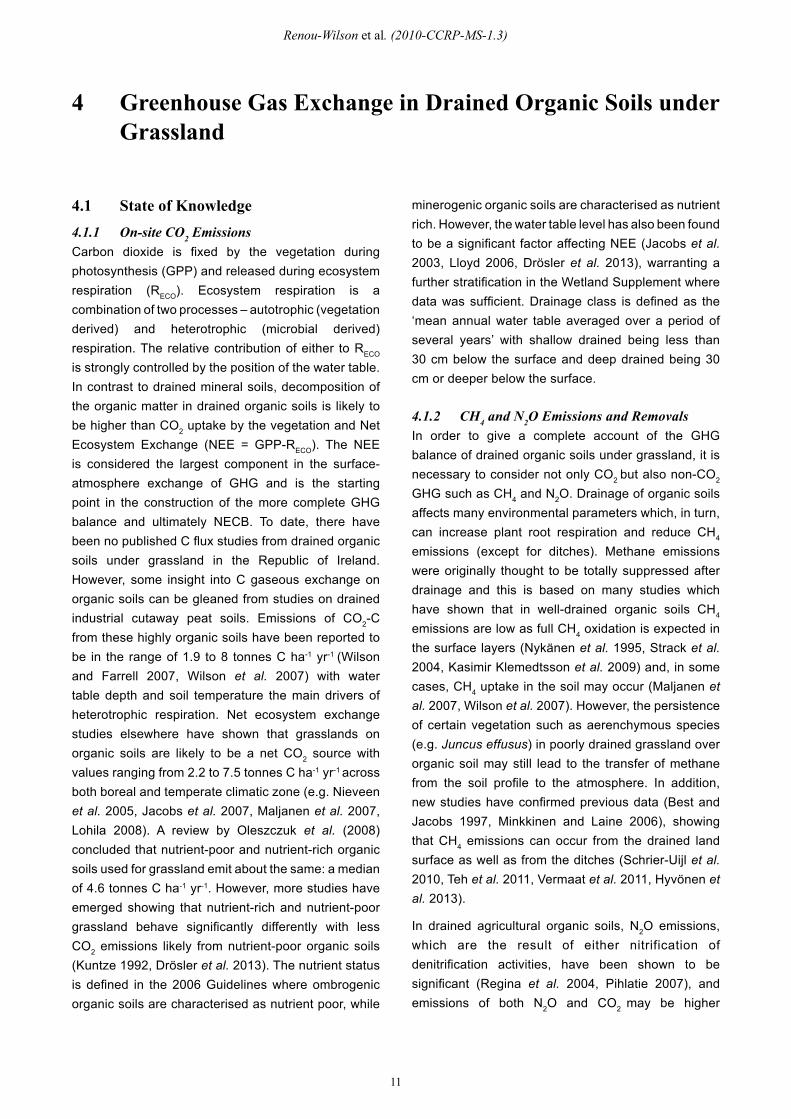
minerogenic organic soils are characterised as nutrient rich. However, the water table level has also been found to be a significant factor affecting NEE (Jacobs et al. 2003, Lloyd 2006, Drösler et al. 2013), warranting a further stratification in the Wetland Supplement where data was sufficient. Drainage class is defined as the ‘mean annual water table averaged over a period of several years’ with shallow drained being less than 30 cm below the surface and deep drained being 30 cm or deeper below the surface.
4.1.2 CH4 and N2O Emissions and RemovalsIn order to give a complete account of the GHG balance of drained organic soils under grassland, it is necessary to consider not only CO2 but also non-CO2 GHG such as CH4 and N2O. Drainage of organic soils affects many environmental parameters which, in turn, can increase plant root respiration and reduce CH4 emissions (except for ditches). Methane emissions were originally thought to be totally suppressed after drainage and this is based on many studies which have shown that in well-drained organic soils CH4 emissions are low as full CH4 oxidation is expected in the surface layers (Nykänen et al. 1995, Strack et al. 2004, Kasimir Klemedtsson et al. 2009) and, in some cases, CH4 uptake in the soil may occur (Maljanen et al. 2007, Wilson et al. 2007). However, the persistence of certain vegetation such as aerenchymous species (e.g. Juncus effusus) in poorly drained grassland over organic soil may still lead to the transfer of methane from the soil profile to the atmosphere. In addition, new studies have confirmed previous data (Best and Jacobs 1997, Minkkinen and Laine 2006), showing that CH4 emissions can occur from the drained land surface as well as from the ditches (Schrier-Uijl et al. 2010, Teh et al. 2011, Vermaat et al. 2011, Hyvönen et al. 2013).
In drained agricultural organic soils, N2O emissions, which are the result of either nitrification of denitrification activities, have been shown to be significant (Regina et al. 2004, Pihlatie 2007), and emissions of both N2O and CO2 may be higher
4.1 State of Knowledge4.1.1 On-site CO2 EmissionsCarbon dioxide is fixed by the vegetation during photosynthesis (GPP) and released during ecosystem respiration (RECO). Ecosystem respiration is a combination of two processes – autotrophic (vegetation derived) and heterotrophic (microbial derived) respiration. The relative contribution of either to RECO is strongly controlled by the position of the water table. In contrast to drained mineral soils, decomposition of the organic matter in drained organic soils is likely to be higher than CO2 uptake by the vegetation and Net Ecosystem Exchange (NEE = GPP-RECO). The NEE is considered the largest component in the surface-atmosphere exchange of GHG and is the starting point in the construction of the more complete GHG balance and ultimately NECB. To date, there have been no published C flux studies from drained organic soils under grassland in the Republic of Ireland. However, some insight into C gaseous exchange on organic soils can be gleaned from studies on drained industrial cutaway peat soils. Emissions of CO2-C from these highly organic soils have been reported to be in the range of 1.9 to 8 tonnes C ha-1 yr-1 (Wilson and Farrell 2007, Wilson et al. 2007) with water table depth and soil temperature the main drivers of heterotrophic respiration. Net ecosystem exchange studies elsewhere have shown that grasslands on organic soils are likely to be a net CO2 source with values ranging from 2.2 to 7.5 tonnes C ha-1 yr-1 across both boreal and temperate climatic zone (e.g. Nieveen et al. 2005, Jacobs et al. 2007, Maljanen et al. 2007, Lohila 2008). A review by Oleszczuk et al. (2008) concluded that nutrient-poor and nutrient-rich organic soils used for grassland emit about the same: a median of 4.6 tonnes C ha-1 yr-1. However, more studies have emerged showing that nutrient-rich and nutrient-poor grassland behave significantly differently with less CO2 emissions likely from nutrient-poor organic soils (Kuntze 1992, Drösler et al. 2013). The nutrient status is defined in the 2006 Guidelines where ombrogenic organic soils are characterised as nutrient poor, while
4 Greenhouse Gas Exchange in Drained Organic Soils under Grassland
Carbon Loss from Drained Organic Soils under Grassland – CALISTO
12
4.3 Results and Discussion4.3.1 Weather Conditions In Year 1 (starting April 2011), Site A displayed higher precipitation (1211 mm) as well as a higher annual mean air temperature (10.2°C) compared to Site B (1003 mm; 9.6°C) (Table 3.1). Rainfall and temperature patterns were similar, with both sites having higher mean annual precipitation (7–12%) and air temperature (5–10%) compared to the 30-year average values (Table 3.1). Both sites also had cooler summer but warmer autumn and winter temperatures compared to the 30-year monthly averages. There was no significant difference between monthly mean soil temperatures between all the sites (p=0.801) (Fig. 4.1). In Year 2, Site A received slightly lower precipitation to Year 1 (1193 mm) but it remained above the long-term average and was driven by high values during June and July, September and October and December and January. Both the mean annual and monthly air temperatures were consistently below the long-term averages (by 8–9%).
to a depth of 20 cm into the soil before the start of the study. Data loggers and a weather station were established at each study site and recorded hourly soil temperatures (°C) at 5, 10 and 20 cm depths as well as recorded photosynthetic photon flux density (PPFD, µmol m-2 s-1) and volumetric soil moisture (%, Site B only). Perforated PVC pipes (internal diameter: 2 cm) were inserted adjacent to each sample plot to measure water table position (WT). Wooden boardwalks were built around the sample plots to minimise damage to the vegetation and to avoid compression of the peat during gas sampling. Carbon dioxide, CH4 and N2O fluxes were measured using the static chamber method (Alm et al. 2007) biweekly during the growing season and monthly during the winter time. A full description of the methodology for the measurement and modelling of the data can be found in Renou-Wilson et al. (2014). Site A was monitored starting April 2011 (first two years are reported here) while Site B was only monitored for one year (April 2011 to March 2012) with no fertiliser application taking place during that time. Additional N2O measurements were taken at Site B in April–June 2012 during an intensive campaign after a typical fertilisation event of 25 kg N/ha.
in nutrient-rich than in nutrient-poor organic soils (Kasimir-Klemedtsson et al. 1997, Maljanen et al. 2003, Schils et al. 2008). Nitrous oxide emissions are caused by nitrogen mineralisation associated with organic matter decomposition. There is also a greater risk of N2O emissions under increasing acid conditions as the N2O:N2 product ratio increases with decreasing soil pH (Simek and Cooper 2002). When fertiliser or organic amendments are applied to the grassland, this causes an additional source of anthropogenic N2O which is measured in tandem with N mineralisation from the organic matter decomposition. However, the latter emissions are reported separately within the IPCC inventory context (see Box 4.1).
Box 4.1. Note on terms used in this report
CO2-C represents the carbon atom contained within the CO2 molecule. In terms of the overall molecular weight of CO2, the carbon atom accounts for 12/44 or 27%. Thus, a multiplier of 3.667 is required in order to convert CO2-C values to CO2.
CH4-C represents the carbon atom contained within the CH4 molecule. In terms of the overall molecular weight of CH4, the carbon atom accounts for 12/16 or 75%. Thus, a multiplier of 1.334 is required in order to convert CH4-C values to CH4.
N2O-N represents the nitrogen atoms contained within the N2O molecule. In terms of the overall molecular weight of N2O, the nitrogen atom accounts for 28/44 or 64%. Thus, a multiplier of 1.571 is required in order to convert N2O-N values to N2O.
Negative gas flux values indicate an uptake by the peatland and positive gas flux values indicate a loss from the peatland to the atmosphere.
4.2 Methodology for Measuring Greenhouse Gas
Twelve permanent sample plots were established systematically within Site A (seven in the deep-drained Site Ad, and five in the shallow-drained Site As) and nine sample plots at Site B (at least 15 m from field border or river). Each sample plot consisted of a stainless steel collar (60 x 60 cm) that was inserted

Renou-Wilson et al. (2010-CCRP-MS-1.3)
13
Fig. 4.1. Mean monthly water table levels, volumetric moisture content (VMC), photosynthetic photon flux density (PPFD) and soil temperature at 5 cm deep recorded during the monitoring period at the study sites (Year 1 starting April 2011).
Carbon Loss from Drained Organic Soils under Grassland – CALISTO
14
(VMC) averaged 47.5% and ranged from 20 to 62% with two significantly drier periods in May and August in Year 1.
There was a typical seasonal trend in mean monthly PPFD values at both locations (Fig. 4.1) associated with day length and seasonal cloud cover, with the highest values observed in summer (June to August) and lowest in the winter (December to February). Annual and mean monthly PPFD values were significantly higher (p<0.001) at Site B than Site A during Year 1. At Site A, mean PPFD was significantly higher in Year 1 than Year 2, with greater values in eight months of the year. The two sites therefore contrasted climatically but displayed similar climatic change trends as predicted by Sweeney et al. (2008).
Seasonality of precipitation was reflected in WT depth at Site A and soil moisture content at Site B (Fig. 4.1). Despite rising slightly above -40 cm in winter, the monthly WT site averages at the deep-drained Site Ad were relatively stable and similar annual means were recorded in both years (-47.8 and -47.4 cm). Monthly means were significantly different between Sites Ad and As (p<0.001), the latter being characterised by seasonal fluctuations with monthly WT below -30 cm during late summer/early autumn periods, rising quickly to levels above -10 cm during winter periods. Despite this, the annual WT mean at the shallow-drained Site As was similar between years at -22.9 cm in Year 1 and -24.2 cm in Year 2. At Site B, volumetric moisture content
4.4 Biomass Production/Export
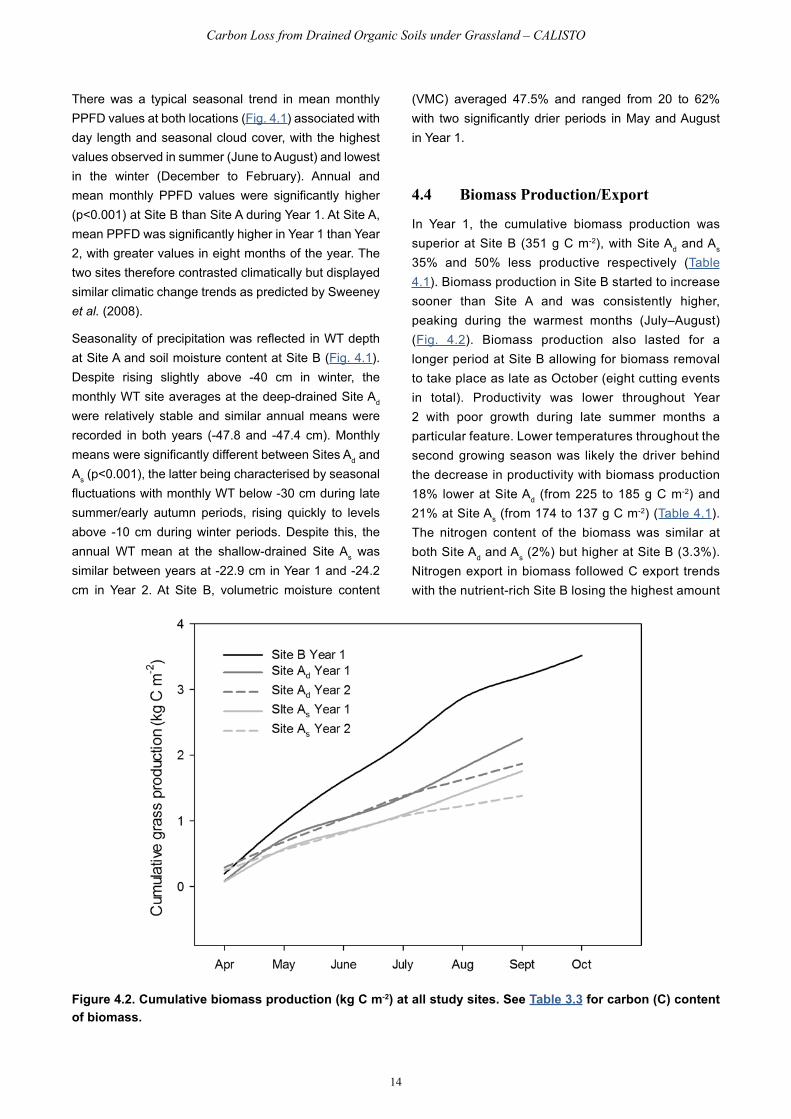
In Year 1, the cumulative biomass production was superior at Site B (351 g C m-2), with Site Ad and As 35% and 50% less productive respectively (Table 4.1). Biomass production in Site B started to increase sooner than Site A and was consistently higher, peaking during the warmest months (July–August) (Fig. 4.2). Biomass production also lasted for a longer period at Site B allowing for biomass removal to take place as late as October (eight cutting events in total). Productivity was lower throughout Year 2 with poor growth during late summer months a particular feature. Lower temperatures throughout the second growing season was likely the driver behind the decrease in productivity with biomass production 18% lower at Site Ad (from 225 to 185 g C m-2) and 21% at Site As (from 174 to 137 g C m-2) (Table 4.1). The nitrogen content of the biomass was similar at both Site Ad and As (2%) but higher at Site B (3.3%). Nitrogen export in biomass followed C export trends with the nutrient-rich Site B losing the highest amount
Figure 4.2. Cumulative biomass production (kg C m-2) at all study sites. See Table 3.3 for carbon (C) content of biomass.
Renou-Wilson et al. (2010-CCRP-MS-1.3)
15
4.5 Methane Fluxes
Fluxes of CH4 were not detectable at the deep-drained sites, namely Site Ad and Site B and were relatively low at Site As. A strong seasonal effect could be observed in both years at Site As. Methane fluxes followed a general trend where the highest values were observed in late summer and the lowest in winter time. However, high flux values for this site (0.9 and 1.4 mg CH4 m-2 hr-1) were also observed in April and November. Spatial variation in emissions at Site As was very evident), with the higher emissions associated with plots that contained Juncus effusus. No statistical relationship was observed between CH4 fluxes and any of the environmental parameters. Therefore, in order to calculate an annual CH4-C balance, linear interpolation between the observed fluxes was performed and the values integrated over a 12-month period (Beetz et al. 2013). Annual CH4-C emissions were not significantly different between years, with 1.3 (1.09) g CH4-C m−2 yr−1 in Year 1 and 1.4 (1.1) g CH4-C m−2 yr−1 in Year 2 (Table 4.1).
As CH4 production is expected to occur mainly within the anoxic soil horizons, i.e. below the groundwater table, the absence of CH4 emissions at Sites B and Ad are consistent firstly with annual mean water table depths (below -30 cm) and secondly with the absence of aerenchymous plant species that can transport CH4 from the soil to the atmosphere (Couwenberg 2009). Emissions close to zero were also recorded from drained grasslands over peat in Germany (Drösler et al. 2013, Leiber-Sauheitl et al. 2013) and Denmark (Petersen et al. 2012).
The estimated mean annual CH4 fluxes for the shallow-drained nutrient-poor Site As (18 ± 15 kg CH4 ha-1 yr-1 over 2 years) are at the lower range of values reported for wet grasslands in Germany (Leiber-Sauheitl et al. 2013) and are only 10% of values reported for managed fen meadow and extensively managed grassland on peat in the Netherlands (Kroon et al. 2010, Schrier-Uijl et al. 2010). The low or even absence of CH4 fluxes may also be due to the relatively shallow peat depth (<1 m) as suggested by Levy et al. (2012) and the fact that these sites have been drained for a very long time (Flasse
at 265 (27) kg N ha-1 yr-1 compared to 107 (45) and 80 (12) kg N ha-1 yr-1 in Site Ad and Site As. Nitrogen biomass exports were 17 to 19% lower in Year 2 in Site Ad and As respectively.
4.4.1 CO2 FluxesAnnual NEE differed significantly at each site (Table 4.1) with the nutrient-poor shallow-drained site (As) a net annual sink of CO2-C in both years of the study (-89 g and -99 g CO2-C m-2 yr-1 in Years 1 and 2 respectively) and the nutrient-poor deep-drained site (Ad) a net source of 85 g CO2-C m-2 yr-1 in Year 1 and a net sink of CO2-C in the second year (-26 CO2-C m-2 yr-1). In contrast, the nutrient-rich drained Site B was a net annual source of 233 g CO2-C m-2 yr-1. This NEE value is at the lower range of data reviewed from temperate and boreal studies (e.g. Maljanen et al. 2010, Elsgaard et al. 2012, Leiber-Sauheitl et al. 2013). Annual losses of CO2 from our nutrient-rich drained site B were more in line with those determined for low-intensity Dutch permanent grasslands on organic soils (Jacobs et al. 2007, Veenendaal et al. 2007) and for extensive wet nutrient-poor grasslands in Germany (Drösler et al. 2013). This corroborates that Site B is a low-intensity grassland (no cultivation and low inputs). The importance of a ‘grassland type’ appears even more pronounced in the case of nutrient-poor sites as investigated in this study. Net annual uptake of CO2-C in both the deep-drained and shallow-drained nutrient-poor sites in Year 2 of our investigation contrast significantly with studies from similar site types in temperate climatic regions where a net annual loss of CO2-C has been reported (Drösler et al. 2013, Leiber-Sauheitl et al. 2013). The NEE values for the nutrient-poor shallow-drained sites in this study represent similar sinks (small source in some year) to those reported by Skiba et al. (2013) for grazed drained nutrient-poor organic soils (moorland) in a maritime temperate climate. Our results would therefore point to the significance of edaphic conditions as well as the low-intensity management system encountered at our sites. An indication of such influences can be found in the contrasting GPP and Reco parameters found at all sites (which are fully discussed in Renou-Wilson et al. 2014).
Carbon Loss from Drained Organic Soils under Grassland – CALISTO
16
integrated over a 12-month period. (Note: The integration period was from 1 April 2011 to 31 March 2012 and, therefore, did not cover the fertilisation experiment.) Annual N2O-N emissions for this period were estimated at 1.6 ± 0.34 kg N2O-N ha-1 yr-1.
In nutrient-rich sites, the potential for N2O emissions is much higher, and is additionally forced by fertiliser applications to these more productive systems. Estimated annual N2O emissions from Site B are nonetheless still low in comparison to most grasslands situated over peat (closer to the IPCC default values for nutrient-rich shallow-drained soils). This study provides further evidence that N2O fluxes are predominantly affected by the grassland management type, which is not represented in the categories within the IPCC guidelines. Most investigations are carried out in intensively managed grasslands. While nutrient rich, Site B is still very much ‘extensive’ given the low artificial N input. Our values are however comparable to Dutch figures reported by Langeveld et al. (1997) and van Beek et al. (2011) where grasslands had typically less fertiliser and manure inputs over time. Overall, our results are not sufficient to conclude firmly on the insignificance of N2O fluxes in extensive grassland over organic soils, and further investigations in this area are warranted to ascertain the potential for large denitrification losses. Since N2O uptakes were detected on occasion, N2O reductase activity could be high and therefore large dinitrogen (N2) emissions may be possible. This study also highlights the need for further research on intensive measurement of N2O based on C:N ratios, which may not reflect soil organic C degradation as seen in the contrasting ecosystem respiration measurements from our two sites with similar C:N ratios.
et al. 1998). The poor quality and supply of substrates may also restrict methanogenesis (Couwenberg 2009). Given that a recent meta-analysis has demonstrated that vegetation is the strongest explanatory parameter for CH4 flux variability (Levy et al. 2012), it is likely that the higher CH4 fluxes measured from the shallow-drained nutrient-poor sites were also a product of the presence of Juncus effusus (aerenchymous species) as seen in other studies (Petersen et al. 2012, Herbst et al. 2013). Overall, our results demonstrate that CH4 fluxes were negligible, if not absent, components of the C balance of extensively drained grasslands over organic soils in a maritime temperate climate, emitted only in very small amounts when the mean annual water table was around -23 cm.
4.6 Nitrous Oxide Fluxes
Fluxes of N2O were not distinguishable from zero at both Site As and Ad during the monitoring period. The absence of N2O emissions from the nutrient-poor sites was consistent with the lack of artificial fertiliser use for several decades at these sites and similar results have been reported from an extensive drained moorland in Scotland (Skiba et al. 2013). At the nutrient-rich Site B, a seasonal trend was observable during the 1 April 2011 to 31 March 2012 period with the highest values (153 µg N2O m-2 hr-1) observed in October. Nitrous oxide uptake (~14 µg N2O m-2 hr-1) was observed during May. Following a fertilisation event at Site B in Year 2, N2O emissions increased considerably and reached an observed maximum of 484 µg N2O m-2 hr-1. As with CH4 fluxes, no statistical relationship was observed between N2O fluxes and any of the environmental parameters. Instead, linear interpolation between the observed fluxes was performed and the values
Renou-Wilson et al. (2010-CCRP-MS-1.3)
17
Tabl
e 4.
1. A
nnua
l flux
es o
f eco
syst
em re
spira
tion
(Rec
o), g
ross
prim
ary
prod
uctio
n (G
PP),
net e
cosy
stem
exc
hang
e (N
EE) o
f CO
2, C
H4,
diss
olve
d or
gani
c ca
rbon
(D
OC
), pa
rtic
ulat
e or
gani
c ca
rbon
(PO
C),
exce
ss C
O2 a
nd b
icar
bona
te (H
CO
3- ) to
geth
er w
ith b
iom
ass
expo
rts,
CH
4 em
issi
ons
from
ent
eric
ferm
enta
tion
and
net
ecos
yste
m c
arbo
n ba
lanc
e (N
ECB
). St
anda
rd e
rror
s ar
e sh
own
in p
aren
thes
es fo
r all
gas
fluxe
s R
eco,
GPP
, NEE
and
for fl
uvia
l flux
es. O
ne s
tand
ard
devi
atio
n is
sh
own
in p
aren
thes
es fo
r all
othe
r com
pone
nts.
Site
Ad =
nutr
ient
-poo
r dee
p dr
aine
d, S
ite A
s = n
utrie
nt-p
oor s
hallo
w d
rain
ed a
nd S
ite B
= n
utrie
nt-r
ich
drai
ned.
Po
sitiv
e va
lues
indi
cate
a lo
ss o
f car
bon
from
the
site
and
neg
ativ
e va
lues
indi
cate
an
upta
ke o
f car
bon
by th
e si
te.
Rec
o g
C m
-2 y
r-1
GPP
g C
m-2 y
r-1
NEE
g C
m-2 y
r-1
CH
4
g C
m-2 y
r-1
CH
4 liv
esto
ckg
C m
-2 y
r-1
Bio
mas
s ex
port
g C
m-2 y
r-1
NEE
+
Bio
mas
sg
C m
-2 y
r-1
DO
Cg
C m
-2 y
r-1
POC
g C
m-2 y
r-1
Exce
ss C
O2
g C
m-2 y
r-1
HC
O3-
g C
m-2
yr-1
NEC
B
g C
m-2
yr-1
Year
1
Site
Ad
1736
(17)
-165
1 (4
7) 8
5 (5
0)0
3.6
225
(60)
310
18.1
(3.2
)6.
4 (2
.7)
13.4
(3.2
)6.
1 (0
.6)
358
(111
)
Site
As
1260
(49)
-134
9 (5
4)-8
9 (7
3)1.
3 (1
.09)
3.6
174
(25)
8518
.1 (3
.2)
6.4
(2.7
)13
.4 (3
.2)
6.1
(0.6
)13
4 (7
5)
Site
B23
22 (5
3)-2
089
(57)
233(
78)
09.
535
1 (4
0)58
437
.7 (9
.0)
7.9
(3.7
)4.
3 (0
.9)
19.9
(3.7
)66
3 (4
2)
Year
2
Site
Ad
1535
(6)
-156
1 (5
0)-2
6 (5
0)0
3.6
185
(36)
159
4.9
(0.2
6)2.
0 (2
.7)
18.5
(3.0
)5.
4 (0
.3)
193
(64)
Site
As
1112
(36)
-121
1 (5
8)-9
9 (6
8)1.
4 (1
.1)
3.6
137
(28)
384.
9 (0
.26)
2.0
(2.7
)18
.5 (3
.0)
5.4
(0.3
)73
(56)
Carbon Loss from Drained Organic Soils under Grassland – CALISTO
18
aqueous fluxes (e.g. remineralisation and atmospheric evasion of CO2). Continuous-level recorders (Orpheus mini, OTT Germany) and flow-gauging instrumentation were installed at each site. Carbon concentrations were determined at fortnightly to monthly intervals throughout each monitoring period. Dissolved organic carbon concentration was measured by high temperature Pt-catalysed combustion on glass-fibre filtered samples (Whatman GF/C; 1.7µm), POC concentrations by loss on ignition of samples filtered onto glass-fibre filters, and DIC according to Stumm and Morgan (1996), from alkalinity (gran titration), and in situ measurements of pH, temperature and specific conductance. Annual C loads were calculated as the product of annual or seasonal flow-weighted mean concentrations and runoff volumes, corresponding to ‘method 5’ given by Walling and Webb (1985), and DOC rainwater inputs were subtracted based on concentrations determined for rainwater during the study. Fluxes are expressed as areal rates according to catchment area. Ninety-five percent confidence limits for flux estimates were calculated according to Hope et al. (1997).
As DIC reflects both CO2 derived from soil respiration and C derived from the atmosphere and rock weathering, total DIC exports were apportioned to reflect terrestrial organic matter dynamics alone (Stumm and Morgan 1996, Telmer and Veizer 1999). All CO2 above atmospheric equilibrium was considered derived from respiration of organic matter. For Site B, where base geology is limestone, up to half of the HCO3
- C export can be derived from soil organic matter whereas for Site A the geology (Precambrian Gneiss and Schist) and alkalinity imply most bicarbonate C derives from organic matter mineralisation.
5.3 Results and Discussion
Fluvial exports were measured at the field scale at Site A and so encompass both sites Ad and As. In Years 1 and 2 the fluvial fluxes totalled 44 g C m-2 yr-1 and 30.8 g C m-2 yr-1 respectively. Dissolved organic carbon export rates were 18.1 g C m-2 yr-1 in Year 1 and 4.9 g C m-2 yr-1 in Year 2, representing 41% and 16% of the fluvial
5 Fluvial Carbon Losses from Drained Organic Soils under Grassland
5.1 State of Knowledge
Recent studies have shown that aquatic C loss is the second largest component of the C budget at a catchment level (Worrall et al. 2009a, Dinsmore et al. 2010). The significance of fluvial C losses has been acknowledged and EFs for DOC are now included in the IPCC Wetland Supplement 2013.
Barry and Foy (2008) measured DOC in rivers draining the catchment of Lough Melvin, which is dominated by peat and humic gley soils and found that annual export rates of DOC averaged 170 kg C ha-1, with loss rates for individual sub-catchments in excess of 240 kg C ha-1. Soil H project shows that peatland catchment had by far the highest levels of DOC in stream-flow compared to catchments dominated by mineral soils with values reaching 150 kg C ha-1 yr-1 (Kiely et al. 2014).
5.2 Methodology
A complete methodology is described in Barry et al. (2015). In short, fluxes of DOC, POC and DIC were determined for each site for the hydrological year beginning October 2011. For Site A, a second year of monitoring covered the hydrological year commencing October 2012. Discharge measurement, laboratory analyses and C flux estimation methods employed are briefly described below and detailed in Barry et al. (2015).
In order to accurately estimate waterborne C fluxes representative of the area on which the terrestrial GHG fluxes were conducted, runoff measurements were confined to the smallest catchment areas encompassing the GHG study sites. Field drains adjacent to each of the study sites were selected and these drained relatively small areas of between 3 and 5 ha. Critically, soils and land use within these catchments was uniform and consistent with that of the GHG study sites. Although areas outside of the study sites yielded water, this approach has advantages in that sampling is close to source, limiting the residence time between exports from the soil environment and thereby lessening the impact of processes that can alter
Renou-Wilson et al. (2010-CCRP-MS-1.3)
19
catchments in Ireland and the UK (Dawson et al. 2004, Dinsmore et al. 2010, Koehler et al. 2011, Kiely et al. 2014). This suggests that DOC fluxes from nutrient-poor organic soils under extensive grasslands in Ireland may be more similar to semi-natural ecosystems. Annual DOC fluxes from the nutrient-poor site were almost four times lower in Year 2, reaching a low value of 4.9 g C m-2 yr-1. It is likely that inter-annual variability in DOC flux at this site is caused by reduced precipitation and greater evapotranspiration during the second hydrological year (runoff 897 mm and 745 mm in Years 1 and 2 respectively). However, the decline in DOC export from Year 1 to 2 was partially offset by a greater flux of aqueous CO2 export, implying that drier conditions were more conducive to soil OM and soil pore water OM mineralisation. In both Years 1 and 2, the flux of DIC (derived from soil respiration) exceeded the flux of DOC, and was predominantly in the form of CO2. The high pCO2 of samples implies that accurately accounting for aqueous CO2 fluxes requires that samples are taken close to source to account for C that is otherwise rapidly evaded to the atmosphere, particularly with waters with low alkalinity. While the literature on aqueous inorganic C fluxes from agricultural catchments is not extensive, our observations are consistent with findings for small boreal streams where exports of CO2 were also substantial and atmospheric evasion of CO2 from streams was equivalent to approximately half of the total stream C flux (Wallin et al. 2013). Our findings also provide support for arguments for greater incorporation of stream C fluxes to improve regional and global C accounting (e.g. Downing et al. 2012). At Site B the DIC flux was also considerable, but comprised a lower fraction of the total. Notably, this DIC export was mainly in the form of bicarbonate so that the soil respiratory origins of much of this fraction are indicated to behave more conservatively during downstream transport but nevertheless remain an important part of the terrestrial C balance. These results support an argument for the requirement to report other fluvial C components in GHG inventories, notably DIC and POC (e.g. Hope et al. 2001, Dinsmore et al. 2010).
C flux in each year respectively (Table 4.1). The mean drainage water pCO2 in Years 1 and 2 respectively was 102 and 146 times in excess of atmospheric equilibrium concentrations, and consequently the export of excess CO2 (above equilibrium) was substantial at 13.4 and 18.5 g C m-2 yr-1 respectively. Excess CO2 represented 30 and 60% of the fluvial C flux each year and dominated the export of DIC (excess CO2 + HCO3
-) which overall comprised 44% and 78% of the fluvial C flux in each year. As with DOC, POC fluxes were also lower in Year 2, declining from 6.4 g C m-2 yr-1 to 2.0 g C m-2 yr-1.
The fluvial C flux was greater at Site B at 68.9 g C m-2 yr-1, comprising 54% DOC, 35% DIC and 11% POC. By comparison to Site A, this total flux largely reflected a greater export of DOC, particularly relative to the second year at site A. Despite differences in base geology between sites, the flux of DIC (estimated as derived from soil respiratory processes) was comparable to both years at site A, but differed in that it was primarily in the form of bicarbonate (29% total flux), implying that Site B yielded a greater carbonate dissolution but had lower evasion losses due to buffering geology at this site.
Studies have shown that fluvial C losses can be large components of terrestrial C balances at field and landscape scales, particularly where organic soils predominate (Worrall et al. 2009a, Dinsmore et al. 2010, Buffam et al. 2011). Furthermore, the importance of this component can be magnified by management practices given that large increases in DOC export can occur following drainage of organic soils, related to greater DOC production under aerobic conditions and soil redox conditions during wet and dry periods (Wallage et al. 2006, Clark et al. 2009, Urbanová et al. 2011). In this study, DOC fluxes were greatest for the drained nutrient-rich site but lower than values reported for drained peatland catchments in the same climatic region (Gibson et al. 2009, Rowson et al. 2010). More significantly, the 2-year mean DOC flux from the nutrient-poor site (11.5 g C m-2 yr-1) is at the low end of values reported for temperate semi-natural peatland

Carbon Loss from Drained Organic Soils under Grassland – CALISTO
20
measurements logged at 6-hour intervals. All samples reached asymptotic values within this period. In all cases a sufficient excess of oxygen was present to meet respiratory demands. Biological oxygen demand values measured over time were converted to C units using a respiratory quotient (RQ) of 1. The labile component of organic matter exports was assessed as the proportion of the total C content of each sample (DOC+POC) remineralised during the incubations (Barry et al., 2015).
6.2 Results and Discussion
At the nutrient-poor Site A, the percent of carbon content remineralised (labile C) from the drain samples was broadly similar for DOC and TOC, ranging between 10 and 26%. A much lower proportion of the organic content of river samples was remineralised (c.10–15%). The amount remineralised was somewhat greater on average for DOC than TOC for the river samples, and in view of the results for the drain samples the implication is that the bioavailable POC fraction is rapidly remineralised after export to streams.
At the nutrient-rich Site B, the labile DOC fraction of drain samples ranged between 20 and 25% and was therefore constrained to a much narrower range than for the nutrient-poor site: however, this may partly reflect the lower sample number. The labile fraction of drain TOC was also constrained to c. 10%, the lower percentage relative to that of DOC, suggesting a lower lability of the particulate C fraction. The labile DOC content of river samples was greater than that of the drain samples at 13% and 33% at the 10th and 90th sample percentiles respectively. Labile TOC for the river samples was greater than for the drain samples and ranged from 20–48%. The river catchment is large and so probably has multiple organic matter sources compared to the drain. Some of these sources may be anthropogenic, from waste-water discharges, agriculture or C losses associated with peat exploitation and these may drive the elevated labile C fraction of the river samples compared to the drain. There is also a possibility of enhanced bioavailability due to greater UV exposure.
6.1 State of Knowledge and Methodology
A full understanding of the fate of DOC lost by aquatic pathways is currently poor. As an operationally defined variable, DOC can consist of a multitude of organic components with differing bioavailabilities. While most of the world’s lakes are heterotrophic (they produce more CO2 than they consume), humic substances have a generally low bioavailability so that much can either be trapped in lake sediments via flocculation or adsorption onto suspended sediments or move downstream to the sea without being fully used as a microbial substrate. Nevertheless, organic matter exported from the landscape remains available for biochemical processing, remineralisation and subsequent efflux to the atmosphere as CO2 and CH4, but also permanent burial in sediments. Thus, proportions of the exported
organic matter may constitute atmospheric sources and sinks over variable timescales, depending on its molecular composition and physico-chemical environment. The varying environmental influences on organic-matter reactivity make accurate assessments of its fate complicated. However, the implication is that most of the exported organic matter can be remineralised, but a large proportion may constitute a net C sink if delivered to environments such as lake sediments that are not conducive to oxidation.
A study from Lough Melvin, Co. Fermanagh-Leitrim where soils consist largely of humic rankers and blanket peat, showed that sediment carbon burial retained approximately 7% of the fluvial C input to the lake, and that C evasion exceeds sediment burial by a factor of 4 (Barry and Foy 2008). Therefore, while quantifying exported C from peatland soils is important, quantifying its bioavailability is critical if its contribution to CO2 emissions downstream of the organic soil is to be assessed.
The biological oxygen demand (BOD) of filtered (DOC) and unfiltered samples (TOC; DOC+POC) was measured manometrically using the Oxitop® system (WTW, Xylem, USA). This approach measures oxygen consumption over time derived from the gas pressure change in the sample bottle, reflecting aerobic respiration. Samples were set to run for 90 days with
6 Dissolved Organic Matter Bioavailability
Renou-Wilson et al. (2010-CCRP-MS-1.3)
21
reflect the greater export of organic C from this site. The labile fractions of DOC were low yet variable, but within the ranges reported for similar studies, indicating small fractions of 5–10% remineralised over the typical time courses of downstream transit of days to weeks. These implications for the terrestrial C balances are further discussed in Barry et al. (2015).
Overall, the mean bioavailable fraction of organic carbon in all samples was 19.5% and ranged from 6.8% to 53.1%. Expressed on a catchment area basis, remineralisation of organic C at Site A was equivalent to 4.5–4.9 g C m-2 yr-1, and at Site B from 5.5–9.4 g C m-2 yr-1. While the range of bioavailable fractions were similar at both sites the greater areal rates for site B
Carbon Loss from Drained Organic Soils under Grassland – CALISTO
22
stocking rates at the sites yielded further emissions of 3.6 g C m-2 yr-1 for Site A and 9.5 g C m-2 yr-1 for Site B. Given the very low-intensity farming systems at both sites, we assume the balance of C import/export from on-site manure deposits negligible (there was no fertilisation at Site B in the first year).
7.2 Complete Net Ecosystem Carbon Budget
Concurrent GHG and fluvial C balance studies on organic soils have been undertaken on only a few sites worldwide and this is the first full NECB of a temperate drained organic soil under grassland. At the nutrient-rich site, NECB was relatively high (663 ± 42 g C m-2 yr-1) considering that the grassland is extensive and this value is greater than those reported for intensive grassland on peat in both Germany (Beetz et al. 2013) and the Netherlands (Veenendaal et al. 2007). However, the value falls within the range of annual emission rates of 410–760 g C m-2 yr-1 reported by Couwenberg (2011), who reviewed several temperate drained peat soils under grassland. It should be noted, however, that the values above do not include fluvial C losses, which in this study accounted for 11% of the total NECB for the nutrient-rich site. While annual biomass exports were at the low end of literature values (e.g. 317–515 g C m-2 yr-1) (Veenendaal et al. 2007, Beetz et al. 2013), they accounted for 53% of the NECB (Table 4.1). The two-year mean NECB of the deep and shallow-drained nutrient-poor sites were considerably smaller than the nutrient-rich site (40% and 16% respectively). Biomass exports were also the biggest components of the NECB at these sites (Table 4.1) and were sufficient to influence the source-sink balance of the shallow-drained site in both years and at the deep-drained site in Year 2 (i.e. shift from a NEE sink to a net source of C). Given the impact of the biomass removal on NECB, controls on grazing regimes could therefore significantly influence the C sink capacity of these ecosystems, as documented for an abandoned former pasture over peat in the Netherlands (Hendricks et al.
7.1 Methodology
The net ecosystem carbon budget (NECB) is positive when more carbon is lost than gained and negative when more carbon is gained than lost: i.e. the ecosystem has accumulated carbon. European grasslands used for livestock grazing and forage production are usually considered to be a carbon sink in terms of net biome productivity (NBP). When calculating the GHG balance, including off-site emissions of CO2 and CH4 as a result of the digesting and enteric fermentation by cattle of the cut herbage, the grasslands are considered neutral (e.g. Soussana et al. 2004, Soussana et al. 2007). This neutral balance was also true for a fertilised grassland on a peaty podzol to brown podzol site in Ireland (Leahy et al. 2004) where a strong C uptake was counteracted by N2O emissions from fertilisation and emissions from ruminants. However, the GHG balance may be substantially reduced or become a large source in less productive grasslands where C uptakes are small (Byrne et al. 2005). In addition, none of these balances account for fluvial carbon losses which would almost certainly tilt the final NECB to becoming a source. Annual mean GHG balance in boreal grassland over peat soil has been estimated to be a large source (2260 CO2 eq. m-2), similar to other managed peatlands (Maljanen et al. 2010). Even such a balance does not include CH4 emissions from ditches which form a part of the drainage network and could contribute significantly to the total GHG budget.
The full NECB for this grassland on organic soil is composed of the gaseous fluxes of CO2 and CH4, as well as fluvial C losses in the form of DOC, POC, DIC and dissolved CO2 and CH4 and C emissions associated with livestock grazing (enteric fermentation and on-site manure deposits). The following nationally derived emission rates for CH4 from enteric fermentation were employed as detailed by O’Mara et al. (2007): 74 kg CH4 head-1 yr-1 for suckler cows; 22.4 kg CH4 head-1 yr-1 for calves; 8 kg CH4 head-1 yr-1 for sheep. Combining these rates with contemporary
7 Net Ecosystem Carbon Budget of Drained Organic Soils under Grassland
Renou-Wilson et al. (2010-CCRP-MS-1.3)
23
However, in the case of nutrient-poor organic soils, fluvial C losses were not a negligible component of the overall NECB and could easily influence the final C balance of these ecosystems.
2007). The NECB of the shallow-drained nutrient-poor site is indeed consistent with values reported for an extensive grassland in Germany, which was re-wetted four years previously (Beetz et al. 2013).
Carbon Loss from Drained Organic Soils under Grassland – CALISTO
24
variability in the quantitative estimates of N2O emissions in studies published across ‘temperate’ Europe.
At the nutrient-poor sites, the annual estimates of GWP varied from a small warming effect (2-year average of 2.3 CO2eq ha-1 yr-1) at the deep-drained site to a net cooling effect at the shallow-drained site (-1.8 CO2eq ha-1 yr-1) and were dominated by CO2 exchange (Table 4.1). Our annual estimates of GWP are in line with figures presented by Beetz et al. (2013) for both an extensive and rewetted grassland over organic soils in Germany. The authors warn of high variability of those estimates depending on the period of measurements used. Although we report two years of measurements in this report, long-term monitoring would allow for more robust multi-year average GHG budgets, which could then be extrapolated to the regional scale.
The GHG budgets and associated GWP were calculated using IPCC methodologies (2007). The GWP of the nutrient-rich drained organic soil was dominated by N2O and reached 26.7 t CO2eq ha-1 yr-1 which is very similar to results (2-year mean of 26 t CO2eq ha-1 yr-1) from an intensive grassland on peat in Scotland (Beetz et al. 2013). These values are however in the lower range of organic soils under grasslands reported by Petersen in Denmark (15–62 CO2eq ha-1 yr-1) and Kasimir-Klemedtsson in Sweden (10–70 CO2eq ha-1 yr-1) while being on a par with German sites (12–31 CO2eq ha-1 yr-1) (Leiber-Sauheitl et al. 2013). Using Tier 1 default N2O values, the calculated GHG budget for Site B would have been more than triple that of the budget measured in this study. A large error in the calculation of GHG budget from these site types is associated with N2O fluxes and this is confirmed by the large
8 Global Warming Potential

Renou-Wilson et al. (2010-CCRP-MS-1.3)
25
range of EFs for temperate-drained nutrient-poor sites in the IPCC guidance (2013): 5.3 (3.7-6.9) t CO2-C ha-1 yr-1. This default value is not further stratified between shallow and deep-drained grasslands and is based on only seven identified study sites, six of which are from Germany (Drösler et al. 2013). Nonetheless, the multi-site GHG investigation reported by Drösler et al. (2013) includes nutrient-poor sites (extensive grasslands), which were a CO2-C sink (NEE minus biomass removal) in some years. In Denmark, an EF of 1.25 t CO2-C ha-1 yr-1 is applied to non-fertilised permanent grassland. Along with the results presented here, this supports our premise highlighting considerable heterogeneity in the C balance of grasslands on organic soils within the European temperate zone. While the stratification of default CO2 EFs according to nutrient and drainage status is indeed supported by this study, variability in the impact of these factors also reflects the historical and contemporary management practices, therefore advocating a progression towards the Tier 2 reporting level for countries with significant areas of organic soils under grassland.
9 Implications for Reporting: CO2, CH4, N2O and DOC Emission Factors
Net ecosystem exchange added to the C losses from the removal of biomass (assuming instantaneous emission of cut biomass) and averaged over a multi-annual measuring period gives a best-possible estimate of emissions/removals and therefore the most accurate CO2-C EF (Couwenberg 2011, Elsgaard et al. 2012). The EF for the nutrient-rich deep-drained grassland (Site B) was 5.84 t CO2-C ha-1 yr-1 which is in the range of values given in the 2013 Wetlands Supplement IPCC guidance (Table 9.1): 6.1 (5.0–7.3) t CO2-C ha-1 yr-1 for this land-use category. It corresponds well with Tier 2 country- specific EFs for permanent grassland over organic soils: 5 t CO2-C ha-1 yr-1 in Germany (Federal Environmental Agency 2013), 5.19 t CO2-C ha-1 yr-1 in the Netherlands (Netherlands Environmental Assessment Agency 2009) and 5.17 t CO2-C ha-1 yr-1 in Denmark (National Environmental Research Institute 2013).
Table 9.1. CO2-C, CH4-C, N2O-N and DOC emissions/removals factors (tonnes ha-1 yr-1) from organic soils under grasslands in the temperate zone as per IPCC Wetlands Supplement (2014). Positive values indicate a flux from the peatland to the atmosphere. 95% confidence interval in brackets.
Grassland type CO2 t C ha-1 yr-1 CH4 kg CH4 ha-1 yr-1 DOC t C ha-1 yr-1 N2O-N kg N ha-1 yr-1
Nutrient poor
Drained +5.3 (3.7-6.9) +1.8 (0.72-2.9) +0.31 (0.19-0.46) +4.3 (1.9-6.8)
Nutrient rich
Deep drained
Shallow drained
+6.1 (5-7.3)
+3.6 (1.8-5.4)
+16 (2.4-29)
+39 (-2.9-81)
+0.31 (0.19-0.46)
+0.31 (0.19-0.46)
+8.2 (4.9-11)
+1.6 (0.56-2.7)
In contrast, our nutrient-poor sites produced much lower CO2 EFs of +2.35 t CO2-C ha-1 yr-1 in the deep drained and +0.62 t CO2-C ha-1 yr-1 in the shallow drained (Table 9.2). These figures are outside the lower
Table 9.2. CO2-C, CH4-C, N2O-N and DOC emissions/removals factors (tonnes ha-1 yr-1) from our study sites (organic soils under grasslands in a maritime temperate climate). Positive values indicate a flux from the peatland to the atmosphere. 95% confidence interval in brackets.
Grassland type CO2 t C ha-1 yr-1 CH4 kg CH4 ha-1 yr-1 DOC t C ha-1 yr-1 N2O-N kg N ha-1 yr-1
Nutrient poor
Deep drained
Shallow drained
+2.35 (1.3-3.4)
+0.62 (0.3-0.9)
0
+18 (17-19)
+0.11 (0.09-0.13)
+0.11 (0.09-0.13)
0
0
Nutrient rich
Deep drained +5.84 0 +0.38 +1.6 (1.3-1.9)
Carbon Loss from Drained Organic Soils under Grassland – CALISTO
26
most of the DOC flux from drained peat catchments can be mineralised (Kölher et al. 2002, Jones et al. 2013). Despite such observations, the oceans still receive considerable inputs of terrestrial organic matter (c. 0.4 Gt yr-1 according to Richey 2004) although the very minor amounts of unambiguously terrestrial material identified in seawater and marine sediments imply that the vast majority is re-mineralised (Bauer and Bianchi 2011). As per the IPCC guidance (2013), a 90% fraction was used to calculate an overall EF for DOC of 22.1 t C ha-1 yr-1, being much lower at the nutrient-poor site (10.3 t C ha-1 yr-1) compared to the nutrient-rich site (33.9 t C ha-1 yr-1). The later value is within the range of the default EF for temperate drained organic soils: 31 (19–46) g C m-2 yr-1 (Table 9.2). Given the high inter-annual variability experienced at the nutrient-poor site, further long-term study would be warranted in order to support the development of a country-specific EF which would include a ‘nutrient status’ stratification.
Overall, the current default EF may not be representative of the variety of grasslands over organic soils present in the maritime fringes of Western Europe. As only one full year was monitored in the nutrient-rich Site B and 2 years at Site A, a longer monitoring period to increase the range of climatic conditions and additional direct measurements from other regionally representative drained organic soils would help attain more robust EFs by averaging inter-annual variability. In turn, this would help to implement Tier 2 methodologies for IPCC inventories more effectively.
The EF for CH4 at both the deep-drained sites, regardless of nutrient status, was zero and, for the shallow-drained nutrient-poor grassland, calculated at 18 kg CH4 ha-1 yr-1 (Table 9.2). The absence of CH4 fluxes from both our well-drained organic soils is at variance with the IPCC guidance which presents an EF of 16 kg CH4 ha-1 yr-1 for nutrient rich and 1.8 kg CH4 ha-1 yr-1 for nutrient poor (Table 9.1). This over-estimation could be compensated by using the EF for nutrient-poor drained organic soils in the case of shallow-drained nutrient-poor sites. If water table status is used as a primary factor, the only default EF provided is for shallow-drained nutrient rich at 39 kg CH4 ha-1 yr-1 which would also lead to a large over-estimation of CH4 fluxes.
The EF for N2O of zero at the nutrient-poor site and 1.6 kg N ha-1 yr-1 at the nutrient-rich site are both very low compared to the default EF in the IPCC guidance (2013). Despite being subject to high uncertainty, our results suggest again the likely significance of management system, especially with regards to fertilisation and stocking regime, factors which are currently missing from Tier 1 methodology.
In order to calculate an EF for DOC, it is critical to account only for the portion of DOC that could be completely mineralised and re-emitted to the atmosphere. While lake sediments can be sites for significant permanent burial of terrestrially fixed C, in most river-lake catchments mineralisation far exceeds burial (Algesten et al. 2003), and indeed studies have shown that
Renou-Wilson et al. (2010-CCRP-MS-1.3)
27
critical in further maintaining the water table levels and maintaining productivity (some species may strongly compete in order to ‘maintain’ ideal conditions for their growth. In addition, the aesthetic value of such land use may become critical as a field could quickly be colonised by tall rushes for example.
10.2 Socio-economic Prospects of Climate-friendly Strategies
An increasing number of scientific studies support the premise for the management of organic soils as a measure for mitigating GHG emissions from agricultural ecosystems (Smith et al. 2007). The most important mitigation practices are: (i) avoiding the drainage of these soils in the first place, (ii) re-establishing a high water table (Freibauer et al. 2004) or (iii) optimising the position of the water table (Lloyd 2006). However, the socio-economic realities need to be addressed fully in order to appraise these strategies. First, the relative importance of climate change versus land management on the GHG emissions needs to be determined. Very little is known about the efficacy and wider landscape effects of some proposed mitigating management techniques. Second, while organic soil restoration or rewetting have a host of biodiversity/environmental co-benefits, there are also direct economic implications for individual farm livelihoods under changed management practices (opportunity cost of crop production lost from this land). Such an economic impact will depend upon whether farmers receive payment for the GHG emission reduction. Studies elsewhere have shown that acceptance of mitigation measures requiring less intensive grassland management, for example, was very low. However, these studies involved mainly intensive, very profitable farms (Schaller et al. 2011). Therefore, the cost of these strategies was high in terms of re-organisation and farm adaptation and would have meant an intensification of production in alternative areas (pushing the climate issue around to another land through added fertiliser for example). In less profitable regions such as parts of Ireland where organic soils are typically found, financial compensation may be a good incentive as it would not require re-organisation, and subsidising farmers’ losses would
10.1 Water Table Management as Mitigation Strategy
In the context of the new opportunity given by the IPCC Wetland Supplement (2013) to report rewetted drained organic soils, this study underpins the need to investigate the rewetting of high C content nutrient-rich organic soils under grassland in Ireland as a priority. The sustained high decomposition rates recorded at the nutrient-rich site as reported here could only be compensated by reducing microbial oxidation of peat via higher water table levels. Rewetting of these site types should therefore be a priority of any climate change mitigation strategy focusing on decreasing C losses from soils in Ireland. Furthermore, the neutral or C sink capacity of nutrient-poor organic soils may also be strongly affected by climate change. With higher predicted temperatures affecting peat decomposition, respiration rates might increase faster than photosynthetic assimilation due to nutrient limitation. Predicted higher precipitation for the studied region could however work in synergy with government-led actions to introduce agricultural schemes for less intensive grassland management or even complete restoration. The former would require the maintenance of a relatively high water table (above -25 cm) and the reduction of the grazing regime to actively promote C uptake by these ecosystems. However, Lloyd (2006) noted that whilst higher water table levels reduced C losses from respiration, there were difficulties in maintaining uniform levels throughout the field. Controlled drainage on cultivated peat soils has been somewhat successfully implemented in Finland although they concluded that it is a slow process (Merja Myllys and Kritina Regina, MTT Agrifood Research Finland, Jokioinen, pers. comm.). Another issue relates to the impact of bringing the water table closer to the surface on the vegetation. Vegetation will typically develop towards a new climax and these changes in vegetation communities play an important role in the CO2 and CH4 exchanges (Strack and Waddington 2007). An increasing proportion of wet species such as Juncus spp. and Equisitum spp. will change the productivity and therefore the overall C sink potential. This decline may be compensated by the absence of biomass removal but the dynamic of such vegetation composition may be
10 Implications for Climate Change Mitigation Measures
Carbon Loss from Drained Organic Soils under Grassland – CALISTO
28
Convention that emissions from drained C-rich soils are significant and that rewetting or restoring is an important contribution to decreasing total emissions of GHGs. The critical question in the context of restoring forested peatlands is how does the restoration work impact on CH4 and CO2 exchange? In Ireland, 2,570 ha of Coillte peatlands have been restored under the LIFE programme with further commitment to restore more Western forested peatlands (Delaney 2008). While the restoration of the environmental conditions (i.e. water table, vegetation recolonisation) required to promote the return of the C sink function has received some attention in the past (Komulainen et al. 1998, Komulainen et al. 1999, Bortoluzzi et al. 2006), very little information on GHG dynamics after restoration is available in Ireland.
10.3.2 After-use of Industrial Cutaway PeatlandsThe IPCC Wetlands Supplement impacts directly on the fate of the 86,878 ha of industrial cutaway peatlands currently in Bord na Móna ownership and the smaller proportion of cutaway owned by private horticultural companies. This could prove crucial for Ireland if these vast tracks could be restored and offset GHG emissions from drained bogs where peat is currently extracted (including turf-cutting). The new EF default value of 2.8 t C/ha given by the IPCC Wetlands Supplement corresponds to values recorded by Wilson et al. (2007) on Bord na Móna cutaway peatlands ranging from 2.5 to 3 t C ha-1 yr-1. This is much higher than previous EF and therefore will dramatically increase Ireland’s contribution to GHG emissions from industrial cutaway and cutover. In the context of reporting these emissions, the default methodology requires the reporting also of the area of drained peatlands where peat is currently extracted. Currently, this applies only to the cutaway peatland in production currently owned by Bord na Móna; other small-scale commercial enterprises and domestic turf-cutting areas are not included.
While restoration of the C sink function in peatlands damaged by peat extraction has been investigated globally (Tuittila et al. 2000, Waddington et al. 2003, Yli-Petäys et al. 2007), research has been slower to develop in Ireland. A rewetted cutaway peatland in Bellacorrick, Co. Mayo has shown that appropriate after-use management can provide an important sink for C02 while managing the release of CH4. However, the majority of the industrial cutaway peatlands are located in the Midlands, where the substrate is
be relatively easy to calculate. Similarly, environmental schemes such as Rural Environment Protection Scheme (REPS) have been successful in these areas where farmers can easily adopt a new management strategy without any significant financial costs. This proposal should be backed up by the social benefits brought by such climate-friendly strategy and which have yet to be monetised. Far from ‘bearing’ the cost of a climate-friendly strategy, farmers should be seen as delivering a sustainable agriculture which benefits everybody. Regional circumstances will be important in developing these strategies and further research into a full C budget, including fluvial losses (Höll et al. 2009) and associated cost and benefits of these management options (Worrall et al. 2009b) are key to developing efficient mitigation strategies.
10.3 Other Types of Drained Organic Soils and their Associated Carbon Balance
Organic soils have been reclaimed primarily for agriculture use but a large proportion has also been drained for forestry and peat extraction. In both cases the impact of drainage on C flows essentially consists of increased oxidation of the peat matrix, leading to increased CO2 release to the atmosphere and to DOC in water outflows.
10.3.1 Under Cropland, including ForestryIn Ireland, some 292,930 ha of forests (43% of the total forest estate) are located on organic soils (Black et al. 2008). Lindsay (2010) has recently reviewed the much-discussed question of the C implications of forestry on peat bogs, and new figures show that the overall loss of C from an afforested peat bog may exceed the C gains made by the plantation forest within a 100-year time-frame. This would contradict older publications (Cannell et al. 1999, Hargreaves et al. 2003) and thus this topic is currently the subject of much forest-based research. Similarly, there are some concerns regarding the C benefit in transforming conifer forests on peat soils back to living bogs. This is a legitimate question given that the UNFCCC have made a major step towards wetland restoration with the IPCC officially working on guidance for calculating how much GHG is emitted from degraded carbon-rich peat soils (decision taken by the Subsidiary Body for Scientific and Technological Advice [SBSTA] in Bonn, Germany in June 2014). This translates to a broad acknowledgement among Parties under the
Renou-Wilson et al. (2010-CCRP-MS-1.3)
29
Other land-use options for industrial cutaway peatlands have been investigated with regards to their capability to sequester C. In 1999, a suite of C gas exchange studies were initiated under the Bord na Móna funded CARBAL project (Wilson and Farrell 2007) in afforested, naturally regenerated and rehabilitated cutaway peatlands. In all scenarios, the authors reported large losses of soil CO2 from the residual peat as have other studies in Finland (Mäkiranta et al. 2007) and Sweden (Tagesson and Lindroth 2007). More research is required on ‘abandoned’ cutaway peatlands where rewetting may not be feasible as other land use option may be more beneficial to offset the constant C release from the atmosphere (e.g. paludiculture). Sphagnum or medicinal plant species or even biomass as a renewable energy source are all potential alternative after-uses of cutaway which need to be further investigated under Irish conditions.
alkaline and not readily suitable for recolonisation by ombrotrophic bog species, such as Sphagna (Renou et al. 2006). In addition, these cutaways may not receive sufficient rainfall (compared to the west of Ireland) and this challenges the establishment of appropriate species. However, fen development following the rewetting of such cutaway may still be a climate-friendly option; a current study in Blackwater, Co. Offaly is monitoring the C sink potential over several years in order to capture inter-annual variability (Wilson 2013). The heterogeneity of the cutaways in terms of wetness across the bog (due to topographical elevation differences between peat-extraction fields) means that vegetation re-establishment needs to be facilitated and tailored so that the capacity for the site to sequester C is not jeopardised by other areas of the cutaway where drier, bare peat release C is to the atmosphere (Malloy and Price 2014).
Carbon Loss from Drained Organic Soils under Grassland – CALISTO
30
Observation 3: Nutrient-rich organic soils under grasslands produce much higher GHG emissions and also represent hotspots for fluvial C losses.
Recommendation 3: Nutrient-rich organic soils should be targeted for rewetting as a strategy to mitigate C emissions.
Observation 4: Current default EF may not be representative of the variety of grasslands over organic soils in Ireland. Our field-measured EF will help Ireland to refine EF and implement Tier 2 methodologies for IPCC inventories more effectively.
Recommendation 4: Continued monitoring to improve annual fluxes estimates to develop more robust emission factors by averaging inter-annual variability.
Observation 5: While the impacts of the nutrient and drainage status on CO2 exchanges, biomass exports and fluvial C losses were confirmed, inter-regional differences in management practice and climate are also significant factors that affect the overall NECB of these ecosystems.
Recommendations 5: It is therefore critical to develop strategies to deliver reduced emissions tailored to local grassland types.
Observation 1: Our field research concluded that nutrient status, drainage and local grassland management practices impacted on GHG fluxes and fluvial C losses as well as biomass exports.
Recommendation 1: As well as using nutrient and drainage status, grassland management practices provide significant additional information for more accurate regional extrapolation of C fluxes. These attributes are in turn intimately linked to past and current management practices in terms of drainage duration and intensity and inputs.
Observation 2: Most Irish grasslands over organic soils were drained several decades ago and are managed as extensively grazed pastures with little or no fertilisation. Nutrient-poor sites in Ireland may not exert appreciable impacts on the atmosphere in terms of NECB, particularly where the mean annual water table remains within -25 cm of the soil surface.
Recommendation 2: Nutrient-poor organic soils which are poorly drained should be targeted to remained wet (WT higher than -25cm) with a continued low input/output system.
11 Final Observations and Recommendations
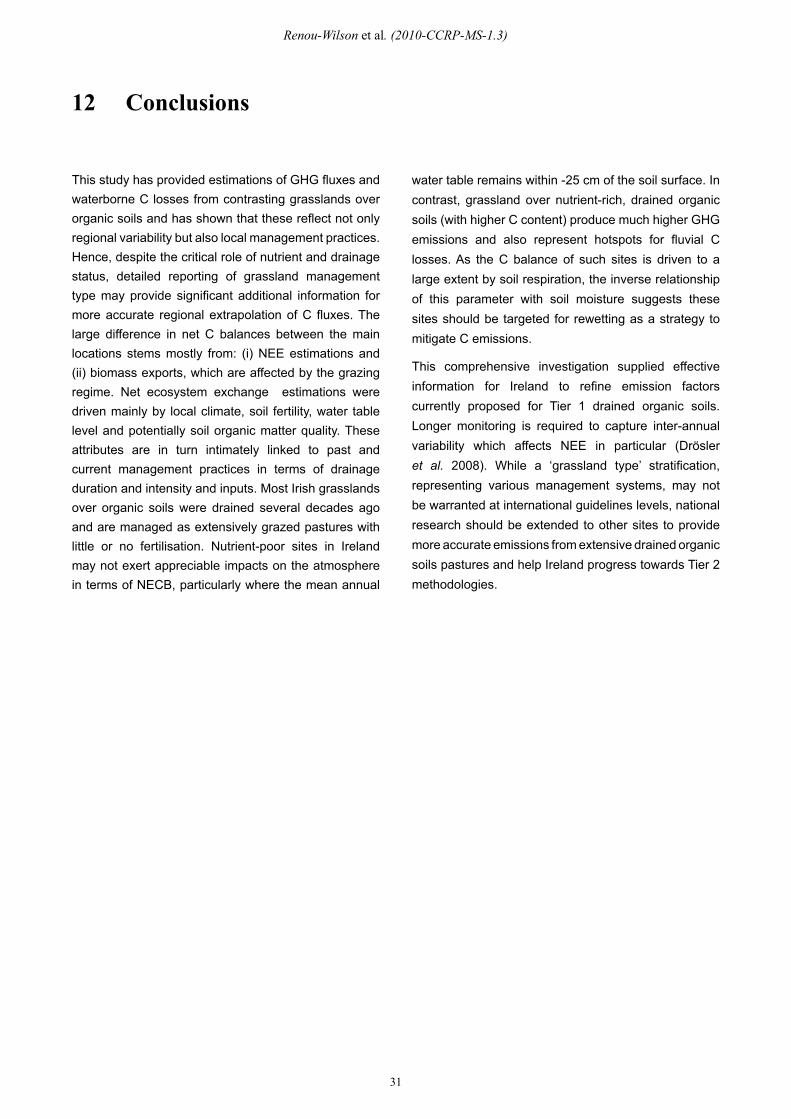
Renou-Wilson et al. (2010-CCRP-MS-1.3)
31
water table remains within -25 cm of the soil surface. In contrast, grassland over nutrient-rich, drained organic soils (with higher C content) produce much higher GHG emissions and also represent hotspots for fluvial C losses. As the C balance of such sites is driven to a large extent by soil respiration, the inverse relationship of this parameter with soil moisture suggests these sites should be targeted for rewetting as a strategy to mitigate C emissions.
This comprehensive investigation supplied effective information for Ireland to refine emission factors currently proposed for Tier 1 drained organic soils. Longer monitoring is required to capture inter-annual variability which affects NEE in particular (Drösler et al. 2008). While a ‘grassland type’ stratification, representing various management systems, may not be warranted at international guidelines levels, national research should be extended to other sites to provide more accurate emissions from extensive drained organic soils pastures and help Ireland progress towards Tier 2 methodologies.
12 Conclusions
This study has provided estimations of GHG fluxes and waterborne C losses from contrasting grasslands over organic soils and has shown that these reflect not only regional variability but also local management practices. Hence, despite the critical role of nutrient and drainage status, detailed reporting of grassland management type may provide significant additional information for more accurate regional extrapolation of C fluxes. The large difference in net C balances between the main locations stems mostly from: (i) NEE estimations and (ii) biomass exports, which are affected by the grazing regime. Net ecosystem exchange estimations were driven mainly by local climate, soil fertility, water table level and potentially soil organic matter quality. These attributes are in turn intimately linked to past and current management practices in terms of drainage duration and intensity and inputs. Most Irish grasslands over organic soils were drained several decades ago and are managed as extensively grazed pastures with little or no fertilisation. Nutrient-poor sites in Ireland may not exert appreciable impacts on the atmosphere in terms of NECB, particularly where the mean annual
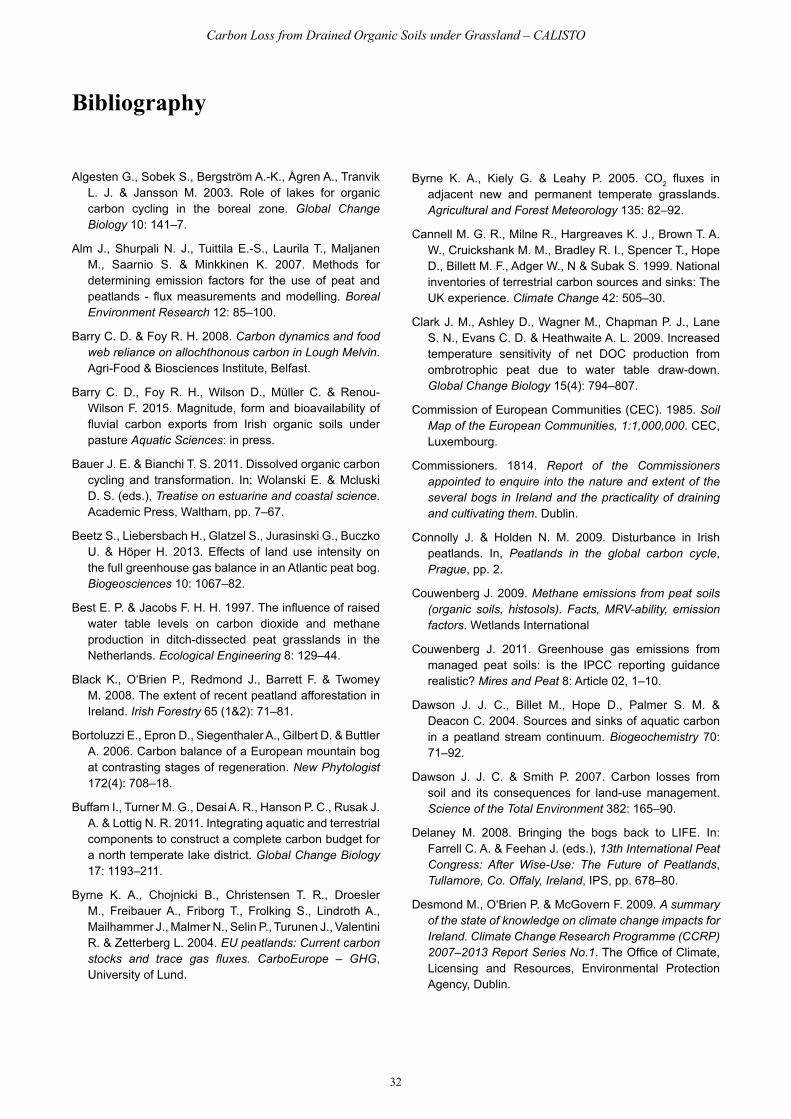
Carbon Loss from Drained Organic Soils under Grassland – CALISTO
32
Byrne K. A., Kiely G. & Leahy P. 2005. CO2 fluxes in adjacent new and permanent temperate grasslands. Agricultural and Forest Meteorology 135: 82–92.
Cannell M. G. R., Milne R., Hargreaves K. J., Brown T. A. W., Cruickshank M. M., Bradley R. I., Spencer T., Hope D., Billett M. F., Adger W., N & Subak S. 1999. National inventories of terrestrial carbon sources and sinks: The UK experience. Climate Change 42: 505–30.
Clark J. M., Ashley D., Wagner M., Chapman P. J., Lane S. N., Evans C. D. & Heathwaite A. L. 2009. Increased temperature sensitivity of net DOC production from ombrotrophic peat due to water table draw-down. Global Change Biology 15(4): 794–807.
Commission of European Communities (CEC). 1985. Soil Map of the European Communities, 1:1,000,000. CEC, Luxembourg.
Commissioners. 1814. Report of the Commissioners appointed to enquire into the nature and extent of the several bogs in Ireland and the practicality of draining and cultivating them. Dublin.
Connolly J. & Holden N. M. 2009. Disturbance in Irish peatlands. In, Peatlands in the global carbon cycle, Prague, pp. 2.
Couwenberg J. 2009. Methane emissions from peat soils (organic soils, histosols). Facts, MRV-ability, emission factors. Wetlands International
Couwenberg J. 2011. Greenhouse gas emissions from managed peat soils: is the IPCC reporting guidance realistic? Mires and Peat 8: Article 02, 1–10.
Dawson J. J. C., Billet M., Hope D., Palmer S. M. & Deacon C. 2004. Sources and sinks of aquatic carbon in a peatland stream continuum. Biogeochemistry 70: 71–92.
Dawson J. J. C. & Smith P. 2007. Carbon losses from soil and its consequences for land-use management. Science of the Total Environment 382: 165–90.
Delaney M. 2008. Bringing the bogs back to LIFE. In: Farrell C. A. & Feehan J. (eds.), 13th International Peat Congress: After Wise-Use: The Future of Peatlands, Tullamore, Co. Offaly, Ireland, IPS, pp. 678–80.
Desmond M., O‘Brien P. & McGovern F. 2009. A summary of the state of knowledge on climate change impacts for Ireland. Climate Change Research Programme (CCRP) 2007–2013 Report Series No.1. The Office of Climate, Licensing and Resources, Environmental Protection Agency, Dublin.
Bibliography
Algesten G., Sobek S., Bergström A.-K., Ågren A., Tranvik L. J. & Jansson M. 2003. Role of lakes for organic carbon cycling in the boreal zone. Global Change Biology 10: 141–7.
Alm J., Shurpali N. J., Tuittila E.-S., Laurila T., Maljanen M., Saarnio S. & Minkkinen K. 2007. Methods for determining emission factors for the use of peat and peatlands - flux measurements and modelling. Boreal Environment Research 12: 85–100.
Barry C. D. & Foy R. H. 2008. Carbon dynamics and food web reliance on allochthonous carbon in Lough Melvin. Agri-Food & Biosciences Institute, Belfast.
Barry C. D., Foy R. H., Wilson D., Müller C. & Renou-Wilson F. 2015. Magnitude, form and bioavailability of fluvial carbon exports from Irish organic soils under pasture Aquatic Sciences: in press.
Bauer J. E. & Bianchi T. S. 2011. Dissolved organic carbon cycling and transformation. In: Wolanski E. & Mcluski D. S. (eds.), Treatise on estuarine and coastal science. Academic Press, Waltham, pp. 7–67.
Beetz S., Liebersbach H., Glatzel S., Jurasinski G., Buczko U. & Höper H. 2013. Effects of land use intensity on the full greenhouse gas balance in an Atlantic peat bog. Biogeosciences 10: 1067–82.
Best E. P. & Jacobs F. H. H. 1997. The influence of raised water table levels on carbon dioxide and methane production in ditch-dissected peat grasslands in the Netherlands. Ecological Engineering 8: 129–44.
Black K., O‘Brien P., Redmond J., Barrett F. & Twomey M. 2008. The extent of recent peatland afforestation in Ireland. Irish Forestry 65 (1&2): 71–81.
Bortoluzzi E., Epron D., Siegenthaler A., Gilbert D. & Buttler A. 2006. Carbon balance of a European mountain bog at contrasting stages of regeneration. New Phytologist 172(4): 708–18.
Buffam I., Turner M. G., Desai A. R., Hanson P. C., Rusak J. A. & Lottig N. R. 2011. Integrating aquatic and terrestrial components to construct a complete carbon budget for a north temperate lake district. Global Change Biology 17: 1193–211.
Byrne K. A., Chojnicki B., Christensen T. R., Droesler M., Freibauer A., Friborg T., Frolking S., Lindroth A., Mailhammer J., Malmer N., Selin P., Turunen J., Valentini R. & Zetterberg L. 2004. EU peatlands: Current carbon stocks and trace gas fluxes. CarboEurope – GHG, University of Lund.
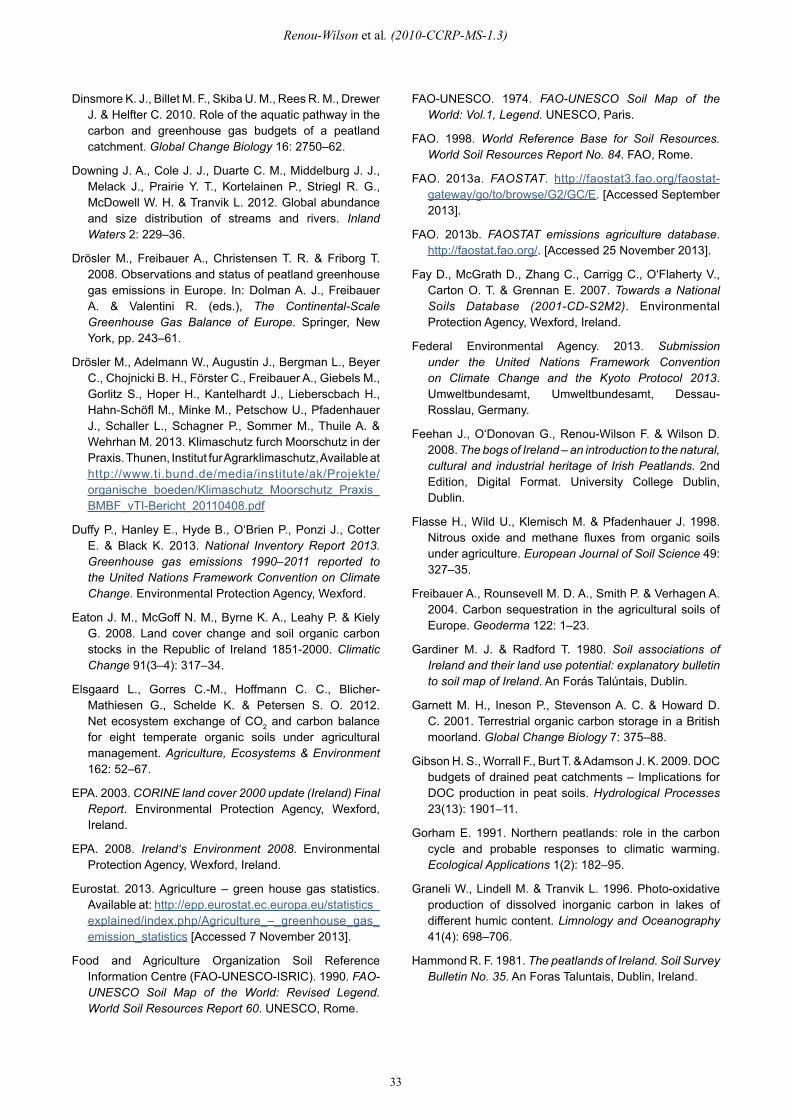
Renou-Wilson et al. (2010-CCRP-MS-1.3)
33
FAO-UNESCO. 1974. FAO-UNESCO Soil Map of the World: Vol.1, Legend. UNESCO, Paris.
FAO. 1998. World Reference Base for Soil Resources. World Soil Resources Report No. 84. FAO, Rome.
FAO. 2013a. FAOSTAT. http://faostat3.fao.org/faostat-gateway/go/to/browse/G2/GC/E. [Accessed September 2013].
FAO. 2013b. FAOSTAT emissions agriculture database. http://faostat.fao.org/. [Accessed 25 November 2013].
Fay D., McGrath D., Zhang C., Carrigg C., O‘Flaherty V., Carton O. T. & Grennan E. 2007. Towards a National Soils Database (2001-CD-S2M2). Environmental Protection Agency, Wexford, Ireland.
Federal Environmental Agency. 2013. Submission under the United Nations Framework Convention on Climate Change and the Kyoto Protocol 2013. Umweltbundesamt, Umweltbundesamt, Dessau-Rosslau, Germany.
Feehan J., O‘Donovan G., Renou-Wilson F. & Wilson D. 2008. The bogs of Ireland – an introduction to the natural, cultural and industrial heritage of Irish Peatlands. 2nd Edition, Digital Format. University College Dublin, Dublin.
Flasse H., Wild U., Klemisch M. & Pfadenhauer J. 1998. Nitrous oxide and methane fluxes from organic soils under agriculture. European Journal of Soil Science 49: 327–35.
Freibauer A., Rounsevell M. D. A., Smith P. & Verhagen A. 2004. Carbon sequestration in the agricultural soils of Europe. Geoderma 122: 1–23.
Gardiner M. J. & Radford T. 1980. Soil associations of Ireland and their land use potential: explanatory bulletin to soil map of Ireland. An Forás Talúntais, Dublin.
Garnett M. H., Ineson P., Stevenson A. C. & Howard D. C. 2001. Terrestrial organic carbon storage in a British moorland. Global Change Biology 7: 375–88.
Gibson H. S., Worrall F., Burt T. & Adamson J. K. 2009. DOC budgets of drained peat catchments – Implications for DOC production in peat soils. Hydrological Processes 23(13): 1901–11.
Gorham E. 1991. Northern peatlands: role in the carbon cycle and probable responses to climatic warming. Ecological Applications 1(2): 182–95.
Graneli W., Lindell M. & Tranvik L. 1996. Photo-oxidative production of dissolved inorganic carbon in lakes of different humic content. Limnology and Oceanography 41(4): 698–706.
Hammond R. F. 1981. The peatlands of Ireland. Soil Survey Bulletin No. 35. An Foras Taluntais, Dublin, Ireland.
Dinsmore K. J., Billet M. F., Skiba U. M., Rees R. M., Drewer J. & Helfter C. 2010. Role of the aquatic pathway in the carbon and greenhouse gas budgets of a peatland catchment. Global Change Biology 16: 2750–62.
Downing J. A., Cole J. J., Duarte C. M., Middelburg J. J., Melack J., Prairie Y. T., Kortelainen P., Striegl R. G., McDowell W. H. & Tranvik L. 2012. Global abundance and size distribution of streams and rivers. Inland Waters 2: 229–36.
Drösler M., Freibauer A., Christensen T. R. & Friborg T. 2008. Observations and status of peatland greenhouse gas emissions in Europe. In: Dolman A. J., Freibauer A. & Valentini R. (eds.), The Continental-Scale Greenhouse Gas Balance of Europe. Springer, New York, pp. 243–61.
Drösler M., Adelmann W., Augustin J., Bergman L., Beyer C., Chojnicki B. H., Förster C., Freibauer A., Giebels M., Gorlitz S., Hoper H., Kantelhardt J., Lieberscbach H., Hahn-Schöfl M., Minke M., Petschow U., Pfadenhauer J., Schaller L., Schagner P., Sommer M., Thuile A. & Wehrhan M. 2013. Klimaschutz furch Moorschutz in der Praxis. Thunen, Institut fur Agrarklimaschutz, Available at http://www.ti.bund.de/media/institute/ak/Projekte/organische_boeden/Klimaschutz_Moorschutz_Praxis_BMBF_vTI-Bericht_20110408.pdf
Duffy P., Hanley E., Hyde B., O‘Brien P., Ponzi J., Cotter E. & Black K. 2013. National Inventory Report 2013. Greenhouse gas emissions 1990–2011 reported to the United Nations Framework Convention on Climate Change. Environmental Protection Agency, Wexford.
Eaton J. M., McGoff N. M., Byrne K. A., Leahy P. & Kiely G. 2008. Land cover change and soil organic carbon stocks in the Republic of Ireland 1851-2000. Climatic Change 91(3–4): 317–34.
Elsgaard L., Gorres C.-M., Hoffmann C. C., Blicher-Mathiesen G., Schelde K. & Petersen S. O. 2012. Net ecosystem exchange of CO2 and carbon balance for eight temperate organic soils under agricultural management. Agriculture, Ecosystems & Environment 162: 52–67.
EPA. 2003. CORINE land cover 2000 update (Ireland) Final Report. Environmental Protection Agency, Wexford, Ireland.
EPA. 2008. Ireland‘s Environment 2008. Environmental Protection Agency, Wexford, Ireland.
Eurostat. 2013. Agriculture – green house gas statistics. Available at: http://epp.eurostat.ec.europa.eu/statistics_explained/index.php/Agriculture_–_greenhouse_gas_emission_statistics [Accessed 7 November 2013].
Food and Agriculture Organization Soil Reference Information Centre (FAO-UNESCO-ISRIC). 1990. FAO-UNESCO Soil Map of the World: Revised Legend. World Soil Resources Report 60. UNESCO, Rome.
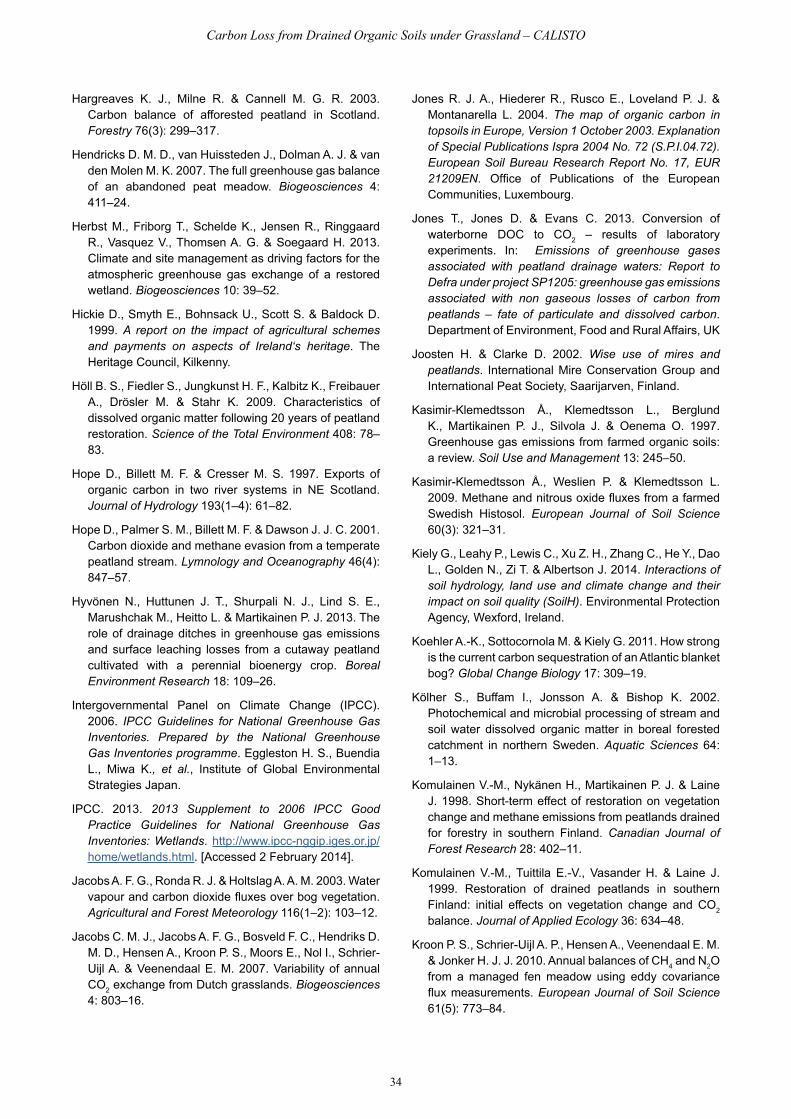
Carbon Loss from Drained Organic Soils under Grassland – CALISTO
34
Jones R. J. A., Hiederer R., Rusco E., Loveland P. J. & Montanarella L. 2004. The map of organic carbon in topsoils in Europe, Version 1 October 2003. Explanation of Special Publications Ispra 2004 No. 72 (S.P.I.04.72). European Soil Bureau Research Report No. 17, EUR 21209EN. Office of Publications of the European Communities, Luxembourg.
Jones T., Jones D. & Evans C. 2013. Conversion of waterborne DOC to CO2 – results of laboratory experiments. In: Emissions of greenhouse gases associated with peatland drainage waters: Report to Defra under project SP1205: greenhouse gas emissions associated with non gaseous losses of carbon from peatlands – fate of particulate and dissolved carbon. Department of Environment, Food and Rural Affairs, UK
Joosten H. & Clarke D. 2002. Wise use of mires and peatlands. International Mire Conservation Group and International Peat Society, Saarijarven, Finland.
Kasimir-Klemedtsson Å., Klemedtsson L., Berglund K., Martikainen P. J., Silvola J. & Oenema O. 1997. Greenhouse gas emissions from farmed organic soils: a review. Soil Use and Management 13: 245–50.
Kasimir-Klemedtsson Å., Weslien P. & Klemedtsson L. 2009. Methane and nitrous oxide fluxes from a farmed Swedish Histosol. European Journal of Soil Science 60(3): 321–31.
Kiely G., Leahy P., Lewis C., Xu Z. H., Zhang C., He Y., Dao L., Golden N., Zi T. & Albertson J. 2014. Interactions of soil hydrology, land use and climate change and their impact on soil quality (SoilH). Environmental Protection Agency, Wexford, Ireland.
Koehler A.-K., Sottocornola M. & Kiely G. 2011. How strong is the current carbon sequestration of an Atlantic blanket bog? Global Change Biology 17: 309–19.
Kölher S., Buffam I., Jonsson A. & Bishop K. 2002. Photochemical and microbial processing of stream and soil water dissolved organic matter in boreal forested catchment in northern Sweden. Aquatic Sciences 64: 1–13.
Komulainen V.-M., Nykänen H., Martikainen P. J. & Laine J. 1998. Short-term effect of restoration on vegetation change and methane emissions from peatlands drained for forestry in southern Finland. Canadian Journal of Forest Research 28: 402–11.
Komulainen V.-M., Tuittila E.-V., Vasander H. & Laine J. 1999. Restoration of drained peatlands in southern Finland: initial effects on vegetation change and CO2 balance. Journal of Applied Ecology 36: 634–48.
Kroon P. S., Schrier-Uijl A. P., Hensen A., Veenendaal E. M. & Jonker H. J. J. 2010. Annual balances of CH4 and N2O from a managed fen meadow using eddy covariance flux measurements. European Journal of Soil Science 61(5): 773–84.
Hargreaves K. J., Milne R. & Cannell M. G. R. 2003. Carbon balance of afforested peatland in Scotland. Forestry 76(3): 299–317.
Hendricks D. M. D., van Huissteden J., Dolman A. J. & van den Molen M. K. 2007. The full greenhouse gas balance of an abandoned peat meadow. Biogeosciences 4: 411–24.
Herbst M., Friborg T., Schelde K., Jensen R., Ringgaard R., Vasquez V., Thomsen A. G. & Soegaard H. 2013. Climate and site management as driving factors for the atmospheric greenhouse gas exchange of a restored wetland. Biogeosciences 10: 39–52.
Hickie D., Smyth E., Bohnsack U., Scott S. & Baldock D. 1999. A report on the impact of agricultural schemes and payments on aspects of Ireland‘s heritage. The Heritage Council, Kilkenny.
Höll B. S., Fiedler S., Jungkunst H. F., Kalbitz K., Freibauer A., Drösler M. & Stahr K. 2009. Characteristics of dissolved organic matter following 20 years of peatland restoration. Science of the Total Environment 408: 78–83.
Hope D., Billett M. F. & Cresser M. S. 1997. Exports of organic carbon in two river systems in NE Scotland. Journal of Hydrology 193(1–4): 61–82.
Hope D., Palmer S. M., Billett M. F. & Dawson J. J. C. 2001. Carbon dioxide and methane evasion from a temperate peatland stream. Lymnology and Oceanography 46(4): 847–57.
Hyvönen N., Huttunen J. T., Shurpali N. J., Lind S. E., Marushchak M., Heitto L. & Martikainen P. J. 2013. The role of drainage ditches in greenhouse gas emissions and surface leaching losses from a cutaway peatland cultivated with a perennial bioenergy crop. Boreal Environment Research 18: 109–26.
Intergovernmental Panel on Climate Change (IPCC). 2006. IPCC Guidelines for National Greenhouse Gas Inventories. Prepared by the National Greenhouse Gas Inventories programme. Eggleston H. S., Buendia L., Miwa K., et al., Institute of Global Environmental Strategies Japan.
IPCC. 2013. 2013 Supplement to 2006 IPCC Good Practice Guidelines for National Greenhouse Gas Inventories: Wetlands. http://www.ipcc-nggip.iges.or.jp/home/wetlands.html. [Accessed 2 February 2014].
Jacobs A. F. G., Ronda R. J. & Holtslag A. A. M. 2003. Water vapour and carbon dioxide fluxes over bog vegetation. Agricultural and Forest Meteorology 116(1–2): 103–12.
Jacobs C. M. J., Jacobs A. F. G., Bosveld F. C., Hendriks D. M. D., Hensen A., Kroon P. S., Moors E., Nol I., Schrier-Uijl A. & Veenendaal E. M. 2007. Variability of annual CO2 exchange from Dutch grasslands. Biogeosciences 4: 803–16.
Renou-Wilson et al. (2010-CCRP-MS-1.3)
35
Malloy S. & Price J. 2014. Fen restoration on a bog harvested down to sedge peat: a hydrological assessment. Ecological Engineering 64: 151–60.
McGettigan M., Duffy P., Hyde B. & O‘Brien P. 2009. National Inventory Report 2009. Greenhouse gas emissions 1990–2007 reported to the United Nation‘s Framework Convention on Climate Change. Environmental Protection Agency, Wexford.
McNally G. 2008. 50 years of research endeavour on the future use of Irish cutaway peatlands. In: Feehan J. & Farrell C. A. (eds.), After Wise Use – The Future of Peatlands: Proceedings of the 13th International Peat Congress – Volume 1, Tullamore, Ireland, June 8–13, 2008, International Peat Society, pp. 418–20.
Met Éireann. 2013. Regional weather data. http://www.met.ie. [Accessed October 2013].
Mills G. 2000. Modelling the water budget of Ireland – evapotranspiration and soil moisture. Irish Geography 33(2): 99–116.
Minkkinen K. & Laine J. 2006. Vegetation heterogeneity and ditches create spatial variability in methan fluxes from peatlands drained for forestry. Plant and Soil 285: 289–304.
National Environmental Research Institute. 2013. Denmark‘s National Inventory Report 2013. Report N. T., National Environmental Research Institute, Aarhus University, Denmark.
Netherlands Environmental Assessment Agency. 2009. Greenhouse Gas Emissions in the Netherlands 1990–2007. PBL report 500080012/2009. PBL, Ah Bilthoven, The Netherlands.
Nieveen J. P., Campbell D. I., Schipper L. A. & Blair I. J. 2005. Carbon exchange of grazed pasture on a drained peat soil. Global Change Biology 11: 607–18.
Nykänen H., Alm J., Lång K., Silvola J. & Martikainen P. J. 1995. Emissions of CH4, N2O and CO2 from a virgin fen and a fen drained for grassland in Finland. Journal of Biogeography 22: 351–7.
O‘Brien P. 2007. Data analysis and estimation of greenhouse gas emissions and removal for the IPCC sector land use, land use change and forestry sectors in Ireland. Environmental Research Centre Report Environmental Protection Agency, Wexford, Ireland.
O‘Mara F., Ryan M., Connolly J., O‘Tool P., Carton O., Lenehan J. J., Lovett D., Hyde B., Jordan E. & Hawkins M. 2007. Estimation of emissions of greenhouse gases from agriculture and strategies for their reduction. synthesis report. Environmental Protection Agency, Wexford, Ireland.
Kuntze H. 1992. Peat losses by liming and fertilization of peatlands used as grassland. Proceedings of 9th International Peat Congress. International Peat Society, Uppsala, Sweden, Vol. 2, 306–14.
Langeveld C. A., Segers R., Dirks B. O. M., Van den Pol-van Dasselaar A., Velthof G. L. & Hensen A. 1997. Emissions of CO2, CH4 and N2O from pasture on drained peat soils in the Netherlands. European Journal of Agronomy 7: 35–42.
Leahy P., Kiely G. & Scanlon T. M. 2004. Managed grasslands; A greenhouse gas sink or source? Geophysical Research Letters 31(L20507): doi:10.1029/2004GL021161.
Leiber-Sauheitl K., Fuß R., Voigt C. & Freibauer A. 2013. High greenhouse gas fluxes from grassland on histic gleysol along soil carbon and drainage gradients. Biogeosciences 11: 749–61.
Levy P. E., Burden A., Cooper M. D. A., Dinsmore K. J., Drewer J., Evans C., Fowler D., Gaiawyn J., Gray A., Jones S. K., Jones T., McNamara N. P., Mills R., Ostle N., Sheppard L. J., Skiba U., Sowerby A., Ward S. E. & Zieliński P. 2012. Methane emissions from soils: synthesis and analysis of a large UK data set. Global Change Biology 18(5): 1657–69.
Lindsay R. 2010. Peatbogs and Carbon – A critical synthesis. University of East London and Royal Society for the Protection of Birds Scotland, London.
Lloyd C. R. 2006. Annual carbon balance of a managed wetland meadow in the Somerset Levels, UK. Agricultural and Forest Meteorology 138: 168–79.
Lohila A. 2008. Carbon dioxide exchange on cultivated and afforested boreal peatlands. Ph.D thesis, University of Kuopio, Kuopio.
Mäkiranta P., Hytönen J., Aro L., Maljanen M., Pihlatie M., Potila H., Shurpali N. J., Laine J., Lohila A., Martikainen P. J. & Minkkinen K. 2007. Soil greenhouse gas emissions from afforested organic soil croplands and cutaway peatlands. Boreal Environment Research 12: 159–75.
Maljanen M., Liikanen A., Silvola J. & Martikainen P. J. 2003. Measuring N2O emissions from organic soils by closed chamber or soil / snow N2O gradient methods. European Journal of Soil Science 54: 625–31.
Maljanen M., Hytönen J., Mäkiranta P., Alm J., Minkkinen K., Laine J. & Martikainen P. J. 2007. Greenhouse gas emissions from cultivated and abandoned organic croplands in Finland. Boreal Environment Research 12: 133–40.
Maljanen M., Sigurdsson B. D., Gudmundsson J., Oskarsson H., Huttunen J. T. & Martikainen P. J. 2010. Greenhouse gas balances of managed peatlands in the Nordic countries – present knowledge and gaps. Biogeosciences 7: 2711–38.
Carbon Loss from Drained Organic Soils under Grassland – CALISTO
36
Schils R., Kuikman P., Liski J., van Oijen M., Smith P., Webb J., Alm J., Somogyi Z., van den Akker J., Billet M., Emmett B., Evans C., Lindner M., Palosuo T., Bellamy P., Jandl R. & Hiederer R. 2008. Review of existing information on the interrelations between soil and climate change. Climsoil Final Report. Wageningen, The Netherlands.
Schrier-Uijl A., Kroon P. S., Leffelaar P. A., von Huissteden J. C., Berendse F. & Veenendaal E. M. 2010. Methane emissions in two drained peat agro-ecosystems with high and low agricultural intensity. Plant Soil 329: 509–20.
Schrier-Uijl A., Kroon P. S., Hendriks D. M. D., Hensen A., Van Huissteden J., Leffelaar P. A., Berendse F. & Veenendaal E. M. 2014. Agricultural peat lands; towards a greenhouse gas sink – a synthesis of a Dutch landscape study. Biogeosciences, 11, 4559–576.
Simek U. & Cooper J. E. 2002. The influence of soil pH on denitrification: progress towards the understanding of this interaction over the last 50 yeras. European Journal of Soil Science 53: 345–54.
Skiba U., Jones S. K., Drewer J., Helfter C., Anderson M., Dinsmore K., McKenzie R., Nemitz E. & Sutton M. A. 2013. Comparison of soil greenhouse gas fluxes from extensive and intensive grazing in a temperate maritime climate. Biogeosciences 10: 1231–41.
Smith P., Martino D., Cai Z., Gwary D., Janzen H. H., Kumar P., McCarl B., Ogle S. M., O‘Mara F., Rice C., Scholes B. & Sirotenko O. 2007. Agriculture. In: Metz. B., Davidson P. R., Bosch P. R., et al. (eds.), Climate Change 2007: Mitigation. Contribution of Working Group III to the Fourth Assessment Report of the Intergovernmental Panel on Climate Change. Cambridge University Press, Cambridge, UK, pp. 499–540.
Soussana J. F., Loiseau P., Vuichard N., Ceschia E., Balesdent J., Chevallier T. & Arrouays D. 2004. Carbon cycling and sequestration opportunities in temperate grasslands. Soil Use and Management 20: 219–30.
Soussana J. F., Allard V., Pilegaard K., Ambus P., Ammann C., Campbell C., Ceschia E., Clifton-Brown J., Czobel S., Domingues T., Flechards, Fuhrer J., Hensen A., Horvath L., Jones M. D., Kasper G., Martin C. M., Nagy Z., Neftel A., Raschi A., Baronti S., Rees R. M., Skiba U., STefani P., Manca G., Sutton M. A., Tuba Z. & Valentini R. 2007. Full accounting of the greenhouse gas (CO2, N2O and CH4) budget of nine European grassland sites. Agriculture, Ecosystems & Environment 121(1–2): 121–34.
Strack M., Waddington J. M. & Tuittila E.-S. 2004. Effect of water table drawdown on northern peatland methane dynamics: implications for climate change. Global Biogeochemical Cycles 18: GB4003, doi:10.1029/2003GB002209.
Oleszczuk R., Regina K., Szajdak L., Höper H. & Maryganova V. 2008. Impacts of agricultural utilization of peat soils on the greenhouse gas balance. In: Strack M. (ed.), Peatlands and Climate Change. International Peat Society, Jyväskylä, Finland, pp. 70–97.
Parish F., Sirin A., Charman D., Joosten H., Minayeva T., Silvius M. & Stringer I. 2008. Assessment on peatlands, biodiversity and climate change. Main report. Global Environment Centre, Kuala Lumpur and Wetlands International, Wageningen.
Penman J., Gytarsky M., Hiraishi T., Krug T., Kruger D., Pipatti R., Buendia L., Miwa K., Ngara T., Tanabe K. & Wagner F. (eds.), 2003. Good practice guidance for land use, land-use change and forestry. Published for the IPCC by the Institute for Global Environmental Strategies, Hayama, Japan.
Petersen S. O., Hoffmann C. C., Schafer C.-M., Blicher-Mathiesen G., Elsgaard L., Kristensen K., Larsen S. E., Torp S. B. & Greve M. H. 2012. Annual emissions of CH4 and N2O, and ecosystem respiration, from eight organic soils in Western Denmark managed by agriculture. Biogeosciences 9: 403–22.
Pihlatie M. 2007. Nitrous oxide emissions from selected natural and managed northern ecosystems. Ph.D thesis, University of Helsinki, Helsinki, Finland.
Regina K., Syväsalo E., Hannukkala A. & Esala M. 2004. Fluxes of N2O from farmed peat soils in Finland. European Journal of Soil Science 55(3): 591–9.
Renou-Wilson F., Bolger T., Bullock C., Convery F., Curry J. P., Ward S., Wilson D. & Müller C. 2011. BOGLAND – Sustainable Management of Peatlands in Ireland. STRIVE Report No. 75, Environmental Protection Agency, Wexford, Ireland.
Renou-Wilson F., Barry C., Müller C. & Wilson D. 2014. The impacts of drainage, nutrient status and management practice on the full carbon balance of grasslands on organic soils in a maritime temperate zone. Biogeosciences 11(16): 4361–79.
Renou F., Egan T. & Wilson D. 2006. Tomorrow‘s landscapes: studies in the after-uses of industrial cutaway peatlands in Ireland. Suo 57(4): 97–107.
Richey J. E. 2004. Pathways of atmospheric CO2 through fluvial systems. In: Field C. B. & Raupach M. R. (eds.), The global C cycle. Scope, Island Press, Washington DC, pp. 329–40.
Rowson J. G., Gibson H. S., Worrall F., Ostle N., Burt T. P. & Adamson J. K. 2010. The complete carbon budget of a drained peat catchment. Soil Use and Management 26: 261–73.
Schaller L., Kantelhardt J. & Drösler M. 2011. Cultivating the climate: socio-economic prospects and consequences of climate-friendly peat land management in Germany. Hydrobiologia 674: 91–104.
Renou-Wilson et al. (2010-CCRP-MS-1.3)
37
Vermaat J., Hellmann F., Dias A. C., Hoorens B., Logtestijn R. P. & Aerts R. 2011. Greenhouse Gas Fluxes from Dutch Peatland Water Bodies: Importance of the Surrounding Landscape. Wetlands 31(3): 493–98.
Waddington J. M., Greenwood M. J., Petrone R. M. & Price J. S. 2003. Mulch decomposition impedes recovery of net carbon sink function in a restored peatland. Ecological Engineering 20: 199–210.
Wallage Z. E., Holden J. & McDonald A. T. 2006. Drain blocking: an effective treatment for reducing dissolved organic carbon loss and water discolouration in a drained peatland. Science of the Total Environment 367: 811–21.
Wallin M. B., Grabs T., Buffam I., Laudon H., Ågren A., Oquist G. & Bishop K. 2013. Evasion of CO2 from streams – The dominant component of the carbon export through the aquatic conduit in a boreal landscape. Global Change Biology 19(3): 785–97.
Walling D. E. & Webb B. W. 1985. Estimating the discharge of contaminants to coastal waters by rivers – some cautionary comments. Marine Pollution Bulletin 16: 488–92.
Wilson D. & Farrell E. P. 2007. CARBAL: Carbon gas balances in industrial cutaway peatlands in Ireland. Final Report for Bord na Móna. Forest Ecosystem Research Group, University College Dublin, Ireland.
Wilson D., Tuittila E.-S., Alm J., Laine J., Farrell E. P. & Byrne K. A. 2007. Carbon dioxide dynamics of a restored maritime peatland. Ecoscience 14(1): 71–80.
Wilson D. 2013. Carbon in cutaway peatlands: will it stay or will it go? Bord na Mona Biodiversity Action Plan, Tullamore, Ireland.
Wilson D., Müller C. & Renou-Wilson F. 2013. Carbon emissions and removals from Irish peatlands: current trends and future mitigation measures. Irish Geography: DOI: 10.1080/00750778.2013.848542.
Worrall F., Burt T. P., Rowson J. G., Warburton J. & Adamson J. K. 2009a. The multi-annual carbon budget of a peat-covered catchment. Science of the Total Environment 407: 4084–94.
Worrall F., Evans M. G., Bonn A., Reed M. S., Chapman D. & Holden J. 2009b. Can carbon offsetting pay for upland ecological restoration? Science of the Total Environment 408: 26–36.
Yli-Petäys M., Laine J., Vasander H. & Tuittila E.-S. 2007. Carbon gas exchange of a re-vegetated cut-away peatland five decades after abandonment. Boreal Environment Research 12: 177–90.
Strack M. & Waddington J. M. 2007. Response of peatland carbon dioxide and methane fluxes to a water table drawdown experiment. Global Biogeochemical Cycles 21: GB1007, doi:10.1029/2006GB002715.
Stumm W. & Morgan J. J. 1996. Aquatic chemistry, chemical equilibria and rates in natural waters. John Wiley & Sons, New York.
Sullivan C. A., Skeffington Sheehy M., Gormally M. J. & Finn J. A. 2010. The ecological status of grasslands on lowland farmlands in western Ireland and implications for grassland classification and nature value assessment. Biological Conservation 143: 1529–39.
Sweeney J., Albanito F., Brereton A., Caffarra A., Charlton R., Donnelly A., Fealy R., Fitzgerald J., Holden N., Jones M. & Murphy C. 2008. Climate Change – Refining the impacts for Ireland. Environmental Protection Agency, Wexford, Ireland.
Tagesson T. & Lindroth A. 2007. High carbon efflux rates in several ecosystems in southern Sweden. Boreal Environment Research 12: 65–80.
Teh Y., Silver W., Sonnentag O., Detto M., Kelly M. & Baldocchi D. 2011. Large greenhouse gas emissions from a temperate peatland pasture. Ecosystems 14(2): 311–25.
Telmer K. & Veizer J. 1999. Carbon fluxes, pCO2 and substrate weathering in a large northern river basin, Canada: carbon isotope perspectives. Chemical Geology 159: 61–86.
Tomlinson R. W. 2005. Soil carbon stocks and changes in the Republic of Ireland. Journal of Environmental Management 76: 77–93.
Tuittila E.-S., Komulainen V.-M., Vasander H., Nykänen H., Martikainen P. J. & Laine J. 2000. Methane dynamics of a restored cut-away peatland. Global Change Biology 6: 569–81.
Urbanová Z., Picek T. & Bárta J. 2011. Effect of peat re-wetting on carbon and nutrient fluxes, greenhouse gas production and diversity of methanogenic archaeal community. Ecological Engineering 37(7): 1017–26.
van Beek C. L., Pleijter M. & Kuikman P. J. 2011. Nitrous oxide emissions from fertilized and unfertilized grasslands on peat soil. Nutrient Cycling in Agroecosystems 89: 453–61.
Veenendaal E. M., Kolle O., Leffelaar P. A., Schrier-Uijl A. P., van Huissteden J., Van Walsem J., Moller F. & Berendse F. 2007. CO2 exchange and carbon balance in two grassland sites on eutrophic drained peat soils. Biogeosciences 4: 1027–40.

38
Carbon Loss from Drained Organic Soils under Grassland – CALISTO
Acronyms and Annotations
CH4 Methane
CO2 Carbon dioxide
DIC Dissolved Inorganic Carbon
DOC Dissolved Organic Carbon
ECD Electron Capture Detector
GHG Greenhouse gas
GPP Gross photosynthesis
GWP Global Warming Potential
HCO3- Bicarbonate
IPCC Intergovernmental Panel for Climate Change
N2O Nitrous oxide
NEE Net ecosystem exchange
pCO2 Excess CO2
POC Particulate Organic Carbon
PPFD Photosynthetic Photon Flux Density
RECO Ecosystem respiration
TOC Total Organic Carbon
UNFCCC United Nations Framework Convention on Climate Change

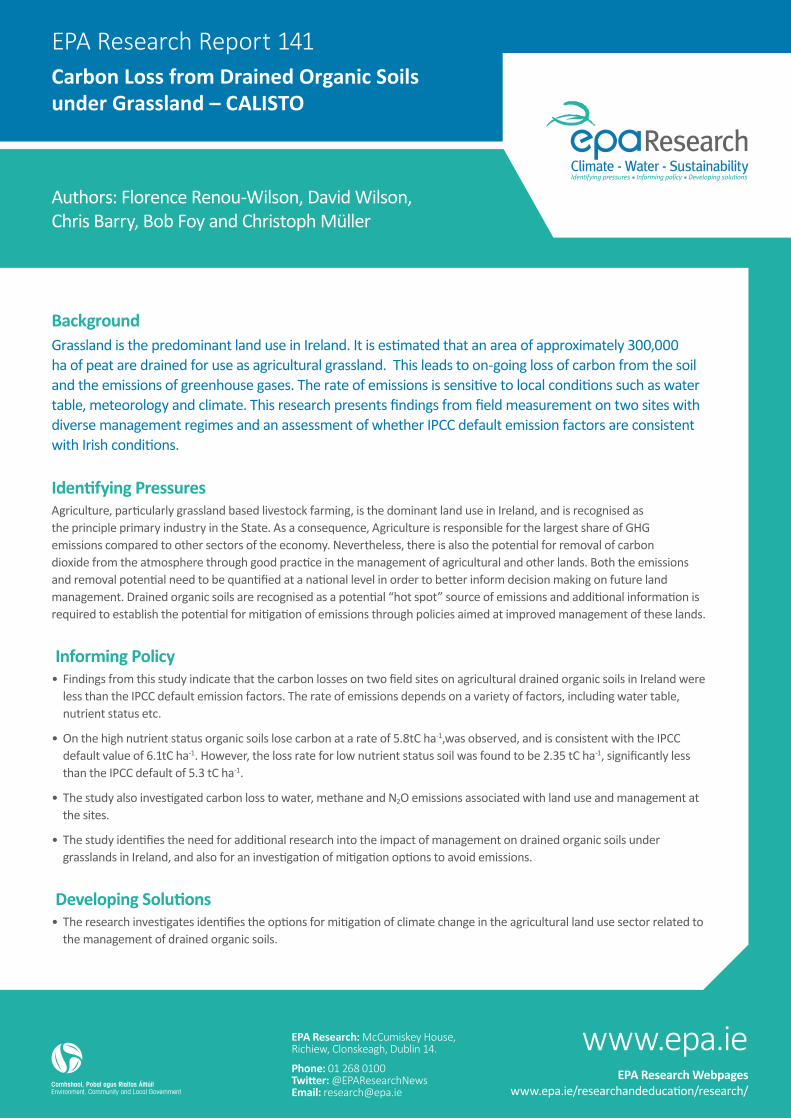
www.epa.ie
BackgroundGrassland is the predominant land use in Ireland. It is estimated that an area of approximately 300,000 ha of peat are drained for use as agricultural grassland. This leads to on-going loss of carbon from the soil and the emissions of greenhouse gases. The rate of emissions is sensitive to local conditions such as water table, meteorology and climate. This research presents findings from field measurement on two sites with diverse management regimes and an assessment of whether IPCC default emission factors are consistent with Irish conditions.
Identifying Pressures Agriculture, particularly grassland based livestock farming, is the dominant land use in Ireland, and is recognised as the principle primary industry in the State. As a consequence, Agriculture is responsible for the largest share of GHG emissions compared to other sectors of the economy. Nevertheless, there is also the potential for removal of carbon dioxide from the atmosphere through good practice in the management of agricultural and other lands. Both the emissions and removal potential need to be quantified at a national level in order to better inform decision making on future land management. Drained organic soils are recognised as a potential “hot spot” source of emissions and additional information is required to establish the potential for mitigation of emissions through policies aimed at improved management of these lands.
Informing Policy• Findings from this study indicate that the carbon losses on two field sites on agricultural drained organic soils in Ireland were
less than the IPCC default emission factors. The rate of emissions depends on a variety of factors, including water table, nutrient status etc.
• On the high nutrient status organic soils lose carbon at a rate of 5.8tC ha-1,was observed, and is consistent with the IPCC default value of 6.1tC ha-1. However, the loss rate for low nutrient status soil was found to be 2.35 tC ha-1, significantly less than the IPCC default of 5.3 tC ha-1.
• The study also investigated carbon loss to water, methane and N2O emissions associated with land use and management at the sites.
• The study identifies the need for additional research into the impact of management on drained organic soils under grasslands in Ireland, and also for an investigation of mitigation options to avoid emissions.
Developing Solutions • The research investigates identifies the options for mitigation of climate change in the agricultural land use sector related to
the management of drained organic soils.
EPA Research Report 141Carbon Loss from Drained Organic Soils under Grassland – CALISTO
Authors: Florence Renou-Wilson, David Wilson, Chris Barry, Bob Foy and Christoph Müller
EPA Research: McCumiskey House, Richiew, Clonskeagh, Dublin 14.
Phone: 01 268 0100 Twitter: @EPAResearchNews Email: [email protected]
EPA Research Webpageswww.epa.ie/researchandeducation/research/