carbon and nitrogen mineralization kinetics in soil previously amended with sewage sludge
TRANSCRIPT
Carbon and Nitrogen Mineralization Kinetics in SoilPreviously Amended with Sewage Sludge
Michael Boyle* and E. A. Paul
ABSTRACTMicrobial mineralization rates of organic carbon (C) and nitrogen
(N) were determined on the same sludge-amended and nonamendedsoil samples. The purpose of this integrated approach was to high-light the long-term dynamics of N release with C stabilization insludge-affected soil. Three application rates of digested municipalsludge, check, 45 Mg ha~' and 180 Mg ha~', were incorporated intofield plots annually for 8 years, with no addition during the subse-quent 3 years. Barley was grown on the site each spring of the 11years. In an 87-week laboratory incubation experiment conductedon soil samples collected 3 years after the last sludge addition, Nand C mineralization rates (*„, kc) increased with sludge applicationrate. Soil nitrogen mineralization potentials (N0) increased with sludgeapplication, unlike carbon mineralization potentials (C0) which didnot correlate with sludge application. The C/N ratio of the miner-alized organic matter decreased with sludge application rate. Threeyears after field incorporation of sludge, decomposition of the or-ganic fraction can be described as a set of two first-order rate re-actions. One fraction is characterized by a large stable element (high/V0, C0 and low &„, ke); the second fraction consists of a smaller labile
Michael Boyle, IPH, Harvard School of Public Health, Boston, MA02115; and E.A. Paul, Dept. of Crop & Soil Sciences, Michigan StateUniv., East Lansing, MI 48824. Contribution from the Dept. ofPlant & Soil Biology, Univ. of California, Berkeley. Received 20Jan. 1988. "Corresponding author.Published in Soil Sci. Soc. Am. J. 53:99-103 (1989).
portion which is characterized by low TV,,, C0 and high *„, kc values.The microbial biomass decreased to less than half of its originalamount after 20 weeks of incubation in all soil treatments.
THE FORMATION of soil organic matter (SOM) is areversible reaction. Additions of organic waste,
such as municipal sludge, has been proposed as onemethod of maintaining levels of organic matter in ag-ricultural as well as forested and disturbed lands. Dataon N mineralization in soils that had recent applica-tions of sludge (Epstein et al., 1978; Lindemann andCardinas, 1984), as well as studies on land previouslyamended with sludge (Stark and Clapp, 1980; Griffinand Laine, 1983), have contributed to the understand-ing of soil N behavior with sludge additions. Howeverthere remains a need for models that predict sludgeN release especially after the termination of applica-tion (Page et al., 1983). Because N turnover in soil ishighly dependent on C transformations and microbialbiomass (McGill et al., 1981), an integrated approachwas taken in this study. A N mineralization indicator(accumulation of NO3), a C decomposition parameter(CO2 evolution), and an estimate of microbial bio-
100 SOIL SCI. SOC. AM. J., VOL. 53, JANUARY-FEBRUARY 1989
mass (CHC13 fumigation-incubation) were used tocharacterize the labile organic fraction while also iden-tifying the interrelationship between N and C min-eralization kinetics.
MATERIALS AND METHODSThe 2.4 by 3.0-m sludge-amended field plots are located
on the Oxford Tract at the University of California, Berke-ley. The Tierra loam soil had an original CEC of 20.1 cmolkg"', a pH of 5.4, and soil organic C content range of 7 to10.2 g kg-'. The sludge, from the East Bay Municipal UtilityDistrict (Oakland, CA), had been anaerobically digested for20 d then vacuum-filtered. The final product was a wet-cakeslurry that contained 25% solids (Williams et al., 1984). Somechemical properties of the sludge are presented in Table 1.Three application rates of the sludge (check, 45 Mg sludgeha"1, 180 Mg sludge ha~') were incorporated into triplicateplots annually for 8 consecutive years with no additions forthe 3 subsequent years. A barley crop (Hordeum Vulgare L.)was grown on the site for each of the 11 years of the study.Laboratory Incubation Study
Surface soils (0-15 cm) were sampled from two of thetriplicated field plots, three years after the last sludge appli-cation. Field-moist soils (15 g oven-dried weight) were passedthrough a 4-mm sieve, then uniformly mixed with 15 g ofOttawa sand (0.59-0.42 mm) and placed in 0.05 L Bucknerfunnels. To remove any inorganic-N prior to incubation,half of the soil-sand samples were initially leached with 100mL of 0.1 M CaCl2 and 25 mL of N-free nutrient solution(0.002 M CaSO4, 0.002 M MgSO4, 0.0025 M 0.0025 MK2SO4) according to Stanford and Smith (1972); these sam-ples were then leached at week 3, 6, 11, 17, 21, 27, 38, 50,66, and 87 with CaQ2 and nutrient solution to determinethe N mineralization rates. The N mineralization methodof Stanford and Smith (1972) was modified by reducing theamount of leaching solution to 1/10 of that recommendedby the authors. This reduction in volume was intended toproduce a less drastic perturbation, provide a concentratedsolution for direct measurement and reduce the amount oforganic N leached from the samples (Smith et al., 1980).The other half of the soil-sand samples were not leached butwere maintained at constant weight throughout the 87-weekincubation period by the addition of water. These non-leached samples were used as controls to determine the effectof N removal on CO2 evolution.
Into each air-tight Mason jar (0.95 L) which was fittedwith a rubber septum, there were placed four 0.05-L Bucknerfunnels with glass filters and the soil-sand mixtures. Four
Table 1. A chemical analysis of theet al., 1980).
Oakland sludge (from Williams
Concentration, mg kg"'Sludge dry wtTotal NAmmoniaNitrate-NTotal PCaMgKNACdCrCuFeHgMnNiPbZn
330002000
50016400226006200
9001200
371470
60022100
14300180
10903910
jars were filled with 16 funnels from each plot (two plots persludge application rate), then incubated at 25 °C for 87 weeks.
Leachate AnalysisAt each sampling period the funnels were placed under
constant vacuum until the soil-sand mixture reached theweight that corresponded to -100 kPa water potential (60%water-holding capacity as determined by a hanging water-column method). Approximately 12.5 mL of the CaCl2 andnutrient solution was passed through the soil-sand mixture,and the leachate was frozen until the following order of anal-ysis was performed: (a) NH4-N; (b) NO2-N; and (c) soluble-C. Ammonium, NO2 plus NO3, and NO3 were determinedon a flow-through injection system (Am. Public Health As-soc., 1981). Total soluble-C was determined using a Dohr-mann DC 80 Carbon Analyzer which used a low tempera-ture, persulfate-UV oxidation procedure.
Soil AnalysisAll samples were triplicated and the results expressed on
an oven-dried basis (105 °C). Total C determinations wereperformed on soils using a dry combustion technique (Nel-son and Sommers, 1982) and the regular Kjeldahl methodwas performed for total soil N (Bremner and Mulvaney,1982).
CO2 EvolutionGas samples were obtained from the closed incubation
jars by the use of a 1-mL syringe and then measured for CO2concentration on a Varian Aerograph Model 920 gas chro-matograph (GC). The jars were then opened and allowed toequilibrate with the atmosphere. The frequency of samplingranged from daily to weekly to insure that the CO2 concen-tration did not exceed 0.8 mol m~3.
Data AnalysisA nonlinear least square (NLLS) regression analysis was
used to calculate N0, C0, and associated rate constants fromthe 87-week data. The NLLS method was used to reducethe error imposed by the logarithmic transformation of lowvalue mineralization data (Smith et al., 1980).
Microbial Biomass C DeterminationsBiomass-C was measured in these soil by the chloroform
fumigation incubation method of Jenkinson and Powlson(1976). At week 0, 3, 6, 21, 38, 50, and 87 Buckner funnelscontaining the soil-sand mixture were removed from theincubation vessels (four funnels per sludge treatment) andtransferred to glass beakers for fumigation with distilledCHC13. The 10-day flush of CO2 after fumigation was mea-sured on a gas chromatograph. Soil samples were not in-oculated after fumigation nor were any controls subtractedfrom the CO2 evolution data (Voroney and Paul, 1984). Thetransfer of the soil-sand samples from the funnels to glassbeakers was a precaution to prevent chloroform adsorbedon the plastic walls of the funnel from suppressing microbialactivity and the flush of CO2 after fumigation.
RESULTS AND DISCUSSIONNitrogen Mineralization
The N mineralization rate, under a particular set oflaboratory conditions, is proportional to the quantityof mineralizable substrate in soil (Stanford and Smith,1972). Nitrogen mineralization potentials (N0) and Nmineralization rate coefficients (A^) were calculated foreach treatment (Table 2). These N0 values determined
BOYLE & PAUL: CARBON AND NITROGEN MINERALIZATION KINETICS IN SOIL AMENDED WITH SEWAGE SLUDGE 101
Table 2. Soil N and C mineralization potentials (N0, C0) and rateconstants (ka, kj.
Table 3. The effect of multiple leaching on total soil carbon min-eralization after the 87-week incubation.
Check 45 Mgha" ' 180 Mgha-
Na (mg kg"')SE*kn (week'1)C 0 (mgkg "')SEk, (week"')yV,,/N,OIO| (%)C0/C,OTa, (%)CJN,,
19120.010
10010213
0.00516.667.652.4
42730.013
11 983910.007
21.155.228.1
579110.020
11 933156
0.01117.636.220.6
Sludge-soil mineralization data minus controlyvo(mgkg-')SEfcn(week-')C0(mgkg-')SEk, (week'1)
26620.013
55733210.005
458110.020
4723700.019
* SE = standard error of the mean.
by a NLLS analysis compared well with those reportedfor soils collected 2 and 4 years after sludge applica-tion (Stark and Clapp, 1980). The kn values increasedwith sludge application rate but were less than thosereported by Stark and Clapp (1980), Lindemann andCardinas (1984), or Griffin and Laine (1983) becausethe incubation temperature was kept 10 °C lower.
The increase in kn values with an increase in sludgeapplication rate was not due to a larger percentage ofreadily mineralizable N remaining after several yearsof field decomposition. Although N0 values werehigher, the percentage of/V0/Ntotal did not consistentlyincrease with rate of sludge application (Table 2). Starkand Clapp (1980) reported similar N0/Nlotai values forsoils after 2 years of repeated sludge application. Inanother study by these same authors, soils which werecollected 4 years after the last sludge application hada No/Ntotai value 12.1% vs. 19.5% for the control. It isassumed that after the termination of the sludge ap-plication NO, km and the percent of labile-N dividedby total-N will decrease with increasing age of the site.Results from our experiment indicate that 3 years af-ter the last sludge addition there still remains a sub-stantial labile-N pool in the sludge-treated soils.
Carbon MineralizationPeriodic leaching of available N only slightly in-
creased the rate of organic-C mineralization in the highsludge application rate as measured by CO2 evolution(Table 3). The results suggest that available-C and notN was probably limiting in the sludge-treated and thenontreated soils.
In order to quantify the C associated with the labile-N fraction (yV0), C mineralization potentials (C0) werealso calculated by the NLLS technique. Soluble-Cleached from the soil represented <3% of the Cevolved as CO2 and was not included in computingC0. The C0, unlike N0, did not correlate with sludgeadditions. In fact, that portion of total soil C that com-prised C0 decreased with sludge application rate (Ta-ble 2). Although speculative, these results suggest thatthe total soil C left after 3 years of field decompositionwas more recalcitrant than native soil organic-C. Thecharacteristics of this C pool is represented by thesludge application data minus the controls in Table 2.
Treatment Leached Not leached
CheckSEf45 Mgha-'SE180 Mgha-1
SE
mg CO2-C kg
3615.0547.9
5822.5437.8
8014.0506.2
3753.5338.1
5613.5328.5
7009.5453.0
fSE = Standard error of the mean.
Stabilization is a term often used to describe soilorganic matter in toto, but SOM is composed of manycomponents, each varying in size, rate of decompo-sition, and proportion to the total organic pool. Al-though the high sludge application rate doubled therate constant (kc), the percentage of mineralizable-Cto soil organic-C decreased (C0/Ctota|). The concept oforganic matter stabilization should involve at leastthree levels of evaluation: the decay rate constant, theabsolute size of the mineralizable pool, and the rela-tive size of the "active" fraction.
The Association Between C and N MineralizationThe pool sizes and decay constants in Table 2 sug-
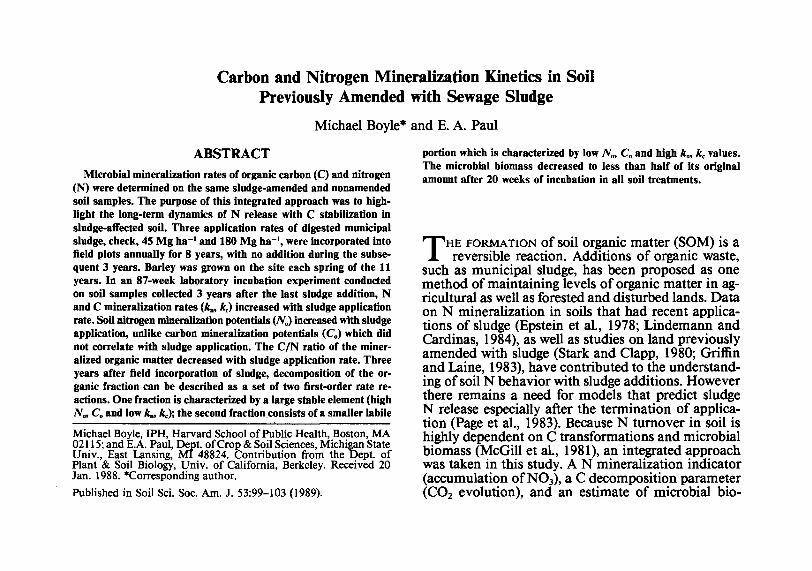
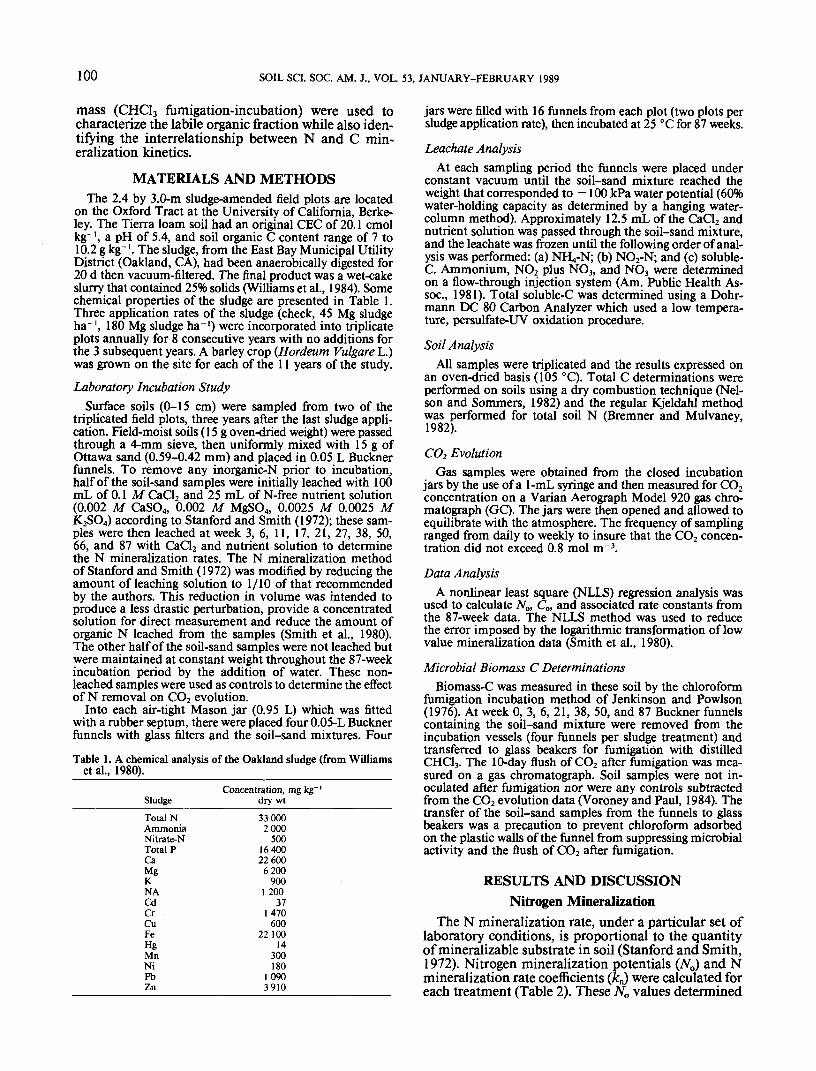
gest that sludge stabilization within soil was more ex-tensive for sludge-C than for sludge-N. These two es-sential parameters, depicted in Fig. 1 as cumulativemineralized C and N, increased with sludge applica-tion rate. The similar shape of the log. curves indicatethat the C/N ratio did not fluctuate over the 87-weekincubation. The relationship between the amount ofN mineralized per CO2-evolved was constant for eachapplication rate and increased with sludge application(Fig. 2). Possible factors or combination of factors forthe observed decomposition characteristics are:
1. the C/N ratio of microbial byproducts fromsludge decomposition was lower than that of thenative soil organic fraction;
2. the C stabilized in sludge was primarily derivedfrom anaerobically digested microbial cell wallswhich may be more recalcitrant than lignin-de-rived SOM;
3. components within the sludge could be inhibit-ing mineralization of C more so than N; and/or
4. the labile sludge-N remained in the soil activefraction after the stabilization of sludge-C due tothe excess incorporation of N into microbial bio-mass without a concurrent increase in biomass-C.
Curve SplittingAs seen in Fig. 1, a single first-order function would
not accurately describe the N or C mineralization be-havior from initiation to completion of the incuba-tion. More than one first-order equation is needed toreflect the heterogeneity of substrate quality. The useof a combination of first-order equations has been em-ployed by Lindemann and Cardinas (1984) to describesludge decomposition kinetics. To section the min-eralization curves into two unique pools with theirown rate constants, a curve-splitting technique wasused (Paul and Voroney, 1980). The reason for seg-
102 SOIL SCI. SOC. AM. J., VOL. 53, JANUARY-FEBRUARY 1989
MineralizationCarbon and Nitrogen
20 8040 60Weeks
Fig. 1. The effect of sludge application rate on soil C and N min-eralization.
C and N Mineralization
600
= 500CO7 400O)•* 300
|> 200
100
D Check45 Mg ho-'
=0.0680.994
slope=0.054V2 = 0.996
2000 4000 6000 8000mg C kg"1 Soil
Fig. 2. The effect of sludge application rate on the amount of soilN mineralized as NO3 per unit soil C evolved as CO2.
menting the mineralization curves at 11 weeks can beseen in Fig. 1. The correlation coefficient (r) valuesfrom linear regression analysis produces the largestcombined r value for all curves when segmented at 11weeks, except for N with the highest sludge applica-tion. The split that gave the highest combined r valuefor this treatment was at the next sampling date, 17weeks, suggesting that the high-sludge application pro-longed the rapid N mineralization portion of the curve.
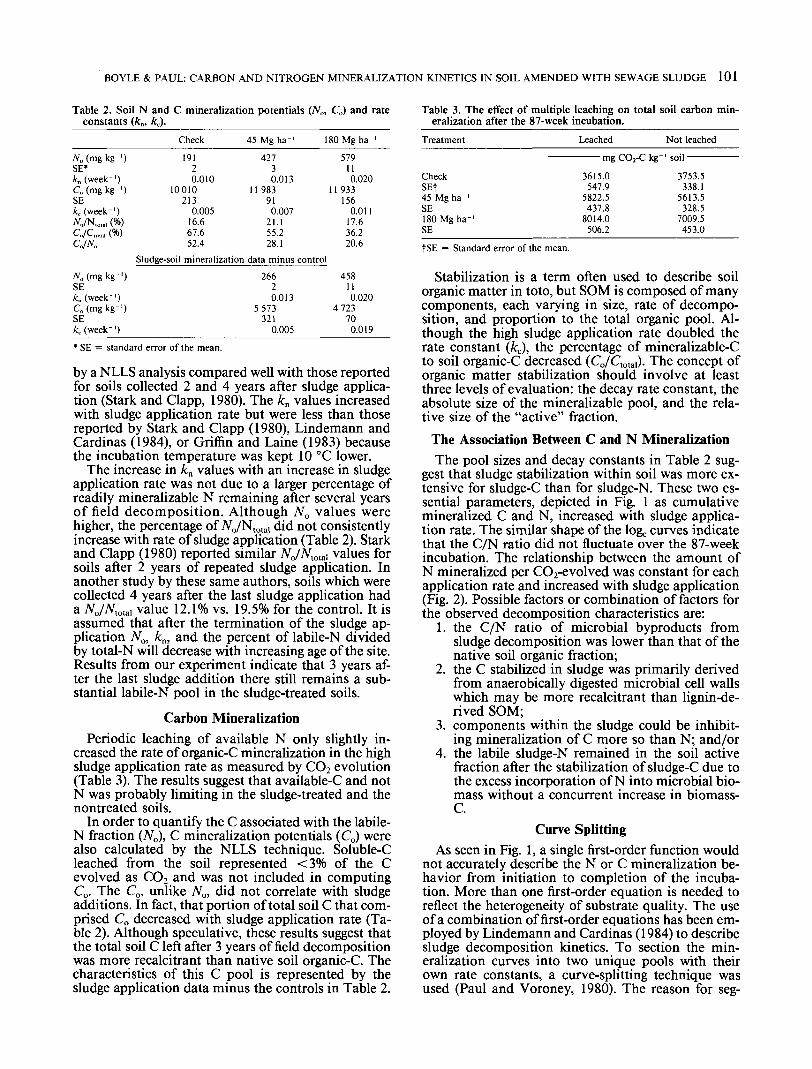
To separate out the first 11-week pool sizes of bothC and N, the 11-week mineralization data were sub-tracted out from the original N0 and C0 estimates. Poolsizes were recalculated by NLLS analysis which gavelong-term pool sizes for the period between week 11and week 87 [N0{n_g7), C0(1,_87)]. These long-term poolsizes were then subtracted from the original C0 andN0 estimates to get the short-term pools (first 11 weeks).To determine the short-term rate constants [fcnco-m or£cjo-n)]» a linear regression was performed on the logeof three values which represent the difference of themineralized N or C accumulated in the first 11 weeks[Ao(o-in, Qo-m from the newly calculated A^O-ID andCo(o-ii)- The rate constant fcn(o-n) for the check soil isrepresented by the slope of the bottom curve in Fig.3. In the same graph, the y intercept of the top linerepresents the loge of the long-term pool size [A^n-87)] for the check soil. In Table 4, the original pool
5.4
5.0
-4.6
~ 7° 4.2
i ™3.8
3.0
2.6
N MineralizationCheck N
0(11-87)
0(0-11) -N(0-11)
20 40Weeks
60 80
Fig. 3. The use of curve-splitting techniques to segment the checkN mineralization data into two distinct rate functions with ap-propriate pool sizes [AVuo ̂ n-s?)] and rate constants
sizes and rate constants are represented as a two com-ponents system for each treatment.
Microbial BiomassSoil microflora contain substantial quantities of C
and N, which upon death are readily mineralized bythe surviving microorganisms (Jenkinson and Fowl-son, 1976; Anderson and Domsch, 1980). In a fieldstudy, Lynch and Panting (1980) observed a biomasssize fluctuation in an agricultural soil that representedfrom 1.1 to 2.7% of the total soil C over the course of1 year. Robertson et al. (1988) attributed 20% of min-eralized C to microbial biomass decline in the first 12weeks of soil incubation. The size of the soil microbialbiomass as effected by sludge application over thecourse of the 87-week incubation is represented in Ta-ble 5. The biomass size was initially higher in thesludge-amended soil than the checks but did not con-sistently increase with application rate. The averagedecline in the biomass-C decreased to half of its orig-inal pool size after 21 weeks.
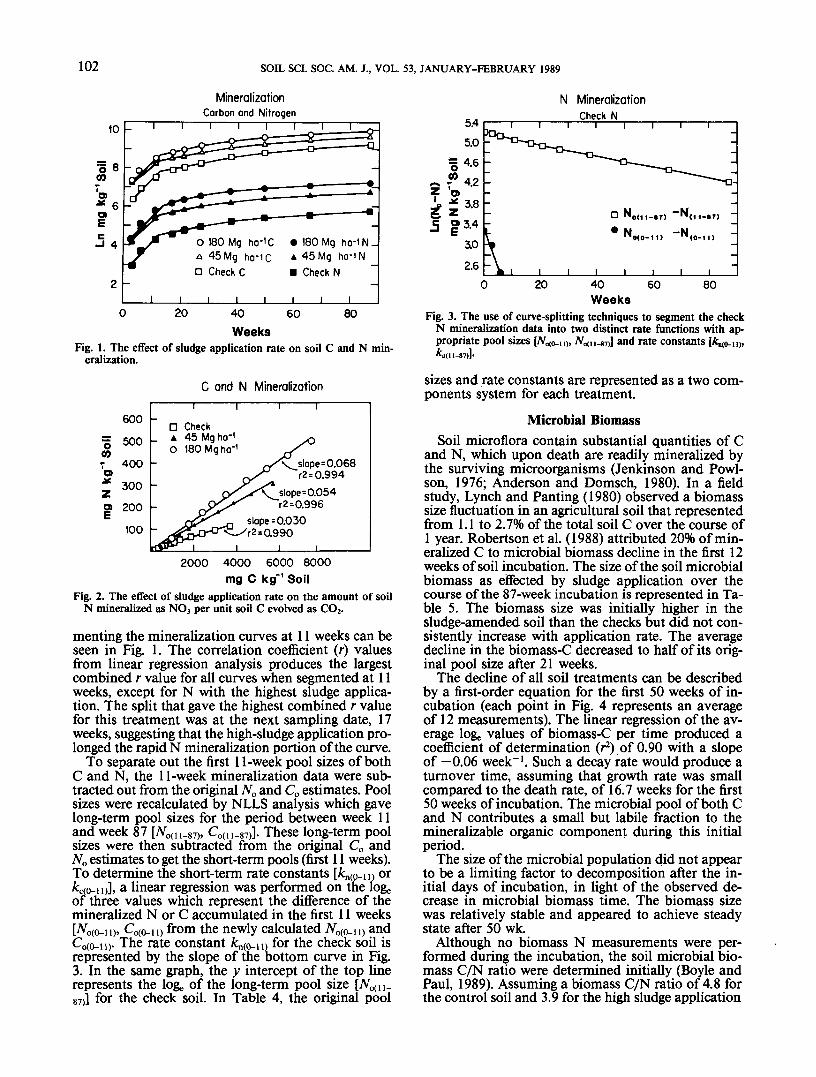
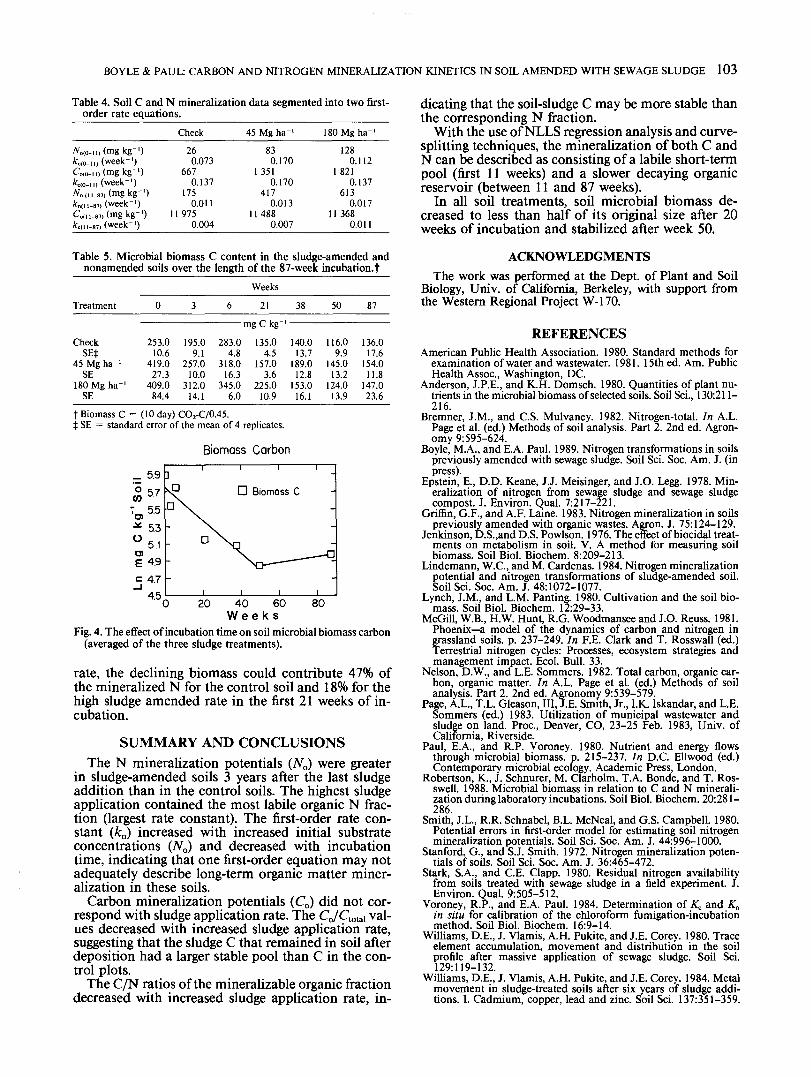
The decline of all soil treatments can be describedby a first-order equation for the first 50 weeks of in-cubation (each point in Fig. 4 represents an averageof 12 measurements). The linear regression of the av-erage loge values of biomass-C per time produced acoefficient of determination (r2) of 0.90 with a slopeof —0.06 week"1. Such a decay rate would produce aturnover time, assuming that growth rate was smallcompared to the death rate, of 16.7 weeks for the first50 weeks of incubation. The microbial pool of both Cand N contributes a small but labile fraction to themineralizable organic component during this initialperiod.
The size of the microbial population did not appearto be a limiting factor to decomposition after the in-itial days of incubation, in light of the observed de-crease in microbial biomass time. The biomass sizewas relatively stable and appeared to achieve steadystate after 50 wk.
Although no biomass N measurements were per-formed during the incubation, the soil microbial bio-mass C/N ratio were determined initially (Boyle andPaul, 1989). Assuming a biomass C/N ratio of 4.8 forthe control soil and 3.9 for the high sludge application
BOYLE & PAUL: CARBON AND NITROGEN MINERALIZATION KINETICS IN SOIL AMENDED WITH SEWAGE SLUDGE 103
Table 4. Soil C and N mineralization data segmented into two first-order rate equations.
Check 45 Mg ha- ISOMgha-AWii) (mg kg-')fco(o-ii)(week-')Co(o-n)(mg kg-')*c(o-n> (week-1)#„ (M-s7> (mg kg'1)£„(, i-87) (week-')Coin-sTitmgkg-')*cu i-87) (week-')
260.073
6670.137
1750.011
119750.004
830.170
1 3510.170
4170.013
11 4880.007
1280.112
1 8210.137
6130.017
113680.011
dicating that the soil-sludge C may be more stable thanthe corresponding N fraction.
With the use of NLLS regression analysis and curve-splitting techniques, the mineralization of both C andN can be described as consisting of a labile short-termpool (first 11 weeks) and a slower decaying organicreservoir (between 11 and 87 weeks).
In all soil treatments, soil microbial biomass de-creased to less than half of its original size after 20weeks of incubation and stabilized after week 50.
Table 5. Microbial biomass C content in the sludge-amended andnonamended soils over the length of the 87-week incubation.t
Weeks
Treatment 21 38 50 87
————————————— mg C kg-' ————————————
Check 253.0 195.0 283.0 135.0 140.0 116.0 136.0SEt 10.6 9.1 4.8 4.5 13.7 9.9 17.6
45Mgha- ' 419.0 257.0 318.0 157.0 189.0 145.0 154.0SE 27.3 10.0 16.3 3.6 12.8 13.2 11.8
ISOMgha- ' 409.0 312.0 345.0 225.0 153.0 124.0 147.0SE_______84.4 14.1 6.0 10.9 16.1 13.9 23.6
f Biomass C = (10 day) CO2-C/0.45.| SE = standard error of the mean of 4 replicates.
Biomass Carbon
- 59
557
"a,55
-* 53°5.1o>E 4.9c 4.7
4.5
D Biomass C
D
20 8040 60W e e k s
Fig. 4. The effect of incubation time on soil microbial biomass carbon(averaged of the three sludge treatments).
rate, the declining biomass could contribute 47% ofthe mineralized N for the control soil and 18% for thehigh sludge amended rate in the first 21 weeks of in-cubation.
SUMMARY AND CONCLUSIONSThe N mineralization potentials (Wo) were greater
in sludge-amended soils 3 years after the last sludgeaddition than in the control soils. The highest sludgeapplication contained the most labile organic N frac-tion (largest rate constant). The first-order rate con-stant (kn) increased with increased initial substrateconcentrations (W0) and decreased with incubationtime, indicating that one first-order equation may notadequately describe long-term organic matter miner-alization in these soils.
Carbon mineralization potentials (C0) did not cor-respond with sludge application rate. The C0/Ctotal val-ues decreased with increased sludge application rate,suggesting that the sludge C that remained in soil afterdeposition had a larger stable pool than C in the con-trol plots.
The C/N ratios of the mineralizable organic fractiondecreased with increased sludge application rate, in-
ACKNOWLEDGMENTS
The work was performed at the Dept. of Plant and SoilBiology, Univ. of California, Berkeley, with support fromthe Western Regional Project W-170.