capital market presentation q1 2020 - daimler › documents › investors › ... · 2020-05-25 ·...
TRANSCRIPT
Capital Market PresentationQ1 2020
DAIMLER AG FIXED INCOME PRESENTATION Q1 2020
Daimler AG
I.Daimler AG 2019
I.DAIMLER AG Q1-2020
Fixed Income Presentation Q1 2020 / April 29, 2020 2
Daimler AG /
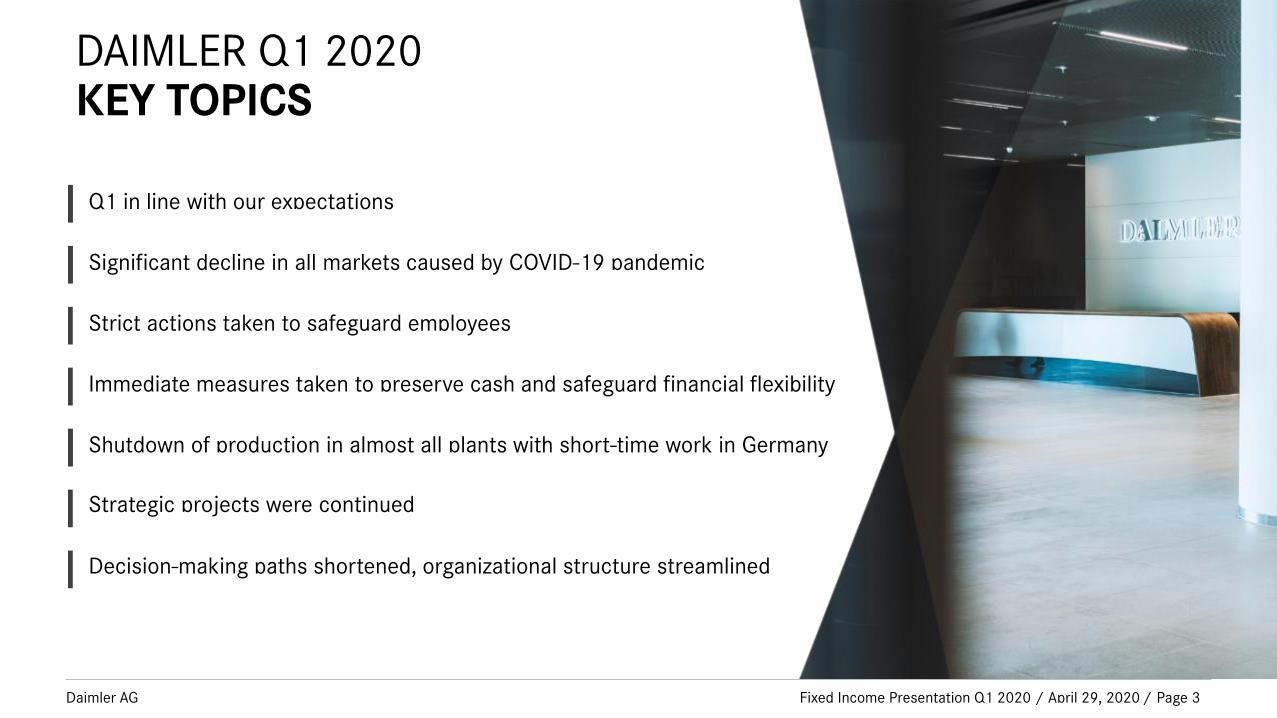
Significant decline in all markets caused by COVID-19 pandemic
DAIMLER Q1 2020KEY TOPICS
Fixed Income Presentation Q1 2020 / April 29, 2020 Page 3
Shutdown of production in almost all plants with short-time work in Germany
Strict actions taken to safeguard employees
Strategic projects were continued
Decision-making paths shortened, organizational structure streamlined
Q1 in line with our expectations
Immediate measures taken to preserve cash and safeguard financial flexibility
Daimler AG /
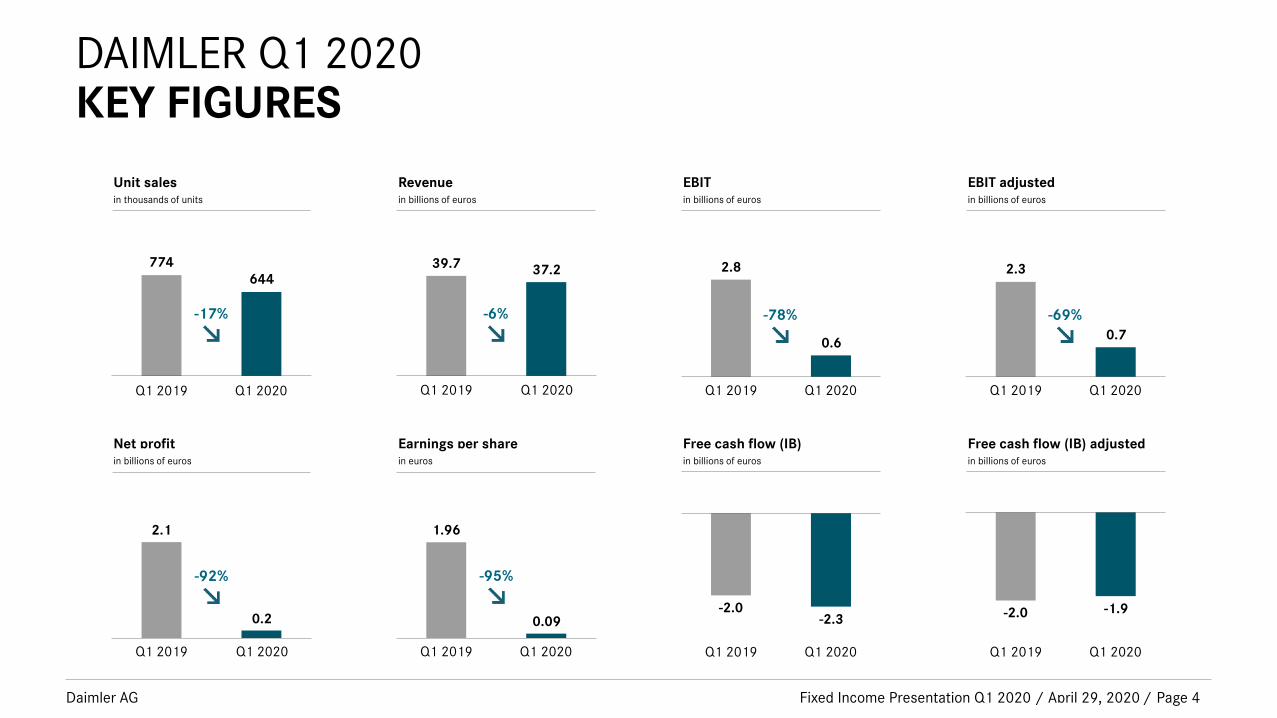
DAIMLER Q1 2020KEY FIGURES
Fixed Income Presentation Q1 2020 / April 29, 2020
Unit salesin thousands of units
Q1 2019 Q1 2020
774644
-17%
Revenuein billions of euros
Q1 2019 Q1 2020
39.7 37.2
-6%
Free cash flow (IB) adjustedin billions of euros
Q1 2019 Q1 2020
-2.0 -1.9
EBIT adjustedin billions of euros
Q1 2019 Q1 2020
2.3
0.7
-69%
Net profitin billions of euros
Q1 2019 Q1 2020
2.1
0.2
-92%
Earnings per sharein euros
Q1 2019 Q1 2020
1.96
0.09
-95%
Page 4
Free cash flow (IB)in billions of euros
Q1 2019 Q1 2020
-2.0-2.3
EBITin billions of euros
Q1 2019 Q1 2020
2.8
0.6
-78%
Daimler AG
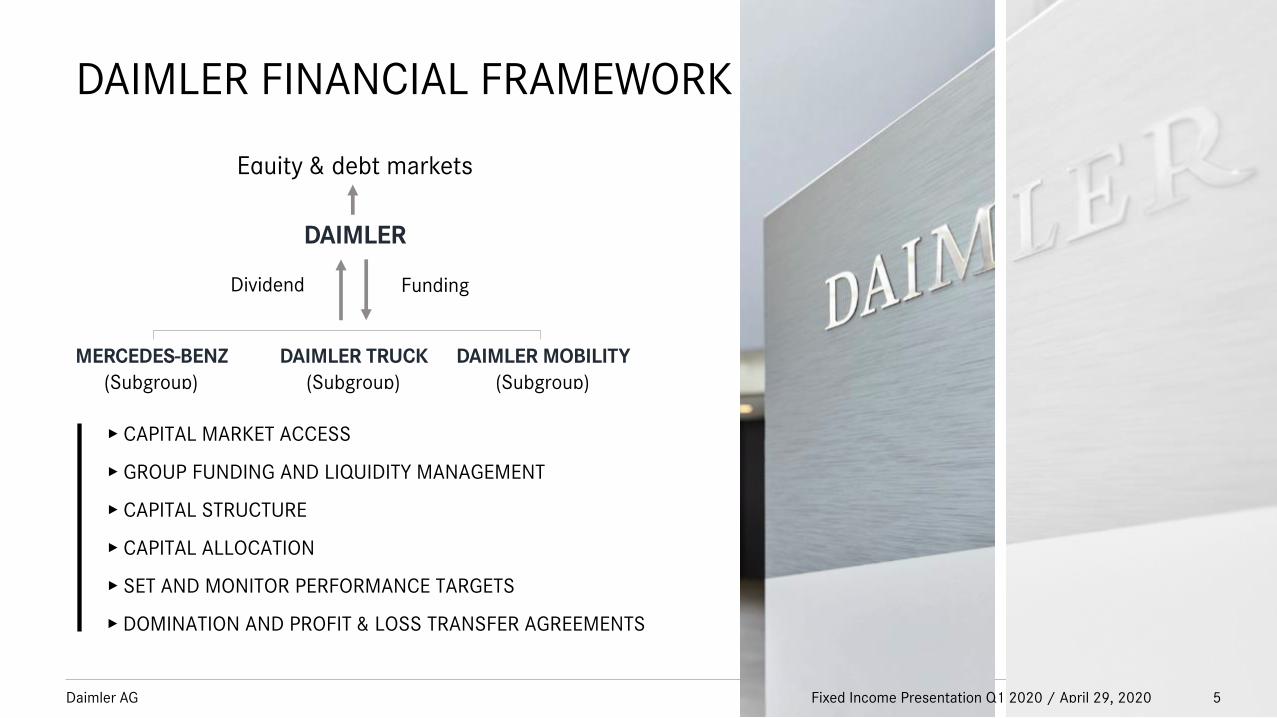
DAIMLER FINANCIAL FRAMEWORK
▸ DOMINATION AND PROFIT & LOSS TRANSFER AGREEMENTS
▸ GROUP FUNDING AND LIQUIDITY MANAGEMENT
▸ CAPITAL MARKET ACCESS
▸ CAPITAL ALLOCATION
▸ SET AND MONITOR PERFORMANCE TARGETS
▸ CAPITAL STRUCTURE
Equity & debt markets
DAIMLER
DAIMLER TRUCK(Subgroup)
MERCEDES-BENZ(Subgroup)
DAIMLER MOBILITY(Subgroup)
Dividend Funding
5Fixed Income Presentation Q1 2020 / April 29, 2020
Daimler AG /
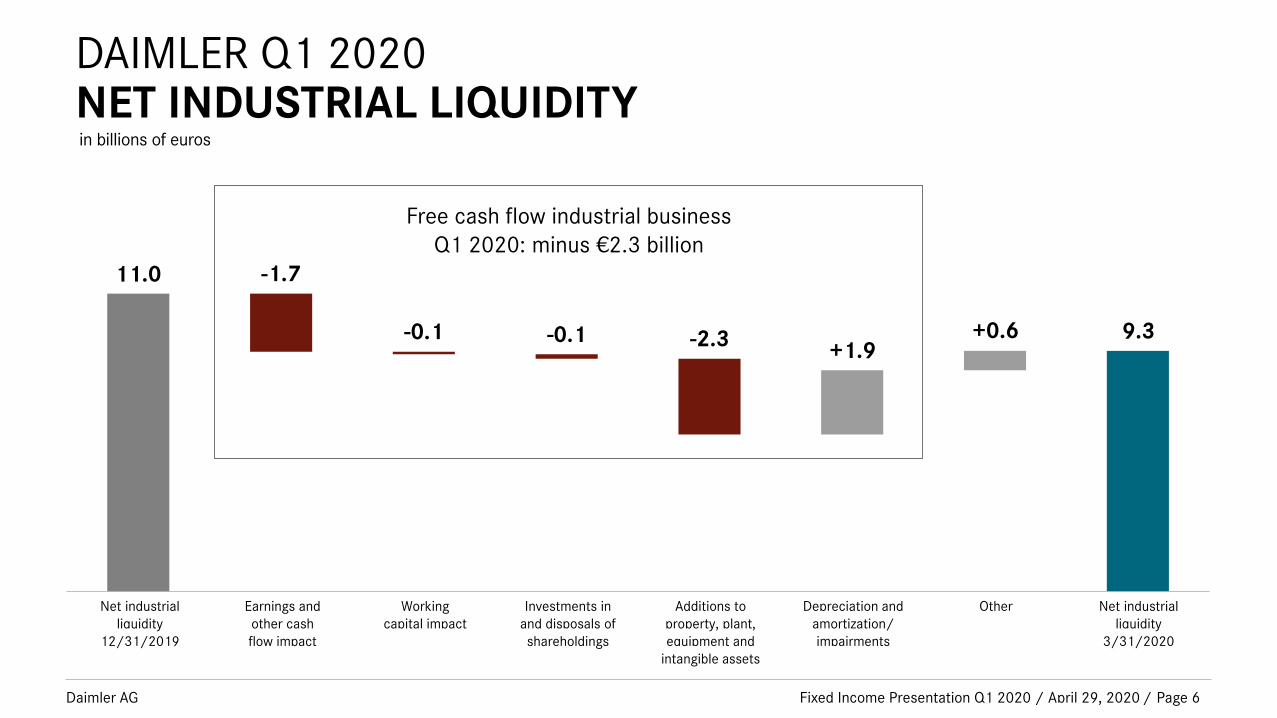
DAIMLER Q1 2020NET INDUSTRIAL LIQUIDITY
Fixed Income Presentation Q1 2020 / April 29, 2020
Free cash flow industrial businessQ1 2020: minus €2.3 billion
Net industrialliquidity
12/31/2019
Workingcapital impact
Other Net industrialliquidity
3/31/2020
-0.1 9.3+0.6
11.0 -1.7
+1.9
Investments in and disposals of shareholdings
-2.3
Additions to property, plant, equipment and
intangible assets
-0.1
Depreciation and amortization/ impairments
Earnings and other cashflow impact
Page 6
in billions of euros
Daimler AG
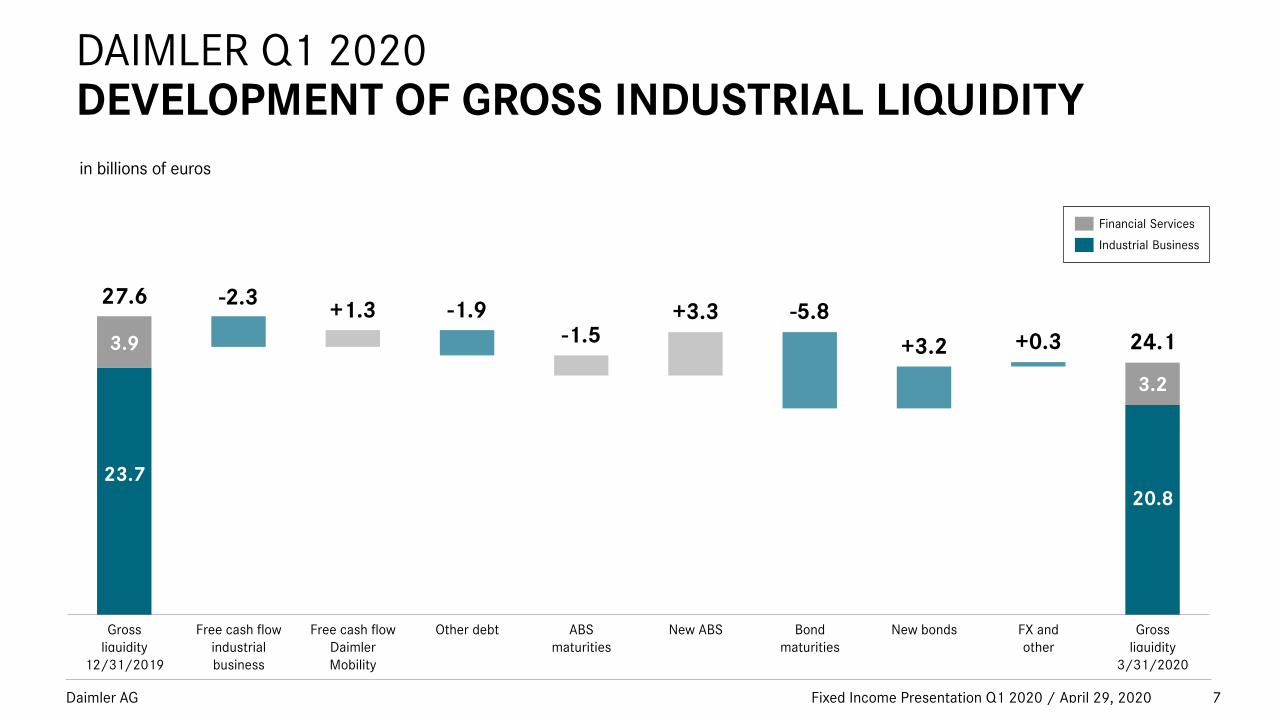
DAIMLER Q1 2020 DEVELOPMENT OF GROSS INDUSTRIAL LIQUIDITY
7
+1.3
24.1+0.3
27.6 -2.3
+3.2
-5.8-1.9
in billions of euros
Grossliquidity
12/31/2019
Free cash flow DaimlerMobility
FX andother
Grossliquidity
3/31/2020
New ABS Bondmaturities
New bondsFree cash flow industrial business
ABSmaturities
Other debt
Financial Services
Industrial Business
-1.5+3.3
3.9
23.7
3.2
20.8
Fixed Income Presentation Q1 2020 / April 29, 2020
Daimler AG /
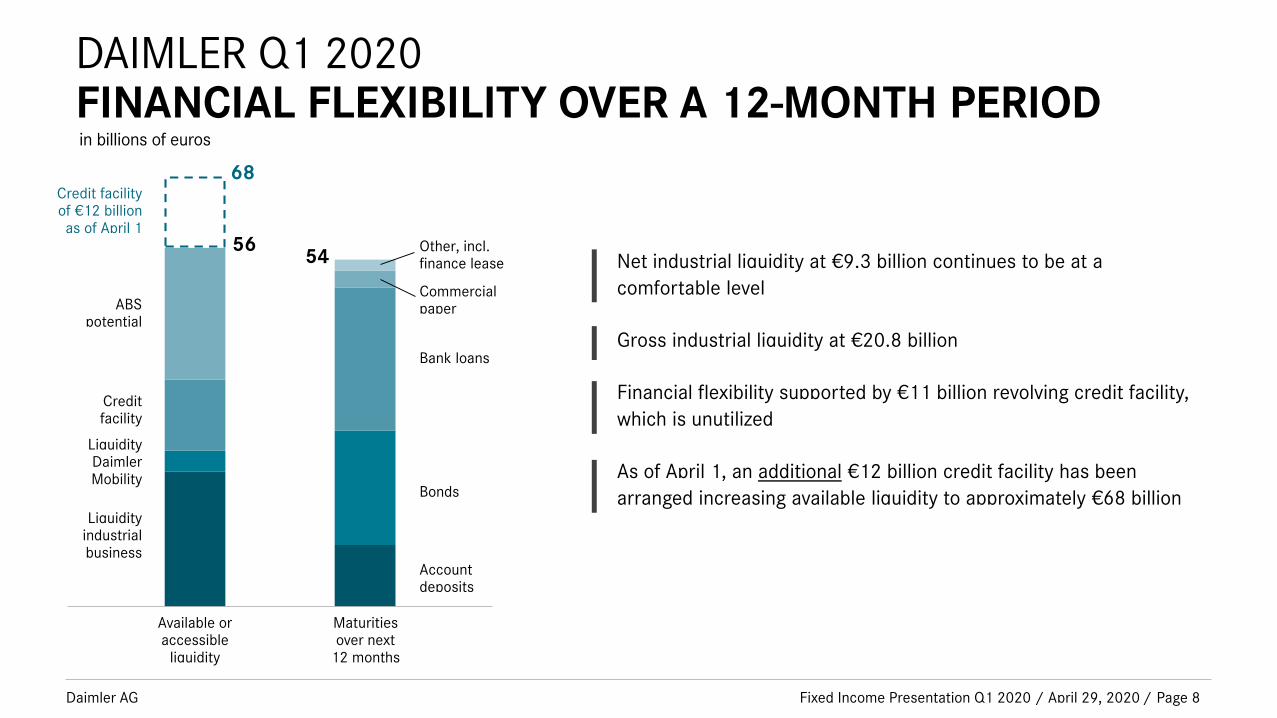
DAIMLER Q1 2020FINANCIAL FLEXIBILITY OVER A 12-MONTH PERIOD
Fixed Income Presentation Q1 2020 / April 29, 2020
Available oraccessible
liquidity
5654
Maturitiesover next
12 months
Other, incl.finance lease
Bank loans
Bonds
Accountdeposits
Commercialpaper
Creditfacility
LiquidityDaimlerMobility
Liquidityindustrialbusiness
ABSpotential
Page 8
in billions of euros
68Credit facilityof €12 billionas of April 1
Gross industrial liquidity at €20.8 billion
As of April 1, an additional €12 billion credit facility has been
arranged increasing available liquidity to approximately €68 billion
Net industrial liquidity at €9.3 billion continues to be at a
comfortable level
Financial flexibility supported by €11 billion revolving credit facility,
which is unutilized
Daimler AG /
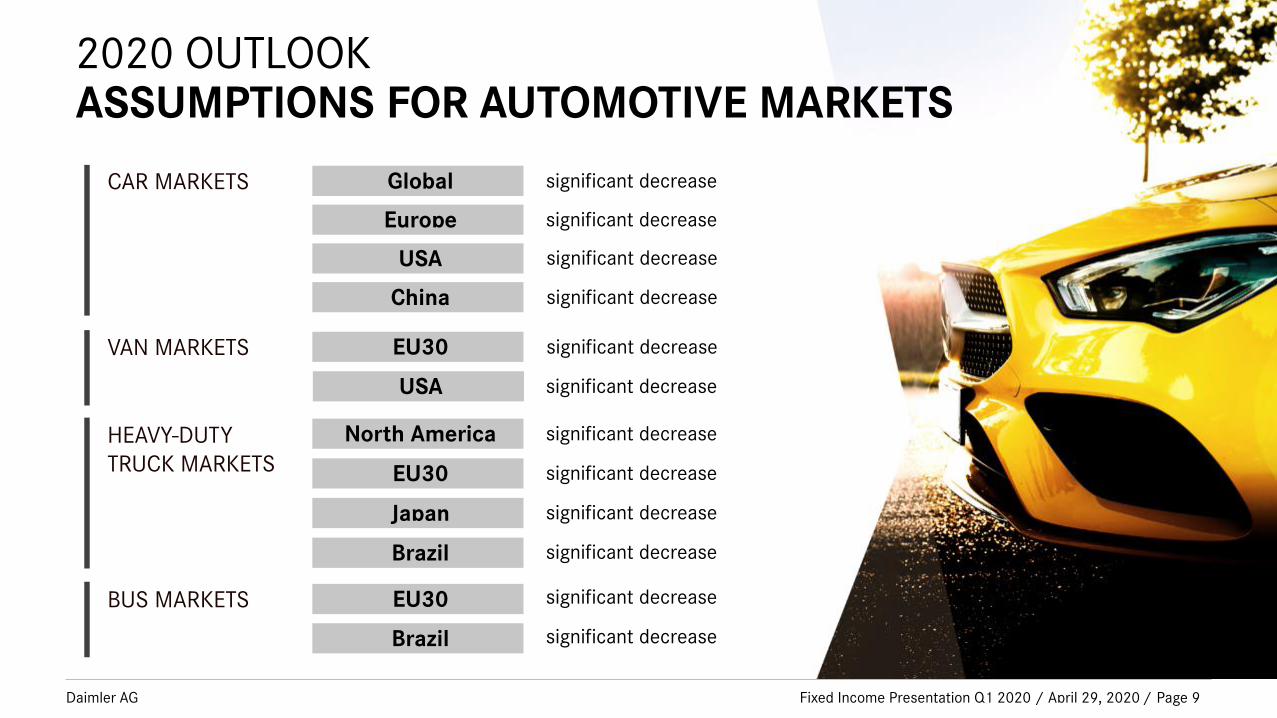
2020 OUTLOOKASSUMPTIONS FOR AUTOMOTIVE MARKETS
Fixed Income Presentation Q1 2020 / April 29, 2020 Page 9
Global
Europe
EU30
Brazil
USA
China
significant decrease
significant decrease
significant decrease
significant decrease
significant decrease
significant decrease
North America
EU30
Japan
Brazil
significant decrease
significant decrease
significant decrease
significant decrease
EU30
USA significant decrease
significant decrease
CAR MARKETS
VAN MARKETS
HEAVY-DUTY TRUCK MARKETS
BUS MARKETS

Daimler AG /
2020 OUTLOOKGUIDANCE
Fixed Income Presentation Q1 2020 / April 29, 2020 Page 10
Daimler Group Below the prior-year level
Industrial business Below the prior-year levelFREE CASH FLOW
Daimler Mobility Below the prior-year levelNEW BUSINESS
ROE ADJUSTED Daimler Mobility Below the prior-year level
Daimler Group Below the prior-year levelGROUP SALES
Daimler Group Below the prior-year levelREVENUE
Daimler Group Below the prior-year levelEBIT
Daimler Group Below the prior-year level
INVESTMENT IN PP&E
R&D EXPENDITURE
Daimler AG /Fixed Income Presentation Q1 2020 / April 29, 2020 Page 11
DAIMLER Q1 2020LOOKING FORWARD
Fully committed to transformation plans
Fully committed to CO2 plans and electrification plans
Comprehensive set of countermeasures implemented to counteract top-line decline
Ready to ramp-up and capture opportunities

Daimler AG
I.Daimler AG 2019
II.DIVISIONAL REVIEW
Q1-2020
Fixed Income Presentation Q1 2020 / April 29, 2020 12
Daimler AG /Fixed Income Presentation Q1 2020 / April 29, 2020
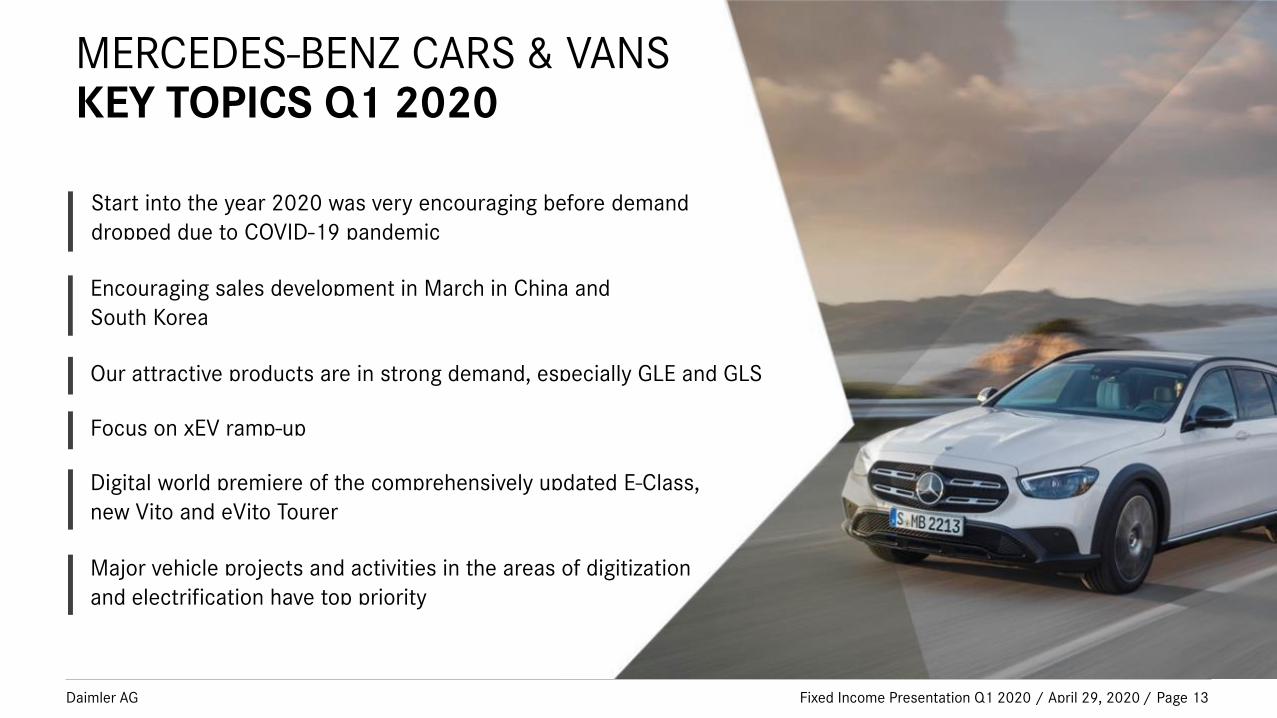
MERCEDES-BENZ CARS & VANSKEY TOPICS Q1 2020
Page 13
Our attractive products are in strong demand, especially GLE and GLS
Start into the year 2020 was very encouraging before demand dropped due to COVID-19 pandemic
Digital world premiere of the comprehensively updated E-Class, new Vito and eVito Tourer
Major vehicle projects and activities in the areas of digitization and electrification have top priority
Encouraging sales development in March in China and South Korea
Focus on xEV ramp-up
Daimler AG /Fixed Income Presentation Q1 2020 / April 29, 2020
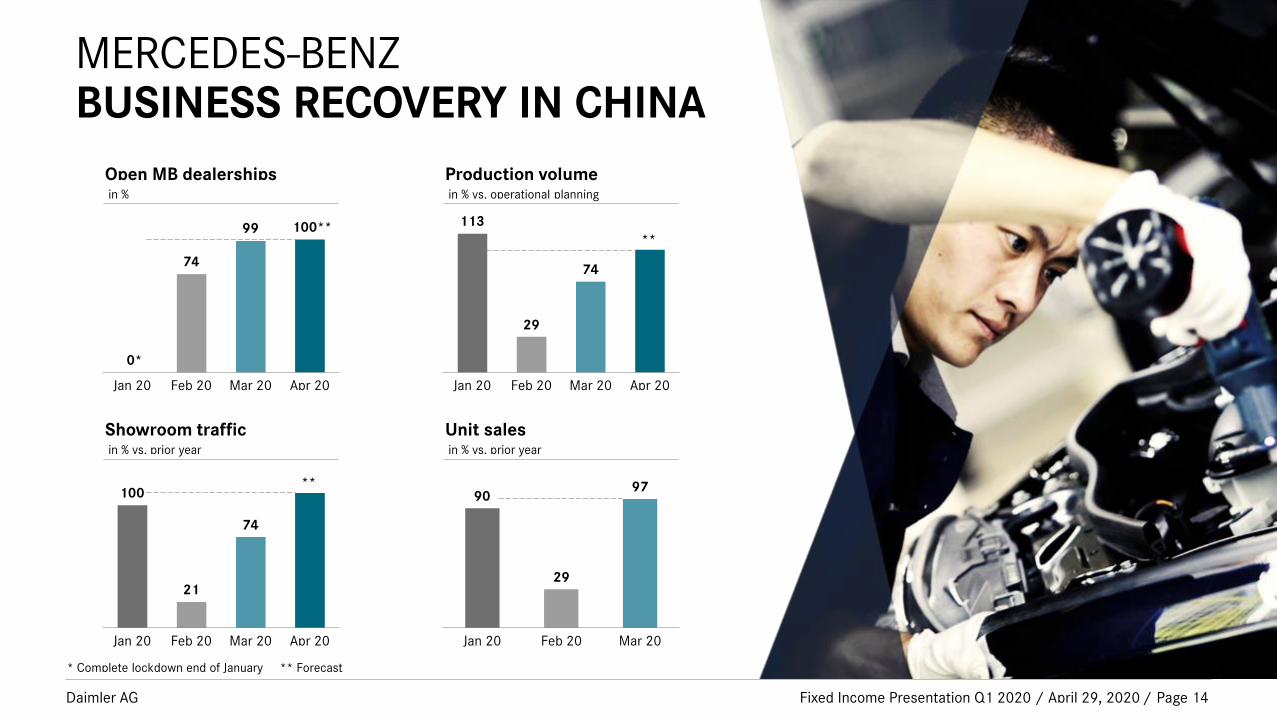
MERCEDES-BENZBUSINESS RECOVERY IN CHINA
Page 14
* Complete lockdown end of January ** Forecast
Open MB dealershipsin %
Jan 20 Feb 20
0*
100**
Mar 20 Apr 20
99
74
Showroom trafficin % vs. prior year
Jan 20 Feb 20
100**
Mar 20 Apr 20
74
21
Unit salesin % vs. prior year
Jan 20 Feb 20
90
Mar 20
97
29
Production volumein % vs. operational planning
Jan 20 Feb 20
113**
Mar 20 Apr 20
74
29
Daimler AG /Fixed Income Presentation Q1 2020 / April 29, 2020
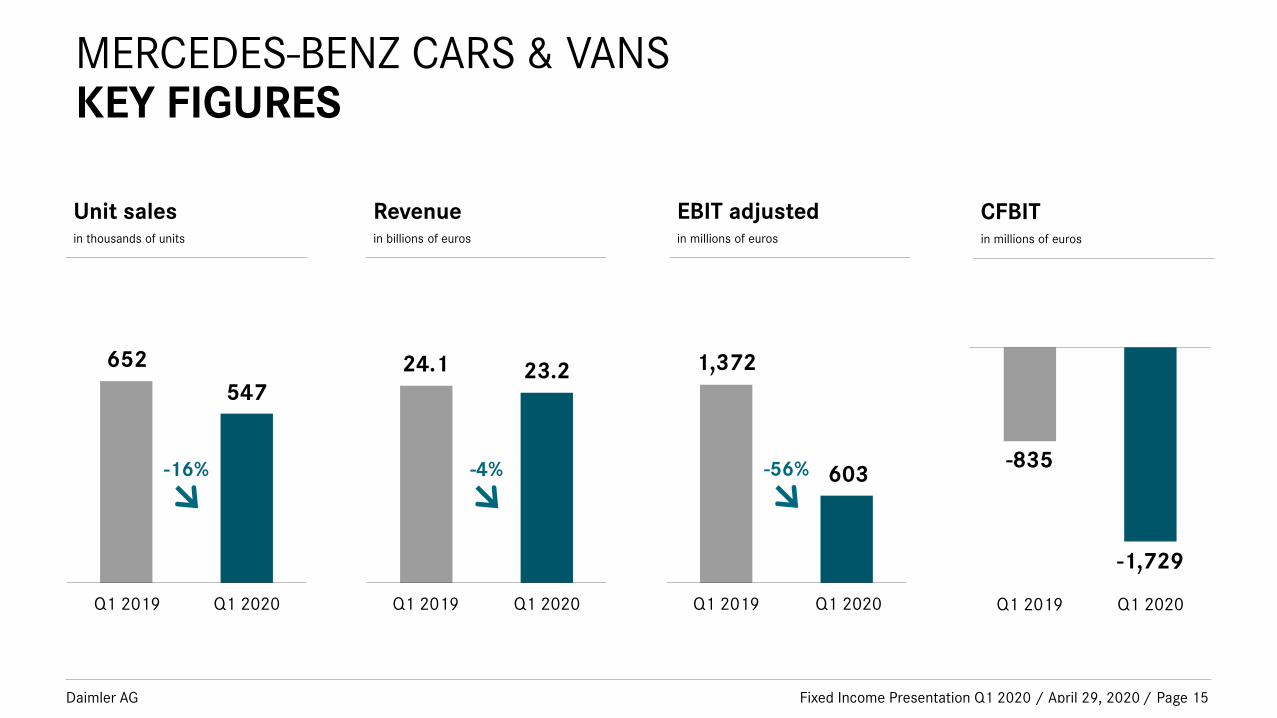
MERCEDES-BENZ CARS & VANSKEY FIGURES
Unit sales in thousands of units
Q1 2019 Q1 2020
652
547
-16%
Revenuein billions of euros
Q1 2019 Q1 2020
24.1 23.2
-4%
EBIT adjustedin millions of euros
Q1 2019 Q1 2020
1,372
603-56%
Page 15
CFBITin millions of euros
Q1 2019 Q1 2020
-835
-1,729
Daimler AG /
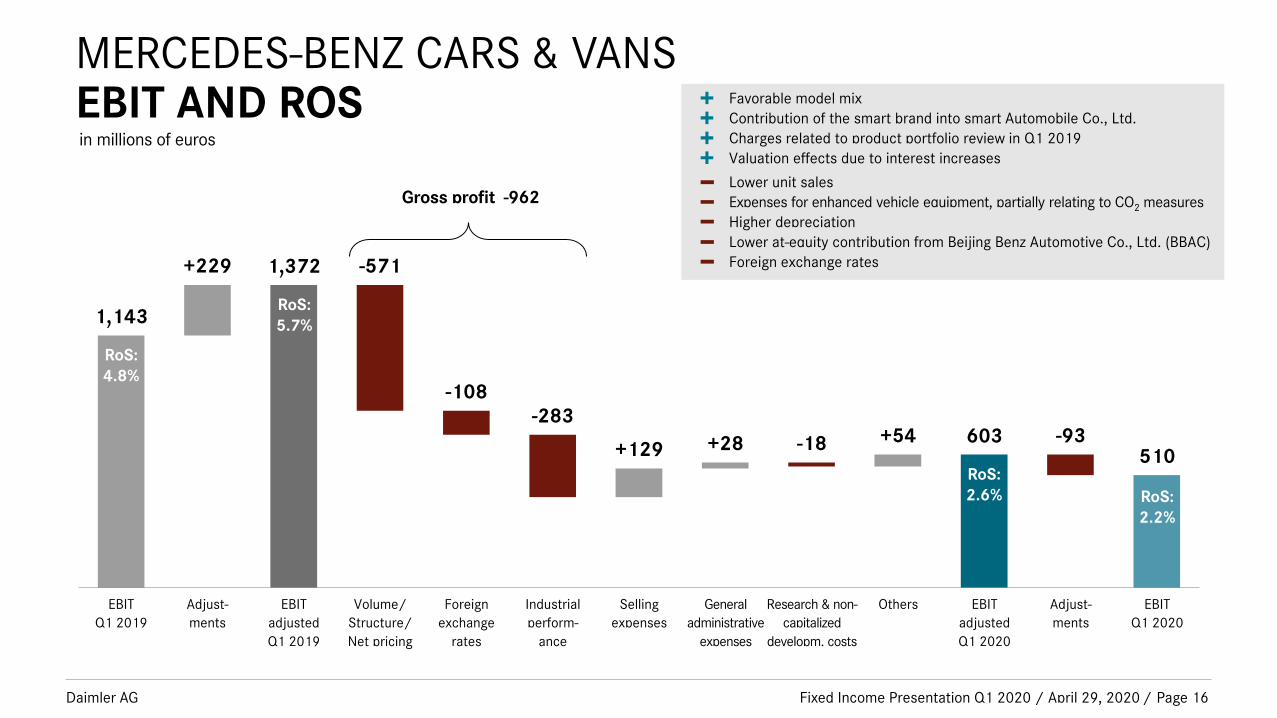
MERCEDES-BENZ CARS & VANSEBIT AND ROS
Fixed Income Presentation Q1 2020 / April 29, 2020 Page 16
in millions of euros
-108
-93
1,143
-571+229
EBIT
Q1 2019
Volume/
Structure/
Net pricing
Foreign
exchange
rates
Others EBIT
adjusted
Q1 2020
+54+28
Adjust-
ments
Adjust-
ments
510
EBIT
Q1 2020
RoS:4.8%
RoS:2.6% RoS:
2.2%
EBIT
adjusted
Q1 2019
1,372
RoS:5.7%
Favorable model mixContribution of the smart brand into smart Automobile Co., Ltd.Charges related to product portfolio review in Q1 2019Valuation effects due to interest increases
Lower unit salesExpenses for enhanced vehicle equipment, partially relating to CO2 measuresHigher depreciation
Lower at-equity contribution from Beijing Benz Automotive Co., Ltd. (BBAC)Foreign exchange rates
603-283
Industrial
perform-
ance
General
administrative
expenses
Research & non-
capitalized
developm. costs
Selling
expenses
-18+129
Gross profit -962
Daimler AG /
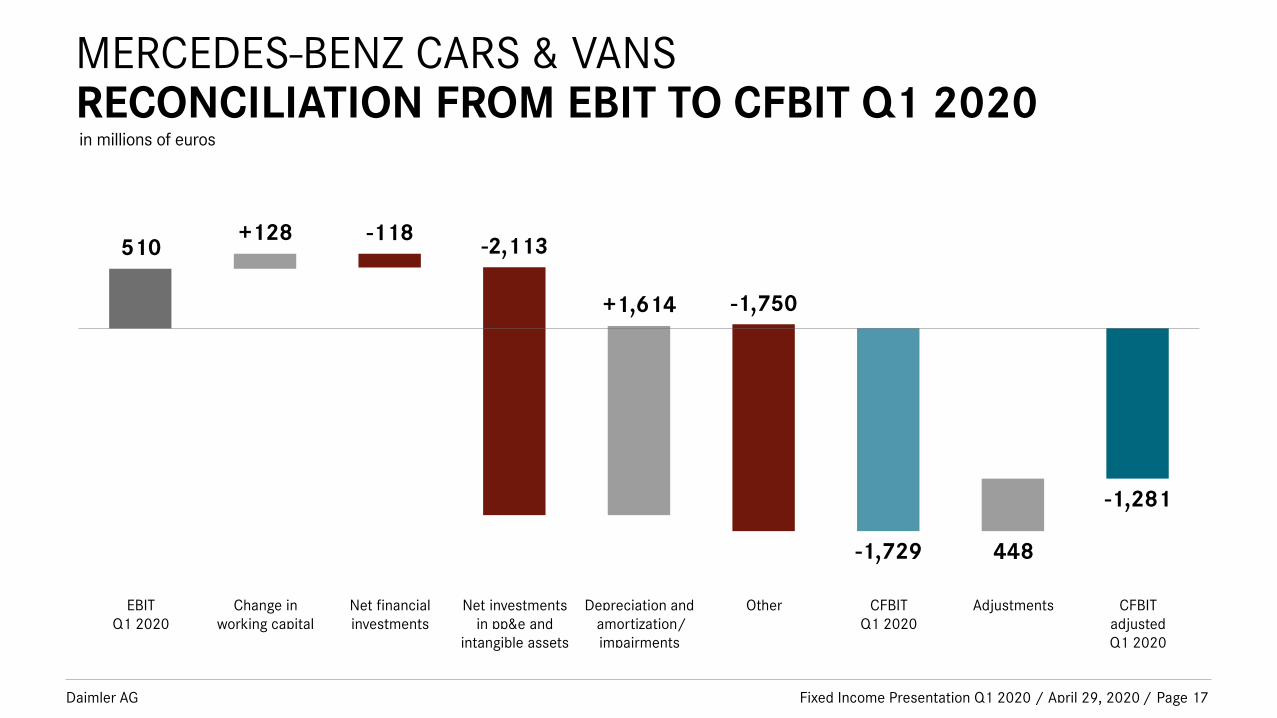
MERCEDES-BENZ CARS & VANSRECONCILIATION FROM EBIT TO CFBIT Q1 2020
Fixed Income Presentation Q1 2020 / April 29, 2020 Page 17
in millions of euros
-2,113
448
-1,750
510-118+128
EBITQ1 2020
Depreciation andamortization/impairments
Change inworking capital
Net investmentsin pp&e and
intangible assets
CFBITQ1 2020
OtherNet financialinvestments
+1,614
-1,729
Adjustments
-1,281
CFBITadjustedQ1 2020
Daimler AG /Fixed Income Presentation Q1 2020 / April 29, 2020
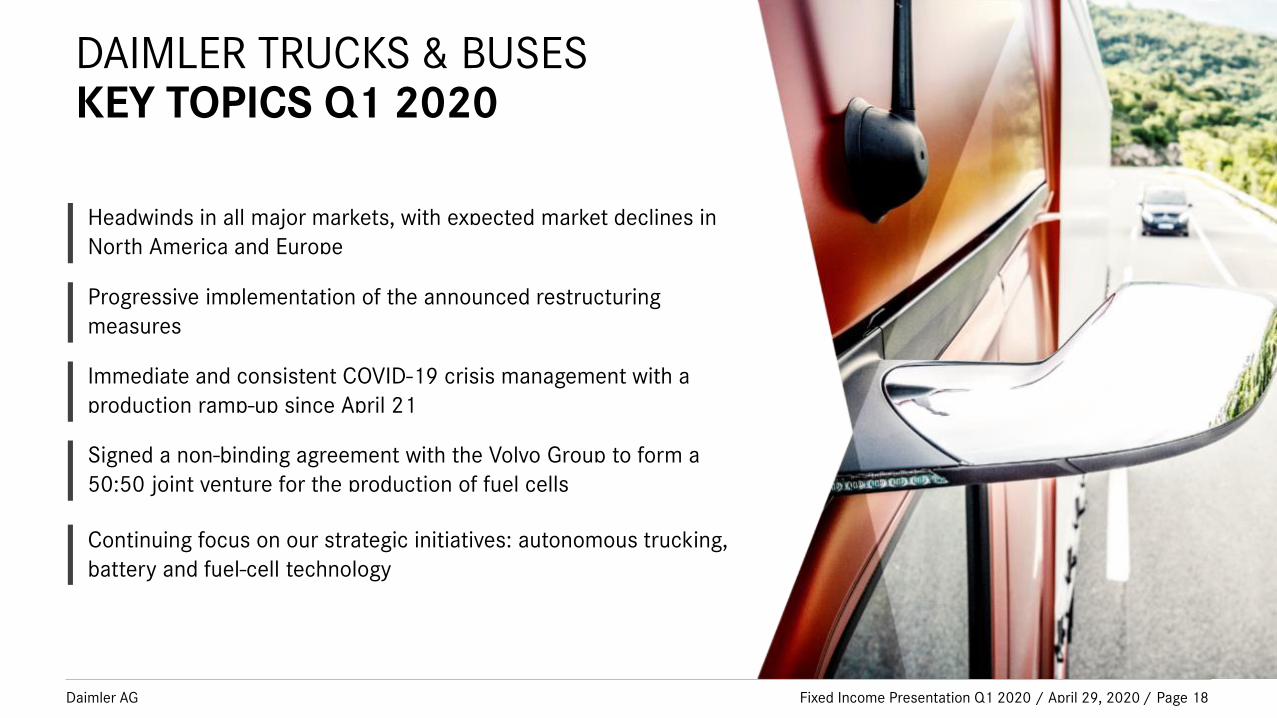
DAIMLER TRUCKS & BUSESKEY TOPICS Q1 2020
Page 18
Headwinds in all major markets, with expected market declines in North America and Europe
Continuing focus on our strategic initiatives: autonomous trucking, battery and fuel-cell technology
Signed a non-binding agreement with the Volvo Group to form a 50:50 joint venture for the production of fuel cells
Progressive implementation of the announced restructuring measures
Immediate and consistent COVID-19 crisis management with a production ramp-up since April 21

Daimler AG /Fixed Income Presentation Q1 2020 / April 29, 2020
DAIMLER TRUCKS & BUSESKEY FIGURES
Incoming orders*in thousands of units
Q1 2019 Q1 2020
110
93
-15%
Revenuein billions of euros
Q1 2019 Q1 2020
10.28.7
-14%
EBIT adjustedin millions of euros
Q1 2019 Q1 2020
553
247-55%
Page 19
CFBITin millions of euros
Q1 2019 Q1 2020
-232
-85
Unit sales in thousands of units
Q1 2019 Q1 2020
121
98
-20%
* Net order intake, adjusted for cancellations
Daimler AG /
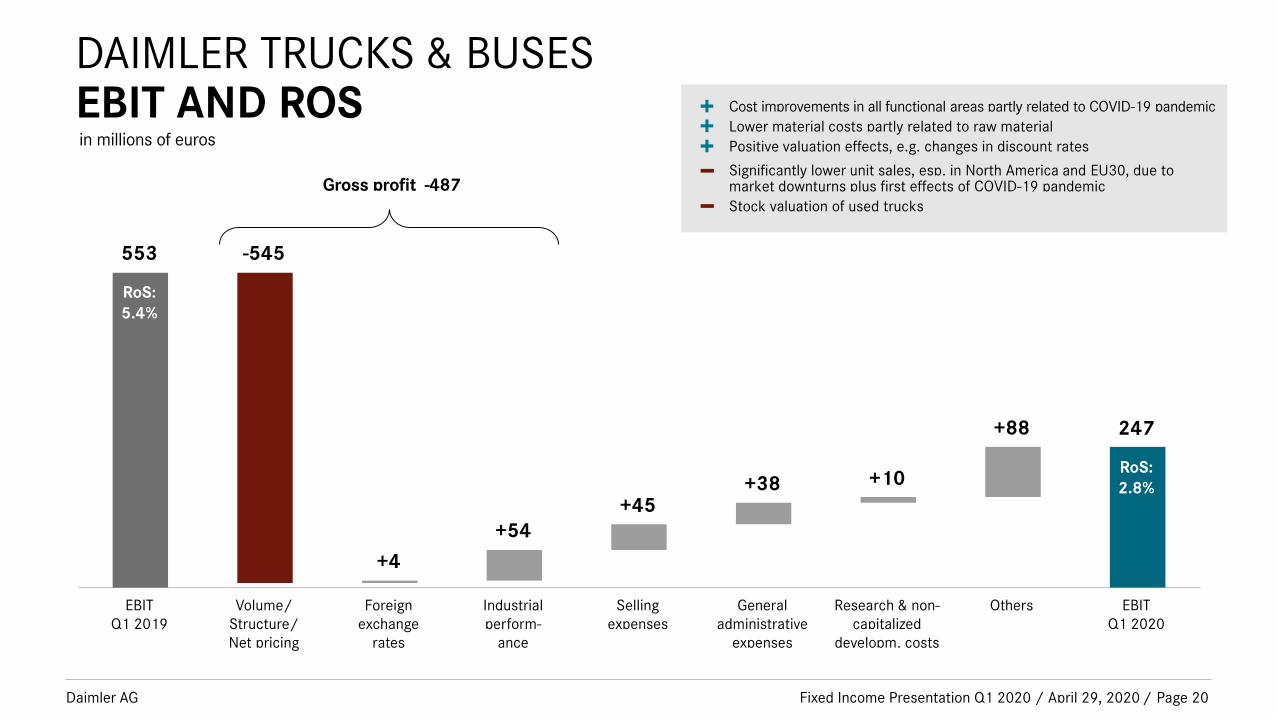
DAIMLER TRUCKS & BUSESEBIT AND ROS
Fixed Income Presentation Q1 2020 / April 29, 2020 Page 20
in millions of euros
+54
553
+4
-545
EBITQ1 2019
Volume/Structure/Net pricing
Foreignexchange
rates
EBITQ1 2020
247
RoS:5.4%
RoS:2.8%
Cost improvements in all functional areas partly related to COVID-19 pandemicLower material costs partly related to raw materialPositive valuation effects, e.g. changes in discount rates
Significantly lower unit sales, esp. in North America and EU30, due to market downturns plus first effects of COVID-19 pandemicStock valuation of used trucks
OthersIndustrialperform-
ance
Generaladministrative
expenses
Research & non-capitalized
developm. costs
Sellingexpenses
+45+38 +10
+88
Gross profit -487
Daimler AG /
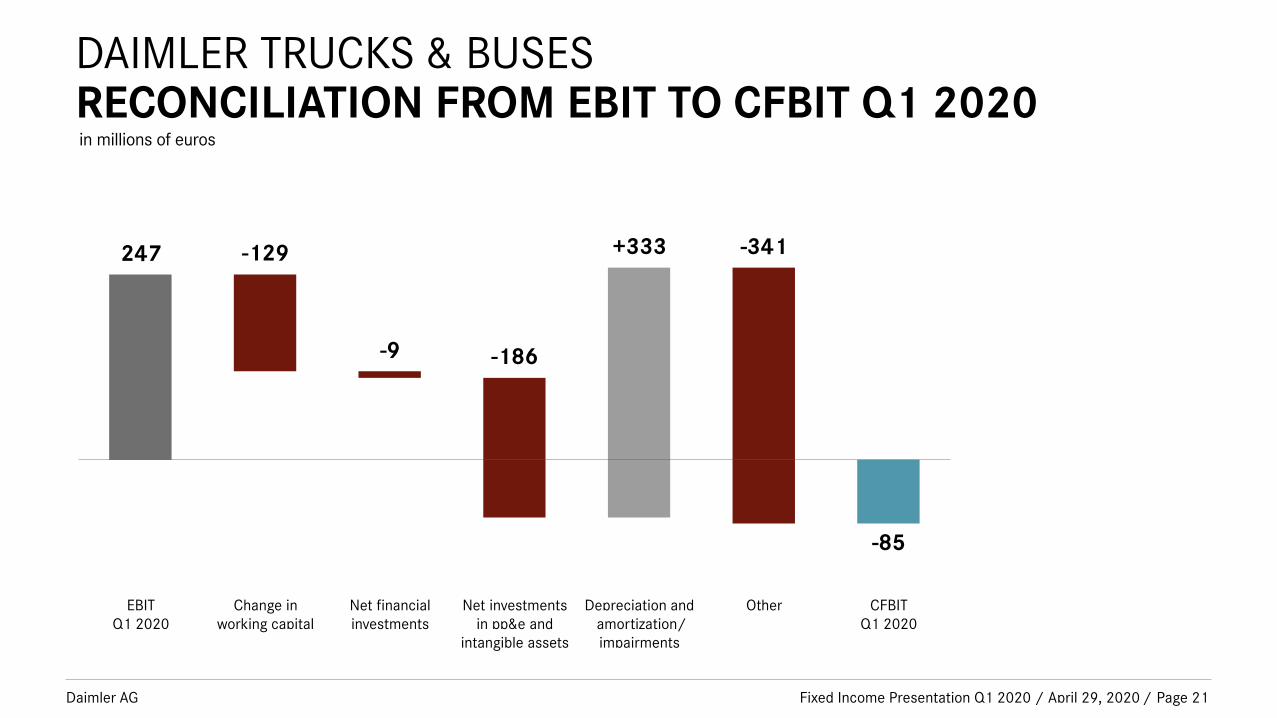
DAIMLER TRUCKS & BUSESRECONCILIATION FROM EBIT TO CFBIT Q1 2020
Fixed Income Presentation Q1 2020 / April 29, 2020 Page 21
in millions of euros
-186
-341247
-9
-129
EBITQ1 2020
Depreciation andamortization/impairments
Change inworking capital
Net investmentsin pp&e and
intangible assets
CFBITQ1 2020
OtherNet financialinvestments
+333
-85
Daimler AG /Fixed Income Presentation Q1 2020 / April 29, 2020
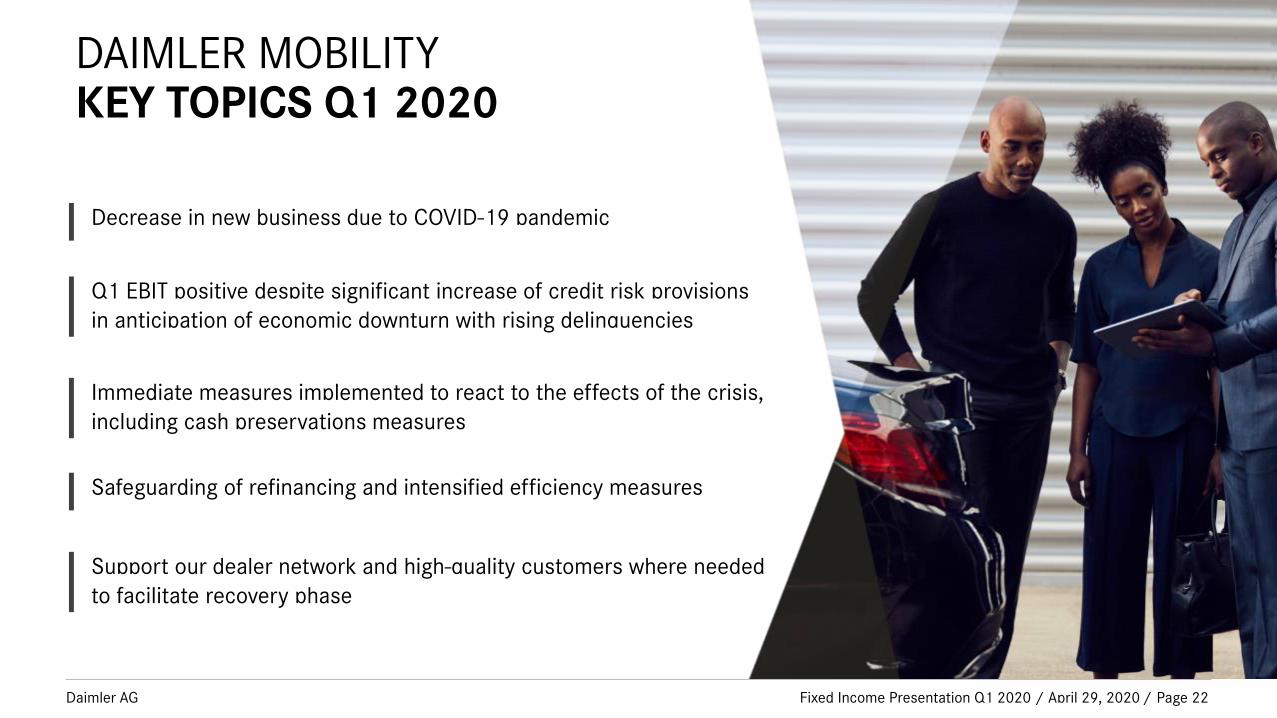
DAIMLER MOBILITYKEY TOPICS Q1 2020
Page 22
Decrease in new business due to COVID-19 pandemic
Q1 EBIT positive despite significant increase of credit risk provisions in anticipation of economic downturn with rising delinquencies
Immediate measures implemented to react to the effects of the crisis, including cash preservations measures
Safeguarding of refinancing and intensified efficiency measures
Support our dealer network and high-quality customers where needed to facilitate recovery phase
Daimler AG /Fixed Income Presentation Q1 2020 / April 29, 2020
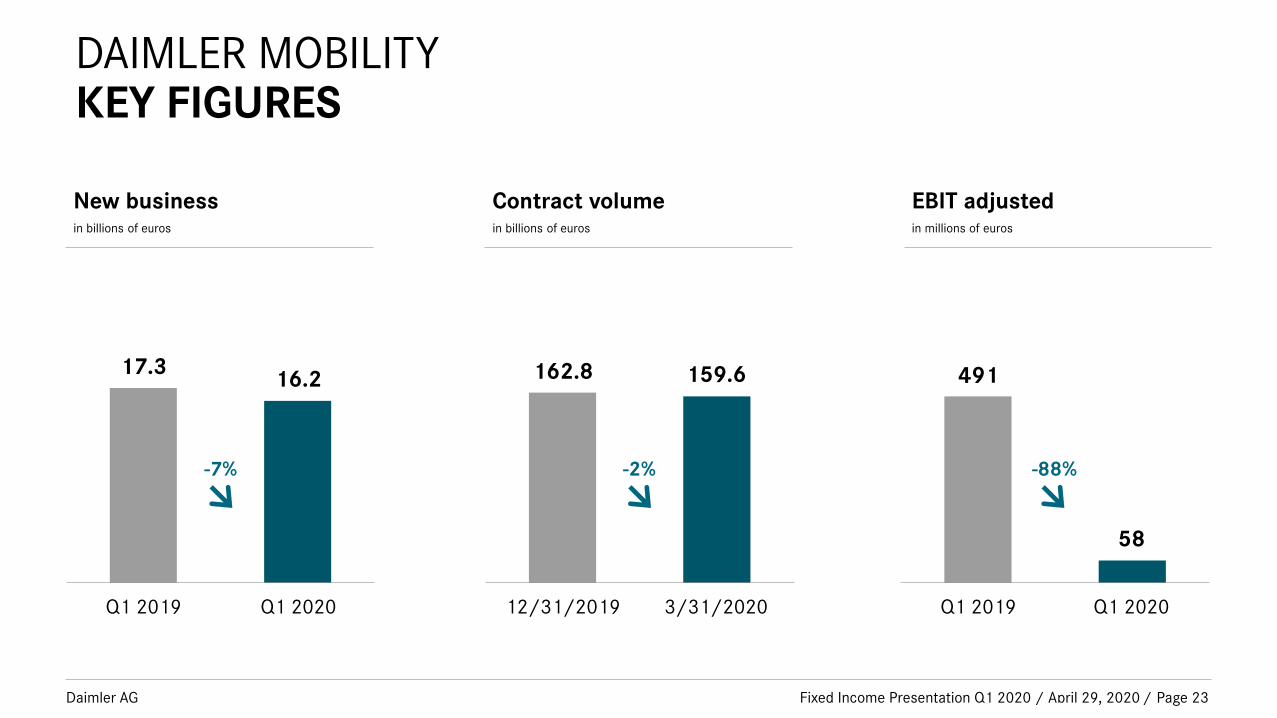
DAIMLER MOBILITYKEY FIGURES
New business in billions of euros
Q1 2019 Q1 2020
Contract volumein billions of euros
EBIT adjustedin millions of euros
17.316.2
12/31/2019 3/31/2020
162.8 159.6
Q1 2019 Q1 2020
491
58
-2% -88%-7%
Page 23
Daimler AG /
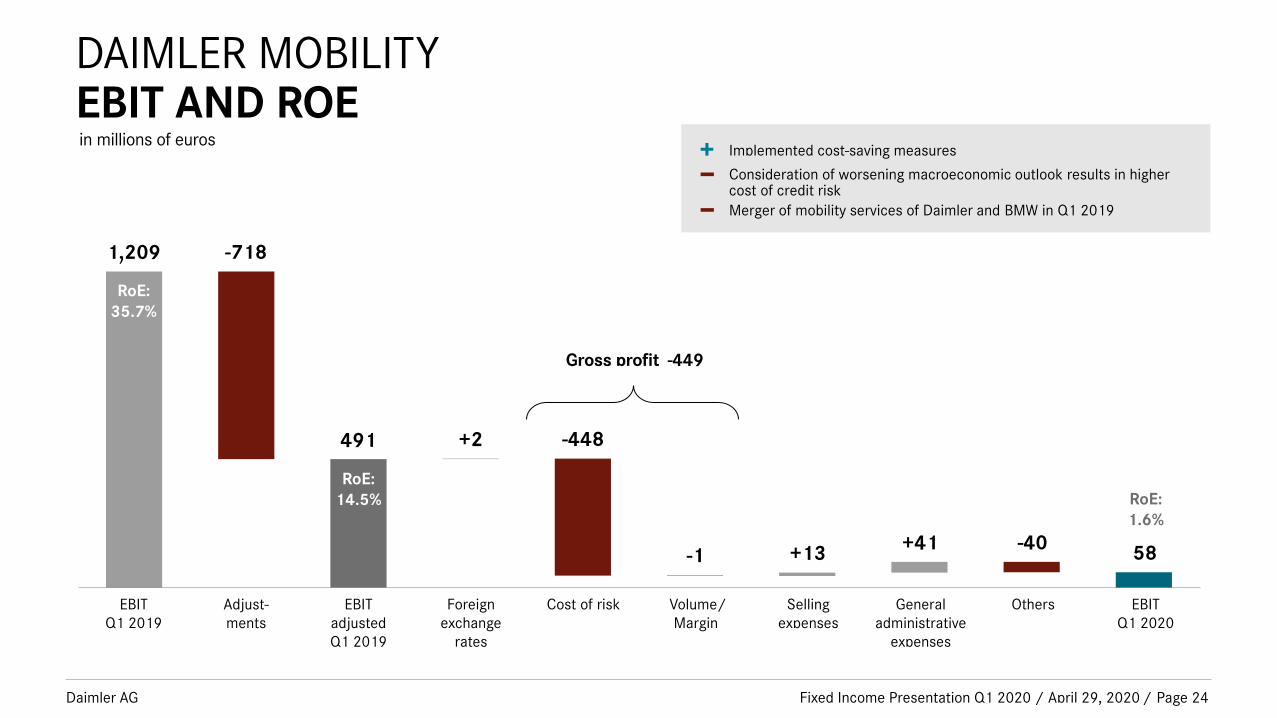
DAIMLER MOBILITYEBIT AND ROE
Fixed Income Presentation Q1 2020 / April 29, 2020 Page 24
in millions of euros
-1
1,209
-448+2
EBITQ1 2019
Volume/Margin
Cost of risk EBITQ1 2020
58
-718
Adjust-ments
RoE:35.7%
Implemented cost-saving measures
Consideration of worsening macroeconomic outlook results in higher cost of credit riskMerger of mobility services of Daimler and BMW in Q1 2019
RoE:1.6%
Foreignexchange
rates
+13
491
EBITadjustedQ1 2019
RoE:14.5%
OthersGeneraladministrative
expenses
Sellingexpenses
-40+41
Gross profit -449
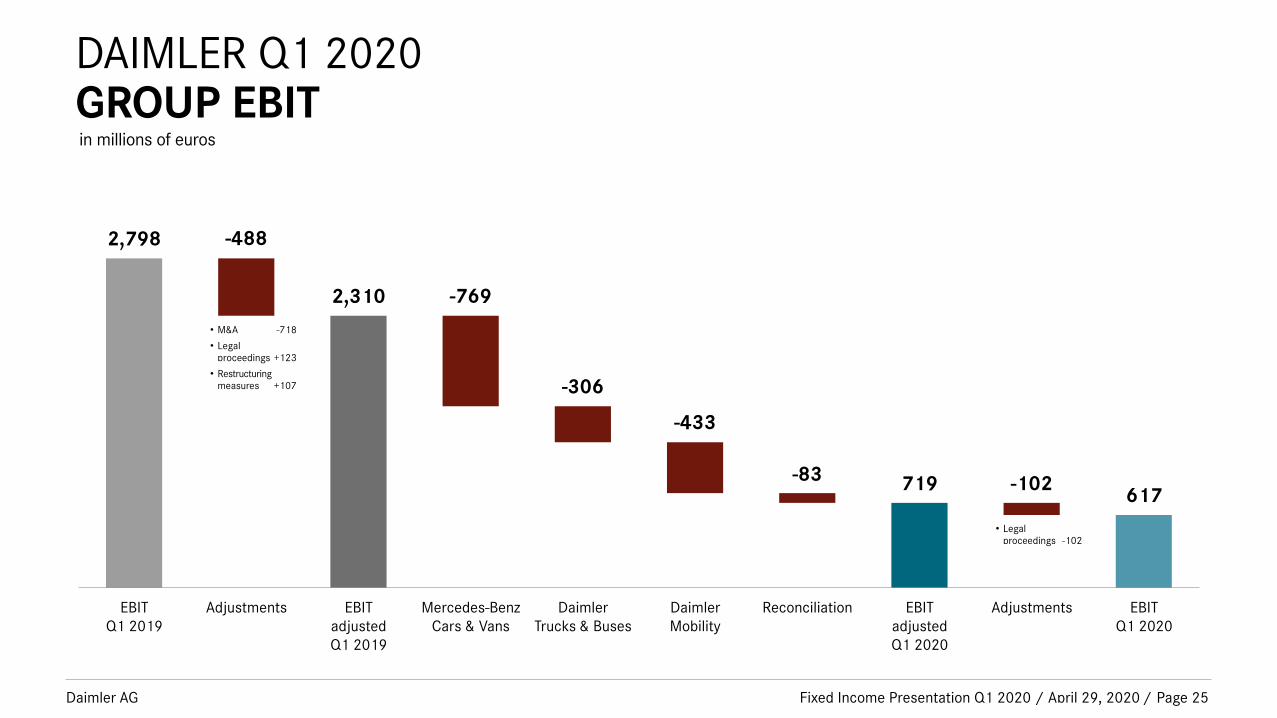
Daimler AG /
DAIMLER Q1 2020GROUP EBIT
Fixed Income Presentation Q1 2020 / April 29, 2020
-306
-102
-433
2,798
-769
-488
EBITQ1 2019
Mercedes-Benz Cars & Vans
DaimlerTrucks & Buses
EBITadjustedQ1 2020
ReconciliationDaimlerMobility
719-83
Adjustments
• Legal proceedings -102
Adjustments
• M&A -718
• Legal proceedings +123
• Restructuringmeasures +107
617
EBITQ1 2020
Page 25
in millions of euros
EBITadjustedQ1 2019
2,310
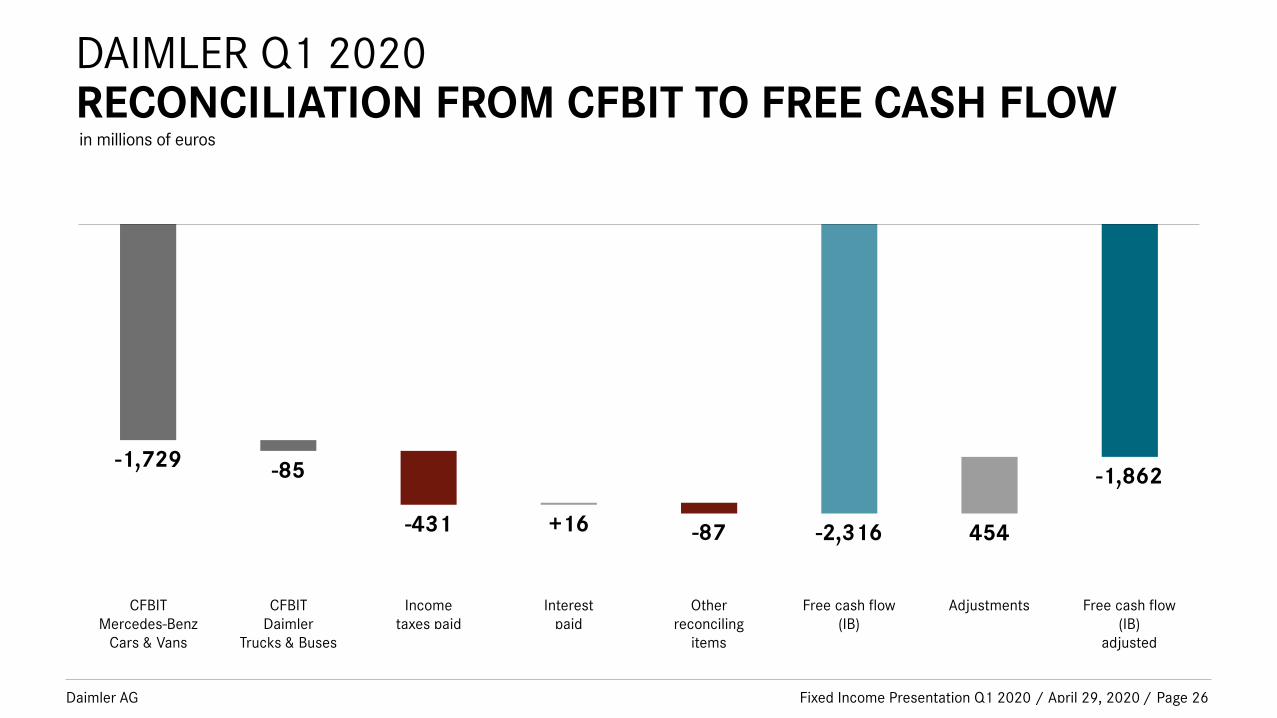
Daimler AG /
DAIMLER Q1 2020RECONCILIATION FROM CFBIT TO FREE CASH FLOW
Fixed Income Presentation Q1 2020 / April 29, 2020 Page 26
in millions of euros
+16
-1,729
-431
-85
CFBITMercedes-Benz
Cars & Vans
CFBITDaimler
Trucks & Buses
Incometaxes paid
Interestpaid
Free cash flow(IB)
Otherreconciling
items
-87 -2,316
Free cash flow(IB)
adjusted
-1,862
Adjustments
454

Daimler AG
I.Daimler AG 2019
III.FUNDING
Fixed Income Presentation Q1 2020 / April 29, 2020 27
Daimler AG
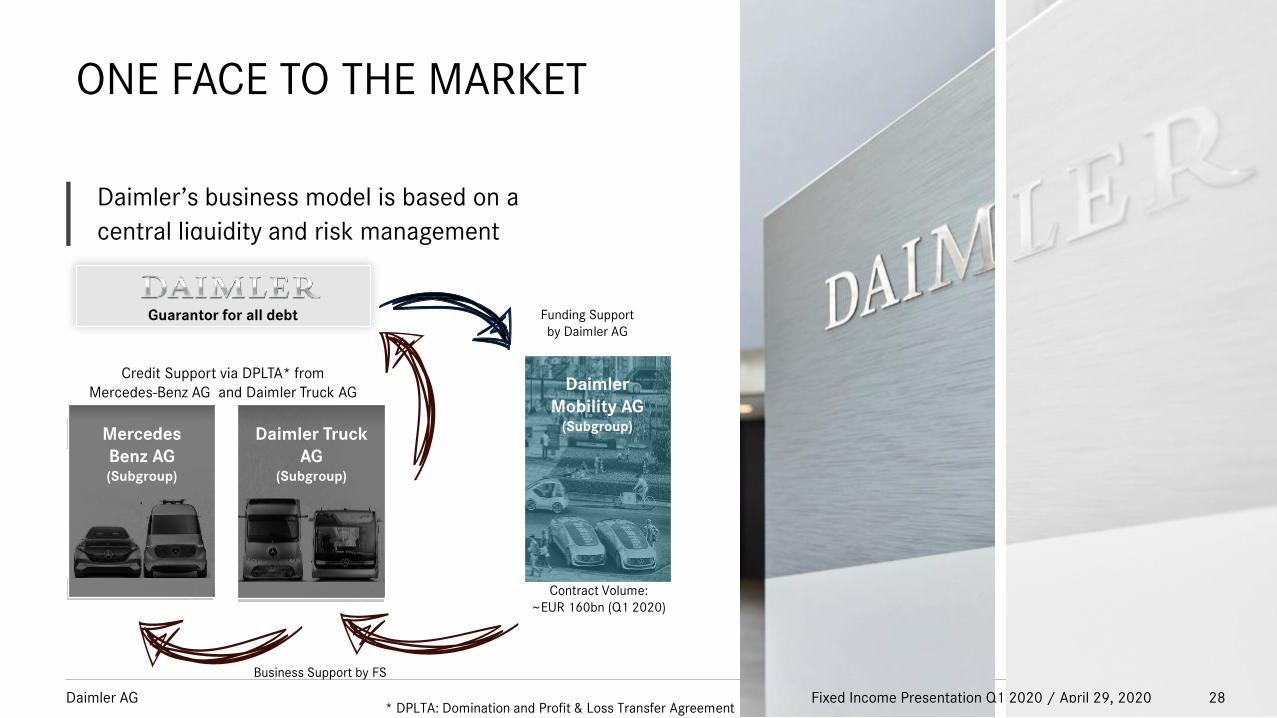
ONE FACE TO THE MARKET
Daimler’s business model is based on a
central liquidity and risk management
* DPLTA: Domination and Profit & Loss Transfer Agreement28
Daimler ambitionI
II
Mercedes
Benz AG(Subgroup)
Daimler Truck
AG(Subgroup)
Daimler
Mobility AG(Subgroup)
Guarantor for all debt
Contract Volume:
~EUR 160bn (Q1 2020)
Business Support by FS
Funding Support
by Daimler AG
Credit Support via DPLTA* from
Mercedes-Benz AG and Daimler Truck AG
Fixed Income Presentation Q1 2020 / April 29, 2020
Daimler AG
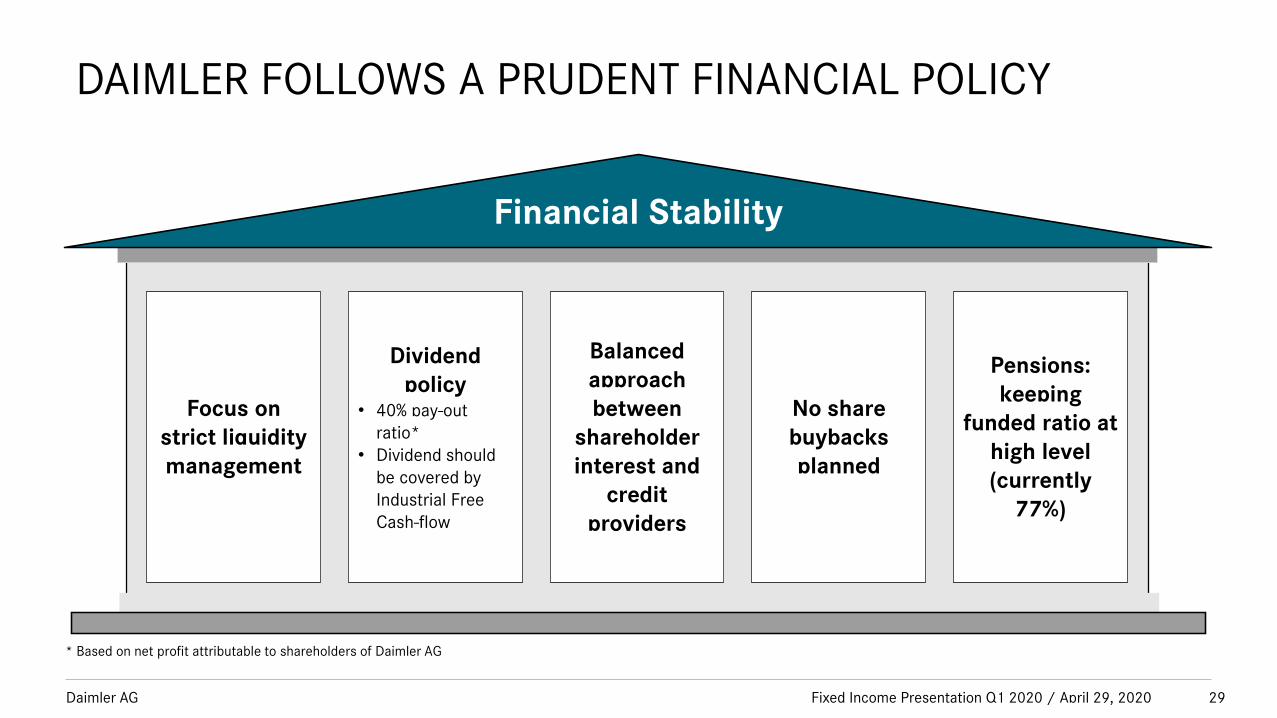
DAIMLER FOLLOWS A PRUDENT FINANCIAL POLICY
Financial Stability
Dividend policy
• 40% pay-out ratio*
• Dividend should be covered by Industrial Free Cash-flow
Focus on strict liquidity management
Pensions: keeping
funded ratio at high level (currently
77%)
* Based on net profit attributable to shareholders of Daimler AG
Balanced approach between
shareholder interest and
credit providers
29
No share buybacks planned
Fixed Income Presentation Q1 2020 / April 29, 2020
Daimler AG
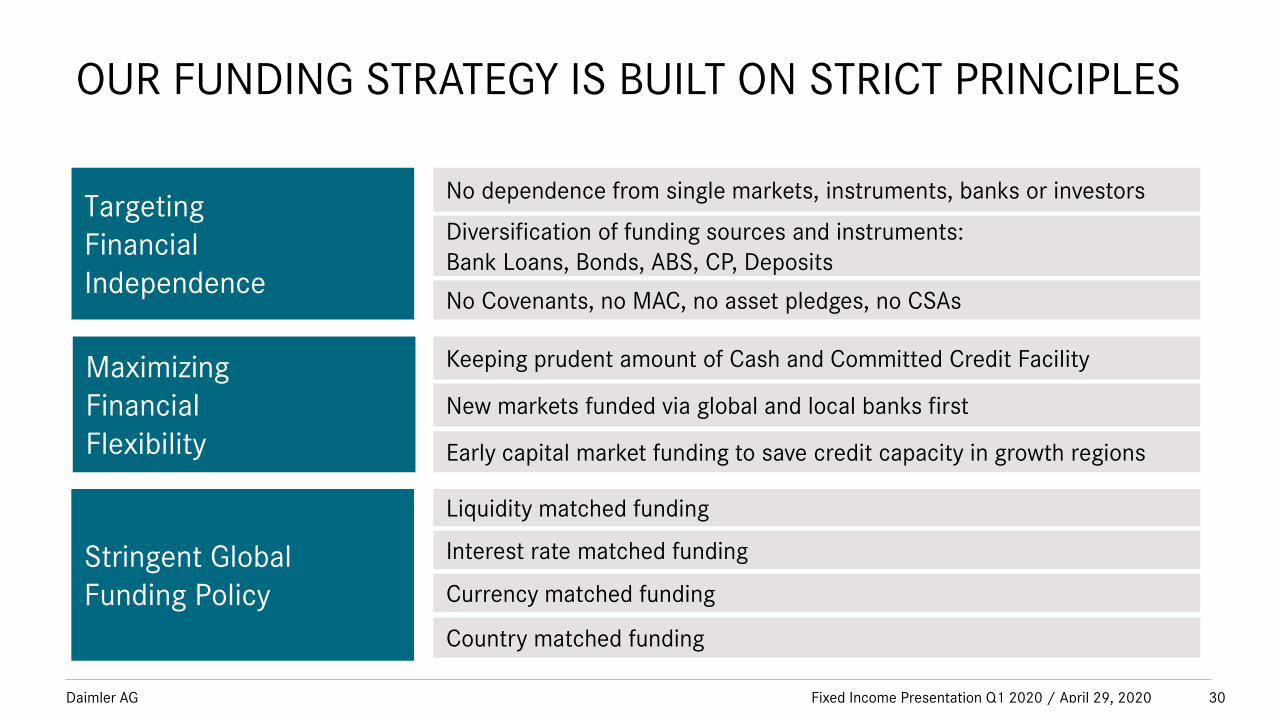
OUR FUNDING STRATEGY IS BUILT ON STRICT PRINCIPLES
Targeting
Financial
Independence
No dependence from single markets, instruments, banks or investors
Diversification of funding sources and instruments:
Bank Loans, Bonds, ABS, CP, Deposits
No Covenants, no MAC, no asset pledges, no CSAs
Maximizing
Financial
Flexibility Early capital market funding to save credit capacity in growth regions
New markets funded via global and local banks first
Stringent Global
Funding Policy
Liquidity matched funding
Interest rate matched funding
Currency matched funding
Country matched funding
Keeping prudent amount of Cash and Committed Credit Facility
30Fixed Income Presentation Q1 2020 / April 29, 2020
Daimler AG
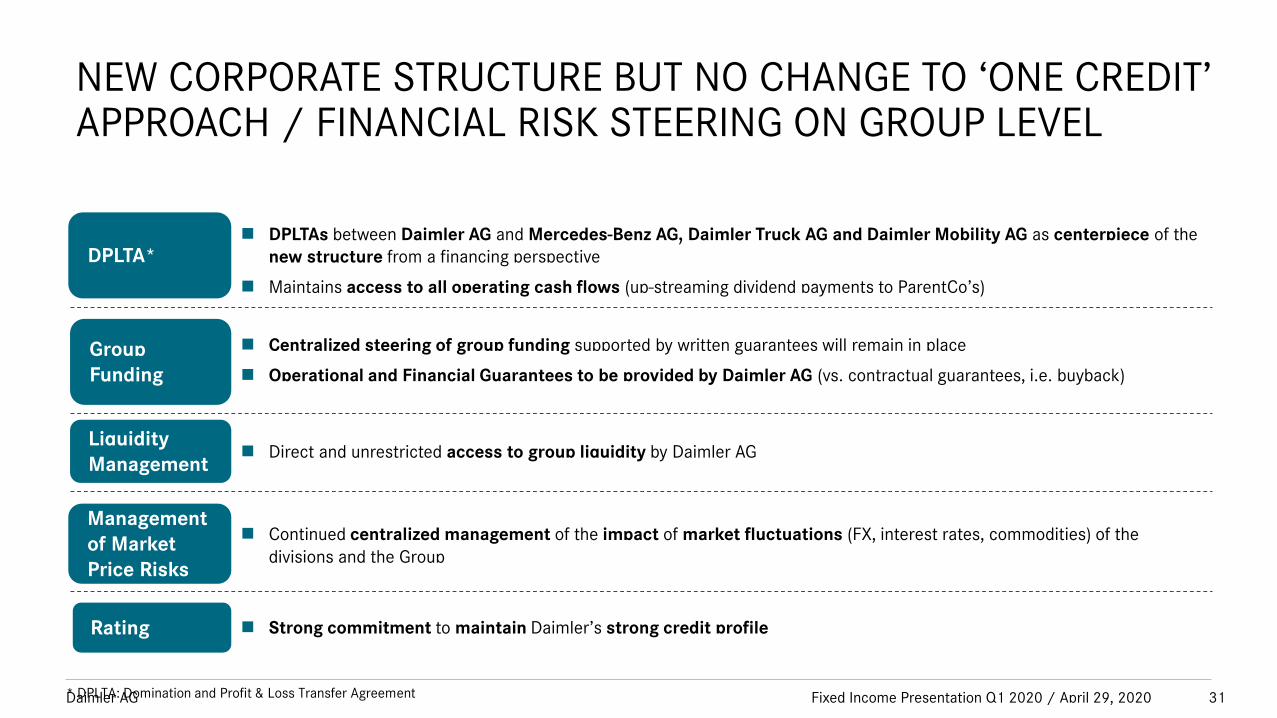
NEW CORPORATE STRUCTURE BUT NO CHANGE TO ‘ONE CREDIT’ APPROACH / FINANCIAL RISK STEERING ON GROUP LEVEL
DPLTA*
Liquidity Management
Group Funding
Management of Market Price Risks
Rating
Centralized steering of group funding supported by written guarantees will remain in place
Operational and Financial Guarantees to be provided by Daimler AG (vs. contractual guarantees, i.e. buyback)
Direct and unrestricted access to group liquidity by Daimler AG
Continued centralized management of the impact of market fluctuations (FX, interest rates, commodities) of the divisions and the Group
Strong commitment to maintain Daimler’s strong credit profile
DPLTAs between Daimler AG and Mercedes-Benz AG, Daimler Truck AG and Daimler Mobility AG as centerpiece of the new structure from a financing perspective
Maintains access to all operating cash flows (up-streaming dividend payments to ParentCo’s)
* DPLTA: Domination and Profit & Loss Transfer Agreement 31Fixed Income Presentation Q1 2020 / April 29, 2020
Daimler AG
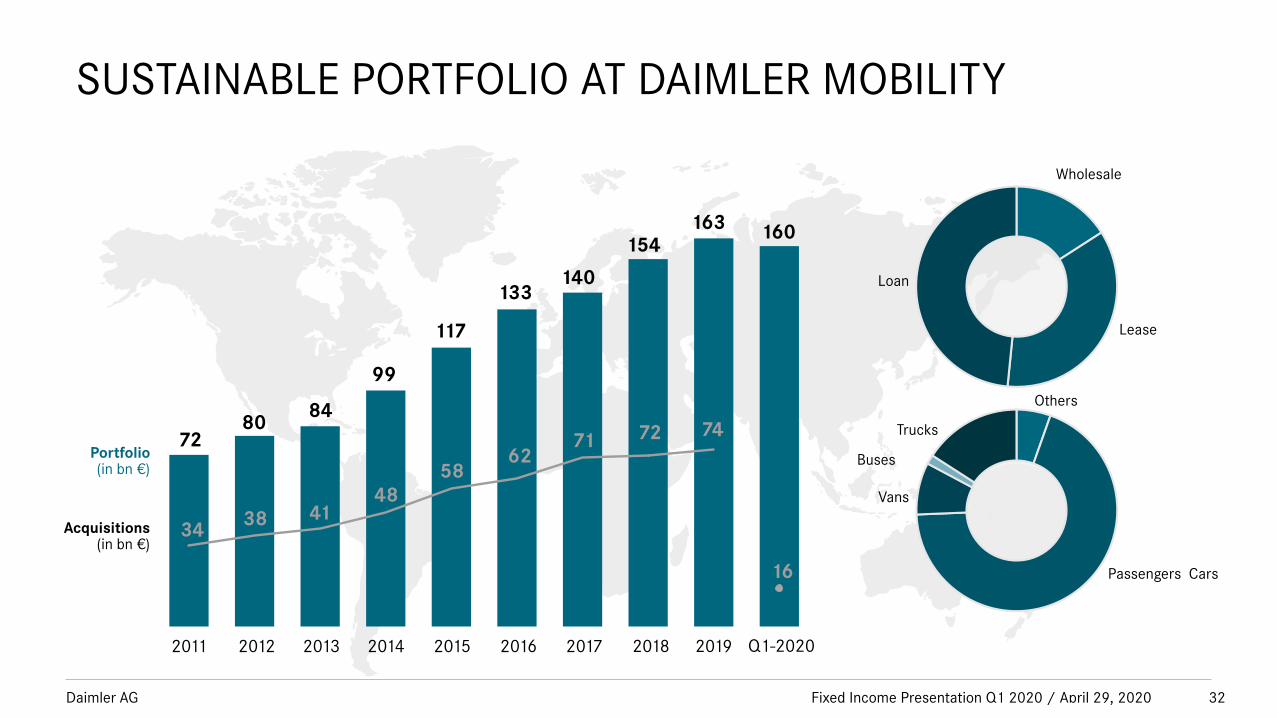
SUSTAINABLE PORTFOLIO AT DAIMLER MOBILITY
74
16
Wholesale
Lease
Loan
Buses
Vans
Trucks
Passengers Cars
Others
Portfolio(in bn €)
Acquisitions(in bn €)
160
7280
84
99
117
133140
154
3438 41
48
5862
71 72
201820172016201520142011 20132012 2019 Q1-2020
163
32Fixed Income Presentation Q1 2020 / April 29, 2020
Daimler AG
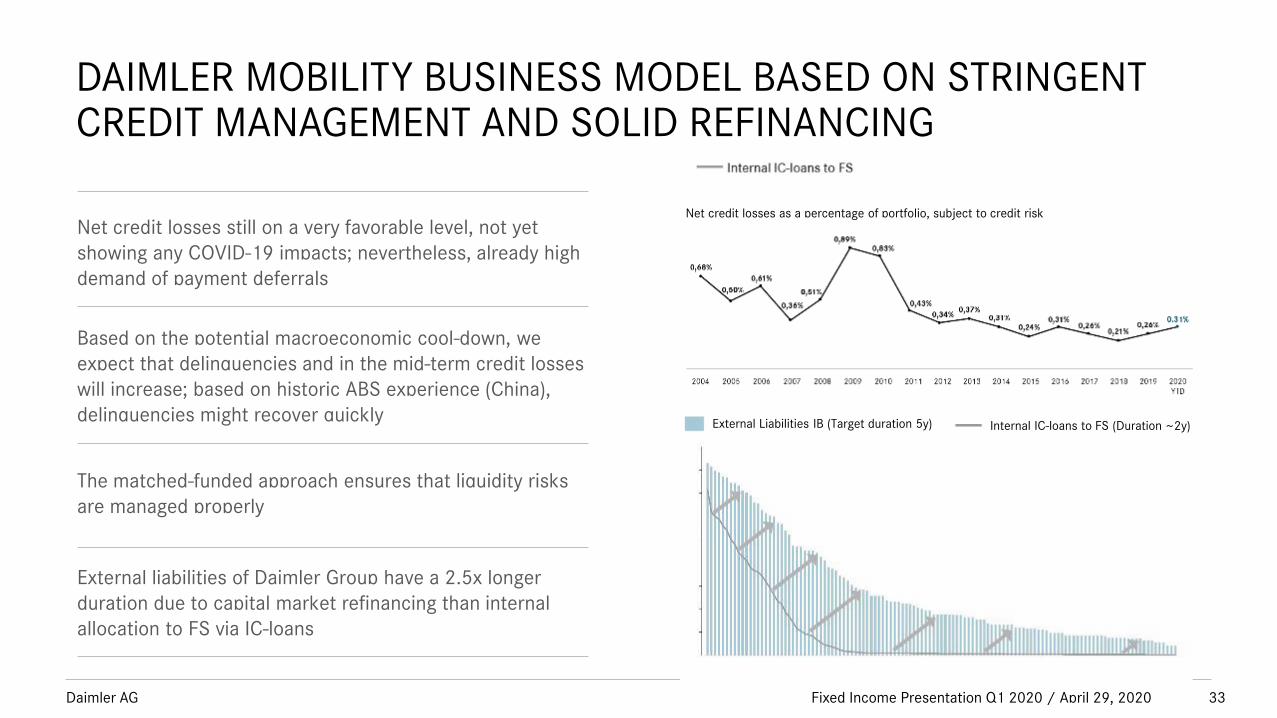
DAIMLER MOBILITY BUSINESS MODEL BASED ON STRINGENT CREDIT MANAGEMENT AND SOLID REFINANCING
Net credit losses as a percentage of portfolio, subject to credit risk
Based on the potential macroeconomic cool-down, we expect that delinquencies and in the mid-term credit losses will increase; based on historic ABS experience (China), delinquencies might recover quickly
The matched-funded approach ensures that liquidity risks are managed properly
External liabilities of Daimler Group have a 2.5x longer duration due to capital market refinancing than internal allocation to FS via IC-loans
Internal IC-loans to FS (Duration ~2y)External Liabilities IB (Target duration 5y)
33
Net credit losses still on a very favorable level, not yet showing any COVID-19 impacts; nevertheless, already high demand of payment deferrals
Fixed Income Presentation Q1 2020 / April 29, 2020
Daimler AG
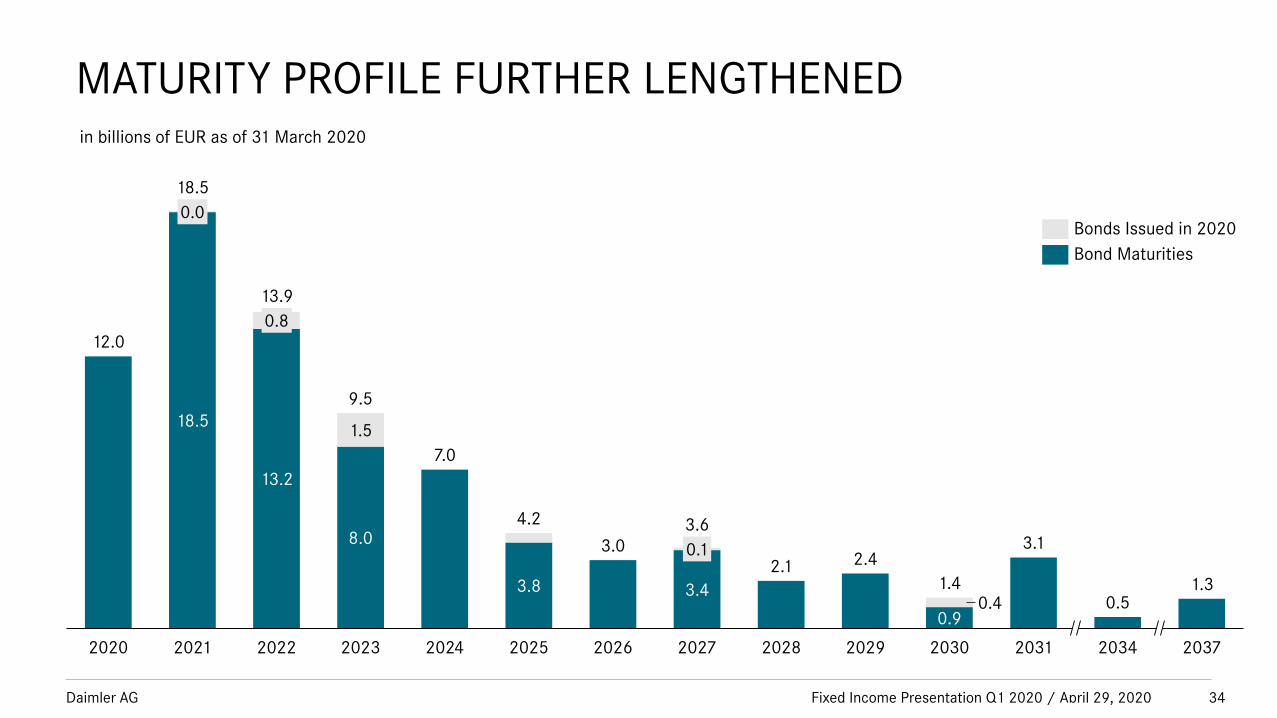
MATURITY PROFILE FURTHER LENGTHENED
18.51.5
13.2
2.43.08.0
2023 20372024 2027
3.8
9.5
20262025
0.1
2028 2029
1.4
0.8
2022
18.5
0.40.9
2030 203420312021
12.0
0.0
7.0
4.2 3.6
2.1
13.9
0.51.3
2020
3.4
3.1
in billions of EUR as of 31 March 2020
34
Bonds Issued in 2020
Bond Maturities
Fixed Income Presentation Q1 2020 / April 29, 2020
Daimler AG
EUR 12BN BRIDGE FACILITY SIGNED
EUR 12bn bridge facility signed to cover mainly volatility and uncertainty in capital markets
Tenor one year, two extension options of six months each
Quick reaction on current crisis secured additional liquidity buffer in high speed
• EUR 12bn bridge facility intended to be (partly) drawn depending on markets
• No intention to draw the EUR 11bn backup credit facility
Additionally, EUR 11bn Backup Facility available until 2024 secures significant long-term liquidity
35Fixed Income Presentation Q1 2020 / April 29, 2020

Daimler AG
FINANCING LIABILITIES SHOW A DIVERSIFIED FUNDING MIX
Note: Figures may not be additive due to rounding.
in billions of EUR
83.5
2016
4.2
0.0
2018
12.5 2.82.0
39.8
1.0
2.7
11.0
Q1 2020
13.1
11.5
0.0
34.6
67.3
2017
10.6
85.6
0.0
11.6
3.32.0
158.3
11.8
29.7
39.4
76.6
1.0
1.7
145.01.8
63.0
2019
4.2
13.9 1.7
37.6
15.8
12.9117.6127.4
161.8
Fin. Lease (IFRS 16)
Other (ex Fin. Lease)
Com. Paper
ABS
Acc. Deposits
Bank Loans
Bonds
36Fixed Income Presentation Q1 2020 / April 29, 2020
Daimler AG
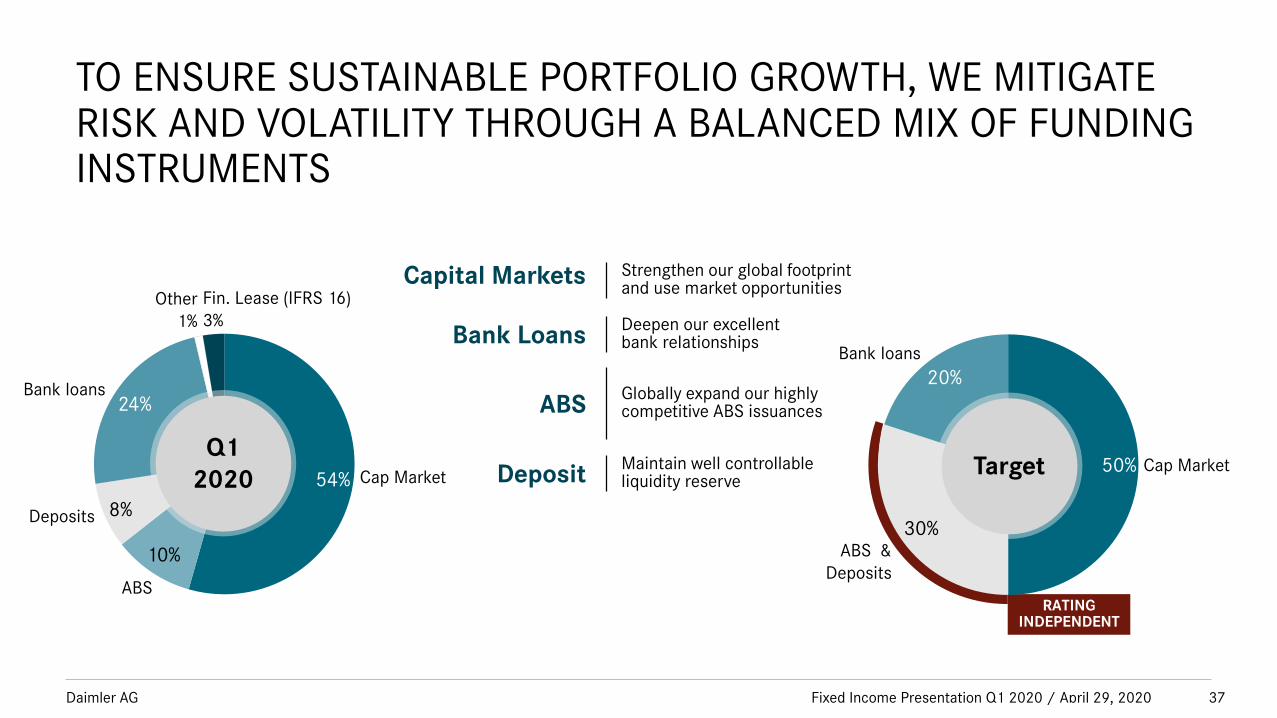
TO ENSURE SUSTAINABLE PORTFOLIO GROWTH, WE MITIGATE RISK AND VOLATILITY THROUGH A BALANCED MIX OF FUNDING INSTRUMENTS
Capital Markets
Maintain well controllable liquidity reserve
Bank Loans
ABS
Deposit
Strengthen our global footprint and use market opportunities
Deepen our excellentbank relationships
Globally expand our highly competitive ABS issuances
RATING INDEPENDENT
54%
10%
8%
24%
Cap Market
ABS
Deposits
Other
1%
Bank loans
Fin. Lease (IFRS 16)
3%
Q1
202050%
30%
20%
Cap Market
ABS &
Deposits
Bank loans
Target
37Fixed Income Presentation Q1 2020 / April 29, 2020
Daimler AG
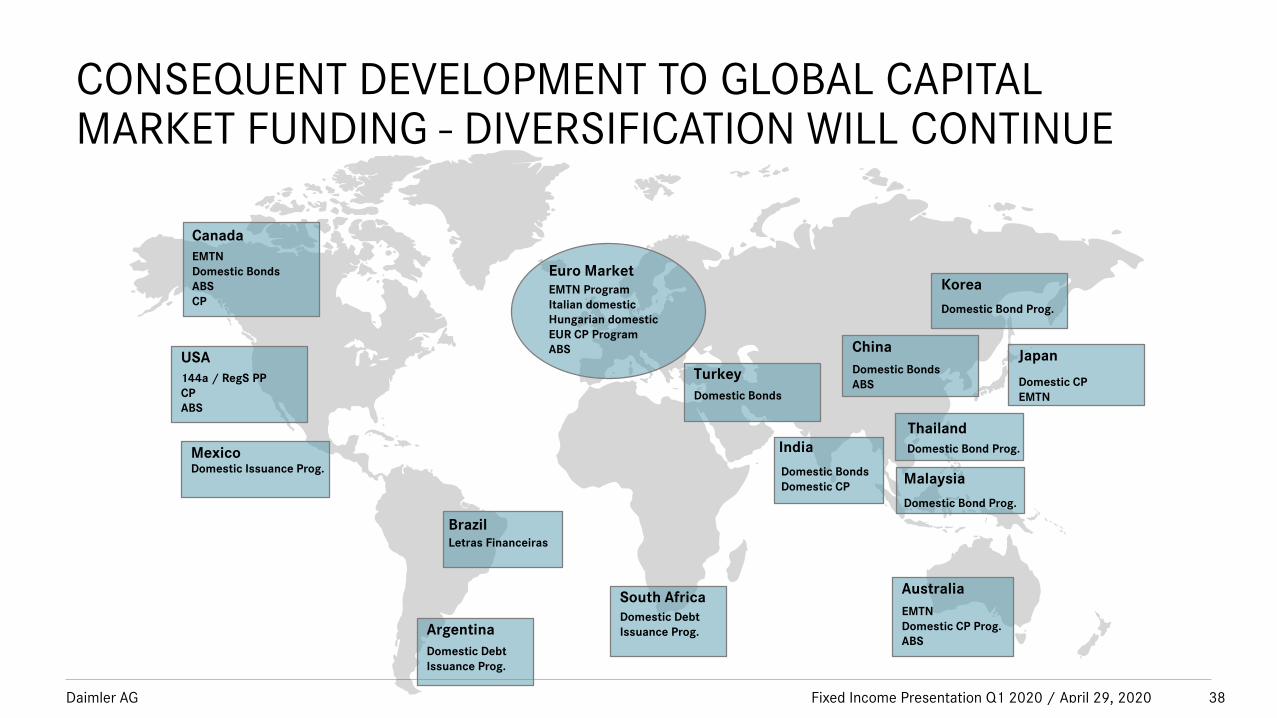
CONSEQUENT DEVELOPMENT TO GLOBAL CAPITAL MARKET FUNDING - DIVERSIFICATION WILL CONTINUE
Argentina
Domestic Debt
Issuance Prog.
MexicoDomestic Issuance Prog.
USA
144a / RegS PP
CP
ABS
EMTN
Domestic Bonds
ABS
CP
Canada
Euro Market
EMTN Program
Italian domestic
Hungarian domestic
EUR CP Program
ABS
Letras Financeiras
Brazil
South Africa
Domestic Debt
Issuance Prog.
Turkey
Domestic Bonds
India
Domestic Bonds
Domestic CP
Australia
EMTN
Domestic CP Prog.
ABS
Thailand
Domestic Bond Prog.
Malaysia
Domestic Bond Prog.
Japan
Domestic CP
EMTN
Korea
Domestic Bond Prog.
China
Domestic Bonds
ABS
38Fixed Income Presentation Q1 2020 / April 29, 2020

Daimler AG
FUNDING BASE FURTHER DIVERSIFIED TO A TRUE GLOBAL SET-UP
Note: Figures may not be additive due to rounding
in billions of EUR
0%
Other
22%
51%
Q4 2009
10%
3%
24%
23%
0%
2%
Bonds
8%
53%
Q1 2020
2%
Com. Paper
Fin. Lease (IFRS 16)
57,32%
ABS
Acc. Deposits
1%
Bank Loans
158,3
Currency Volume %
EUR 19,5 66%
USD 7,8 27%
ZAR 0,8 3%
JPY 0,6 2%
GBP 0,3 1%
CHF 0,2 1%
Other (AUD,
MXN, ARS)
0,2 1%
Total 29
Currencies 9
39
Currency Volume %
EUR 37,2 45%
USD 29,2 36%
CNY 4,4 5%
GBP 3,5 4%
CAD 2,3 3%
ZAR 1,5 2%
KRW 0,8 1%
MXN 0,6 1%
AUD 0,5 1%
JPY 0,5 1%
NOK 0,4 1%
Other (THB, CHF 1,3 2%
MYR, HKD, HUF,
INR)
Total 83
Currencies 20
Fixed Income Presentation Q1 2020 / April 29, 2020
Daimler AG
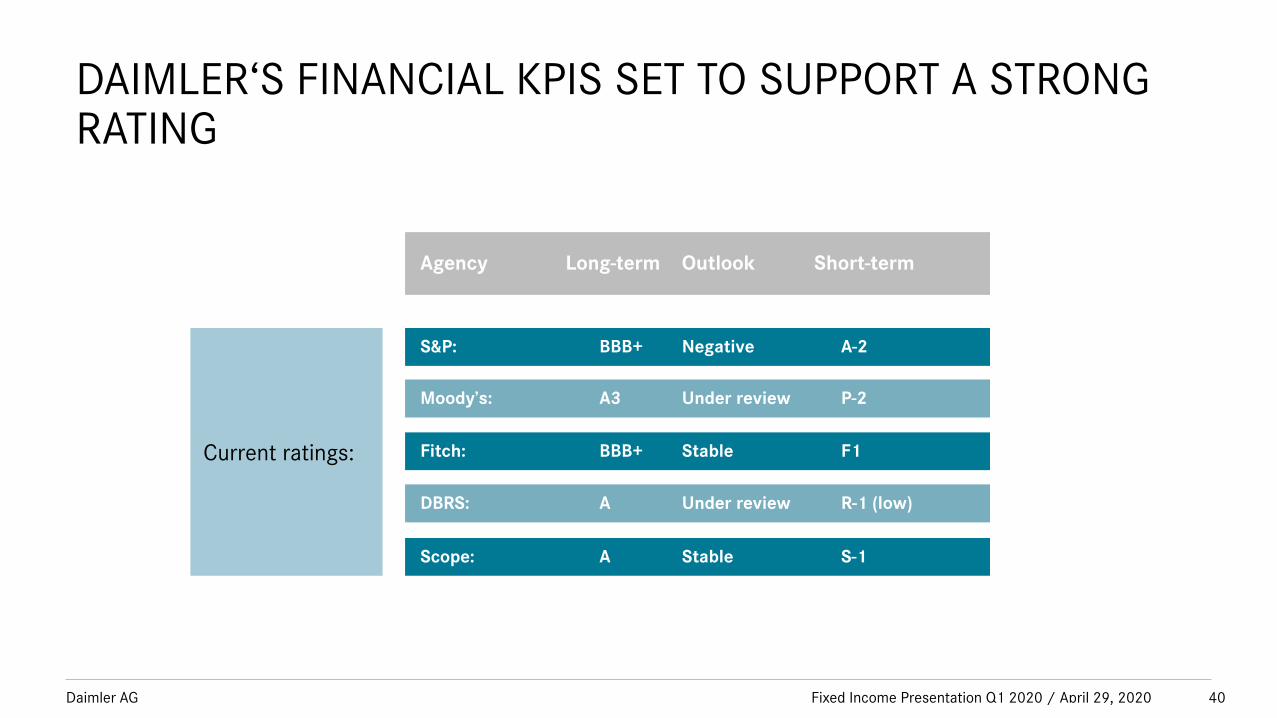
DAIMLER‘S FINANCIAL KPIS SET TO SUPPORT A STRONG RATING
Current ratings:
S&P: BBB+ Negative A-2
Moody’s: A3 Under review P-2
Fitch: BBB+ Stable F1
DBRS: A Under review R-1 (low)
Scope: A Stable S-1
Agency Long-term Outlook Short-term
40Fixed Income Presentation Q1 2020 / April 29, 2020
Daimler AG
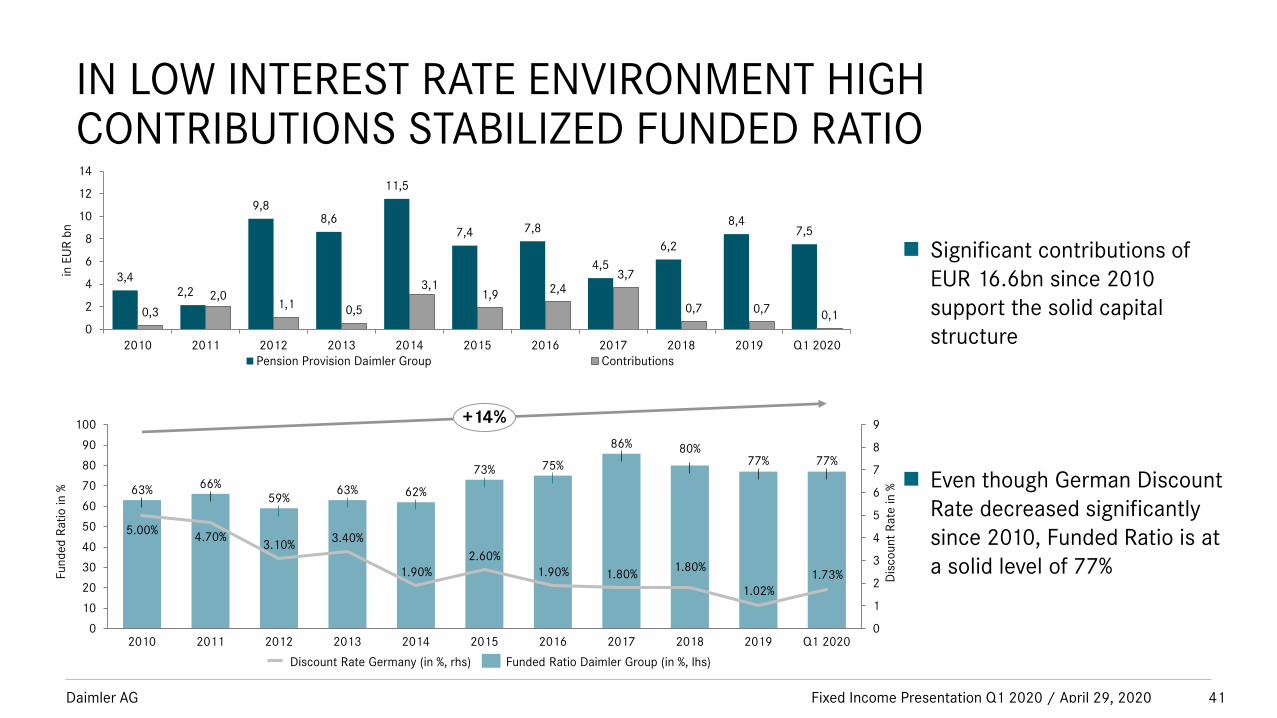
IN LOW INTEREST RATE ENVIRONMENT HIGH CONTRIBUTIONS STABILIZED FUNDED RATIO
3,42,2
9,88,6
11,5
7,4 7,8
4,5
6,2
8,47,5
0,3
2,01,1
0,5
3,11,9
2,43,7
0,7 0,70,1
0
2
4
6
8
10
12
14
2010 2011 2012 2013 2014 2015 2016 2017 2018 2019 Q1 2020
in E
UR
bn
Pension Provision Daimler Group Contributions
80%77% 77%
0
1
2
3
4
5
6
7
8
9
0
10
20
30
40
50
60
70
80
90
100
4.70%5.00%
2010
86%
66%
2011
59%
3.40%
63%
2013
1.90%
Q1 2020
63% 62%
2014
2.60%
73%
2015
1.02%
20162012
75%
1.80%
2017
1.80%1.90%
2019
3.10%
1.73%
2018
+14%
Discount Rate Germany (in %, rhs) Funded Ratio Daimler Group (in %, lhs)
Significant contributions of
EUR 16.6bn since 2010
support the solid capital
structure
Even though German Discount
Rate decreased significantly
since 2010, Funded Ratio is at
a solid level of 77%Fun
ded
Rati
o in
%
Dis
co
un
t R
ate
in
%
41Fixed Income Presentation Q1 2020 / April 29, 2020

Daimler AG
I.Daimler AG 2019
IV.SUSTAINABILITY
Fixed Income Presentation Q1 2020 / April 29, 2020 42
Reset the slide back to its
Change the slide layout
via menu bar:
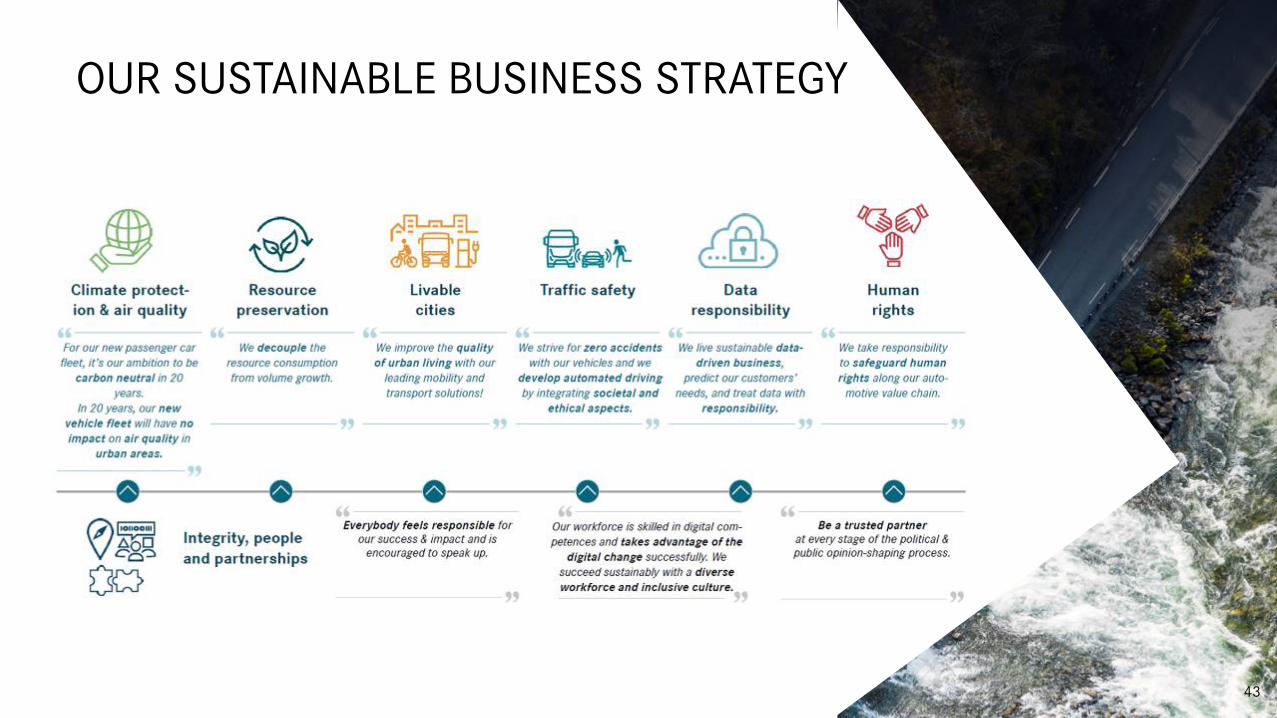
OUR SUSTAINABLE BUSINESS STRATEGY
43
Daimler AG
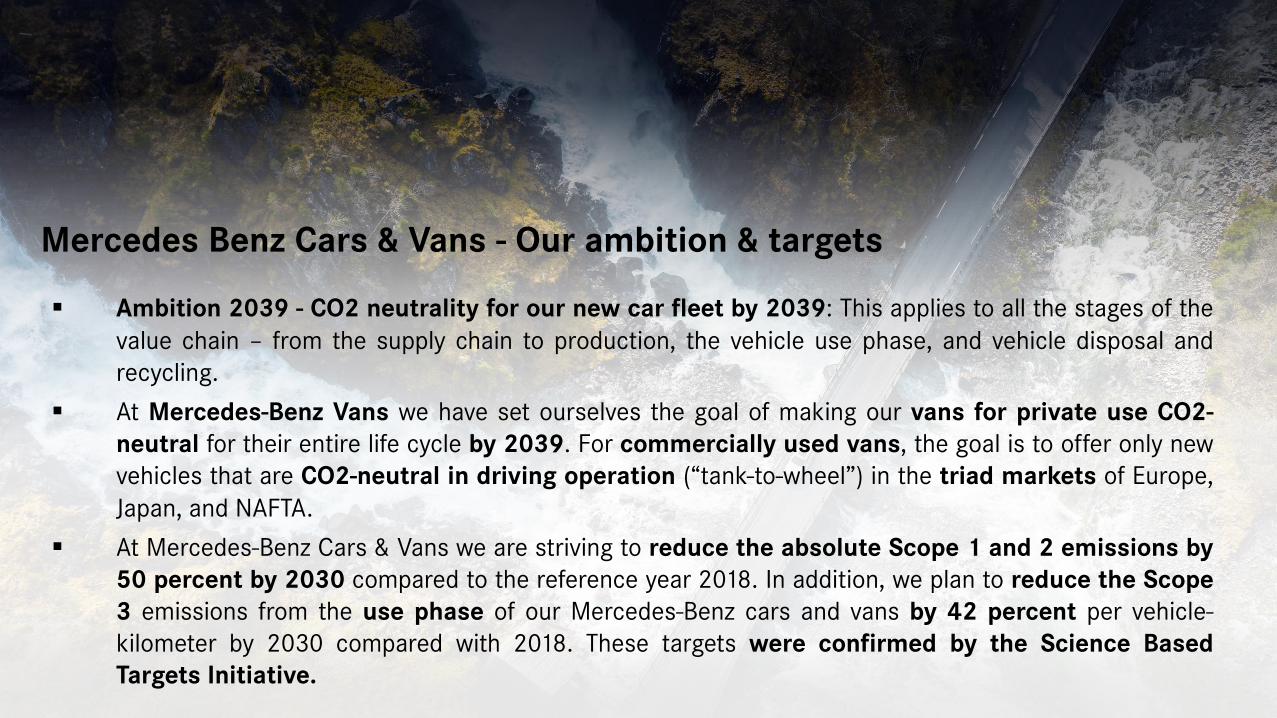
Ambition 2039 - CO2 neutrality for our new car fleet by 2039: This applies to all the stages of the
value chain – from the supply chain to production, the vehicle use phase, and vehicle disposal and
recycling.
At Mercedes-Benz Vans we have set ourselves the goal of making our vans for private use CO2-
neutral for their entire life cycle by 2039. For commercially used vans, the goal is to offer only new
vehicles that are CO2-neutral in driving operation (“tank-to-wheel”) in the triad markets of Europe,
Japan, and NAFTA.
At Mercedes-Benz Cars & Vans we are striving to reduce the absolute Scope 1 and 2 emissions by
50 percent by 2030 compared to the reference year 2018. In addition, we plan to reduce the Scope
3 emissions from the use phase of our Mercedes-Benz cars and vans by 42 percent per vehicle-
kilometer by 2030 compared with 2018. These targets were confirmed by the Science Based
Targets Initiative.
Mercedes Benz Cars & Vans - Our ambition & targets
Daimler AG Fixed Income Presentation Q1 2020 / April 29, 2020 45
Daimler AG
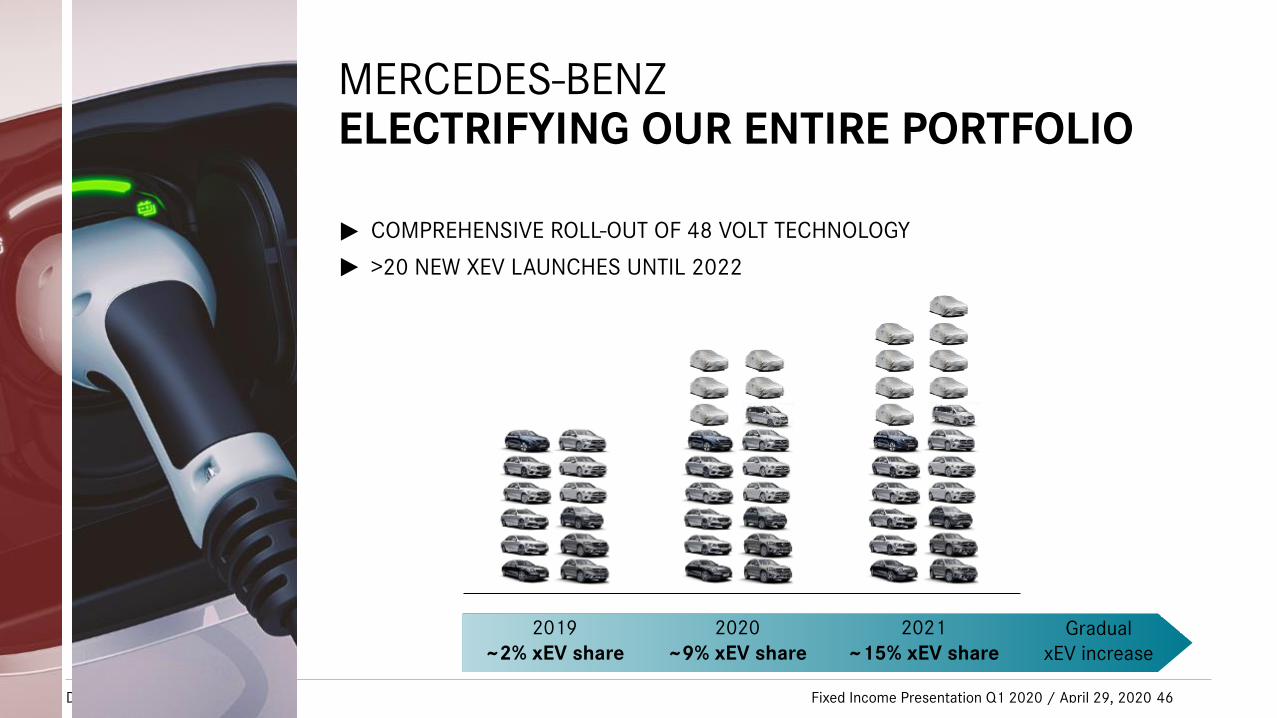
MERCEDES-BENZ ELECTRIFYING OUR ENTIRE PORTFOLIO
2019~2% xEV share
2020~9% xEV share
2021~15% xEV share
COMPREHENSIVE ROLL-OUT OF 48 VOLT TECHNOLOGY
>20 NEW XEV LAUNCHES UNTIL 2022▸▸
Gradual xEV increase
46Fixed Income Presentation Q1 2020 / April 29, 2020
Daimler AG
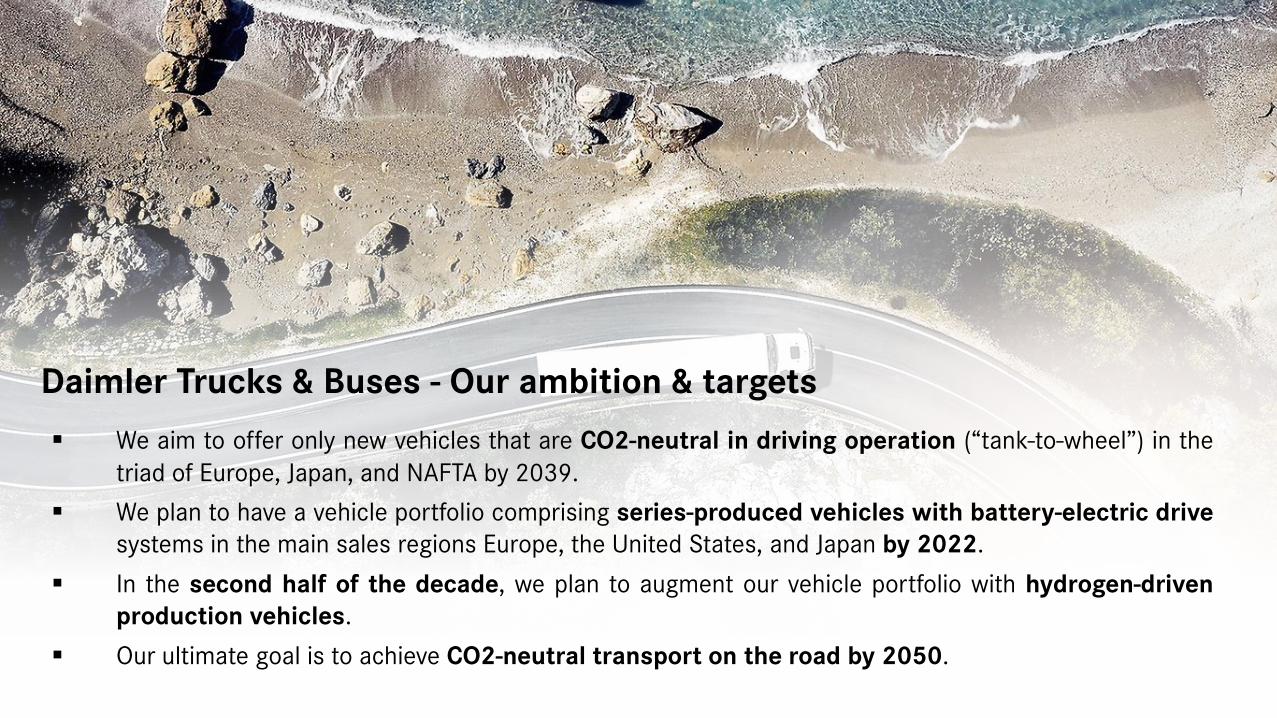
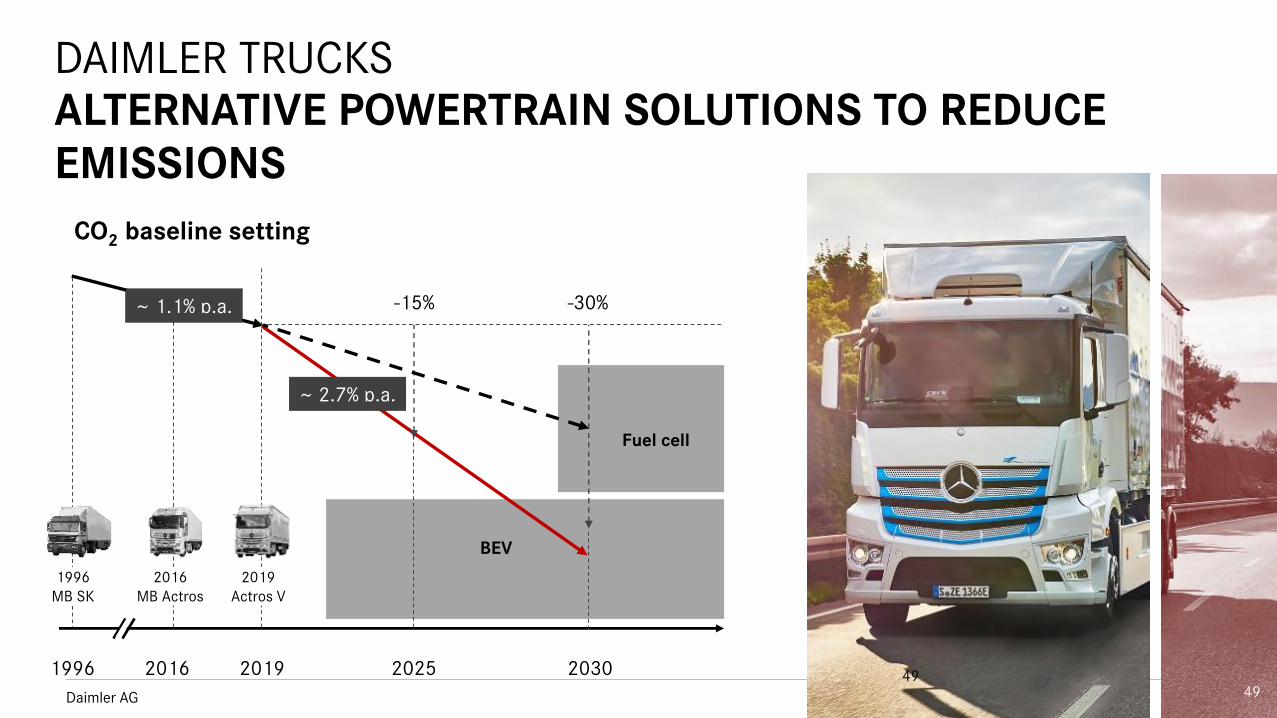
We aim to offer only new vehicles that are CO2-neutral in driving operation (“tank-to-wheel”) in the
triad of Europe, Japan, and NAFTA by 2039.
We plan to have a vehicle portfolio comprising series-produced vehicles with battery-electric drive
systems in the main sales regions Europe, the United States, and Japan by 2022.
In the second half of the decade, we plan to augment our vehicle portfolio with hydrogen-driven
production vehicles.
Our ultimate goal is to achieve CO2-neutral transport on the road by 2050.
Daimler Trucks & Buses - Our ambition & targets

Daimler AG
Daimler AG
DAIMLER TRUCKSALTERNATIVE POWERTRAIN SOLUTIONS TO REDUCE EMISSIONS
CO2 baseline setting
BEV
Fuel cell
1996 2016 2019 2025 2030
~ 1.1% p.a.
~ 2.7% p.a.
-15% -30%
1996 MB SK
2016 MB Actros
2019 Actros V
4949

Daimler AG
I.Daimler AG 2019
V.ADDITIONAL FINANCIAL
SLIDES
Fixed Income Presentation Q1 2020 / April 29, 2020 50 50
Daimler AG /
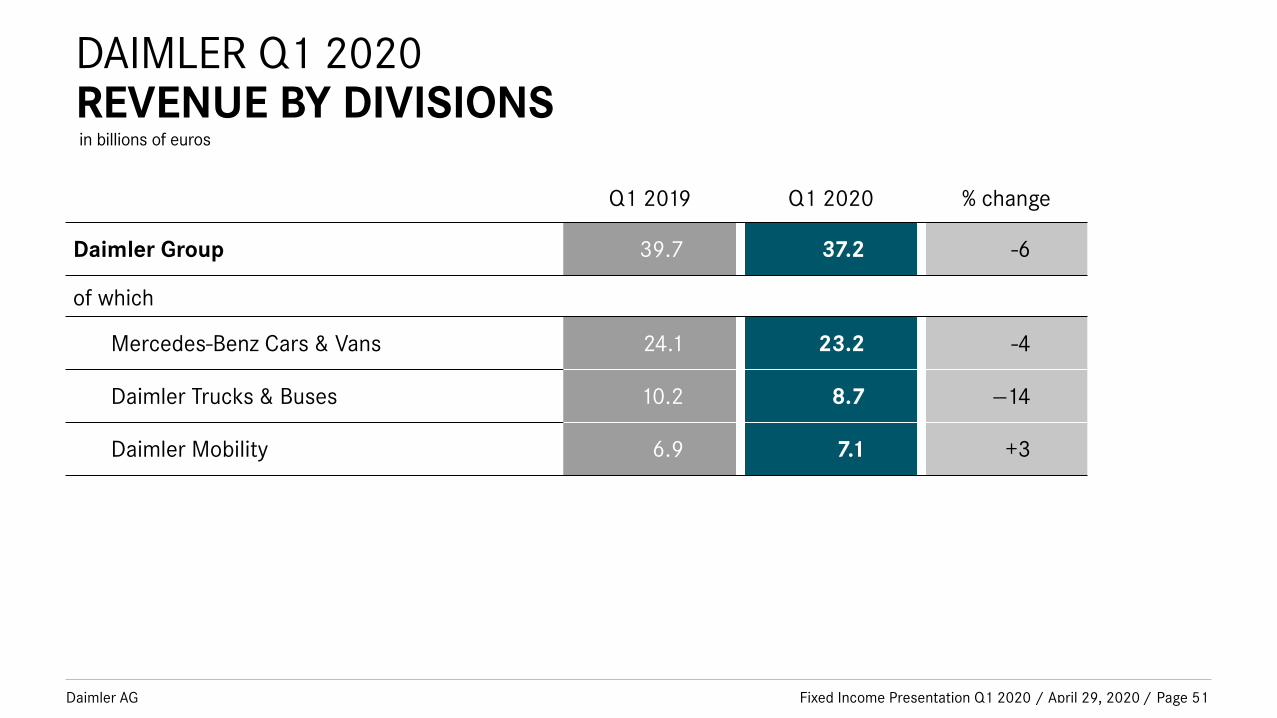
DAIMLER Q1 2020REVENUE BY DIVISIONS
Fixed Income Presentation Q1 2020 / April 29, 2020
Q1 2019 Q1 2020 % change
Daimler Group 39.7 37.2 -6
of which
Mercedes-Benz Cars & Vans 24.1 23.2 -4
Daimler Trucks & Buses 10.2 8.7 --14
Daimler Mobility 6.9 7.1 +3
Page 51
in billions of euros
Daimler AG /
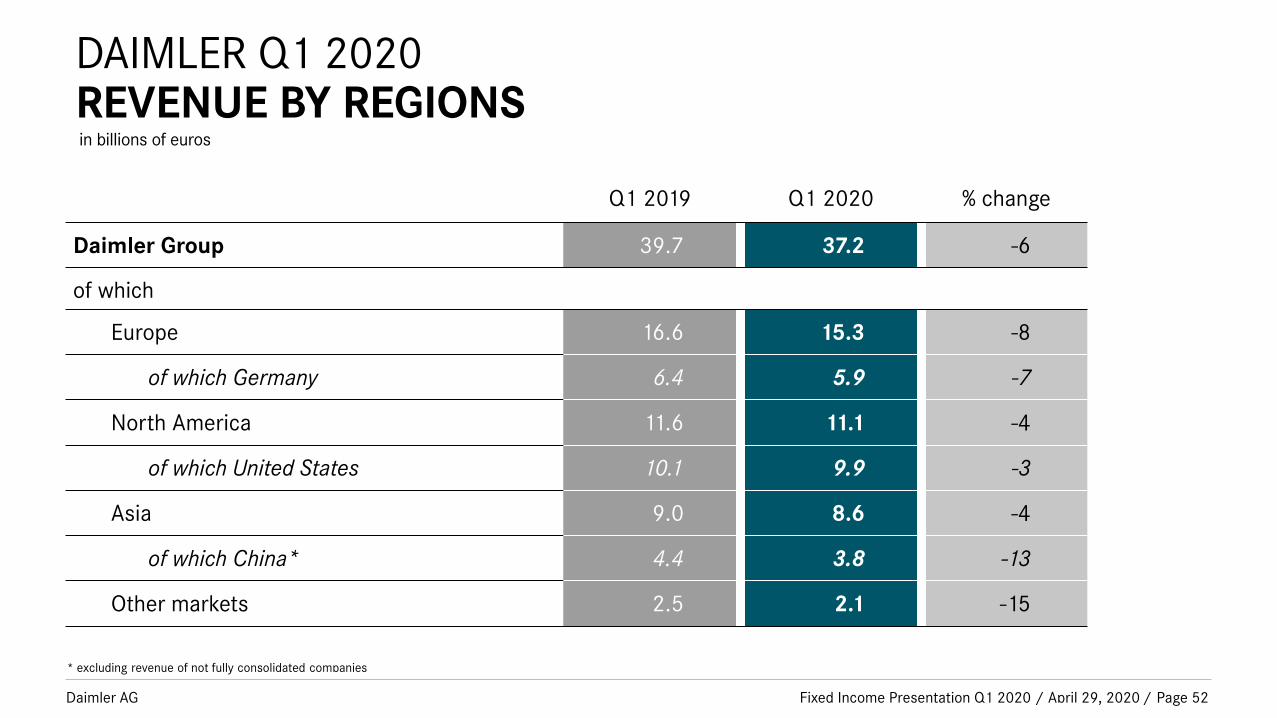
DAIMLER Q1 2020REVENUE BY REGIONS
Fixed Income Presentation Q1 2020 / April 29, 2020
Q1 2019 Q1 2020 % change
Daimler Group 39.7 37.2 -6
of which
Europe 16.6 15.3 -8
of which Germany 6.4 5.9 -7
North America 11.6 11.1 -4
of which United States 10.1 9.9 -3
Asia 9.0 8.6 -4
of which China* 4.4 3.8 -13
Other markets 2.5 2.1 -15
* excluding revenue of not fully consolidated companies
Page 52
in billions of euros
Daimler AG /
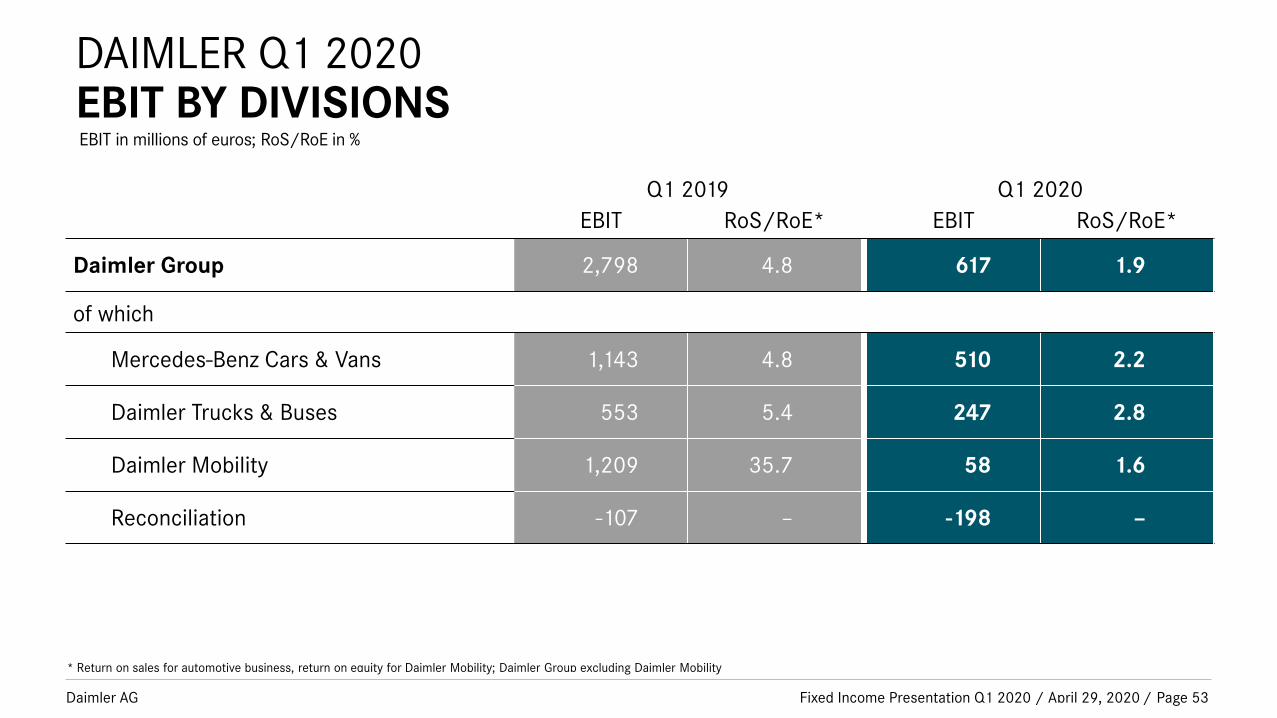
DAIMLER Q1 2020EBIT BY DIVISIONS
Fixed Income Presentation Q1 2020 / April 29, 2020
Q1 2019 Q1 2020
EBIT RoS/RoE* EBIT RoS/RoE*
Daimler Group 2,798 4.8 617 1.9
of which
Mercedes-Benz Cars & Vans 1,143 4.8 510 2.2
Daimler Trucks & Buses 553 5.4 247 2.8
Daimler Mobility 1,209 35.7 58 1.6
Reconciliation -107 – -198 –
* Return on sales for automotive business, return on equity for Daimler Mobility; Daimler Group excluding Daimler Mobility
Page 53
EBIT in millions of euros; RoS/RoE in %
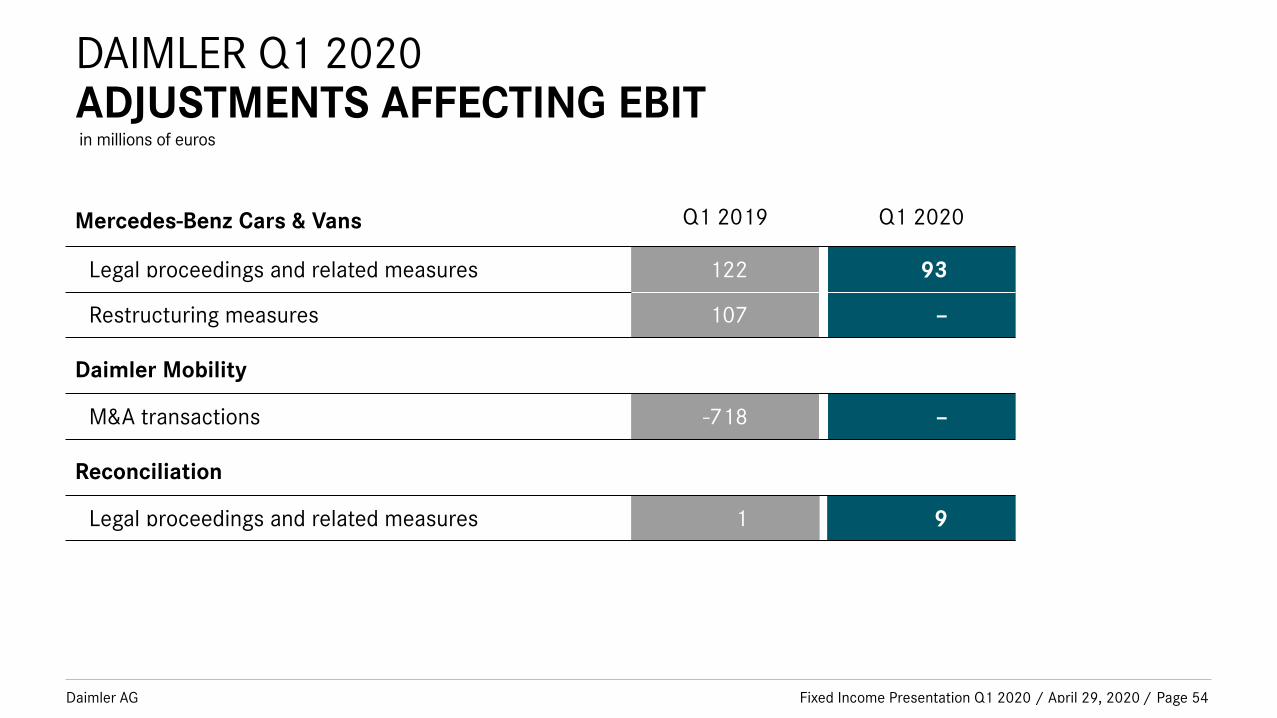
Daimler AG /
DAIMLER Q1 2020ADJUSTMENTS AFFECTING EBIT
Fixed Income Presentation Q1 2020 / April 29, 2020 Page 54
in millions of euros
Mercedes-Benz Cars & Vans Q1 2019 Q1 2020
Legal proceedings and related measures 122 93
Restructuring measures 107 –
Daimler Mobility
M&A transactions -718 –
Reconciliation
Legal proceedings and related measures 1 9
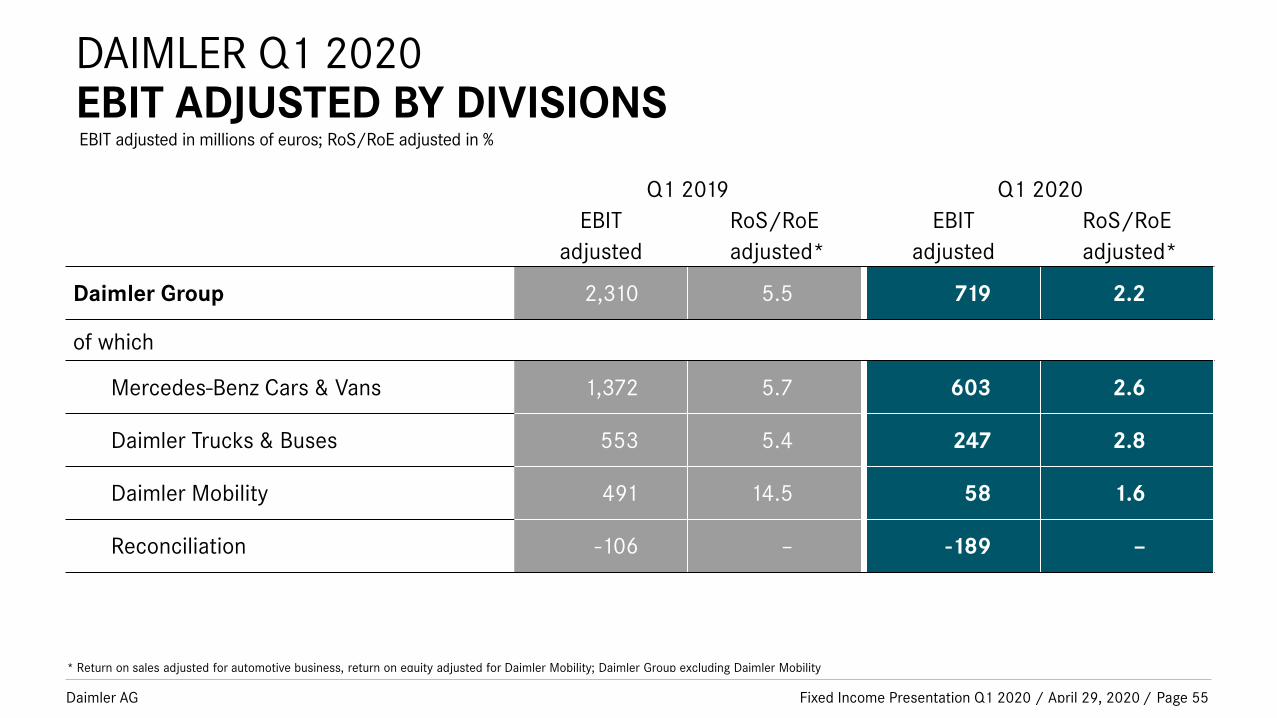
Daimler AG /
DAIMLER Q1 2020EBIT ADJUSTED BY DIVISIONS
Fixed Income Presentation Q1 2020 / April 29, 2020
Q1 2019 Q1 2020
EBIT
adjusted
RoS/RoE
adjusted*
EBIT
adjusted
RoS/RoE
adjusted*
Daimler Group 2,310 5.5 719 2.2
of which
Mercedes-Benz Cars & Vans 1,372 5.7 603 2.6
Daimler Trucks & Buses 553 5.4 247 2.8
Daimler Mobility 491 14.5 58 1.6
Reconciliation -106 – -189 –
* Return on sales adjusted for automotive business, return on equity adjusted for Daimler Mobility; Daimler Group excluding Daimler Mobility
Page 55
EBIT adjusted in millions of euros; RoS/RoE adjusted in %
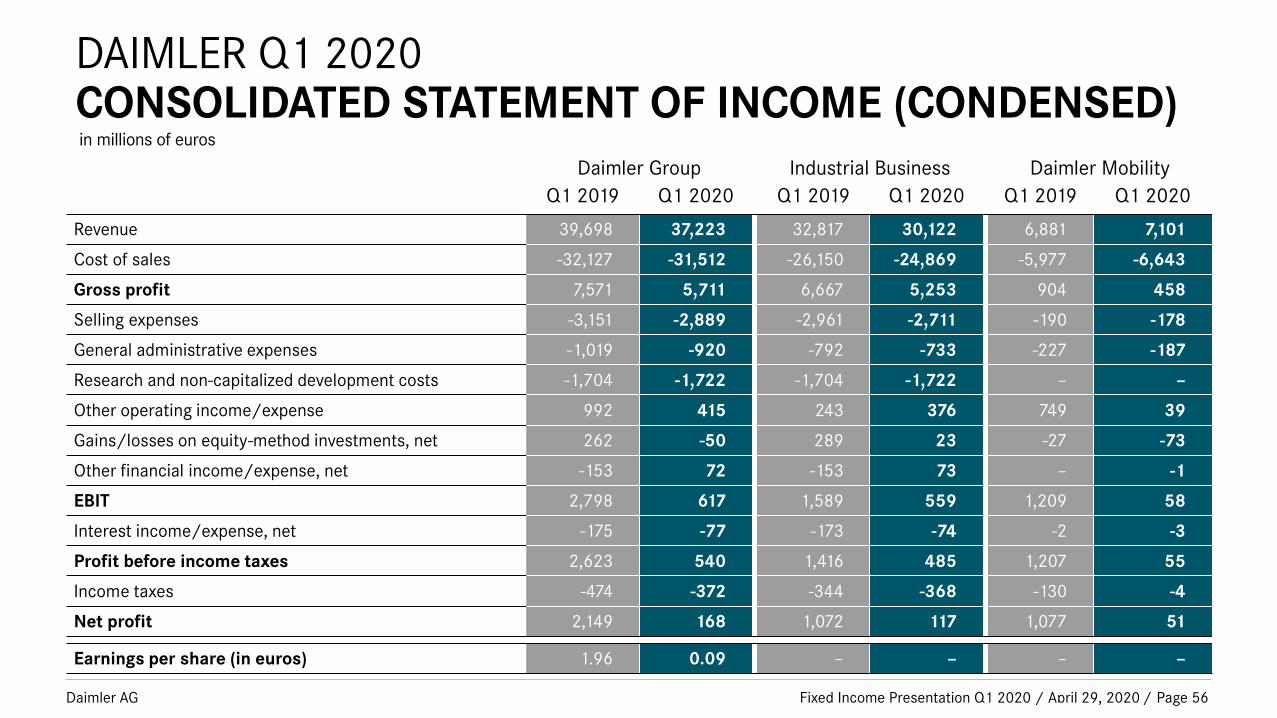
Daimler AG /
DAIMLER Q1 2020CONSOLIDATED STATEMENT OF INCOME (CONDENSED)
Fixed Income Presentation Q1 2020 / April 29, 2020
Daimler Group Industrial Business Daimler Mobility
Q1 2019 Q1 2020 Q1 2019 Q1 2020 Q1 2019 Q1 2020
Revenue 39,698 37,223 32,817 30,122 6,881 7,101
Cost of sales -32,127 -31,512 -26,150 -24,869 -5,977 -6,643
Gross profit 7,571 5,711 6,667 5,253 904 458
Selling expenses -3,151 -2,889 -2,961 -2,711 -190 -178
General administrative expenses -1,019 -920 -792 -733 -227 -187
Research and non-capitalized development costs -1,704 -1,722 -1,704 -1,722 – –
Other operating income/expense 992 415 243 376 749 39
Gains/losses on equity-method investments, net 262 -50 289 23 -27 -73
Other financial income/expense, net -153 72 -153 73 – -1
EBIT 2,798 617 1,589 559 1,209 58
Interest income/expense, net -175 -77 -173 -74 -2 -3
Profit before income taxes 2,623 540 1,416 485 1,207 55
Income taxes -474 -372 -344 -368 -130 -4
Net profit 2,149 168 1,072 117 1,077 51
Earnings per share (in euros) 1.96 0.09 – – – –
Page 56
in millions of euros
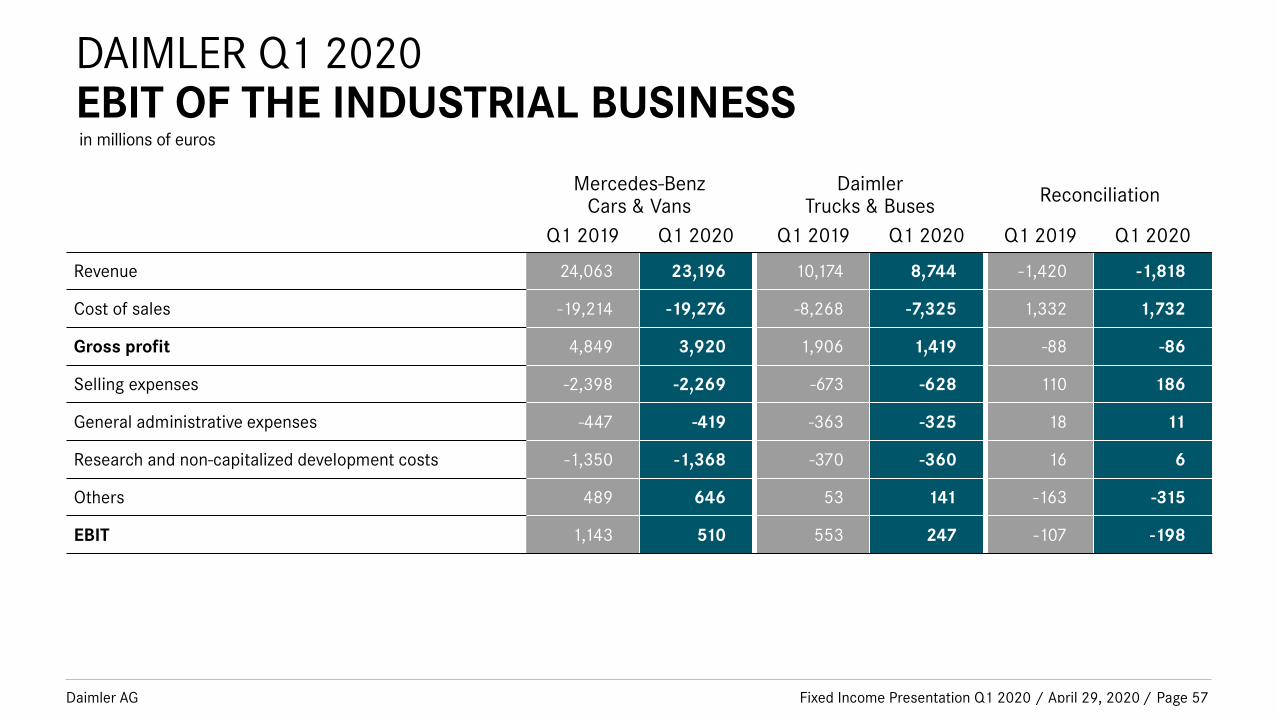
Daimler AG /
DAIMLER Q1 2020EBIT OF THE INDUSTRIAL BUSINESS
Fixed Income Presentation Q1 2020 / April 29, 2020 Page 57
in millions of euros
Mercedes-BenzCars & Vans
DaimlerTrucks & Buses
Reconciliation
Q1 2019 Q1 2020 Q1 2019 Q1 2020 Q1 2019 Q1 2020
Revenue 24,063 23,196 10,174 8,744 -1,420 -1,818
Cost of sales -19,214 -19,276 -8,268 -7,325 1,332 1,732
Gross profit 4,849 3,920 1,906 1,419 -88 -86
Selling expenses -2,398 -2,269 -673 -628 110 186
General administrative expenses -447 -419 -363 -325 18 11
Research and non-capitalized development costs -1,350 -1,368 -370 -360 16 6
Others 489 646 53 141 -163 -315
EBIT 1,143 510 553 247 -107 -198
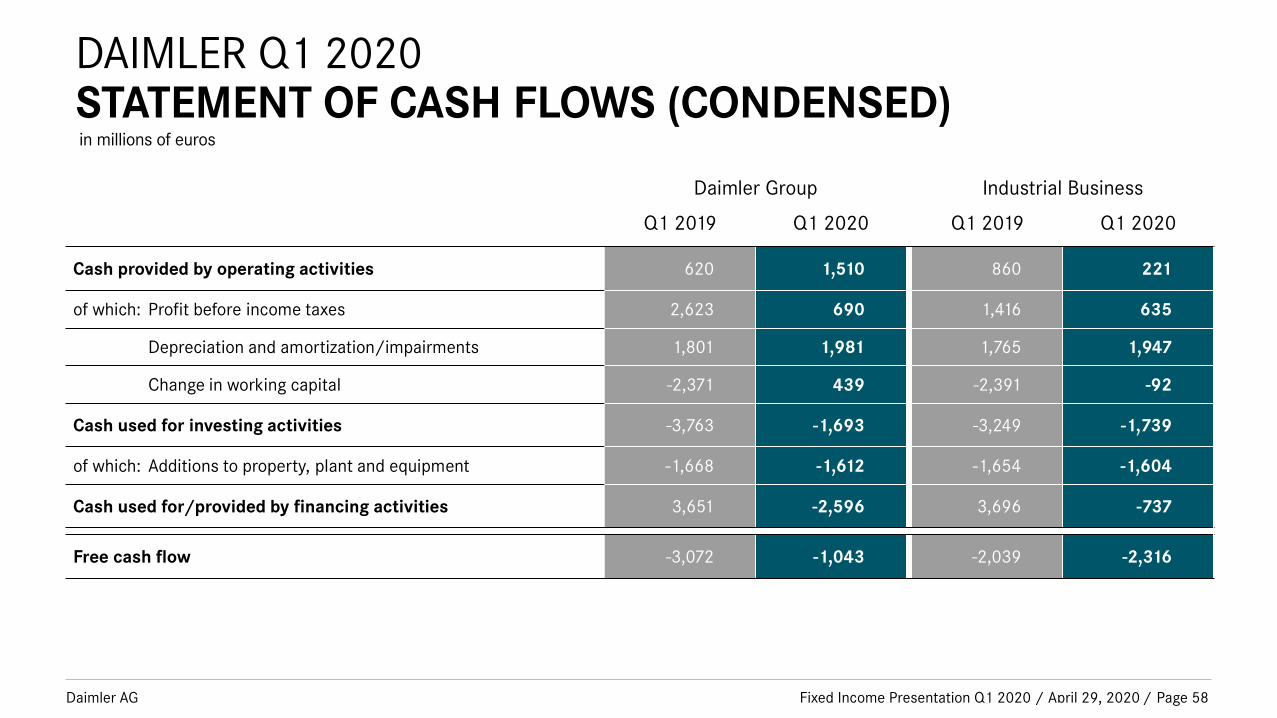
Daimler AG /
DAIMLER Q1 2020STATEMENT OF CASH FLOWS (CONDENSED)
Fixed Income Presentation Q1 2020 / April 29, 2020
Daimler Group Industrial Business
Q1 2019 Q1 2020 Q1 2019 Q1 2020
Cash provided by operating activities 620 1,510 860 221
of which: Profit before income taxes 2,623 690 1,416 635
Depreciation and amortization/impairments 1,801 1,981 1,765 1,947
Change in working capital -2,371 439 -2,391 -92
Cash used for investing activities -3,763 -1,693 -3,249 -1,739
of which: Additions to property, plant and equipment -1,668 -1,612 -1,654 -1,604
Cash used for/provided by financing activities 3,651 -2,596 3,696 -737
Free cash flow -3,072 -1,043 -2,039 -2,316
Page 58
in millions of euros
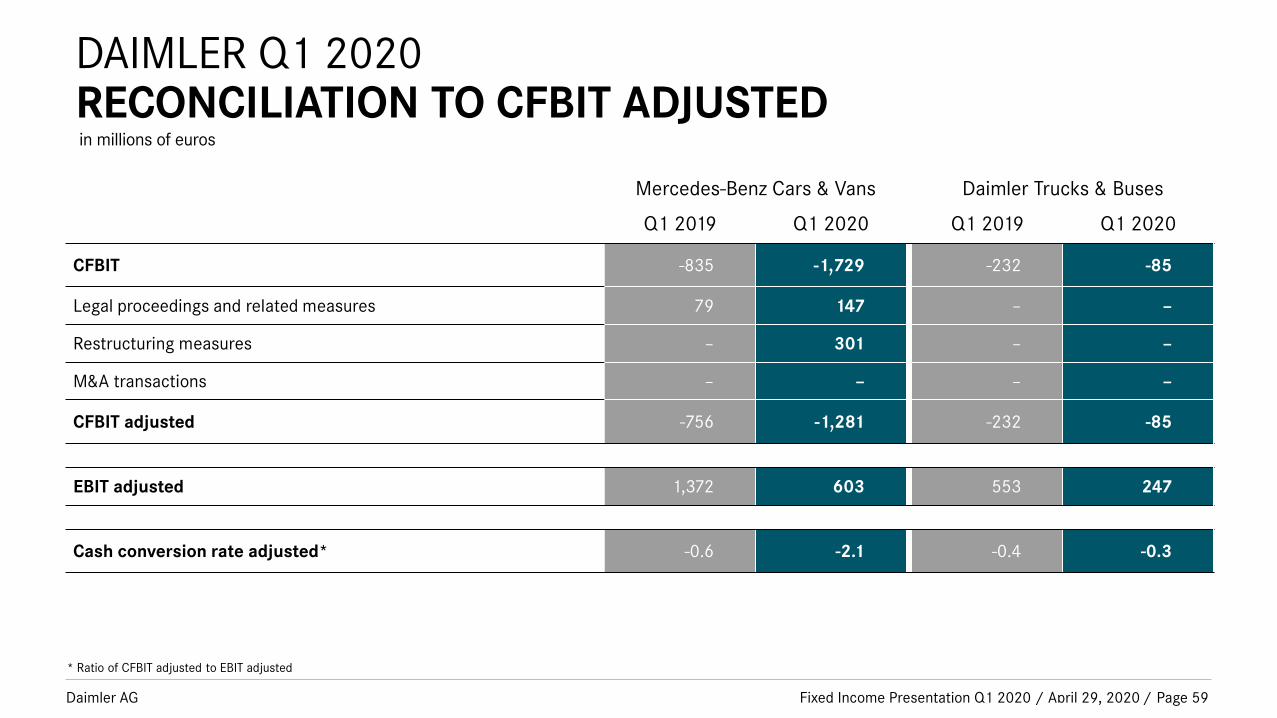
Daimler AG /
DAIMLER Q1 2020RECONCILIATION TO CFBIT ADJUSTED
Fixed Income Presentation Q1 2020 / April 29, 2020
Mercedes-Benz Cars & Vans Daimler Trucks & Buses
Q1 2019 Q1 2020 Q1 2019 Q1 2020
CFBIT -835 -1,729 -232 -85
Legal proceedings and related measures 79 147 – –
Restructuring measures – 301 – –
M&A transactions – – – –
CFBIT adjusted -756 -1,281 -232 -85
EBIT adjusted 1,372 603 553 247
Cash conversion rate adjusted* -0.6 -2.1 -0.4 -0.3
Page 59
in millions of euros
* Ratio of CFBIT adjusted to EBIT adjusted
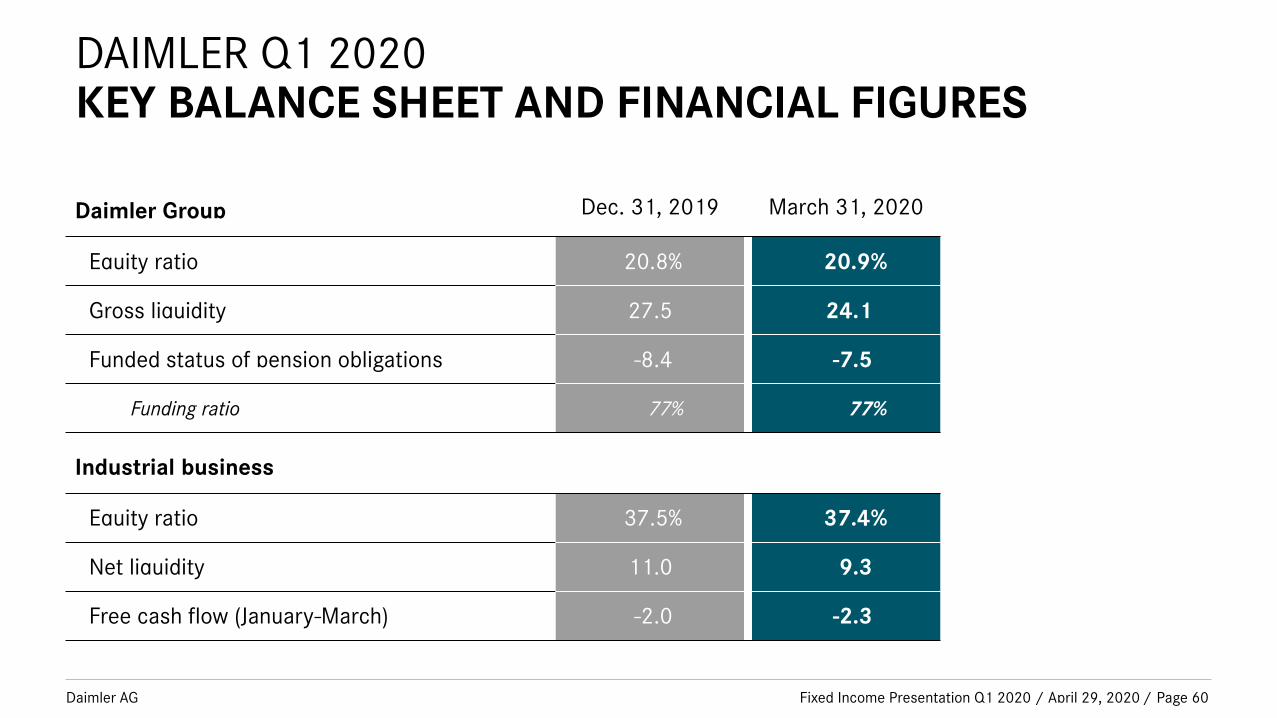
Daimler AG /
DAIMLER Q1 2020KEY BALANCE SHEET AND FINANCIAL FIGURES
Fixed Income Presentation Q1 2020 / April 29, 2020
Daimler Group Dec. 31, 2019 March 31, 2020
Equity ratio 20.8% 20.9%
Gross liquidity 27.5 24.1
Funded status of pension obligations -8.4 -7.5
Funding ratio 77% 77%
Industrial business
Equity ratio 37.5% 37.4%
Net liquidity 11.0 9.3
Free cash flow (January-March) -2.0 -2.3
Page 60
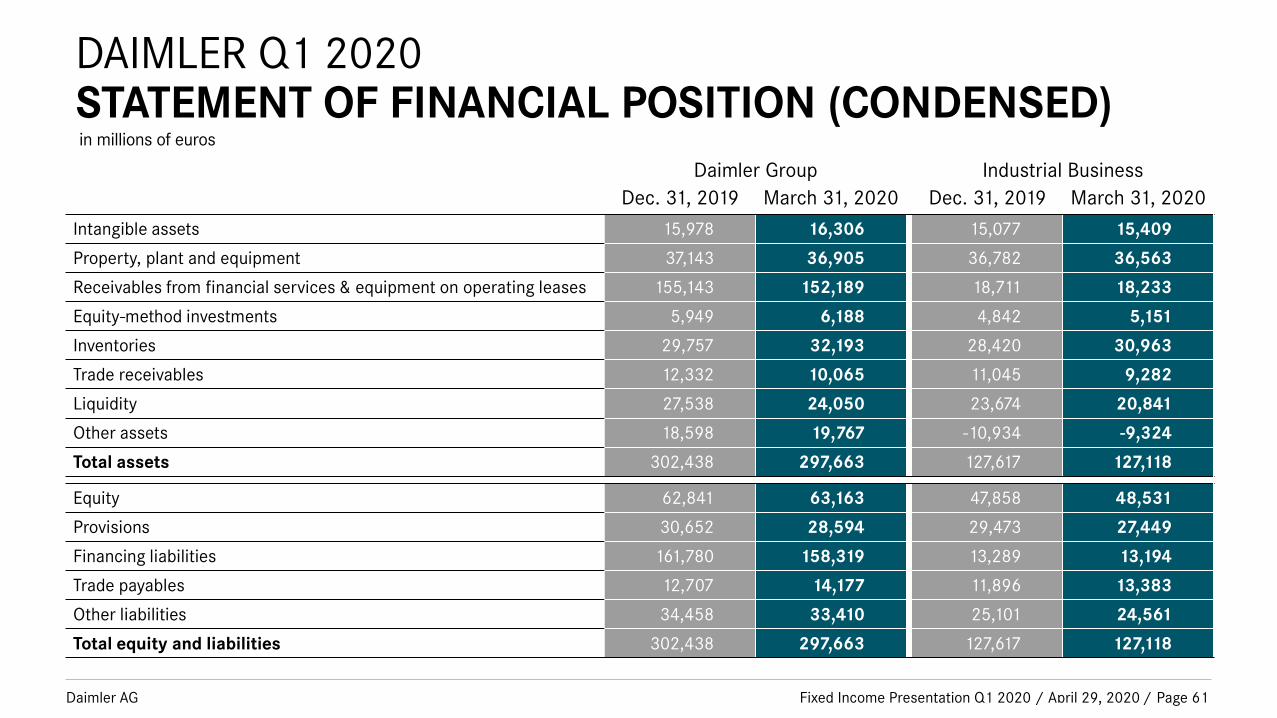
Daimler AG /
DAIMLER Q1 2020STATEMENT OF FINANCIAL POSITION (CONDENSED)
Fixed Income Presentation Q1 2020 / April 29, 2020
Daimler Group Industrial Business
Dec. 31, 2019 March 31, 2020 Dec. 31, 2019 March 31, 2020
Intangible assets 15,978 16,306 15,077 15,409
Property, plant and equipment 37,143 36,905 36,782 36,563
Receivables from financial services & equipment on operating leases 155,143 152,189 18,711 18,233
Equity-method investments 5,949 6,188 4,842 5,151
Inventories 29,757 32,193 28,420 30,963
Trade receivables 12,332 10,065 11,045 9,282
Liquidity 27,538 24,050 23,674 20,841
Other assets 18,598 19,767 -10,934 -9,324
Total assets 302,438 297,663 127,617 127,118
Equity 62,841 63,163 47,858 48,531
Provisions 30,652 28,594 29,473 27,449
Financing liabilities 161,780 158,319 13,289 13,194
Trade payables 12,707 14,177 11,896 13,383
Other liabilities 34,458 33,410 25,101 24,561
Total equity and liabilities 302,438 297,663 127,617 127,118
Page 61
in millions of euros