capital intensity in the large-scale manufacturing of...
TRANSCRIPT
135
Pakistan Economic and Social Review Volume XXXIX, No. 2 (Winter 2001), pp. 135-151
CAPITAL INTENSITY IN THE LARGE-SCALE MANUFACTURING OF PAKISTAN
RUKHSANA KALIM*
Abstract. The objective of this paper is twofold. First it tests the Sen’s proposition on the role of working capital in determining factor intensity. Second the future prospects of employment in the manufacturing sector are examined. Twenty-eight industries at a three-digit level of dis-aggregation in the manufacturing sector of Pakistan have been selected. We found no verification of Sen’s arguments on the role of working capital in affecting the degree of capital intensity in different industries. The analysis has shown that on average capital intensity is high in many industries and has increased over the period of time reflecting low employment potential in manufacturing sector.
I. INTRODUCTION From the employment point of view capital intensity is generally defined as the ratio of capital to labour used in a production process or industry at a given time: the higher the ratio the more is the capital intensity and vice versa. Generally developing countries are in shortage of capital hence minimizing capital intensity as an investment criterion is considered desirable. In practice, there are many factors involved in the choice of technique of production and a clear dichotomy between capital intensity and labour intensive techniques cannot be made. Nevertheless, some indicators have been used in economic literature to measure the degree of factor intensity in order to (a) study the variations in factor proportions; (b) examine the functional relationships between partial factor inputs and outputs; (c) analyze the efficiency in factor use and finally (d) see the prospects of employment in the sector. In pursuing almost the similar objectives, we will investigate the degree of factor intensity ill the large-scale manufacturing sector of Pakistan. *The author is Associate Professor at the Institute of Management Sciences, The University
of Lahore, 1 KM Raiwind Road, Lahore (Pakistan).
136 Pakistan Economic and Social Review
Earlier some studies have been done on the degree of capital intensity in the large-scale manufacturing sector of Pakistan. For example, Islam (1970) by using value-added per employee (VA/L) as an indicator of capital intensity measured capital intensity in the manufacturing sector of Pakistan for the year 1959-60. By comparing his estimates with the United States he found a high degree of capital intensity in Pakistan in the sense of having more than average VA per employee in Pakistan. Later, Khan (1970) measured the degree of capital intensity in twenty industries in Pakistan by using capital-labour ratios for the year 1962-63 on the basis of the CMI data. By comparing his estimates with the United States and Japan he also reached a startling conclusion that on average the capital intensities for Pakistan manufacturing were higher than for Japan or were close to the US ones. Hussain (1974), Kemal (1976a), Hamid (1978) and Afridi (1985) also reported a high degree of capital intensity in the manufacturing sector of Pakistan.
All the above-mentioned studies which used capital-labour (K/L) or capital-value-added (K/V) ratios as an indicator of capital intensity ignored the role of working capital completely. The inclusion of working capital in the value of fixed capital according to Sen (1972) affects not merely the absolute rates of surplus but also relative rates since it tends to have larger adverse effects on the surplus-ratio of less capital-intensive techniques. According to Sen (1975), two concepts must be differentiated, mechanization and capital intensity. The former is concerned with machinery and possibly other types of fixed capital, like buildings, excluding working capital. The latter includes working capital in the value of fixed assets. It might be the case that the ratio of working capital to physical capital in different industries may vary quite widely and will frequently tend to be higher for relatively less mechanized techniques (Sen, 1975, p. 47). Hence, the inclusion of working capital could make the ordering of capital intensity of different techniques quite different from that of mechanization (Sen, 1975, p. 48).
Moreover, all the above-mentioned authors with the exception of Kemal (1976a) used the unadjusted CMI data on the value of fixed assets and made no effort to adjust the data for underestimation of the capital stock.
Contrary to the earlier studies, this study takes into account the role of working capital along with the fixed capital and tests the Sen’s proposition on the importance of working capital in the measurement of capital intensity. An effort is also made to adjust the CMI data on the value of fixed assets (capital stock) for the price increases each year and for the underestimation for the years 1969-70 to 1989-90. The adjusted data of capital stock may
KALIM: Capital Intensity in the Large-Scale Manufacturing Sector 137
give us a better picture of the analysis of capital intensity in the manufacturing sector. The paper is organized as follows: Section II describes methodology and the procedure of collecting data. In Section III capital stock data is estimated and the CMI data on the value of fixed asset is adjusted accordingly. In Section IV the degree of capital intensity is estimated by using capital-labour and capital-value-added ratios for 28 industries for the years 1977-78 and 1984-85 respectively. A comparison in terms of variations in the degree of capital intensity is made between these two years. Finally, Section V concludes the major findings of the study.
II. METHODOLOGY AND DATA COLLECTION For measuring the degree of factor intensity two indicators, viz. capital-labour (K/L) ratios and capital-value-added (K/V) ratios are used in a broader sense. Keeping in view the importance of working capital (mentioned in Section I) we have summed the value of fixed assets (fixed capital) and working capital together. Thus two measures of capital labour ratios are provided. K1/L uses the value of fixed capital divided by the number of employees at a given time, whereas K2/L uses the sum of fixed and working capital divided by the number of employees. A similar procedure has been adopted in measuring capital-value-added (K/V) ratios. Value-added is the gross value-added at constant prices of 1975-76.
The value of capital stock is the adjusted net value of fixed assets (the details are followed in the next section). In the manufacturing sector this consists of the value of land, building, plant and machinery and other fixed assets (CMI 1984-85). The working capital (stock) includes the value of raw-materials, chemicals and dyes, spare parts, packing materials, fuels and other input materials, finished and finished products and by-products at the end of the year (CMI 1984-85). All the data is in constant prices of 1975-76.
We have made our estimates for twenty eighty three-digit industries of Pakistan for the year 1984-85. The estimates for the year 1977-78 will be used for comparative purposes. The selection of the year is dependent on the availability of data.
III. ESTIMATION OF CAPITAL STOCK Following the method of Vines, Muscatelli and Srinivasan (1990) a time series of net fixed asset (capital stock) for the periods of 1969-70 to 1989-90 has been constructed by the perpetual inventory method by using annual estimates of gross fixed capital formation (reported in the Pakistan Economic Surveys of different years) in conjunction with a depreciation value of 10
138 Pakistan Economic and Social Review
percent per annum as reported in the United Nations (1985) for the manufacturing sector of Pakistan.
The value of capital stock (K0) for the benchmark period (1969-70) has been arrived at by multiplying the estimated incremental capital-output ratio (assuming that average equals the marginal) by output of that year.
The incremental capital-output ratio (ICOR) of 2.5 was derived on the basis of a three year moving average of incremental output and gross fixed capital formation for the year 1969-70. To check the stability of ICOR we also estimated the ICORs for the periods of 1979-80 and 1985-86. While the ICOR remained unchanged at 2.5 for 1979-80, it showed an increase in 1985-86 (3.4). We also calculated an ICOR of 3.0 on the basis of a simple average of annual incremental output and investment for the periods of 1969-70 to 1989-90. Later we estimated the values of fixed assets by applying different ICORs and depreciation rates to check the stability of our estimates of the value of fixed assets. As the results are not substantially different from each other, it supports our view that this procedure is fairly realistic and robust. In order to adjust the capital stock values to a constant price basis the following identity has been used:
Kt = Kt–1 + It/Pt – dt (1)
Where
Kt = the capital stock at time t.
Kt–1 = the capital stock at previous year.
It = the gross fixed investment at time t.
Pt = the price index of year t based on 1975-76 prices.
It/Pt = the gross fixed investment at time t divided by the price index of year t.
dt = depreciation based on Kt–1.
The benchmark value of capital stock (K0) in 1969-70 is at the constant prices of 1975-76.
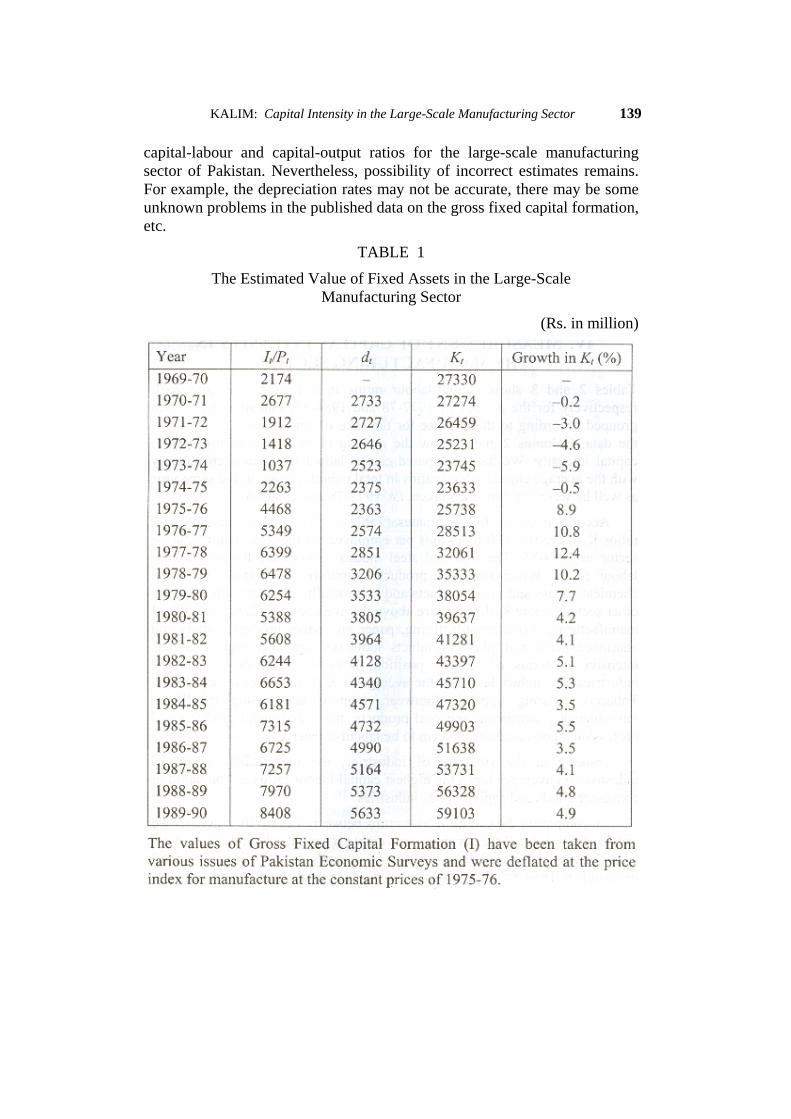
The calculated value of capital stock as shown in Table 1 takes into account price fluctuations in investment goods each year and is closer to the national accounts figures of the gross fixed investment. The annual average growth of capital stock according to our estimated values is 4% per annum during 1969-70 to 1989-90 using end point estimates. The use of these estimated values of capital stock will hopefully give a better picture of
KALIM: Capital Intensity in the Large-Scale Manufacturing Sector 139
capital-labour and capital-output ratios for the large-scale manufacturing sector of Pakistan. Nevertheless, possibility of incorrect estimates remains. For example, the depreciation rates may not be accurate, there may be some unknown problems in the published data on the gross fixed capital formation, etc.
TABLE 1
The Estimated Value of Fixed Assets in the Large-Scale Manufacturing Sector
(Rs. in million)
140 Pakistan Economic and Social Review
At a disaggregated level it is difficult to estimate the value of fixed assets for industries as there is no information on gross fixed investment by industry sectors. For the purpose of this exercise it has been assumed that the same ratio of capital stock between different industries (as reported in the CMI) holds and that the reported capital stock figures of all industries are biased downward/upward by the same aggregate ratio which we have discovered, an adjustment of the value of capital stock for all industries has been made. All the other data on working capital and gross value-added, however, have been taken from the CMI.
IV. MEASUREMENT OF CAPITAL INTENSITY IN THE MANUFACTURING SECTOR
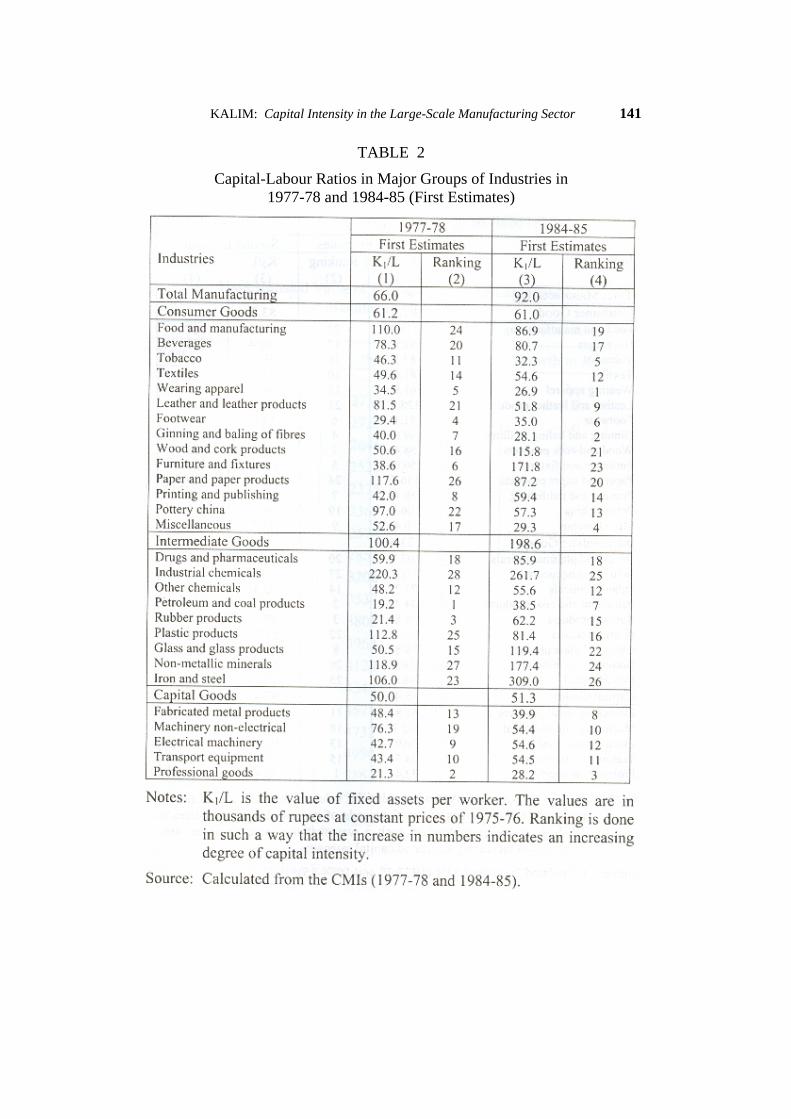
Tables 2 and 3 show capital-labour ratios in terms of K1/L and K2/L respectively for the periods of 1977-78 and 1984-85. Industries have been grouped according to the end use for the sake of convenience to analyzing the data. Columns 2 and 4 show the ranking of industries accordingly to capital intensity. We have compared capital-labour ratios in each industry with the average capital-labour ratios in total manufacturing in the same year as well between the two years taken, i.e. 1977-78 and 1984-85.
According to the first estimates (Table 2) the average capital-labour ratios K1/L are Rs. 92.0 thousands per employee for the total manufacturing sector in 1984-85. The iron and steel industry shows the highest capital-labour ratios. Wood and cork products, furniture and fixture, industrial chemicals, glass and glass products and non-metallic products industries are other sectors where K1/L ratios are above the average of K1/L ratios for total manufacturing. Food manufacturing, paper and paper products, drugs and pharmaceuticals and plastic products industries are also highly capital-intensive in terms of ranking position, however, K1/L ratios in these industries are slightly less than the average of K1/L ratios for all industries. Tobacco, wearing apparel, footwear, ginning and baling of fibres, miscellaneous, petroleum and coal products, fabricated metal products and professional goods industries seem to be labour-intensive.
Looking at the structure of industries, the intermediate group of industries on average shows the highest capital-labour ratios as compared to consumer goods and capital goods industries.
By comparing the capital-labour ratios between the two time periods we can see from Table 2 that average (unweighted) capital-labour ratios in total manufacturing increased from Rs. 66.0 thousands in 1977-78 to Rs. 92.0 thousands in 1984-85. The increase of K1/L in total manufacturing is 39%
KALIM: Capital Intensity in the Large-Scale Manufacturing Sector 141
TABLE 2
Capital-Labour Ratios in Major Groups of Industries in 1977-78 and 1984-85 (First Estimates)
142 Pakistan Economic and Social Review
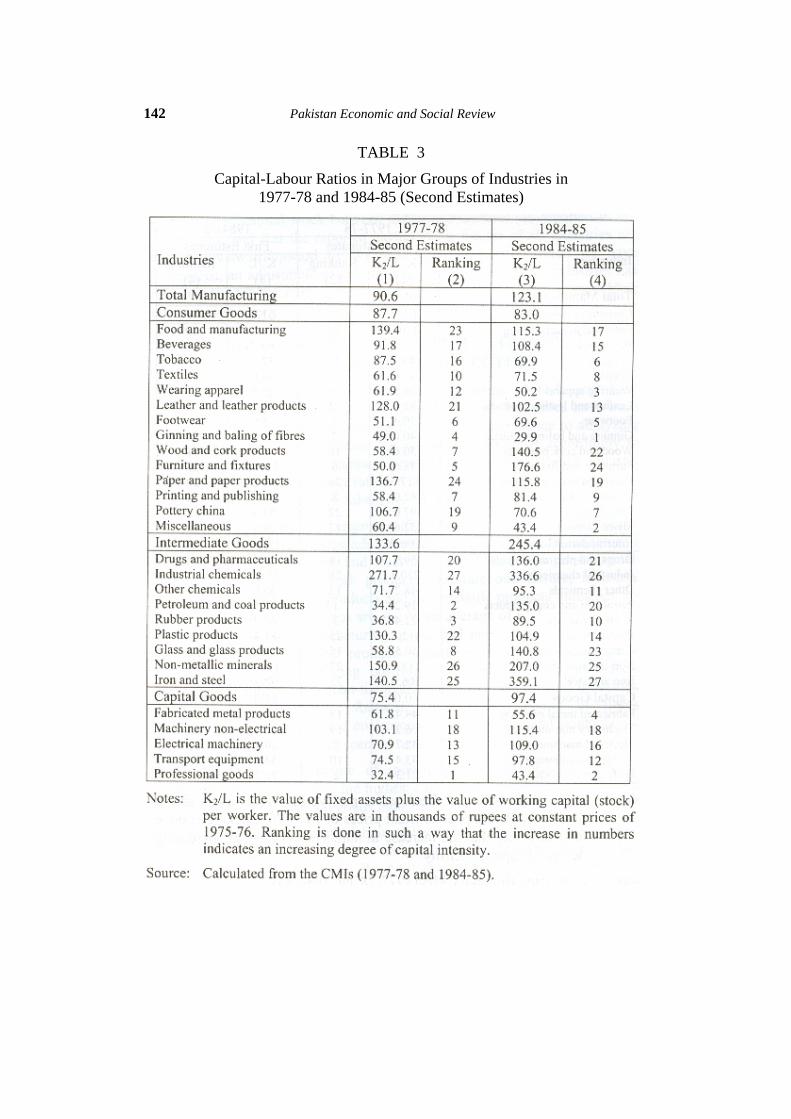
TABLE 3
Capital-Labour Ratios in Major Groups of Industries in 1977-78 and 1984-85 (Second Estimates)
KALIM: Capital Intensity in the Large-Scale Manufacturing Sector 143
while the capital stock increased by 48% (see Table 1) during 1977-78 to 1984-85 showing that the employment must have increased by 6.5% (48%–39%). Looking at the aggregate employment figures (459,000 in 1977-8 and 492,000 in 1984-85) the increase is 7% for the periods of 1977-78 to 1984-85 (calculated from the CMI of the respective years) showing our estimates of capital-labour ratios are robust.
Among consumer goods industries capital-labour ratios have increased in six out of fourteen industries, viz. beverages, textiles, footwear, wood and cork products, furniture and fixtures, and printing and publishing. The increase in capital-labour ratios is substantial in two industries, viz. wood and cork products and furniture and fixture. The increase in capital-labour ratios in these industries may be due to the high growth of industrial real wages which according to one study was 7.6% per annum during 1976-1981 (Noman, 1988, p. 162), thus, inducing the investors to substitute capital for labour. There is also the possibility that the new plants may be using modern and imported techniques of production thus indicating increased capital-labour ratios. However, the overall decline in capital-labour ratios in the rest of the consumer goods industries has offset the overall increase in these ratios in some industries with the result that overall capital-labour ratios in the consumer goods industry group almost remained the same during 1977-78 to 1984-85. The overall decline in capital-labour ratios in some consumer goods industries may be associated with the increased utilization of capacity.
With the exception of plastic products, almost all the intermediate group of industries show a substantial increase in capital-labour ratios. The highest variations in capital-labour ratios have occurred in the iron and steel industry followed by rubber products, glass and glass products, and non-metallic mineral products industries etc.
The capital-labour ratios on average in capital goods industries have slightly increased from Rs. 50.0 to Rs. 51.3 thousands per employee. The capital-labour ratios have increased in the electrical machinery, transport equipment, and professional goods industries while in the fabricated metal products and non-electrical machinery these have declined.
A comparison of the 2 years indicates that the average capital-labour ratios have remained the same in consumer goods industries while these have increased slightly in capital goods industries. A major role in increasing the average capital-labour ratios in total manufacturing sector in 1984-85 as compared to 1977-78 has been played by the intermediate group of industries. Our analysis is consistent with Hamid’s analysis who also found
144 Pakistan Economic and Social Review
the highest capital-labour ratios in the intermediate group of industries in 1975-76 (See Hamid, 1978, p. 10).
We have found low capital intensity in terms of K1/L ratios in capital goods industries. Khan (1970) and Hamid (1978) also had the similar findings.
Looking at Table 3 the estimates of capital intensity in terms of K2/L show that these have increased from Rs. 90.6 thousands in 1977-78 to Rs. 123.1 thousands in 1984-85. The rank correlation between K1/L and K2/L in 1984-85 is 0.87. The ranking position according to the second estimates across industries did not change significantly except in the petroleum and coal products industry in 1984-85. With the exception of this industry we have found no significant evidence that lower mechanization in terms of K1/L ratios is characterized by higher capital intensity in terms of K2/L ratios and in general found no support for Sen’s (1972) concern. In the petroleum and coal products industry, the ratio of working capital to fixed assets appears to be very high where K2/L ratios are above average of K2/L ratios for total manufacturing as compared to K1/L ratios which are less than average of K1/L ratios for total manufacturing in 1984-85. The ratio of working capital to fixed capital stock in the petroleum and coal industry was 2.55 in 1984-85 (calculated from our estimated data on physical capital and the reported CMI data on working capital) which reflects the fact that the petroleum and coal industry may carry a very large stocks of raw materials as compared to the fixed assets so its ranking position in the second estimates changed significantly.
On the basis of percentage changes in K2/L over K1/L on average there is no conclusive evidence that labour-intensive firms use relatively more capital in the form of stocks as pointed out by Sen (1972).
Some observations can be made with respect to the analysis of capital-labour ratios. As a particular point of time these observed capital labour ratios reflect a large number of historical circumstances relating to factor prices, ex ante technological possibilities etc. Between two time periods the overall increase in capital-labour ratios in 1984-85 as compared to 1977-78 shows that capital intensity has increased and that on average, workers have more capital stock to work with. Different industries are showing a different degree of capital intensity. Many reasons can be assigned to the wide variations in capital-labour ratios at the disaggregate level. For example, the increase in relative factor prices may have led industries to substitute capital for labour. How far these industries are responsive to changes in relative factor prices is an empirical question which can only be answered by the
KALIM: Capital Intensity in the Large-Scale Manufacturing Sector 145
estimation of the elasticity of substitution between capital and labour with respect to relative factor prices. In the case of developing countries there is sufficient empirical evidence to indicate that the elasticity of substitution in the manufacturing sector is positive which indicates that relative factor prices can play an important role in determining capital-labour ratios (among many others see, for instance, Roamer, 1975; Kim, 1984 and Malik et al., 1989). The use of more advanced technology might have increased capital-labour ratios in some industries. However, there are many other factors as well which may lead to high capital-labour ratios. For example, an increase in under-utilization of capacity across industries between the two time periods might have affected capital-labour ratios and which may not be easy to identify empirically (see Bhalla, 1975).
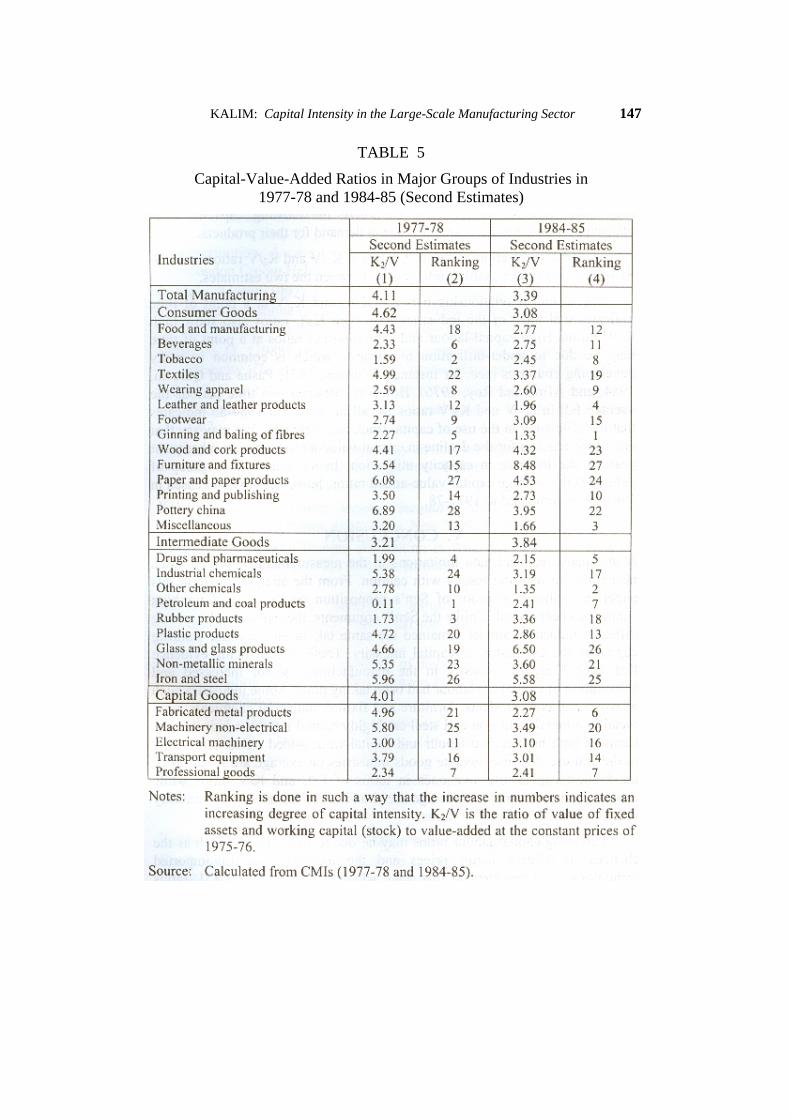
For calculating capital-value added ratios, the two methods have been used again, K1/V shows the ratio of fixed assets to value-added, while K2/V shows the ratio of fixed and working capital to value-added {see Tables 4 and 5 respectively). As there is no output indices for each and every item, we have deflated value-added by the wholesale price index of 1975-76.
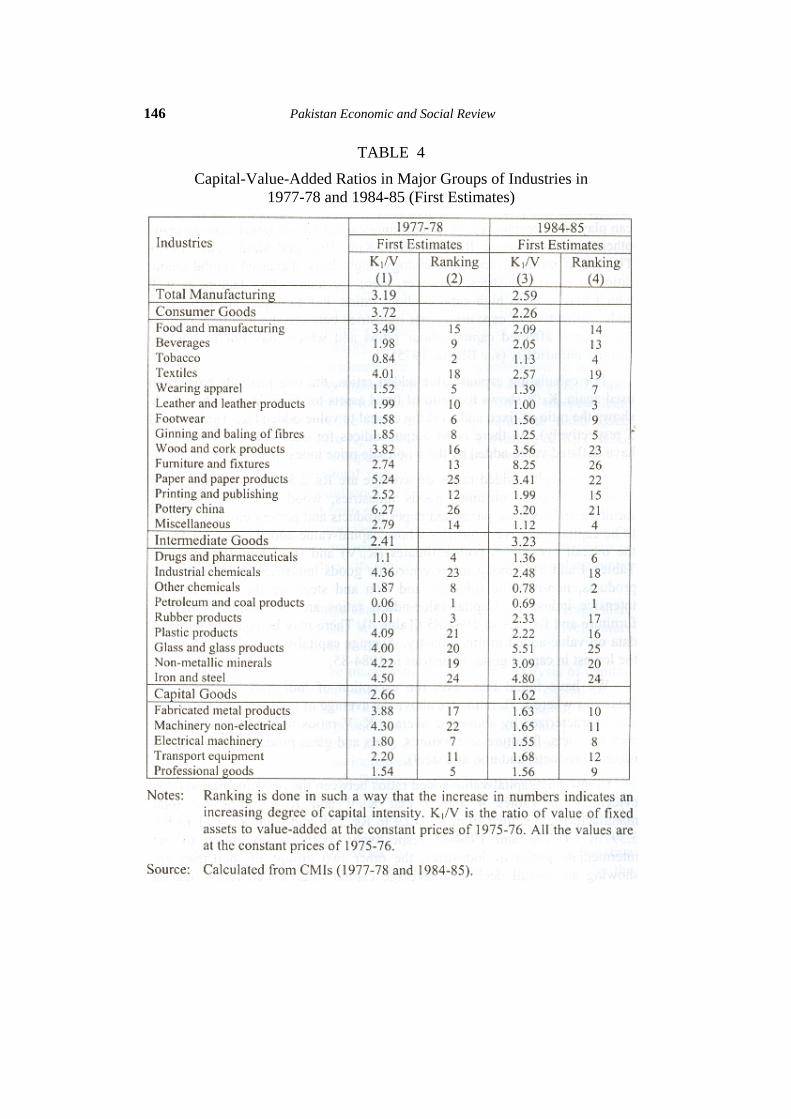
Capital-value-added ratios on average are Rs. 2.59 for all industries in 1984-85. Among consumer goods industries, wood and cork products, furniture and fixtures, paper and paper products and pottery china are found to be capital-intensive industries whose capital-value-added ratios are above the overall average in both estimates (K1/V) and (K2/V) in 1984-85 (see Tables 4 and 5). Among the intermediate goods industries, glass and glass products, non-metallic minerals and iron and steel are the most capital-intensive industries. Capital-value-added ratios are exceptionally high in furniture and fixtures in 1984-85 (Table 4). There may be some problem of data on value-added in this industry. Average capital-value-added ratios are the lowest in capital goods industries in 1984-85.
We have found that, with the exception of industrial chemicals the industries where K1/L ratios are above the average of total manufacturing are also characterized by above the average K1/V ratios in 1984-85 (wood and cork products, furniture and fixtures, glass and glass products, non-metallic mineral products, and iron and steel).
Comparing capital-value-added ratios between the two time periods it is evident from Tables 4 and 5 that K1/V and K2/V ratios for total manufacturing declined from Rs. 3.19 to Rs. 2.59 and from Rs. 4.11 to Rs. 3.39 in 1977-78 and 1984-85 respectively. With the exception of the intermediate group of industries, the other two groups of industries are showing an overall decline in average capital-value added ratios during
146 Pakistan Economic and Social Review
TABLE 4
Capital-Value-Added Ratios in Major Groups of Industries in 1977-78 and 1984-85 (First Estimates)
KALIM: Capital Intensity in the Large-Scale Manufacturing Sector 147
TABLE 5
Capital-Value-Added Ratios in Major Groups of Industries in 1977-78 and 1984-85 (Second Estimates)
148 Pakistan Economic and Social Review
1977-78 and 1984-85. The overall decline in K1/V ratios in 1984-85 indicates that the efficiency in the use of capital stock has increased. The increase in the cost of capital after 1970s (see Planning Commission, 1978) may have induced entrepreneurs to utilize the existing capacity more efficiently in order to meet any increase in demand for their products.
The rank correlation coefficient between K1/V and K2/V ratios in 1984-85 is 0.87 and shows a strong relationship between the two estimates.
The technical relationship between K1/L and K1/V at a point of time indicates that most of the industries with high K1/L ratios also show high K1/V ratios. High capital-labour and capital-output ratios at a point of time may be due to under-utilization of capacity which is common in many developing countries (see, for instance, Winston, 1971; Pasha and Qureshi, 1984; and Afroz and Roy, 1976). However, between two time periods the average fall in K1/V and K2/V ratios for all industries in 1984-85 indicates that the efficiency in the use of capital stock has increased. We may say that one of the reasons for the decline in capital-value-added ratios in subsequent years is the increase in capacity utilization. In the intermediate group of industries the average capital-value-added ratios, however, have increased in 1984-85 as compared to 1977-78.
V. CONCLUSION Many theoretical and data limitations in the measurement of capital stock necessitate to read the results with caution. From the analysis made in this paper, no substantial proof of Sen’s proposition on the role of working capital has been found. Unlike the Sen’s arguments, the ranking order among different industries almost remained the same taking into account working capital in the estimation of capital intensity. There is convincing evidence that overall capital intensity in the manufacturing sector increased and substitution of capital for labour had been taking place. Some industries such as wood and cork products, furniture and fixture, industrial chemicals, non-metallic minerals and iron and steel are highly capital intensive industries in terms of both high capital-labour and capital-value-added ratios. According to the end use, the intermediate goods industries on average are found to be the highest capital-intensive ones in terms of K/L and K/V ratios while capital goods industries on average are showing the lowest capital intensity in terms of the K/L and K/V ratios.
Increasing capital-labour ratios may be due to many factors such as the changes in relative factor prices and the increased use of imported technology. It is not clear at this stage whether the changes in K/L ratios

KALIM: Capital Intensity in the Large-Scale Manufacturing Sector 149
were driven by the changes in technology or by relative factor prices. This would require a detailed analysis of the features of technology and the form of the production function in the manufacturing sector.
On average the escalation in capital intensity over the two time periods taken (1977-78 and 1984-85) indicates that the overall future employment prospects in the sector are bleak.
150 Pakistan Economic and Social Review
REFERENCES
KALIM: Capital Intensity in the Large-Scale Manufacturing Sector 151