capital flow volatility and systemic risk in emerging markets… · risk in emerging markets: ......
TRANSCRIPT
91Dealing with the Challenges of Macro Financial Linkages in Emerging Marketshttp://dx.doi.org/10.1596/978-1-4648-0002-3
Capital Flow Volatility and Systemic Risk in Emerging Markets: The Policy ToolkitStijn Claessens and Swati R. Ghosh*
C h a p t e r 3
Introduction
As the global financial crisis has shown, reaping the benefits of financial develop-ment and international financial integration without incurring large risks remains a key challenge for many countries around the world. The financial system is inherently procyclical, that is, it tends to amplify the business cycle. Faced with a positive shock, financial institutions and markets can behave in the same man-ner, fuelling asset price and credit booms, and leading to a generalized expansion of economic activity. When the cycle turns, asset prices decline, credit gets reduced, and the economy can slow down. In the extreme, disturbances can lead to financial crises with major real sector dislocations and large fiscal costs. This procyclicality and risk of financial crises importantly relates to various aspects of international financial integration, with capital flows often being quite volatile.
In advanced countries (ACs), the buildup in banking systems’ vulnerabilities prior to the recent crisis took place through complex chains of credit intermedia-tion and involved large gross capital flows. Global banks (particularly European banks) were key players in this process, raising funds on U.S. wholesale markets and then lending these funds back to U.S. residents through purchases of securi-tized claims on U.S. borrowers, mostly related to residential mortgages (Shin 2012). Although net capital inflows—that is, the net of gross inflows and out-flows—were relatively small, gross exposures ended up very large.1 The shock
* Stijn Claessens is an Assistant Director with the Research Department of the International Monetary Fund (IMF). Swati r. Ghosh is an Adviser with the Poverty Reduction and Economic Management Vice Presidency, World Bank. The authors are grateful to Roxana Mihet, Lindsay Mollineaux, and Ezgi Ozturk for excellent research assistance and to Amar Bhattacharya for extensive discussions and suggestions on an earlier version of this chapter. The views expressed here are those of the authors and should not be attributed to the IMF or the World Bank, or their respective executive directors or management.
92 Capital Flow Volatility and Systemic Risk in Emerging Markets: The Policy Toolkit
Dealing with the Challenges of Macro Financial Linkages in Emerging Marketshttp://dx.doi.org/10.1596/978-1-4648-0002-3
that originated in the U.S. subprime market quickly affected many financial systems around the world. Because banks were vulnerable on their funding side to wholesale markets and developments in the U.S. dollar shadow-banking sys-tem, liquidity shortages spread quickly. These disturbances led to major real sec-tor dislocations as the tightening of funding spurred a downward cycle of balance sheet contractions and deleveraging, declining asset prices, sharp curtailment in global trade, and declining economic activity.
In the wake of the crisis, countries are undertaking many efforts to improve their financial systems, strengthen resilience to shocks (including to those origi-nating internationally), and reduce the natural tendency for financial systems to display procyclical behavior. The international financial architecture is also being modified to help reduce spillovers. Although not yet finished, this agenda has already shown some results (see FSB 2012 for an overview of achievements and areas of remaining needed reforms). Emerging markets (EMs), however, face even greater challenges in dealing with international financial integration and cross-border flows, for several reasons.
First, EMs tend to receive capital flows that, even in net terms, are large rela-tive to their domestic economies and overall absorptive capacity—especially rela-tive to the size and depth of their financial systems.2 On average, net private capi-tal flows relative to M2 over 2000–10, for example, have been many times larger for EMs than for ACs. Similarly, financial flows are much larger as a share of their domestic capital markets for EMs than for ACs. Second, EMs are more prone to (larger) shocks, in part because their economies are smaller and less diversified, and because they have less domestic economic and political stability. In addition, shocks of any kind—positive or negative, external or domestic in origin—are exacerbated and propagated more easily in EMs because of structural and insti-tutional characteristics (such as weak enforcement of property rights and poor information infrastructures). In particular, large capital inflows—much of which are intermediated through banking systems—tend to interact with and amplify the domestic financial and real business cycles to a greater extent than in ACs.
Unless managed properly, international financial integration thus poses serious challenges to economic and financial sector stability in EMs. This chapter exam-ines these challenges. It first empirically investigates the interactions of capital flow surges and stops, domestic financial cycles and financial crises in EMs with their real sector (business) cycles, and compares these to those in ACs. These findings build on earlier work (Claessens, Kose, and Terrones 2011; Claessens and Ghosh 2012) which showed that business cycles and financial cycles are much more volatile in EMs than in ACs. That work highlighted how adverse financial cycles combined with recessions, although not necessarily more frequent or lon-ger, tend to lead to worse and deeper losses in EMs than in ACs. Conversely, recoveries combined with favorable financial cycles tend to be stronger (and faster) in EMs than in ACs. We expand on those insights by also considering cycles in capital flows and financial crises, which allow us to compare the impli-cations of various types of financial events for the real economy and across the two groups of countries. Our data indicate that capital flow surges and sudden
Capital Flow Volatility and Systemic Risk in Emerging Markets: The Policy Toolkit 93
Dealing with the Challenges of Macro Financial Linkages in Emerging Marketshttp://dx.doi.org/10.1596/978-1-4648-0002-3
capital outflows are the financial events associated with the greatest amplifica-tion in business cycles in EMs.
Because the comparison of financial events in relation to the behavior of busi-ness cycles highlights the importance of capital flows in EMs, we analyze the macroeconomic challenges and buildups of domestic financial sector vulnerabil-ity during large surges of capital inflows. These vulnerabilities can generate sys-temic risks that manifest themselves in the face of shocks (domestic or external in origin) that can trigger capital outflows or “sudden stops” and downturns in financial and economic cycles. We then examine the broad policy toolkit available to EMs, including macro prudential measures, taking into account the character-istics of EMs. We conclude that EMs are likely to have to use a more heterodox mix of policy tools, notably including macro prudential policies, but also capital flows management (CFM) tools.3
The chapter is organized as follows. The first section analyzes the nature of the links between various financial cycles—domestic financial (credit) and asset prices cycles, and capital-flow movements—and crises and domestic business cycles, comparing across types of financial events and between EMs and ACs. As this analysis highlights the important role of capital flows in affecting the busi-ness cycles in emerging markets, the next section focuses on the determinants and behavior of capital flows and the role that domestic banking sectors play in intermediating such capital flows. It documents in particular the dimensions of increased macro and financial sector vulnerability associated with large surges in capital inflows. The third section discusses the broad policy toolkit available to deal with these vulnerabilities, including macroeconomic management and macro prudential and capital flow management policies. The last section con-cludes the chapter.
the Interplay between Domestic Financial Capital Flows and Business Cycles
This section reviews the empirical record of how financial events and business cycles interact in a large sample of countries and compares these interactions for EMs with those for ACs.
Samples and MethodologyWe studied business cycles and financial events in 61 countries (23 ACs and 38 EMs) using as much as possible quarterly data. The methodology we employed to identify the business and domestic financial cycles focused on changes in the levels of variables. A recession (expansion) begins just after the economy reaches a peak (trough) and ends as the economy reaches a trough (peak).4 Recoveries can be measured either by the time it takes to reach the level of the previous peak (duration) or by the output increase in the first four quarters (amplitude). The methodology for determining financial cycles is the same as for business cycles, that is, we identified downturns and upturns in (real) financial variables. Phases of cycles can be characterized according to their intensity (amplitude),
94 Capital Flow Volatility and Systemic Risk in Emerging Markets: The Policy Toolkit
Dealing with the Challenges of Macro Financial Linkages in Emerging Marketshttp://dx.doi.org/10.1596/978-1-4648-0002-3
duration, cost (cumulative loss, but only in case of recessions), and severity (slope). For business cycles we used output, whereas for domestic financial cycles we used credit, equity prices, and house prices. All variables are in real terms. The period we covered is from the first quarter of 1960 to the fourth quarter of 2011, with differences in data coverage between ACs and EMs (often only more recent data was available for EMs).
For capital flows, we used the methodology of Ghosh and others (2012), where “surges,” that is, large capital inflows relative to the recipient economies, are defined as those that fall in the top 30 percent of the country-specific distri-bution of net capital inflows to GDP for the country as well as in the top 30 percent of the overall distribution of net capital inflows to GDP for the whole samples, or the subsamples of ACs or EMs.5 Conversely, large capital outflows (as a share of GDP) are defined as capital outflows that fall in the top 30 percent outflows for the country and the top 30 percent overall for the whole or the two subsamples. We used annual data, given the large intrayear volatility in capital flows and data availability.
Note though that there is much overlap among these financial events, with the overlaps somewhat greater for EMs, especially as regards to capital flows. For example, of the 31 large capital outflows events for ACs, 3 are also credit crunch-es, whereas for EMs, of the 46 outflow episodes, 15 are also credit crunches. For ACs, the domestic financial events tend to overlap more among each other. For example, of the 35 house-price busts for ACs, 17 were also credit crunches (of which 11 were also equity busts) and an additional 7 were also equity busts. Conversely for EMs, of the 16 house-price busts, only 3 were also credit crunches (of which none were also equity busts), yet an additional 7 were also equity busts (note that this might be due to more limited house-price data for EMs).
In addition, we looked at extreme adverse financial events, that is, banking, currency, and sovereign debt crises, for which we used the definitions and data from Laeven and Valencia (2012), and “sudden stops,” for which we use the data from Forbes and Warnock (2012), where the latter partly overlap with our large capital outflow events. Altogether, we considered five types of adverse financial events: credit crunches, equity and house-price busts, large capital outflows, and financial crises; and four types of favorable financial events: credit, equity prices, house-price booms, and large capital inflows.
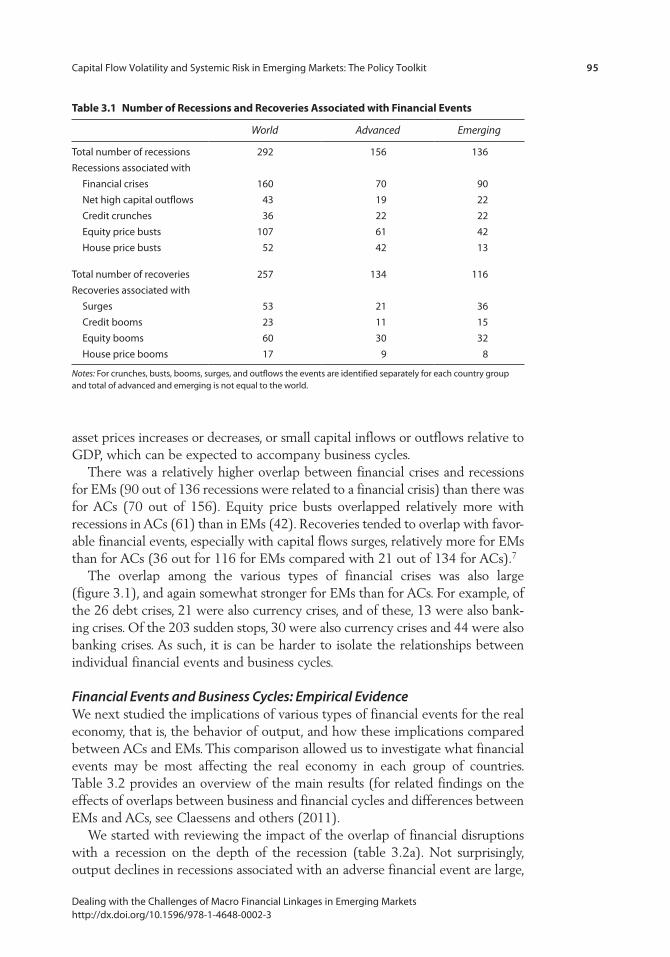
We then considered the overlap between business cycles and the various financial events.6 Table 3.1 shows the overlap of recessions with the five adverse financial events and of the recoveries with the four favorable events. The coinci-dence of adverse business phases with adverse financial events is, not surprisingly, quite large. We see that of the 292 recessions, 160, 43, 36, 107, and 52 overlap with financial crises, large capital outflows, credit crunches, equity prices, and house-prices busts, respectively. The coincidence of favorable business phases with favorable financial cycles is somewhat less. Of the 257 recoveries, 53, 23, 60, and 17 overlap with large capital inflows and credit, equity prices, and house-price booms, respectively. Note that all of these financial events are relatively extreme, since we did not consider “normal” credit expansions and contractions,
Capital Flow Volatility and Systemic Risk in Emerging Markets: The Policy Toolkit 95
Dealing with the Challenges of Macro Financial Linkages in Emerging Marketshttp://dx.doi.org/10.1596/978-1-4648-0002-3
asset prices increases or decreases, or small capital inflows or outflows relative to GDP, which can be expected to accompany business cycles.
There was a relatively higher overlap between financial crises and recessions for EMs (90 out of 136 recessions were related to a financial crisis) than there was for ACs (70 out of 156). Equity price busts overlapped relatively more with recessions in ACs (61) than in EMs (42). Recoveries tended to overlap with favor-able financial events, especially with capital flows surges, relatively more for EMs than for ACs (36 out for 116 for EMs compared with 21 out of 134 for ACs).7
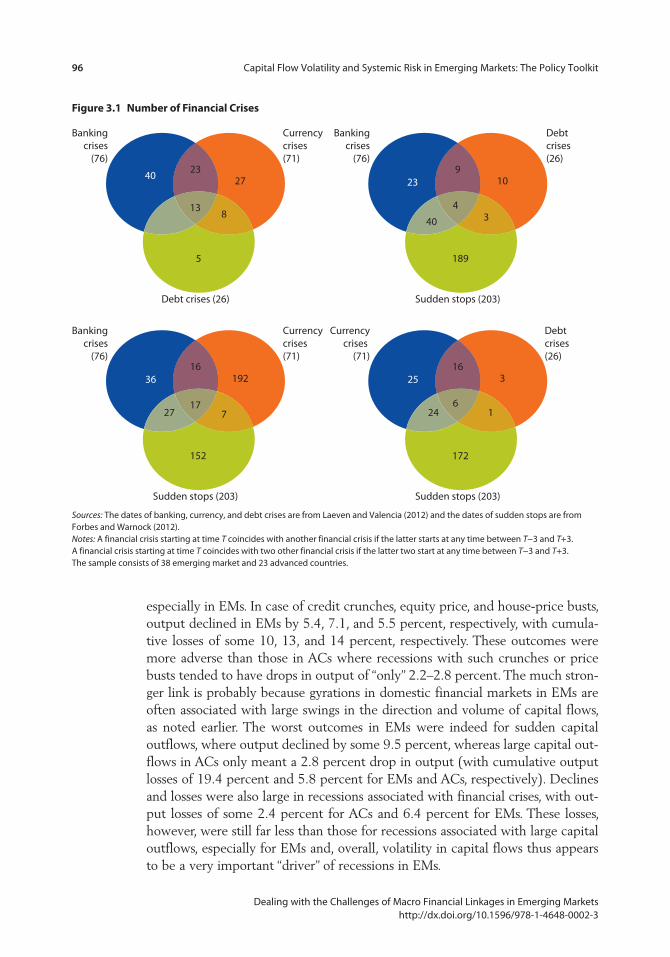
The overlap among the various types of financial crises was also large (figure 3.1), and again somewhat stronger for EMs than for ACs. For example, of the 26 debt crises, 21 were also currency crises, and of these, 13 were also bank-ing crises. Of the 203 sudden stops, 30 were also currency crises and 44 were also banking crises. As such, it is can be harder to isolate the relationships between individual financial events and business cycles.
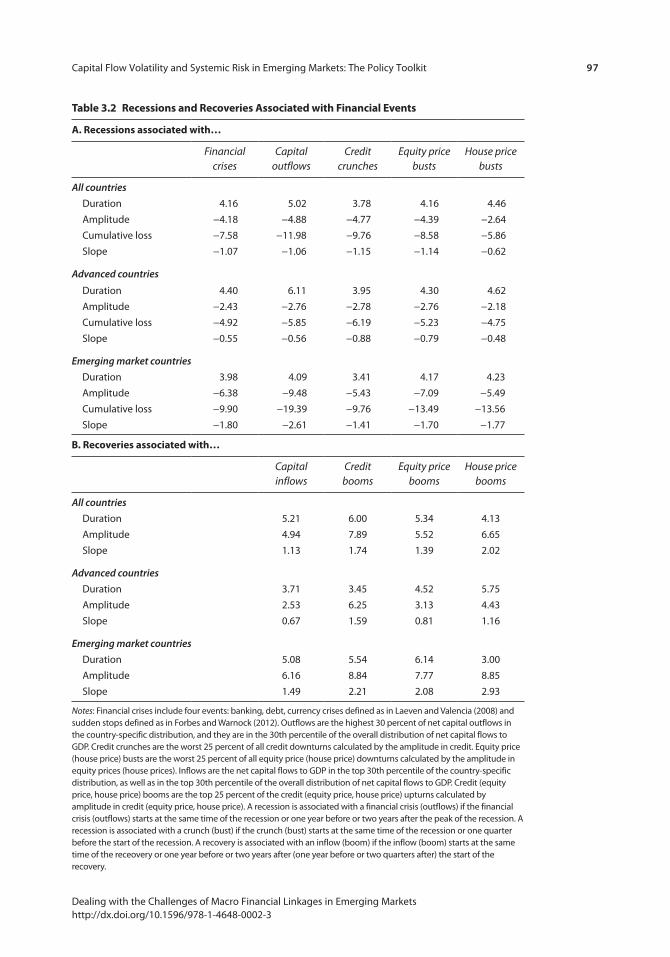
Financial Events and Business Cycles: Empirical EvidenceWe next studied the implications of various types of financial events for the real economy, that is, the behavior of output, and how these implications compared between ACs and EMs. This comparison allowed us to investigate what financial events may be most affecting the real economy in each group of countries. Table 3.2 provides an overview of the main results (for related findings on the effects of overlaps between business and financial cycles and differences between EMs and ACs, see Claessens and others (2011).
We started with reviewing the impact of the overlap of financial disruptions with a recession on the depth of the recession (table 3.2a). Not surprisingly, output declines in recessions associated with an adverse financial event are large,
table 3.1 Number of recessions and recoveries associated with Financial events
World Advanced Emerging
Total number of recessions 292 156 136
Recessions associated with
Financial crises 160 70 90
Net high capital outflows 43 19 22
Credit crunches 36 22 22
Equity price busts 107 61 42
House price busts 52 42 13
Total number of recoveries 257 134 116
Recoveries associated with
Surges 53 21 36
Credit booms 23 11 15
Equity booms 60 30 32
House price booms 17 9 8
Notes: For crunches, busts, booms, surges, and outflows the events are identified separately for each country group and total of advanced and emerging is not equal to the world.
96 Capital Flow Volatility and Systemic Risk in Emerging Markets: The Policy Toolkit
Dealing with the Challenges of Macro Financial Linkages in Emerging Marketshttp://dx.doi.org/10.1596/978-1-4648-0002-3
Bankingcrises
(76)
Currency crises (71)
Bankingcrises
(76)
Debt crises (26)
4023
27
138
5
239
10
4
40 3
189
Bankingcrises
(76)
Currency crises (71)
Currencycrises
(71)
Debt crises (26)
1636 192
1727 7
152
2516
3
624 1
172
Debt crises (26) Sudden stops (203)
Sudden stops (203) Sudden stops (203)
Figure 3.1 Number of Financial Crises
Sources: The dates of banking, currency, and debt crises are from Laeven and Valencia (2012) and the dates of sudden stops are from Forbes and Warnock (2012).Notes: A financial crisis starting at time T coincides with another financial crisis if the latter starts at any time between T−3 and T+3. A financial crisis starting at time T coincides with two other financial crisis if the latter two start at any time between T−3 and T+3. The sample consists of 38 emerging market and 23 advanced countries.
especially in EMs. In case of credit crunches, equity price, and house-price busts, output declined in EMs by 5.4, 7.1, and 5.5 percent, respectively, with cumula-tive losses of some 10, 13, and 14 percent, respectively. These outcomes were more adverse than those in ACs where recessions with such crunches or price busts tended to have drops in output of “only” 2.2–2.8 percent. The much stron-ger link is probably because gyrations in domestic financial markets in EMs are often associated with large swings in the direction and volume of capital flows, as noted earlier. The worst outcomes in EMs were indeed for sudden capital outflows, where output declined by some 9.5 percent, whereas large capital out-flows in ACs only meant a 2.8 percent drop in output (with cumulative output losses of 19.4 percent and 5.8 percent for EMs and ACs, respectively). Declines and losses were also large in recessions associated with financial crises, with out-put losses of some 2.4 percent for ACs and 6.4 percent for EMs. These losses, however, were still far less than those for recessions associated with large capital outflows, especially for EMs and, overall, volatility in capital flows thus appears to be a very important “driver” of recessions in EMs.
Capital Flow Volatility and Systemic Risk in Emerging Markets: The Policy Toolkit 97
Dealing with the Challenges of Macro Financial Linkages in Emerging Marketshttp://dx.doi.org/10.1596/978-1-4648-0002-3
table 3.2 recessions and recoveries associated with Financial events
a. recessions associated with…
Financial crises
Capital outflows
Credit crunches
Equity price busts
House price busts
All countries
Duration 4.16 5.02 3.78 4.16 4.46
Amplitude −4.18 −4.88 −4.77 −4.39 −2.64
Cumulative loss −7.58 −11.98 −9.76 −8.58 −5.86
Slope −1.07 −1.06 −1.15 −1.14 −0.62
Advanced countries
Duration 4.40 6.11 3.95 4.30 4.62
Amplitude −2.43 −2.76 −2.78 −2.76 −2.18
Cumulative loss −4.92 −5.85 −6.19 −5.23 −4.75
Slope −0.55 −0.56 −0.88 −0.79 −0.48
Emerging market countries
Duration 3.98 4.09 3.41 4.17 4.23
Amplitude −6.38 −9.48 −5.43 −7.09 −5.49
Cumulative loss −9.90 −19.39 −9.76 −13.49 −13.56
Slope −1.80 −2.61 −1.41 −1.70 −1.77
B. recoveries associated with…
Capital inflows
Credit booms
Equity price booms
House price booms
All countries
Duration 5.21 6.00 5.34 4.13
Amplitude 4.94 7.89 5.52 6.65
Slope 1.13 1.74 1.39 2.02
Advanced countries
Duration 3.71 3.45 4.52 5.75
Amplitude 2.53 6.25 3.13 4.43
Slope 0.67 1.59 0.81 1.16
Emerging market countries
Duration 5.08 5.54 6.14 3.00
Amplitude 6.16 8.84 7.77 8.85
Slope 1.49 2.21 2.08 2.93
Notes: Financial crises include four events: banking, debt, currency crises defined as in Laeven and Valencia (2008) and sudden stops defined as in Forbes and Warnock (2012). Outflows are the highest 30 percent of net capital outflows in the country-specific distribution, and they are in the 30th percentile of the overall distribution of net capital flows to GDP. Credit crunches are the worst 25 percent of all credit downturns calculated by the amplitude in credit. Equity price (house price) busts are the worst 25 percent of all equity price (house price) downturns calculated by the amplitude in equity prices (house prices). Inflows are the net capital flows to GDP in the top 30th percentile of the country-specific distribution, as well as in the top 30th percentile of the overall distribution of net capital flows to GDP. Credit (equity price, house price) booms are the top 25 percent of the credit (equity price, house price) upturns calculated by amplitude in credit (equity price, house price). A recession is associated with a financial crisis (outflows) if the financial crisis (outflows) starts at the same time of the recession or one year before or two years after the peak of the recession. A recession is associated with a crunch (bust) if the crunch (bust) starts at the same time of the recession or one quarter before the start of the recession. A recovery is associated with an inflow (boom) if the inflow (boom) starts at the same time of the receovery or one year before or two years after (one year before or two quarters after) the start of the recovery.
98 Capital Flow Volatility and Systemic Risk in Emerging Markets: The Policy Toolkit
Dealing with the Challenges of Macro Financial Linkages in Emerging Marketshttp://dx.doi.org/10.1596/978-1-4648-0002-3
Conversely, output increases were much greater in recoveries associated with favorable financial events, and more so in EMs than in ACs (table 3.2b). Recoveries associated with asset price booms meant an 8 to 9 percent increase in output in EMs versus 3 to 4 percent in ACs. Similarly, in recoveries associated with credit booms, output increases were 1.5 percentage points larger in EMs than in ACs: 8.8 percent versus 6.3 percent. The smaller difference between EMs and ACs with respect to the relationship between credit booms and output likely reflects, in part, the similar importance of banking systems in both groups of countries (the non-bank part of the financial system tends to be less developed in most EMs). In ACs, output increased the most in recoveries associated with credit booms while asset prices were less important for output increases, whereas in EMs all types of domes-tic financial booms had similarly large relationships with the size of the recoveries. Large capital inflows were not the most important “driver” of upswings in the busi-ness cycle for EMs. Nevertheless, recoveries associated with capital inflows experi-enced twice as large an output increase in EMs than in ACs: 6 versus 2.5 percent.
a Closer Look at Capital Inflows and their Implications
The previous section established that in general, but especially for EMs, capital flows interact very strongly with real sector developments. It also noted that, compared with the experiences in ACs, capital flow cycles in EMs overlap to a greater degree with domestic financial cycles and financial crises. What causes these two facts? We discuss two explanations: “surges” or large capital flows to and from EMs are more volatile and often driven by global (financial) factors, rather than by domestic devel-opments; and capital flows interact in a more intense way with the domestic finan-cial systems and consequently real economy in EMs. For the first explanation, we review the literature on the determinants of capital flows to EMs. For the second, we discuss the mechanisms through which such financial-real interactions take place, focusing in particular on flows intermediated through the banking sector (which forms the bulk of cross-border flows), and how this can lead to both larger macroeconomic and domestic financial cycles. Finally, we review how this can lead to a buildup of vulnerability during surges of capital inflows to EMs and document dimensions of such increased observed vulnerabilities—both macroeconomic and financial—that validate the channels leading to the buildup discussed earlier.
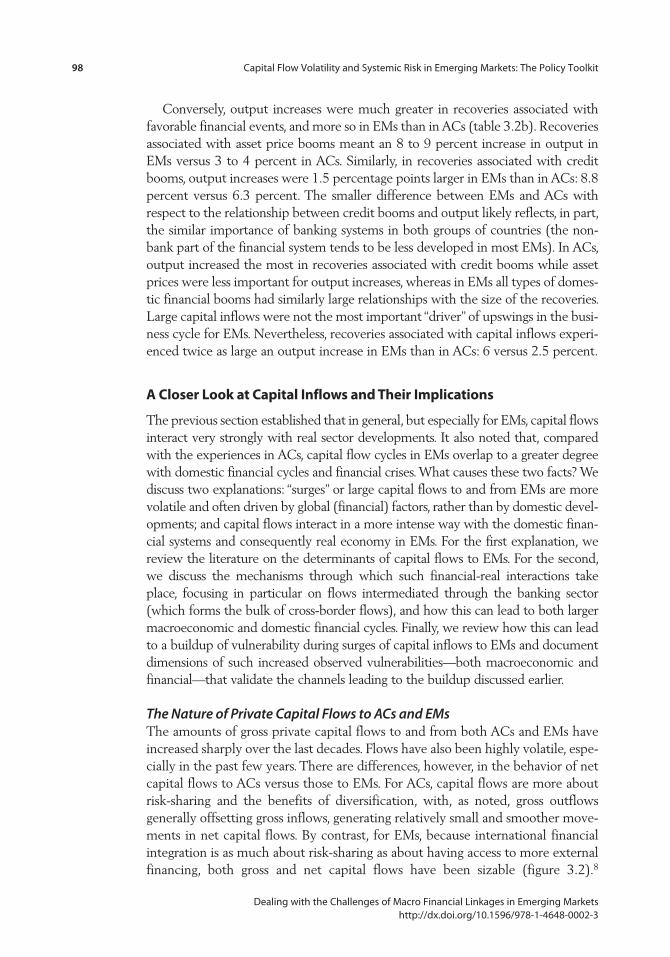
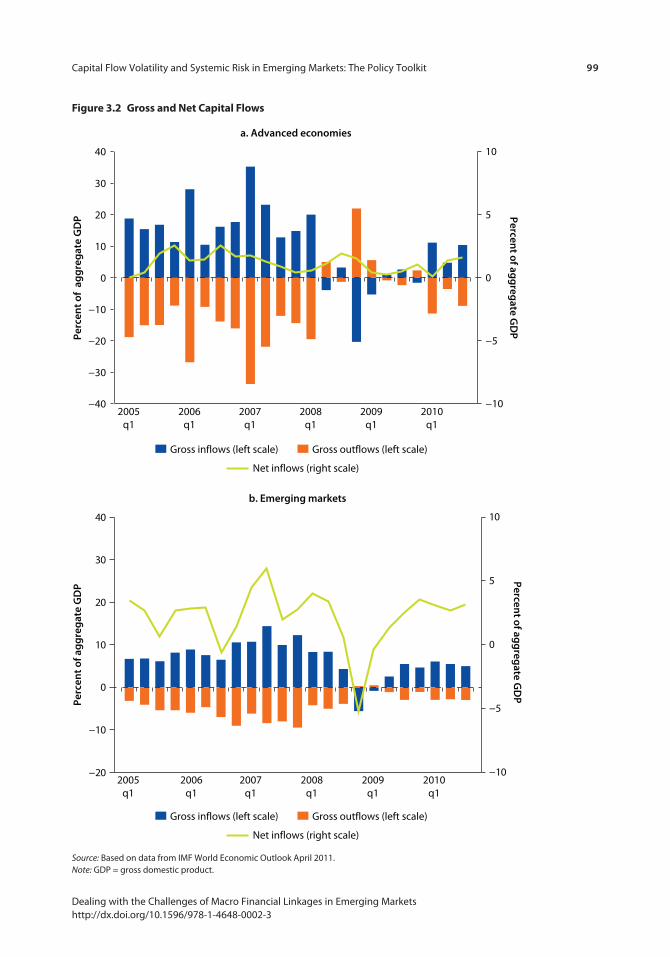
The Nature of Private Capital Flows to ACs and EMsThe amounts of gross private capital flows to and from both ACs and EMs have increased sharply over the last decades. Flows have also been highly volatile, espe-cially in the past few years. There are differences, however, in the behavior of net capital flows to ACs versus those to EMs. For ACs, capital flows are more about risk-sharing and the benefits of diversification, with, as noted, gross outflows generally offsetting gross inflows, generating relatively small and smoother move-ments in net capital flows. By contrast, for EMs, because international financial integration is as much about risk-sharing as about having access to more external financing, both gross and net capital flows have been sizable (figure 3.2).8
Capital Flow Volatility and Systemic Risk in Emerging Markets: The Policy Toolkit 99
Dealing with the Challenges of Macro Financial Linkages in Emerging Marketshttp://dx.doi.org/10.1596/978-1-4648-0002-3
−40
−30
−20
−10
0
10
20
30
40
−10
−5
0
5
10
Gross inflows (left scale) Gross outflows (left scale)
Net inflows (right scale)
Gross inflows (left scale) Gross outflows (left scale)
Net inflows (right scale)
a. Advanced economies
b. Emerging markets
2005q1
2006q1
2007q1
2008q1
2009q1
2010q1
Perc
ent o
f ag
gre
gat
e G
DP Percen
t of agg
regate G
DP
−20
−10
0
10
20
30
40
−10
−5
0
5
10
2005q1
2006q1
2007q1
2008q1
2009q1
2010q1
Perc
ent o
f ag
gre
gat
e G
DP
Percent of ag
greg
ate GD
P
Figure 3.2 Gross and Net Capital Flows
Source: Based on data from IMF World Economic Outlook April 2011.Note: GDP = gross domestic product.
100 Capital Flow Volatility and Systemic Risk in Emerging Markets: The Policy Toolkit
Dealing with the Challenges of Macro Financial Linkages in Emerging Marketshttp://dx.doi.org/10.1596/978-1-4648-0002-3
Stan
dar
d d
evia
tion
of n
et p
riva
te c
apit
al fl
ows
in p
erce
nt o
f GD
P
1990 1995 2000Years
Years
2005 20100
1
2
3
4
5
6
7
a. Advanced economics
b. Emerging markets
1990 1995 2000 2005 20100
1
2
3
4
5
6
7
Stan
dar
d d
evia
tion
of n
et p
riva
te c
apit
al fl
ows
in p
erce
nt o
f GD
P
Interquartile range of total net private flows Total net private flows
Interquartile range of total net private flows Total net private flows
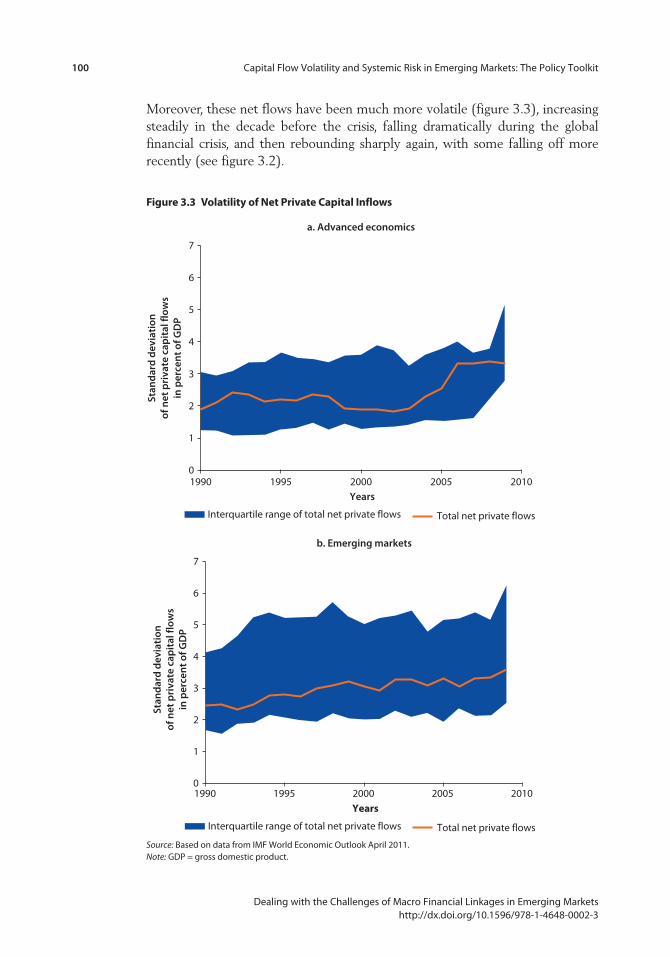
Figure 3.3 Volatility of Net private Capital Inflows
Source: Based on data from IMF World Economic Outlook April 2011.Note: GDP = gross domestic product.
Moreover, these net flows have been much more volatile (figure 3.3), increasing steadily in the decade before the crisis, falling dramatically during the global financial crisis, and then rebounding sharply again, with some falling off more recently (see figure 3.2).
Capital Flow Volatility and Systemic Risk in Emerging Markets: The Policy Toolkit 101
Dealing with the Challenges of Macro Financial Linkages in Emerging Marketshttp://dx.doi.org/10.1596/978-1-4648-0002-3
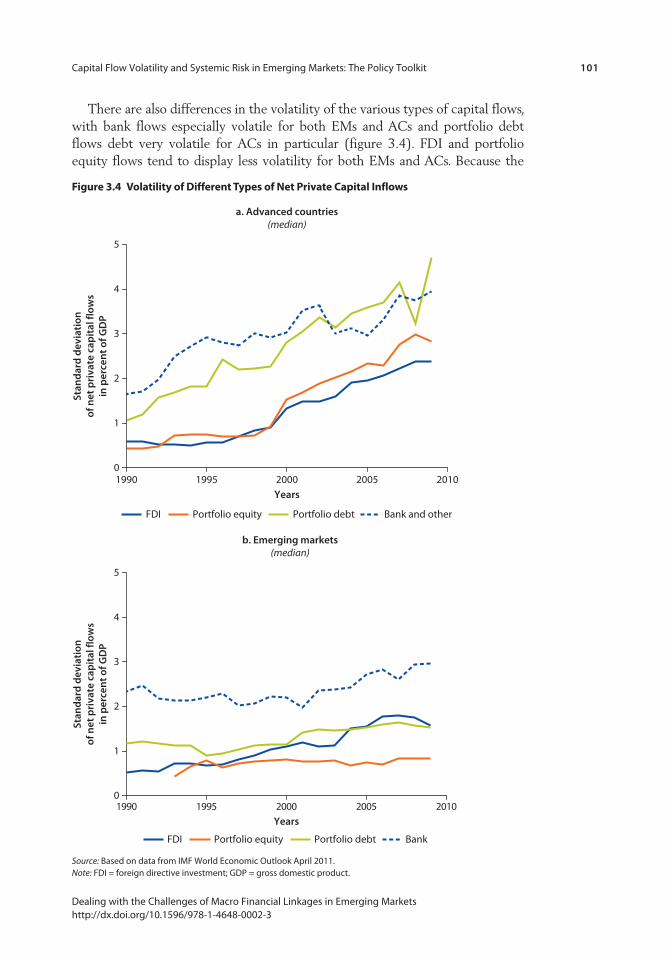
There are also differences in the volatility of the various types of capital flows, with bank flows especially volatile for both EMs and ACs and portfolio debt flows debt very volatile for ACs in particular (figure 3.4). FDI and portfolio equity flows tend to display less volatility for both EMs and ACs. Because the
1990 1995 2000Years
2005 20100
1
2
3
4
5
a. Advanced countries(median)
b. Emerging markets(median)
FDI Portfolio equity Portfolio debt Bank and other
FDI Portfolio equity Portfolio debt Bank
Stan
dar
d d
evia
tion
of n
et p
riva
te c
apit
al fl
ows
in p
erce
nt o
f GD
P
Years1990 1995 2000 2005 2010
0
1
2
3
4
5
Stan
dar
d d
evia
tion
of n
et p
riva
te c
apit
al fl
ows
in p
erce
nt o
f GD
P
Figure 3.4 Volatility of Different types of Net private Capital Inflows
Source: Based on data from IMF World Economic Outlook April 2011.Note: FDI = foreign directive investment; GDP = gross domestic product.
102 Capital Flow Volatility and Systemic Risk in Emerging Markets: The Policy Toolkit
Dealing with the Challenges of Macro Financial Linkages in Emerging Marketshttp://dx.doi.org/10.1596/978-1-4648-0002-3
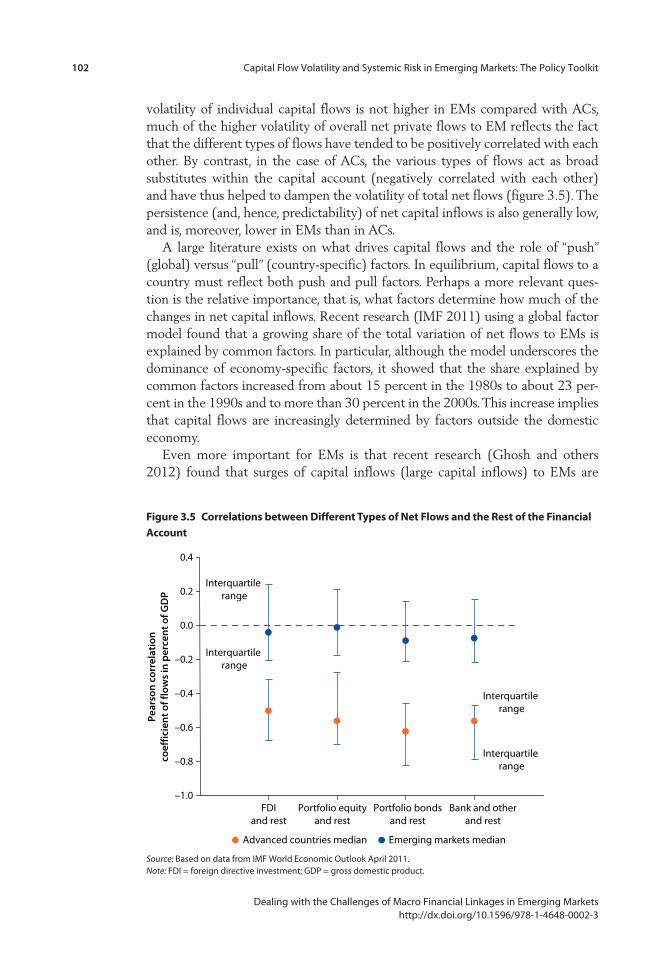
volatility of individual capital flows is not higher in EMs compared with ACs, much of the higher volatility of overall net private flows to EM reflects the fact that the different types of flows have tended to be positively correlated with each other. By contrast, in the case of ACs, the various types of flows act as broad substitutes within the capital account (negatively correlated with each other) and have thus helped to dampen the volatility of total net flows (figure 3.5). The persistence (and, hence, predictability) of net capital inflows is also generally low, and is, moreover, lower in EMs than in ACs.
A large literature exists on what drives capital flows and the role of “push” (global) versus “pull” (country-specific) factors. In equilibrium, capital flows to a country must reflect both push and pull factors. Perhaps a more relevant ques-tion is the relative importance, that is, what factors determine how much of the changes in net capital inflows. Recent research (IMF 2011) using a global factor model found that a growing share of the total variation of net flows to EMs is explained by common factors. In particular, although the model underscores the dominance of economy-specific factors, it showed that the share explained by common factors increased from about 15 percent in the 1980s to about 23 per-cent in the 1990s and to more than 30 percent in the 2000s. This increase implies that capital flows are increasingly determined by factors outside the domestic economy.
Even more important for EMs is that recent research (Ghosh and others 2012) found that surges of capital inflows (large capital inflows) to EMs are
–1.0
–0.8
–0.6
–0.4
–0.2
0.0
0.2
0.4
Advanced countries median Emerging markets median
Interquartile range
Interquartile range
Interquartile range
Interquartile range
FDIand rest
Portfolio equityand rest
Portfolio bondsand rest
Bank and otherand rest
Pear
son
cor
rela
tion
coef
fici
ent o
f flo
ws
in p
erce
nt o
f GD
P
Figure 3.5 Correlations between Different types of Net Flows and the rest of the Financial account
Source: Based on data from IMF World Economic Outlook April 2011.Note: FDI = foreign directive investment; GDP = gross domestic product.
Capital Flow Volatility and Systemic Risk in Emerging Markets: The Policy Toolkit 103
Dealing with the Challenges of Macro Financial Linkages in Emerging Marketshttp://dx.doi.org/10.1596/978-1-4648-0002-3
synchronized across countries, and that such surges are strongly influenced by global factors, namely global liquidity conditions and global uncertainty.9 However, while global conditions dictate the likelihood of capital flows of sig-nificant magnitudes to EMs as a whole, individual country conditions still mat-ter. Conditional on a surge occurring, whether a particular country receives a portion of a generalized surge of capital flows, depends on prevailing macroeco-nomic and other country circumstances. Moreover they found that the magni-tude of the surge of capital to a particular country depends on country-specific factors. Economic growth, external financing needs, financial openness and interconnectedness, and institutional quality appear to be significant factors in explaining the likelihood and the magnitude of the surge. Capital inflow surges end up therefore being procyclical with respect to domestic economic conditions.10
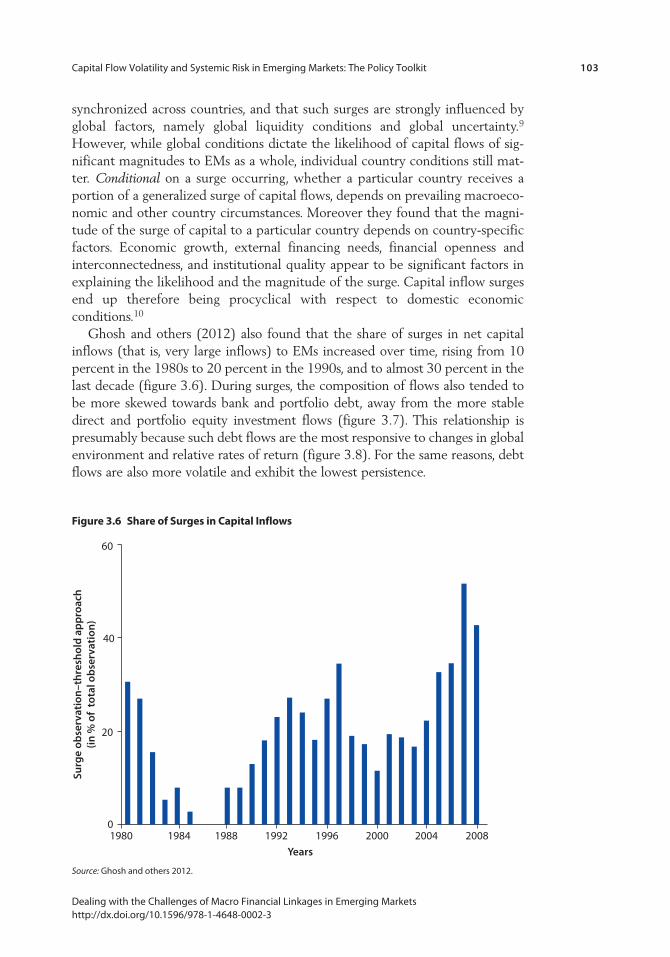
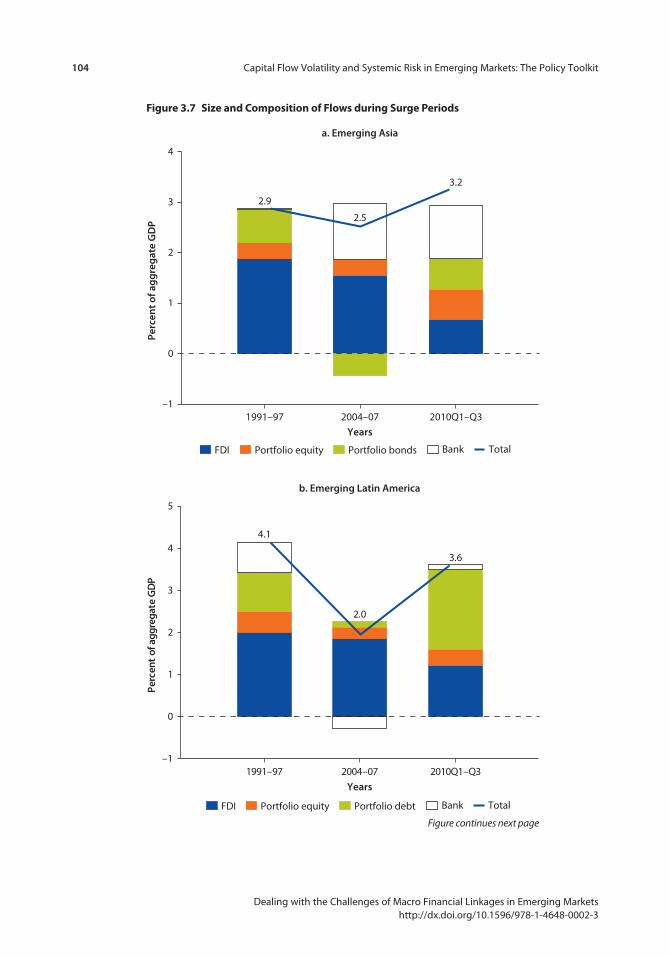
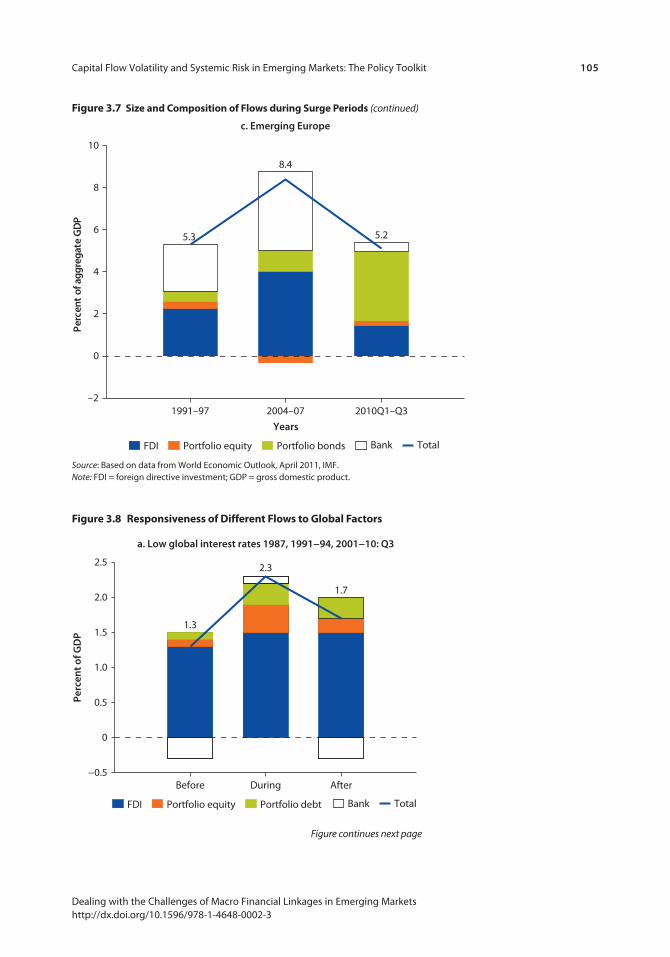
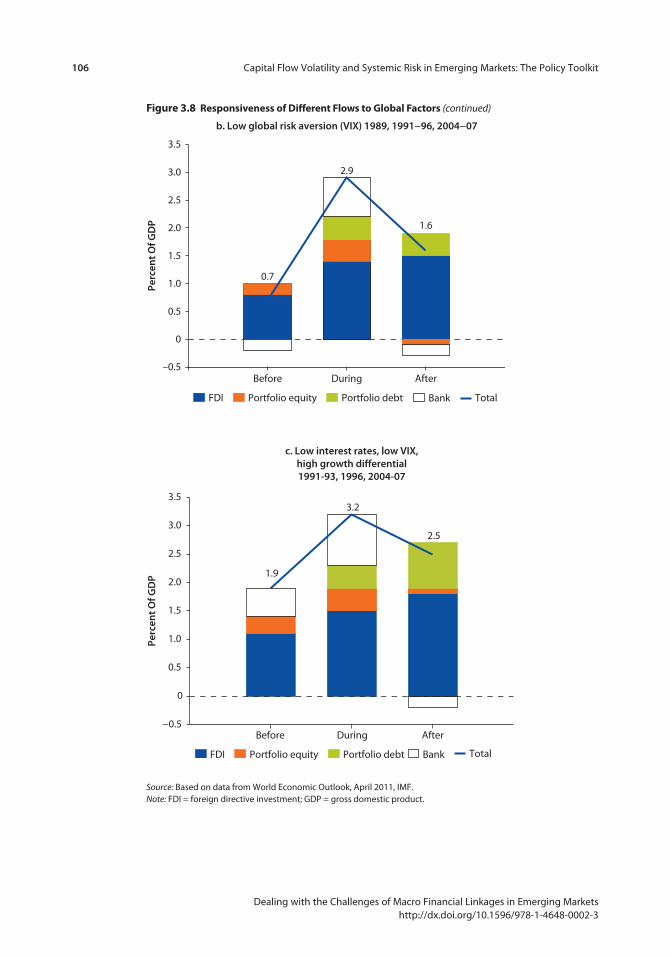
Ghosh and others (2012) also found that the share of surges in net capital inflows (that is, very large inflows) to EMs increased over time, rising from 10 percent in the 1980s to 20 percent in the 1990s, and to almost 30 percent in the last decade (figure 3.6). During surges, the composition of flows also tended to be more skewed towards bank and portfolio debt, away from the more stable direct and portfolio equity investment flows (figure 3.7). This relationship is presumably because such debt flows are the most responsive to changes in global environment and relative rates of return (figure 3.8). For the same reasons, debt flows are also more volatile and exhibit the lowest persistence.
Surg
e ob
serv
atio
n–t
hre
shol
d a
pp
roac
h(in
% o
f to
tal o
bse
rvat
ion
)
60
40
20
01980 1984 1988 1992 1996
Years
2000 2004 2008
Figure 3.6 Share of Surges in Capital Inflows
Source: Ghosh and others 2012.
104 Capital Flow Volatility and Systemic Risk in Emerging Markets: The Policy Toolkit
Dealing with the Challenges of Macro Financial Linkages in Emerging Marketshttp://dx.doi.org/10.1596/978-1-4648-0002-3
1991–97 2004–07
Years2010Q1–Q3
–1
0
1
2
3
4
a. Emerging Asia
FDI Portfolio equity Portfolio bonds Total Bank
Perc
ent o
f ag
gre
gat
e G
DP
2.9
2.5
3.2
Figure 3.7 Size and Composition of Flows during Surge periods
1991–97 2004–07
Years
2010Q1–Q3–1
0
1
2
3
5
b. Emerging Latin America
4
Perc
ent
of a
ggre
gate
GD
P
4.1
2.0
3.6
FDI Portfolio equity Portfolio debt Total Bank
Figure continues next page
Capital Flow Volatility and Systemic Risk in Emerging Markets: The Policy Toolkit 105
Dealing with the Challenges of Macro Financial Linkages in Emerging Marketshttp://dx.doi.org/10.1596/978-1-4648-0002-3
Source: Based on data from World Economic Outlook, April 2011, IMF.Note: FDI = foreign directive investment; GDP = gross domestic product.
1991–97 2004–07
Years
2010Q1–Q3–2
0
2
4
6
8
10
c. Emerging Europe
Perc
ent
of a
ggre
gate
GD
P
5.3
8.4
5.2
FDI Portfolio equity Portfolio bonds Total Bank
Before During After−0.5
0
0.5
1.0
1.5
2.0
2.5
Perc
ent o
f GD
P
1.3
2.3
1.7
a. Low global interest rates 1987, 1991−94, 2001−10: Q3
FDI Portfolio equity Portfolio debt Total Bank
Figure 3.8 responsiveness of Different Flows to Global Factors
Figure 3.7 Size and Composition of Flows during Surge periods (continued)
Figure continues next page
106 Capital Flow Volatility and Systemic Risk in Emerging Markets: The Policy Toolkit
Dealing with the Challenges of Macro Financial Linkages in Emerging Marketshttp://dx.doi.org/10.1596/978-1-4648-0002-3
Before During After–0.5
0
0.5
1.0
1.5
2.0
2.5
3.0
3.5Pe
rcen
t Of G
DP
0.7
2.9
1.6
b. Low global risk aversion (VIX) 1989, 1991−96, 2004−07
FDI Portfolio equity Portfolio debt Total Bank
Source: Based on data from World Economic Outlook, April 2011, IMF.Note: FDI = foreign directive investment; GDP = gross domestic product.
Before During After−0.5
0
0.5
1.0
1.5
2.0
2.5
3.0
3.5
Perc
ent O
f GD
P 1.9
3.2
2.5
c. Low interest rates, low VIX,high growth differential1991-93, 1996, 2004-07
FDI Portfolio equity Portfolio debt Total Bank
Figure 3.8 responsiveness of Different Flows to Global Factors (continued)
Capital Flow Volatility and Systemic Risk in Emerging Markets: The Policy Toolkit 107
Dealing with the Challenges of Macro Financial Linkages in Emerging Marketshttp://dx.doi.org/10.1596/978-1-4648-0002-3
In summary, net capital inflows to EMs tend to be volatile, and recent years have seen several periods of sharp rises in large net capital inflows to EMs, fol-lowed by slowdowns or reversals. Large capital inflows are often initiated by global conditions, with the bulk of the flows during such periods being debt-creating flows, of which bank flows are an important component. Although EMs do not appear to experience a higher incidence of capital flow surges than ACs, the magnitude and pace of capital flow surges for EMs have tended to be larger in relative terms, especially with respect to domestic financial variables (see also Agosin and Huaita 2012).
These findings help explain why in EMs large capital inflows can generate macroeconomic challenges and can heighten systemic risks in the financial sector (particularly when intermediated through the domestic banking sector) that materialize when these capital flows slow down or reverse.
Mechanisms Underlying the Interactions between Capital Flows, Domestic Financial Cycles, and Business CyclesWhat are the mechanics or channels through which the observed interactions among capital flows, and domestic business, and financial cycles arise for EMs? The starting point is that because of financial frictions, finance—be it in ACs or EMs—is inherently procyclical, that is, it tends to amplify the business cycle (see Brunnermeier and others 2009 for a review). This procyclicality can originate from the behavior of financial institutions or markets (supply side) or from changes in borrowers’ balance sheets and income statements (demand side).11 Further, because of externalities (spillovers) and other factors (some aspects of micro prudential regulation, for instance), this natural procyclicality is amplified for the sector as a whole. Thus, faced with a positive shock, financial institutions tend to behave in the same manner, expanding their balance sheets and increas-ing their demand for assets, which raises asset prices, fuelling a cycle and leading to a generalized expansion of credit and economic activity.
This procyclicality in domestic bank lending can interact with capital flows. When credit is expanding rapidly, outstripping the pool of locally available funds, banks will turn to international sources of funding (as mentioned earlier, the bulk of capital flows in surges is composed of bank and other lending). The ability of banks to raise funds internationally fluctuates, in turn, with global credit market conditions (see Bruno and Shin 2011; and Avdjiev, McCauley, and McGuire 2012). The presence of foreign-owned banks can further accentuate these credit cycles, given their easier access to both international financial markets and the internal capital markets of their parent banks.
As such, ample global liquidity and low investor risk aversion—and EMs’ good growth prospects—can mean a surge of capital to EMs. These capital inflows can place upward pressures on the exchange rate. They provide domestic banks both the means to increase lending and the incentives to do so, because there is an expansion of demand and activity, especially in the nontradable sec-tors, coming from the asset price booms. In turn, as the value of banks’ net worth
108 Capital Flow Volatility and Systemic Risk in Emerging Markets: The Policy Toolkit
Dealing with the Challenges of Macro Financial Linkages in Emerging Marketshttp://dx.doi.org/10.1596/978-1-4648-0002-3
rises and measured risks fall, their balance sheet capacity expands. Banks then increase their lending again, which further fuels the domestic financial cycle, with again (more) capital inflows. Of course, these mechanisms can also play out in reverse.
These interactions between financial and real sectors may be more driven by capital flows in EMs than in ACs for a number of reasons. First, as noted, EMs tend to receive not only relatively large capital flows, but flows that are largely intermediated through their financial systems. This intermediation alone would make capital flows tend to interact with and amplify domestic financial and real business cycles in EMs to a greater extent than in ACs. The relatively large pres-ence of foreign-owned banks in many EMs—market shares are often more than 70 percent (Claessens and van Horen 2012)—can further accentuate this ampli-fication. Importantly, the stronger interactions also reflect EMs’ structural and institutional characteristics. A key structural characteristic is that EMs’ financial sectors are still largely bank dominated, most often relying on collateral (between 72 and 85 percent of loans require collateral, higher than in ACs). This charac-teristic naturally creates more procyclicality when asset prices and collateral values change. Given more limited alternative sources of financing, changes in bank lending are likely to have a greater impact on the real economy.
Institutional and other weaknesses can also increase the impact of capital flows, especially in the face of negative shocks. Although EMs have made sub-stantial progress, they still lag behind ACs in measures of overall quality of insti-tutions, have weaker legal regimes and enforcement, and have less of a track record. Market discipline of financial institutions does not work as well in EMs, given lower information disclosure and transparency, and greater prevalence of insider-type corporate governance arrangements, including nonfinancial corpora-tions often linked to financial institutions. These weaknesses can serve to height-en investor nervousness or even lead to a loss of investor confidence in the face of minor shocks.12 EMs can then be subject to sudden stops and reversals of capi-tal flows. If cumulative inflows were large and occurred through the banking system, such reversals could have very significant impacts on the domestic economy.
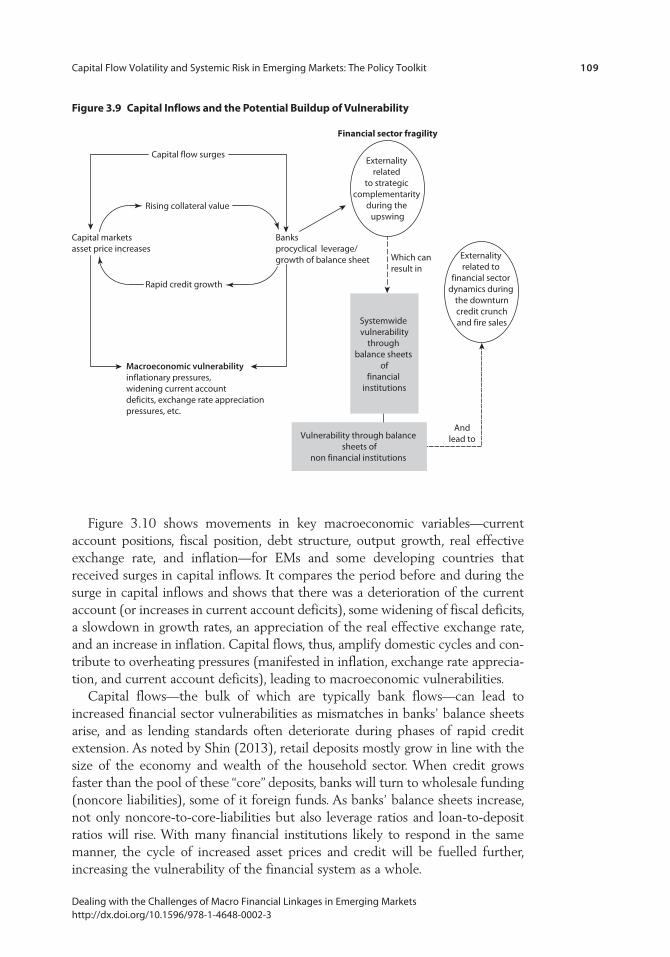
The Buildup of Vulnerability through Capital InflowsThe same interactions imply that large capital inflows can increase vulnerabilities at the macroeconomic level and exacerbate systemic risks in the financial sector (figure 3.9). At the macro level, large inflows in net terms are the financial coun-terpart to the savings and investment decisions in the country and affect the exchange rate, inflation, and current account positions. Surges of capital inflows can put upward pressures on the exchange rate (in countries with floating rates) or lead to an expansion of the money supply in countries with fixed exchange rates (unless sterilized). They can generate widening current account deficits, inflationary pressures, asset booms, and higher debt ratios. To the extent that short-term debt flows are more sensitive to interest rate differentials, the compo-sition of capital inflows will skew toward short-term debt flows.
Capital Flow Volatility and Systemic Risk in Emerging Markets: The Policy Toolkit 109
Dealing with the Challenges of Macro Financial Linkages in Emerging Marketshttp://dx.doi.org/10.1596/978-1-4648-0002-3
Capital flow surges
Capital marketsasset price increases
Banksprocyclical leverage/growth of balance sheet
Macroeconomic vulnerabilityinflationary pressures, widening current accountdeficits, exchange rate appreciationpressures, etc.
Externality related
to strategic complementarity
during the upswing
Systemwide vulnerability
through balance sheets
offinancial
institutions
Vulnerability through balance sheets of
non financial institutions
Externality related to
financial sector dynamics during
the downturncredit crunchand fire sales
Andlead to
Which can result in
Rising collateral value
Rapid credit growth
Financial sector fragility
Figure 3.9 Capital Inflows and the potential Buildup of Vulnerability
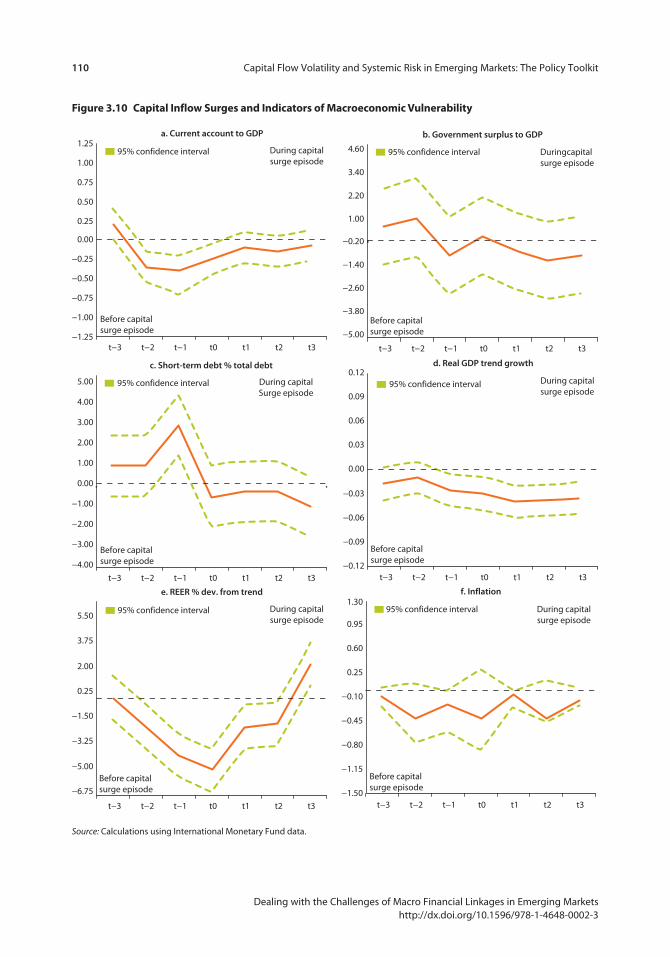
Figure 3.10 shows movements in key macroeconomic variables—current account positions, fiscal position, debt structure, output growth, real effective exchange rate, and inflation—for EMs and some developing countries that received surges in capital inflows. It compares the period before and during the surge in capital inflows and shows that there was a deterioration of the current account (or increases in current account deficits), some widening of fiscal deficits, a slowdown in growth rates, an appreciation of the real effective exchange rate, and an increase in inflation. Capital flows, thus, amplify domestic cycles and con-tribute to overheating pressures (manifested in inflation, exchange rate apprecia-tion, and current account deficits), leading to macroeconomic vulnerabilities.
Capital flows—the bulk of which are typically bank flows—can lead to increased financial sector vulnerabilities as mismatches in banks’ balance sheets arise, and as lending standards often deteriorate during phases of rapid credit extension. As noted by Shin (2013), retail deposits mostly grow in line with the size of the economy and wealth of the household sector. When credit grows faster than the pool of these “core” deposits, banks will turn to wholesale funding (noncore liabilities), some of it foreign funds. As banks’ balance sheets increase, not only noncore-to-core-liabilities but also leverage ratios and loan-to-deposit ratios will rise. With many financial institutions likely to respond in the same manner, the cycle of increased asset prices and credit will be fuelled further, increasing the vulnerability of the financial system as a whole.
110 Capital Flow Volatility and Systemic Risk in Emerging Markets: The Policy Toolkit
Dealing with the Challenges of Macro Financial Linkages in Emerging Marketshttp://dx.doi.org/10.1596/978-1-4648-0002-3
−1.25
−1.00
−0.75
−0.50
−0.25
0.00
0.25
0.50
0.75
1.00
1.25
t−3 t−2 t−1 t0 t1 t2 t3
a. Current account to GDP
During capitalsurge episode
Before capital surge episode
Before capital surge episode
Before capital surge episode
Before capital surge episode
Before capital surge episode
95% confidence interval
−6.75
−5.00
−3.25
−1.50
0.25
2.00
3.75
5.50
e. REER % dev. from trend
95% confidence interval During capitalsurge episode
−1.50
−1.15
−0.80
−0.45
−0.10
0.25
0.60
0.95
1.30f. Inflation
95% confidence interval During capitalsurge episode
−0.12
−0.09
−0.06
−0.03
0.00
0.03
0.06
0.09
0.12d. Real GDP trend growth
During capital surge episode
95% confidence interval
−5.00
−3.80
−2.60
−1.40
−0.20
1.00
2.20
3.40
4.60
b. Government surplus to GDP
Duringcapital surge episode
Before capital surge episode
95% confidence interval
−4.00
−3.00
−2.00
−1.00
0.00
1.00
2.00
3.00
4.00
5.00
c. Short-term debt % total debt
During capitalSurge episode
95% confidence interval
t−3 t−2 t−1 t0 t1 t2 t3t−3 t−2 t−1 t0 t1 t2 t3
t−3 t−2 t−1 t0 t1 t2 t3t−3 t−2 t−1 t0 t1 t2 t3
t−3 t−2 t−1 t0 t1 t2 t3
Figure 3.10 Capital Inflow Surges and Indicators of Macroeconomic Vulnerability
Source: Calculations using International Monetary Fund data.
Capital Flow Volatility and Systemic Risk in Emerging Markets: The Policy Toolkit 111
Dealing with the Challenges of Macro Financial Linkages in Emerging Marketshttp://dx.doi.org/10.1596/978-1-4648-0002-3
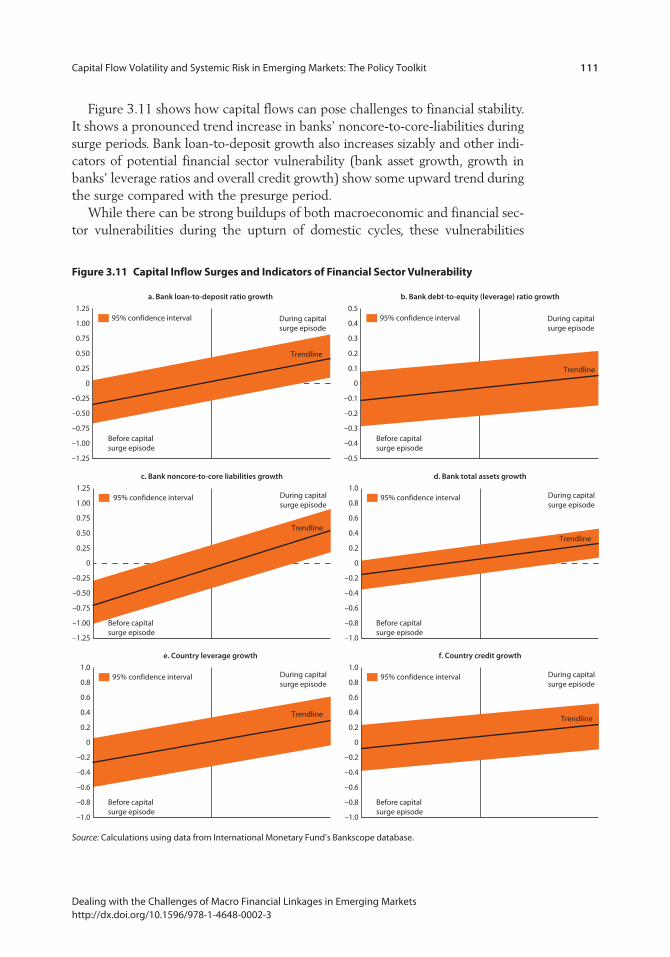
Figure 3.11 shows how capital flows can pose challenges to financial stability. It shows a pronounced trend increase in banks’ noncore-to-core-liabilities during surge periods. Bank loan-to-deposit growth also increases sizably and other indi-cators of potential financial sector vulnerability (bank asset growth, growth in banks’ leverage ratios and overall credit growth) show some upward trend during the surge compared with the presurge period.
While there can be strong buildups of both macroeconomic and financial sec-tor vulnerabilities during the upturn of domestic cycles, these vulnerabilities
1.00
1.25
a. Bank loan-to-deposit ratio growth
During capital surge episode
95% confidence interval
–0.50
–0.25
0
0.25
0.50
0.75
–1.25
–1.00
–0.75Before capital surge episode
1.00
1.25
c. Bank noncore-to-core liabilities growth
During capital surge episode
95% confidence interval
–0.50
–0.25
0
0.25
0.50
0.75
–1.25
–1.00
–0.75
Before capital surge episode
Trendline
Trendline
0.8
1.0
e. Country leverage growth
During capital surge episode
95% confidence interval
–0.4
–0.2
0
0.2
0.4
0.6
–1.0
–0.8
–0.6
Before capital surge episode
Trendline
0.4
0.5
b. Bank debt-to-equity (leverage) ratio growth
During capital surge episode
95% confidence interval
–0.2
–0.1
0
0.1
0.2
0.3
–0.5
–0.4
–0.3Before capital surge episode
0.8
1.0
d. Bank total assets growth
During capital surge episode
95% confidence interval
–0.4
–0.2
0
0.2
0.4
0.6
–1.0
–0.8
–0.6
Before capital surge episode
Trendline
Trendline
0.8
1.0
f. Country credit growth
During capital surge episode
95% confidence interval
–0.4
–0.2
0
0.2
0.4
0.6
–1.0
–0.8
–0.6
Before capital surge episode
Trendline
Figure 3.11 Capital Inflow Surges and Indicators of Financial Sector Vulnerability
Source: Calculations using data from International Monetary Fund’s Bankscope database.
112 Capital Flow Volatility and Systemic Risk in Emerging Markets: The Policy Toolkit
Dealing with the Challenges of Macro Financial Linkages in Emerging Marketshttp://dx.doi.org/10.1596/978-1-4648-0002-3
manifest themselves most clearly in the face of a negative shock or during cyclical downturns. As risks have been built up, negative shocks—a domestic cyclical downturn, or a global shock, leading to capital outflows—can then easily lead to domestic economic and financial downturns.
Dealing with Capital Inflows Surges and Vulnerability Buildup
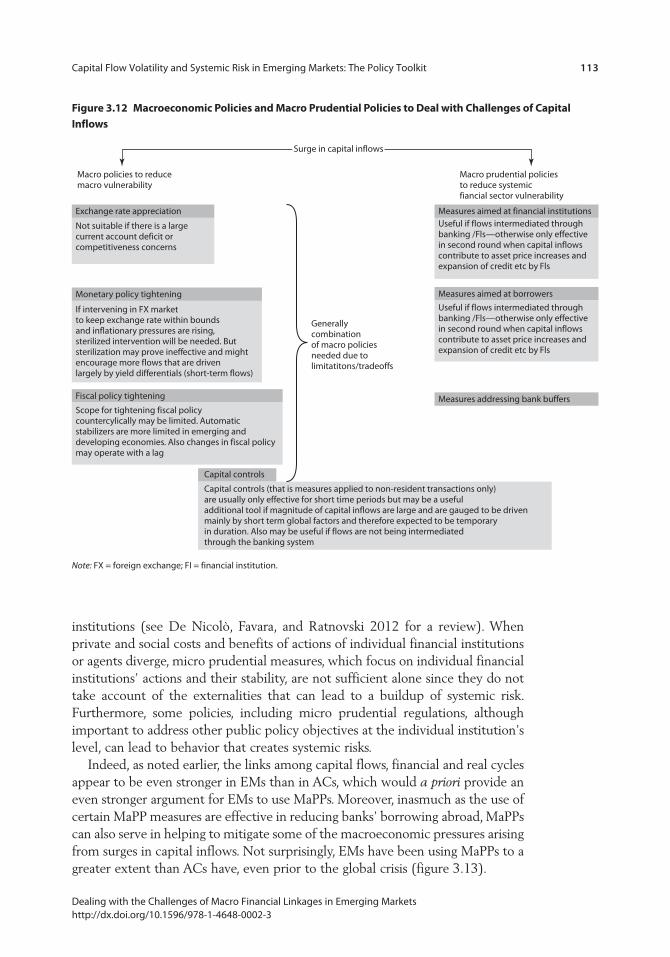
Given the trends and potential risks arising from volatile capital flows, what policy tools are available to EMs, besides diligent application of micro prudential regulations and tight supervision? A significant literature exists on the macroeco-nomic challenges of managing capital inflows and appropriate macroeconomic, macro prudential and capital flow management policies (see Korinek 2011 for a review of academic work and IMF 2012 for policy-related analyses). Not surpris-ingly, the appropriate policy options depend on the (global) causes of the capital flows and their temporary or permanent nature, and on prevailing domestic conditions and objectives. Some of these studies suggest a somewhat sequential, decision-tree-type approach, with choices depending on prevailing conditions and concerns (for instance, Ostry and others 2011). Generally, however, for most EMs receiving large inflows, it is likely that a sequential approach will not suffice and that a combination of macroeconomic, macro prudential policies and capital flow management policies is needed to avoid tradeoffs and limitations associated with each individual policy instrument (Ghosh 2010). This combination is sketched in figure 3.12.
Country differences will, therefore, be key in determining the optimal combi-nation of policies. For example, in the face of large capital inflows, allowing the exchange rate to appreciate would be an appropriate response for countries run-ning current account surpluses; however, an exchange rate appreciation in econo-mies already running current account deficits would only serve to exacerbate competitiveness concerns. Frequently, as documented in figure 3.10, capital inflows lead to domestic overheating pressures. Thus for countries where com-petitiveness or current account deficits and domestic inflationary pressures are concerns, sterilized foreign exchange intervention might be an option. However, sterilized intervention may prove fiscally too costly and ineffective, especially if capital flows are largely driven by global liquidity and short-term interest dif-ferentials, since higher domestic interest rates would only serve to attract more inflows. Although tightening fiscal policy could be beneficial under such circum-stances, it may prove difficult in practice since EMs tend to have few automatic stabilizers and fiscal policy operates with lags. Using several policy instruments as a package may then help minimize the limitations of each instrument and be more effective overall.
What about the vulnerabilities in the financial sector? The observed increase in average banking system vulnerabilities during surges of capital inflows to EMs argue for the use of macro prudential policies (MaPPs), together with supportive macroeconomic policies. The premise for the use of MaPPs rests on the existence of externalities and spillovers from the actions of individual agents/financial
Capital Flow Volatility and Systemic Risk in Emerging Markets: The Policy Toolkit 113
Dealing with the Challenges of Macro Financial Linkages in Emerging Marketshttp://dx.doi.org/10.1596/978-1-4648-0002-3
institutions (see De Nicolò, Favara, and Ratnovski 2012 for a review). When private and social costs and benefits of actions of individual financial institutions or agents diverge, micro prudential measures, which focus on individual financial institutions’ actions and their stability, are not sufficient alone since they do not take account of the externalities that can lead to a buildup of systemic risk. Furthermore, some policies, including micro prudential regulations, although important to address other public policy objectives at the individual institution’s level, can lead to behavior that creates systemic risks.
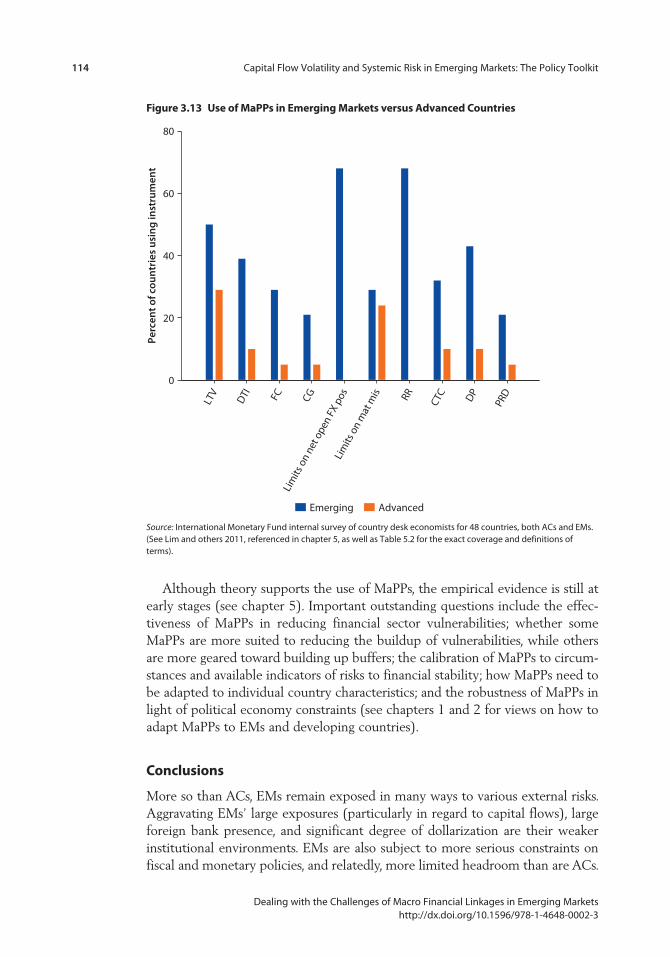
Indeed, as noted earlier, the links among capital flows, financial and real cycles appear to be even stronger in EMs than in ACs, which would a priori provide an even stronger argument for EMs to use MaPPs. Moreover, inasmuch as the use of certain MaPP measures are effective in reducing banks’ borrowing abroad, MaPPs can also serve in helping to mitigate some of the macroeconomic pressures arising from surges in capital inflows. Not surprisingly, EMs have been using MaPPs to a greater extent than ACs have, even prior to the global crisis (figure 3.13).
Macro prudential policiesto reduce systemicfiancial sector vulnerability
Macro policies to reducemacro vulnerability
Measures aimed at financial institutionsUseful if flows intermediated throughbanking /Fls—otherwise only effectivein second round when capital inflowscontribute to asset price increases andexpansion of credit etc by Fls
Exchange rate appreciation
Not suitable if there is a largecurrent account deficit orcompetitiveness concerns
Monetary policy tightening
Generallycombinationof macro policiesneeded due tolimitatitons/tradeoffs
If intervening in FX marketto keep exchange rate within boundsand inflationary pressures are rising,sterilized intervention will be needed. Butsterilization may prove ineffective and mightencourage more flows that are drivenlargely by yield differentials (short-term flows)
Fiscal policy tightening
Scope for tightening fiscal policycountercylically may be limited. Automaticstabilizers are more limited in emerging anddeveloping economies. Also changes in fiscal policymay operate with a lag
Capital controls
Capital controls (that is measures applied to non-resident transactions only)are usually only effective for short time periods but may be a usefuladditional tool if magnitude of capital inflows are large and are gauged to be drivenmainly by short term global factors and therefore expected to be temporaryin duration. Also may be useful if flows are not being intermediatedthrough the banking system
Measures aimed at borrowers
Measures addressing bank buffers
Useful if flows intermediated throughbanking /Fls—otherwise only effectivein second round when capital inflowscontribute to asset price increases andexpansion of credit etc by Fls
Surge in capital inflows
Figure 3.12 Macroeconomic policies and Macro prudential policies to Deal with Challenges of Capital Inflows
Note: FX = foreign exchange; FI = financial institution.
114 Capital Flow Volatility and Systemic Risk in Emerging Markets: The Policy Toolkit
Dealing with the Challenges of Macro Financial Linkages in Emerging Marketshttp://dx.doi.org/10.1596/978-1-4648-0002-3
LTV
DTI FC CG
Lim
its o
n ne
t ope
n FX
pos
Lim
its o
n m
at m
is RR CTC DP
PRD
Perc
ent o
f cou
ntr
ies
usin
g in
stru
men
t
0
20
40
60
80
Emerging Advanced
Figure 3.13 Use of Mapps in emerging Markets versus advanced Countries
Source: International Monetary Fund internal survey of country desk economists for 48 countries, both ACs and EMs. (See Lim and others 2011, referenced in chapter 5, as well as Table 5.2 for the exact coverage and definitions of terms).
Although theory supports the use of MaPPs, the empirical evidence is still at early stages (see chapter 5). Important outstanding questions include the effec-tiveness of MaPPs in reducing financial sector vulnerabilities; whether some MaPPs are more suited to reducing the buildup of vulnerabilities, while others are more geared toward building up buffers; the calibration of MaPPs to circum-stances and available indicators of risks to financial stability; how MaPPs need to be adapted to individual country characteristics; and the robustness of MaPPs in light of political economy constraints (see chapters 1 and 2 for views on how to adapt MaPPs to EMs and developing countries).
Conclusions
More so than ACs, EMs remain exposed in many ways to various external risks. Aggravating EMs’ large exposures (particularly in regard to capital flows), large foreign bank presence, and significant degree of dollarization are their weaker institutional environments. EMs are also subject to more serious constraints on fiscal and monetary policies, and relatedly, more limited headroom than are ACs.
Capital Flow Volatility and Systemic Risk in Emerging Markets: The Policy Toolkit 115
Dealing with the Challenges of Macro Financial Linkages in Emerging Marketshttp://dx.doi.org/10.1596/978-1-4648-0002-3
To manage these risks, we argue that EMs should continue to use a different and broad set of policies, including MaPP tools in addition to monetary, fiscal, and micro prudential policies.
At the same time, concerns in EMs are becoming similar to those of ACs given their rapidly changing financial sectors. Changes in financial systems raise—as they did for ACs before the global crisis—challenges of supervisory oversight, where to draw the perimeter, how to address emerging developments (such as shadow banking), and how to regulate and supervise foreign banks. Also, as banks in EMs increase in size and complexity, cross-sectional risks (for example, arising from “too big to fail” and contagion) are increasing. Importantly, domestic finan-cial cycles in EMs are becoming more important in driving economic out-comes—indeed many are already experiencing concerns about credit booms, including real estate, and their attendant risks.
Overall, EMs are therefore likely to benefit by continuing their general prag-matic approach of supporting the use of traditional macroeconomic manage-ment tools with both MaPPs and CFM tools as needed. What constitutes the best mix of policies though, can benefit from further research, including investiga-tions into what are the most effective and efficient MaPP approaches.
Notes
1. “Gross inflows” and “gross outflows” are also “net” items since capital flows can involve transactions by foreigners (nonresidents) and domestic agents (residents). Gross inflows refer to the net of foreigners’ purchases of domestic securities and domestic resi-dents’ sales of foreign securities. Gross outflows refer to the net of foreigners’ sales of domestic securities and domestic residents’ purchases of foreign securities. Net inflows are the net of the two—that is gross inflows minus gross outflows. For a resident vs. non-resident and inflows vs. outflows, four-way-based classification of gross capital flows, see Forbes and Warnock (2012).
2. In the case of EMs, net capital inflows generally reflect changes in their external liabili-ties or gross inflows since EMs’ gross outflows (or changes in their asset positions) tend to be much smaller in magnitude as their holdings of foreign assets are still rela-tively small.
3. Analytically, a distinction can be made between macro prudential measures, which are motivated by systemic financial risk concerns and which aim to limit the financial sec-tor’s contribution to overall risks or strengthen its ability to cope with risks, and CFM measures, which are motivated by overall macroeconomic risks and which aim to affect the rights or ability of nonresidents or residents to enter into capital account transac-tions. In practice, the two categories have a sizable overlap (for example, limits on banks’ foreign exchange positions driven by systemic financial risk considerations can be con-sidered both a macro prudential and a CFM tool). The overlap is not complete, however. For instance, a tax imposed on equity flows motivated by macro vulnerability concerns (such as excessive exchange rate appreciation) could be classified as a CFM tool but not as a macro prudential tool. Or a loan-to-value limit motivated by systemic consider-ations imposed on banks could be considered a macro prudential, but not a CFM, tool.
4. The methodology determined the peaks and troughs of any given series by first searching for maxima and minima over a given period of time. It then selected pairs
116 Capital Flow Volatility and Systemic Risk in Emerging Markets: The Policy Toolkit
Dealing with the Challenges of Macro Financial Linkages in Emerging Marketshttp://dx.doi.org/10.1596/978-1-4648-0002-3
of adjacent, locally absolute maxima and minima that met certain censoring rules requiring a certain minimal duration of cycles and phases. For further details on the methodology see Claessens, Kose, and Terrones (2011),
5. We used the samples of ACs and EMs separately to determine the 30 percent cutoffs as capital flow volatility is much larger for EMs than for ACs (using a combined sample would show very few surges or stops in ACs).
6. The overlap was defined for credit, equity, and house-price cycles as financial events that start at the same time as the recessions (or recoveries) or one quarter before the start of the recessions (or recovery). Capital flows events and financial crises, which are only dated on an annual basis, are considered to overlap with the business cycle if the financial event started at the same time as the recession (or recovery) or one year before or two years after the peak (trough) of the business cycles.
7. Note that the latter is partly because of the differences in data coverage between ACs and EMs. For instance, for most EMs, data on credit developments start later than for ACs and house-price data are still not available for all EMs. At the same time, capital flows data are generally available for the whole sample period. This means that we are more likely to document large movements in capital flows than large domestic finan-cial cycles during business cycles in EMs.
8. Indeed, inflow surges to EMs are mainly liability driven, that is, reflect nonresident purchases of domestic assets (Ghosh and others 2012).
9. Ghosh and others found that the unconditional probability of a surge is 22 percent. Against this probablility, a 100 basis-point fall in U.S. real interest rates—at mean values—increases the probability of a surge by 3 percentage points; and a 1 standard deviation reduction in volatility of S&P500 index by 3 percentage points.
10. Ghosh and others suggest, therefore, that global factors act largely as “gatekeepers”—capital surges toward EMs only when conditions are ripe, but once a hurdle is passed, the volume of capital flows is largely independent of the conditions.
11. The latter amplification mechanisms are collectively known as “the financial accelera-tor.” These models show how small shocks, real or financial, can be propagated and amplified across the real economy as they lead to changes in access to finance for corporations and households. Here the financial system is less a cause of, but more accommodates, procyclicality. Obviously, there are many interactions between the demand and supply sides causes. See Brunnermeier, Eisenbach, and Sannikov 2012, for a review of analytical models of both demand and supply side factors.
12. Moreover, capital outflows from an EM can sometimes originate in response to devel-opments unrelated to that particular EM. This could arise from “pure” contagion whereby adverse developments/shocks in one EM cause investors to withdraw from other EMs even though the economic fundamentals may be dissimilar because of more fragile investor confidence. Or in some cases it can occur for more structural reasons. For instance, as foreign bank presence is greater in EMs than in ACs, more than double, shocks to foreign banks’ operations (including those originating from head-quarters) can have significant impacts on EMs’ domestic financial and real sectors.
references
Agosin, Manuel R., and Franklin Huaita. 2012. “Overreaction in Capital Flows to Emerging Markets: Booms and Sudden Sops.” Journal of International Money and Finance 31 (5): 1140–55.
Capital Flow Volatility and Systemic Risk in Emerging Markets: The Policy Toolkit 117
Dealing with the Challenges of Macro Financial Linkages in Emerging Marketshttp://dx.doi.org/10.1596/978-1-4648-0002-3
Avdjiev, Stefan, Robert N. McCauley, and Patrick McGuire. 2012. “Rapid Credit Growth and International Credit: Challenges for Asia.” Working Paper 377, Bank for International Settlements, Basel, Switzerland, April.
Brunnermeier, Markus K., Thomas Eisenbach, and Yuliy Sannikov. 2012. “Macroeconomics with Financial Frictions: A Survey.” NBER Working Paper No. 18102, National Bureau of Economic Research, Cambridge, MA.
Brunnermeier, Markus K., Charles Goodhart, Andrew Crocket, Avinash Persaud, and Hyun Shin. 2009. “The Fundamental Principles of Financial Regulation.” 11th Geneva Report on the World Economy, International Center for Monetary and Banking Studies, Geneva
Bruno, Valentina, and Hyun Song Shin. 2013. “Capital Flows, Cross-Border Banking and Global Liquidity.” NBER Working Paper No. 19038, National Bureau of Economic Research, Cambridge, MA.
Claessens, Stijn, and Swati R. Ghosh. 2012. “Financial Regulations on International Capital Flows and Exchange Rates.” EWC/KDI Conference on Financial Regulations on International Capital Flows and Exchange Rates. The East-West Center and the Korea Development Institute, Honolulu, Hawaii.
Claessens, Stijn, M. Ayhan Kose, and Marco E. Terrones. 2011. “How Do Business and Financial Cycles Interact?” Working Paper 11/88, International Monetary Fund, Washington, DC. http://www.imf.org/external/pubs/ft/wp/2011/wp1188.pdf (short-er version published in Journal of International Economics 87 (1): 178–90.
Claessens, Stijn and Neeltje van Horen. 2012. “Foreign Banks: Trends and Impact.” IMF Working Paper No. 12/10, International Monetary Fund, Washington, DC.
De Nicolò, Gianni, Giovanni Favara, and Lev Ratnovski. 2012. “Externalities and Macroprudential Policy.” Staff Discussion Notes12/05, International Monetary Fund, Washington, DC.
FSB (Financial Stability Board). 2012. “Financial Stability Board Reports to G20 on Progress of Financial Regulatory Reforms.” Financial Stability Board, Press Release, November 5. http://www.financialstabilityboard.org/press/pr_121105.pdf.
Forbes, Kristin, and Frank Warnock. 2012. “Capital Flow Waves: Surges, Stops, Flight and Retrenchment.” Journal of International Economics 88 (2): 235–51.
Ghosh, Swati R. 2010. “Dealing with the Challenges of Capital Inflows in the Context of MacroFinancial Links.” Economic Premise Note 19, World Bank, Washington, DC.
Ghosh, Atish R., Jun Kim, Mahvash S. Qureshi, and Juan Zalduendo. 2012. “Surges.” Working Paper 12/22, International Monetary Fund, Washington, DC.
IMF (International Monetary Fund). 2011. “World Economic Outlook—Tensions from the Two-Speed Recovery: Unemployment, Commodities, and Capital Flows.” International Monetary Fund, April. http://www.imf.org/external/pubs/ft/weo/2011/01/.
———. 2012. The Liberalization and Management of Capital Flows—An Institutional View. Washington, DC: International Monetary Fund.
Korinek, Anton. 2011. “The New Economics of Prudential Capital Controls: A Research Agenda.” IMF Economic Review 59 (November 7): 523–61.
Laeven, Luc, and Fabian Valencia. 2008. “Systemic Banking Crises: A NewDatabase.” Working Paper WP/08/224, International Monetary Fund, Washington, DC.
———. 2012. “Systemic Banking Crises Database: An Update.” Working Paper 12/163, International Monetary Fund, Washington, DC.

118 Capital Flow Volatility and Systemic Risk in Emerging Markets: The Policy Toolkit
Dealing with the Challenges of Macro Financial Linkages in Emerging Marketshttp://dx.doi.org/10.1596/978-1-4648-0002-3
Lim, C. H., F. Columba, A. Costa, P. Kongsamut, A. Otani, M. Saiyid, T. Wezel, and X. Wu. 2011. “Macroprudential Policy: What Instruments and How to Use Them? Lessons from Country Experiences.” Working Paper 11/238, International Monetary Fund, Washington, DC.
Ostry, Jonathan David, Atish R. Ghosh, Karl Friedrich Habermeier, Luc Laeven, Marcos Chamon, Mahvash Saeed Qureshi, and Annamaria Kokenyne. 2011. “Managing Capital Inflows: What Tools to Use?” Staff Discussion Note 11/06, International Monetary Fund, Washington, DC.
Shin, Hyun Song. 2012. “Global Banking Glut and Loan Risk Premium. 2011 Mundell-Fleming Lecture, IMF Economic Review 60 (July): 155–92.
———. 2013. “Adapting Macro Prudential Approaches to Emerging and Developing Economies.” In Dealing with the Challenges of Macro Financial Linkages in Emerging Markets, edited by Otaviano Canuto and Swati R. Ghosh. Washington, DC: World Bank.