capital asset pricing model and pricing of islamic...
TRANSCRIPT
JKAU: Islamic Econ., Vol. 29 No. 1, pp: 21-39 (January 2016)
DOI: 10.4197 / Islec. 29-1.2
21
Capital Asset Pricing Model and Pricing of Islamic Financial Instruments
Shabir Ahmad Hakim*, Zarinah Hamid** and Ahamed Kameel Mydin Meera** *Effat University Jeddah, Saudi Arabia, **International Islamic University Malaysia
Abstract. The prohibitions of ribā (interest) and trading in non-ḥalāl businesses in Islam redefines investment universe assumed by Capital Asset Pricing Model (CAPM). In Islamic investment world, risk-free asset and market portfolio with non-ḥalāl constituents are irrelevant. We propose two-versions of Sharīʿah-compliant CAPM that use Sharīʿah-complaint market portfolio and are free of risk-free asset. We test the proposed models together with conventional CAPM in Bursa Malaysia using three- and ten-year data. The test results of the models with three-year data reveal remarkable similarity between versions of Sharīʿah-compliant models. Besides, Sharīʿah-compliant CAPM is as capable of explaining returns on Sharīʿah-complaint stocks as conventional CAPM is of explaining returns on all stocks.
Keywords: Asset pricing, Sharīʿah-compliant CAPM, Sharīʿah-compliant zero-beta portfolio, Sharīʿah-compliant market portfolio, Islamic financial instruments
JEL Classification: G11, G12, G15
KAUJIE Classification: L31, I41, I43
1. Introduction
Capital asset pricing model (CAPM) of William Sharpe (1964) extends Markowitz’s mean variance theory (MVT) by adding the assumptions of the presence of risk-free lending and borrowing and homogeneity of the expectations of investors. CAPM combines capital market line (CML) and Markowitz’s efficient frontier to identify a tangency market portfolio that consists of all risky assets in the market. The market portfolio is assumed to be
sufficient for explaining returns on any risk asset. Furthermore, market portfolio together with a risk-free asset, the return on which represents the intercept of CML, constitutes the investment universe for investors. However, CAPM with such an investment universe is not applicable to the explanation of returns on Islamic financial instruments because of the restrictions imposed by Sharīʿah on dealing with interest (ribā) and engaging in non-ḥalāl businesses.
22 Shabir Ahmad Hakim, Zarinah Hamid and Ahamed Kameel Mydin Meera
Allah Almighty admonishes Muslims of indulging in ribā by saying:
Those who eat ribā will not stand (on the Day of Resurrection) except like the standing of a person beaten by Shayṭān (Satan) leading him to insanity. … So whosoever receives an admonition from his Lord and stops eating ribā, shall not be punished for the past; his case is for Allah; but whoever returns (to ribā) such are the dwellers of the Fire (Qur’ān 2: 275).
Allah also says:
O you who believe! Be afraid (have taqwá) of Allah and give up what remains from ribā, if you are (really) believers. And if you do not do it, then take a notice of war from Allah and His Messenger but if you repent, you shall have your capital sums. Deal not unjustly, and you shall not be dealt with unjustly (Qur’ān 2:278-279).
Given the severity of indulgence in ribā, Muslim investors are not expected to hold risk-free interest-bearing assets of CAPM. In addition, Allah (SWT) commands Muslims to stay away from forbidden, non-ḥalāl businesses, saying:
O you who believe! Indeed intoxicants, gambling, sacrificing on stone alters (to other than Allah), and divining arrows are but defilement from the work of Shayṭān (Satan). So avoid that in order that you may be successful (Qur’ān 5:90).
Hence, the market portfolio of CAPM that consists of the stocks of both ḥalāl and non-ḥalāl businesses is not a permissible investment option for Muslim investors.
The Qur’ānic injunctions redraw the domain of Muslim’s investment activities. The prohibition of ribā drops out interest-bearing risk-free assets from the investment universe and prohibition of engaging in non-ḥalāl businesses necessitates restructuring of the market portfolio. Under these circumstances, the natural questions that arise are: 1) Is CAPM relevant for explaining returns on assets in the Islamic investment universe, 2) If it is, then what needs to be done to make it applicable in Islamic financial
universe. To answer these questions, we propose two alternative versions of CAPM with investment universes that are fully in compliance with the dictates of Sharīʿah. First, we follow Black (1972) and relax the assumption of risk-free lending and borrowing in CAPM and propose use of a Sharīʿah-compliant zero-beta portfolio in place of the risk-free asset. Second, assuming absence of a zero-beta portfolio, we pursue Lintner (1965) approach and replace risk-free asset with cash holding; cash is an asset that does not earn any returns. In addition, we suggest use of a risky market portfolio that is constituted by the stocks of Sharīʿah-compliant businesses only.
The need for a fully Sharīʿah-compliant CAPM is warranted by the phenomenal growth of Islamic financial system in the last three decades. Over years, a number of Sharīʿah-compliant Islamic financial instruments that cater to various investment needs of Muslim investors have been introduced. Because Islamic financial instruments differ from the conventional financial instruments in terms of their legal framework and the nature of transactions, it is imperative that asset pricing models originally designed for conventional financial instruments are customized so that they are applicable to Islamic financial instruments (Jobst, 2007). Furthermore, sustainability of the attractiveness of Islamic financial instruments is contingent on investors’ ability to fairly assess their risk return dynamics. Recognizing the need for asset pricing models that not only are based on the investment alternatives permitted by Sharīʿah but also are capable of capturing the true nature of the risk and return dynamics of Islamic financial instruments, we propose two versions of Sharīʿah-compliant CAPM (SCAPM) that are free of the elements forbidden by Sharīʿah. We do acknowledge the shortcomings of CAPM assertion of the sufficiency of market portfolio in explaining stock returns, which in fact, led to the emergence of multifactor asset pricing models. However, the multifactor asset pricing models recognize the dominance of market portfolio in explaining returns of risky assets (Fama and French, 1996; Carhart, 1997; Pastor and Stambaugh, 2003). Hence, we deem it worthwhile to focus on developing CAPM that adheres to the dictates of Sharīʿah and is useful for investors in Islamic financial system.
Capital Asset Pricing Model and Pricing of Islamic Financial Instruments 23
The proposed models of this study are tested in Bursa Malaysia (Malaysian Stock Market) to estimate returns on nine portfolios constructed from the stocks of the Sharīʿah-compliant firms listed on the Bursa. We use FTSE Bursa Malaysia EMAS Sharīʿah Index as proxy for the Sharīʿah-compliant market portfolio and one-year yield of AAA-rated ṣukūk as proxy for the zero-beta portfolio. However, due to limited data available on AAA-ṣukūk, we are restricted to a three-year window for testing the SCAPM that replaces risk-free rate with return on Sharīʿah-complaint zero-beta portfolio. To assess performance of this model, we run other models over the same period. The test results of the SCAPMs exhibit remarkable similarity in beta coefficients and explanatory powers to the extent that they seem to be useable interchangeably. Therefore, we test SCAPM with cash and conventional CAPM over a ten-year period from January 2004 to December 2013. We observe that despite differences in the model inputs, the behavior of the Sharīʿah-compliant CAPM is as good an indicator of the returns on Sharīʿah-compliant assets as conventional CAPM is of all risky assets.
The rest of the paper is organized as follows: section 2 reviews the studies related to this study, section 3 proposes CAPM for Islamic financial instruments, section 4 explains data and methodology, section 5 discusses the empirical results, and section 6 concludes the paper.
2. Related Studies
Islamic financial system is expected to be based on the fundamental principle of total submission to the commands of Allah, including adherence to highest moral values and establishment of social justice. The forbiddance of ribā bears on ethical and moral dimensions of the Islamic financial system (Mulcahy, 2014). The ribā-based system encourages accumulation of wealth in the hands of few individuals, who tend to be disinterested in the welfare of their fellow human beings (Karsten, 1982). Furthermore, ribā represents one end of the two forbidden extremes of risk taking, that of avoidance of risk in wealth creation. The other extreme of high risk behavior involves gambling and speculative activities (Zaher and Hassan, 2001; Rosly and Zaini, 2008). Islamic finance recognizes the relationship between risk and return on assets, but
demands observance of high moral values in handling risk and return dynamics (Rosly and Zaini, 2008).
The significant growth of the Islamic financial system in recent decades has led to the emergence of a number of Sharīʿah-complaint Islamic financial instruments customized to the investment needs of Muslim investors. These instruments are structurally different from conventional financial instruments with respect to their legal framework and nature of transactions, which necessitate customization of conventional asset pricing models for pricing them (Jobst, 2007). However, Islamic finance researchers have paid little attention to the pricing of Islamic financial instruments. Moreover, previous studies on Islamic asset pricing have limited scope because of their lack of comprehensiveness in capturing the defining characteristics of Islamic financial instruments.
Tomkins and Karim (1987) suggest removal of risk-free rate from the CAPM equation such that the returns on assets are linearly dependent on their standardized covariance with the market portfolio. The study acknowledges prohibition of ribā as well as sufficiency of the market portfolio in explaining asset returns. However, it ignores prohibition of dealing with non-ḥalāl businesses that are components of the market portfolio. Several other studies propose use of different alternatives of risk-free rate, such as nominal GDP (Shaikh, 2009), zakāh rate (El-Ashker, 1987), and inflation (Hanif, 2011). These studies fall short of suggesting a SCAPM that does not violate the fundamental principles of CAPM theory. Shaikh (2009) uses nominal GDP lagged by one year, which is not in synch with single-period static CAPM that assumes presence of instantaneous risk-free assets. An instantaneous risk-free is an asset about which at any instant of time investors are certain about its expected returns (Merton, 1973). Furthermore, CAPM is an extension of Markowitz’s mean variance theory (MVT), which states that investors can diversify risk of their portfolios by combining risky assets that are not perfectly correlated with one another. CAPM extends MVT by combining a risky investment in the form of market portfolio with a risk-free asset. In other words, the inputs to CAPM are returns that investors can earn on the investment alternatives. To the best knowledge of the researchers, there is not any asset that earns nominal GDP, zakāh rate, or inflation rate. In addition, inflation rate and GDP are expected
24 Shabir Ahmad Hakim, Zarinah Hamid and Ahamed Kameel Mydin Meera
to affect cross section of returns in a market and were used as state variables in the first economic multifactor model by Chen, Roll, and Ross (1986). The state variables cannot replace risk-free asset or zero beta portfolio, which are insulated from the fluctuations in the economy (Black, 1972; Wei, 1988; Fama, 1996). Moreover, the use of conventional market portfolio in these studies ignores restrictions imposed by Sharīʿah on dealing with non-ḥalāl businesses, which is tantamount to treating Islamic financial market a subset of the overall market, to which we disagree. We treat an Islamic financial market as a separate entity that is independent of the conventional market.
Several other studies have used CAPM and other conventional performance measurement tools to evaluate the performance of Islamic financial instruments. Selim (2008) illustrates that within CAPM framework, zero risk-free rate optimizes the risk-return relationship in mushārakah contracts. In his derivation, he uses total return that includes both economic profit and opportunity cost of the invested capital, computed as the risk-free return. Abbes (2012) ignores prohibition of ribā and applies conventional CAPM and Sharpe ratio to compare rate of return on Islamic and conventional market indices. Dewi and Ferdian (2012) follow similar procedures in evaluating performance of Islamic mutual funds in Malaysia and Indonesia. Similarly, Affaneh, Albohali, and Boldin (2013) compare performance of the Islamic and conventional mutual funds using Sharpe ratio adjusted for autocorrelation and skewness with excess portfolio returns computed net of risk-free rate.
All these studies overlook the structural differences between conventional and Islamic financial products caused by the restrictions imposed by the Sharīʿah. They treat Islamic instruments as subset of the overall market, the constituents of which can be evaluated like any other asset in the market. Recognizing the uniqueness of the Islamic instruments and the investment universe they belong to, this study proposes versions of SCAPM that use inputs that are in total compliance with the dictates of Sharīʿah and are free of forbidden elements of ribā and non-ḥalāl businesses. Besides, it upholds the fundamental principles of CAPM, those of returns used in the model are returns or lack of returns on the assets held or invested in.
3. CAPM for the Islamic Financial Instruments
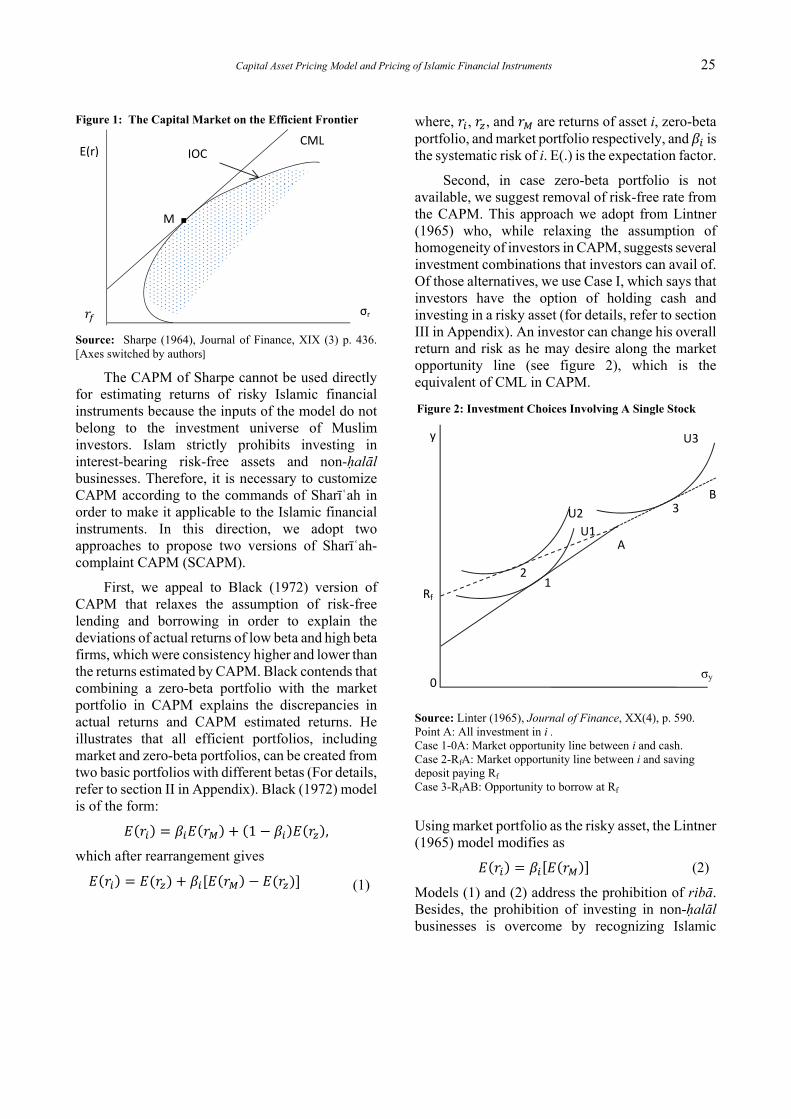
Sharpe (1964) extends Markowitz’s mean variance theory (MVT) to develop a capital asset pricing model (CAPM) under the condition of market equilibrium. He adds two assumptions to MVT(1): (i) investors can lend and borrow at pure risk-free rate, and (ii) investors have homogenous expectations and evaluate the available investment options identically. He combines capital market line (CML) and Markowitz’s efficient frontier to define the investment opportunity set for the investors. The intercept of CML represents return on risk-free asset and CML’s point of tangency on efficient frontier represents a risky portfolio that is constituted by all risky assets (see figure 1 below). He concludes that risk-free asset and risky portfolio represent investment universe under the condition of market equilibrium and tangency portfolio is sufficient to explain returns on any risky asset (for derivation of CAPM, refer to section I in Appendix).
(1) Assumptions of MVT: 1) Investors characterize investments
based on probability distribution of their expected holding period returns. 2) The risk of an investment is reflected by the variance of its returns. 3) Investors make decisions on the basis of probability distribution of the expected returns and their volatility. 4) Investors are risk averse and prefer higher return for a given level of risk and lower risk for a given level of return. 5) Investors aim at maximizing their one-period expected utility (Reilly and Brown, 2003).
Capital Asset Pricing Model and Pricing of Islamic Financial Instruments 25
Figure 1: The Capital Market on the Efficient Frontier
Source: Sharpe (1964), Journal of Finance, XIX (3) p. 436. [Axes switched by authors]
The CAPM of Sharpe cannot be used directly for estimating returns of risky Islamic financial instruments because the inputs of the model do not belong to the investment universe of Muslim investors. Islam strictly prohibits investing in interest-bearing risk-free assets and non-ḥalāl businesses. Therefore, it is necessary to customize CAPM according to the commands of Sharīʿah in order to make it applicable to the Islamic financial instruments. In this direction, we adopt two approaches to propose two versions of Sharīʿah-complaint CAPM (SCAPM).
First, we appeal to Black (1972) version of CAPM that relaxes the assumption of risk-free lending and borrowing in order to explain the deviations of actual returns of low beta and high beta firms, which were consistency higher and lower than the returns estimated by CAPM. Black contends that combining a zero-beta portfolio with the market portfolio in CAPM explains the discrepancies in actual returns and CAPM estimated returns. He illustrates that all efficient portfolios, including market and zero-beta portfolios, can be created from two basic portfolios with different betas (For details, refer to section II in Appendix). Black (1972) model is of the form:
1 ,
which after rearrangement gives
(1)
where, , , and are returns of asset i, zero-beta portfolio, and market portfolio respectively, and is the systematic risk of i. E(.) is the expectation factor.
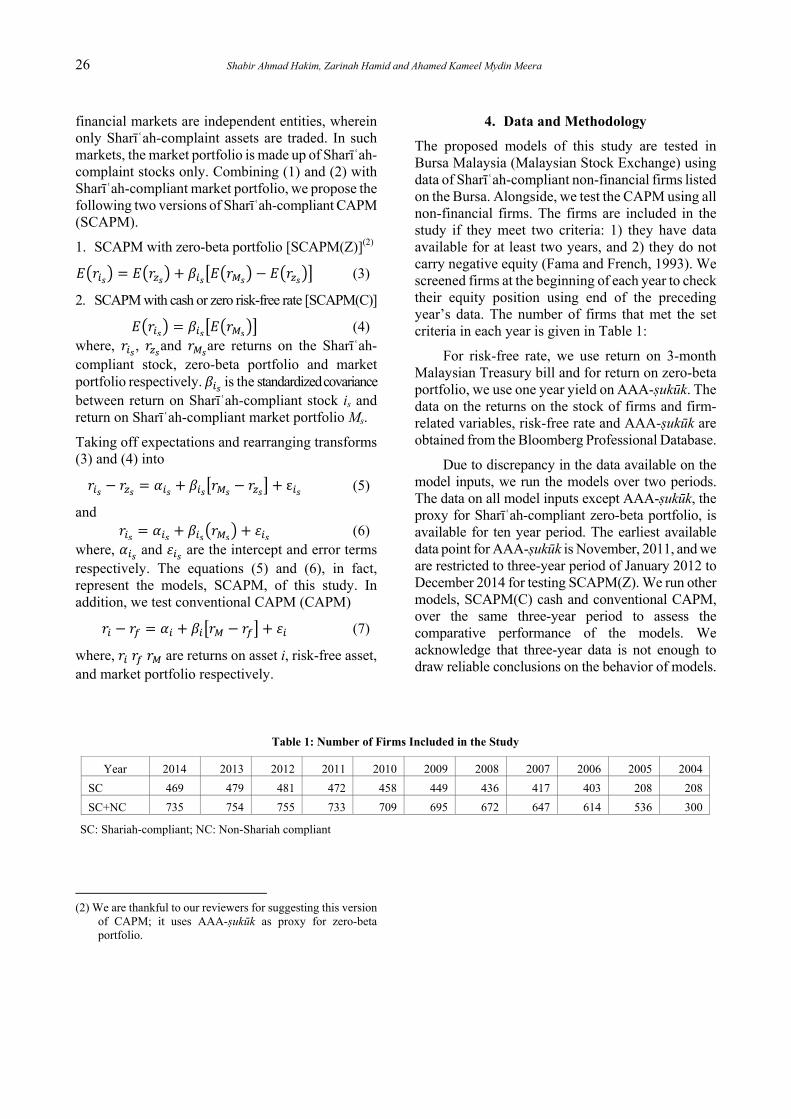
Second, in case zero-beta portfolio is not available, we suggest removal of risk-free rate from the CAPM. This approach we adopt from Lintner (1965) who, while relaxing the assumption of homogeneity of investors in CAPM, suggests several investment combinations that investors can avail of. Of those alternatives, we use Case I, which says that investors have the option of holding cash and investing in a risky asset (for details, refer to section III in Appendix). An investor can change his overall return and risk as he may desire along the market opportunity line (see figure 2), which is the equivalent of CML in CAPM.
Source: Linter (1965), Journal of Finance, XX(4), p. 590. Point A: All investment in i . Case 1-0A: Market opportunity line between i and cash. Case 2-RfA: Market opportunity line between i and saving deposit paying Rf Case 3-RfAB: Opportunity to borrow at Rf
Using market portfolio as the risky asset, the Lintner (1965) model modifies as
(2)
Models (1) and (2) address the prohibition of ribā. Besides, the prohibition of investing in non-ḥalāl businesses is overcome by recognizing Islamic
σr
E(r)
CML IOC
M ∎
y
12
3
Rf
σy
A
B
0
Figure 2: Investment Choices Involving A Single Stock
U1
U3
U2
26 Shabir Ahmad Hakim, Zarinah Hamid and Ahamed Kameel Mydin Meera
financial markets are independent entities, wherein only Sharīʿah-complaint assets are traded. In such markets, the market portfolio is made up of Sharīʿah-complaint stocks only. Combining (1) and (2) with Sharīʿah-compliant market portfolio, we propose the following two versions of Sharīʿah-compliant CAPM (SCAPM).
1. SCAPM with zero-beta portfolio [SCAPM(Z)](2)
(3)
2. SCAPM with cash or zero risk-free rate [SCAPM(C)]
(4)where, , and are returns on the Sharīʿah-compliant stock, zero-beta portfolio and market portfolio respectively. is the standardized covariance between return on Sharīʿah-compliant stock is and return on Sharīʿah-compliant market portfolio Ms.
Taking off expectations and rearranging transforms (3) and (4) into
ε (5)
and (6)
where, and are the intercept and error terms respectively. The equations (5) and (6), in fact, represent the models, SCAPM, of this study. In addition, we test conventional CAPM (CAPM)
(7)
where, are returns on asset i, risk-free asset, and market portfolio respectively.
(2) We are thankful to our reviewers for suggesting this version
of CAPM; it uses AAA-ṣukūk as proxy for zero-beta portfolio.
4. Data and Methodology
The proposed models of this study are tested in Bursa Malaysia (Malaysian Stock Exchange) using data of Sharīʿah-compliant non-financial firms listed on the Bursa. Alongside, we test the CAPM using all non-financial firms. The firms are included in the study if they meet two criteria: 1) they have data available for at least two years, and 2) they do not carry negative equity (Fama and French, 1993). We screened firms at the beginning of each year to check their equity position using end of the preceding year’s data. The number of firms that met the set criteria in each year is given in Table 1:
For risk-free rate, we use return on 3-month Malaysian Treasury bill and for return on zero-beta portfolio, we use one year yield on AAA-ṣukūk. The data on the returns on the stock of firms and firm-related variables, risk-free rate and AAA-ṣukūk are obtained from the Bloomberg Professional Database.
Due to discrepancy in the data available on the model inputs, we run the models over two periods. The data on all model inputs except AAA-ṣukūk, the proxy for Sharīʿah-compliant zero-beta portfolio, is available for ten year period. The earliest available data point for AAA-ṣukūk is November, 2011, and we are restricted to three-year period of January 2012 to December 2014 for testing SCAPM(Z). We run other models, SCAPM(C) cash and conventional CAPM, over the same three-year period to assess the comparative performance of the models. We acknowledge that three-year data is not enough to draw reliable conclusions on the behavior of models.
Table 1: Number of Firms Included in the Study
Year 2014 2013 2012 2011 2010 2009 2008 2007 2006 2005 2004
SC 469 479 481 472 458 449 436 417 403 208 208
SC+NC 735 754 755 733 709 695 672 647 614 536 300
SC: Shariah-compliant; NC: Non-Shariah compliant
Capital Asset Pricing Model and Pricing of Islamic Financial Instruments 27
However, the test results are expected to provide a firsthand feel of the behavior of the model parameters. In addition, we test SCAPM(C) and CAPM over ten-year period of January 2004 to December 2013.
4.1 Model Inputs
Explanatory variables
CAPM is a single-factor that assumes sufficiency of market portfolio in explaining returns on risky stocks. In SCAPM, we use FTSE Bursa Malaysia EMAS Sharīʿah Index as proxy for the market portfolio. The index is constituted by Sharīʿah-compliant firms in the FTSE Bursa Malaysia EMAS Index that meet the screening requirement of the Sharīʿah Advisory Council (SAC)(3). As explanatory variables, we use returns on the index in excess of one-year yield on AAA-ṣukūk in SCAPM(Z), and actual returns on the index in SCAPM(C).
We test the conventional CAPM with return on FTSE Bursa Malaysia EMAS Index, in excess of return on 3-month Malaysian Treasury bill, as explanatory variable. FTSE Bursa Malaysia EMAS Index is a market capitalization-weighted index that consists of large cap and mid cap constituents of the FTSE Bursa Malaysia 100 Index and FTSE Bursa Malaysia Small Cap Index (FTSE Bursa Malaysia Index Series, 2014).
Dependent variables
The dependent variables in the models comprise of returns on nine portfolios created from the selected firms. We apply Fama and French (1993) sorting procedure, which involves sorting firms first on size then on book to market value of equity (B/M). In first sort, firms are divided in the proportion of 33:34:33 into three size groups: small (S), medium (M), and big (B). In second sort, the firms in each size group are further divided to create
(3) SAC requirements, as highlighted in the fact sheet of FTSE
Bursa Malaysia Index Screening (2014), stipulate that a Sharīʿah compliant firm should not be involved in any of the following as core business activity: 1) ribā-based financial services, 2) Gambling, 3) Manufacturing or selling of non-ḥalāl products, 4) Conventional insurance, 5) Non-permissible entertainment activities, 6) Manufacturing or selling of tobacco or tobacco-related products, 7) Trading in Sharīʿah non-compliant securities, and 8) Other activities deemed non-permissible according to Sharīʿah.
three B/M groups in the proportion of 33:34:33. The three groups thus obtained are high B/M (H), medium B/M (M) and low B/M (L). From the intersection of this 3x3 sort, nine portfolios, namely small size high B/M (SH), small size medium B/M (SM), small size low B/M (SL), medium size high B/M (MH), medium size medium B/M (MM), medium size low B/M (ML), big size high B/M (BH), big size medium B/M (BM), and big size low B/M (BL) are created. We use value-weighted returns on these portfolios as dependent variables.
The dependent portfolios for SCAPM are created from the Sharīʿah-compliant firms listed on the Bursa Malaysia (Bursa Malaysia, List of Companies, 2014) while portfolios for CAPM are created from all listed firms. The return on dependent portfolios for SCAPM(Z) is computed net of yield on AAA ṣukūk and the return on dependent portfolios for CAPM is computed net of rerun on 3-month Malaysian Treasury security. In case of SCAPM(C), actual return on portfolios is used. The dependent portfolios in all models are revised annually.
4.2 Descriptive Statistics of the Model Inputs
As mentioned earlier, we test our models over two periods: all models are tested over a three-year period, and SCAPM(C) and CAPM are also tested over a ten-year period. Therefore, we present the descriptive statistics of the three-year data first followed by the descriptives of the ten-year data.
4.2.1 Three Year Data
Descriptive Statistics of SCAPM(Z) Inputs
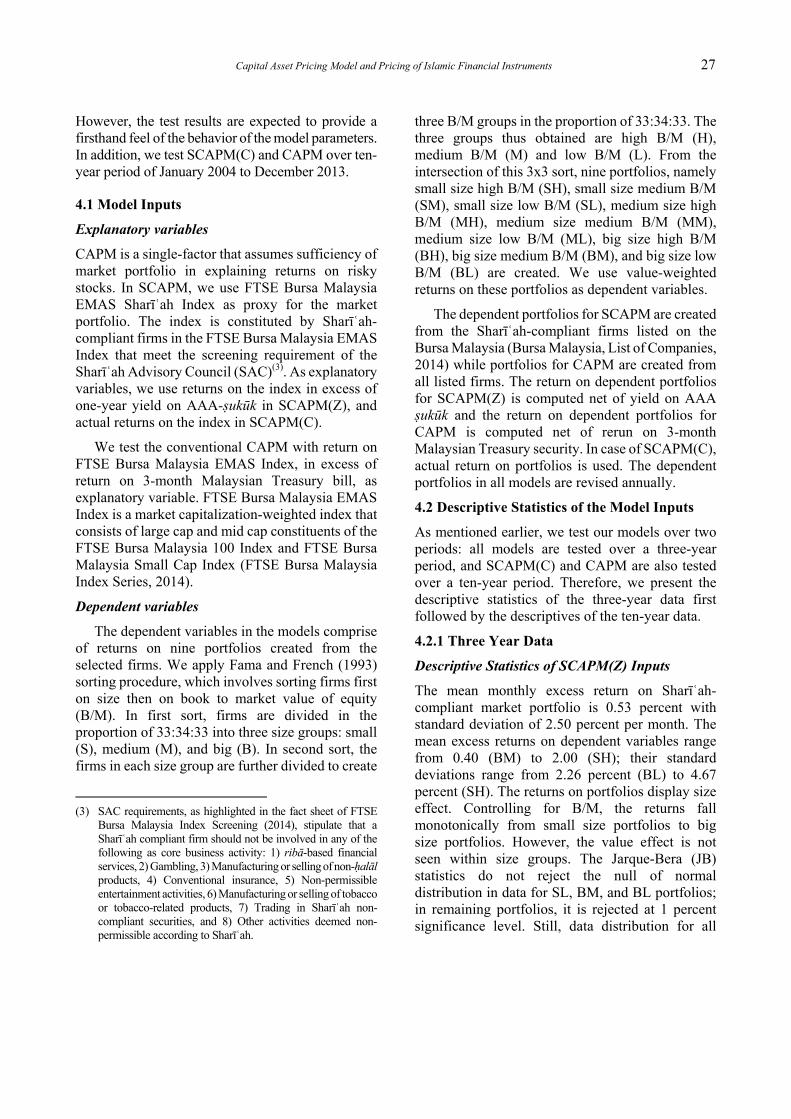
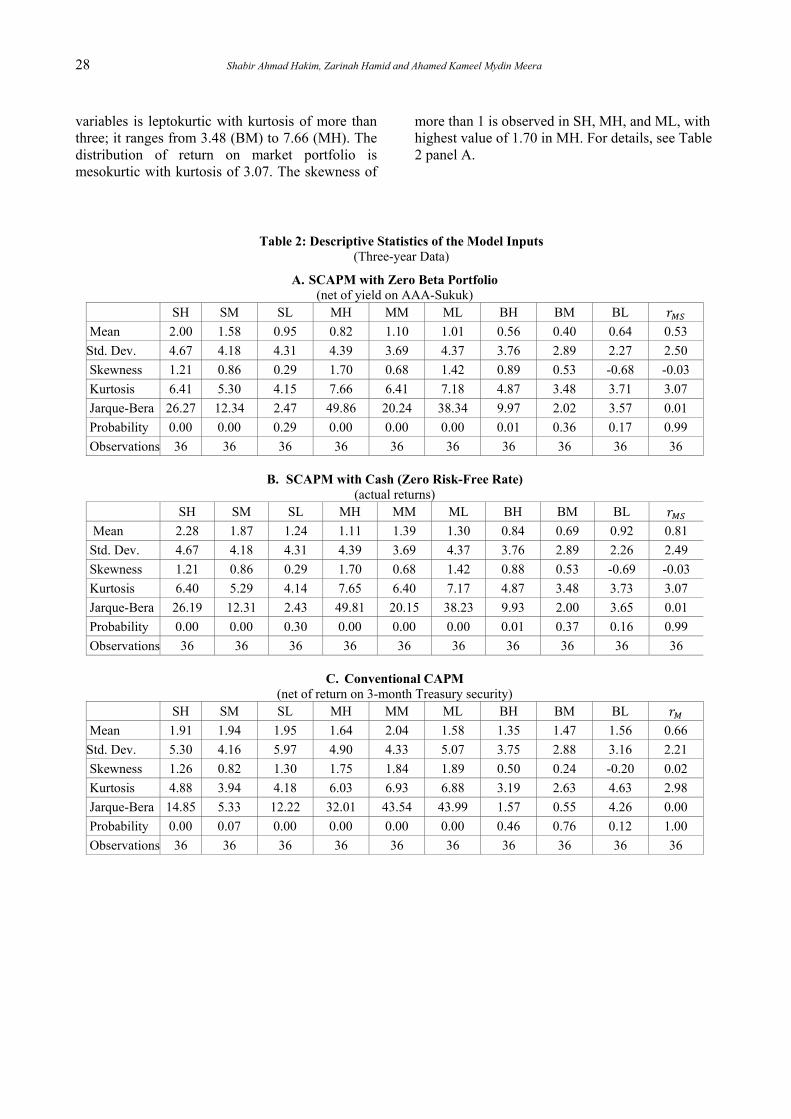
The mean monthly excess return on Sharīʿah-compliant market portfolio is 0.53 percent with standard deviation of 2.50 percent per month. The mean excess returns on dependent variables range from 0.40 (BM) to 2.00 (SH); their standard deviations range from 2.26 percent (BL) to 4.67 percent (SH). The returns on portfolios display size effect. Controlling for B/M, the returns fall monotonically from small size portfolios to big size portfolios. However, the value effect is not seen within size groups. The Jarque-Bera (JB) statistics do not reject the null of normal distribution in data for SL, BM, and BL portfolios; in remaining portfolios, it is rejected at 1 percent significance level. Still, data distribution for all
28 Shabir Ahmad Hakim, Zarinah Hamid and Ahamed Kameel Mydin Meera
variables is leptokurtic with kurtosis of more than three; it ranges from 3.48 (BM) to 7.66 (MH). The distribution of return on market portfolio is mesokurtic with kurtosis of 3.07. The skewness of
more than 1 is observed in SH, MH, and ML, with highest value of 1.70 in MH. For details, see Table 2 panel A.
Table 2: Descriptive Statistics of the Model Inputs
(Three-year Data)
A. SCAPM with Zero Beta Portfolio (net of yield on AAA-Sukuk)
SH SM SL MH MM ML BH BM BL
Mean 2.00 1.58 0.95 0.82 1.10 1.01 0.56 0.40 0.64 0.53
Std. Dev. 4.67 4.18 4.31 4.39 3.69 4.37 3.76 2.89 2.27 2.50
Skewness 1.21 0.86 0.29 1.70 0.68 1.42 0.89 0.53 -0.68 -0.03
Kurtosis 6.41 5.30 4.15 7.66 6.41 7.18 4.87 3.48 3.71 3.07
Jarque-Bera 26.27 12.34 2.47 49.86 20.24 38.34 9.97 2.02 3.57 0.01
Probability 0.00 0.00 0.29 0.00 0.00 0.00 0.01 0.36 0.17 0.99
Observations 36 36 36 36 36 36 36 36 36 36
B. SCAPM with Cash (Zero Risk-Free Rate) (actual returns)
SH SM SL MH MM ML BH BM BL
Mean 2.28 1.87 1.24 1.11 1.39 1.30 0.84 0.69 0.92 0.81
Std. Dev. 4.67 4.18 4.31 4.39 3.69 4.37 3.76 2.89 2.26 2.49
Skewness 1.21 0.86 0.29 1.70 0.68 1.42 0.88 0.53 -0.69 -0.03
Kurtosis 6.40 5.29 4.14 7.65 6.40 7.17 4.87 3.48 3.73 3.07
Jarque-Bera 26.19 12.31 2.43 49.81 20.15 38.23 9.93 2.00 3.65 0.01
Probability 0.00 0.00 0.30 0.00 0.00 0.00 0.01 0.37 0.16 0.99
Observations 36 36 36 36 36 36 36 36 36 36
C. Conventional CAPM (net of return on 3-month Treasury security)
SH SM SL MH MM ML BH BM BL
Mean 1.91 1.94 1.95 1.64 2.04 1.58 1.35 1.47 1.56 0.66
Std. Dev. 5.30 4.16 5.97 4.90 4.33 5.07 3.75 2.88 3.16 2.21
Skewness 1.26 0.82 1.30 1.75 1.84 1.89 0.50 0.24 -0.20 0.02
Kurtosis 4.88 3.94 4.18 6.03 6.93 6.88 3.19 2.63 4.63 2.98
Jarque-Bera 14.85 5.33 12.22 32.01 43.54 43.99 1.57 0.55 4.26 0.00
Probability 0.00 0.07 0.00 0.00 0.00 0.00 0.46 0.76 0.12 1.00
Observations 36 36 36 36 36 36 36 36 36 36
Capital Asset Pricing Model and Pricing of Islamic Financial Instruments 29
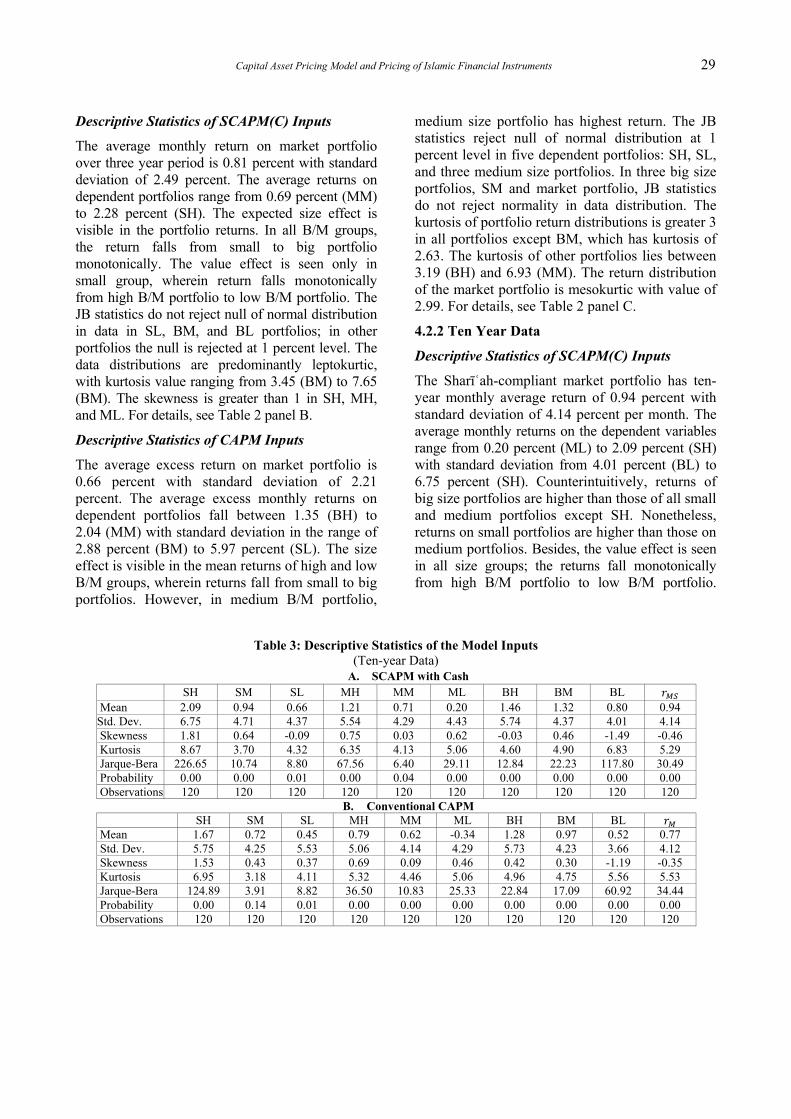
Descriptive Statistics of SCAPM(C) Inputs
The average monthly return on market portfolio over three year period is 0.81 percent with standard deviation of 2.49 percent. The average returns on dependent portfolios range from 0.69 percent (MM) to 2.28 percent (SH). The expected size effect is visible in the portfolio returns. In all B/M groups, the return falls from small to big portfolio monotonically. The value effect is seen only in small group, wherein return falls monotonically from high B/M portfolio to low B/M portfolio. The JB statistics do not reject null of normal distribution in data in SL, BM, and BL portfolios; in other portfolios the null is rejected at 1 percent level. The data distributions are predominantly leptokurtic, with kurtosis value ranging from 3.45 (BM) to 7.65 (BM). The skewness is greater than 1 in SH, MH, and ML. For details, see Table 2 panel B.
Descriptive Statistics of CAPM Inputs
The average excess return on market portfolio is 0.66 percent with standard deviation of 2.21 percent. The average excess monthly returns on dependent portfolios fall between 1.35 (BH) to 2.04 (MM) with standard deviation in the range of 2.88 percent (BM) to 5.97 percent (SL). The size effect is visible in the mean returns of high and low B/M groups, wherein returns fall from small to big portfolios. However, in medium B/M portfolio,
medium size portfolio has highest return. The JB statistics reject null of normal distribution at 1 percent level in five dependent portfolios: SH, SL, and three medium size portfolios. In three big size portfolios, SM and market portfolio, JB statistics do not reject normality in data distribution. The kurtosis of portfolio return distributions is greater 3 in all portfolios except BM, which has kurtosis of 2.63. The kurtosis of other portfolios lies between 3.19 (BH) and 6.93 (MM). The return distribution of the market portfolio is mesokurtic with value of 2.99. For details, see Table 2 panel C.
4.2.2 Ten Year Data
Descriptive Statistics of SCAPM(C) Inputs
The Sharīʿah-compliant market portfolio has ten-year monthly average return of 0.94 percent with standard deviation of 4.14 percent per month. The average monthly returns on the dependent variables range from 0.20 percent (ML) to 2.09 percent (SH) with standard deviation from 4.01 percent (BL) to 6.75 percent (SH). Counterintuitively, returns of big size portfolios are higher than those of all small and medium portfolios except SH. Nonetheless, returns on small portfolios are higher than those on medium portfolios. Besides, the value effect is seen in all size groups; the returns fall monotonically from high B/M portfolio to low B/M portfolio.
Table 3: Descriptive Statistics of the Model Inputs (Ten-year Data)
A. SCAPM with Cash SH SM SL MH MM ML BH BM BL
Mean 2.09 0.94 0.66 1.21 0.71 0.20 1.46 1.32 0.80 0.94 Std. Dev. 6.75 4.71 4.37 5.54 4.29 4.43 5.74 4.37 4.01 4.14 Skewness 1.81 0.64 -0.09 0.75 0.03 0.62 -0.03 0.46 -1.49 -0.46 Kurtosis 8.67 3.70 4.32 6.35 4.13 5.06 4.60 4.90 6.83 5.29 Jarque-Bera 226.65 10.74 8.80 67.56 6.40 29.11 12.84 22.23 117.80 30.49 Probability 0.00 0.00 0.01 0.00 0.04 0.00 0.00 0.00 0.00 0.00 Observations 120 120 120 120 120 120 120 120 120 120
B. Conventional CAPM SH SM SL MH MM ML BH BM BL
Mean 1.67 0.72 0.45 0.79 0.62 -0.34 1.28 0.97 0.52 0.77 Std. Dev. 5.75 4.25 5.53 5.06 4.14 4.29 5.73 4.23 3.66 4.12 Skewness 1.53 0.43 0.37 0.69 0.09 0.46 0.42 0.30 -1.19 -0.35 Kurtosis 6.95 3.18 4.11 5.32 4.46 5.06 4.96 4.75 5.56 5.53 Jarque-Bera 124.89 3.91 8.82 36.50 10.83 25.33 22.84 17.09 60.92 34.44 Probability 0.00 0.14 0.01 0.00 0.00 0.00 0.00 0.00 0.00 0.00 Observations 120 120 120 120 120 120 120 120 120 120
30 Shabir Ahmad Hakim, Zarinah Hamid and Ahamed Kameel Mydin Meera
JB statistics reject null hypothesis of normal distribution for all variables at 1 percent level of significance. The data distribution for all dependent variables is leptokurtic with kurtosis of more than 3; its values range from 3.70 (SM) to 8.67 (SH). The return on the market portfolio has kurtosis of 5.29. Skewness of more than |1| is seen only in the distributions of SH (1.81) and BL (-1.49). For details, see Table 3 panel A.
Descriptive Statistics of CAPM Inputs
The average excess monthly return on the explanatory variable in Conventional CAPM, the market portfolio, is 1.11 percent with standard deviation of 11.06 percent. The excess monthly returns on dependent portfolios are between -0.34 percent (ML) and 1.67 percent (SH), with standard deviations in the range of 3.66 percent (BL) to 5.75 percent (SH). The size and value effects in portfolios are similar to those in SCAPM. JB test statistics lead to the rejection of null hypothesis of normal distribution at 1 percent significance level for all model inputs except SM. The condition of normal distribution is violated by the presence of excess kurtosis in all data series. The kurtosis falls in the range of 3.18 (SM) to 6.95 (SH); the kurtosis of the market portfolio is 5.53. Skewness of more than 1 is seen in SH (1.53) and BL (-1.19) only. For details, see Table 3 panel B.
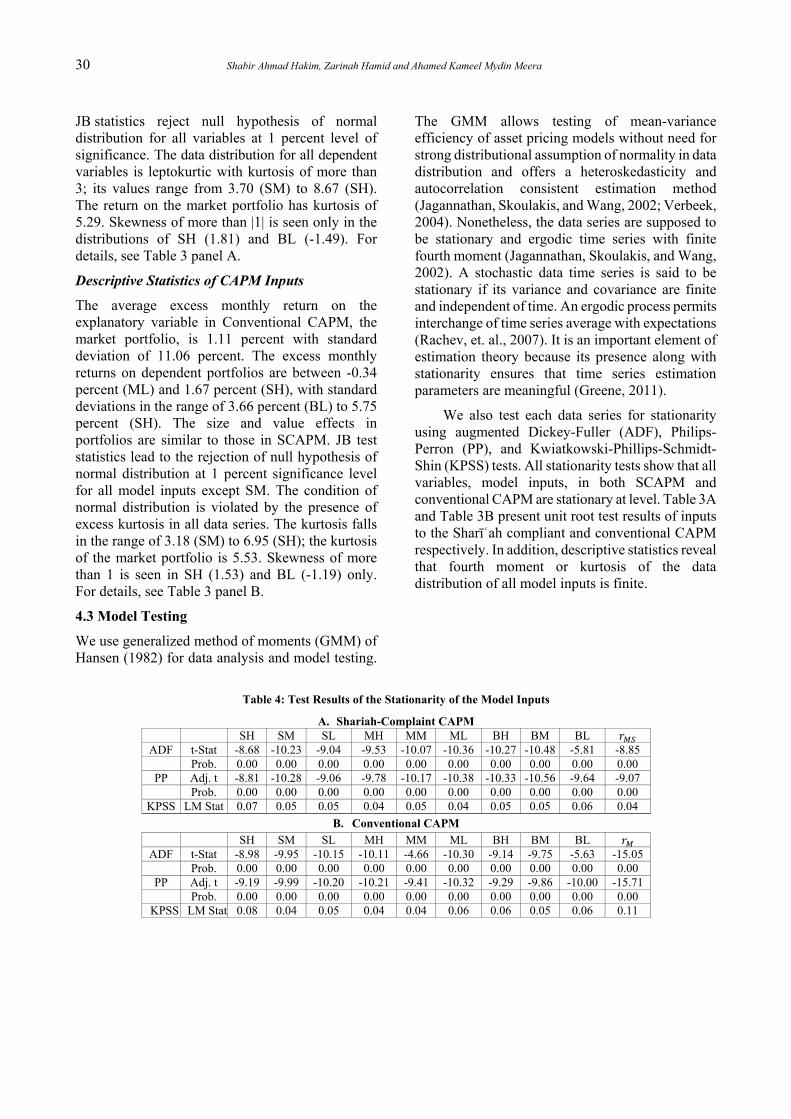
4.3 Model Testing
We use generalized method of moments (GMM) of Hansen (1982) for data analysis and model testing.
The GMM allows testing of mean-variance efficiency of asset pricing models without need for strong distributional assumption of normality in data distribution and offers a heteroskedasticity and autocorrelation consistent estimation method (Jagannathan, Skoulakis, and Wang, 2002; Verbeek, 2004). Nonetheless, the data series are supposed to be stationary and ergodic time series with finite fourth moment (Jagannathan, Skoulakis, and Wang, 2002). A stochastic data time series is said to be stationary if its variance and covariance are finite and independent of time. An ergodic process permits interchange of time series average with expectations (Rachev, et. al., 2007). It is an important element of estimation theory because its presence along with stationarity ensures that time series estimation parameters are meaningful (Greene, 2011).
We also test each data series for stationarity using augmented Dickey-Fuller (ADF), Philips-Perron (PP), and Kwiatkowski-Phillips-Schmidt-Shin (KPSS) tests. All stationarity tests show that all variables, model inputs, in both SCAPM and conventional CAPM are stationary at level. Table 3A and Table 3B present unit root test results of inputs to the Sharīʿah compliant and conventional CAPM respectively. In addition, descriptive statistics reveal that fourth moment or kurtosis of the data distribution of all model inputs is finite.
Table 4: Test Results of the Stationarity of the Model Inputs
A. Shariah-Complaint CAPM SH SM SL MH MM ML BH BM BL
ADF t-Stat -8.68 -10.23 -9.04 -9.53 -10.07 -10.36 -10.27 -10.48 -5.81 -8.85 Prob. 0.00 0.00 0.00 0.00 0.00 0.00 0.00 0.00 0.00 0.00
PP Adj. t -8.81 -10.28 -9.06 -9.78 -10.17 -10.38 -10.33 -10.56 -9.64 -9.07 Prob. 0.00 0.00 0.00 0.00 0.00 0.00 0.00 0.00 0.00 0.00
KPSS LM Stat 0.07 0.05 0.05 0.04 0.05 0.04 0.05 0.05 0.06 0.04
B. Conventional CAPM SH SM SL MH MM ML BH BM BL
ADF t-Stat -8.98 -9.95 -10.15 -10.11 -4.66 -10.30 -9.14 -9.75 -5.63 -15.05 Prob. 0.00 0.00 0.00 0.00 0.00 0.00 0.00 0.00 0.00 0.00
PP Adj. t -9.19 -9.99 -10.20 -10.21 -9.41 -10.32 -9.29 -9.86 -10.00 -15.71 Prob. 0.00 0.00 0.00 0.00 0.00 0.00 0.00 0.00 0.00 0.00
KPSS LM Stat 0.08 0.04 0.05 0.04 0.04 0.06 0.06 0.05 0.06 0.11
Capital Asset Pricing Model and Pricing of Islamic Financial Instruments 31
5. Empirical Results
This section discusses test results of the proposed SCAPM along with conventional CAPM in Bursa Malaysia. The test results of the models are presented first with three-year data followed by the results of models with ten year data.
5.1 Three Year Data
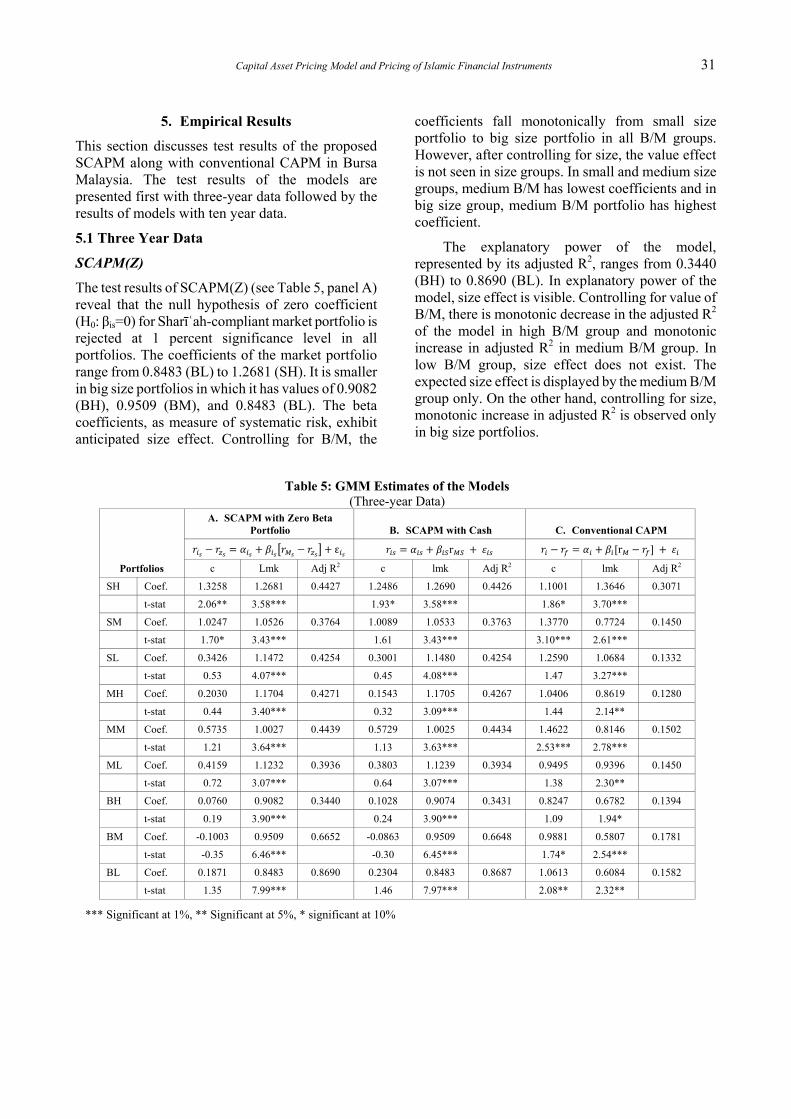
SCAPM(Z)
The test results of SCAPM(Z) (see Table 5, panel A) reveal that the null hypothesis of zero coefficient (H0: βis=0) for Sharīʿah-compliant market portfolio is rejected at 1 percent significance level in all portfolios. The coefficients of the market portfolio range from 0.8483 (BL) to 1.2681 (SH). It is smaller in big size portfolios in which it has values of 0.9082 (BH), 0.9509 (BM), and 0.8483 (BL). The beta coefficients, as measure of systematic risk, exhibit anticipated size effect. Controlling for B/M, the
coefficients fall monotonically from small size portfolio to big size portfolio in all B/M groups. However, after controlling for size, the value effect is not seen in size groups. In small and medium size groups, medium B/M has lowest coefficients and in big size group, medium B/M portfolio has highest coefficient.
The explanatory power of the model, represented by its adjusted R2, ranges from 0.3440 (BH) to 0.8690 (BL). In explanatory power of the model, size effect is visible. Controlling for value of B/M, there is monotonic decrease in the adjusted R2 of the model in high B/M group and monotonic increase in adjusted R2 in medium B/M group. In low B/M group, size effect does not exist. The expected size effect is displayed by the medium B/M group only. On the other hand, controlling for size, monotonic increase in adjusted R2 is observed only in big size portfolios.
Table 5: GMM Estimates of the Models (Three-year Data)
Portfolios
A. SCAPM with Zero Beta Portfolio B. SCAPM with Cash C. Conventional CAPM
ε r r
c Lmk Adj R2 c lmk Adj R2 c lmk Adj R2
SH Coef. 1.3258 1.2681 0.4427 1.2486 1.2690 0.4426 1.1001 1.3646 0.3071
t-stat 2.06** 3.58*** 1.93* 3.58*** 1.86* 3.70***
SM Coef. 1.0247 1.0526 0.3764 1.0089 1.0533 0.3763 1.3770 0.7724 0.1450
t-stat 1.70* 3.43*** 1.61 3.43*** 3.10*** 2.61***
SL Coef. 0.3426 1.1472 0.4254 0.3001 1.1480 0.4254 1.2590 1.0684 0.1332
t-stat 0.53 4.07*** 0.45 4.08*** 1.47 3.27***
MH Coef. 0.2030 1.1704 0.4271 0.1543 1.1705 0.4267 1.0406 0.8619 0.1280
t-stat 0.44 3.40*** 0.32 3.09*** 1.44 2.14**
MM Coef. 0.5735 1.0027 0.4439 0.5729 1.0025 0.4434 1.4622 0.8146 0.1502
t-stat 1.21 3.64*** 1.13 3.63*** 2.53*** 2.78***
ML Coef. 0.4159 1.1232 0.3936 0.3803 1.1239 0.3934 0.9495 0.9396 0.1450
t-stat 0.72 3.07*** 0.64 3.07*** 1.38 2.30**
BH Coef. 0.0760 0.9082 0.3440 0.1028 0.9074 0.3431 0.8247 0.6782 0.1394
t-stat 0.19 3.90*** 0.24 3.90*** 1.09 1.94*
BM Coef. -0.1003 0.9509 0.6652 -0.0863 0.9509 0.6648 0.9881 0.5807 0.1781
t-stat -0.35 6.46*** -0.30 6.45*** 1.74* 2.54***
BL Coef. 0.1871 0.8483 0.8690 0.2304 0.8483 0.8687 1.0613 0.6084 0.1582
t-stat 1.35 7.99*** 1.46 7.97*** 2.08** 2.32**
*** Significant at 1%, ** Significant at 5%, * significant at 10%
32 Shabir Ahmad Hakim, Zarinah Hamid and Ahamed Kameel Mydin Meera
The intercept of the model ranges from -0.1003 (BM) to 1.325 (SH). It is significant in SH and SM at 5 percent and 10 percent levels of significance respectively.
SCAPM(C)
The test results of SCAPM(C) (see Table 5, panel B) show that the Sharīʿah-compliant market portfolio is significant at 1 percent significance level in all portfolios. Its coefficients range from 0.8483 (BL) to 1.2690 (SH). The coefficients are almost same as those in CAPM with zero-beta portfolio; the maximum difference observed is of 0.0009 in SH portfolio. In addition, the coefficients display size and value effects that are similar to those in SCAPM with zero-beta portfolio. The explanatory power of the model ranges from 0.3431(BH) to 0.8687 (BL); it is similar to that of the preceding model with maximum difference of 0.09 percent in BH. Moreover, the model exhibits size and value effects similar to those of SCAPM with zero-beta portfolio.
The intercept of the model ranges from -0.0863 (BM) to 1.2486 (SH). It is significant in SH at 10 percent significance level.
CAPM
The market portfolio is significant in all portfolios. It is significant at 10 percent in BH, at 5 percent in MH, ML, and BL, and at 1 percent in the remaining five portfolios. Its coefficients range from 0.5807 (BM) to 1.3646 (SH). Controlling for B/M, the coefficients display expected size effect in high and low B/M portfolios only. In these groups, the coefficients fall monotonically from small to big size portfolios. In medium B/M portfolio, medium size portfolio carries highest coefficient. Whereas, controlling for size, we do not observe desired coefficient on different B/M portfolios. In small and big size groups, medium B/M portfolios have lowest coefficient, while in medium size group, low B/M portfolio has the highest coefficient.
The explanatory power of CAPM is much lower than that of its Sharīʿah-complaint counterparts. Its adjusted R2 ranges from 0.1280 (MH) to 0.3071 (SH). It is less than 20 percent in all portfolios except SH. The model displays size effect in medium and low B/M groups, where adjusted R2 increase monotonically, by small margins though.
Table 6: GMM Estimates of the Models (Ten-year Data)
Portfolios
A. Shariah-Complaint CAPM with Cash B. Conventional CAPM r r
Α r Adj. R2 α r Adj. R2 SH coef. 1.3071 0.8414 0.2608 1.0216 0.8366 0.3540
t-Stats 2.45** 5.41*** 2.28** 7.00*** SM coef. 0.2153 0.7707 0.4545 0.2288 0.6295 0.3668
t-Stats 0.64 8.04*** 0.73 8.96*** SL coef. 0.0711 0.6329 0.3544 -0.1601 0.7918 0.3426
t-Stats 0.20 8.14*** -0.36 7.32*** MH coef. 0.2742 1.0035 0.5590 0.0514 0.9534 0.6005
t-Stats 0.79 9.35*** 0.17 10.44*** MM coef. -0.0402 0.8045 0.5999 0.0024 0.7934 0.6215
t-Stats -0.165 14.82*** 0.01 17.12*** ML coef. -0.4701 0.7122 0.4395 -0.9056 0.7320 0.4898
t-Stats -1.63 9.12*** -3.03 10.36*** BH coef. 0.3806 1.1563 0.6945 0.3526 1.2023 0.7459
t-Stats 1.53 19.52*** 1.43 18.25*** BM coef. 0.4586 0.9204 0.7592 0.2399 0.9362 0.8290
t-Stats 1.83* 10.81*** 1.37 16.69*** BL coef. -0.0252 0.8813 0.8285 -0.1074 0.8079 0.8280
t-Stats -0.134 10.78*** -0.68 12.90***
*** Significant at 1%, ** Significant at 5%, * significant at 10%
Capital Asset Pricing Model and Pricing of Islamic Financial Instruments 33
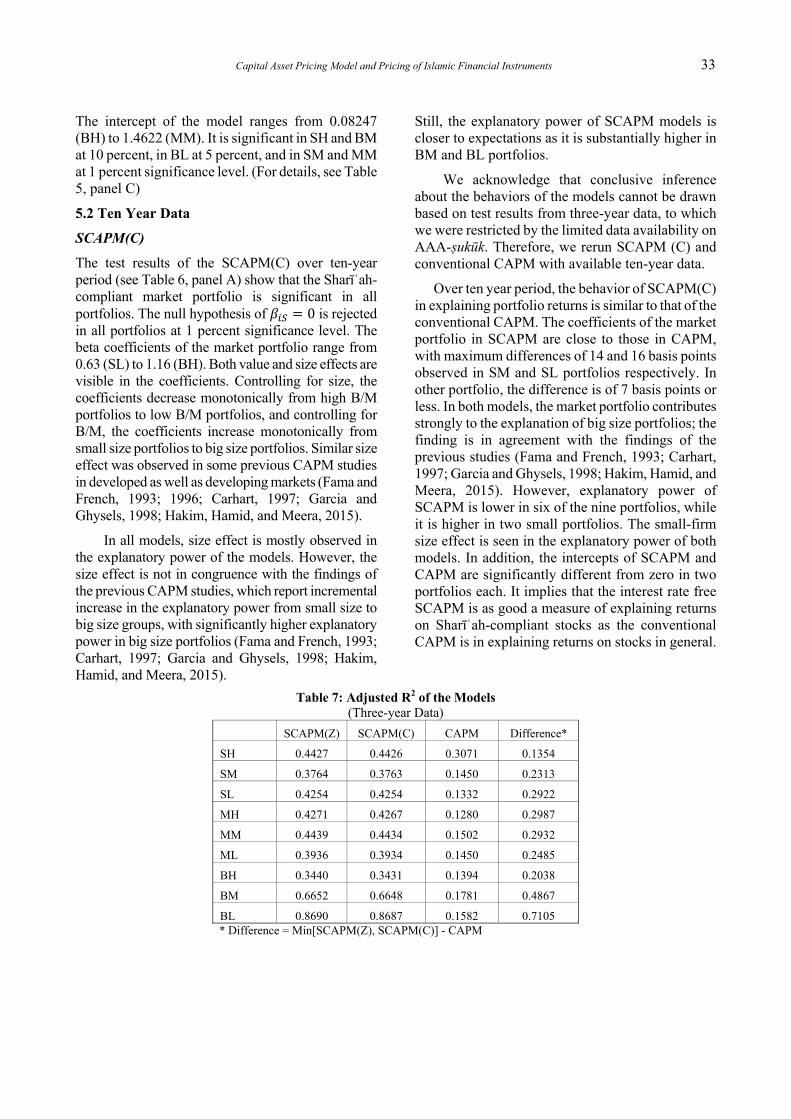
The intercept of the model ranges from 0.08247 (BH) to 1.4622 (MM). It is significant in SH and BM at 10 percent, in BL at 5 percent, and in SM and MM at 1 percent significance level. (For details, see Table 5, panel C)
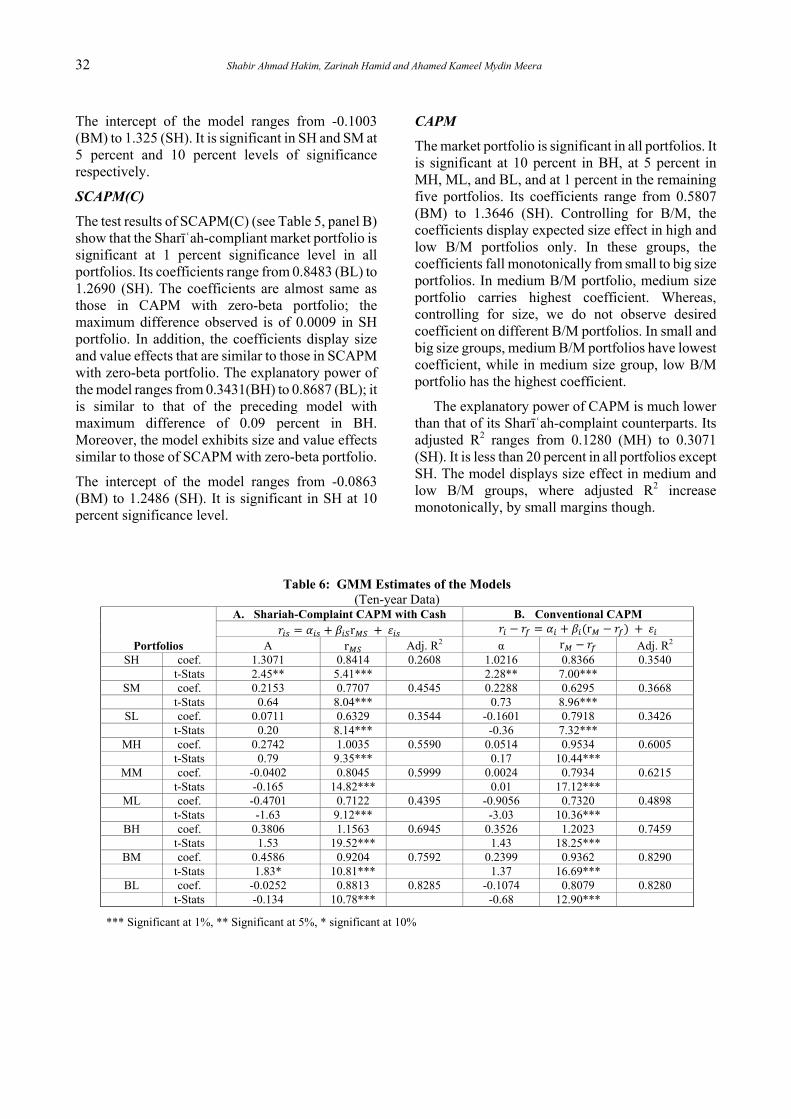
5.2 Ten Year Data
SCAPM(C)
The test results of the SCAPM(C) over ten-year period (see Table 6, panel A) show that the Sharīʿah-compliant market portfolio is significant in all portfolios. The null hypothesis of 0 is rejected in all portfolios at 1 percent significance level. The beta coefficients of the market portfolio range from 0.63 (SL) to 1.16 (BH). Both value and size effects are visible in the coefficients. Controlling for size, the coefficients decrease monotonically from high B/M portfolios to low B/M portfolios, and controlling for B/M, the coefficients increase monotonically from small size portfolios to big size portfolios. Similar size effect was observed in some previous CAPM studies in developed as well as developing markets (Fama and French, 1993; 1996; Carhart, 1997; Garcia and Ghysels, 1998; Hakim, Hamid, and Meera, 2015).
In all models, size effect is mostly observed in the explanatory power of the models. However, the size effect is not in congruence with the findings of the previous CAPM studies, which report incremental increase in the explanatory power from small size to big size groups, with significantly higher explanatory power in big size portfolios (Fama and French, 1993; Carhart, 1997; Garcia and Ghysels, 1998; Hakim, Hamid, and Meera, 2015).
Still, the explanatory power of SCAPM models is closer to expectations as it is substantially higher in BM and BL portfolios.
We acknowledge that conclusive inference about the behaviors of the models cannot be drawn based on test results from three-year data, to which we were restricted by the limited data availability on AAA-ṣukūk. Therefore, we rerun SCAPM (C) and conventional CAPM with available ten-year data.
Over ten year period, the behavior of SCAPM(C) in explaining portfolio returns is similar to that of the conventional CAPM. The coefficients of the market portfolio in SCAPM are close to those in CAPM, with maximum differences of 14 and 16 basis points observed in SM and SL portfolios respectively. In other portfolio, the difference is of 7 basis points or less. In both models, the market portfolio contributes strongly to the explanation of big size portfolios; the finding is in agreement with the findings of the previous studies (Fama and French, 1993; Carhart, 1997; Garcia and Ghysels, 1998; Hakim, Hamid, and Meera, 2015). However, explanatory power of SCAPM is lower in six of the nine portfolios, while it is higher in two small portfolios. The small-firm size effect is seen in the explanatory power of both models. In addition, the intercepts of SCAPM and CAPM are significantly different from zero in two portfolios each. It implies that the interest rate free SCAPM is as good a measure of explaining returns on Sharīʿah-compliant stocks as the conventional CAPM is in explaining returns on stocks in general.
Table 7: Adjusted R2 of the Models (Three-year Data)
SCAPM(Z) SCAPM(C) CAPM Difference*
SH 0.4427 0.4426 0.3071 0.1354
SM 0.3764 0.3763 0.1450 0.2313
SL 0.4254 0.4254 0.1332 0.2922
MH 0.4271 0.4267 0.1280 0.2987
MM 0.4439 0.4434 0.1502 0.2932
ML 0.3936 0.3934 0.1450 0.2485
BH 0.3440 0.3431 0.1394 0.2038
BM 0.6652 0.6648 0.1781 0.4867
BL 0.8690 0.8687 0.1582 0.7105 * Difference = Min[SCAPM(Z), SCAPM(C)] - CAPM
34 Shabir Ahmad Hakim, Zarinah Hamid and Ahamed Kameel Mydin Meera
6. Conclusions
Islam strictly forbids Muslims from paying or receiving interest (ribā) and engaging in non-ḥalāl businesses, which, for the Sharīʿah-abiding Muslims, redefine the investment universe assumed by CAPM. This, along with uniqueness of Islamic financial instruments, demands customization of conventional CAPM for pricing Islamic financial instruments. In this regard, we propose two versions of Sharīʿah-compliant CAPM. One replaces risk-free rate with Sharīʿah-complaint zero-beta portfolio in the form of AAA-ṣukūk and the other drops risk-free rate from the model assuming absence of zero-beta portfolio. In addition, Sharīʿah-complaint market portfolio is used as proxy for the market portfolio.
We test the proposed models together with conventional CAPM in Bursa Malaysia using three-year and ten-year data. We test all models with three year data and SCAPM(C) and conventional CAPM with both three- and ten-year data. The two stage testing is necessitated by limited data availability on AAA-ṣukūk. We use nine portfolios each, created from Sharīʿah-compliant and all firm listed on Bursa that meet screening criteria, as dependent variables in SCAPM and CAPM respectively. The test results of the models over three year horizon, show marked similarity between SCAPMs and their distinctive difference from CAPM. However, in ten-year period, the distinction between SCAPM and CAPM fades away. In fact, the models behave closely in explaining portfolio returns.
The findings of this study lead to two conclusions: First, the two versions of Sharīʿah-compliant CAPM yield similar results and have almost same explanatory power in different portfolios. Hence, they can be safely used interchangeably. However, the findings based on three-year data should be handled with care. The similarity of the models needs to be tested over longer time horizon, long enough to make inferences reliable. Second, over longer period, both Sharīʿah-compliant and conventional models display similar behavior in explaining portfolio returns. The similarity in the behaviors exists despite differences in the model inputs, which indicates that Sharīʿah-compatible CAPM is as applicable in explaining risk-return dynamics of the Sharīʿah-compliant stocks as conventional CAPM is in stocks in general. However, it is necessary that the models are tested in other markets to establish their validity.
This study is significant as it proposes asset pricing models that are free of the inputs—interest rate (ribā), market portfolio containing non-ḥalāl stocks—that are not permissible for Muslim investors. The underlying principle of the models is that the interest rate is not an opportunity cost for the Muslim investors because it is not an investment option or a foregone investment opportunity for them. Moreover, treating Islamic financial markets as independent entities and upholding CAPM theory, the proposed models derive inputs from actual investment universe of Sharīʿah-abiding Muslim investors.
Capital Asset Pricing Model and Pricing of Islamic Financial Instruments 35
References
Abbes, M.B. (2012) Risk and Return of Islamic and Conventional Indices. International Journal of Euro-Mediterranean Studies, 5(1), 1-23.
Affaneh, I., Albohali, M. and Boldin, R.J. (2013) Islamic Market Indices: A comparison with conventional world indices based on the adjusted Sharpe ratio. International Journal of Business, Accounting, and Finance, 7(1), 87-100.
Black, F. (1972) Capital market equilibrium with restricted borrowing. Journal of Business, 45(3), 444-455.
Bursa Malaysia, List of Companies (2014) Retrieved August 20, 2014, from Bursa Malaysia: http://www.bursamalaysia.com/market/listed-companies/list-of-companies/main-market/#/?alphabet=All
Carhart, M.M. (1997) On persistence in mutual fund performance. Journal of Finance, LII(1), 57-82.
Chen, N.-F., Roll, R. and Ross, S.A. (1986) Economic forces and the stock market. Journal of Business, 59(3), 383-403.
Cochrane, J.H. (2001) Asset Pricing (1st ed.). Princeton, NJ: Princeton University Press.
Dewi, M.K. and Ferdian, I.R. (2012) Evaluating Performance of Islamic Mutual Funds in Indonesia and Malaysia. Journal of Applied Economics and Business Research, 2(1), 11-33.
El-Ashker, A.A.-F. (1987) The Islamic Business Enterprise. London: Croom Helm.
Fama, E.F. (1996) Multifactor portfolio efficeincy and multifactor asset pricing. Journal of Finance and Quantitative Analysis, 31(4), 441-465.
Fama, E.F. and French, K.R. (1993). Common risk factors in the returns on stocks and bonds. Journal of Financial Economics, 33, 3-56.
Fama, E.F. and French, K.R. (1996) Multifactor explanations of asset pricing anomalies. Journal of Finance, LI(1), 55-84.
FTSE Bursa Malaysia Index Series (2014) Retrieved August 25, 2014, from FTSE: http://www.ftse.com/ products/indices/bursa-malaysia
Garcia, R. and Ghysels, E. (1998) Structural change and asset pricing in emerging markets. Journal of International Money and Finance, 17, 455-473.
Greene, W. (2011) Econometric Analysis, 7th Edition. New Jersey: Prentice Hall.
Hakim, S., Hamid, Z. and Meera, A.K. (2015) Combining Local and Global Markets in Asset Pricing in Emerging Markets: Evidence from Three BRICS Nations. Journal of Developing Area, 49(3), 365-378.
Hanif, M. (2011) Risk and Return under Shari'a Framework: An Attempt to Develop Shari'a Compliant Asset Pricing Model (SCAPM). Pakistan Journal of Commerce and Social Sciences , 5(2), 283-292.
Ibn-Kathir, (2003) Tafsir Ibn Kathir. Riyadh: Darassalam.
Jagannathan, R., Skoulakis, G. and Wang, Z. (2002) Generalized Method of Moments: Applications in Finance. Journal of Business & Economic Statistics, 20(4), 470-481.
Jobst, A.A. (2007) The Economics of Islamic Finance and Securitization. The Journal of Structured Finance, 13(1), 6-27.
Karsten, I. (1982) Islam and financial intermediation. Staff Papers International Monetary Fund, 29(1), 108-142.
Lintner, J. (1965) Security prices, risk, and maximal gains from diversification. Journal of Finance, XX(4), 587-615.
Merton, R.C. (1973) An intertemporal capital asset pricing model. Econometrica, 41(5), 867-887.
Mulcahy, M.B. (2014) Purifying Islamic equities: the interest tax shield. International Journal of Islamic and Middle Eastern Finance Management, 7(4), 473-484.
Pastor, L. and Stambaugh, R.F. (2003) Liquidity Risk and Expected Stock Returns. Journal of Political Economy, 111(3), 642–685.
Rachev, S.T., Mittnik, S., Fabozzi, F.F., Focardi, S.M. and Jasic, T. (2007) Financial Econometrics From Basics to Advanced Modeling Techniques. New Jersey: John Wiley & Sonas.
Reilly, F.K. and Brown, K.C. (2003) Investment Analysis & Portfolio Management 7th Ed. Mason, OH: Thompson Southwestern.
Rosly, S.A. and Zaini, M.A. (2008) Risk-return analysis of Islamic banks' investment deposits and shareholders' fund. Managerial Finance, 34(10), 695-707.
Selim, T. H. (2008) An Islamic capital asset pricing model. Humanomics, 24(2), 122-129.
Shaikh, S.A. (2009) Corporate Finance in an Interest Free Economy: An Alternate Approach to Practiced Islamic Corporate Finance. Journal of Islamic Banking & Finance, International Association of Islamic Banks.
Sharpe, W.F. (1964) Capital asset prices: A theory of market equilibrium under conditions of risk. Journal of Finance, XIX(3), 425-442.
Tomkins, C. and Karim, R. (1987) The Sharīʿah and its Implications for Islamic Financial Analysis: An Opportunity to Study Interactions among Society, Organisations and Accounting. The American Journal of Islamic Social Sciences, 4(1), 101-115.
Verbeek, M. (2004) A Guide to Modern Econometrics (2nd ed.). Sussex, England: John Wiley & Sons.
Wei, K.C. (1988) An asset-pricing theory unifying the CAPM and APT. Journal of Finance, XLIII(4), 881-892.
Zaher, T.S. and Hassan, M.K. (2001) A Comparative Literature Survey of Islamic Finance and Banking. Financial Markets, Institutions & Instruments, 10, 155-199.
36 Shabir Ahmad Hakim, Zarinah Hamid and Ahamed Kameel Mydin Meera
Appendix
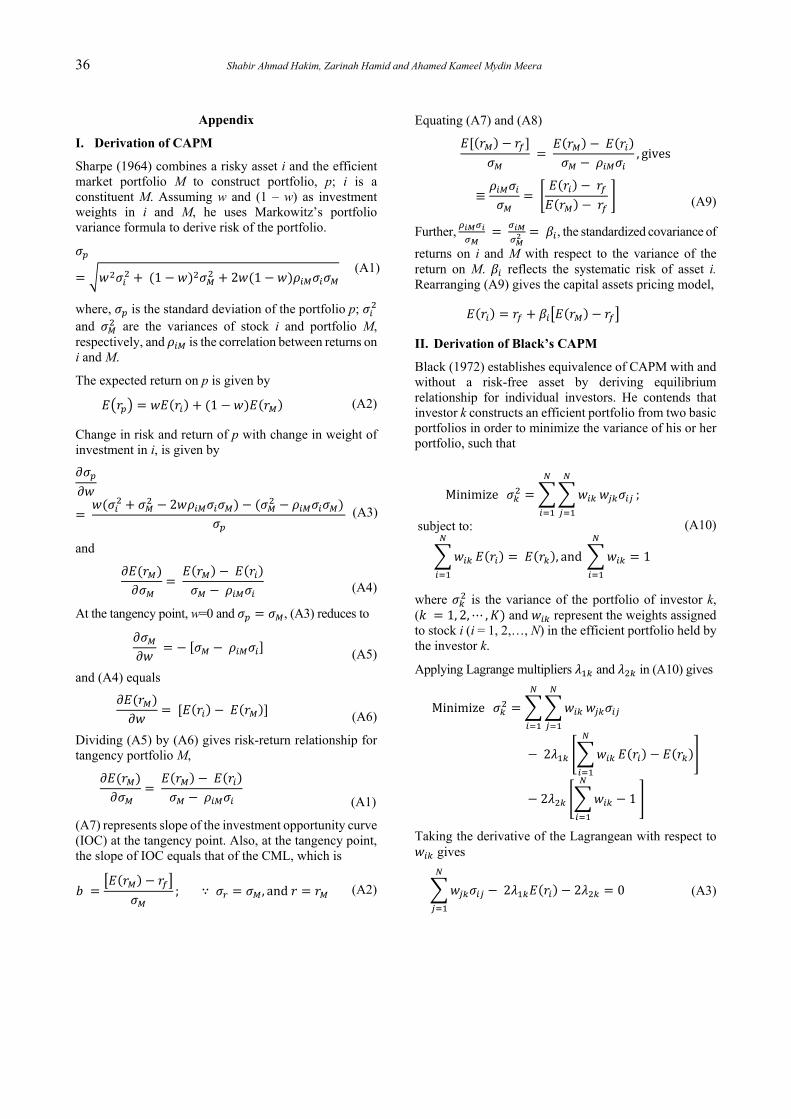
I. Derivation of CAPM
Sharpe (1964) combines a risky asset i and the efficient market portfolio M to construct portfolio, p; i is a constituent M. Assuming w and (1 – w) as investment weights in i and M, he uses Markowitz’s portfolio variance formula to derive risk of the portfolio.
1 2 1 (A1)
where, is the standard deviation of the portfolio p; and are the variances of stock i and portfolio M, respectively, and is the correlation between returns on i and M.
The expected return on p is given by
1 (A2)
Change in risk and return of p with change in weight of investment in i, is given by
2
(A3)
and
(A4)
At the tangency point, w=0 and , (A3) reduces to
(A5)
and (A4) equals
(A6)
Dividing (A5) by (A6) gives risk-return relationship for tangency portfolio M,
(A1)
(A7) represents slope of the investment opportunity curve (IOC) at the tangency point. Also, at the tangency point, the slope of IOC equals that of the CML, which is
; ∵ , and (A2)
Equating (A7) and (A8)
, gives
≡ (A9)
Further, , the standardized covariance of
returns on i and M with respect to the variance of the return on M. reflects the systematic risk of asset i. Rearranging (A9) gives the capital assets pricing model,
II. Derivation of Black’s CAPM
Black (1972) establishes equivalence of CAPM with and without a risk-free asset by deriving equilibrium relationship for individual investors. He contends that investor k constructs an efficient portfolio from two basic portfolios in order to minimize the variance of his or her portfolio, such that
Minimize ;
subject to:
, and 1
(A10)
where is the variance of the portfolio of investor k, ( 1, 2,⋯ , and represent the weights assigned to stock i (i = 1, 2,…, N) in the efficient portfolio held by the investor k.
Applying Lagrange multipliers and in (A10) gives
Minimize
2
2 1
Taking the derivative of the Lagrangean with respect to gives
2 2 0 (A3)
Capital Asset Pricing Model and Pricing of Islamic Financial Instruments 37
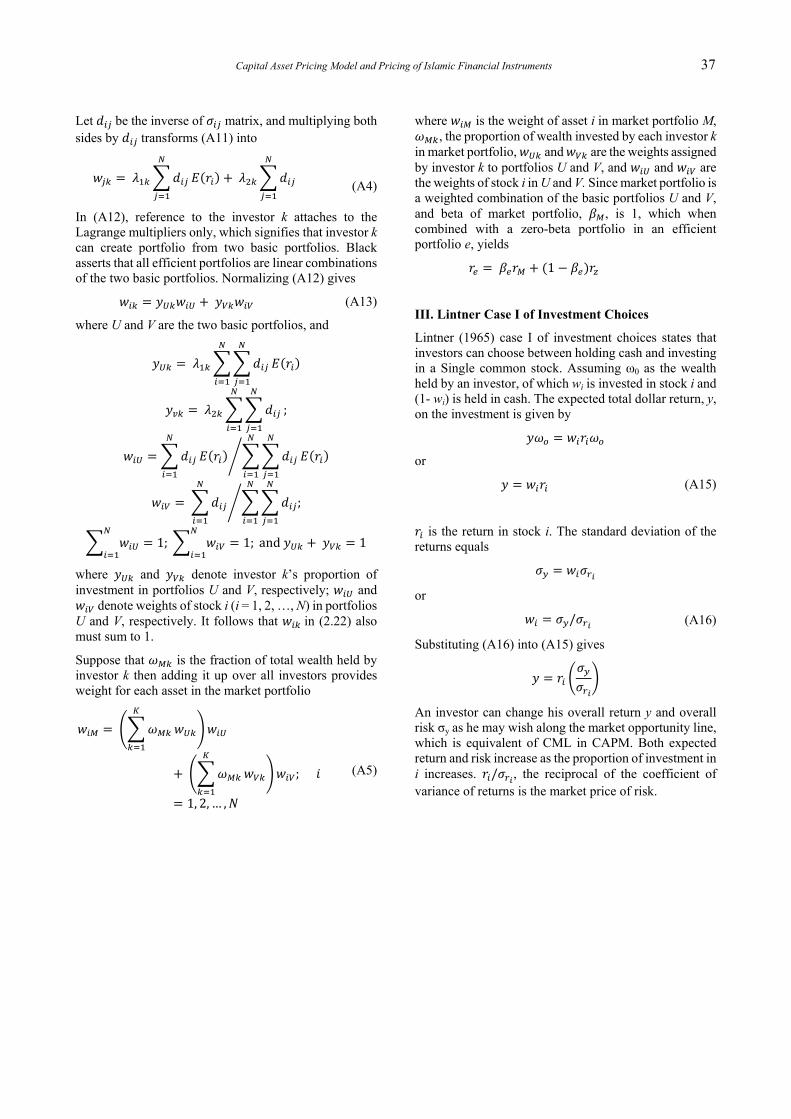
Let be the inverse of matrix, and multiplying both sides by transforms (A11) into
(A4)
In (A12), reference to the investor k attaches to the Lagrange multipliers only, which signifies that investor k can create portfolio from two basic portfolios. Black asserts that all efficient portfolios are linear combinations of the two basic portfolios. Normalizing (A12) gives
(A13)
where U and V are the two basic portfolios, and
;
;
1; 1; and 1
where and denote investor k’s proportion of investment in portfolios U and V, respectively; and
denote weights of stock i (i = 1, 2, …, N) in portfolios U and V, respectively. It follows that in (2.22) also must sum to 1.
Suppose that is the fraction of total wealth held by investor k then adding it up over all investors provides weight for each asset in the market portfolio
;
1, 2, … ,
(A5)
where is the weight of asset i in market portfolio M, , the proportion of wealth invested by each investor k
in market portfolio, and are the weights assigned by investor k to portfolios U and V, and and are the weights of stock i in U and V. Since market portfolio is a weighted combination of the basic portfolios U and V, and beta of market portfolio, , is 1, which when combined with a zero-beta portfolio in an efficient portfolio e, yields
1
III. Lintner Case I of Investment Choices
Lintner (1965) case I of investment choices states that investors can choose between holding cash and investing in a Single common stock. Assuming ω0 as the wealth held by an investor, of which wi is invested in stock i and (1- wi) is held in cash. The expected total dollar return, y, on the investment is given by
or
(A15)
is the return in stock i. The standard deviation of the returns equals
or
/ (A16)
Substituting (A16) into (A15) gives
An investor can change his overall return y and overall risk σy as he may wish along the market opportunity line, which is equivalent of CML in CAPM. Both expected return and risk increase as the proportion of investment in i increases. / , the reciprocal of the coefficient of variance of returns is the market price of risk.

38 Shabir Ahmad Hakim, Zarinah Hamid and Ahamed Kameel Mydin Meera
ر األصول الرأسمالية نموذج ر و سع األدوات املالية اإلسالميةسع
ر حكيم أحمد شب اململكة العربية السعودية –جدة –جامعة عفت نة راحامد، زر أحمد كميل مايدن م
يا جامعة اإلسالمية العاملية بمال ا
رمة املستخلص: ر املتوافقة مع إن تحرم الربا (الفائدة)، وتحرم تداول األدوات املالية للشركات امل (غثماري يفرض إعادة النظر الفضاء الشرعة) أسمالية ر الذي يقوم عليھ نموذج تقييم األصول ال االس
)Capital Asset Pricing Model - CAPM ( اطر و أصوالً ؛ حيث أن شتمل خالية من امل محفظة سوقية رمة ثمار القائم ع األسس واملبادئ اإلسالمية ع أدوات للشركات امل عالم االس رحت .ال عالقة لھ اق
ن والذي ، املتوافق مع الشرعة اإلسالمية م األصول الرأسماليةينموذج تقي (CAPM) منالدراسة نوعشتمل عمتوافقة مع شتمل ع أدوات محفظة سوقية ستخدم خالية من أصول الشرعة فقط وال اطر رت الدراسةامل رحة . اخت يا التقليدي مع تطبيق لذلك النموذجمع النماذج املق بورصة مال
عضها تائج اختبارأظهرت نو . والبعض اآلخر عشر سنوات ثالث سنوات،إ مستخدمًة بيانات تمتد ُمدد وظاً ذات السنوات للبيانات النماذج هًا م شا ن النماذج الثالث رحة ب إو . املتوافقة مع الشرعة املق
األسهم العوائد ع شرح املتوافق مع الشرعة قادر ع الرأسمالية نموذج تقييم األصول فإن جانب ذلك، .األسهم للعوائد ع جميع شرحھالتقليدي جلـلنموذ بدقة مماثلة املتوافقة مع الشرعة
Capital Asset Pricing Model and Pricing of Islamic Financial Instruments 39
Shabir Ahmad Hakim is a PhD in Business Administration with concentration in Finance from the International Islamic University Malaysia. He is the winner of 2015 Permodalan Nasional Berhad award for the best PhD student. He also has Mater of Business Administration with honors from Western Michigan University, USA. Currently, he works as Assistant Professor in Finance at Effat University Jeddah, Saudi Arabia. His research interests are in the areas of Asset Pricing, Emerging Markets, Corporate Finance, and Islamic Finance.
E-mail: [email protected]
Zarinah Hamid received both her Bachelor’s (Magna Cum Laude) and Master’s degree in Mathematics from Indiana State University, USA. She resumed her research training and later was awarded Master’s degree in Economics and Ph.D. (Economics and Mathematics) from University of Missouri, Kansas City, USA. She teaches business mathematics, statistical methods, econometrics, quantitative decision making and mathematical economics. Her research areas include intra-trade and financial integration, entrepreneurship education, SME’s and waqf development. She has published over 30 articles in international refereed journals and has presented the research findings in various seminars locally and internationally. She used to hold positions as Deputy Dean of Student Affairs, Principal of Residential College and Course Coordinator. Currently she is the editor of one of IIUM’s flagship journals, i.e. International Journal of Economics, Management and Accounting.
E-mail: [email protected].
Ahamed Kameel Mydin Meera is a Professor at the Faculty of Economics and Management Sciences, International Islamic University Malaysia. He holds a Ph.D. degree in Finance from the University of North Texas, Denton, Texas, USA. His areas of interest and expertise include Financial Markets, Investment Analysis, Macro-Economics, Gold Dinar, Economics of Social Issues, and Quantitative Methods. He has wide experience in teaching, training, consultancy and research in the above areas. His works have been published in local and international journals. He is author of books on “The Islamic Gold Dinar”; “The Theft of Nations” (both published by Pelanduk Publications) and “Real Money – Money and Payment Systems from an Islamic Perspective” published by IIUM Press.
E-mail: [email protected]