canntrust holdings inc. trst-cse: $2.30 the...
TRANSCRIPT
Page 1 of 31 Russell Stanley, MBA, CFA | 647.794.1922 | [email protected]
29 August 2017
Special Situations
CannTrust Holdings Inc.
The Pharmaceuticalization of Medical Cannabis
Projected Return: 172%
Valuation: 10x 2019E EBITDA
CannTrust Holdings Inc.Market Cap. (FD, $M)
Net Cash ($M) (est.)
Enterprise Value ($M)
Basic Shares O/S (M)
FD Shares O/S (M)
Avg. Daily Volume
52 Week High
52 Week Low
Financial Metrics31-Dec
Revenue ($M)
Adj. EBITDA ($M)
Diluted EPS
Operating CFPS
Valuation DataEV/EBITDA Current
Peers
Target
P/E Current
Peers
Target
Quarterly Data
Revenue ($M) 2017
2018
EBITDA ($M) 2017
2018
OCFPS 2017
2018
Company Description
6.5 9.3 10.2 11.0
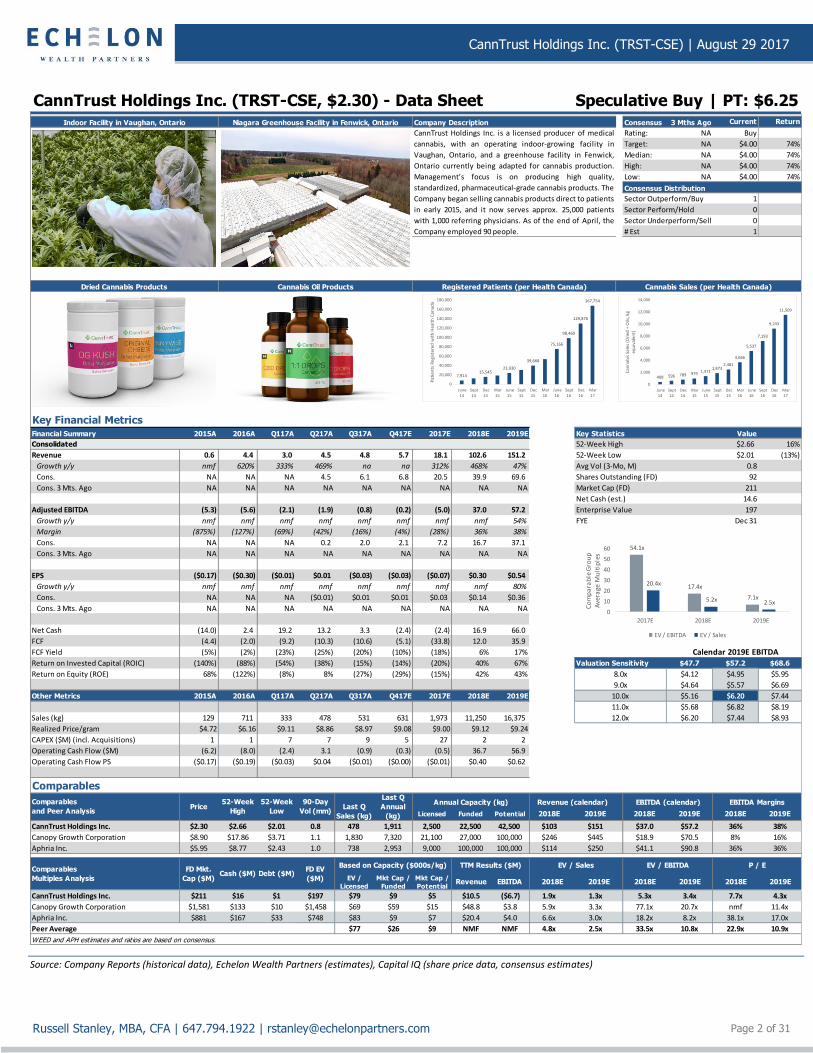
CannTrust Holdings Inc. is a licensed producer of medical
cannabis, with an operating indoor-growing facility in
Vaughan, Ontario, and a greenhouse facility in Fenwick,
Ontario currently being adapted for cannabis production.
Management’s focus is on producing high quality,
standardized, pharmaceutical-grade cannabis products. The
Company began selling cannabis products direct to patients
in early 2015, and it now serves approx. 25,000 patients with
1,000 referring physicians. As of the end of April, the
Company employed 90 people.
($0.03) $0.04 ($0.01) ($0.00)
$0.07 $0.10 $0.11 $0.12
18.8 25.7 27.9 30.2
(2.1) (1.9) (0.8) (0.2)
Q1 Q2 Q3 Q4
3.0 4.5 4.8 5.7
nmf 31.0x 11.9x
neg 20.9x 11.6x
neg 15.5x 10.0x
neg 7.7x 4.3x
neg 5.3x 3.4x
165.0x 27.5x 9.1x
($0.07) $0.30 $0.54
($0.01) $0.40 $0.62
18.1 102.6 151.2
(5.0) 37.0 57.2
2017E 2018E 2019E
91.9
773,430
2.66
2.01
86.7
211.4
14.6
196.8
0.0
0.1
0.2
0.3
0.4
$2.20
$2.25
$2.30
$2.35
$2.40
$2.45
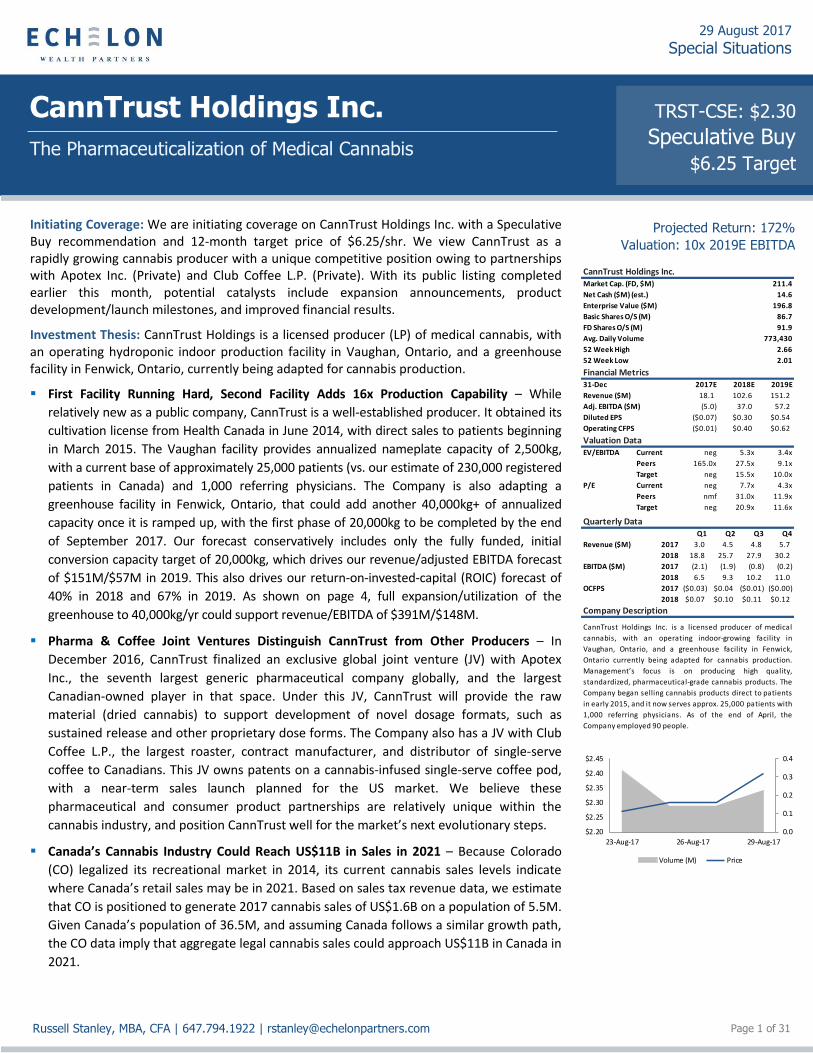
23-Aug-17 26-Aug-17 29-Aug-17
Volume (M) Price
Initiating Coverage: We are initiating coverage on CannTrust Holdings Inc. with a Speculative Buy recommendation and 12-month target price of $6.25/shr. We view CannTrust as a rapidly growing cannabis producer with a unique competitive position owing to partnerships with Apotex Inc. (Private) and Club Coffee L.P. (Private). With its public listing completed earlier this month, potential catalysts include expansion announcements, product development/launch milestones, and improved financial results.
Investment Thesis: CannTrust Holdings is a licensed producer (LP) of medical cannabis, with an operating hydroponic indoor production facility in Vaughan, Ontario, and a greenhouse facility in Fenwick, Ontario, currently being adapted for cannabis production.
▪ First Facility Running Hard, Second Facility Adds 16x Production Capability – While
relatively new as a public company, CannTrust is a well-established producer. It obtained its
cultivation license from Health Canada in June 2014, with direct sales to patients beginning
in March 2015. The Vaughan facility provides annualized nameplate capacity of 2,500kg,
with a current base of approximately 25,000 patients (vs. our estimate of 230,000 registered
patients in Canada) and 1,000 referring physicians. The Company is also adapting a
greenhouse facility in Fenwick, Ontario, that could add another 40,000kg+ of annualized
capacity once it is ramped up, with the first phase of 20,000kg to be completed by the end
of September 2017. Our forecast conservatively includes only the fully funded, initial
conversion capacity target of 20,000kg, which drives our revenue/adjusted EBITDA forecast
of $151M/$57M in 2019. This also drives our return-on-invested-capital (ROIC) forecast of
40% in 2018 and 67% in 2019. As shown on page 4, full expansion/utilization of the
greenhouse to 40,000kg/yr could support revenue/EBITDA of $391M/$148M.
▪ Pharma & Coffee Joint Ventures Distinguish CannTrust from Other Producers – In
December 2016, CannTrust finalized an exclusive global joint venture (JV) with Apotex
Inc., the seventh largest generic pharmaceutical company globally, and the largest
Canadian-owned player in that space. Under this JV, CannTrust will provide the raw
material (dried cannabis) to support development of novel dosage formats, such as
sustained release and other proprietary dose forms. The Company also has a JV with Club
Coffee L.P., the largest roaster, contract manufacturer, and distributor of single-serve
coffee to Canadians. This JV owns patents on a cannabis-infused single-serve coffee pod,
with a near-term sales launch planned for the US market. We believe these
pharmaceutical and consumer product partnerships are relatively unique within the
cannabis industry, and position CannTrust well for the market’s next evolutionary steps.
▪ Canada’s Cannabis Industry Could Reach US$11B in Sales in 2021 – Because Colorado
(CO) legalized its recreational market in 2014, its current cannabis sales levels indicate
where Canada’s retail sales may be in 2021. Based on sales tax revenue data, we estimate
that CO is positioned to generate 2017 cannabis sales of US$1.6B on a population of 5.5M.
Given Canada’s population of 36.5M, and assuming Canada follows a similar growth path,
the CO data imply that aggregate legal cannabis sales could approach US$11B in Canada in
2021.
TRST-CSE: $2.30
Speculative Buy
$6.25 Target
CannTrust Holdings Inc. (TRST-CSE) | August 29 2017
Page 2 of 31 Russell Stanley, MBA, CFA | 647.794.1922 | [email protected]
CannTrust Holdings Inc. (TRST-CSE, $2.30) - Data Sheet Speculative Buy | PT: $6.25Company Description Consensus 3 Mths Ago Current Return
Rating: NA Buy
Target: NA $4.00 74%
Median: NA $4.00 74%
High: NA $4.00 74%
Low: NA $4.00 74%
Consensus Distribution
Sector Outperform/Buy 1
Sector Perform/Hold 0
Sector Underperform/Sell 0
# Est 1
Key Financial Metrics Financial Summary 2015A 2016A Q117A Q217A Q317A Q417E 2017E 2018E 2019E Key Statistics Value
Consolidated 52-Week High $2.66 16%
Revenue 0.6 4.4 3.0 4.5 4.8 5.7 18.1 102.6 151.2 52-Week Low $2.01 (13%)
Growth y/y nmf 620% 333% 469% na na 312% 468% 47% Avg Vol (3-Mo, M) 0.8
Cons. NA NA NA 4.5 6.1 6.8 20.5 39.9 69.6 Shares Outstanding (FD) 92
Cons. 3 Mts. Ago NA NA NA NA NA NA NA NA NA Market Cap (FD) 211
Net Cash (est.) 14.6
Adjusted EBITDA (5.3) (5.6) (2.1) (1.9) (0.8) (0.2) (5.0) 37.0 57.2 Enterprise Value 197
Growth y/y nmf nmf nmf nmf nmf nmf nmf nmf 54% FYE Dec 31
Margin (875%) (127%) (69%) (42%) (16%) (4%) (28%) 36% 38%
Cons. NA NA NA 0.2 2.0 2.1 7.2 16.7 37.1
Cons. 3 Mts. Ago NA NA NA NA NA NA NA NA NA
EPS ($0.17) ($0.30) ($0.01) $0.01 ($0.03) ($0.03) ($0.07) $0.30 $0.54
Growth y/y nmf nmf nmf nmf nmf nmf nmf nmf 80%
Cons. NA NA NA ($0.01) $0.01 $0.01 $0.03 $0.14 $0.36
Cons. 3 Mts. Ago NA NA NA NA NA NA NA NA NA
Net Cash (14.0) 2.4 19.2 13.2 3.3 (2.4) (2.4) 16.9 66.0
FCF (4.4) (2.0) (9.2) (10.3) (10.6) (5.1) (33.8) 12.0 35.9
FCF Yield (5%) (2%) (23%) (25%) (20%) (10%) (18%) 6% 17% Calendar 2019E EBITDA
Return on Invested Capital (ROIC) (140%) (88%) (54%) (38%) (15%) (14%) (20%) 40% 67% Valuation Sensitivity $47.7 $57.2 $68.6
Return on Equity (ROE) 68% (122%) (8%) 8% (27%) (29%) (15%) 42% 43% $4.12 $4.95 $5.95
$4.64 $5.57 $6.69
Other Metrics 2015A 2016A Q117A Q217A Q317A Q417E 2017E 2018E 2019E $5.16 $6.20 $7.44
$5.68 $6.82 $8.19
Sales (kg) 129 711 333 478 531 631 1,973 11,250 16,375 $6.20 $7.44 $8.93
Realized Price/gram $4.72 $6.16 $9.11 $8.86 $8.97 $9.08 $9.00 $9.12 $9.24
CAPEX ($M) (incl. Acquisitions) 1 1 7 7 9 5 27 2 2
Operating Cash Flow ($M) (6.2) (8.0) (2.4) 3.1 (0.9) (0.3) (0.5) 36.7 56.9
Operating Cash Flow PS ($0.17) ($0.19) ($0.03) $0.04 ($0.01) ($0.00) ($0.01) $0.40 $0.62
Comparables
Licensed Funded Potential 2018E 2019E 2018E 2019E 2018E 2019E
CannTrust Holdings Inc. $2.30 $2.66 $2.01 0.8 478 1,911 2,500 22,500 42,500 $103 $151 $37.0 $57.2 36% 38%
Canopy Growth Corporation $8.90 $17.86 $3.71 1.1 1,830 7,320 21,100 27,000 100,000 $246 $445 $18.9 $70.5 8% 16%
Aphria Inc. $5.95 $8.77 $2.43 1.0 738 2,953 9,000 100,000 100,000 $114 $250 $41.1 $90.8 36% 36%
EV /
Licensed
Mkt Cap /
Funded
Mkt Cap /
PotentialRevenue EBITDA 2018E 2019E 2018E 2019E
CannTrust Holdings Inc. $211 $16 $1 $197 $79 $9 $5 $10.5 ($6.7) 1.9x 1.3x 5.3x 3.4x 7.7x 4.3x
Canopy Growth Corporation $1,581 $133 $10 $1,458 $69 $59 $15 $48.8 $3.8 5.9x 3.3x 77.1x 20.7x nmf 11.4x
Aphria Inc. $881 $167 $33 $748 $83 $9 $7 $20.4 $4.0 6.6x 3.0x 18.2x 8.2x 38.1x 17.0x
Peer Average $77 $26 $9 NMF NMF 4.8x 2.5x 33.5x 10.8x 22.9x 10.9x
WEED and APH estimates and ratios are based on consensus.
EV / Sales EV / EBITDA P / E
2018E 2019E
Indoor Facility in Vaughan, Ontario Niagara Greenhouse Facility in Fenwick, Ontario
Dried Cannabis Products Cannabis Oil Products
Revenue (calendar)
11.0x
12.0x
Annual Capacity (kg)
CannTrust Holdings Inc. is a licensed producer of medical
cannabis, with an operating indoor-growing facility in
Vaughan, Ontario, and a greenhouse facility in Fenwick,
Ontario currently being adapted for cannabis production.
Management’s focus is on producing high quality,
standardized, pharmaceutical-grade cannabis products. The
Company began selling cannabis products direct to patients
in early 2015, and it now serves approx. 25,000 patients
with 1,000 referring physicians. As of the end of April, the
Company employed 90 people.
8.0x
9.0x
10.0x
Registered Patients (per Health Canada) Cannabis Sales (per Health Canada)
EBITDA (calendar) EBITDA Margins
Based on Capacity ($000s/kg) TTM Results ($M)
Comparables
and Peer AnalysisPrice
52-Week
High
52-Week
Low
90-Day
Vol (mm)Last Q
Sales (kg)
Comparables
Multiples Analysis
FD Mkt.
Cap ($M)Cash ($M) Debt ($M)
FD EV
($M)
Last Q
Annual
(kg)
54.1x
17.4x
7.1x
20.4x
5.2x 2.5x
0
10
20
30
40
50
60
2017E 2018E 2019E
Co
mp
ara
ble
Gro
up
A
vera
ge M
ult
iple
s
EV / EBITDA EV / Sales
7,91415,545
23,930
39,668
75,166
98,460
129,876
167,754
0
20,000
40,000
60,000
80,000
100,000
120,000
140,000
160,000
180,000
June14
Sept14
Dec14
Mar15
June15
Sept15
Dec15
Mar16
June16
Sept16
Dec16
Mar17
Pat
ien
ts R
egis
tere
d w
ith
Hea
lth
Can
ada
408 596 789 9791,371
1,8732,481
3,666
5,537
7,193
9,243
11,509
0
2,000
4,000
6,000
8,000
10,000
12,000
14,000
June14
Sept14
Dec14
Mar15
June15
Sept15
Dec15
Mar16
June16
Sept16
Dec16
Mar17
Can
nab
is S
ales
(D
ried
+ O
ils, k
g eq
uiv
alen
t)
Source: Company Reports (historical data), Echelon Wealth Partners (estimates), Capital IQ (share price data, consensus estimates)
CannTrust Holdings Inc. (TRST-CSE) | August 29 2017
Page 3 of 31 Russell Stanley, MBA, CFA | 647.794.1922 | [email protected]
Estimates & Assumptions
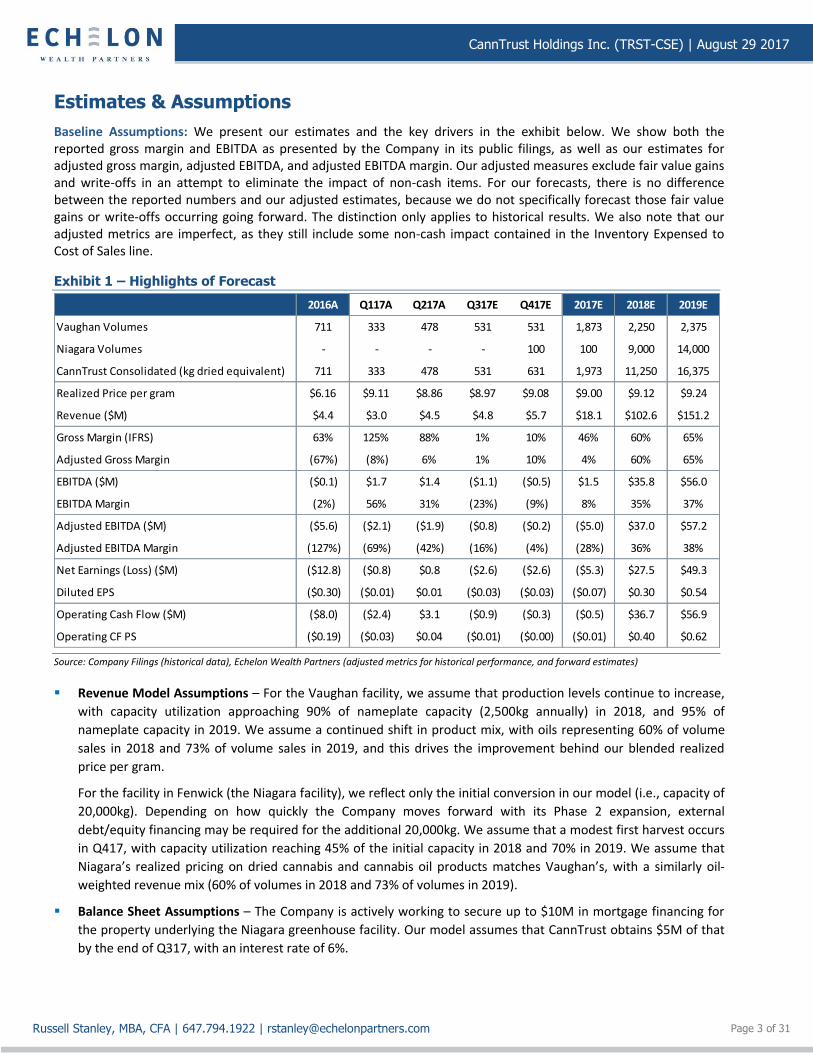
Baseline Assumptions: We present our estimates and the key drivers in the exhibit below. We show both the reported gross margin and EBITDA as presented by the Company in its public filings, as well as our estimates for adjusted gross margin, adjusted EBITDA, and adjusted EBITDA margin. Our adjusted measures exclude fair value gains and write-offs in an attempt to eliminate the impact of non-cash items. For our forecasts, there is no difference between the reported numbers and our adjusted estimates, because we do not specifically forecast those fair value gains or write-offs occurring going forward. The distinction only applies to historical results. We also note that our adjusted metrics are imperfect, as they still include some non-cash impact contained in the Inventory Expensed to Cost of Sales line.
Exhibit 1 – Highlights of Forecast
2016A Q117A Q217A Q317E Q417E 2017E 2018E 2019E
Vaughan Volumes 711 333 478 531 531 1,873 2,250 2,375
Niagara Volumes - - - - 100 100 9,000 14,000
CannTrust Consolidated (kg dried equivalent) 711 333 478 531 631 1,973 11,250 16,375
Realized Price per gram $6.16 $9.11 $8.86 $8.97 $9.08 $9.00 $9.12 $9.24
Revenue ($M) $4.4 $3.0 $4.5 $4.8 $5.7 $18.1 $102.6 $151.2
Gross Margin (IFRS) 63% 125% 88% 1% 10% 46% 60% 65%
Adjusted Gross Margin (67%) (8%) 6% 1% 10% 4% 60% 65%
EBITDA ($M) ($0.1) $1.7 $1.4 ($1.1) ($0.5) $1.5 $35.8 $56.0
EBITDA Margin (2%) 56% 31% (23%) (9%) 8% 35% 37%
Adjusted EBITDA ($M) ($5.6) ($2.1) ($1.9) ($0.8) ($0.2) ($5.0) $37.0 $57.2
Adjusted EBITDA Margin (127%) (69%) (42%) (16%) (4%) (28%) 36% 38%
Net Earnings (Loss) ($M) ($12.8) ($0.8) $0.8 ($2.6) ($2.6) ($5.3) $27.5 $49.3
Diluted EPS ($0.30) ($0.01) $0.01 ($0.03) ($0.03) ($0.07) $0.30 $0.54
Operating Cash Flow ($M) ($8.0) ($2.4) $3.1 ($0.9) ($0.3) ($0.5) $36.7 $56.9
Operating CF PS ($0.19) ($0.03) $0.04 ($0.01) ($0.00) ($0.01) $0.40 $0.62
Source: Company Filings (historical data), Echelon Wealth Partners (adjusted metrics for historical performance, and forward estimates)
▪ Revenue Model Assumptions – For the Vaughan facility, we assume that production levels continue to increase,
with capacity utilization approaching 90% of nameplate capacity (2,500kg annually) in 2018, and 95% of
nameplate capacity in 2019. We assume a continued shift in product mix, with oils representing 60% of volume
sales in 2018 and 73% of volume sales in 2019, and this drives the improvement behind our blended realized
price per gram.
For the facility in Fenwick (the Niagara facility), we reflect only the initial conversion in our model (i.e., capacity of
20,000kg). Depending on how quickly the Company moves forward with its Phase 2 expansion, external
debt/equity financing may be required for the additional 20,000kg. We assume that a modest first harvest occurs
in Q417, with capacity utilization reaching 45% of the initial capacity in 2018 and 70% in 2019. We assume that
Niagara’s realized pricing on dried cannabis and cannabis oil products matches Vaughan’s, with a similarly oil-
weighted revenue mix (60% of volumes in 2018 and 73% of volumes in 2019).
▪ Balance Sheet Assumptions – The Company is actively working to secure up to $10M in mortgage financing for
the property underlying the Niagara greenhouse facility. Our model assumes that CannTrust obtains $5M of that
by the end of Q317, with an interest rate of 6%.
CannTrust Holdings Inc. (TRST-CSE) | August 29 2017
Page 4 of 31 Russell Stanley, MBA, CFA | 647.794.1922 | [email protected]
▪ Effective Tax Rate – CannTrust also has $17.9M in non-capital tax losses, and the vast majority of these do not
begin to expire until 2024. Nonetheless, we conservatively assume that the Company is fully taxed at 26.5%
throughout our forecast period.
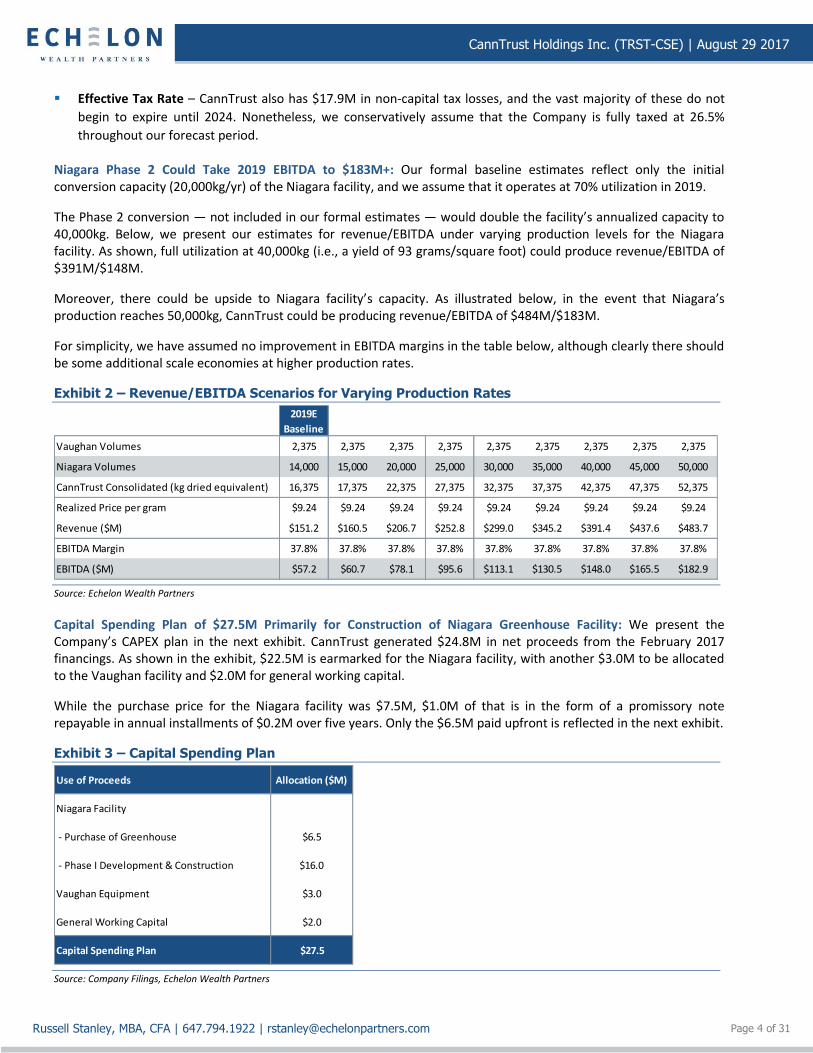
Niagara Phase 2 Could Take 2019 EBITDA to $183M+: Our formal baseline estimates reflect only the initial conversion capacity (20,000kg/yr) of the Niagara facility, and we assume that it operates at 70% utilization in 2019.
The Phase 2 conversion — not included in our formal estimates — would double the facility’s annualized capacity to 40,000kg. Below, we present our estimates for revenue/EBITDA under varying production levels for the Niagara facility. As shown, full utilization at 40,000kg (i.e., a yield of 93 grams/square foot) could produce revenue/EBITDA of $391M/$148M.
Moreover, there could be upside to Niagara facility’s capacity. As illustrated below, in the event that Niagara’s production reaches 50,000kg, CannTrust could be producing revenue/EBITDA of $484M/$183M.
For simplicity, we have assumed no improvement in EBITDA margins in the table below, although clearly there should be some additional scale economies at higher production rates.
Exhibit 2 – Revenue/EBITDA Scenarios for Varying Production Rates
2019E
Baseline
Vaughan Volumes 2,375 2,375 2,375 2,375 2,375 2,375 2,375 2,375 2,375
Niagara Volumes 14,000 15,000 20,000 25,000 30,000 35,000 40,000 45,000 50,000
CannTrust Consolidated (kg dried equivalent) 16,375 17,375 22,375 27,375 32,375 37,375 42,375 47,375 52,375
Realized Price per gram $9.24 $9.24 $9.24 $9.24 $9.24 $9.24 $9.24 $9.24 $9.24
Revenue ($M) $151.2 $160.5 $206.7 $252.8 $299.0 $345.2 $391.4 $437.6 $483.7
EBITDA Margin 37.8% 37.8% 37.8% 37.8% 37.8% 37.8% 37.8% 37.8% 37.8%
EBITDA ($M) $57.2 $60.7 $78.1 $95.6 $113.1 $130.5 $148.0 $165.5 $182.9 Source: Echelon Wealth Partners
Capital Spending Plan of $27.5M Primarily for Construction of Niagara Greenhouse Facility: We present the Company’s CAPEX plan in the next exhibit. CannTrust generated $24.8M in net proceeds from the February 2017 financings. As shown in the exhibit, $22.5M is earmarked for the Niagara facility, with another $3.0M to be allocated to the Vaughan facility and $2.0M for general working capital.
While the purchase price for the Niagara facility was $7.5M, $1.0M of that is in the form of a promissory note repayable in annual installments of $0.2M over five years. Only the $6.5M paid upfront is reflected in the next exhibit.
Exhibit 3 – Capital Spending Plan
Use of Proceeds Allocation ($M)
Niagara Facility
- Purchase of Greenhouse $6.5
- Phase I Development & Construction $16.0
Vaughan Equipment $3.0
General Working Capital $2.0
Capital Spending Plan $27.5
Source: Company Filings, Echelon Wealth Partners
CannTrust Holdings Inc. (TRST-CSE) | August 29 2017
Page 5 of 31 Russell Stanley, MBA, CFA | 647.794.1922 | [email protected]
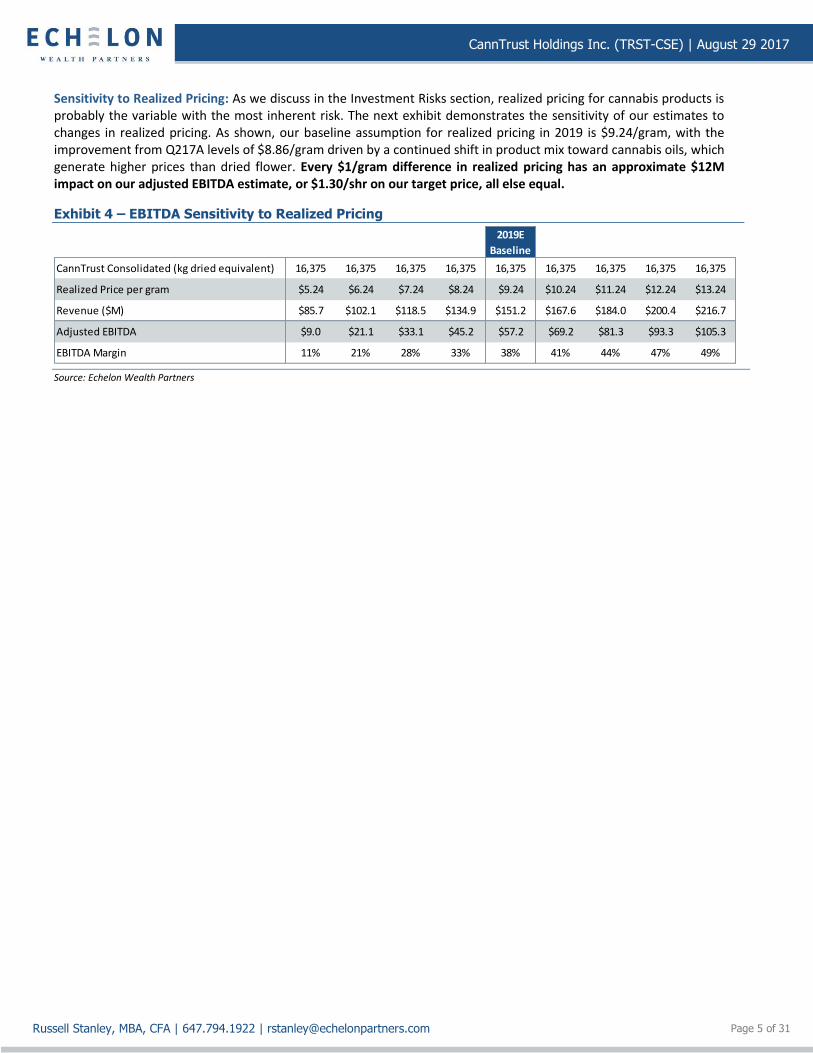
Sensitivity to Realized Pricing: As we discuss in the Investment Risks section, realized pricing for cannabis products is probably the variable with the most inherent risk. The next exhibit demonstrates the sensitivity of our estimates to changes in realized pricing. As shown, our baseline assumption for realized pricing in 2019 is $9.24/gram, with the improvement from Q217A levels of $8.86/gram driven by a continued shift in product mix toward cannabis oils, which generate higher prices than dried flower. Every $1/gram difference in realized pricing has an approximate $12M impact on our adjusted EBITDA estimate, or $1.30/shr on our target price, all else equal.
Exhibit 4 – EBITDA Sensitivity to Realized Pricing
2019E
Baseline
CannTrust Consolidated (kg dried equivalent) 16,375 16,375 16,375 16,375 16,375 16,375 16,375 16,375 16,375
Realized Price per gram $5.24 $6.24 $7.24 $8.24 $9.24 $10.24 $11.24 $12.24 $13.24
Revenue ($M) $85.7 $102.1 $118.5 $134.9 $151.2 $167.6 $184.0 $200.4 $216.7
Adjusted EBITDA $9.0 $21.1 $33.1 $45.2 $57.2 $69.2 $81.3 $93.3 $105.3
EBITDA Margin 11% 21% 28% 33% 38% 41% 44% 47% 49% Source: Echelon Wealth Partners
CannTrust Holdings Inc. (TRST-CSE) | August 29 2017
Page 6 of 31 Russell Stanley, MBA, CFA | 647.794.1922 | [email protected]
Valuation
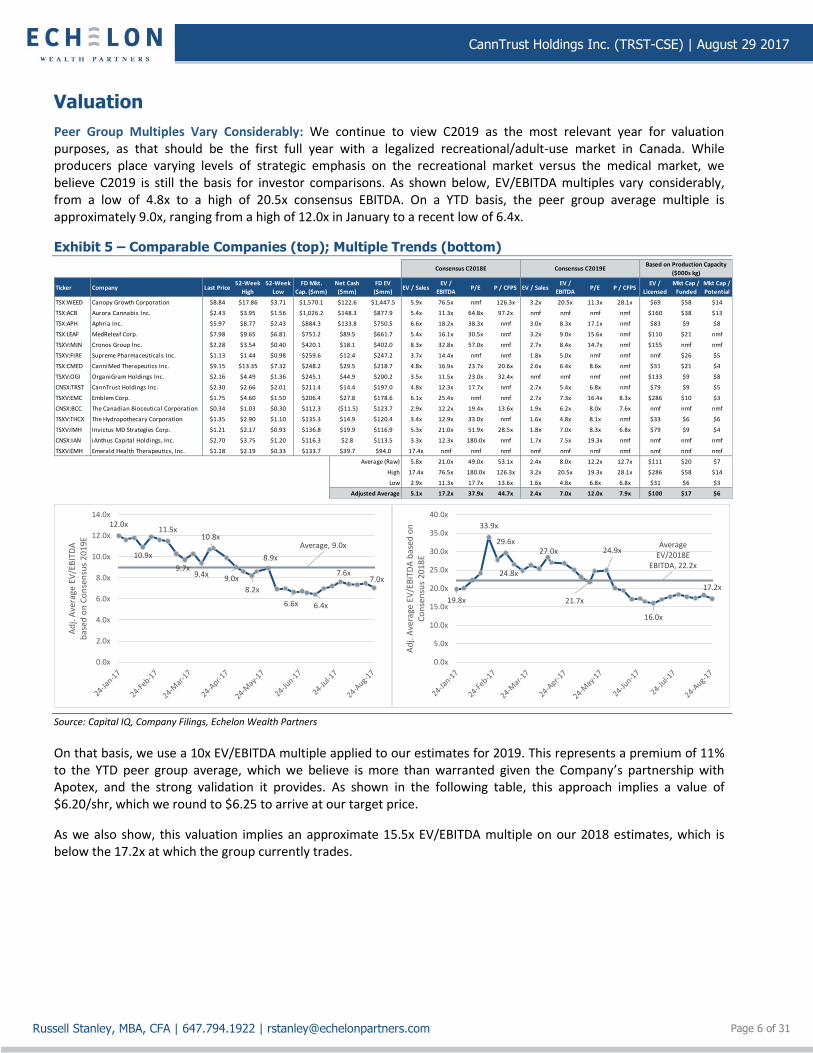
Peer Group Multiples Vary Considerably: We continue to view C2019 as the most relevant year for valuation purposes, as that should be the first full year with a legalized recreational/adult-use market in Canada. While producers place varying levels of strategic emphasis on the recreational market versus the medical market, we believe C2019 is still the basis for investor comparisons. As shown below, EV/EBITDA multiples vary considerably, from a low of 4.8x to a high of 20.5x consensus EBITDA. On a YTD basis, the peer group average multiple is approximately 9.0x, ranging from a high of 12.0x in January to a recent low of 6.4x.
Exhibit 5 – Comparable Companies (top); Multiple Trends (bottom)
Ticker Company Last Price52-Week
High
52-Week
Low
FD Mkt.
Cap. ($mm)
Net Cash
($mm)
FD EV
($mm)EV / Sales
EV /
EBITDAP/E P / CFPS EV / Sales
EV /
EBITDAP/E P / CFPS
EV /
Licensed
Mkt Cap /
Funded
Mkt Cap /
Potential
TSX:WEED Canopy Growth Corporation $8.84 $17.86 $3.71 $1,570.1 $122.6 $1,447.5 5.9x 76.5x nmf 126.3x 3.2x 20.5x 11.3x 28.1x $69 $58 $14
TSX:ACB Aurora Cannabis Inc. $2.43 $3.95 $1.56 $1,026.2 $148.3 $877.9 5.4x 11.3x 64.8x 97.2x nmf nmf nmf nmf $160 $38 $13
TSX:APH Aphria Inc. $5.97 $8.77 $2.43 $884.3 $133.8 $750.5 6.6x 18.2x 38.3x nmf 3.0x 8.3x 17.1x nmf $83 $9 $8
TSX:LEAF MedReleaf Corp. $7.98 $9.65 $6.81 $751.2 $89.5 $661.7 5.4x 16.1x 30.5x nmf 3.2x 9.0x 15.6x nmf $110 $21 nmf
TSXV:MJN Cronos Group Inc. $2.28 $3.54 $0.40 $420.1 $18.1 $402.0 8.3x 32.8x 57.0x nmf 2.7x 8.4x 14.7x nmf $155 nmf nmf
TSXV:FIRE Supreme Pharmaceuticals Inc. $1.13 $1.44 $0.98 $259.6 $12.4 $247.2 3.7x 14.4x nmf nmf 1.8x 5.0x nmf nmf nmf $26 $5
TSX:CMED CanniMed Therapeutics Inc. $9.15 $13.35 $7.32 $248.2 $29.5 $218.7 4.8x 16.9x 23.7x 20.6x 2.6x 6.4x 8.6x nmf $31 $21 $4
TSXV:OGI OrganiGram Holdings Inc. $2.16 $4.49 $1.36 $245.1 $44.9 $200.2 3.5x 11.5x 23.0x 32.4x nmf nmf nmf nmf $133 $9 $8
CNSX:TRST CannTrust Holdings Inc. $2.30 $2.66 $2.01 $211.4 $14.4 $197.0 4.8x 12.3x 17.7x nmf 2.7x 5.4x 6.8x nmf $79 $9 $5
TSXV:EMC Emblem Corp. $1.75 $4.60 $1.50 $206.4 $27.8 $178.6 6.1x 25.4x nmf nmf 2.7x 7.3x 16.4x 8.3x $286 $10 $3
CNSX:BCC The Canadian Bioceutical Corporation $0.34 $1.03 $0.30 $112.3 ($11.5) $123.7 2.9x 12.2x 19.4x 13.6x 1.9x 6.2x 8.0x 7.6x nmf nmf nmf
TSXV:THCX The Hydropothecary Corporation $1.35 $2.90 $1.10 $135.3 $14.9 $120.4 3.4x 12.9x 33.0x nmf 1.6x 4.8x 8.1x nmf $33 $6 $6
TSXV:IMH Invictus MD Strategies Corp. $1.21 $2.17 $0.93 $136.8 $19.9 $116.9 5.3x 21.0x 51.9x 28.5x 1.8x 7.0x 8.3x 6.8x $79 $9 $4
CNSX:IAN iAnthus Capital Holdings, Inc. $2.70 $3.75 $1.20 $116.3 $2.8 $113.5 3.3x 12.3x 180.0x nmf 1.7x 7.5x 19.3x nmf nmf nmf nmf
TSXV:EMH Emerald Health Therapeutics, Inc. $1.18 $2.19 $0.33 $133.7 $39.7 $94.0 17.4x nmf nmf nmf nmf nmf nmf nmf nmf nmf nmf
Average (Raw) 5.8x 21.0x 49.0x 53.1x 2.4x 8.0x 12.2x 12.7x $111 $20 $7
High 17.4x 76.5x 180.0x 126.3x 3.2x 20.5x 19.3x 28.1x $286 $58 $14
Low 2.9x 11.3x 17.7x 13.6x 1.6x 4.8x 6.8x 6.8x $31 $6 $3
Adjusted Average 5.1x 17.2x 37.9x 44.7x 2.4x 7.0x 12.0x 7.9x $100 $17 $6
Consensus C2018E Consensus C2019EBased on Production Capacity
($000s kg)
12.0x
10.9x
11.5x
9.7x9.4x
10.8x
9.0x
8.2x
8.9x
6.6x 6.4x
7.6x7.0x
Average, 9.0x
0.0x
2.0x
4.0x
6.0x
8.0x
10.0x
12.0x
14.0x
Ad
j. A
vera
ge E
V/E
BIT
DA
b
ased
on
Co
nse
nsu
s 2
01
9E
19.8x
33.9x
29.6x
24.8x
27.0x
21.7x
24.9x
16.0x
17.2x
Average EV/2018E
EBITDA, 22.2x
0.0x
5.0x
10.0x
15.0x
20.0x
25.0x
30.0x
35.0x
40.0x
Ad
j. A
vera
ge E
V/E
BIT
DA
bas
ed o
n
Co
nse
nsu
s 2
01
8E
Source: Capital IQ, Company Filings, Echelon Wealth Partners
On that basis, we use a 10x EV/EBITDA multiple applied to our estimates for 2019. This represents a premium of 11% to the YTD peer group average, which we believe is more than warranted given the Company’s partnership with Apotex, and the strong validation it provides. As shown in the following table, this approach implies a value of $6.20/shr, which we round to $6.25 to arrive at our target price.
As we also show, this valuation implies an approximate 15.5x EV/EBITDA multiple on our 2018 estimates, which is below the 17.2x at which the group currently trades.
CannTrust Holdings Inc. (TRST-CSE) | August 29 2017
Page 7 of 31 Russell Stanley, MBA, CFA | 647.794.1922 | [email protected]
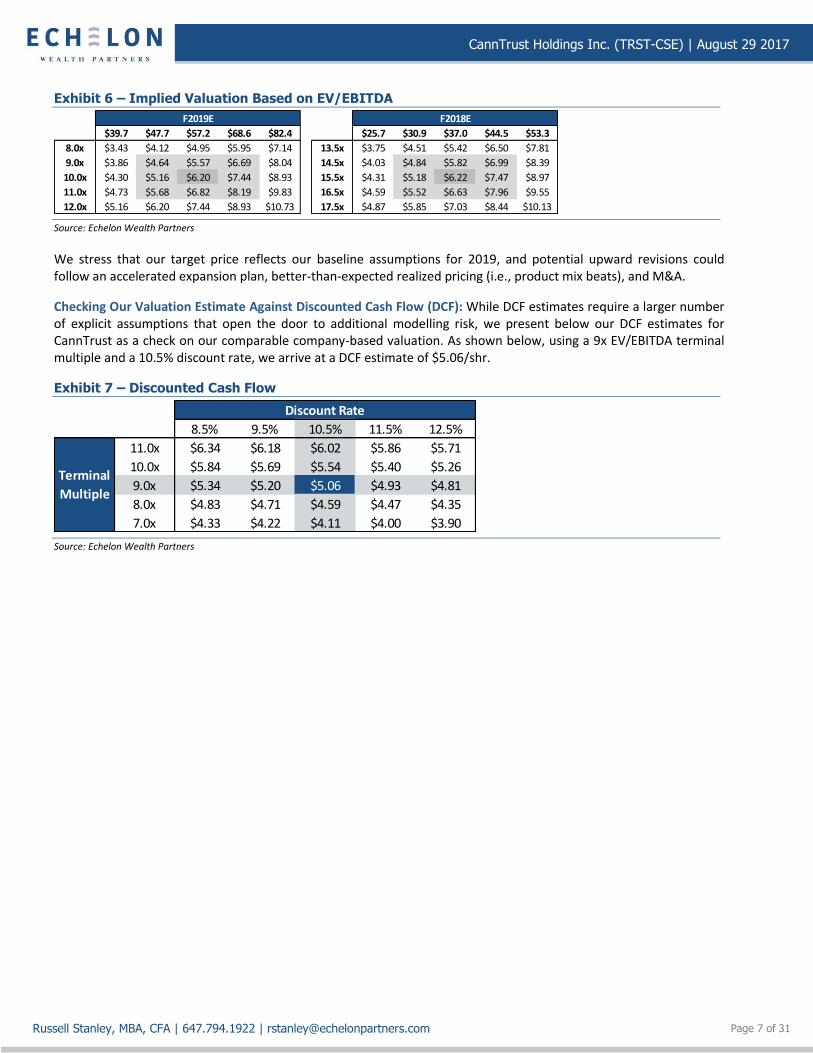
Exhibit 6 – Implied Valuation Based on EV/EBITDA
$39.7 $47.7 $57.2 $68.6 $82.4
8.0x $3.43 $4.12 $4.95 $5.95 $7.14
9.0x $3.86 $4.64 $5.57 $6.69 $8.04
10.0x $4.30 $5.16 $6.20 $7.44 $8.93
11.0x $4.73 $5.68 $6.82 $8.19 $9.83
12.0x $5.16 $6.20 $7.44 $8.93 $10.73
F2019E
$25.7 $30.9 $37.0 $44.5 $53.3
13.5x $3.75 $4.51 $5.42 $6.50 $7.81
14.5x $4.03 $4.84 $5.82 $6.99 $8.39
15.5x $4.31 $5.18 $6.22 $7.47 $8.97
16.5x $4.59 $5.52 $6.63 $7.96 $9.55
17.5x $4.87 $5.85 $7.03 $8.44 $10.13
F2018E
Source: Echelon Wealth Partners
We stress that our target price reflects our baseline assumptions for 2019, and potential upward revisions could follow an accelerated expansion plan, better-than-expected realized pricing (i.e., product mix beats), and M&A.
Checking Our Valuation Estimate Against Discounted Cash Flow (DCF): While DCF estimates require a larger number of explicit assumptions that open the door to additional modelling risk, we present below our DCF estimates for CannTrust as a check on our comparable company-based valuation. As shown below, using a 9x EV/EBITDA terminal multiple and a 10.5% discount rate, we arrive at a DCF estimate of $5.06/shr.
Exhibit 7 – Discounted Cash Flow
8.5% 9.5% 10.5% 11.5% 12.5%
11.0x $6.34 $6.18 $6.02 $5.86 $5.71
10.0x $5.84 $5.69 $5.54 $5.40 $5.26
9.0x $5.34 $5.20 $5.06 $4.93 $4.81
8.0x $4.83 $4.71 $4.59 $4.47 $4.35
7.0x $4.33 $4.22 $4.11 $4.00 $3.90
Discount Rate
Terminal
Multiple
Source: Echelon Wealth Partners
CannTrust Holdings Inc. (TRST-CSE) | August 29 2017
Page 8 of 31 Russell Stanley, MBA, CFA | 647.794.1922 | [email protected]
Background
CannTrust has been Producing since June 2014: The business was founded in August 2013, and it has been operating under its current name since November 2014. The holding company corporate entity was formed in March 2015 and a corporate re-organization was completed the following month, resulting in the corporate entity acquiring the operating company for 35.7M shares. CannTrust obtained its cultivation license from Health Canada in June 2014, with direct sales to patients beginning in March 2015.
Joint Venture with Apotex Sets Stage for Pharmaceutical Development: In December 2016, CannTrust entered an exclusive, global JV with Apotex Inc., the seventh largest generic pharmaceutical manufacturer in the world. The agreement contemplates joint development of novel dosage formats and products. While a number of LPs have announced plans to develop cannabis-based pharmaceutical products, we believe CannTrust is relatively unique for having a formal partnership with a major pharmaceutical company. We view this as a very strong validation of the Company’s product quality and manufacturing processes.
Private Placements Generate Net Proceeds of $24.8M in February: In February 2017, CannTrust completed a $25.2M financing at $2.00/special warrant, with each special warrant exercisable into shares on a 1-for-1 basis upon completion of the IPO. The Company also completed a separate $1.0M private placement at $2.00/shr. In aggregate, these financings generated net proceeds of $24.8M.
Acquisition of Greenhouse Significantly Expands Production Potential: In March 2017, CannTrust acquired the assets of a greenhouse operation in Fenwick, Ontario, for $7.5M. This included an initial cash payment of $6.5M and a $1.0M promissory note payable in five annual installments of $0.2M. The Company is currently adapting this greenhouse for cannabis production, and expects to host a pre-license inspection from Health Canada once construction work is complete (target: end of September).
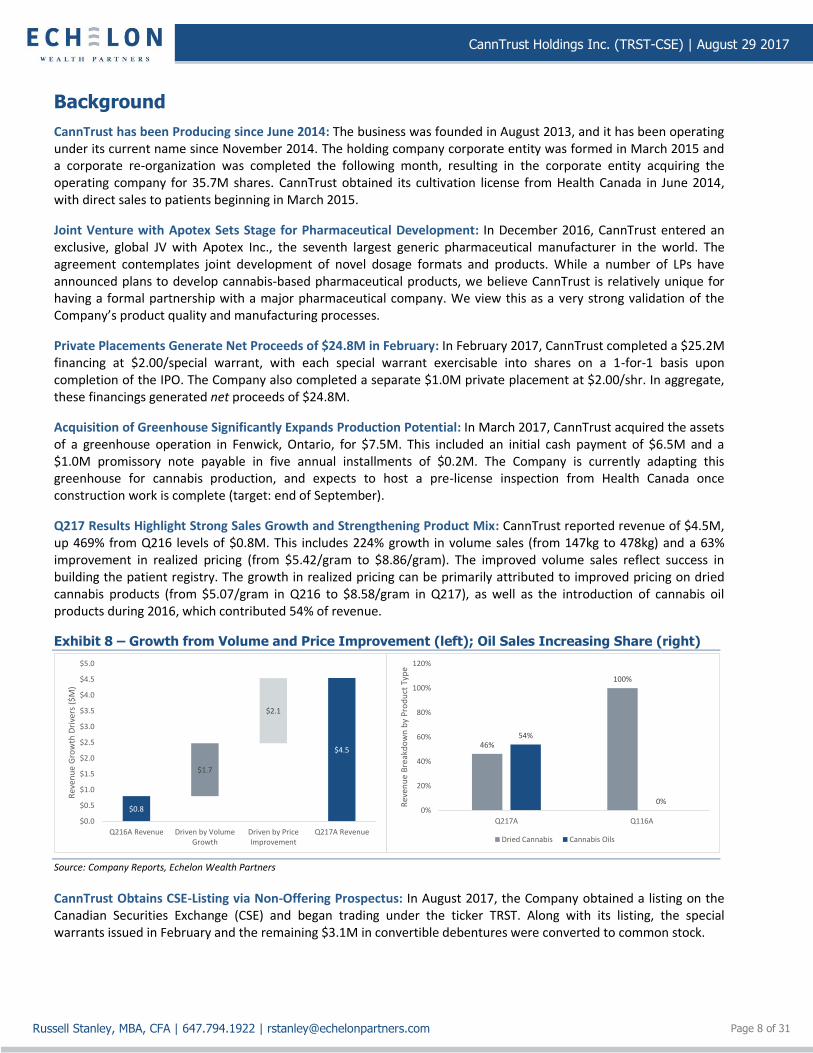
Q217 Results Highlight Strong Sales Growth and Strengthening Product Mix: CannTrust reported revenue of $4.5M, up 469% from Q216 levels of $0.8M. This includes 224% growth in volume sales (from 147kg to 478kg) and a 63% improvement in realized pricing (from $5.42/gram to $8.86/gram). The improved volume sales reflect success in building the patient registry. The growth in realized pricing can be primarily attributed to improved pricing on dried cannabis products (from $5.07/gram in Q216 to $8.58/gram in Q217), as well as the introduction of cannabis oil products during 2016, which contributed 54% of revenue.
Exhibit 8 – Growth from Volume and Price Improvement (left); Oil Sales Increasing Share (right)
$4.5
$1.7
$2.1
$0.8
$0.0
$0.5
$1.0
$1.5
$2.0
$2.5
$3.0
$3.5
$4.0
$4.5
$5.0
Q216A Revenue Driven by VolumeGrowth
Driven by PriceImprovement
Q217A Revenue
Rev
enu
e G
row
th D
rive
rs (
$M
)
46%
100%
54%
0%0%
20%
40%
60%
80%
100%
120%
Q217A Q116A
Rev
enu
e B
reak
do
wn
by
Pro
du
ct T
ype
Dried Cannabis Cannabis Oils
Source: Company Reports, Echelon Wealth Partners
CannTrust Obtains CSE-Listing via Non-Offering Prospectus: In August 2017, the Company obtained a listing on the Canadian Securities Exchange (CSE) and began trading under the ticker TRST. Along with its listing, the special warrants issued in February and the remaining $3.1M in convertible debentures were converted to common stock.
CannTrust Holdings Inc. (TRST-CSE) | August 29 2017
Page 9 of 31 Russell Stanley, MBA, CFA | 647.794.1922 | [email protected]
Business Overview: Established Producer with Strong Growth Potential
CannTrust Holdings Inc. is a licensed producer of medical cannabis, with an operating indoor-growing facility in Vaughan, Ontario, and a greenhouse facility in Fenwick, Ontario, currently being adapted for cannabis production. Management’s focus is on producing high-quality, standardized, pharmaceutical-grade cannabis products. The Company began selling cannabis products direct to patients in early 2015, and as of August 2017, it had expanded its patient base to over 25,000 revenue-generating patients with almost 1,000 referring physicians. As of the end of April, the Company employed 90 people.
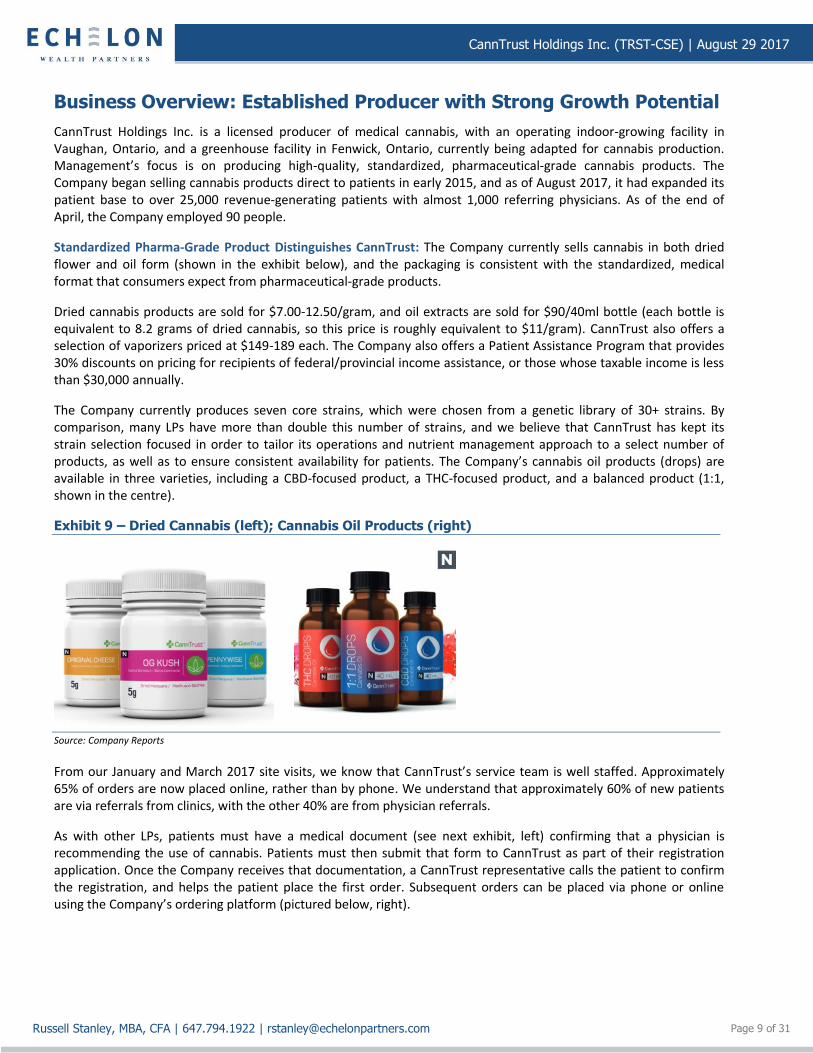
Standardized Pharma-Grade Product Distinguishes CannTrust: The Company currently sells cannabis in both dried flower and oil form (shown in the exhibit below), and the packaging is consistent with the standardized, medical format that consumers expect from pharmaceutical-grade products.
Dried cannabis products are sold for $7.00-12.50/gram, and oil extracts are sold for $90/40ml bottle (each bottle is equivalent to 8.2 grams of dried cannabis, so this price is roughly equivalent to $11/gram). CannTrust also offers a selection of vaporizers priced at $149-189 each. The Company also offers a Patient Assistance Program that provides 30% discounts on pricing for recipients of federal/provincial income assistance, or those whose taxable income is less than $30,000 annually.
The Company currently produces seven core strains, which were chosen from a genetic library of 30+ strains. By comparison, many LPs have more than double this number of strains, and we believe that CannTrust has kept its strain selection focused in order to tailor its operations and nutrient management approach to a select number of products, as well as to ensure consistent availability for patients. The Company’s cannabis oil products (drops) are available in three varieties, including a CBD-focused product, a THC-focused product, and a balanced product (1:1, shown in the centre).
Exhibit 9 – Dried Cannabis (left); Cannabis Oil Products (right)
Source: Company Reports
From our January and March 2017 site visits, we know that CannTrust’s service team is well staffed. Approximately 65% of orders are now placed online, rather than by phone. We understand that approximately 60% of new patients are via referrals from clinics, with the other 40% are from physician referrals.
As with other LPs, patients must have a medical document (see next exhibit, left) confirming that a physician is recommending the use of cannabis. Patients must then submit that form to CannTrust as part of their registration application. Once the Company receives that documentation, a CannTrust representative calls the patient to confirm the registration, and helps the patient place the first order. Subsequent orders can be placed via phone or online using the Company’s ordering platform (pictured below, right).
CannTrust Holdings Inc. (TRST-CSE) | August 29 2017
Page 10 of 31 Russell Stanley, MBA, CFA | 647.794.1922 | [email protected]
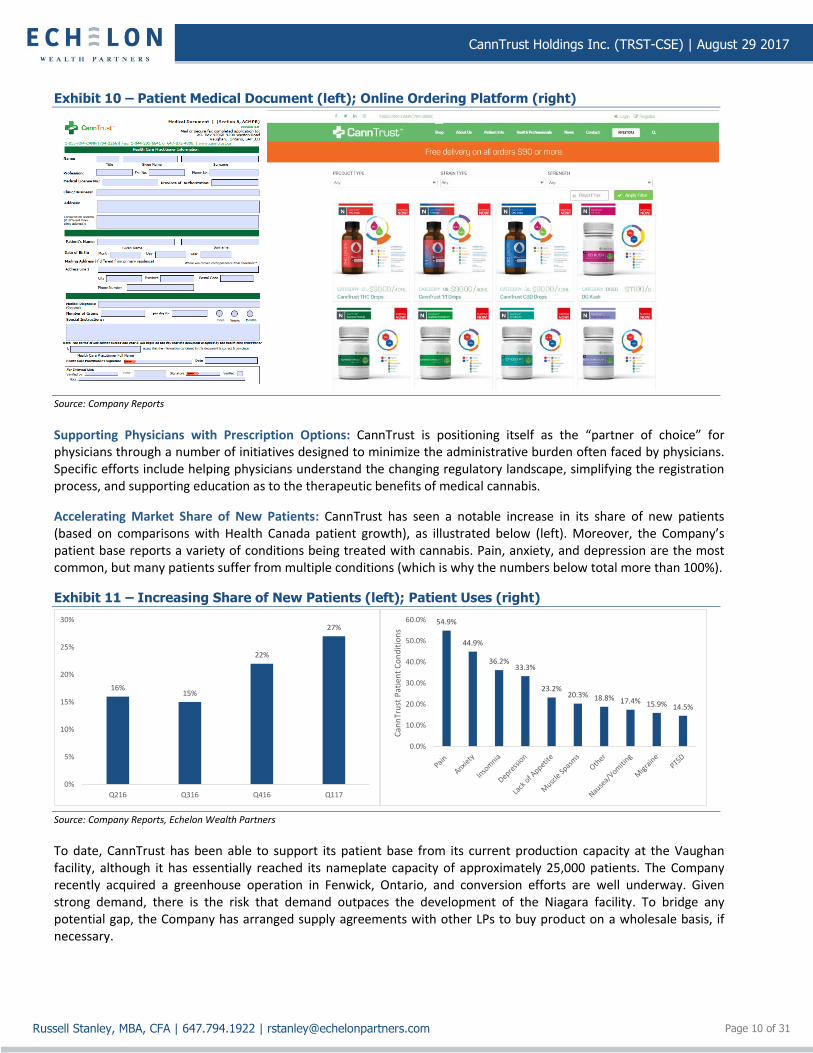
Exhibit 10 – Patient Medical Document (left); Online Ordering Platform (right)
Source: Company Reports
Supporting Physicians with Prescription Options: CannTrust is positioning itself as the “partner of choice” for physicians through a number of initiatives designed to minimize the administrative burden often faced by physicians. Specific efforts include helping physicians understand the changing regulatory landscape, simplifying the registration process, and supporting education as to the therapeutic benefits of medical cannabis.
Accelerating Market Share of New Patients: CannTrust has seen a notable increase in its share of new patients (based on comparisons with Health Canada patient growth), as illustrated below (left). Moreover, the Company’s patient base reports a variety of conditions being treated with cannabis. Pain, anxiety, and depression are the most common, but many patients suffer from multiple conditions (which is why the numbers below total more than 100%).
Exhibit 11 – Increasing Share of New Patients (left); Patient Uses (right)
16%15%
22%
27%
0%
5%
10%
15%
20%
25%
30%
Q216 Q316 Q416 Q117
54.9%
44.9%
36.2%33.3%
23.2%20.3% 18.8% 17.4% 15.9% 14.5%
0.0%
10.0%
20.0%
30.0%
40.0%
50.0%
60.0%
Can
nTr
ust
Pat
ien
t C
on
dit
ion
s
Source: Company Reports, Echelon Wealth Partners
To date, CannTrust has been able to support its patient base from its current production capacity at the Vaughan facility, although it has essentially reached its nameplate capacity of approximately 25,000 patients. The Company recently acquired a greenhouse operation in Fenwick, Ontario, and conversion efforts are well underway. Given strong demand, there is the risk that demand outpaces the development of the Niagara facility. To bridge any potential gap, the Company has arranged supply agreements with other LPs to buy product on a wholesale basis, if necessary.
CannTrust Holdings Inc. (TRST-CSE) | August 29 2017
Page 11 of 31 Russell Stanley, MBA, CFA | 647.794.1922 | [email protected]
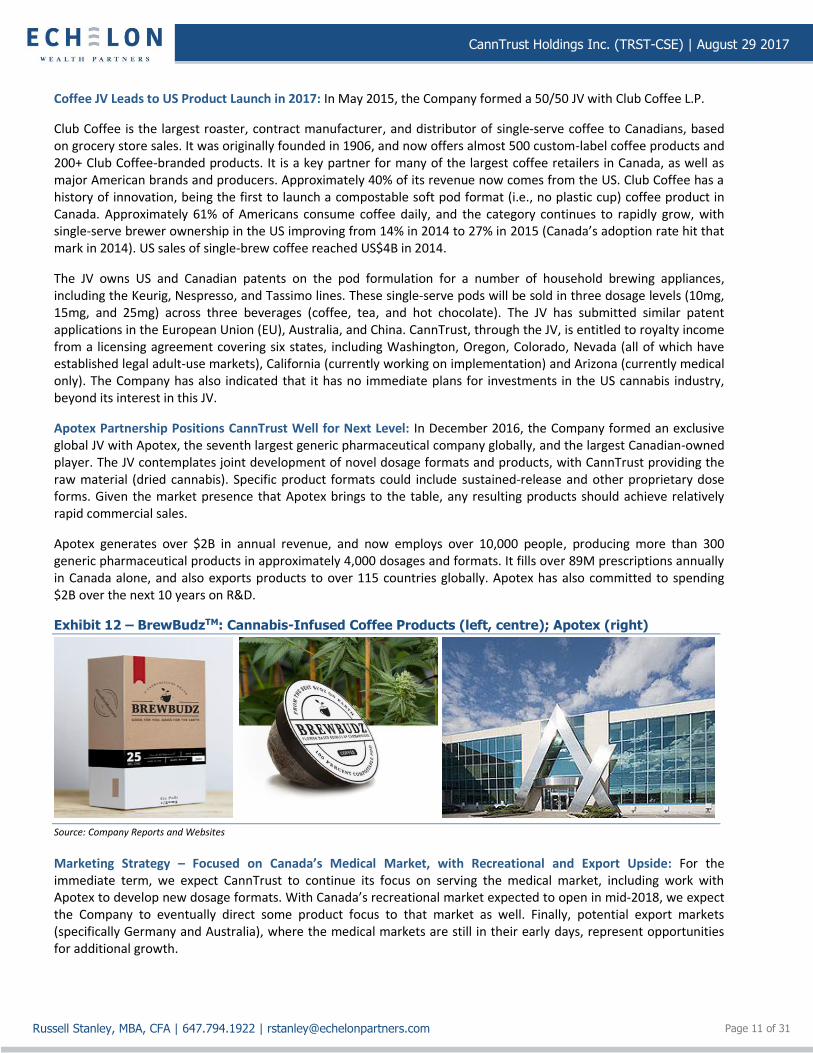
Coffee JV Leads to US Product Launch in 2017: In May 2015, the Company formed a 50/50 JV with Club Coffee L.P.
Club Coffee is the largest roaster, contract manufacturer, and distributor of single-serve coffee to Canadians, based on grocery store sales. It was originally founded in 1906, and now offers almost 500 custom-label coffee products and 200+ Club Coffee-branded products. It is a key partner for many of the largest coffee retailers in Canada, as well as major American brands and producers. Approximately 40% of its revenue now comes from the US. Club Coffee has a history of innovation, being the first to launch a compostable soft pod format (i.e., no plastic cup) coffee product in Canada. Approximately 61% of Americans consume coffee daily, and the category continues to rapidly grow, with single-serve brewer ownership in the US improving from 14% in 2014 to 27% in 2015 (Canada’s adoption rate hit that mark in 2014). US sales of single-brew coffee reached US$4B in 2014.
The JV owns US and Canadian patents on the pod formulation for a number of household brewing appliances, including the Keurig, Nespresso, and Tassimo lines. These single-serve pods will be sold in three dosage levels (10mg, 15mg, and 25mg) across three beverages (coffee, tea, and hot chocolate). The JV has submitted similar patent applications in the European Union (EU), Australia, and China. CannTrust, through the JV, is entitled to royalty income from a licensing agreement covering six states, including Washington, Oregon, Colorado, Nevada (all of which have established legal adult-use markets), California (currently working on implementation) and Arizona (currently medical only). The Company has also indicated that it has no immediate plans for investments in the US cannabis industry, beyond its interest in this JV.
Apotex Partnership Positions CannTrust Well for Next Level: In December 2016, the Company formed an exclusive global JV with Apotex, the seventh largest generic pharmaceutical company globally, and the largest Canadian-owned player. The JV contemplates joint development of novel dosage formats and products, with CannTrust providing the raw material (dried cannabis). Specific product formats could include sustained-release and other proprietary dose forms. Given the market presence that Apotex brings to the table, any resulting products should achieve relatively rapid commercial sales.
Apotex generates over $2B in annual revenue, and now employs over 10,000 people, producing more than 300 generic pharmaceutical products in approximately 4,000 dosages and formats. It fills over 89M prescriptions annually in Canada alone, and also exports products to over 115 countries globally. Apotex has also committed to spending $2B over the next 10 years on R&D.
Exhibit 12 – BrewBudzTM: Cannabis-Infused Coffee Products (left, centre); Apotex (right)
Source: Company Reports and Websites
Marketing Strategy – Focused on Canada’s Medical Market, with Recreational and Export Upside: For the immediate term, we expect CannTrust to continue its focus on serving the medical market, including work with Apotex to develop new dosage formats. With Canada’s recreational market expected to open in mid-2018, we expect the Company to eventually direct some product focus to that market as well. Finally, potential export markets (specifically Germany and Australia), where the medical markets are still in their early days, represent opportunities for additional growth.
CannTrust Holdings Inc. (TRST-CSE) | August 29 2017
Page 12 of 31 Russell Stanley, MBA, CFA | 647.794.1922 | [email protected]
The Vaughan Facility — Already Pushing Patient Capacity: The Company operates a 40,000-square-foot hydroponic indoor growing facility in Vaughan, Ontario, about a 30-minute drive from Toronto. The facility has a nameplate production capacity of 2,500kg of dried marijuana equivalent, with five grow rooms producing five “turns” annually, with output of 100-120kg/turn.
The original cultivation license was received in June 2014, and its current renewal date is March 2020. The current license term of 30 months is notable. We view CannTrust’s long license term as indicative of its strong track record with Health Canada.
The facility is leased, with its initial 10-year term ending in November 2023, although the Company has the option to extend the lease for another two 5-year terms. The facility has four Level 8 safes, giving CannTrust vault capacity of $25M, with each safe licensed for $6.25M at $10/gram. During 2014 through Q117, the Company made investments totalling $8.4M in the Vaughan facility. Specific focuses included technology for sanitation, risk mitigation and the prevention of crop failures, as well as automated nutrient delivery/management systems.
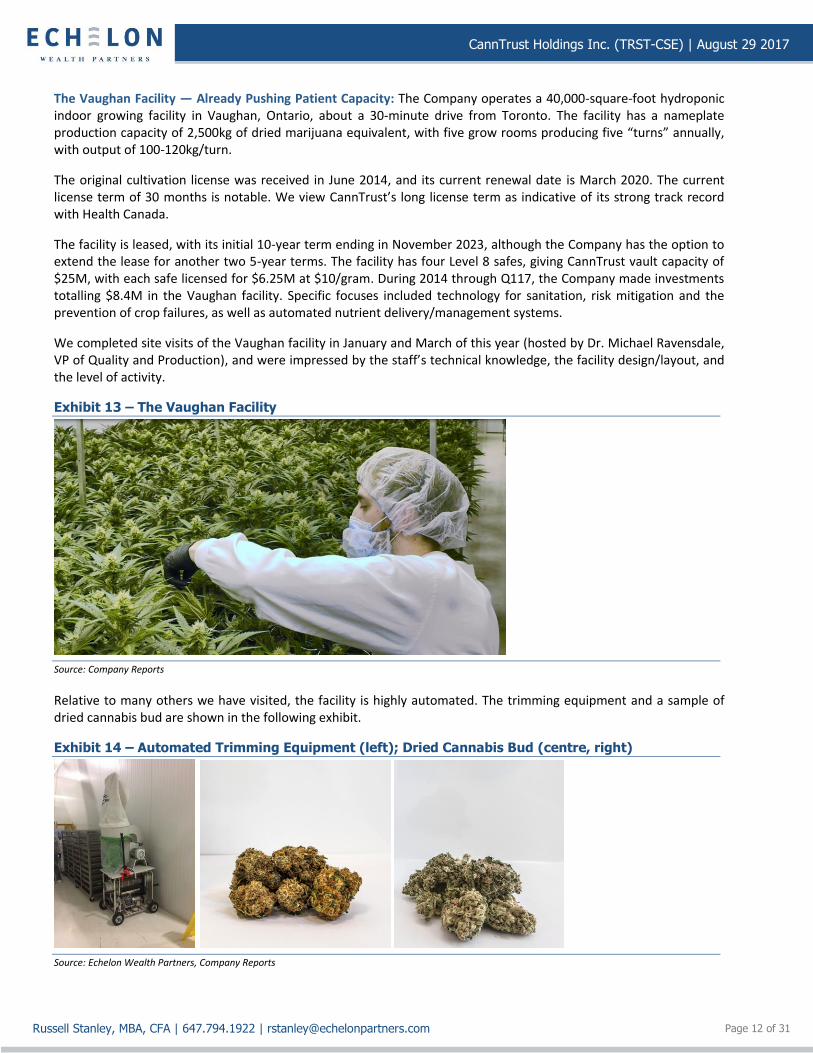
We completed site visits of the Vaughan facility in January and March of this year (hosted by Dr. Michael Ravensdale, VP of Quality and Production), and were impressed by the staff’s technical knowledge, the facility design/layout, and the level of activity.
Exhibit 13 – The Vaughan Facility
Source: Company Reports
Relative to many others we have visited, the facility is highly automated. The trimming equipment and a sample of dried cannabis bud are shown in the following exhibit.
Exhibit 14 – Automated Trimming Equipment (left); Dried Cannabis Bud (centre, right)
Source: Echelon Wealth Partners, Company Reports
CannTrust Holdings Inc. (TRST-CSE) | August 29 2017
Page 13 of 31 Russell Stanley, MBA, CFA | 647.794.1922 | [email protected]
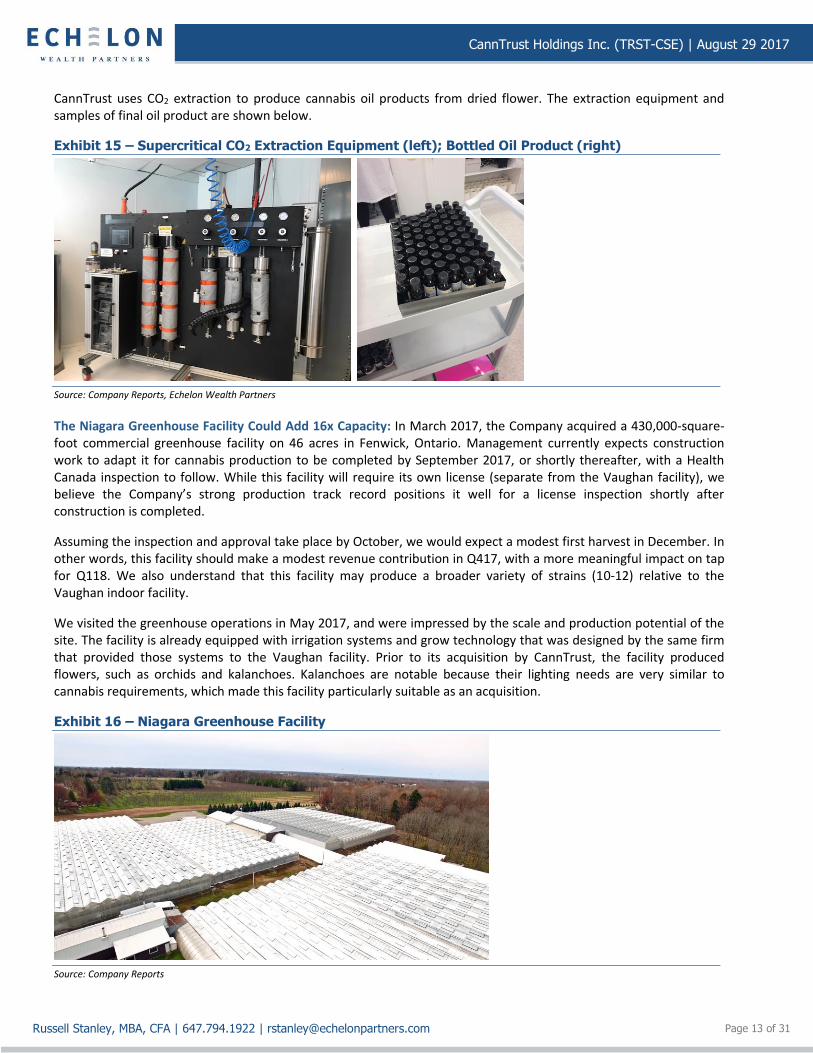
CannTrust uses CO2 extraction to produce cannabis oil products from dried flower. The extraction equipment and samples of final oil product are shown below.
Exhibit 15 – Supercritical CO2 Extraction Equipment (left); Bottled Oil Product (right)
Source: Company Reports, Echelon Wealth Partners
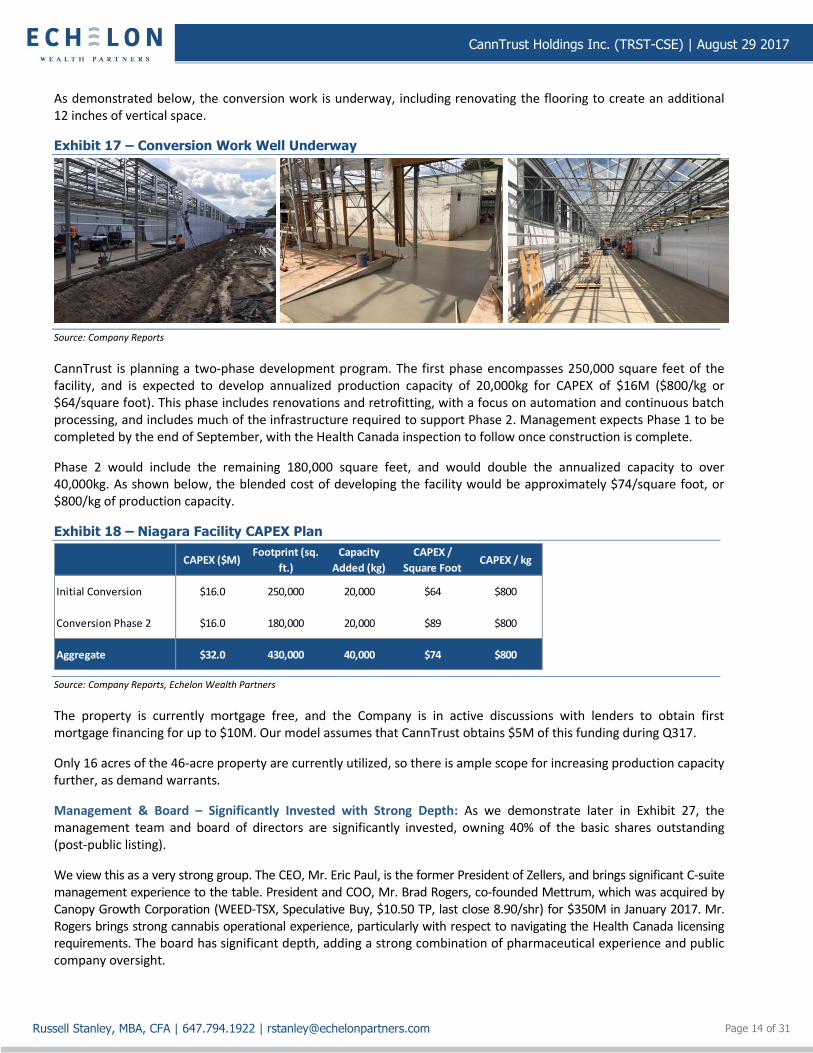
The Niagara Greenhouse Facility Could Add 16x Capacity: In March 2017, the Company acquired a 430,000-square-foot commercial greenhouse facility on 46 acres in Fenwick, Ontario. Management currently expects construction work to adapt it for cannabis production to be completed by September 2017, or shortly thereafter, with a Health Canada inspection to follow. While this facility will require its own license (separate from the Vaughan facility), we believe the Company’s strong production track record positions it well for a license inspection shortly after construction is completed.
Assuming the inspection and approval take place by October, we would expect a modest first harvest in December. In other words, this facility should make a modest revenue contribution in Q417, with a more meaningful impact on tap for Q118. We also understand that this facility may produce a broader variety of strains (10-12) relative to the Vaughan indoor facility.
We visited the greenhouse operations in May 2017, and were impressed by the scale and production potential of the site. The facility is already equipped with irrigation systems and grow technology that was designed by the same firm that provided those systems to the Vaughan facility. Prior to its acquisition by CannTrust, the facility produced flowers, such as orchids and kalanchoes. Kalanchoes are notable because their lighting needs are very similar to cannabis requirements, which made this facility particularly suitable as an acquisition.
Exhibit 16 – Niagara Greenhouse Facility
Source: Company Reports
CannTrust Holdings Inc. (TRST-CSE) | August 29 2017
Page 14 of 31 Russell Stanley, MBA, CFA | 647.794.1922 | [email protected]
As demonstrated below, the conversion work is underway, including renovating the flooring to create an additional 12 inches of vertical space.
Exhibit 17 – Conversion Work Well Underway
Source: Company Reports
CannTrust is planning a two-phase development program. The first phase encompasses 250,000 square feet of the facility, and is expected to develop annualized production capacity of 20,000kg for CAPEX of $16M ($800/kg or $64/square foot). This phase includes renovations and retrofitting, with a focus on automation and continuous batch processing, and includes much of the infrastructure required to support Phase 2. Management expects Phase 1 to be completed by the end of September, with the Health Canada inspection to follow once construction is complete.
Phase 2 would include the remaining 180,000 square feet, and would double the annualized capacity to over 40,000kg. As shown below, the blended cost of developing the facility would be approximately $74/square foot, or $800/kg of production capacity.
Exhibit 18 – Niagara Facility CAPEX Plan
CAPEX ($M)Footprint (sq.
ft.)
Capacity
Added (kg)
CAPEX /
Square FootCAPEX / kg
Initial Conversion $16.0 250,000 20,000 $64 $800
Conversion Phase 2 $16.0 180,000 20,000 $89 $800
Aggregate $32.0 430,000 40,000 $74 $800
Source: Company Reports, Echelon Wealth Partners
The property is currently mortgage free, and the Company is in active discussions with lenders to obtain first mortgage financing for up to $10M. Our model assumes that CannTrust obtains $5M of this funding during Q317.
Only 16 acres of the 46-acre property are currently utilized, so there is ample scope for increasing production capacity further, as demand warrants.
Management & Board – Significantly Invested with Strong Depth: As we demonstrate later in Exhibit 27, the management team and board of directors are significantly invested, owning 40% of the basic shares outstanding (post-public listing).
We view this as a very strong group. The CEO, Mr. Eric Paul, is the former President of Zellers, and brings significant C-suite management experience to the table. President and COO, Mr. Brad Rogers, co-founded Mettrum, which was acquired by Canopy Growth Corporation (WEED-TSX, Speculative Buy, $10.50 TP, last close 8.90/shr) for $350M in January 2017. Mr. Rogers brings strong cannabis operational experience, particularly with respect to navigating the Health Canada licensing requirements. The board has significant depth, adding a strong combination of pharmaceutical experience and public company oversight.
CannTrust Holdings Inc. (TRST-CSE) | August 29 2017
Page 15 of 31 Russell Stanley, MBA, CFA | 647.794.1922 | [email protected]
Canada’s Cannabis Industry: Readying for Recreational Market
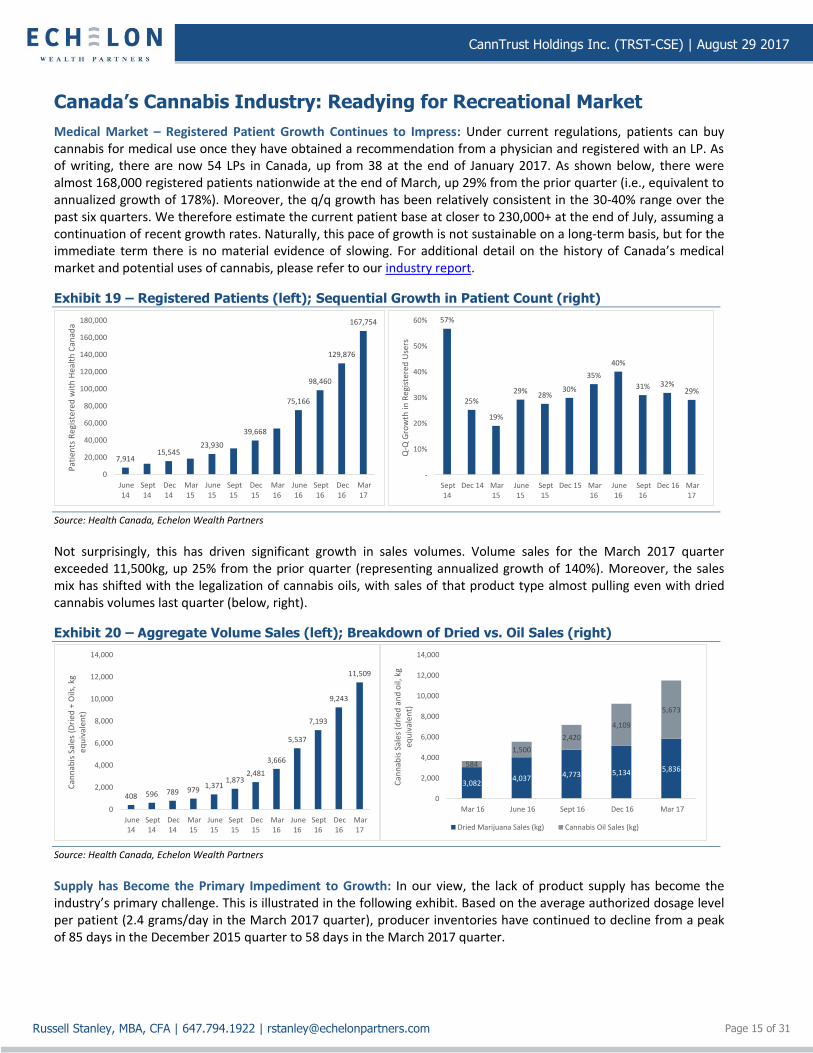
Medical Market – Registered Patient Growth Continues to Impress: Under current regulations, patients can buy cannabis for medical use once they have obtained a recommendation from a physician and registered with an LP. As of writing, there are now 54 LPs in Canada, up from 38 at the end of January 2017. As shown below, there were almost 168,000 registered patients nationwide at the end of March, up 29% from the prior quarter (i.e., equivalent to annualized growth of 178%). Moreover, the q/q growth has been relatively consistent in the 30-40% range over the past six quarters. We therefore estimate the current patient base at closer to 230,000+ at the end of July, assuming a continuation of recent growth rates. Naturally, this pace of growth is not sustainable on a long-term basis, but for the immediate term there is no material evidence of slowing. For additional detail on the history of Canada’s medical market and potential uses of cannabis, please refer to our industry report.
Exhibit 19 – Registered Patients (left); Sequential Growth in Patient Count (right)
7,91415,545
23,930
39,668
75,166
98,460
129,876
167,754
0
20,000
40,000
60,000
80,000
100,000
120,000
140,000
160,000
180,000
June14
Sept14
Dec14
Mar15
June15
Sept15
Dec15
Mar16
June16
Sept16
Dec16
Mar17
Pat
ien
ts R
egis
tere
d w
ith
Hea
lth
Can
ada
57%
25%
19%
29%28%
30%
35%
40%
31% 32%29%
-
10%
20%
30%
40%
50%
60%
Sept14
Dec 14 Mar15
June15
Sept15
Dec 15 Mar16
June16
Sept16
Dec 16 Mar17
Q-Q
Gro
wth
in R
egis
tere
d U
sers
Source: Health Canada, Echelon Wealth Partners
Not surprisingly, this has driven significant growth in sales volumes. Volume sales for the March 2017 quarter exceeded 11,500kg, up 25% from the prior quarter (representing annualized growth of 140%). Moreover, the sales mix has shifted with the legalization of cannabis oils, with sales of that product type almost pulling even with dried cannabis volumes last quarter (below, right).
Exhibit 20 – Aggregate Volume Sales (left); Breakdown of Dried vs. Oil Sales (right)
408 596 789 9791,371
1,8732,481
3,666
5,537
7,193
9,243
11,509
0
2,000
4,000
6,000
8,000
10,000
12,000
14,000
June14
Sept14
Dec14
Mar15
June15
Sept15
Dec15
Mar16
June16
Sept16
Dec16
Mar17
Can
nab
is S
ales
(D
ried
+ O
ils, k
g eq
uiv
alen
t)
3,0824,037 4,773 5,134 5,836
584
1,500
2,420
4,109
5,673
0
2,000
4,000
6,000
8,000
10,000
12,000
14,000
Mar 16 June 16 Sept 16 Dec 16 Mar 17
Can
nab
is S
ales
(d
ried
an
d o
il, k
g eq
uiv
alen
t)
Dried Marijuana Sales (kg) Cannabis Oil Sales (kg)
Source: Health Canada, Echelon Wealth Partners
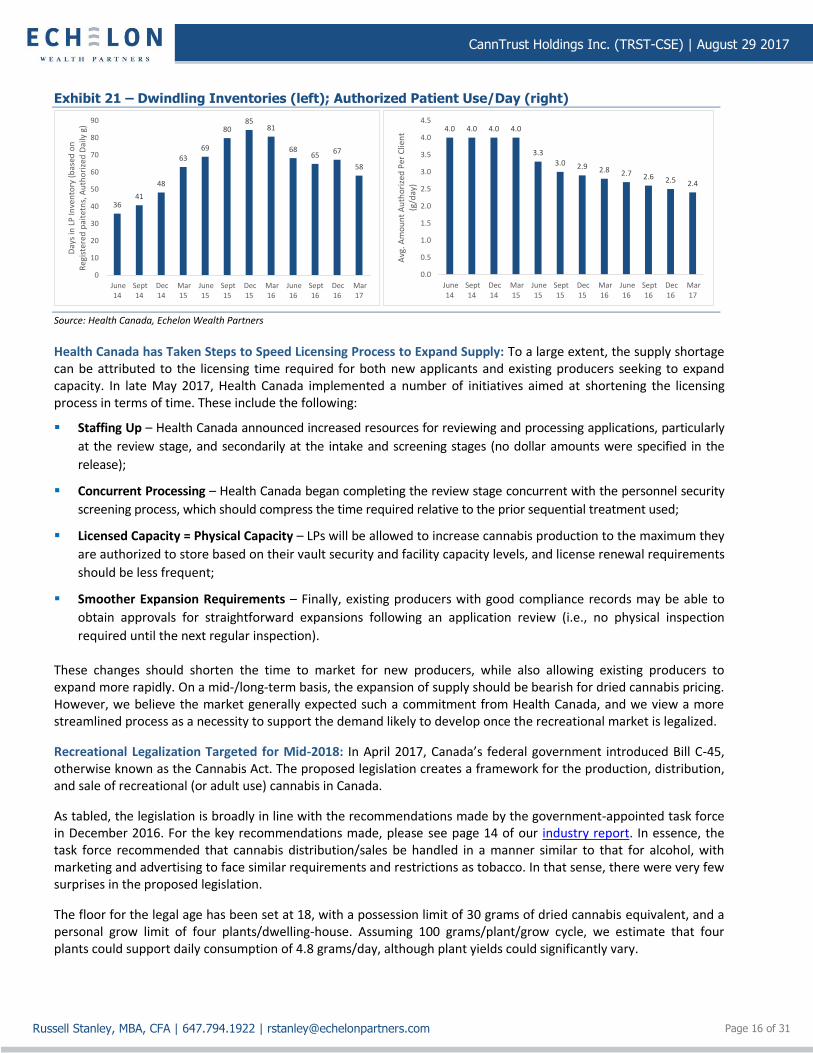
Supply has Become the Primary Impediment to Growth: In our view, the lack of product supply has become the industry’s primary challenge. This is illustrated in the following exhibit. Based on the average authorized dosage level per patient (2.4 grams/day in the March 2017 quarter), producer inventories have continued to decline from a peak of 85 days in the December 2015 quarter to 58 days in the March 2017 quarter.
CannTrust Holdings Inc. (TRST-CSE) | August 29 2017
Page 16 of 31 Russell Stanley, MBA, CFA | 647.794.1922 | [email protected]
Exhibit 21 – Dwindling Inventories (left); Authorized Patient Use/Day (right)
3641
48
63
69
8085
81
6865
67
58
0
10
20
30
40
50
60
70
80
90
June14
Sept14
Dec14
Mar15
June15
Sept15
Dec15
Mar16
June16
Sept16
Dec16
Mar17
Day
s in
LP
Inve
nto
ry (
bas
ed o
n
Reg
iste
red
pai
tetn
s, A
uth
ori
zed
Dai
ly g
)
4.0 4.0 4.0 4.0
3.33.0 2.9 2.8 2.7 2.6 2.5 2.4
0.0
0.5
1.0
1.5
2.0
2.5
3.0
3.5
4.0
4.5
June14
Sept14
Dec14
Mar15
June15
Sept15
Dec15
Mar16
June16
Sept16
Dec16
Mar17
Avg
. Am
ou
nt
Au
tho
rize
d P
er C
lien
t (g
/day
)
Source: Health Canada, Echelon Wealth Partners
Health Canada has Taken Steps to Speed Licensing Process to Expand Supply: To a large extent, the supply shortage can be attributed to the licensing time required for both new applicants and existing producers seeking to expand capacity. In late May 2017, Health Canada implemented a number of initiatives aimed at shortening the licensing process in terms of time. These include the following:
▪ Staffing Up – Health Canada announced increased resources for reviewing and processing applications, particularly
at the review stage, and secondarily at the intake and screening stages (no dollar amounts were specified in the
release);
▪ Concurrent Processing – Health Canada began completing the review stage concurrent with the personnel security
screening process, which should compress the time required relative to the prior sequential treatment used;
▪ Licensed Capacity = Physical Capacity – LPs will be allowed to increase cannabis production to the maximum they
are authorized to store based on their vault security and facility capacity levels, and license renewal requirements
should be less frequent;
▪ Smoother Expansion Requirements – Finally, existing producers with good compliance records may be able to
obtain approvals for straightforward expansions following an application review (i.e., no physical inspection
required until the next regular inspection).
These changes should shorten the time to market for new producers, while also allowing existing producers to expand more rapidly. On a mid-/long-term basis, the expansion of supply should be bearish for dried cannabis pricing. However, we believe the market generally expected such a commitment from Health Canada, and we view a more streamlined process as a necessity to support the demand likely to develop once the recreational market is legalized.
Recreational Legalization Targeted for Mid-2018: In April 2017, Canada’s federal government introduced Bill C-45, otherwise known as the Cannabis Act. The proposed legislation creates a framework for the production, distribution, and sale of recreational (or adult use) cannabis in Canada.
As tabled, the legislation is broadly in line with the recommendations made by the government-appointed task force in December 2016. For the key recommendations made, please see page 14 of our industry report. In essence, the task force recommended that cannabis distribution/sales be handled in a manner similar to that for alcohol, with marketing and advertising to face similar requirements and restrictions as tobacco. In that sense, there were very few surprises in the proposed legislation.
The floor for the legal age has been set at 18, with a possession limit of 30 grams of dried cannabis equivalent, and a personal grow limit of four plants/dwelling-house. Assuming 100 grams/plant/grow cycle, we estimate that four plants could support daily consumption of 4.8 grams/day, although plant yields could significantly vary.
CannTrust Holdings Inc. (TRST-CSE) | August 29 2017
Page 17 of 31 Russell Stanley, MBA, CFA | 647.794.1922 | [email protected]
We also note that individual provinces will have authority to impose more restrictive requirements, including a higher minimum age, lower personal possession limits, and/or personal grow limits. Making cannabis products at home, such as food and beverages, will be allowable as long as organic solvents are not used. Provinces will also be able to restrict where adults can consume cannabis, such as in public or in vehicles.
The federal government has targeted July 2018 for implementation of the legislation. On June 8th, the Bill passed its second reading and has now been referred back to the Standing Committee on Health (HESA) for further review. The Committee is expected to begin holding hearings on September 11th.
The Bill leaves much of the implementation detail to the individual provinces to iron out. The biggest looming questions remain the legal minimum age each province will use, and the specific form that the distribution/sales systems will take (e.g., what role will alcohol distribution monopolies, such as the LCBO, and major pharmacy chains, such as Shoppers Drug Mart have?). Three provinces — Ontario, New Brunswick, and Nova Scotia — have indicated a preference for a legal age of 19, which would be in line with the legal age for alcohol in those provinces. In Canada, all provinces and territories have set 19 as the minimum legal age for alcohol consumption, with the exception of Alberta, Manitoba and Quebec, where it is 18.
In July 2017, at the Council of the Federation meetings in Edmonton, Alberta, the Premiers issued a joint statement indicating that the provinces need federal engagement and information sharing in five areas: road safety/enforcement, preparation and training on distribution, taxation, public education, and implications for the black market. The statement also expressed concern that the federal legalization timeline (July 1, 2018) may be unrealistic, with an extension required if the issues are not adequately addressed.
As we discussed in our June 26th edition of Cannabis Weekly, the federal government has already indicated that it is working on a back-up plan under which it will handle distribution and taxes for provinces that are not ready by the time the legislation is passed.
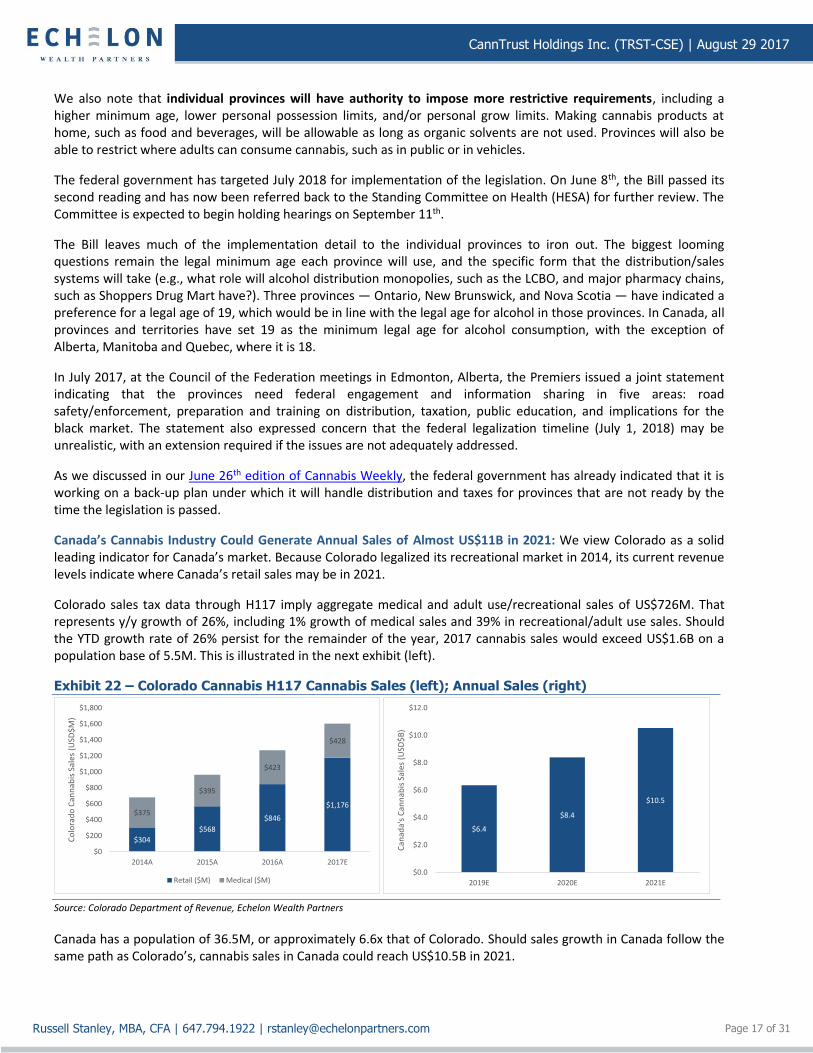
Canada’s Cannabis Industry Could Generate Annual Sales of Almost US$11B in 2021: We view Colorado as a solid leading indicator for Canada’s market. Because Colorado legalized its recreational market in 2014, its current revenue levels indicate where Canada’s retail sales may be in 2021.
Colorado sales tax data through H117 imply aggregate medical and adult use/recreational sales of US$726M. That represents y/y growth of 26%, including 1% growth of medical sales and 39% in recreational/adult use sales. Should the YTD growth rate of 26% persist for the remainder of the year, 2017 cannabis sales would exceed US$1.6B on a population base of 5.5M. This is illustrated in the next exhibit (left).
Exhibit 22 – Colorado Cannabis H117 Cannabis Sales (left); Annual Sales (right)
$304
$568
$846
$1,176$375
$395
$423
$428
$0
$200
$400
$600
$800
$1,000
$1,200
$1,400
$1,600
$1,800
2014A 2015A 2016A 2017E
Co
lora
do
Can
nab
is S
ales
(U
SD$
M)
Retail ($M) Medical ($M)
$6.4
$8.4
$10.5
$0.0
$2.0
$4.0
$6.0
$8.0
$10.0
$12.0
2019E 2020E 2021E
Can
ada'
s C
ann
abis
Sal
es (
USD
$B
)
Source: Colorado Department of Revenue, Echelon Wealth Partners
Canada has a population of 36.5M, or approximately 6.6x that of Colorado. Should sales growth in Canada follow the same path as Colorado’s, cannabis sales in Canada could reach US$10.5B in 2021.
CannTrust Holdings Inc. (TRST-CSE) | August 29 2017
Page 18 of 31 Russell Stanley, MBA, CFA | 647.794.1922 | [email protected]
We also note that the legal age for adult use possession in Colorado is 21. Canada’s federal government has proposed a minimum age of 18, though we remind readers that the provinces are free to set the minimum age at a higher level. Early indications are that Ontario, New Brunswick, and Nova Scotia may set their legal minimum age at 19+, which would be in line with their legal age requirements for alcohol. All else equal, a lower legal minimum age should mean a broader potential market.
Moreover, we believe that comparatively easier/faster licensing requirements in CO have contributed to an increase in product supply that has significantly reduced wholesale cannabis prices, so its retail sales data is particularly impressive because those dollar amounts reflect strong volume growth that has more than offset pricing pressure. Granted, cannabis-infused products such as edibles and beverages are already legal in Colorado, whereas in Canada, they are not. However, we fully expect edibles to be legalized in the not-too-distant future, based on the government’s comments to date. We cite the following excerpt from Health Canada’s backgrounder on recreational cannabis legalization published in April 2017.
“Initially, adults would be able to legally purchase fresh and dried cannabis, cannabis oils, and seeds or plants for cultivation. Other products, such as edibles, would be made available at a later date, once federal regulations for their production and sale have been developed and brought into force.”
On balance, we therefore view Colorado as a reasonable proxy for what the Canadian market could look like in several years.
CannTrust Holdings Inc. (TRST-CSE) | August 29 2017
Page 19 of 31 Russell Stanley, MBA, CFA | 647.794.1922 | [email protected]
Financial Performance: Strong Top-Line Growth
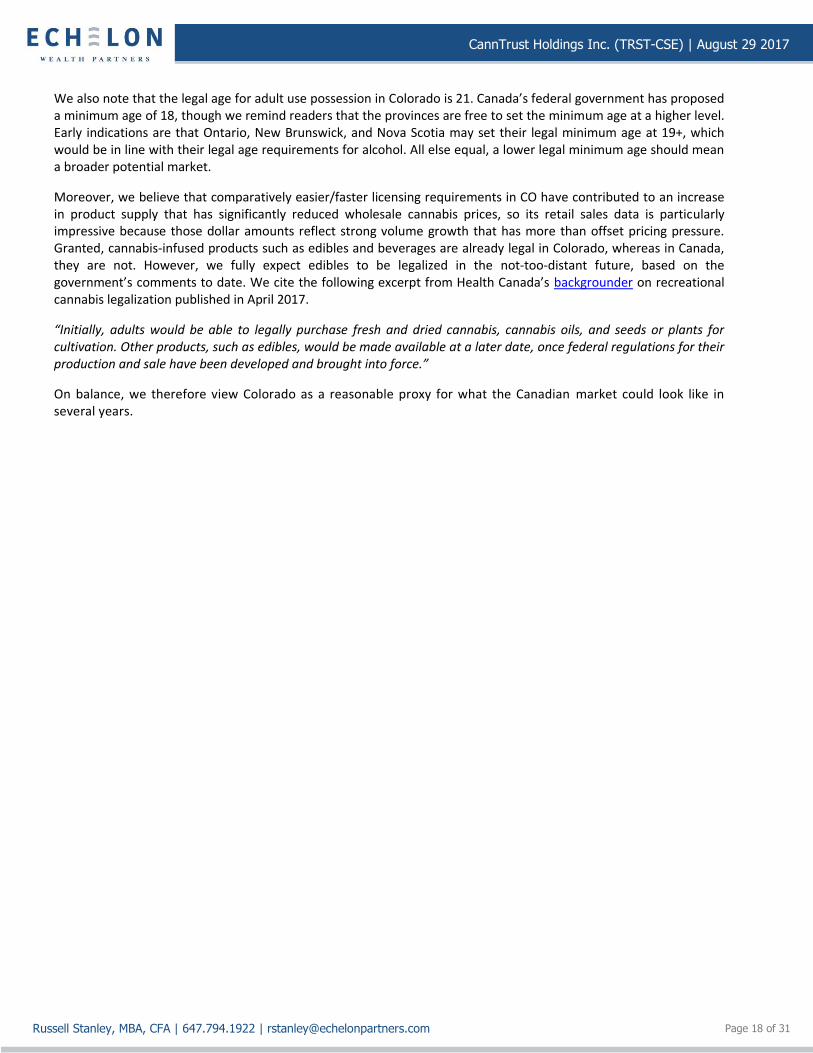
Q217 Results Demonstrate Strong Volume Growth and Improving Product Mix: We present the highlights of CannTrust’s results in the next exhibit, along with a comparison to prior-year levels.
Exhibit 23 – Quarterly Results vs. Prior Period Performance
Q217A Q216A Y/Y Q117A Q/Q
Sales Volumes (kg) 478 147 224% 333 43%
Realized Price per gram $8.86 $5.42 63% $9.11 (3%)
Revenue ($M) $4.5 $0.8 469% $3.0 50%
Gross Margin (IFRS) 88% 28% 6016 bps 125% (3688 bps)
Adjusted Gross Margin 6% (90%) 9602 bps (8%) 1308 bps
EBITDA ($M) $1.4 ($0.7) nmf $1.7 (17%)
EBITDA Margin 31% (92%) 12278 bps 56% (2473 bps)
Adjusted EBITDA ($M) ($1.9) ($1.6) nmf ($2.1) nmf
Adjusted EBITDA Margin (42%) (205%) 16276 bps (69%) 2680 bps
Net Earnings (Loss) ($M) $0.8 ($1.3) nmf ($0.8) nmf
Diluted EPS $0.01 ($0.05) nmf ($0.01) nmf
Operating Cash Flow ($M) $3.1 ($0.6) nmf ($2.4) nmf
Operating CF PS $0.04 ($0.02) nmf ($0.03) nmf
Source: Company Reports, Echelon Wealth Partners
▪ Revenue up 469% on Volumes & Sales – CannTrust reported 469% y/y revenue growth, from $0.8M in Q216 to
$4.5M in Q217. This reflects a combination of increased sales volumes (up 224% y/y) and improved product
pricing (up 63%). We break this down in more detail in the next exhibit. Revenue from the sale of dried cannabis
improved 162%, driven by a 69% improvement in realized pricing and a 55% increase in sales volumes. This
revenue improvement explains approximately 35% of the overall growth in revenue. The other 65% can be
attributed to the introduction of cannabis oil products, which contributed $2.3M in Q217 (vs. nil in Q216).
Exhibit 24 – Revenue Mix Comparison (Cannabis Revenue Only)
Q217A Q216A Y/Y Q117A Q/Q
Dried Cannabis
- Volume Sales (kg) 228 147 55% 222 3%
- Revenue per gram $8.58 $5.07 69% $8.33 3%
Dried Cannabis Revenue ($M) $2.0 $0.7 162% $1.8 6%
Cannabis Oils
- Volume Sales (kg equivalent) 250 0 nmf 111 125%
- Revenue per gram $9.12 - nmf $9.85 (7%)
Cannabis Oils Revenue ($M) $2.3 - nmf $1.1 109%
Source: Company Reports, Echelon Wealth Partners
CannTrust Holdings Inc. (TRST-CSE) | August 29 2017
Page 20 of 31 Russell Stanley, MBA, CFA | 647.794.1922 | [email protected]
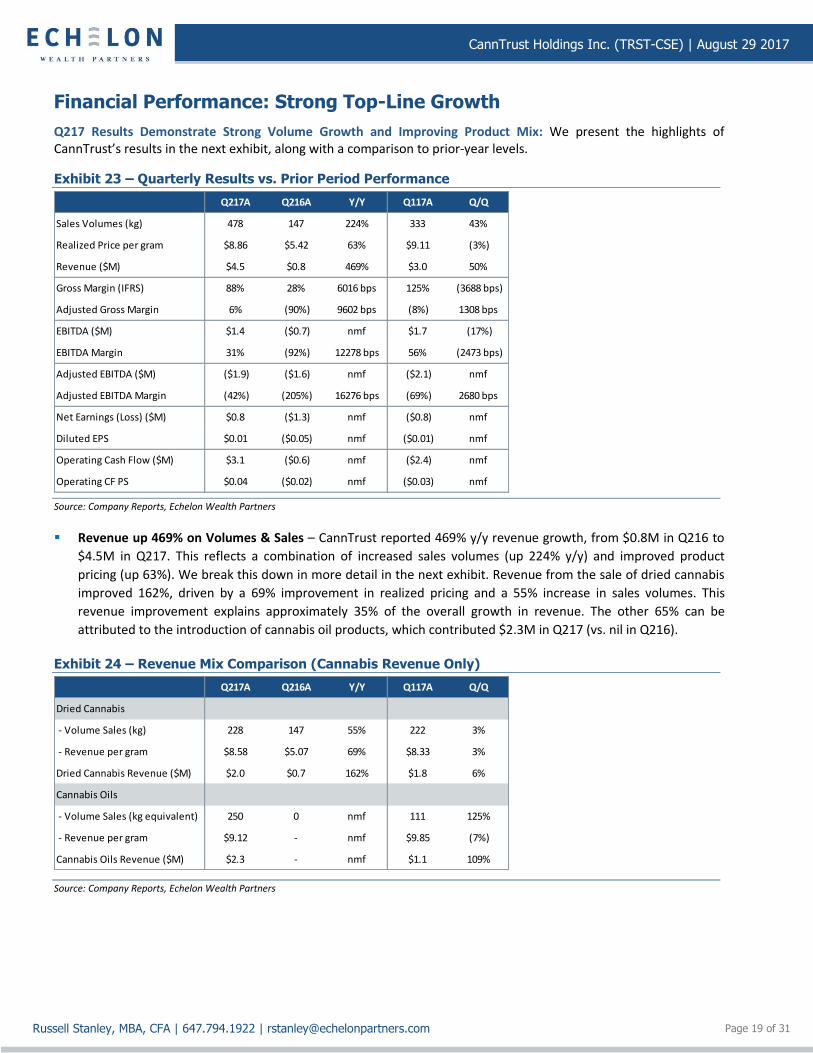
▪ Gross Margins Improve with Increased Realized Pricing – In Exhibit 23 above, we present both the gross margin
measured according to IFRS standards, and an adjusted gross margin that excludes the fair value gain associated
with Biological Assets, as well as write-offs. We believe investors should focus on adjusted gross margin. Like
other LPs, CannTrust has cannabis plants at various stages of growth, which are shown on the balance sheet as
Biological Assets ($3.2M as of Q217, up from $2.3M at the end of Q416). As those plants grow through the pre-
harvest stages, the value of those Biological Assets increases. IFRS requires periodic revaluation of those
Biological Assets on the balance sheet. When those plants are harvested, they are transferred to the Inventory
line on the balance sheet, and the value of that Inventory is later expensed on the income statement upon sale.
This accounting treatment creates non-cash, unrealized gains from the increase in fair value of those plants (e.g.,
$3.7M in Q217), and those gains are recognized on the income statement as a reduction of the cost of sales, even
though they relate to cannabis that has not even been sold yet. This is the accounting treatment required by IFRS,
though in our view, it creates confusion for investors. We therefore present an adjusted gross margin for
CannTrust, which excludes these fair value gains and write-offs in an attempt to eliminate the impact of non-cash
items. We concede that this measure is imperfect, as it still includes some non-cash impact contained in the
Inventory Expensed to Cost of Sales line. In Q217, the Company produced an adjusted gross margin of 6%, which
represents significant improvement over the Q216 level of negative 90%.
▪ Adjusted EBITDA Should Also be the Focus – For the same reasons, we believe investors should focus on adjusted
EBITDA (which excludes the fair value gain on Biological Assets as well as the write-offs). As with adjusted gross
margin, our metric is imperfect, as it still includes some non-cash impact contained in the Inventory Expensed to
Cost of Sales line. We estimate the adjusted EBITDA loss at $1.9M for Q217, up slightly from a loss of $1.6M in Q216.
This can be primarily attributed to an increase in OPEX in support of additional growth.
2016 Shows Continued Revenue Ramp Up: CannTrust produced 2016 revenue of $4.4M, up 620% from $0.6M in 2015. This was driven by 451% growth in volumes sold (711kg of dried equivalent, up from 129kg in 2015, as shown in the next exhibit), and by a 31% improvement in realized pricing. As with the quarterly results, the improvement in realized pricing can be attributed to better pricing on dried cannabis sales (from $4.29/gram to $5.72/gram), as well as the introduction of cannabis oil products, which receive higher pricing than dried products ($6.43/gram realized in 2016).
Exhibit 25 – Strong Revenue Growth during 2014-2016
-$0.6
$3.5
-
-
$0.6
-
$0.5
$1.0
$1.5
$2.0
$2.5
$3.0
$3.5
$4.0
$4.5
2014A 2015A 2016A
Rev
enu
e b
y P
rod
uct
Gro
up
($
M)
Dried Cannabis ($M) Cannabis Oils ($M)
-
129
620
-
-
91
-
100
200
300
400
500
600
700
800
2014A 2015A 2016A
Vo
lum
e Sa
les
(kg
dri
ed e
qu
ival
ent)
Dried Cannabis (kg) Cannabis Oils (kg)
Source: Company Reports, Echelon Wealth Partners
The Balance Sheet — Cashed up for Growth: At the end of Q217, the Company had cash and equivalents of $15.6M, including $0.7M classified as short-term investments (invested in GICs with a large Canadian financial institution). The Company had $3.1M in debt convertible to stock at an exercise price of $1.10/shr. Our model reflects conversion of that debt at the time of the public listing, which occurred earlier in August. The only other debt at quarter-end was the $1.0M promissory note issued as part of the purchase consideration for acquiring the greenhouse in Fenwick. However, the Company is actively working to secure up to $10M in mortgage financing for the property underlying the Niagara greenhouse facility. Our model assumes CannTrust obtains $5M of that financing by the end of Q317.
CannTrust Holdings Inc. (TRST-CSE) | August 29 2017
Page 21 of 31 Russell Stanley, MBA, CFA | 647.794.1922 | [email protected]
The Capital Structure: Skin in the Game
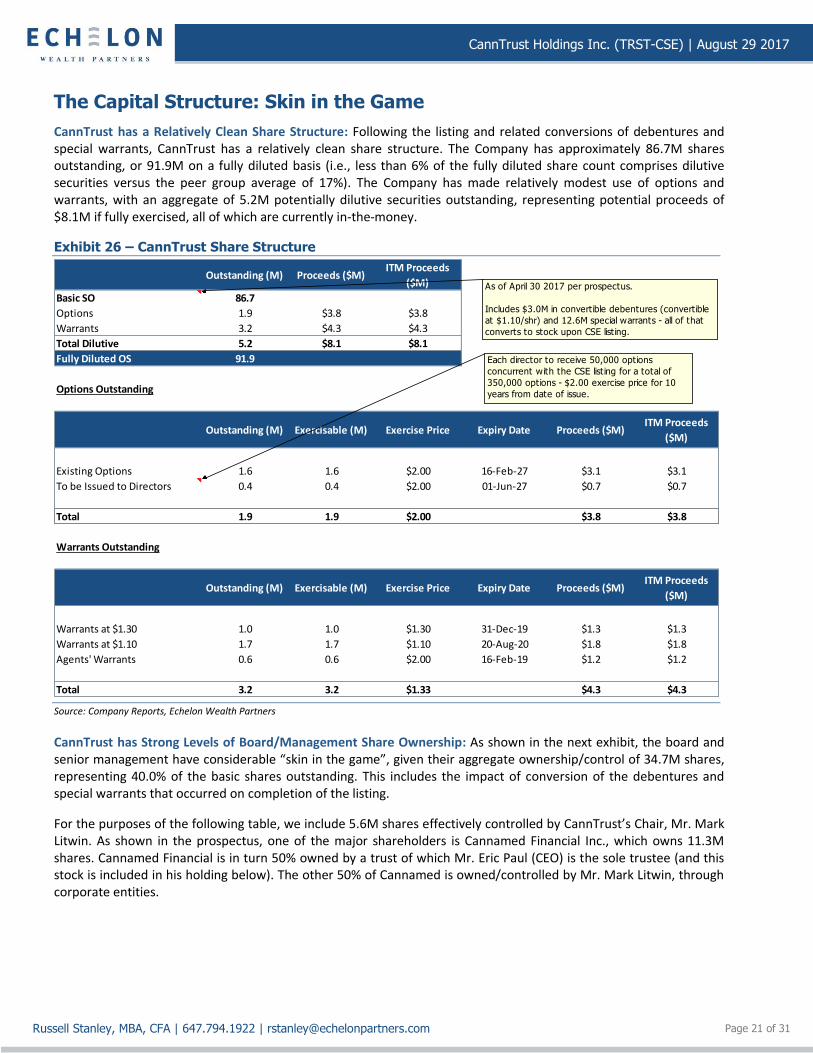
CannTrust has a Relatively Clean Share Structure: Following the listing and related conversions of debentures and special warrants, CannTrust has a relatively clean share structure. The Company has approximately 86.7M shares outstanding, or 91.9M on a fully diluted basis (i.e., less than 6% of the fully diluted share count comprises dilutive securities versus the peer group average of 17%). The Company has made relatively modest use of options and warrants, with an aggregate of 5.2M potentially dilutive securities outstanding, representing potential proceeds of $8.1M if fully exercised, all of which are currently in-the-money.
Exhibit 26 – CannTrust Share Structure
Outstanding (M) Proceeds ($M)ITM Proceeds
($M)
Basic SO 86.7
Options 1.9 $3.8 $3.8
Warrants 3.2 $4.3 $4.3
Total Dilutive 5.2 $8.1 $8.1
Fully Diluted OS 91.9
Options Outstanding
Outstanding (M) Exercisable (M) Exercise Price Expiry Date Proceeds ($M)ITM Proceeds
($M)
Existing Options 1.6 1.6 $2.00 16-Feb-27 $3.1 $3.1
To be Issued to Directors 0.4 0.4 $2.00 01-Jun-27 $0.7 $0.7
Total 1.9 1.9 $2.00 $3.8 $3.8
Warrants Outstanding
Outstanding (M) Exercisable (M) Exercise Price Expiry Date Proceeds ($M)ITM Proceeds
($M)
Warrants at $1.30 1.0 1.0 $1.30 31-Dec-19 $1.3 $1.3
Warrants at $1.10 1.7 1.7 $1.10 20-Aug-20 $1.8 $1.8
Agents' Warrants 0.6 0.6 $2.00 16-Feb-19 $1.2 $1.2
Total 3.2 3.2 $1.33 $4.3 $4.3
Each director to receive 50,000 options
concurrent with the CSE listing for a total of
350,000 options - $2.00 exercise price for 10
years from date of issue.
As of April 30 2017 per prospectus.
Includes $3.0M in convertible debentures (convertible
at $1.10/shr) and 12.6M special warrants - all of that
converts to stock upon CSE listing.
Source: Company Reports, Echelon Wealth Partners
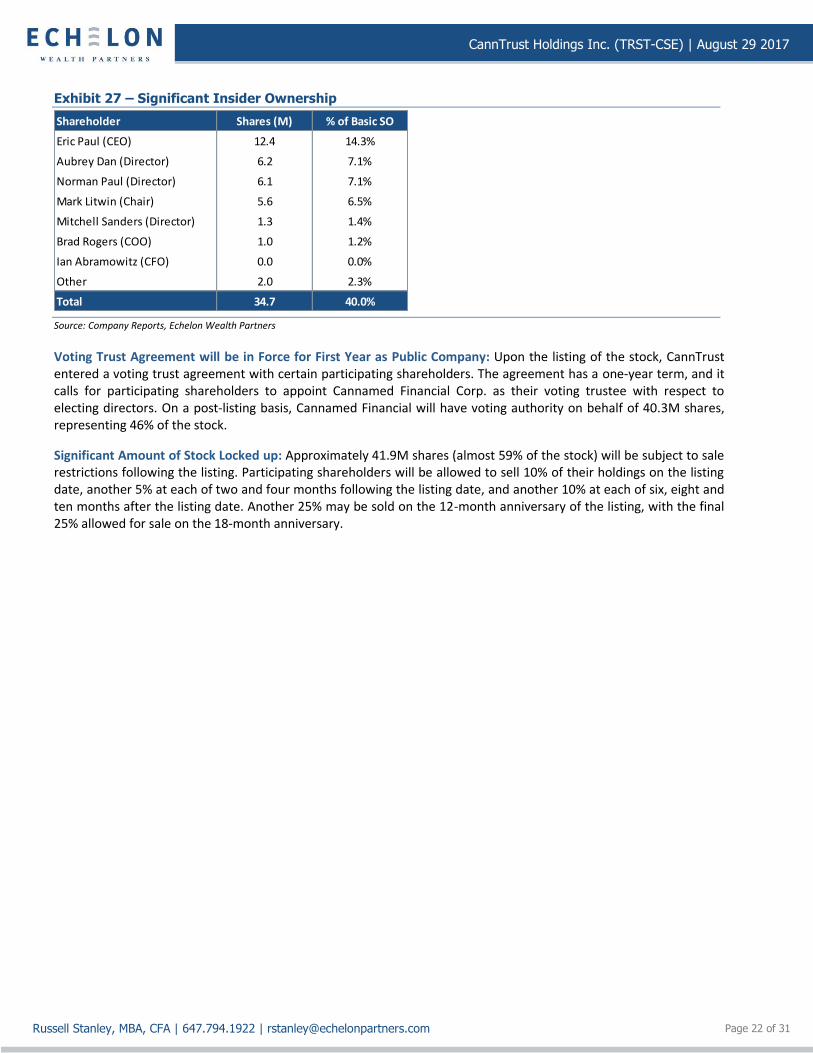
CannTrust has Strong Levels of Board/Management Share Ownership: As shown in the next exhibit, the board and senior management have considerable “skin in the game”, given their aggregate ownership/control of 34.7M shares, representing 40.0% of the basic shares outstanding. This includes the impact of conversion of the debentures and special warrants that occurred on completion of the listing.
For the purposes of the following table, we include 5.6M shares effectively controlled by CannTrust’s Chair, Mr. Mark Litwin. As shown in the prospectus, one of the major shareholders is Cannamed Financial Inc., which owns 11.3M shares. Cannamed Financial is in turn 50% owned by a trust of which Mr. Eric Paul (CEO) is the sole trustee (and this stock is included in his holding below). The other 50% of Cannamed is owned/controlled by Mr. Mark Litwin, through corporate entities.
CannTrust Holdings Inc. (TRST-CSE) | August 29 2017
Page 22 of 31 Russell Stanley, MBA, CFA | 647.794.1922 | [email protected]
Exhibit 27 – Significant Insider Ownership
Shareholder Shares (M) % of Basic SO
Eric Paul (CEO) 12.4 14.3%
Aubrey Dan (Director) 6.2 7.1%
Norman Paul (Director) 6.1 7.1%
Mark Litwin (Chair) 5.6 6.5%
Mitchell Sanders (Director) 1.3 1.4%
Brad Rogers (COO) 1.0 1.2%
Ian Abramowitz (CFO) 0.0 0.0%
Other 2.0 2.3%
Total 34.7 40.0% Source: Company Reports, Echelon Wealth Partners
Voting Trust Agreement will be in Force for First Year as Public Company: Upon the listing of the stock, CannTrust entered a voting trust agreement with certain participating shareholders. The agreement has a one-year term, and it calls for participating shareholders to appoint Cannamed Financial Corp. as their voting trustee with respect to electing directors. On a post-listing basis, Cannamed Financial will have voting authority on behalf of 40.3M shares, representing 46% of the stock.
Significant Amount of Stock Locked up: Approximately 41.9M shares (almost 59% of the stock) will be subject to sale restrictions following the listing. Participating shareholders will be allowed to sell 10% of their holdings on the listing date, another 5% at each of two and four months following the listing date, and another 10% at each of six, eight and ten months after the listing date. Another 25% may be sold on the 12-month anniversary of the listing, with the final 25% allowed for sale on the 18-month anniversary.
CannTrust Holdings Inc. (TRST-CSE) | August 29 2017
Page 23 of 31 Russell Stanley, MBA, CFA | 647.794.1922 | [email protected]
Investment Risks
While this is not an exhaustive list, we view the following as the most relevant to investors in CannTrust.
Regulatory Risk: In April 2017, Canada’s federal government introduced Bill C-45, otherwise known as the Cannabis Act, which would legalize recreational/adult use of cannabis. The government has indicated that it plans to bring the legislation into force by July 2018.
However, many of the details with respect to sales and distribution are being left to the individual provinces to determine, and, as of writing, there is little more than speculation as to what the market will really look like. This uncertainty will likely linger and potentially weigh on the market until individual provinces make their plans known.
As noted earlier, in May 2015, the Company formed a 50/50 JV with Club Coffee L.P. The JV contemplates the launch of a cannabis-infused coffee product in the US. Cannabis is still a controlled substance under the Controlled Substances Act in the US, so there is still the risk of federal enforcement of the law. Management believes its business interests in the US adhere to the principles of the Cole Memo.
There have also been media reports that the Canadian Depository for Securities Limited (CDS) is considering a policy shift that would see it refuse to settle trades for cannabis issuers with investments in the US. No public statement to this effect has been issued by the CDS, but if such a policy change were to occur, it could materially impact liquidity.
In addition, as an LP, CannTrust is required to submit to unscheduled site visits by Health Canada. After the product recalls announced by several other LPs over the past six months, the industry is under increasing pressure to ensure that its products are safe for consumption by consumers. Management reports that these inspections typically take place on a monthly basis, and that there are no outstanding inspection issues. We believe that CannTrust is well positioned to compete, given its clean history with Health Canada (no use of pesticides).
Competition Risk: To date, the medical market in Canada has grown so rapidly that the biggest challenge LPs currently have experienced is keeping up with demand. Eventually, the industry will mature, and individual LPs will have to battle each other for market share (or higher-value product niches) in order to continue expanding revenue and protect margins. This will become particularly true as dried cannabis becomes more commoditized (see below).
Forecasting Risk: Our estimates contemplate significant production and revenue growth for CannTrust. While expansion plans are largely within a company’s control, the pricing that any one producer realizes is subject to prevailing market conditions.
In our view, the variable involving the most uncertainty in our model is realized pricing. Many LPs have completed significant equity financings in order to fund capacity expansions, and while the market is currently in short supply of product, there is the risk of eventual oversupply.
In order to achieve the government’s objective of diverting cannabis revenue out of the hands of criminal enterprises, final pricing will have to be comparable to that in the illicit market. This will mean that cultivation operations will have to be content with realized pricing for dried cannabis that is well below current levels in order to allow for the revenue impact of both federal/provincial taxes and whatever distribution system is allowed by each province.
We therefore believe a sustainable business model is one that involves specific initiatives for moving up the value chain into products that will be less commoditized, as they should offer better price and margin protection. CannTrust’s partnerships with Apotex and Club Coffee position the Company very well in this regard.
CannTrust Holdings Inc. (TRST-CSE) | August 29 2017
Page 24 of 31 Russell Stanley, MBA, CFA | 647.794.1922 | [email protected]
Appendix A: Senior Management Team
Eric Paul, Chief Executive Officer and Director
Mr. Paul is a pharmacist and has been a senior business executive with over 40 years in the healthcare industry, including MediTrust, Canada’s first mail order pharmacy, a hospital medication management software system company, and President of Zellers, one of Canada’s largest discount retailers.
Ian Abramowitz, Chief Financial Officer
Mr. Abramowitz is a CPA and Chartered Accountant with over 35 years of practice and financial experience in Canada, the US and South Africa, with operational experience in consumer packaged goods, logistics, and real estate. He has a B.Acc degree from the University of the Witwatersrand, South Africa.
Brad Rogers, President and Chief Operating Officer
Mr. Rogers was a co-founder and Chief Operating Officer of Mettrum Ltd. (now owned by Canopy Growth Corp.) from January 2013 until December 2015. He led Mettrum Ltd. from pre-licensing to public listing, including the licensing of three facilities and multiple rounds of financing. From 1996 to 2012, Mr. Rogers was the Vice President of Product for Mood Media. He has an Executive MBA from the Ivey School of Business.
Stan Abramowitz, Secretary
Mr. Abramowitz is a CPA and Chartered Accountant with over 30 years of practice and financial experience in Canada and South Africa. He is the Chief Financial Officer and Secretary of Forum, positions he has held since 1989. Forum is a Toronto-based merchant banking group. Through this affiliation, Mr. Abramowitz has also held the positions of Chief Financial Officer, Secretary and Director of a number of public companies listed on the TSX and TSXV. Mr. Abramowitz is currently the Chief Financial Officer and a director of Gencan Capital, a CSE-listed corporation. Prior to 1989, Mr. Abramowitz worked in the accounting profession. He has a B.Acc and a B.Com degree from the University of the Witwatersrand, South Africa.
CannTrust Holdings Inc. (TRST-CSE) | August 29 2017
Page 25 of 31 Russell Stanley, MBA, CFA | 647.794.1922 | [email protected]
Appendix B: Board of Directors
Mark Litwin, Chairman
Mr. Litwin is the President of Gencan Capital Inc., a CSE-listed corporation. He was previously President and a director of Gencan’s predecessor corporations that were listed on the TSXV and TSX. He is also President of Sutton Management Limited, an investment and management holding company. Mr. Litwin has held the position of President and has been a director of a number of other public companies. He has significant experience in the real estate industry and has B.Econ (Hons) and MBA degrees from York University. Mr. Litwin is a member of the board of the UHN Toronto Rehab Hospital Foundation and the Mt. Sinai Hospital Finance/Resource Committee.
Eric Paul, Chief Executive Officer (see Appendix A)
Aubrey Dan
Mr. Dan has been the President of Dancap Family Investment Office since July 2000. He was formerly the Director of Sales at Novopharm Limited, one of the largest generic drug companies in Canada, from September 1984 to September 1992, and he was President of Wampole Canada Inc., a manufacturer of herbs and vitamins, from July 1995 to June 2000. He is also a Tony Award-winning producer.
Mitchell Sanders
Mr. Sanders has been a senior partner at Goldman, Spring, Kichler & Sanders LLP since 1990, providing services in the areas of corporate finance, mergers and acquisitions, and securities law to mid-market clients in both Canada and the US. He has been counsel in numerous public and private financing transactions, initial public offerings, and private placements throughout North America, and currently sits on the boards and advisory committees of various companies and not-for-profit entities. He is a former long-time member of The Executive Committee (TEC), an international organization of Chief Executive Officers, as well as a former member of the Small Business Advisory Committee to the Ontario Securities Commission. He is also a current member of the board of the UHN Toronto Rehab Hospital Foundation.
Norman Paul
Mr. Paul is a pharmacist and one of the co-founders of CannTrust. He has over 40 years of experience as a CEO and senior operating executive, including at one of Canada’s largest discount retailers and one of Canada’s largest drug store chains. He was Founder and CEO of MediTrust, Canada’s first mail order pharmacy from 1991 to 1999 when it was sold to the Katz Group. Mr. Paul was also the CEO of Autros Hospital Systems, a hospital management system, from 1993 to 2001 when it was sold to a large Canadian healthcare provider. He is past Chairman of Claim Secure, one of the largest pharmacy benefit managers in Canada, and the Founder and CEO of AA Pharma, a generic drug manufacturer, since 2002.
Mark Dawber
Mr. Dawber is a CPA and Chartered Accountant with significant public accounting experience. He was an Audit Partner at Moore Stephens Hyde Houghton from 1971 to 1998, and at BDO Canada LLP from 1999 to 2000. He has extensive public company experience, having served on public company boards for many years as an independent director, chair of audit committees, and as a member of governance and compensation committees. He has conducted numerous assignments for the Institute of Chartered Accountants of Ontario’s Professional Conduct Committee.
Robert Marcovitch
Mr. Marcovitch is a seasoned senior executive with substantial business experience, managing companies with more than $1B in revenue. He is currently the President and CEO of K2 Ski’s, an international developer, manufacturer, marketer and distributor of winter sports equipment, and he has held that position since October 2015 (he was previously with K2 from 1999 to 2011). His responsibilities include managing factories in Europe and the US. He was previously the Chief Executive Officer at The Coleman Outdoor Company from 2011 to 2015; prior to that, he was Chief Executive Officer and President of Ride, Inc. from 1994 to 1999, which prior to its acquisition by K2 was a large publicly traded company.
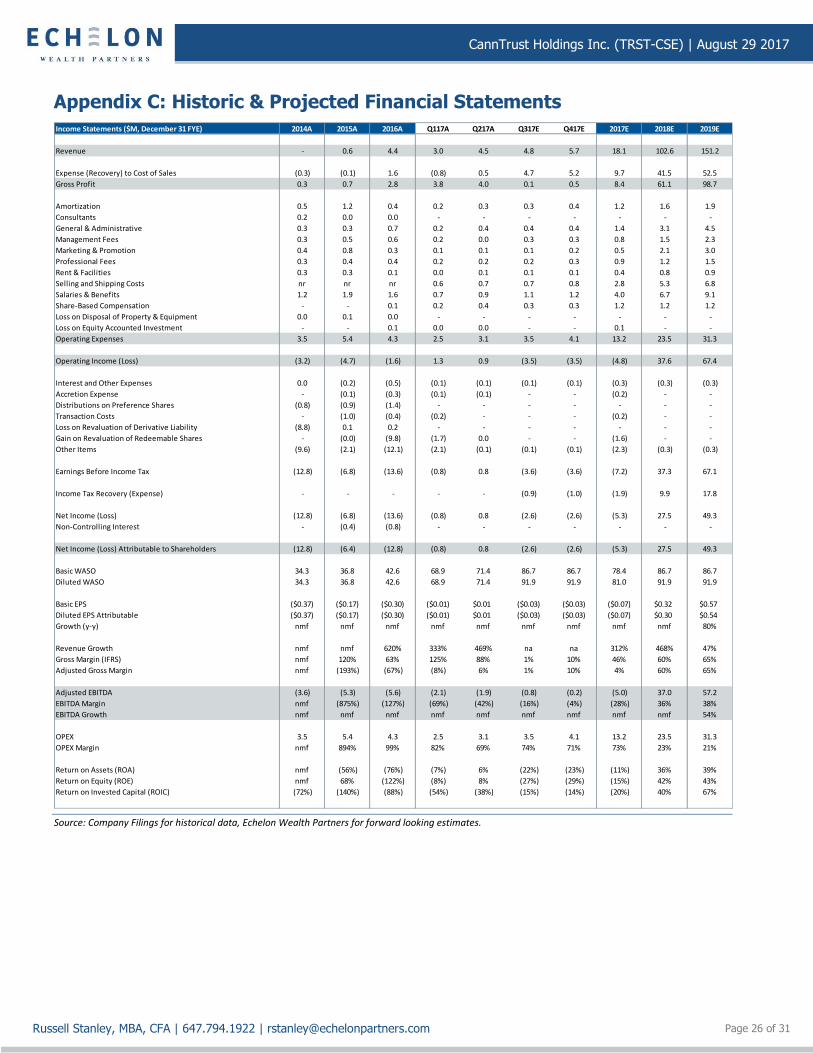
CannTrust Holdings Inc. (TRST-CSE) | August 29 2017
Page 26 of 31 Russell Stanley, MBA, CFA | 647.794.1922 | [email protected]
Appendix C: Historic & Projected Financial Statements
Income Statements ($M, December 31 FYE) 2014A 2015A 2016A Q117A Q217A Q317E Q417E 2017E 2018E 2019E
Revenue - 0.6 4.4 3.0 4.5 4.8 5.7 18.1 102.6 151.2
Expense (Recovery) to Cost of Sales (0.3) (0.1) 1.6 (0.8) 0.5 4.7 5.2 9.7 41.5 52.5
Gross Profit 0.3 0.7 2.8 3.8 4.0 0.1 0.5 8.4 61.1 98.7
Amortization 0.5 1.2 0.4 0.2 0.3 0.3 0.4 1.2 1.6 1.9
Consultants 0.2 0.0 0.0 - - - - - - -
General & Administrative 0.3 0.3 0.7 0.2 0.4 0.4 0.4 1.4 3.1 4.5
Management Fees 0.3 0.5 0.6 0.2 0.0 0.3 0.3 0.8 1.5 2.3
Marketing & Promotion 0.4 0.8 0.3 0.1 0.1 0.1 0.2 0.5 2.1 3.0
Professional Fees 0.3 0.4 0.4 0.2 0.2 0.2 0.3 0.9 1.2 1.5
Rent & Facilities 0.3 0.3 0.1 0.0 0.1 0.1 0.1 0.4 0.8 0.9
Selling and Shipping Costs nr nr nr 0.6 0.7 0.7 0.8 2.8 5.3 6.8
Salaries & Benefits 1.2 1.9 1.6 0.7 0.9 1.1 1.2 4.0 6.7 9.1
Share-Based Compensation - - 0.1 0.2 0.4 0.3 0.3 1.2 1.2 1.2
Loss on Disposal of Property & Equipment 0.0 0.1 0.0 - - - - - - -
Loss on Equity Accounted Investment - - 0.1 0.0 0.0 - - 0.1 - -
Operating Expenses 3.5 5.4 4.3 2.5 3.1 3.5 4.1 13.2 23.5 31.3
Operating Income (Loss) (3.2) (4.7) (1.6) 1.3 0.9 (3.5) (3.5) (4.8) 37.6 67.4
Interest and Other Expenses 0.0 (0.2) (0.5) (0.1) (0.1) (0.1) (0.1) (0.3) (0.3) (0.3)
Accretion Expense - (0.1) (0.3) (0.1) (0.1) - - (0.2) - -
Distributions on Preference Shares (0.8) (0.9) (1.4) - - - - - - -
Transaction Costs - (1.0) (0.4) (0.2) - - - (0.2) - -
Loss on Revaluation of Derivative Liability (8.8) 0.1 0.2 - - - - - - -
Gain on Revaluation of Redeemable Shares - (0.0) (9.8) (1.7) 0.0 - - (1.6) - -
Other Items (9.6) (2.1) (12.1) (2.1) (0.1) (0.1) (0.1) (2.3) (0.3) (0.3)
Earnings Before Income Tax (12.8) (6.8) (13.6) (0.8) 0.8 (3.6) (3.6) (7.2) 37.3 67.1
Income Tax Recovery (Expense) - - - - - (0.9) (1.0) (1.9) 9.9 17.8
Net Income (Loss) (12.8) (6.8) (13.6) (0.8) 0.8 (2.6) (2.6) (5.3) 27.5 49.3
Non-Controlling Interest - (0.4) (0.8) - - - - - - -
Net Income (Loss) Attributable to Shareholders (12.8) (6.4) (12.8) (0.8) 0.8 (2.6) (2.6) (5.3) 27.5 49.3
Basic WASO 34.3 36.8 42.6 68.9 71.4 86.7 86.7 78.4 86.7 86.7
Diluted WASO 34.3 36.8 42.6 68.9 71.4 91.9 91.9 81.0 91.9 91.9
Basic EPS ($0.37) ($0.17) ($0.30) ($0.01) $0.01 ($0.03) ($0.03) ($0.07) $0.32 $0.57
Diluted EPS Attributable ($0.37) ($0.17) ($0.30) ($0.01) $0.01 ($0.03) ($0.03) ($0.07) $0.30 $0.54
Growth (y-y) nmf nmf nmf nmf nmf nmf nmf nmf nmf 80%
Revenue Growth nmf nmf 620% 333% 469% na na 312% 468% 47%
Gross Margin (IFRS) nmf 120% 63% 125% 88% 1% 10% 46% 60% 65%
Adjusted Gross Margin nmf (193%) (67%) (8%) 6% 1% 10% 4% 60% 65%
Adjusted EBITDA (3.6) (5.3) (5.6) (2.1) (1.9) (0.8) (0.2) (5.0) 37.0 57.2
EBITDA Margin nmf (875%) (127%) (69%) (42%) (16%) (4%) (28%) 36% 38%
EBITDA Growth nmf nmf nmf nmf nmf nmf nmf nmf nmf 54%
OPEX 3.5 5.4 4.3 2.5 3.1 3.5 4.1 13.2 23.5 31.3
OPEX Margin nmf 894% 99% 82% 69% 74% 71% 73% 23% 21%
Return on Assets (ROA) nmf (56%) (76%) (7%) 6% (22%) (23%) (11%) 36% 39%
Return on Equity (ROE) nmf 68% (122%) (8%) 8% (27%) (29%) (15%) 42% 43%
Return on Invested Capital (ROIC) (72%) (140%) (88%) (54%) (38%) (15%) (14%) (20%) 40% 67%
Source: Company Filings for historical data, Echelon Wealth Partners for forward looking estimates.
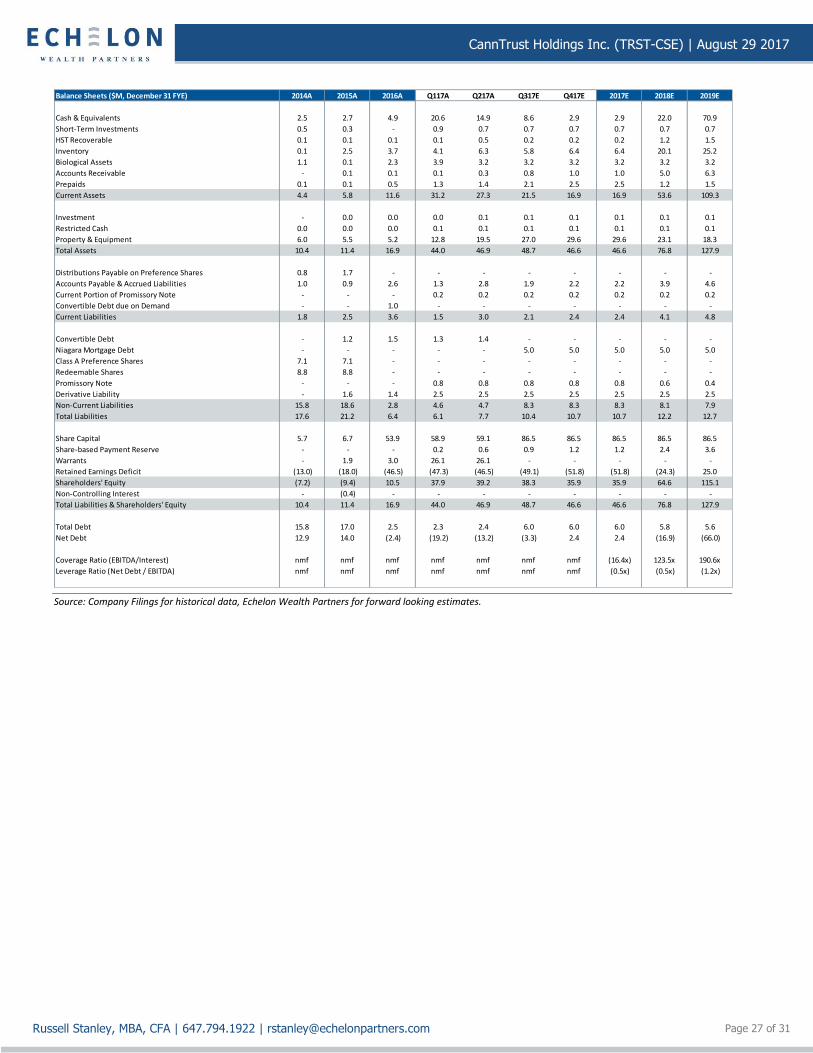
CannTrust Holdings Inc. (TRST-CSE) | August 29 2017
Page 27 of 31 Russell Stanley, MBA, CFA | 647.794.1922 | [email protected]
Balance Sheets ($M, December 31 FYE) 2014A 2015A 2016A Q117A Q217A Q317E Q417E 2017E 2018E 2019E
Cash & Equivalents 2.5 2.7 4.9 20.6 14.9 8.6 2.9 2.9 22.0 70.9
Short-Term Investments 0.5 0.3 - 0.9 0.7 0.7 0.7 0.7 0.7 0.7
HST Recoverable 0.1 0.1 0.1 0.1 0.5 0.2 0.2 0.2 1.2 1.5
Inventory 0.1 2.5 3.7 4.1 6.3 5.8 6.4 6.4 20.1 25.2
Biological Assets 1.1 0.1 2.3 3.9 3.2 3.2 3.2 3.2 3.2 3.2
Accounts Receivable - 0.1 0.1 0.1 0.3 0.8 1.0 1.0 5.0 6.3
Prepaids 0.1 0.1 0.5 1.3 1.4 2.1 2.5 2.5 1.2 1.5
Current Assets 4.4 5.8 11.6 31.2 27.3 21.5 16.9 16.9 53.6 109.3
Investment - 0.0 0.0 0.0 0.1 0.1 0.1 0.1 0.1 0.1
Restricted Cash 0.0 0.0 0.0 0.1 0.1 0.1 0.1 0.1 0.1 0.1
Property & Equipment 6.0 5.5 5.2 12.8 19.5 27.0 29.6 29.6 23.1 18.3
Total Assets 10.4 11.4 16.9 44.0 46.9 48.7 46.6 46.6 76.8 127.9
Distributions Payable on Preference Shares 0.8 1.7 - - - - - - - -
Accounts Payable & Accrued Liabilities 1.0 0.9 2.6 1.3 2.8 1.9 2.2 2.2 3.9 4.6
Current Portion of Promissory Note - - - 0.2 0.2 0.2 0.2 0.2 0.2 0.2
Convertible Debt due on Demand - - 1.0 - - - - - - -
Current Liabilities 1.8 2.5 3.6 1.5 3.0 2.1 2.4 2.4 4.1 4.8
Convertible Debt - 1.2 1.5 1.3 1.4 - - - - -
Niagara Mortgage Debt - - - - - 5.0 5.0 5.0 5.0 5.0
Class A Preference Shares 7.1 7.1 - - - - - - - -
Redeemable Shares 8.8 8.8 - - - - - - - -
Promissory Note - - - 0.8 0.8 0.8 0.8 0.8 0.6 0.4
Derivative Liability - 1.6 1.4 2.5 2.5 2.5 2.5 2.5 2.5 2.5
Non-Current Liabilities 15.8 18.6 2.8 4.6 4.7 8.3 8.3 8.3 8.1 7.9
Total Liabilities 17.6 21.2 6.4 6.1 7.7 10.4 10.7 10.7 12.2 12.7
Share Capital 5.7 6.7 53.9 58.9 59.1 86.5 86.5 86.5 86.5 86.5
Share-based Payment Reserve - - - 0.2 0.6 0.9 1.2 1.2 2.4 3.6
Warrants - 1.9 3.0 26.1 26.1 - - - - -
Retained Earnings Deficit (13.0) (18.0) (46.5) (47.3) (46.5) (49.1) (51.8) (51.8) (24.3) 25.0
Shareholders' Equity (7.2) (9.4) 10.5 37.9 39.2 38.3 35.9 35.9 64.6 115.1
Non-Controlling Interest - (0.4) - - - - - - - -
Total Liabilities & Shareholders' Equity 10.4 11.4 16.9 44.0 46.9 48.7 46.6 46.6 76.8 127.9
Total Debt 15.8 17.0 2.5 2.3 2.4 6.0 6.0 6.0 5.8 5.6
Net Debt 12.9 14.0 (2.4) (19.2) (13.2) (3.3) 2.4 2.4 (16.9) (66.0)
Coverage Ratio (EBITDA/Interest) nmf nmf nmf nmf nmf nmf nmf (16.4x) 123.5x 190.6x
Leverage Ratio (Net Debt / EBITDA) nmf nmf nmf nmf nmf nmf nmf (0.5x) (0.5x) (1.2x)
Source: Company Filings for historical data, Echelon Wealth Partners for forward looking estimates.
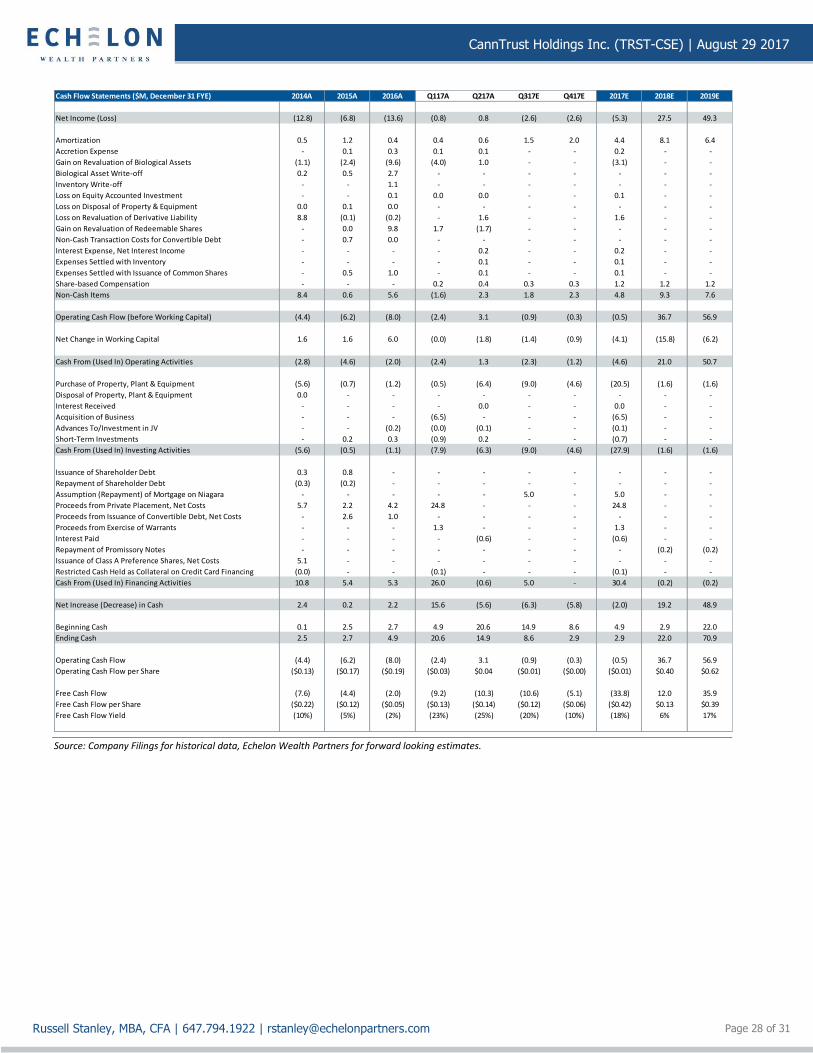
CannTrust Holdings Inc. (TRST-CSE) | August 29 2017
Page 28 of 31 Russell Stanley, MBA, CFA | 647.794.1922 | [email protected]
Cash Flow Statements ($M, December 31 FYE) 2014A 2015A 2016A Q117A Q217A Q317E Q417E 2017E 2018E 2019E
Net Income (Loss) (12.8) (6.8) (13.6) (0.8) 0.8 (2.6) (2.6) (5.3) 27.5 49.3
Amortization 0.5 1.2 0.4 0.4 0.6 1.5 2.0 4.4 8.1 6.4
Accretion Expense - 0.1 0.3 0.1 0.1 - - 0.2 - -
Gain on Revaluation of Biological Assets (1.1) (2.4) (9.6) (4.0) 1.0 - - (3.1) - -
Biological Asset Write-off 0.2 0.5 2.7 - - - - - - -
Inventory Write-off - - 1.1 - - - - - - -
Loss on Equity Accounted Investment - - 0.1 0.0 0.0 - - 0.1 - -
Loss on Disposal of Property & Equipment 0.0 0.1 0.0 - - - - - - -
Loss on Revaluation of Derivative Liability 8.8 (0.1) (0.2) - 1.6 - - 1.6 - -
Gain on Revaluation of Redeemable Shares - 0.0 9.8 1.7 (1.7) - - - - -
Non-Cash Transaction Costs for Convertible Debt - 0.7 0.0 - - - - - - -
Interest Expense, Net Interest Income - - - - 0.2 - - 0.2 - -
Expenses Settled with Inventory - - - - 0.1 - - 0.1 - -
Expenses Settled with Issuance of Common Shares - 0.5 1.0 - 0.1 - - 0.1 - -
Share-based Compensation - - - 0.2 0.4 0.3 0.3 1.2 1.2 1.2
Non-Cash Items 8.4 0.6 5.6 (1.6) 2.3 1.8 2.3 4.8 9.3 7.6
Operating Cash Flow (before Working Capital) (4.4) (6.2) (8.0) (2.4) 3.1 (0.9) (0.3) (0.5) 36.7 56.9
Net Change in Working Capital 1.6 1.6 6.0 (0.0) (1.8) (1.4) (0.9) (4.1) (15.8) (6.2)
Cash From (Used In) Operating Activities (2.8) (4.6) (2.0) (2.4) 1.3 (2.3) (1.2) (4.6) 21.0 50.7
Purchase of Property, Plant & Equipment (5.6) (0.7) (1.2) (0.5) (6.4) (9.0) (4.6) (20.5) (1.6) (1.6)
Disposal of Property, Plant & Equipment 0.0 - - - - - - - - -
Interest Received - - - - 0.0 - - 0.0 - -
Acquisition of Business - - - (6.5) - - - (6.5) - -
Advances To/Investment in JV - - (0.2) (0.0) (0.1) - - (0.1) - -
Short-Term Investments - 0.2 0.3 (0.9) 0.2 - - (0.7) - -
Cash From (Used In) Investing Activities (5.6) (0.5) (1.1) (7.9) (6.3) (9.0) (4.6) (27.9) (1.6) (1.6)
Issuance of Shareholder Debt 0.3 0.8 - - - - - - - -
Repayment of Shareholder Debt (0.3) (0.2) - - - - - - - -
Assumption (Repayment) of Mortgage on Niagara - - - - - 5.0 - 5.0 - -
Proceeds from Private Placement, Net Costs 5.7 2.2 4.2 24.8 - - - 24.8 - -
Proceeds from Issuance of Convertible Debt, Net Costs - 2.6 1.0 - - - - - - -
Proceeds from Exercise of Warrants - - - 1.3 - - - 1.3 - -
Interest Paid - - - - (0.6) - - (0.6) - -
Repayment of Promissory Notes - - - - - - - - (0.2) (0.2)
Issuance of Class A Preference Shares, Net Costs 5.1 - - - - - - - - -
Restricted Cash Held as Collateral on Credit Card Financing (0.0) - - (0.1) - - - (0.1) - -
Cash From (Used In) Financing Activities 10.8 5.4 5.3 26.0 (0.6) 5.0 - 30.4 (0.2) (0.2)
Net Increase (Decrease) in Cash 2.4 0.2 2.2 15.6 (5.6) (6.3) (5.8) (2.0) 19.2 48.9
Beginning Cash 0.1 2.5 2.7 4.9 20.6 14.9 8.6 4.9 2.9 22.0
Ending Cash 2.5 2.7 4.9 20.6 14.9 8.6 2.9 2.9 22.0 70.9
Operating Cash Flow (4.4) (6.2) (8.0) (2.4) 3.1 (0.9) (0.3) (0.5) 36.7 56.9
Operating Cash Flow per Share ($0.13) ($0.17) ($0.19) ($0.03) $0.04 ($0.01) ($0.00) ($0.01) $0.40 $0.62
Free Cash Flow (7.6) (4.4) (2.0) (9.2) (10.3) (10.6) (5.1) (33.8) 12.0 35.9
Free Cash Flow per Share ($0.22) ($0.12) ($0.05) ($0.13) ($0.14) ($0.12) ($0.06) ($0.42) $0.13 $0.39
Free Cash Flow Yield (10%) (5%) (2%) (23%) (25%) (20%) (10%) (18%) 6% 17%
Source: Company Filings for historical data, Echelon Wealth Partners for forward looking estimates.
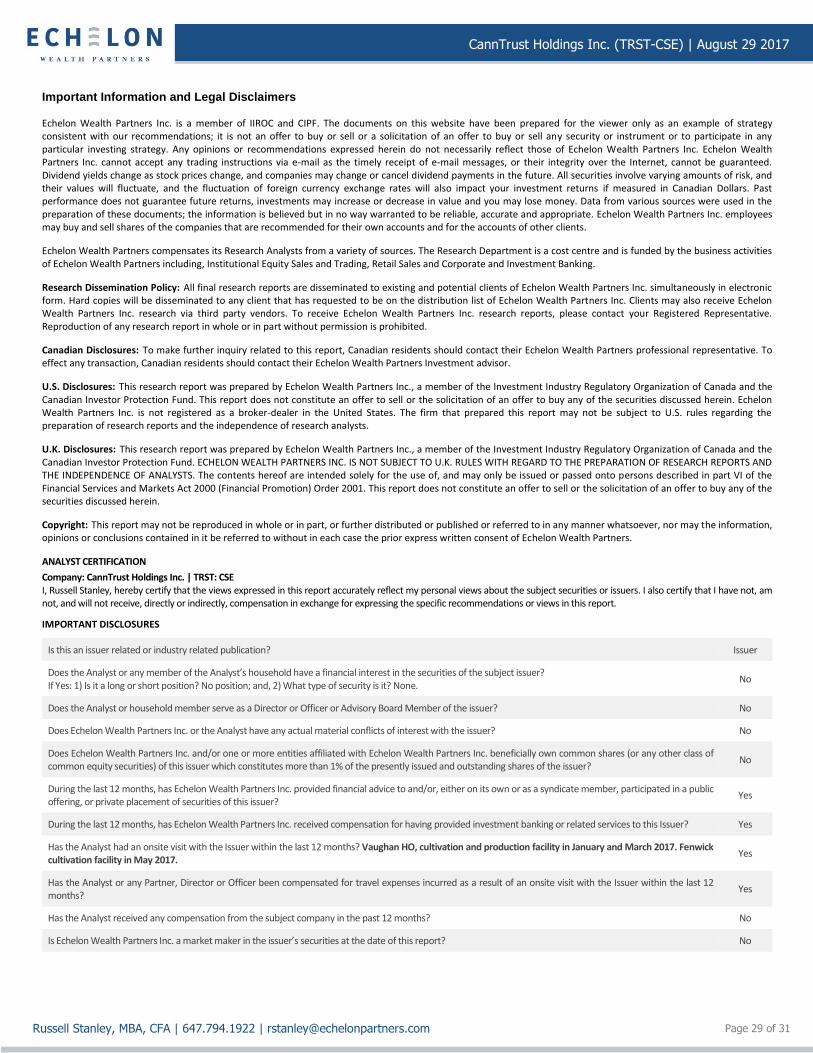
CannTrust Holdings Inc. (TRST-CSE) | August 29 2017
Page 29 of 31 Russell Stanley, MBA, CFA | 647.794.1922 | [email protected]
Important Information and Legal Disclaimers
Echelon Wealth Partners Inc. is a member of IIROC and CIPF. The documents on this website have been prepared for the viewer only as an example of strategy consistent with our recommendations; it is not an offer to buy or sell or a solicitation of an offer to buy or sell any security or instrument or to participate in any particular investing strategy. Any opinions or recommendations expressed herein do not necessarily reflect those of Echelon Wealth Partners Inc. Echelon Wealth Partners Inc. cannot accept any trading instructions via e-mail as the timely receipt of e-mail messages, or their integrity over the Internet, cannot be guaranteed. Dividend yields change as stock prices change, and companies may change or cancel dividend payments in the future. All securities involve varying amounts of risk, and their values will fluctuate, and the fluctuation of foreign currency exchange rates will also impact your investment returns if measured in Canadian Dollars. Past performance does not guarantee future returns, investments may increase or decrease in value and you may lose money. Data from various sources were used in the preparation of these documents; the information is believed but in no way warranted to be reliable, accurate and appropriate. Echelon Wealth Partners Inc. employees may buy and sell shares of the companies that are recommended for their own accounts and for the accounts of other clients.
Echelon Wealth Partners compensates its Research Analysts from a variety of sources. The Research Department is a cost centre and is funded by the business activities of Echelon Wealth Partners including, Institutional Equity Sales and Trading, Retail Sales and Corporate and Investment Banking.
Research Dissemination Policy: All final research reports are disseminated to existing and potential clients of Echelon Wealth Partners Inc. simultaneously in electronic form. Hard copies will be disseminated to any client that has requested to be on the distribution list of Echelon Wealth Partners Inc. Clients may also receive Echelon Wealth Partners Inc. research via third party vendors. To receive Echelon Wealth Partners Inc. research reports, please contact your Registered Representative. Reproduction of any research report in whole or in part without permission is prohibited.
Canadian Disclosures: To make further inquiry related to this report, Canadian residents should contact their Echelon Wealth Partners professional representative. To effect any transaction, Canadian residents should contact their Echelon Wealth Partners Investment advisor.
U.S. Disclosures: This research report was prepared by Echelon Wealth Partners Inc., a member of the Investment Industry Regulatory Organization of Canada and the Canadian Investor Protection Fund. This report does not constitute an offer to sell or the solicitation of an offer to buy any of the securities discussed herein. Echelon Wealth Partners Inc. is not registered as a broker-dealer in the United States. The firm that prepared this report may not be subject to U.S. rules regarding the preparation of research reports and the independence of research analysts.
U.K. Disclosures: This research report was prepared by Echelon Wealth Partners Inc., a member of the Investment Industry Regulatory Organization of Canada and the Canadian Investor Protection Fund. ECHELON WEALTH PARTNERS INC. IS NOT SUBJECT TO U.K. RULES WITH REGARD TO THE PREPARATION OF RESEARCH REPORTS AND THE INDEPENDENCE OF ANALYSTS. The contents hereof are intended solely for the use of, and may only be issued or passed onto persons described in part VI of the Financial Services and Markets Act 2000 (Financial Promotion) Order 2001. This report does not constitute an offer to sell or the solicitation of an offer to buy any of the securities discussed herein.
Copyright: This report may not be reproduced in whole or in part, or further distributed or published or referred to in any manner whatsoever, nor may the information, opinions or conclusions contained in it be referred to without in each case the prior express written consent of Echelon Wealth Partners.
ANALYST CERTIFICATION
Company: CannTrust Holdings Inc. | TRST: CSE I, Russell Stanley, hereby certify that the views expressed in this report accurately reflect my personal views about the subject securities or issuers. I also certify that I have not, am not, and will not receive, directly or indirectly, compensation in exchange for expressing the specific recommendations or views in this report. IMPORTANT DISCLOSURES
Is this an issuer related or industry related publication? Issuer
Does the Analyst or any member of the Analyst’s household have a financial interest in the securities of the subject issuer? If Yes: 1) Is it a long or short position? No position; and, 2) What type of security is it? None.
No
Does the Analyst or household member serve as a Director or Officer or Advisory Board Member of the issuer? No
Does Echelon Wealth Partners Inc. or the Analyst have any actual material conflicts of interest with the issuer? No
Does Echelon Wealth Partners Inc. and/or one or more entities affiliated with Echelon Wealth Partners Inc. beneficially own common shares (or any other class of common equity securities) of this issuer which constitutes more than 1% of the presently issued and outstanding shares of the issuer?
No
During the last 12 months, has Echelon Wealth Partners Inc. provided financial advice to and/or, either on its own or as a syndicate member, participated in a public offering, or private placement of securities of this issuer?
Yes
During the last 12 months, has Echelon Wealth Partners Inc. received compensation for having provided investment banking or related services to this Issuer? Yes
Has the Analyst had an onsite visit with the Issuer within the last 12 months? Vaughan HO, cultivation and production facility in January and March 2017. Fenwick cultivation facility in May 2017.
Yes
Has the Analyst or any Partner, Director or Officer been compensated for travel expenses incurred as a result of an onsite visit with the Issuer within the last 12 months?
Yes
Has the Analyst received any compensation from the subject company in the past 12 months? No
Is Echelon Wealth Partners Inc. a market maker in the issuer’s securities at the date of this report? No
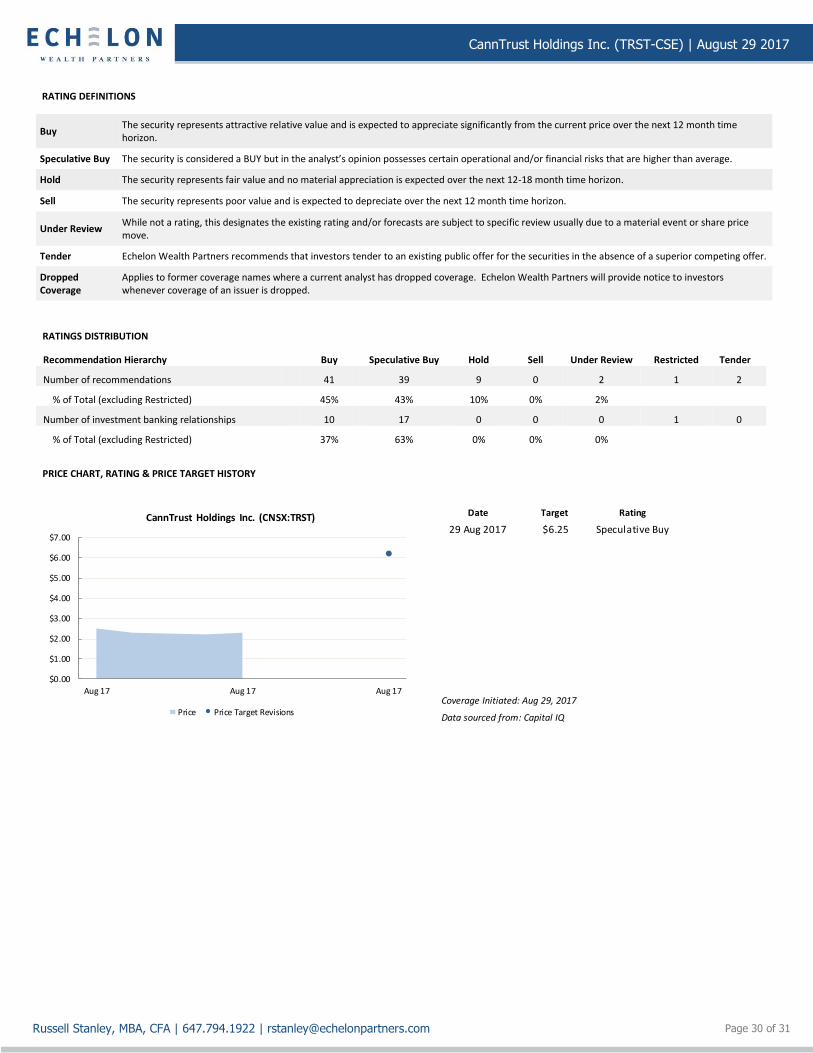
CannTrust Holdings Inc. (TRST-CSE) | August 29 2017
Page 30 of 31 Russell Stanley, MBA, CFA | 647.794.1922 | [email protected]
RATING DEFINITIONS
Buy The security represents attractive relative value and is expected to appreciate significantly from the current price over the next 12 month time horizon.
Speculative Buy The security is considered a BUY but in the analyst’s opinion possesses certain operational and/or financial risks that are higher than average.
Hold The security represents fair value and no material appreciation is expected over the next 12-18 month time horizon.
Sell The security represents poor value and is expected to depreciate over the next 12 month time horizon.
Under Review While not a rating, this designates the existing rating and/or forecasts are subject to specific review usually due to a material event or share price move.
Tender Echelon Wealth Partners recommends that investors tender to an existing public offer for the securities in the absence of a superior competing offer.
Dropped Coverage
Applies to former coverage names where a current analyst has dropped coverage. Echelon Wealth Partners will provide notice to investors whenever coverage of an issuer is dropped.
RATINGS DISTRIBUTION
Recommendation Hierarchy Buy Speculative Buy Hold Sell Under Review Restricted Tender
Number of recommendations 41 39 9 0 2 1 2
% of Total (excluding Restricted) 45% 43% 10% 0% 2%
Number of investment banking relationships 10 17 0 0 0 1 0
% of Total (excluding Restricted) 37% 63% 0% 0% 0%
PRICE CHART, RATING & PRICE TARGET HISTORY
Date Target Rating
29 Aug 2017 $6.25 Speculative Buy
Coverage Initiated: Aug 29, 2017
Data sourced from: Capital IQ
$0.00
$1.00
$2.00
$3.00
$4.00
$5.00
$6.00
$7.00
Aug 17 Aug 17 Aug 17
CannTrust Holdings Inc. (CNSX:TRST)
Price Price Target Revisions

CannTrust Holdings Inc. (TRST-CSE) | August 29 2017
Page 31 of 31 Russell Stanley, MBA, CFA | 647.794.1922 | [email protected]
Toronto Wealth Management
1 Adelaide Street East, Suite 2000
Toronto, ON M5C 2V9
416-572-5523
Toronto Capital Markets
130 King Street West, Suite 2500
Toronto, Ontario M5X 2A2
416-649-4273
Montreal Wealth Management and Capital Markets
1000 De La Gauchetière St. W., Suite 1130
Montréal, QC H3B 4W5
514-396-0333
Ottawa Wealth Management
360 Albert Street, Suite 800
Ottawa, ON K1R 7X7
1-877-967-5866
Calgary Wealth Management
350 - 7th Avenue SW, 19th Floor
Calgary, AB T2P 3N9
403-218-3144
Vancouver Wealth Management and Capital Markets
1055 Dunsmuir St. Suite 3424; P.O Box 49207
Vancouver, BC V7X 1K8
604-647-2888
Victoria Wealth Management
730 View Street, Suite 210
Victoria, BC V8W 3Y7
1-877-978-9300
Oakville Wealth Management
1275 North Service Road, Suite 612
Oakville, ON L6M 3G4
289-348-5936
London Wealth Management
495 Richmond St., Suite 830
London, ON N6A 5A9 V8W 3Y7
519-858-2112
Saskatoon Wealth Management
402-261 First Avenue North
Saskatoon, SK S7K 1X2
306-667-2282
Tokyo Capital Markets
Holland Hills Mori Tower; RoP #603
5-11-1 Toranomon, Minato-Ku,
Tokyo, 105-0001, Japan
+81.90.1470.1684