cancer statistics 2007 a presentation from the american cancer society ©2007, american cancer...
TRANSCRIPT
Cancer Statistics 2007A Presentation From the American Cancer Society
©2007, American Cancer Society, Inc.
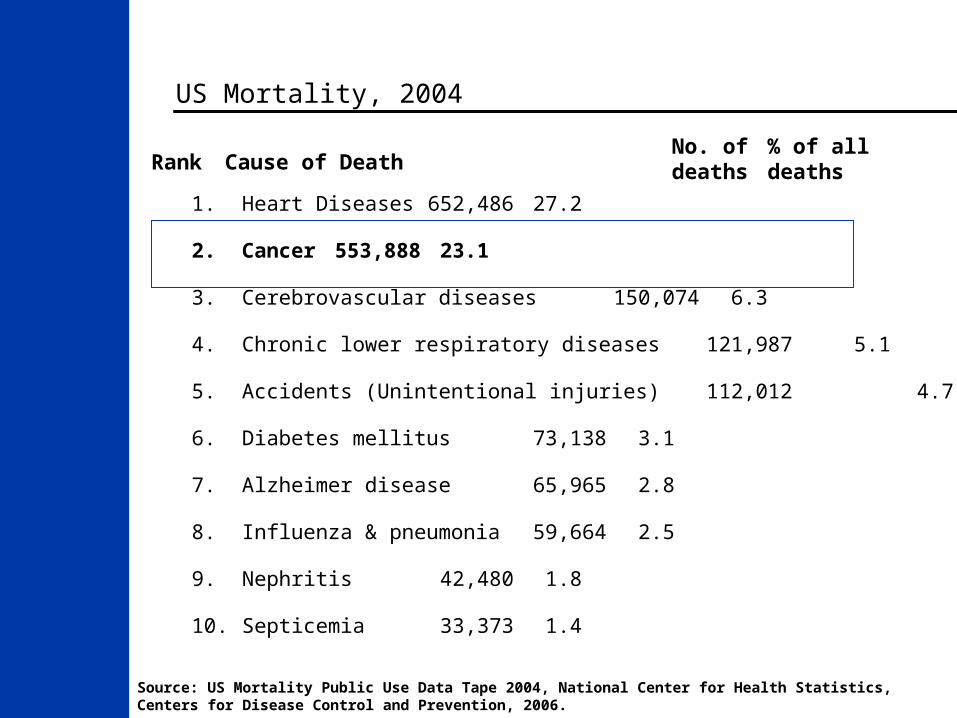
US Mortality, 2004
Source: US Mortality Public Use Data Tape 2004, National Center for Health Statistics, Centers for Disease Control and Prevention, 2006.
1. Heart Diseases 652,486 27.2
2. Cancer 553,888 23.1
3. Cerebrovascular diseases 150,074 6.3
4. Chronic lower respiratory diseases 121,987 5.1
5. Accidents (Unintentional injuries) 112,012 4.7
6. Diabetes mellitus 73,138 3.1
7. Alzheimer disease 65,965 2.8
8. Influenza & pneumonia 59,664 2.5
9. Nephritis 42,480 1.8
10. Septicemia 33,373 1.4
Rank Cause of DeathNo. of deaths
% of all deaths
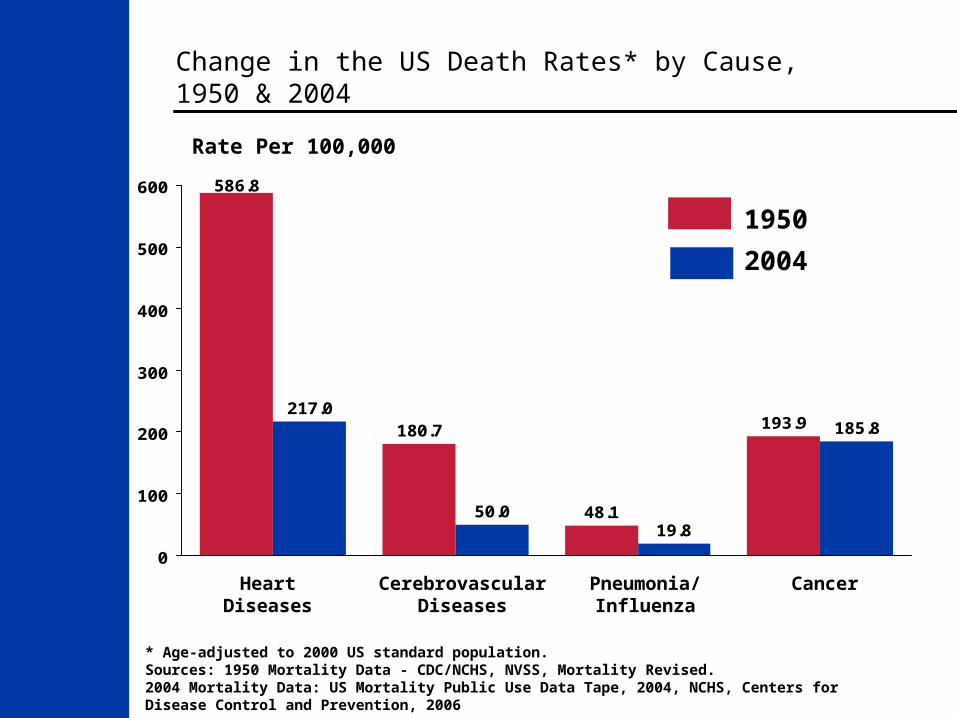
Change in the US Death Rates* by Cause, 1950 & 2004
* Age-adjusted to 2000 US standard population.Sources: 1950 Mortality Data - CDC/NCHS, NVSS, Mortality Revised.2004 Mortality Data: US Mortality Public Use Data Tape, 2004, NCHS, Centers for Disease Control and Prevention, 2006
19.8
180.7
48.1
586.8
193.9
50.0
185.8217.0
0
100
200
300
400
500
600
HeartDiseases
CerebrovascularDiseases
Pneumonia/Influenza
Cancer
1950
2004
Rate Per 100,000
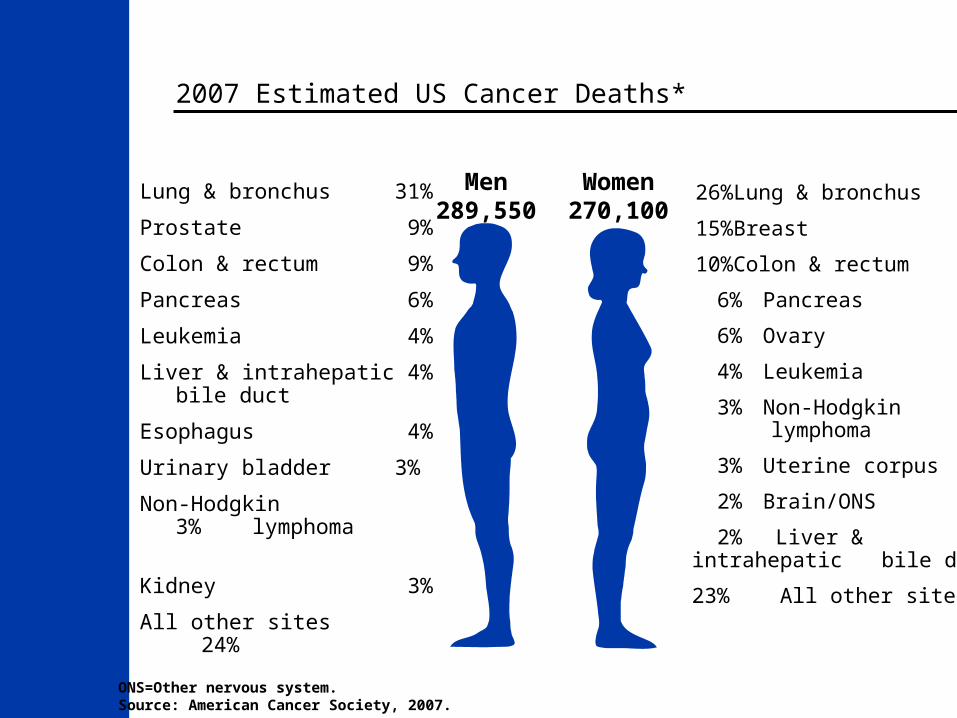
2007 Estimated US Cancer Deaths*
ONS=Other nervous system.Source: American Cancer Society, 2007.
Men289,550
Women270,100
26% Lung & bronchus
15% Breast
10% Colon & rectum
6% Pancreas
6% Ovary
4% Leukemia
3% Non-Hodgkin lymphoma
3% Uterine corpus
2% Brain/ONS
2% Liver & intrahepaticbile duct
23% All other sites
Lung & bronchus 31%
Prostate 9%
Colon & rectum 9%
Pancreas 6%
Leukemia 4%
Liver & intrahepatic 4%bile duct
Esophagus 4%
Urinary bladder 3%
Non-Hodgkin 3% lymphoma
Kidney 3%
All other sites 24%
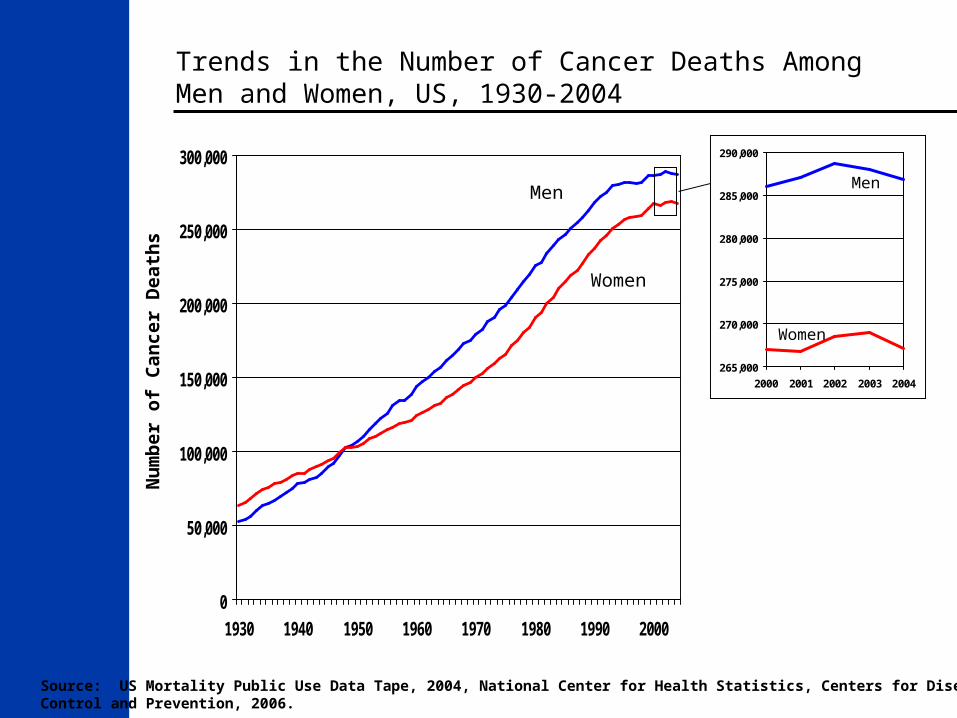
Trends in the Number of Cancer Deaths Among Men and Women, US, 1930-2004
0
50,000
100,000
150,000
200,000
250,000
300,000
1930 1940 1950 1960 1970 1980 1990 2000
Women
Men
Nu
mb
er o
f C
ance
r D
eath
s
265,000
270,000
275,000
280,000
285,000
290,000
2000 2001 2002 2003 2004
Men
Women
Source: US Mortality Public Use Data Tape, 2004, National Center for Health Statistics, Centers for Disease Control and Prevention, 2006.
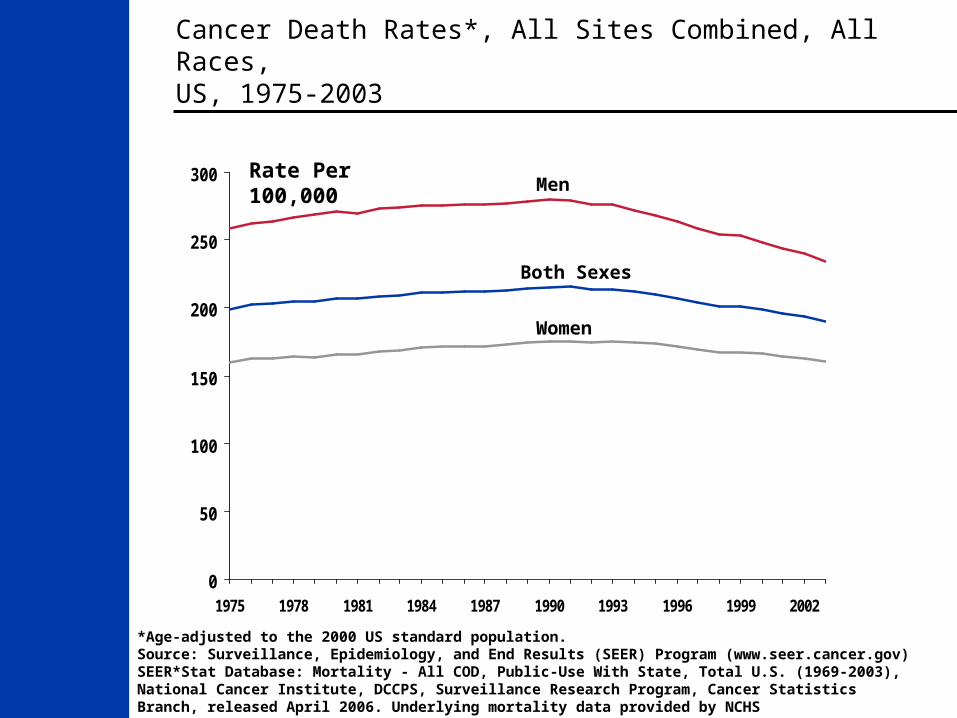
Cancer Death Rates*, All Sites Combined, All Races, US, 1975-2003
*Age-adjusted to the 2000 US standard population.Source: Surveillance, Epidemiology, and End Results (SEER) Program (www.seer.cancer.gov) SEER*Stat Database: Mortality - All COD, Public-Use With State, Total U.S. (1969-2003), National Cancer Institute, DCCPS, Surveillance Research Program, Cancer Statistics Branch, released April 2006. Underlying mortality data provided by NCHS (www.cdc.gov/nchs).
0
50
100
150
200
250
300
1975 1978 1981 1984 1987 1990 1993 1996 1999 2002
Men
Both Sexes
Rate Per 100,000
Women
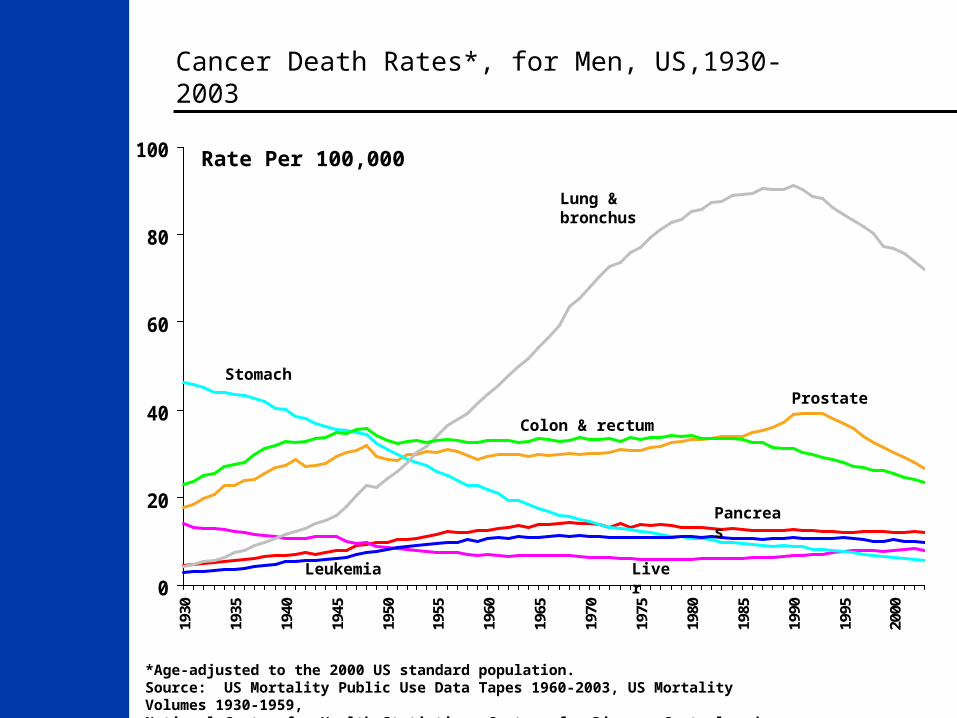
Cancer Death Rates*, for Men, US,1930-2003
*Age-adjusted to the 2000 US standard population.Source: US Mortality Public Use Data Tapes 1960-2003, US Mortality Volumes 1930-1959,National Center for Health Statistics, Centers for Disease Control and Prevention, 2006.
0
20
40
60
80
100
1930
1935
1940
1945
1950
1955
1960
1965
1970
1975
1980
1985
1990
1995
2000
Lung & bronchus
Colon & rectum
Stomach
Rate Per 100,000
Prostate
Pancreas
LiverLeukemia
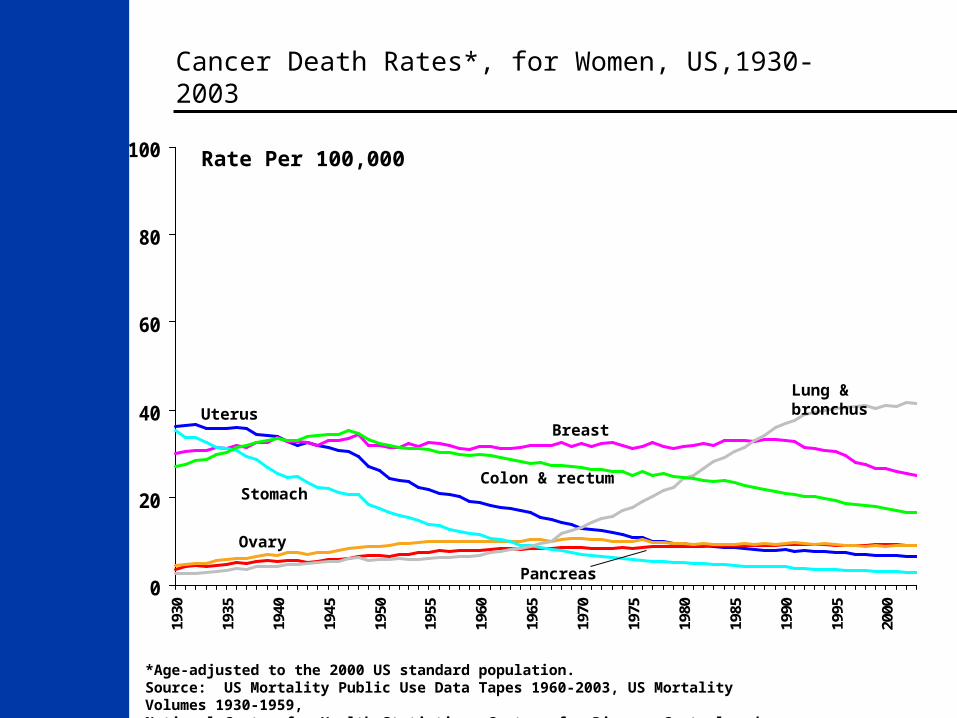
Cancer Death Rates*, for Women, US,1930-2003
*Age-adjusted to the 2000 US standard population.Source: US Mortality Public Use Data Tapes 1960-2003, US Mortality Volumes 1930-1959,National Center for Health Statistics, Centers for Disease Control and Prevention, 2006.
0
20
40
60
80
10019
30
1935
1940
1945
1950
1955
1960
1965
1970
1975
1980
1985
1990
1995
2000
Lung & bronchus
Colon & rectum
Uterus
Stomach
Breast
Ovary
Pancreas
Rate Per 100,000
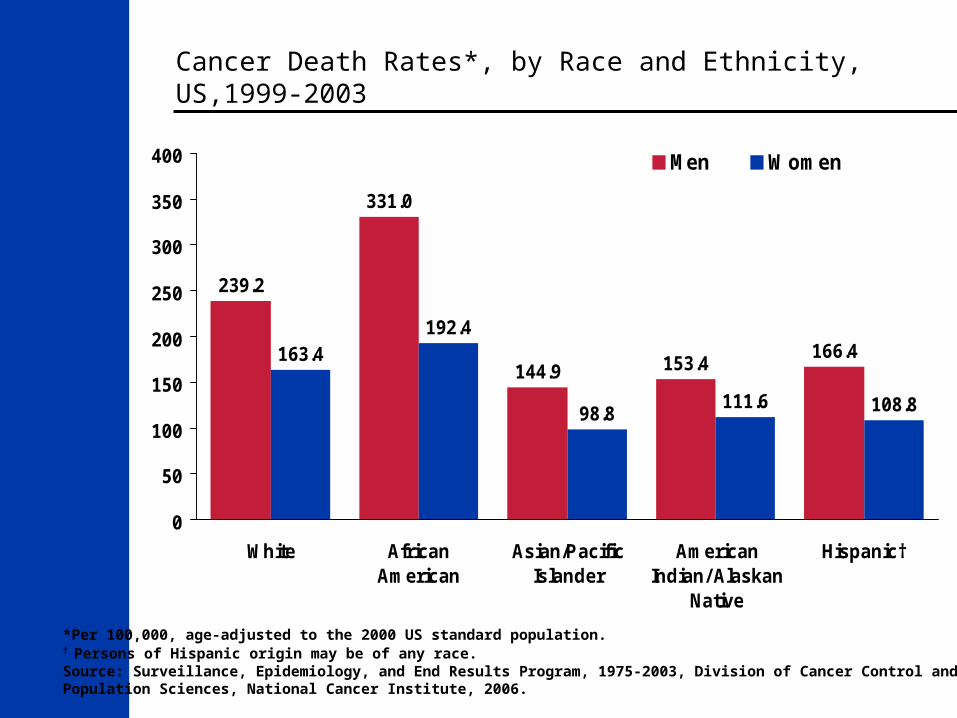
239.2
144.9 153.4163.4192.4
98.8111.6 108.8
331.0
166.4
0
50
100
150
200
250
300
350
400
White AfricanAmerican
Asian/PacificIslander
AmericanIndian/ Alaskan
Native
Hispanic†
Men Women
*Per 100,000, age-adjusted to the 2000 US standard population.† Persons of Hispanic origin may be of any race.Source: Surveillance, Epidemiology, and End Results Program, 1975-2003, Division of Cancer Control andPopulation Sciences, National Cancer Institute, 2006.
Cancer Death Rates*, by Race and Ethnicity, US,1999-2003
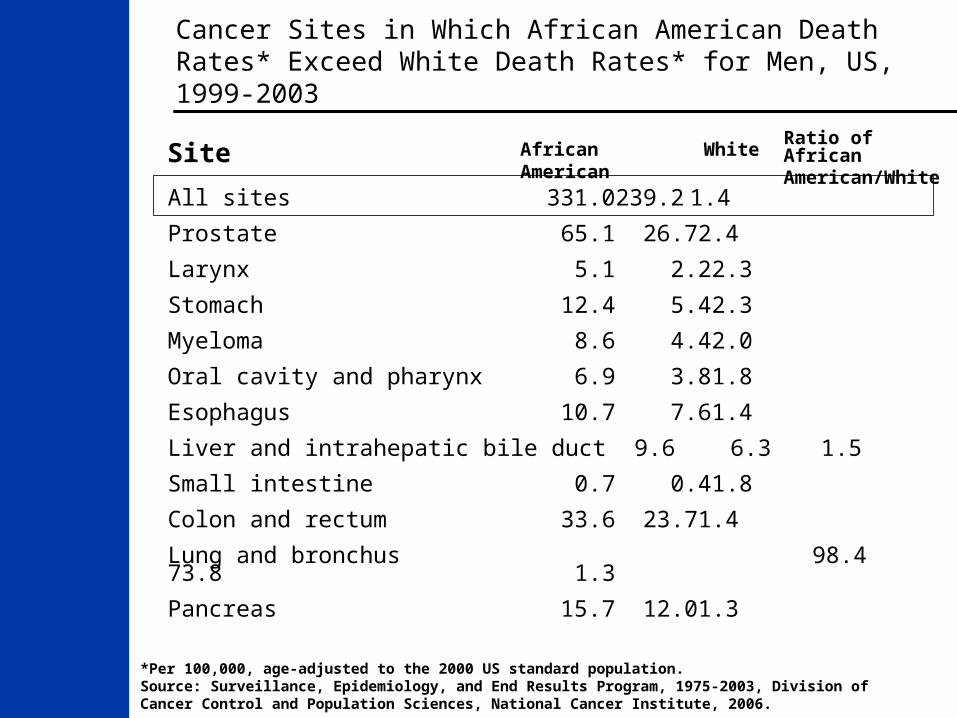
All sites 331.0 239.2 1.4
Prostate 65.1 26.7 2.4
Larynx 5.1 2.2 2.3
Stomach 12.4 5.4 2.3
Myeloma 8.6 4.4 2.0
Oral cavity and pharynx 6.9 3.8 1.8
Esophagus 10.7 7.6 1.4
Liver and intrahepatic bile duct 9.6 6.3 1.5
Small intestine 0.7 0.4 1.8
Colon and rectum 33.6 23.7 1.4
Lung and bronchus 98.4 73.8 1.3
Pancreas 15.7 12.0 1.3
Cancer Sites in Which African American Death Rates* Exceed White Death Rates* for Men, US, 1999-2003
*Per 100,000, age-adjusted to the 2000 US standard population.Source: Surveillance, Epidemiology, and End Results Program, 1975-2003, Division of Cancer Control and Population Sciences, National Cancer Institute, 2006.
Site African American WhiteRatio of African American/White
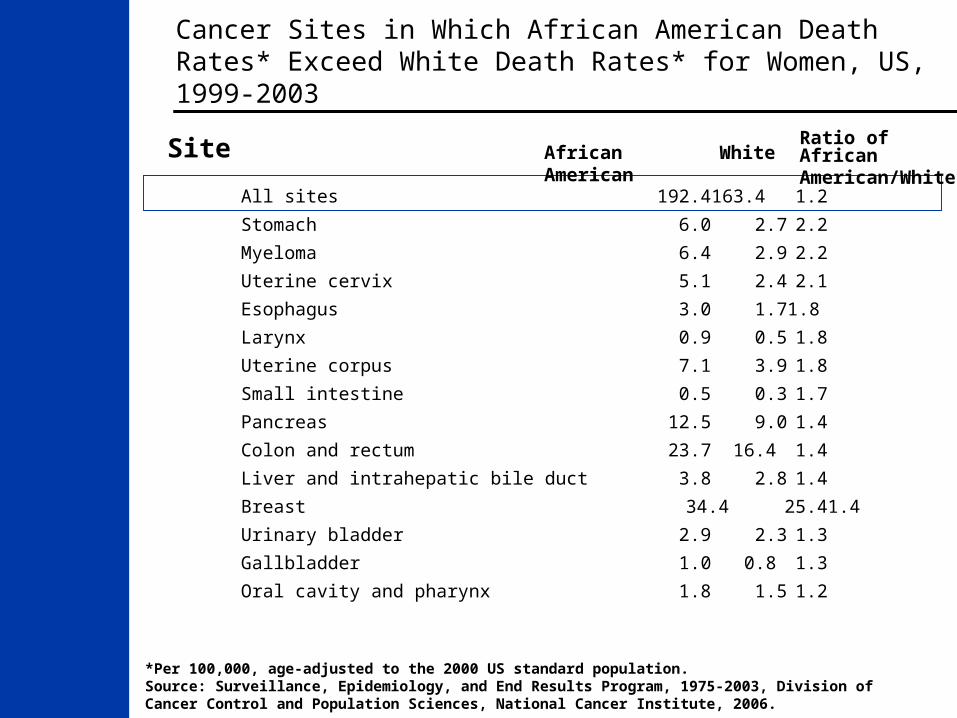
All sites 192.4 163.4 1.2
Stomach 6.0 2.7 2.2
Myeloma 6.4 2.9 2.2
Uterine cervix 5.1 2.4 2.1
Esophagus 3.0 1.7 1.8
Larynx 0.9 0.5 1.8
Uterine corpus 7.1 3.9 1.8
Small intestine 0.5 0.3 1.7
Pancreas 12.5 9.0 1.4
Colon and rectum 23.7 16.4 1.4
Liver and intrahepatic bile duct 3.8 2.8 1.4
Breast 34.4 25.4 1.4
Urinary bladder 2.9 2.3 1.3
Gallbladder 1.0 0.8 1.3
Oral cavity and pharynx 1.8 1.5 1.2
Cancer Sites in Which African American Death Rates* Exceed White Death Rates* for Women, US, 1999-2003
*Per 100,000, age-adjusted to the 2000 US standard population.Source: Surveillance, Epidemiology, and End Results Program, 1975-2003, Division of Cancer Control and Population Sciences, National Cancer Institute, 2006.
Site African American WhiteRatio of African American/White
0
50
100
150
200
250
300
350
400
450
500
1975 1978 1981 1984 1987 1990 1993 1996 1999 2002
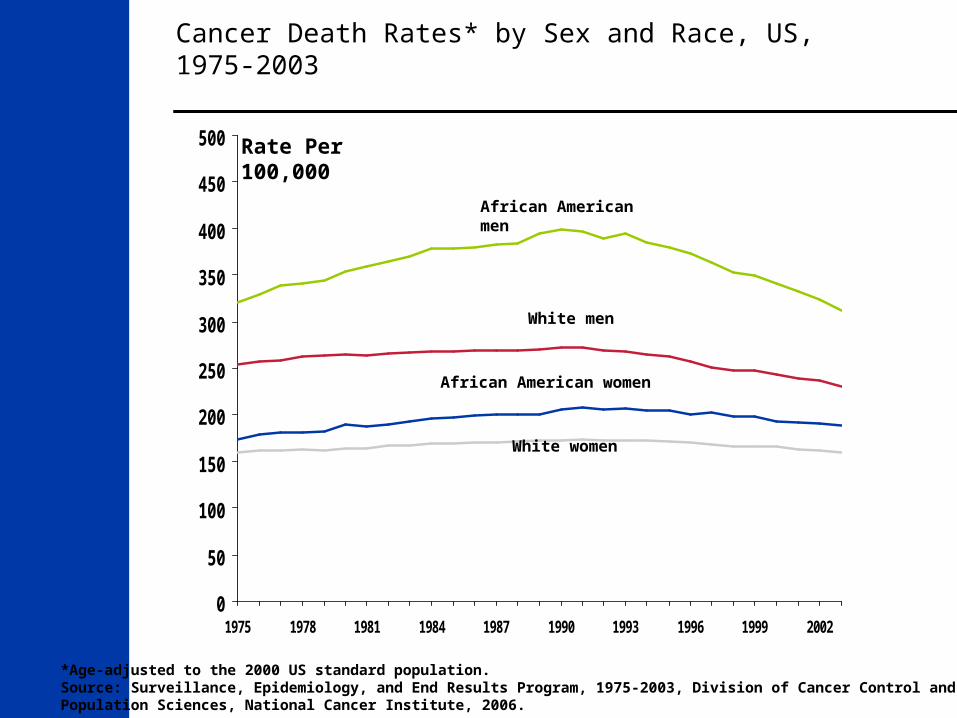
African American men
White men
African American women
White women
Rate Per 100,000
Cancer Death Rates* by Sex and Race, US, 1975-2003
*Age-adjusted to the 2000 US standard population.Source: Surveillance, Epidemiology, and End Results Program, 1975-2003, Division of Cancer Control andPopulation Sciences, National Cancer Institute, 2006.
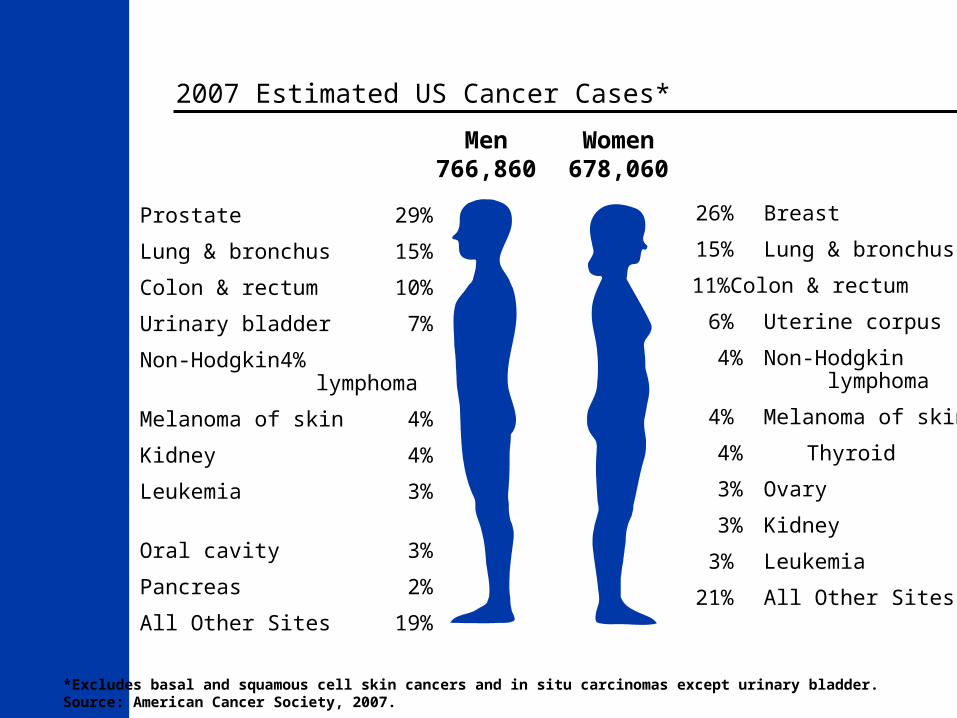
2007 Estimated US Cancer Cases*
*Excludes basal and squamous cell skin cancers and in situ carcinomas except urinary bladder.Source: American Cancer Society, 2007.
Men766,860
Women678,060
26% Breast
15% Lung & bronchus
11% Colon & rectum
6% Uterine corpus
4% Non-Hodgkin lymphoma
4% Melanoma of skin
4% Thyroid
3% Ovary
3% Kidney
3% Leukemia
21% All Other Sites
Prostate 29%
Lung & bronchus 15%
Colon & rectum 10%
Urinary bladder 7%
Non-Hodgkin4% lymphoma
Melanoma of skin 4%
Kidney 4%
Leukemia 3%
Oral cavity 3%
Pancreas 2%
All Other Sites 19%
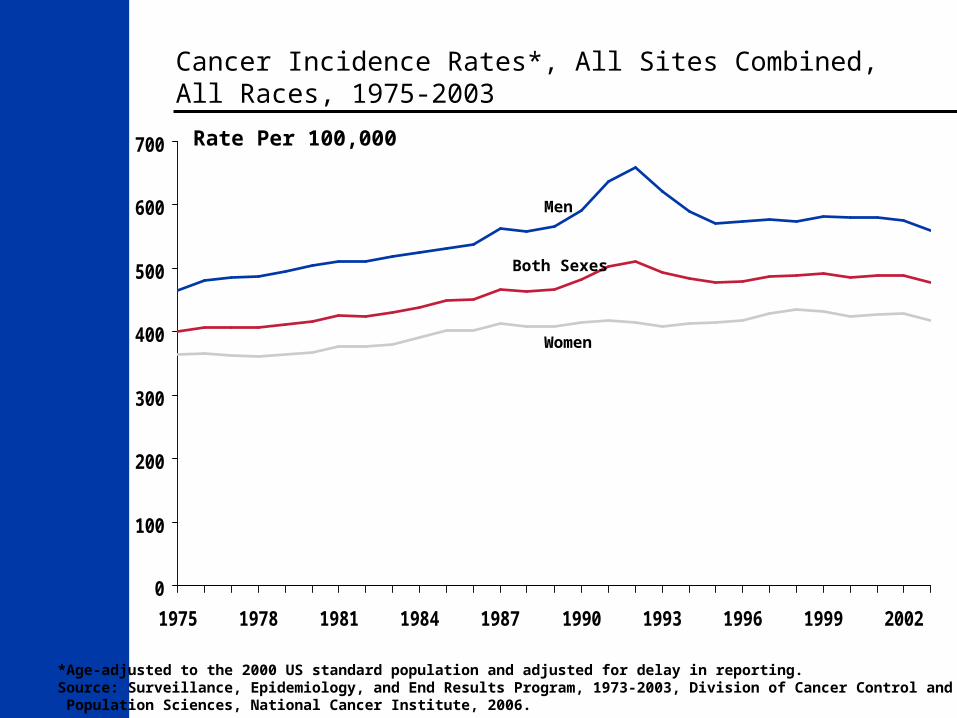
Cancer Incidence Rates*, All Sites Combined, All Races, 1975-2003
*Age-adjusted to the 2000 US standard population and adjusted for delay in reporting.Source: Surveillance, Epidemiology, and End Results Program, 1973-2003, Division of Cancer Control and Population Sciences, National Cancer Institute, 2006.
0
100
200
300
400
500
600
700
1975 1978 1981 1984 1987 1990 1993 1996 1999 2002
Both Sexes
Men
Women
Rate Per 100,000
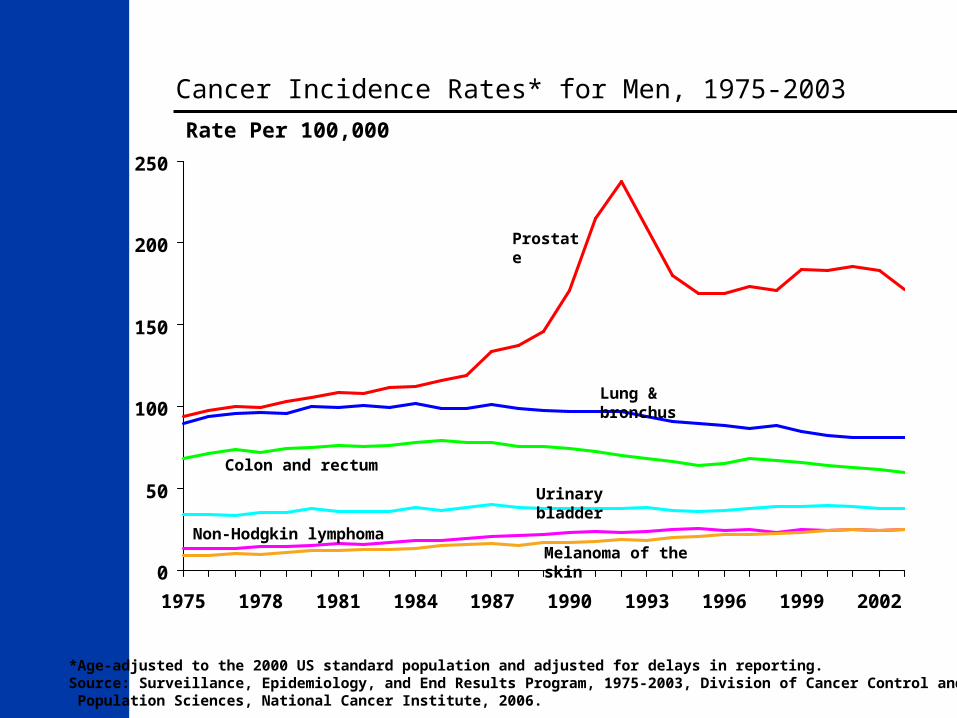
Cancer Incidence Rates* for Men, 1975-2003
*Age-adjusted to the 2000 US standard population and adjusted for delays in reporting.Source: Surveillance, Epidemiology, and End Results Program, 1975-2003, Division of Cancer Control and Population Sciences, National Cancer Institute, 2006.
0
50
100
150
200
250
1975 1978 1981 1984 1987 1990 1993 1996 1999 2002
Prostate
Lung & bronchus
Colon and rectum
Urinary bladder
Non-Hodgkin lymphoma
Rate Per 100,000
Melanoma of the skin
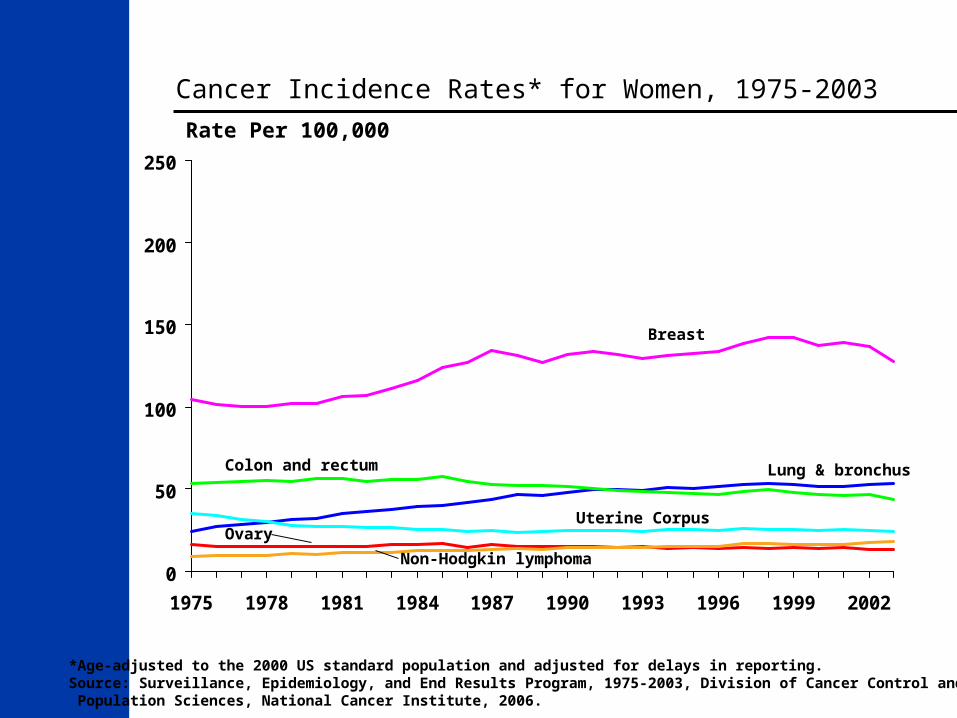
Cancer Incidence Rates* for Women, 1975-2003
*Age-adjusted to the 2000 US standard population and adjusted for delays in reporting.Source: Surveillance, Epidemiology, and End Results Program, 1975-2003, Division of Cancer Control and Population Sciences, National Cancer Institute, 2006.
0
50
100
150
200
250
1975 1978 1981 1984 1987 1990 1993 1996 1999 2002
Colon and rectum
Rate Per 100,000
Breast
Lung & bronchus
Uterine CorpusOvary
Non-Hodgkin lymphoma
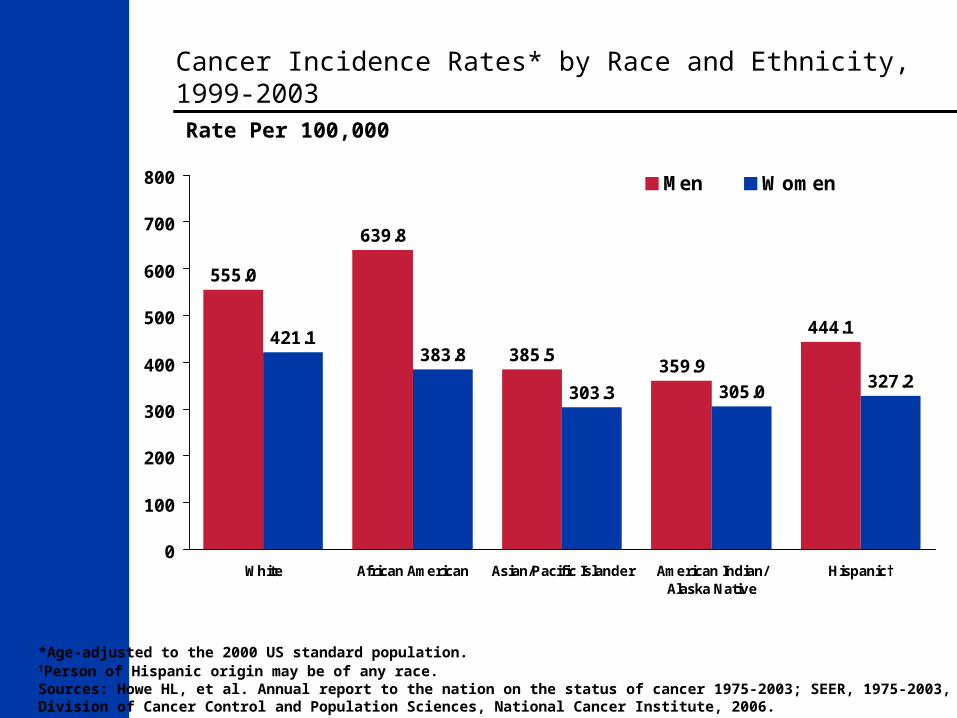
Cancer Incidence Rates* by Race and Ethnicity, 1999-2003
*Age-adjusted to the 2000 US standard population.†Person of Hispanic origin may be of any race.Sources: Howe HL, et al. Annual report to the nation on the status of cancer 1975-2003; SEER, 1975-2003,Division of Cancer Control and Population Sciences, National Cancer Institute, 2006.
555.0
385.5359.9
421.1383.8
303.3 305.0327.2
639.8
444.1
0
100
200
300
400
500
600
700
800
White African American Asian/Pacific Islander American Indian/Alaska Native
Hispanic†
Men Women
Rate Per 100,000
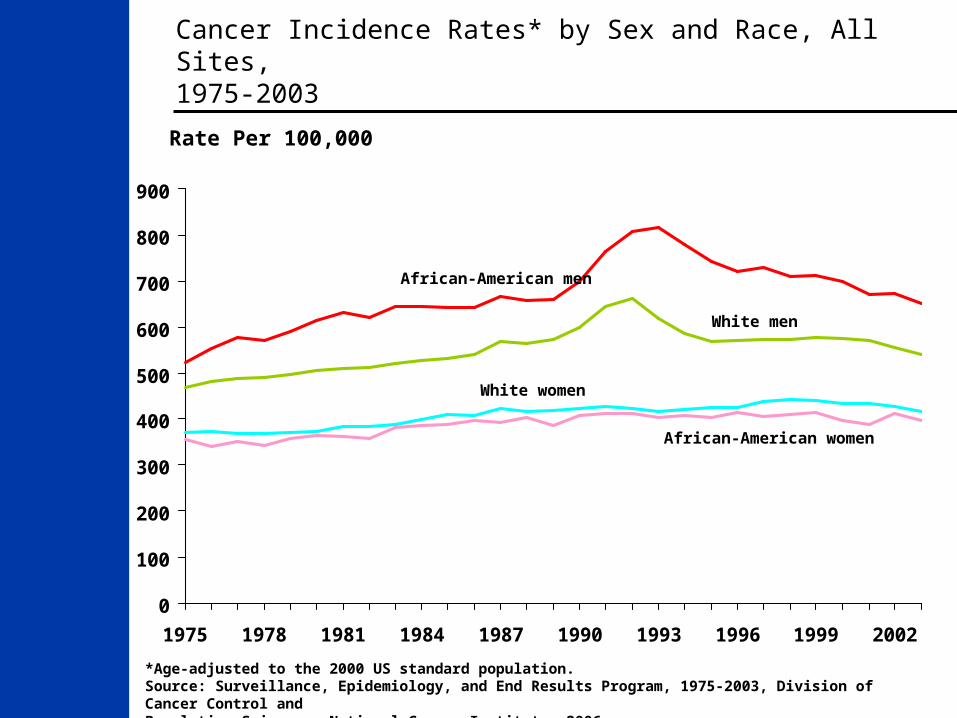
Cancer Incidence Rates* by Sex and Race, All Sites, 1975-2003
*Age-adjusted to the 2000 US standard population.Source: Surveillance, Epidemiology, and End Results Program, 1975-2003, Division of Cancer Control andPopulation Sciences, National Cancer Institute, 2006.
0
100
200
300
400
500
600
700
800
900
1975 1978 1981 1984 1987 1990 1993 1996 1999 2002
African-American men
White men
White women
African-American women
Rate Per 100,000
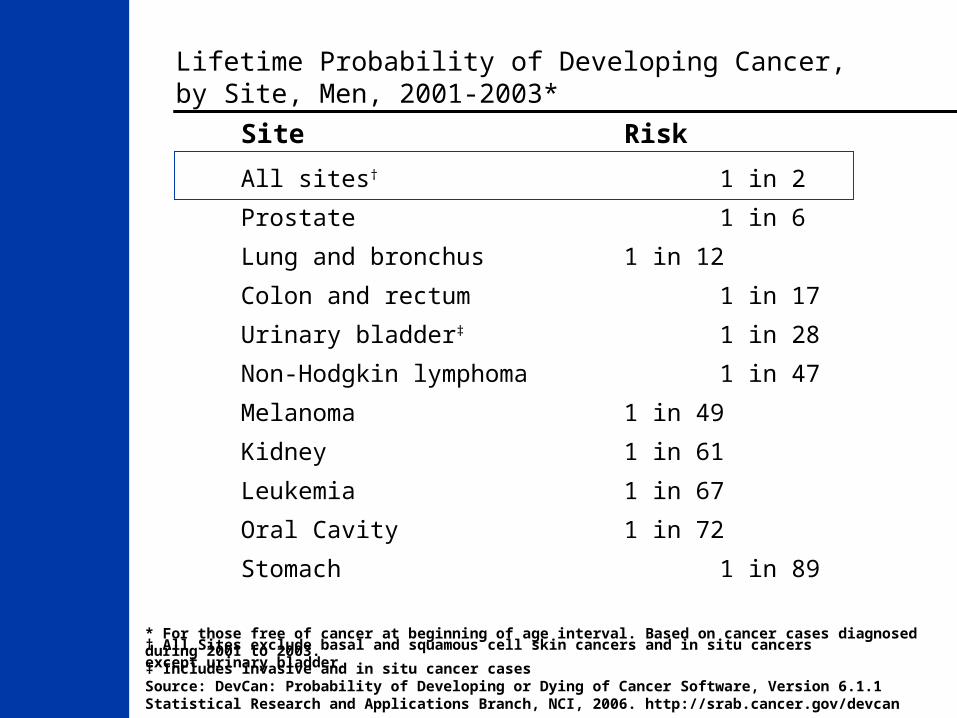
* For those free of cancer at beginning of age interval. Based on cancer cases diagnosed during 2001 to 2003.
Source: DevCan: Probability of Developing or Dying of Cancer Software, Version 6.1.1 Statistical Research and Applications Branch, NCI, 2006. http://srab.cancer.gov/devcan
Lifetime Probability of Developing Cancer, by Site, Men, 2001-2003*
† All Sites exclude basal and squamous cell skin cancers and in situ cancers except urinary bladder .
Site Risk
All sites† 1 in 2
Prostate 1 in 6
Lung and bronchus 1 in 12
Colon and rectum 1 in 17
Urinary bladder‡ 1 in 28
Non-Hodgkin lymphoma 1 in 47
Melanoma 1 in 49
Kidney 1 in 61
Leukemia 1 in 67
Oral Cavity 1 in 72
Stomach 1 in 89
‡ Includes invasive and in situ cancer cases
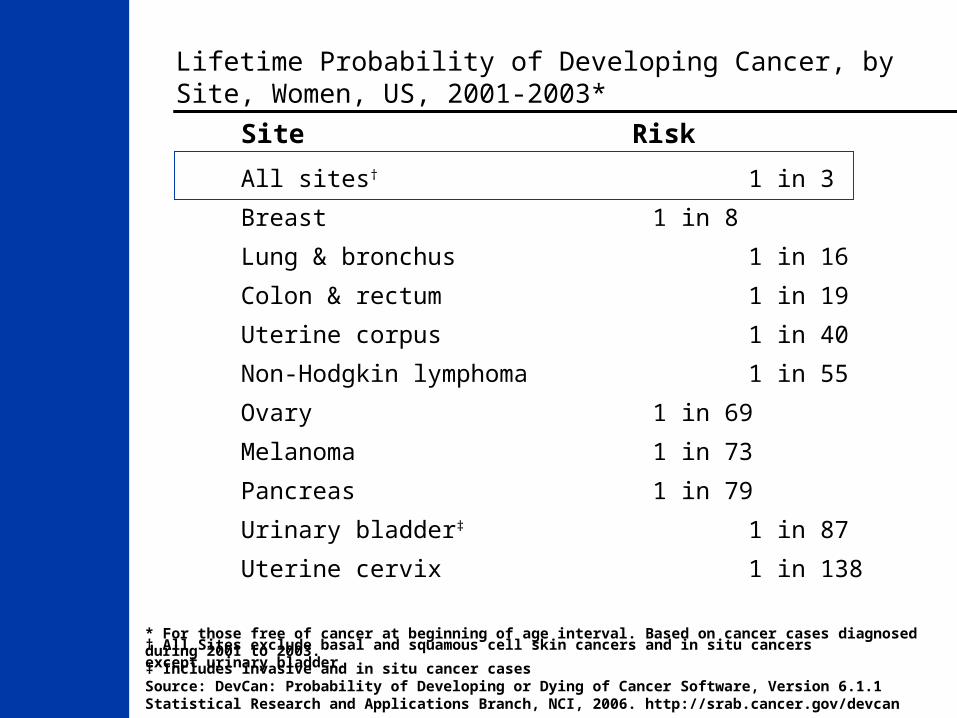
Lifetime Probability of Developing Cancer, by Site, Women, US, 2001-2003*
Site Risk
All sites† 1 in 3
Breast 1 in 8
Lung & bronchus 1 in 16
Colon & rectum 1 in 19
Uterine corpus 1 in 40
Non-Hodgkin lymphoma 1 in 55
Ovary 1 in 69
Melanoma 1 in 73
Pancreas 1 in 79
Urinary bladder‡ 1 in 87
Uterine cervix 1 in 138
Source: DevCan: Probability of Developing or Dying of Cancer Software, Version 6.1.1 Statistical Research and Applications Branch, NCI, 2006. http://srab.cancer.gov/devcan
* For those free of cancer at beginning of age interval. Based on cancer cases diagnosed during 2001 to 2003.† All Sites exclude basal and squamous cell skin cancers and in situ cancers except urinary bladder .‡ Includes invasive and in situ cancer cases
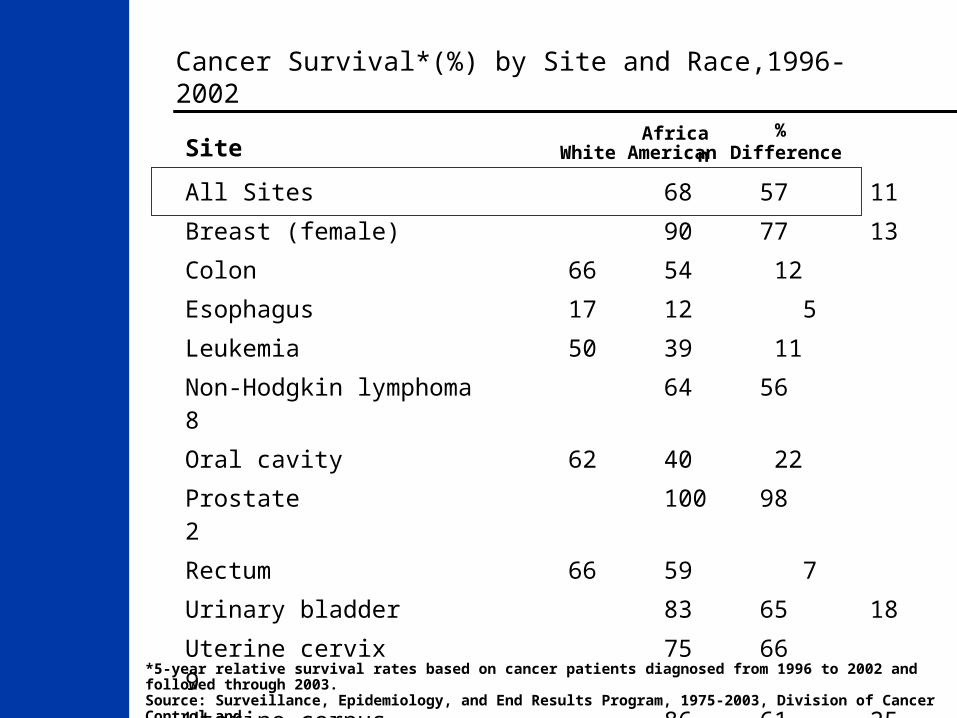
All Sites 68 57 11
Breast (female) 90 77 13
Colon 66 54 12
Esophagus 17 12 5
Leukemia 50 39 11
Non-Hodgkin lymphoma 64 56 8
Oral cavity 62 40 22
Prostate 100 98 2
Rectum 66 59 7
Urinary bladder 83 65 18
Uterine cervix 75 66 9
Uterine corpus 86 61 25
Cancer Survival*(%) by Site and Race,1996-2002
*5-year relative survival rates based on cancer patients diagnosed from 1996 to 2002 and followed through 2003. Source: Surveillance, Epidemiology, and End Results Program, 1975-2003, Division of Cancer Control andPopulation Sciences, National Cancer Institute, 2006.
Site White%
DifferenceAfrican
American
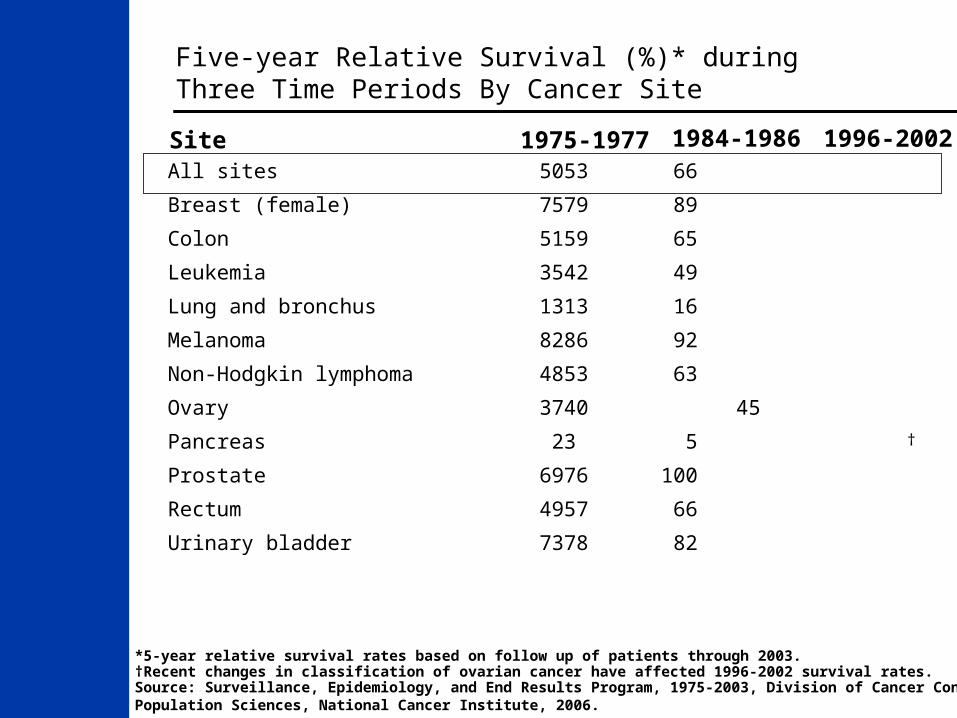
Five-year Relative Survival (%)* during Three Time Periods By Cancer Site
*5-year relative survival rates based on follow up of patients through 2003. †Recent changes in classification of ovarian cancer have affected 1996-2002 survival rates.Source: Surveillance, Epidemiology, and End Results Program, 1975-2003, Division of Cancer Control andPopulation Sciences, National Cancer Institute, 2006.
Site 1975-1977 1984-1986 1996-2002All sites 50 53 66
Breast (female) 75 79 89
Colon 51 59 65
Leukemia 35 42 49
Lung and bronchus 13 13 16
Melanoma 82 86 92
Non-Hodgkin lymphoma 48 53 63
Ovary 37 40 45
Pancreas 2 3 5
Prostate 69 76 100
Rectum 49 57 66
Urinary bladder 73 78 82
†
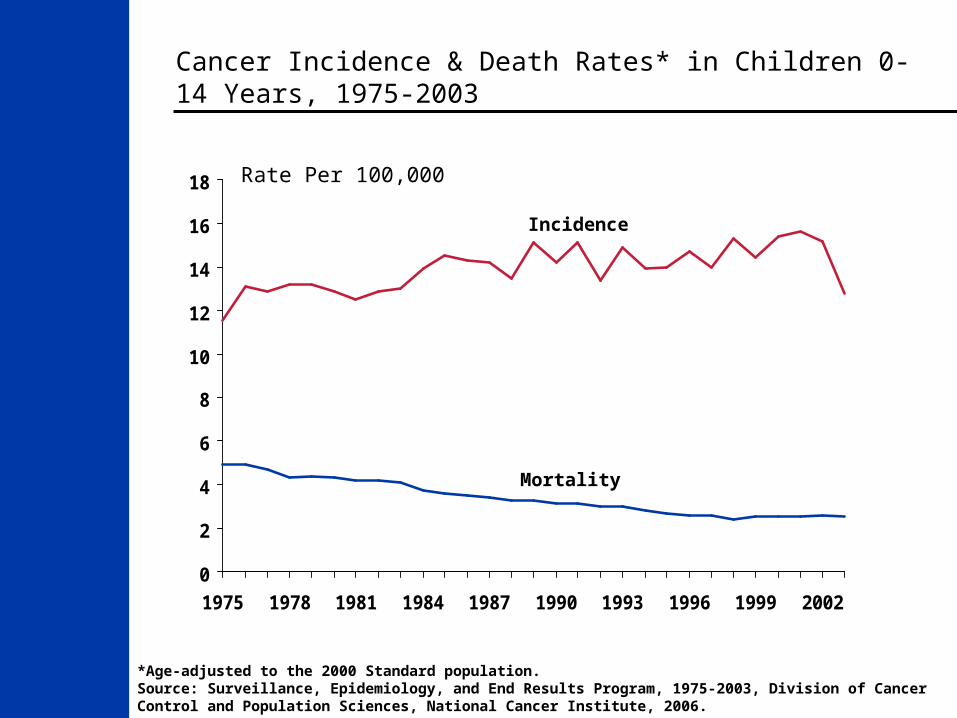
Cancer Incidence & Death Rates* in Children 0-14 Years, 1975-2003
0
2
4
6
8
10
12
14
16
18
1975 1978 1981 1984 1987 1990 1993 1996 1999 2002
Incidence
Mortality
Rate Per 100,000
*Age-adjusted to the 2000 Standard population.Source: Surveillance, Epidemiology, and End Results Program, 1975-2003, Division of Cancer Control and Population Sciences, National Cancer Institute, 2006.
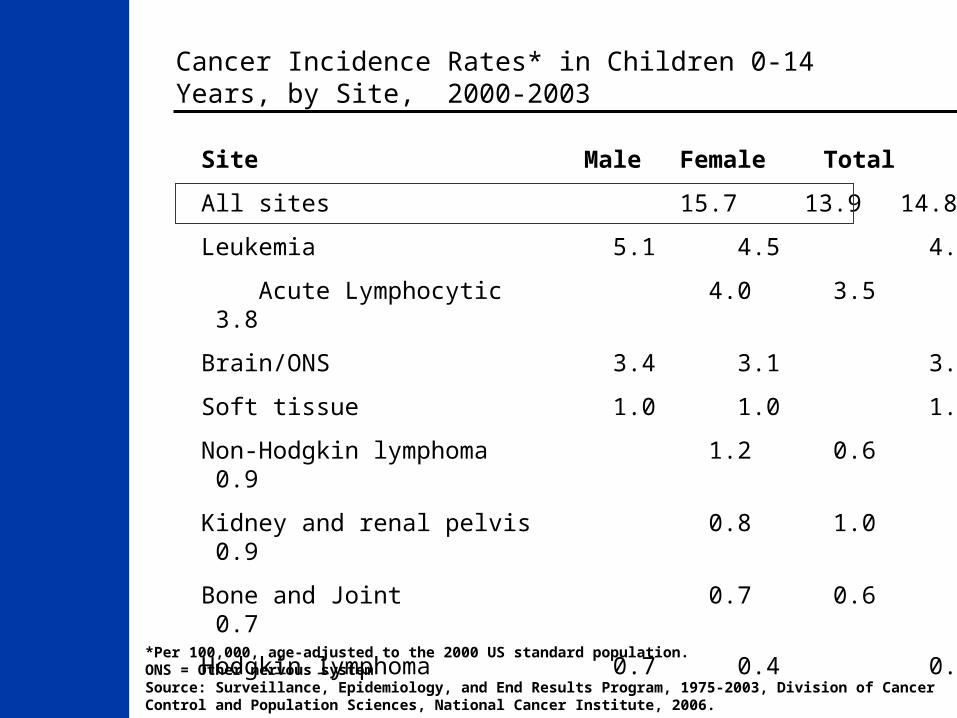
Cancer Incidence Rates* in Children 0-14 Years, by Site, 2000-2003
*Per 100,000, age-adjusted to the 2000 US standard population.ONS = Other nervous systemSource: Surveillance, Epidemiology, and End Results Program, 1975-2003, Division of Cancer Control and Population Sciences, National Cancer Institute, 2006.
Site Male Female Total
All sites 15.7 13.9 14.8
Leukemia 5.1 4.5 4.8
Acute Lymphocytic 4.0 3.5 3.8
Brain/ONS 3.4 3.1 3.3
Soft tissue 1.0 1.0 1.0
Non-Hodgkin lymphoma 1.2 0.6 0.9
Kidney and renal pelvis 0.8 1.0 0.9
Bone and Joint 0.7 0.6 0.7
Hodgkin lymphoma 0.7 0.4 0.5
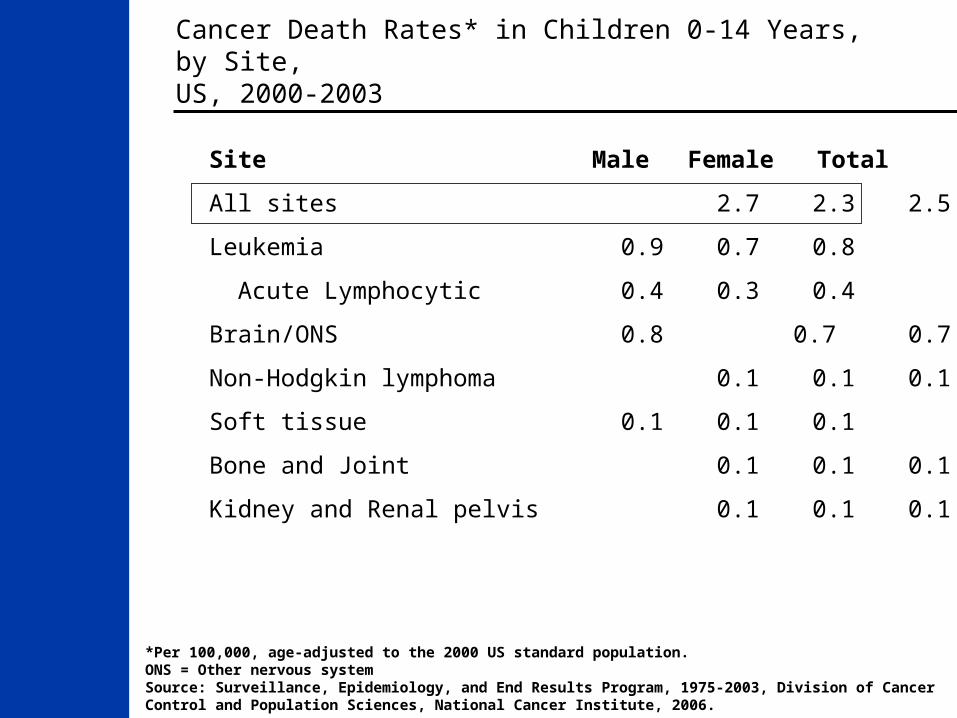
Cancer Death Rates* in Children 0-14 Years, by Site, US, 2000-2003
*Per 100,000, age-adjusted to the 2000 US standard population.ONS = Other nervous systemSource: Surveillance, Epidemiology, and End Results Program, 1975-2003, Division of Cancer Control and Population Sciences, National Cancer Institute, 2006.
Site Male Female Total
All sites 2.7 2.3 2.5
Leukemia 0.9 0.7 0.8
Acute Lymphocytic 0.4 0.3 0.4
Brain/ONS 0.8 0.7 0.7
Non-Hodgkin lymphoma 0.1 0.1 0.1
Soft tissue 0.1 0.1 0.1
Bone and Joint 0.1 0.1 0.1
Kidney and Renal pelvis 0.1 0.1 0.1
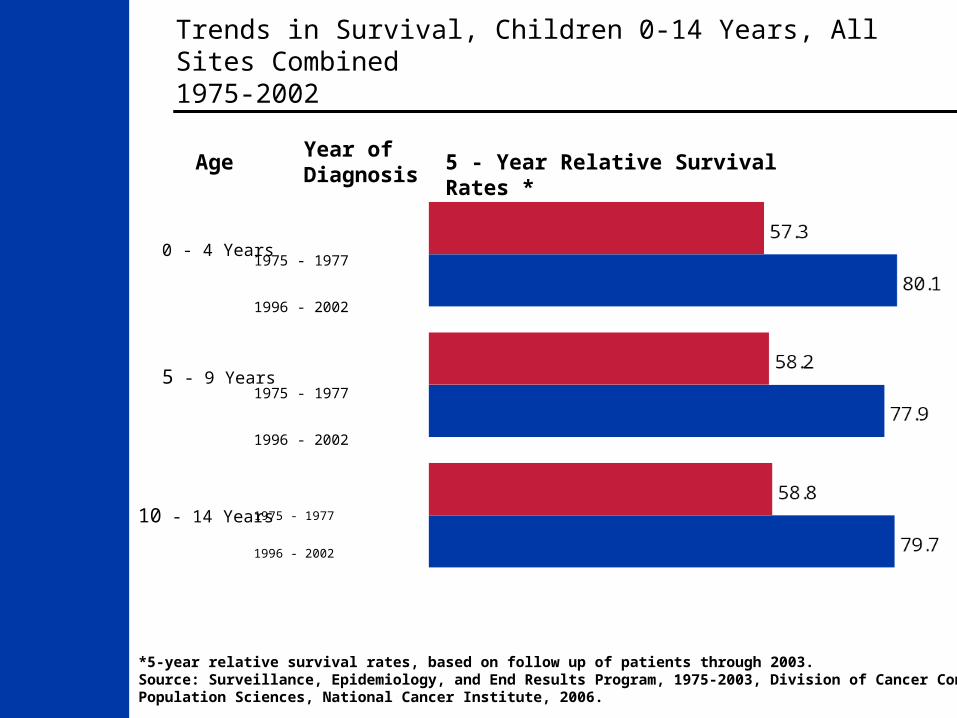
Trends in Survival, Children 0-14 Years, All Sites Combined1975-2002
*5-year relative survival rates, based on follow up of patients through 2003.Source: Surveillance, Epidemiology, and End Results Program, 1975-2003, Division of Cancer Control andPopulation Sciences, National Cancer Institute, 2006.
5 - Year Relative Survival Rates *AgeYear ofDiagnosis
1975 - 1977
1996 - 2002
1975 - 1977
1996 - 2002
0 - 4 Years
1975 - 1977
1996 - 2002
5 - 9 Years
10 - 14 Years
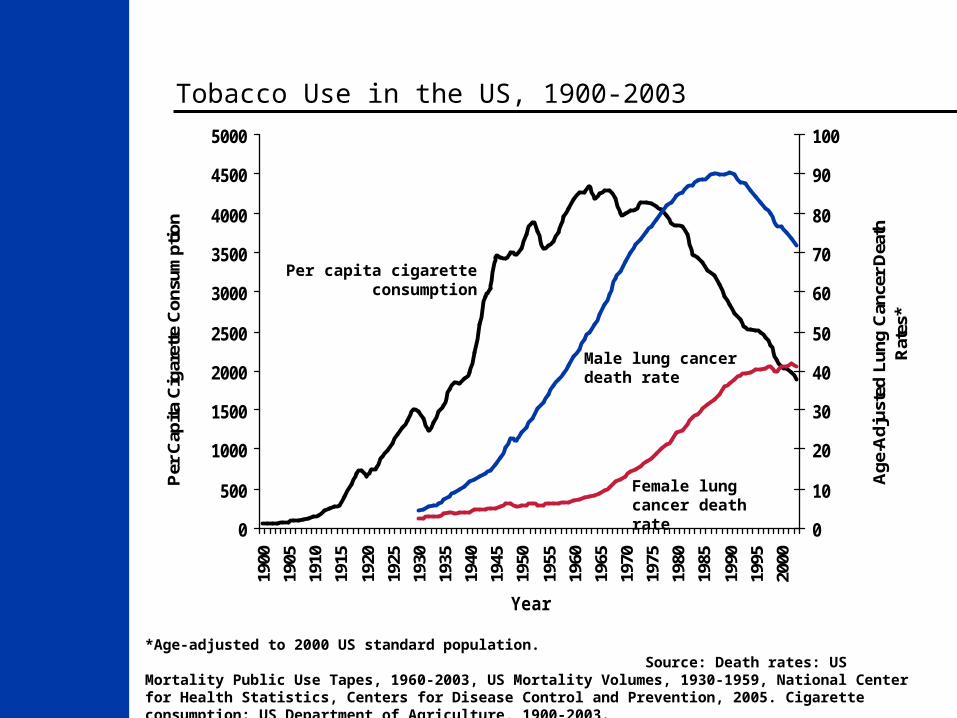
Tobacco Use in the US, 1900-2003
0
500
1000
1500
2000
2500
3000
3500
4000
4500
5000
1900
1905
1910
1915
1920
1925
1930
1935
1940
1945
1950
1955
1960
1965
1970
1975
1980
1985
1990
1995
2000
Year
Per
Cap
ita C
igar
ette
Con
sum
ptio
n
0
10
20
30
40
50
60
70
80
90
100
Age
-Adj
uste
d Lu
ng C
ance
r D
eath
R
ates
*
*Age-adjusted to 2000 US standard population. Source: Death rates: US Mortality Public Use Tapes, 1960-2003, US Mortality Volumes, 1930-1959, National Center for Health Statistics, Centers for Disease Control and Prevention, 2005. Cigarette consumption: US Department of Agriculture, 1900-2003.
Per capita cigarette consumption
Male lung cancer death rate
Female lung cancer death rate
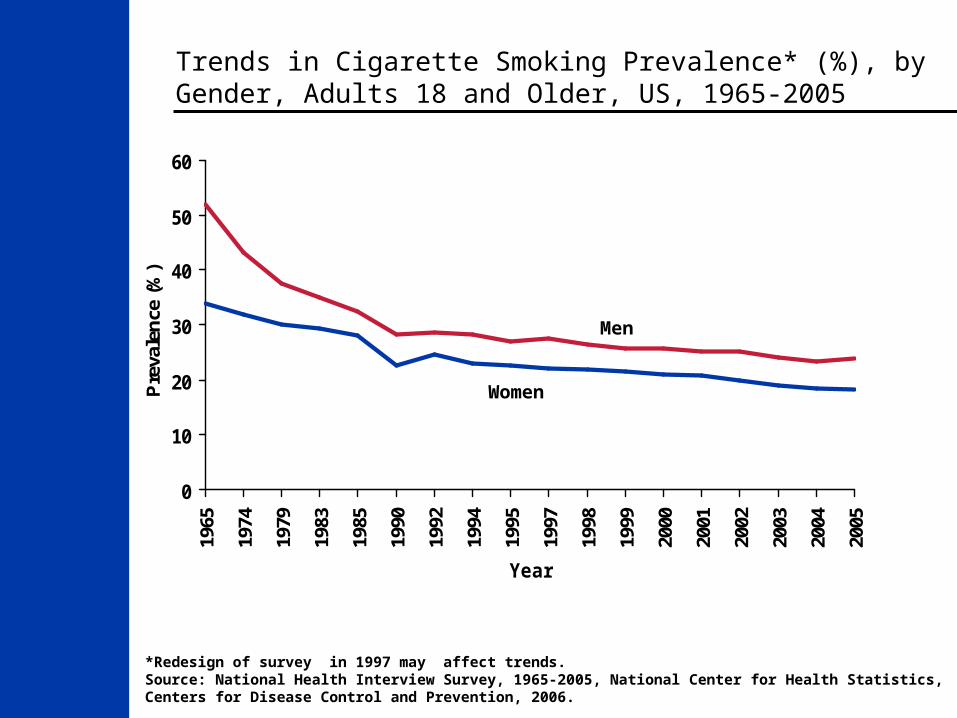
Trends in Cigarette Smoking Prevalence* (%), by Gender, Adults 18 and Older, US, 1965-2005
*Redesign of survey in 1997 may affect trends.Source: National Health Interview Survey, 1965-2005, National Center for Health Statistics, Centers for Disease Control and Prevention, 2006.
0
10
20
30
40
50
60
1965
1974
1979
1983
1985
1990
1992
1994
1995
1997
1998
1999
2000
2001
2002
2003
2004
2005
Year
Pre
vale
nce
(%
)
Men
Women
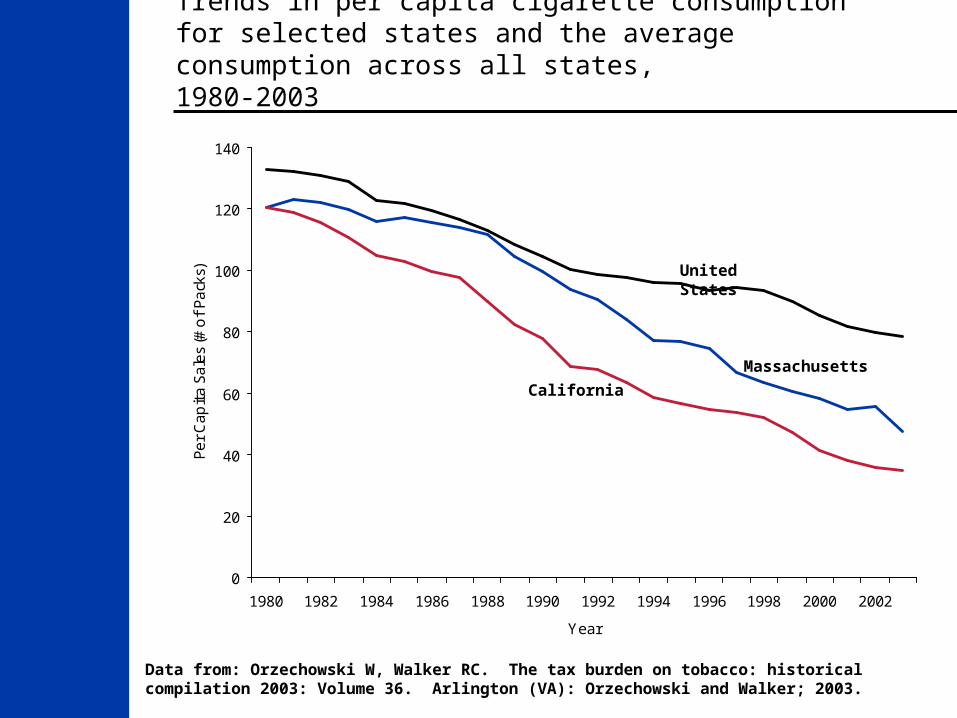
Trends in per capita cigarette consumption for selected states and the average consumption across all states, 1980-2003
0
20
40
60
80
100
120
140
1980 1982 1984 1986 1988 1990 1992 1994 1996 1998 2000 2002
Year
Per Cap
ita
Sale
s (#
of Pa
cks) United States
Massachusetts
California
Data from: Orzechowski W, Walker RC. The tax burden on tobacco: historical compilation 2003: Volume 36. Arlington (VA): Orzechowski and Walker; 2003.
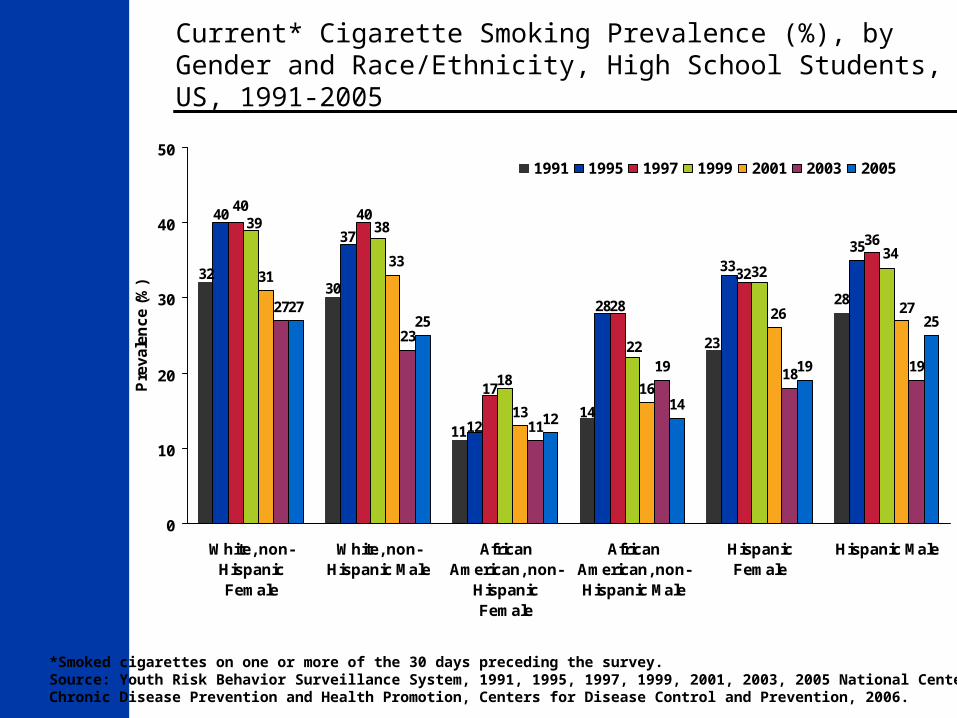
Current* Cigarette Smoking Prevalence (%), by Gender and Race/Ethnicity, High School Students, US, 1991-2005
*Smoked cigarettes on one or more of the 30 days preceding the survey.Source: Youth Risk Behavior Surveillance System, 1991, 1995, 1997, 1999, 2001, 2003, 2005 National Center for Chronic Disease Prevention and Health Promotion, Centers for Disease Control and Prevention, 2006.
28
35
31
13
16
27
23
11
19 18 19
2725
1214
19
25
3230
1114
23
40
37
12
28
33
4040
17
32
36
28
34
39 38
22
32
18
33
2726
0
10
20
30
40
50
White, non-HispanicFemale
White, non-Hispanic Male
AfricanAmerican, non-
HispanicFemale
AfricanAmerican, non-Hispanic Male
HispanicFemale
Hispanic Male
Pre
va
len
ce
(%
)
1991 1995 1997 1999 2001 2003 2005
Note: Data from participating states and the District of Columbia were aggregated to represent the United States.Source: Behavioral Risk Factor Surveillance System CD-ROM (1984-1995, 1996, 1998) and Public Use Data Tape (2000, 2003, 2005), National Center for Chronic Disease Prevention and Health Promotion, Centers for Disease Control and Prevention, 1997, 1999, 2000, 2001, 2004, 2006.
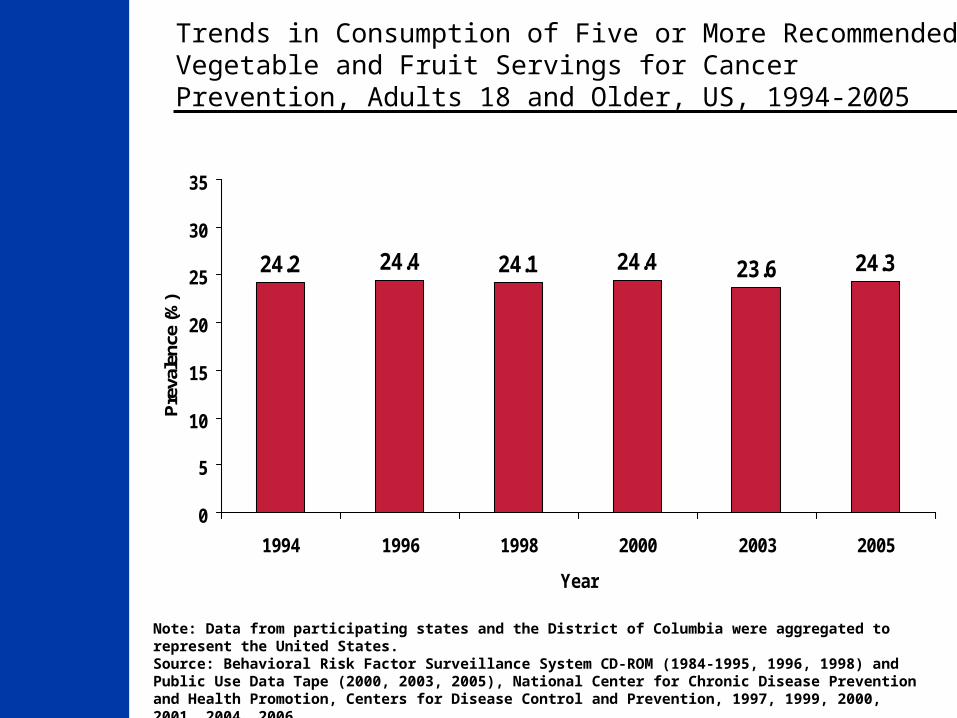
24.2 24.4 24.1 24.4 23.6 24.3
0
5
10
15
20
25
30
35
1994 1996 1998 2000 2003 2005
Year
Pre
vale
nce
(%)
Trends in Consumption of Five or More Recommended Vegetable and Fruit Servings for Cancer Prevention, Adults 18 and Older, US, 1994-2005
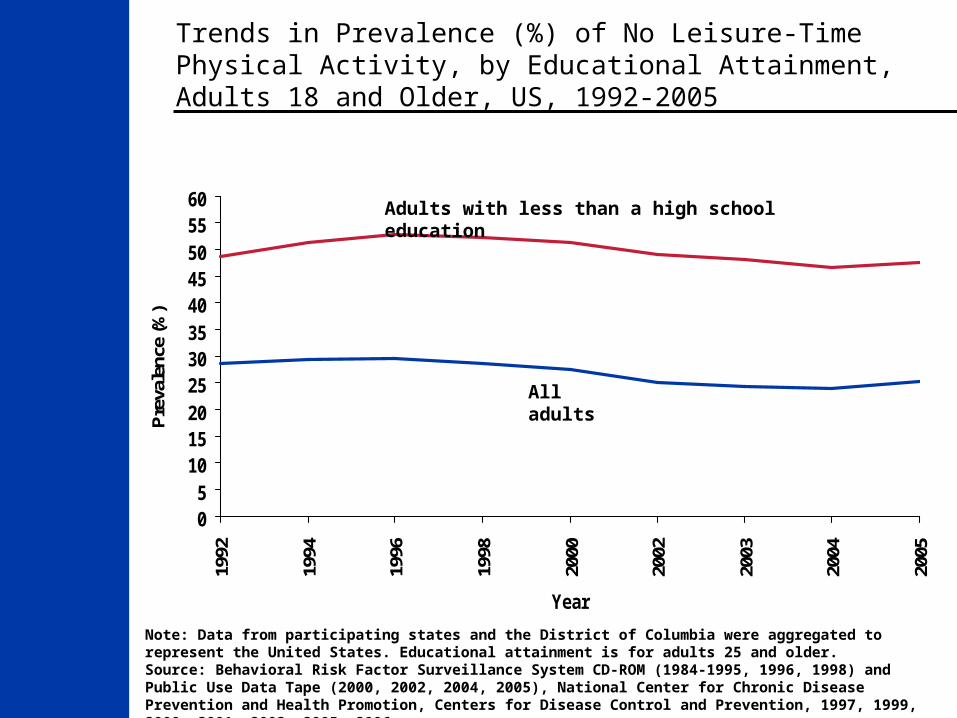
Trends in Prevalence (%) of No Leisure-Time Physical Activity, by Educational Attainment, Adults 18 and Older, US, 1992-2005
Note: Data from participating states and the District of Columbia were aggregated to represent the United States. Educational attainment is for adults 25 and older.Source: Behavioral Risk Factor Surveillance System CD-ROM (1984-1995, 1996, 1998) and Public Use Data Tape (2000, 2002, 2004, 2005), National Center for Chronic Disease Prevention and Health Promotion, Centers for Disease Control and Prevention, 1997, 1999, 2000, 2001, 2003, 2005, 2006.
05
1015202530354045505560
1992
1994
1996
1998
2000
2002
2003
2004
2005
Year
Pre
vale
nce
(%)
Adults with less than a high school education
All adults
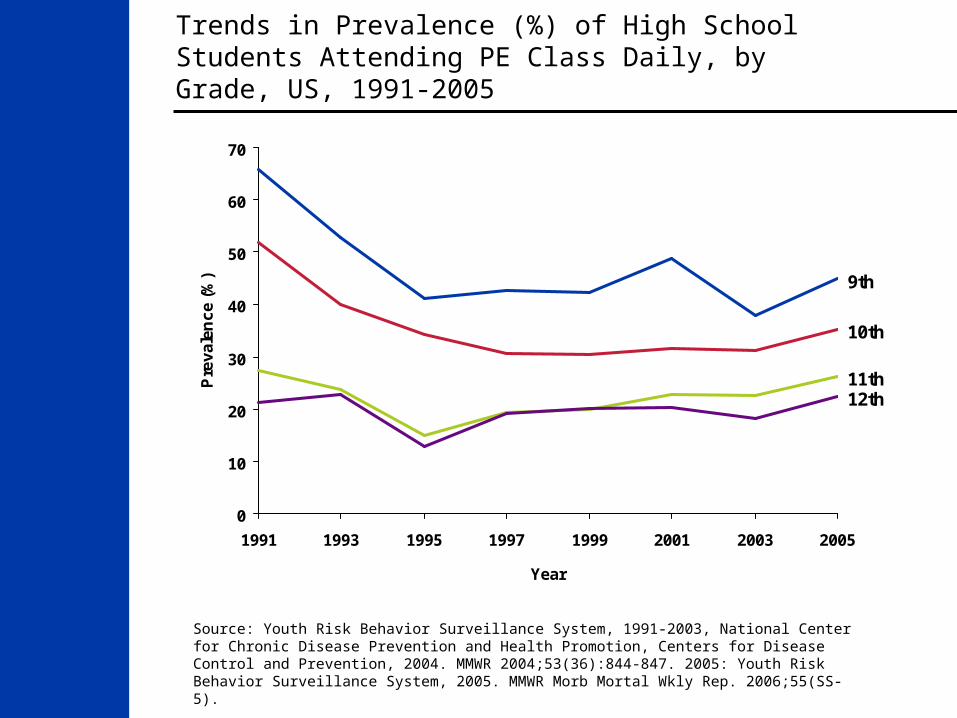
Trends in Prevalence (%) of High School Students Attending PE Class Daily, by Grade, US, 1991-2005
9th
10th
11th12th
0
10
20
30
40
50
60
70
1991 1993 1995 1997 1999 2001 2003 2005
Year
Pre
va
len
ce
(%
)
Source: Youth Risk Behavior Surveillance System, 1991-2003, National Center for Chronic Disease Prevention and Health Promotion, Centers for Disease Control and Prevention, 2004. MMWR 2004;53(36):844-847. 2005: Youth Risk Behavior Surveillance System, 2005. MMWR Morb Mortal Wkly Rep. 2006;55(SS-5).
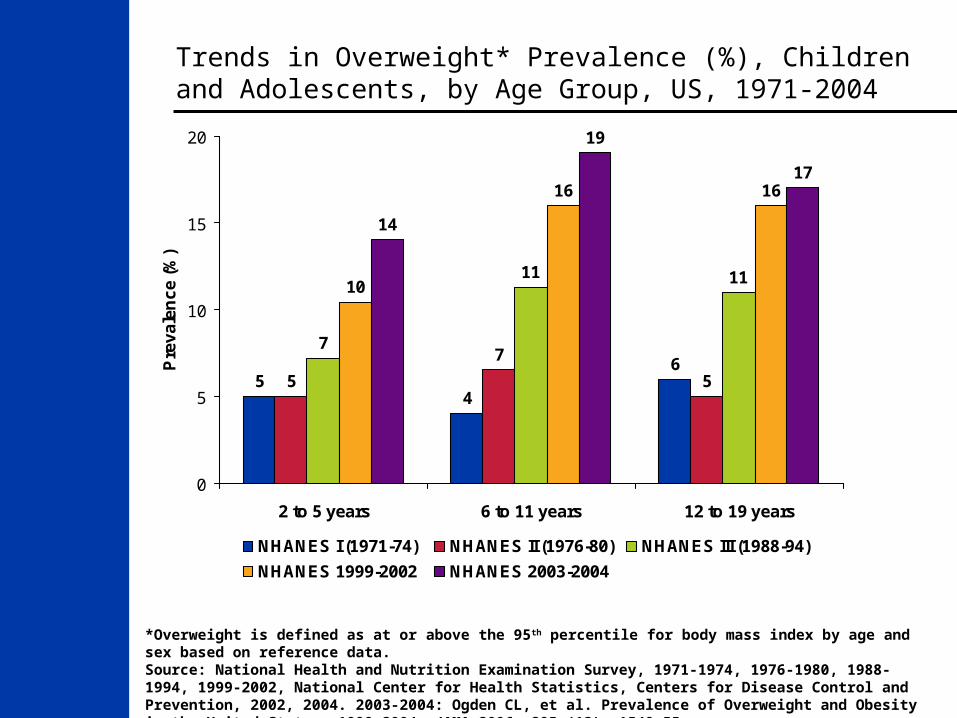
Trends in Overweight* Prevalence (%), Children and Adolescents, by Age Group, US, 1971-2004
*Overweight is defined as at or above the 95th percentile for body mass index by age and sex based on reference data. Source: National Health and Nutrition Examination Survey, 1971-1974, 1976-1980, 1988-1994, 1999-2002, National Center for Health Statistics, Centers for Disease Control and Prevention, 2002, 2004. 2003-2004: Ogden CL, et al. Prevalence of Overweight and Obesity in the United States, 1999-2004. JAMA 2006; 295 (13): 1549-55.
54
65
7
5
7
11 1110
16 16
14
19
17
0
5
10
15
20
2 to 5 years 6 to 11 years 12 to 19 years
Pre
va
len
ce
(%
)
NHANES I (1971-74) NHANES II (1976-80) NHANES III (1988-94)
NHANES 1999-2002 NHANES 2003-2004
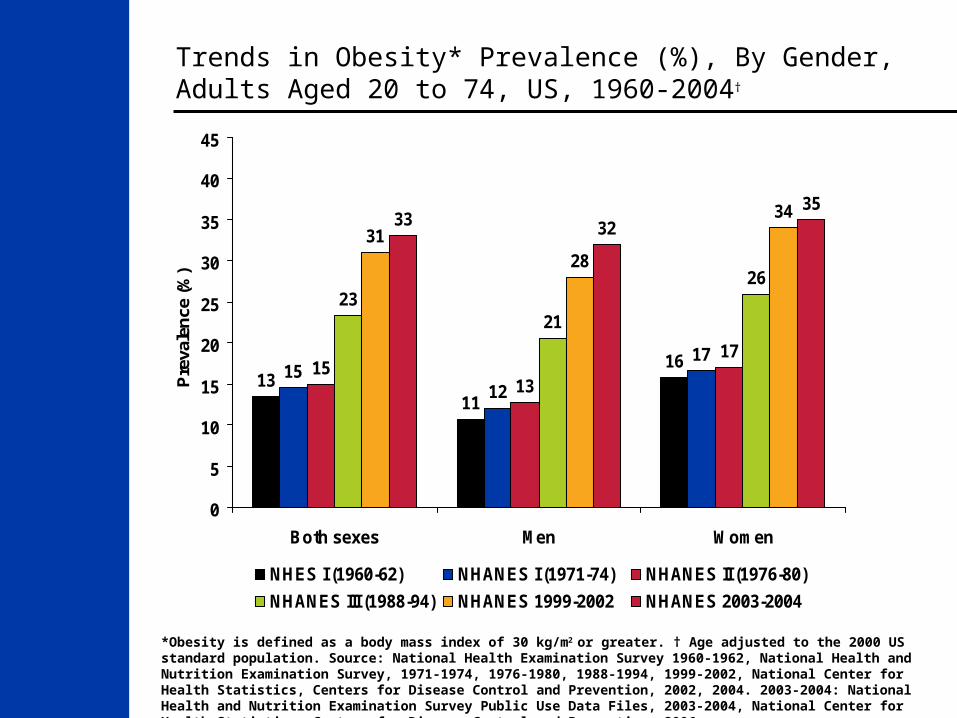
Trends in Obesity* Prevalence (%), By Gender, Adults Aged 20 to 74, US, 1960-2004†
*Obesity is defined as a body mass index of 30 kg/m2 or greater. † Age adjusted to the 2000 US standard population. Source: National Health Examination Survey 1960-1962, National Health and Nutrition Examination Survey, 1971-1974, 1976-1980, 1988-1994, 1999-2002, National Center for Health Statistics, Centers for Disease Control and Prevention, 2002, 2004. 2003-2004: National Health and Nutrition Examination Survey Public Use Data Files, 2003-2004, National Center for Health Statistics, Centers for Disease Control and Prevention, 2006.
1311
1615
12
1715
13
17
2321
26
3128
3433 3235
0
5
10
15
20
25
30
35
40
45
Both sexes Men Women
Pre
vale
nce
(%)
NHES I (1960-62) NHANES I (1971-74) NHANES II (1976-80)
NHANES III (1988-94) NHANES 1999-2002 NHANES 2003-2004
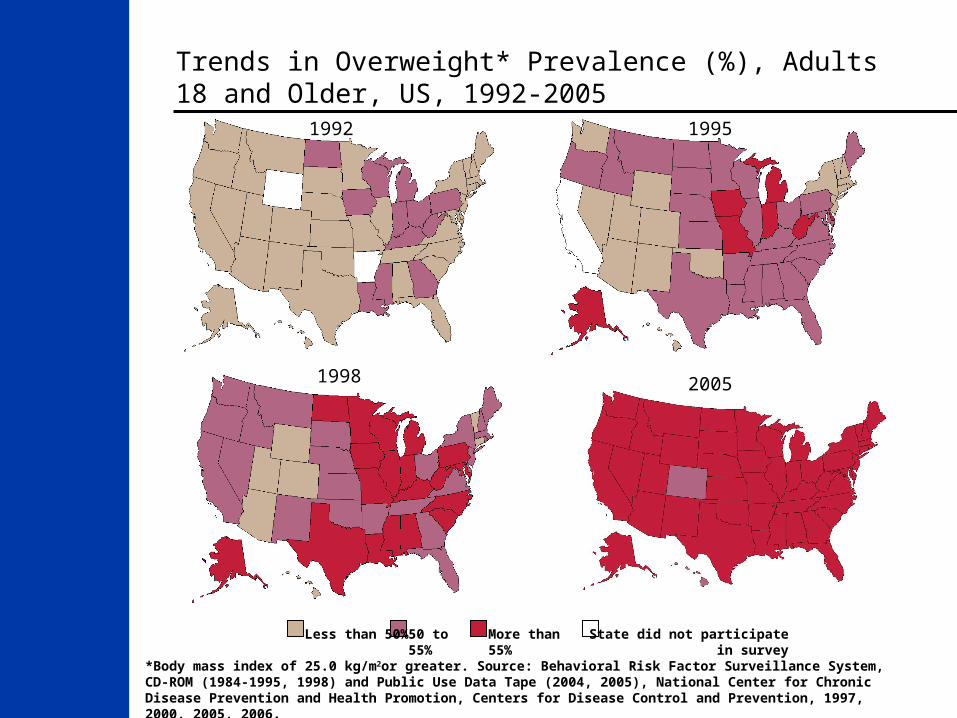
Trends in Overweight* Prevalence (%), Adults 18 and Older, US, 1992-2005
1992 1995
1998
Less than 50% 50 to 55% More than 55% State did not participate in survey
*Body mass index of 25.0 kg/m2or greater. Source: Behavioral Risk Factor Surveillance System, CD-ROM (1984-1995, 1998) and Public Use Data Tape (2004, 2005), National Center for Chronic Disease Prevention and Health Promotion, Centers for Disease Control and Prevention, 1997, 2000, 2005, 2006.
2005
Screening Guidelines for the Early Detection of Breast Cancer, American Cancer Society
Yearly mammograms are recommended starting at age 40.
A clinical breast exam should be part of a periodic health exam, about every three years for women in their 20s and 30s, and every year for women 40 and older.
Women should know how their breasts normally feel and report any breast changes promptly to their health care providers. Breast self-exam is an option for women starting in their 20s.
Women at increased risk (e.g., family history, genetic tendency, past breast cancer) should talk with their doctors about the benefits and limitations of starting mammography screening earlier, having additional tests (i.e., breast ultrasound and MRI), or having more frequent exams.
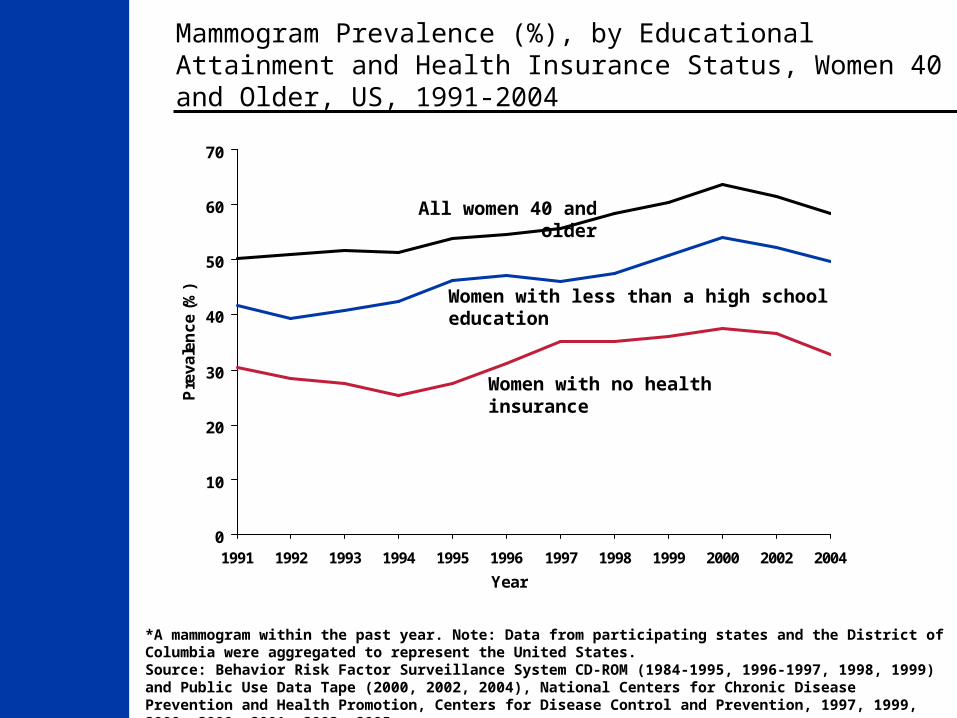
Mammogram Prevalence (%), by Educational Attainment and Health Insurance Status, Women 40 and Older, US, 1991-2004
*A mammogram within the past year. Note: Data from participating states and the District of Columbia were aggregated to represent the United States.Source: Behavior Risk Factor Surveillance System CD-ROM (1984-1995, 1996-1997, 1998, 1999) and Public Use Data Tape (2000, 2002, 2004), National Centers for Chronic Disease Prevention and Health Promotion, Centers for Disease Control and Prevention, 1997, 1999, 2000, 2000, 2001, 2003, 2005.
0
10
20
30
40
50
60
70
1991 1992 1993 1994 1995 1996 1997 1998 1999 2000 2002 2004
Year
Pre
va
len
ce
(%
)
Women with less than a high school education
Women with no health insurance
All women 40 and older
Screening Guidelines for the Early Detection of Cervical Cancer, American Cancer Society
Screening should begin approximately three years after a women begins having vaginal intercourse, but no later than 21 years of age.
Screening should be done every year with regular Pap tests or every two years using liquid-based tests.
At or after age 30, women who have had three normal test results in a row may get screened every 2-3 years. However, doctors may suggest a woman get screened more frequently if she has certain risk factors, such as HIV infection or a weakened immune system.
Women 70 and older who have had three or more consecutive Pap tests in the last ten years may choose to stop cervical cancer screening.
Screening after a total hysterectomy (with removal of the cervix) is not necessary unless the surgery was done as a treatment for cervical cancer.
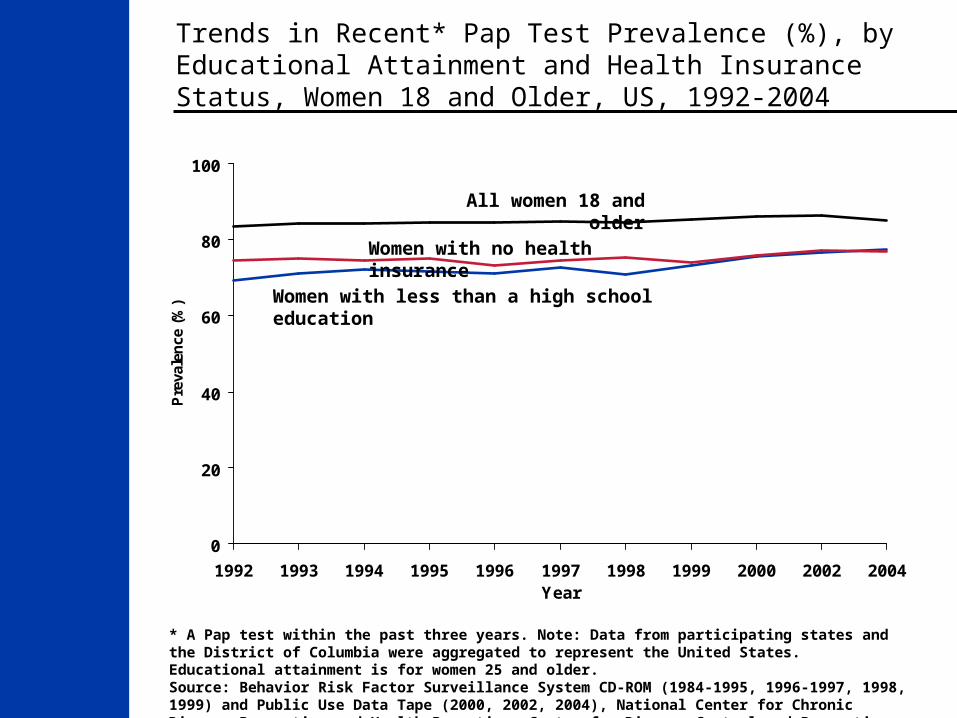
Trends in Recent* Pap Test Prevalence (%), by Educational Attainment and Health Insurance Status, Women 18 and Older, US, 1992-2004
* A Pap test within the past three years. Note: Data from participating states and the District of Columbia were aggregated to represent the United States. Educational attainment is for women 25 and older.Source: Behavior Risk Factor Surveillance System CD-ROM (1984-1995, 1996-1997, 1998, 1999) and Public Use Data Tape (2000, 2002, 2004), National Center for Chronic Disease Prevention and Health Promotion, Center for Disease Control and Prevention, 1997, 1999, 2000, 2000, 2001, 2003, 2005.
0
20
40
60
80
100
1992 1993 1994 1995 1996 1997 1998 1999 2000 2002 2004Year
Pre
vale
nce
(%
)
Women with no health insurance
Women with less than a high school education
All women 18 and older
Screening Guidelines for the Early Detection of Colorectal Cancer, American Cancer Society
Beginning at age 50, men and women should follow one of the following examination schedules:
A fecal occult blood test (FOBT) every year
A flexible sigmoidoscopy (FSIG) every five years
Annual fecal occult blood test and flexible sigmoidoscopy every five years*
A double-contrast barium enema every five years
A colonoscopy every ten years
*Combined testing is preferred over either annual FOBT or FSIG every 5 years alone.
People who are at moderate or high risk for colorectal cancer should talk with a doctor about a different testing schedule
20
16
8
21
16
9
18
12
22
16
9
19
14
9
24
0
5
10
15
20
25
30
Total Less than a high schooleducation
No health insurance
Pre
va
len
ce
(%
)
1997 1999 2001 2002 2004
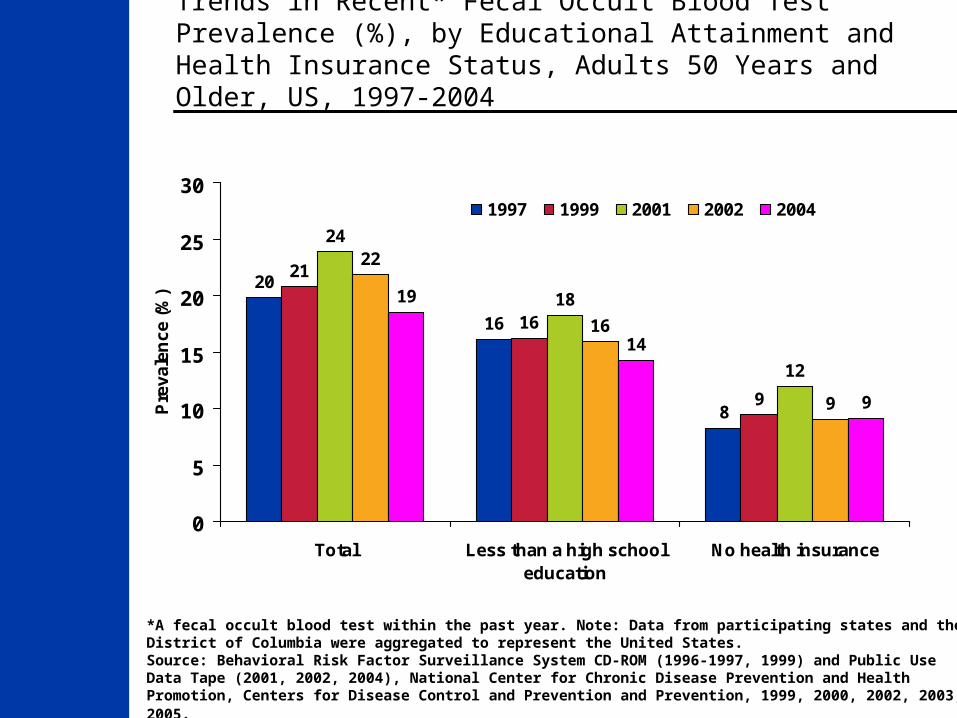
Trends in Recent* Fecal Occult Blood Test Prevalence (%), by Educational Attainment and Health Insurance Status, Adults 50 Years and Older, US, 1997-2004
*A fecal occult blood test within the past year. Note: Data from participating states and the District of Columbia were aggregated to represent the United States. Source: Behavioral Risk Factor Surveillance System CD-ROM (1996-1997, 1999) and Public Use Data Tape (2001, 2002, 2004), National Center for Chronic Disease Prevention and Health Promotion, Centers for Disease Control and Prevention and Prevention, 1999, 2000, 2002, 2003, 2005.
3128
16
34
29
16
39
32
17
41
33
18
45
36
19
0
5
10
15
20
25
30
35
40
45
50
Total Less than a high schooleducation
No health insurance
Prev
alen
ce (%
)
1997 1999 2001 2002 2004
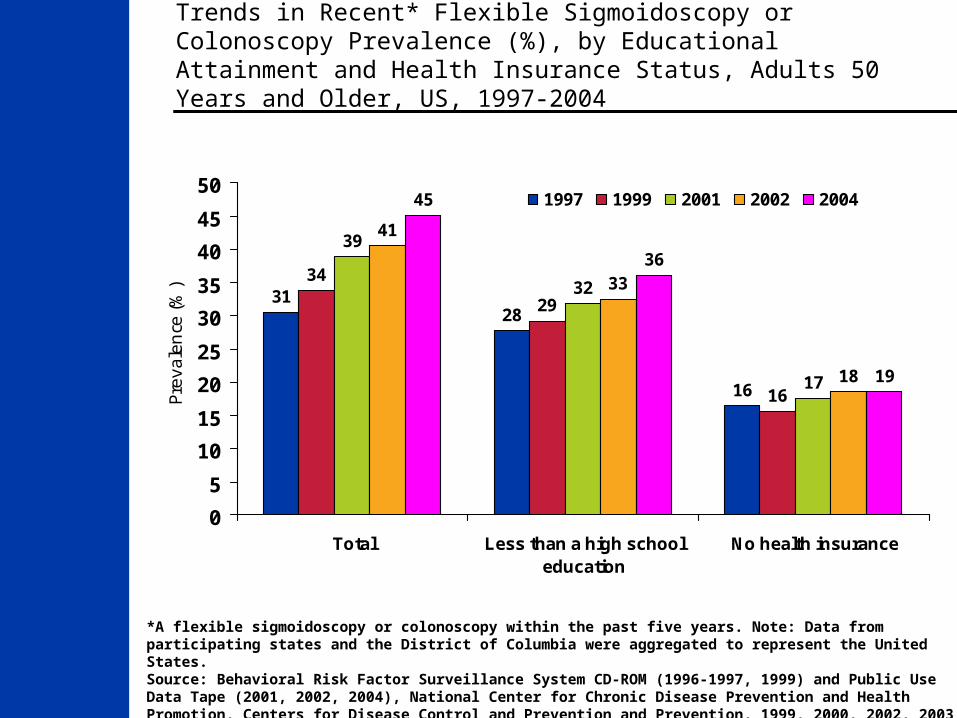
Trends in Recent* Flexible Sigmoidoscopy or Colonoscopy Prevalence (%), by Educational Attainment and Health Insurance Status, Adults 50 Years and Older, US, 1997-2004
*A flexible sigmoidoscopy or colonoscopy within the past five years. Note: Data from participating states and the District of Columbia were aggregated to represent the United States. Source: Behavioral Risk Factor Surveillance System CD-ROM (1996-1997, 1999) and Public Use Data Tape (2001, 2002, 2004), National Center for Chronic Disease Prevention and Health Promotion, Centers for Disease Control and Prevention and Prevention, 1999, 2000, 2002, 2003, 2005.
Screening Guidelines for the Early Detection of Prostate Cancer, American Cancer Society
The prostate-specific antigen (PSA) test and the digital rectal examination (DRE) should be offered annually, beginning at age 50, to men who have a life expectancy of at least 10 years.
Men at high risk (African-American men and men with a strong family history of one or more first-degree relatives diagnosed with prostate cancer at an early age) should begin testing at age 45.
For men at average risk and high risk, information should be provided about what is known and what is uncertain about the benefits and limitations of early detection and treatment of prostate cancer so that they can make an informed decision about testing.
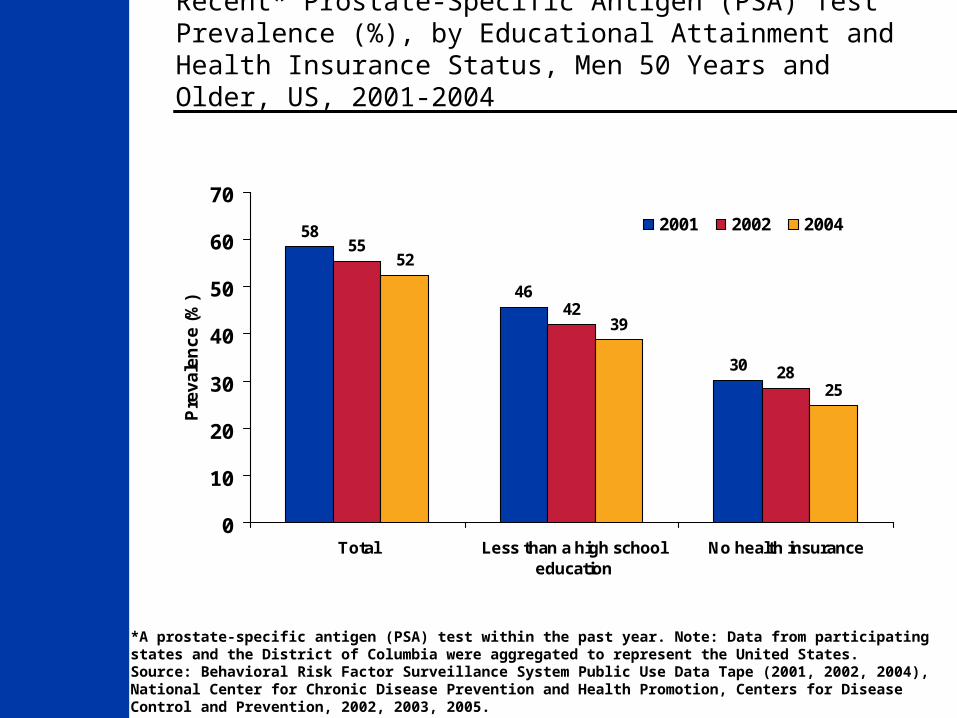
58
46
30
42
28
52
39
25
55
0
10
20
30
40
50
60
70
Total Less than a high schooleducation
No health insurance
Pre
va
len
ce
(%
)
2001 2002 2004
Recent* Prostate-Specific Antigen (PSA) Test Prevalence (%), by Educational Attainment and Health Insurance Status, Men 50 Years and Older, US, 2001-2004
*A prostate-specific antigen (PSA) test within the past year. Note: Data from participating states and the District of Columbia were aggregated to represent the United States. Source: Behavioral Risk Factor Surveillance System Public Use Data Tape (2001, 2002, 2004), National Center for Chronic Disease Prevention and Health Promotion, Centers for Disease Control and Prevention, 2002, 2003, 2005.
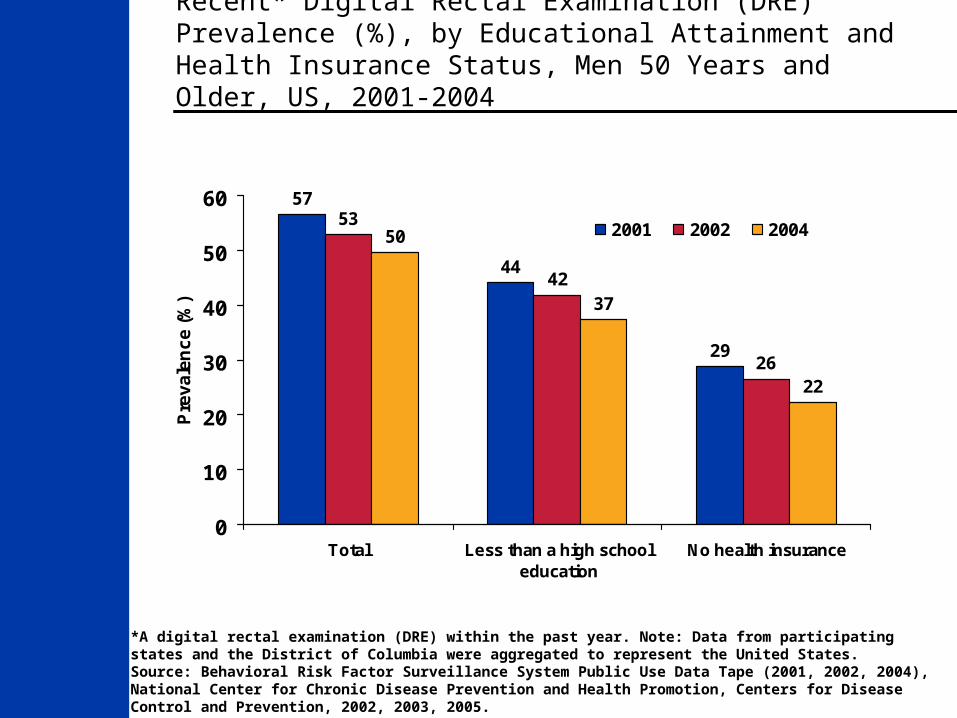
57
44
29
53
42
26
50
37
22
0
10
20
30
40
50
60
Total Less than a high schooleducation
No health insurance
Pre
va
len
ce
(%
)
2001 2002 2004
Recent* Digital Rectal Examination (DRE) Prevalence (%), by Educational Attainment and Health Insurance Status, Men 50 Years and Older, US, 2001-2004
*A digital rectal examination (DRE) within the past year. Note: Data from participating states and the District of Columbia were aggregated to represent the United States. Source: Behavioral Risk Factor Surveillance System Public Use Data Tape (2001, 2002, 2004), National Center for Chronic Disease Prevention and Health Promotion, Centers for Disease Control and Prevention, 2002, 2003, 2005.
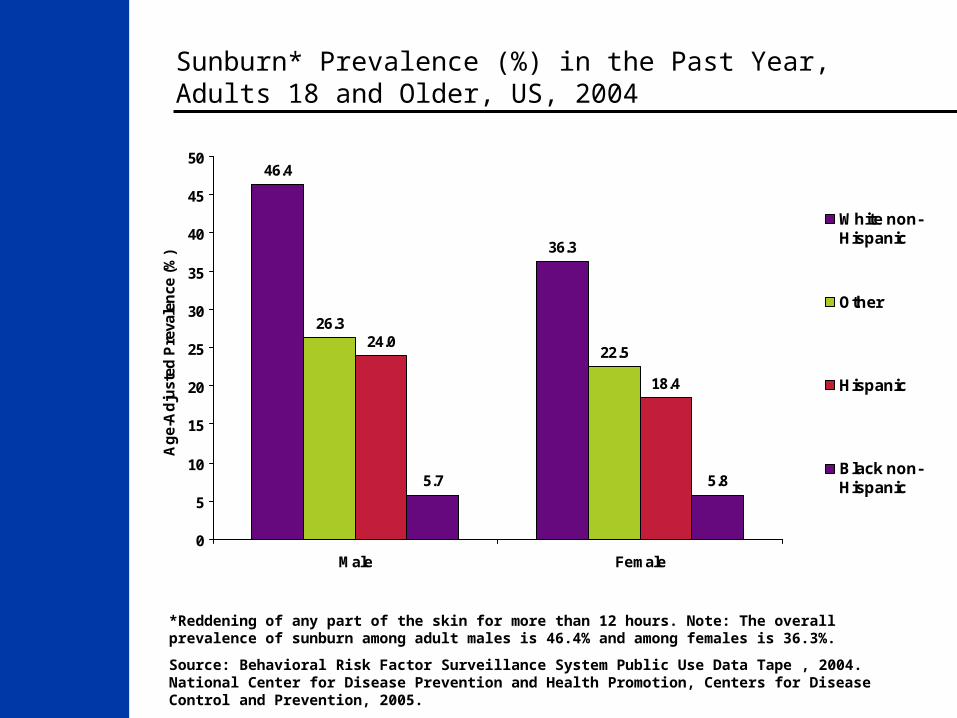
Sunburn* Prevalence (%) in the Past Year, Adults 18 and Older, US, 2004
46.4
36.3
22.524.0
18.4
5.7 5.8
26.3
0
5
10
15
20
25
30
35
40
45
50
Male Female
Ag
e-A
dju
sted
Pre
vale
nce
(%
)
White non-Hispanic
Other
Hispanic
Black non-Hispanic
*Reddening of any part of the skin for more than 12 hours. Note: The overall prevalence of sunburn among adult males is 46.4% and among females is 36.3%.
Source: Behavioral Risk Factor Surveillance System Public Use Data Tape , 2004. National Center for Disease Prevention and Health Promotion, Centers for Disease Control and Prevention, 2005.
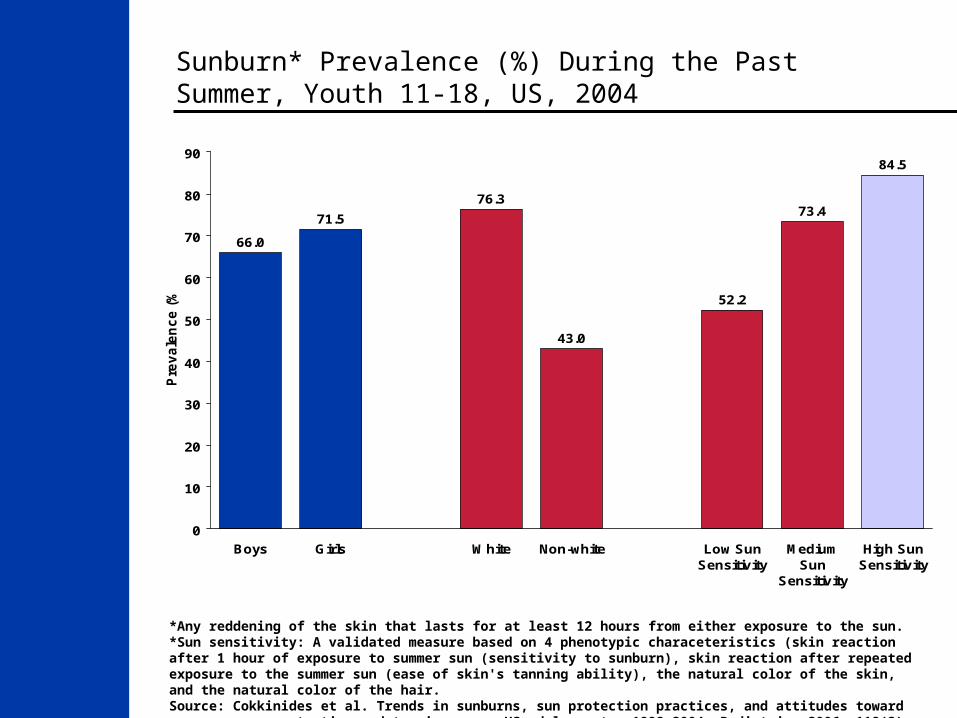
Sunburn* Prevalence (%) During the Past Summer, Youth 11-18, US, 2004
66.0
71.5
76.3
43.0
52.2
73.4
84.5
0
10
20
30
40
50
60
70
80
90
Boys Girls White Non-white Low SunSensitivity
MediumSun
Sensitivity
High SunSensitivity
Pre
va
len
ce
(%
)
*Any reddening of the skin that lasts for at least 12 hours from either exposure to the sun. *Sun sensitivity: A validated measure based on 4 phenotypic characeteristics (skin reaction after 1 hour of exposure to summer sun (sensitivity to sunburn), skin reaction after repeated exposure to the summer sun (ease of skin's tanning ability), the natural color of the skin, and the natural color of the hair.Source: Cokkinides et al. Trends in sunburns, sun protection practices, and attitudes toward sun exposure protection and tanning among US adolescents, 1998-2004. Pediatrics 2006; 118(3): 853-864.
Thank you