cancer screening
TRANSCRIPT

Why screen for cancer?
Burden of Cancer
Cancer Registry
Cancer Incidence
Cancer Mortality
Cancer Prevalence
Screening for Cancer
Incidence
• Number of new cases diagnosed with a
disease (e.g. cancer) in a defined
population over a given period of time.
• Usually expressed as a rate e.g. per
100,000.
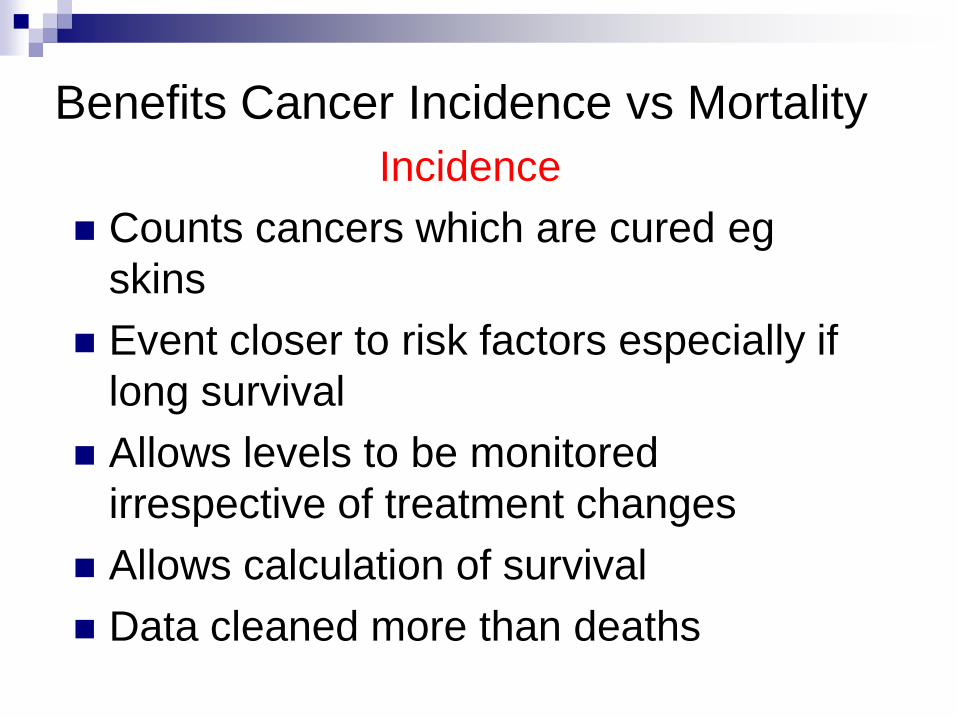
Benefits Cancer Incidence vs Mortality
Incidence
Counts cancers which are cured eg
skins
Event closer to risk factors especially if
long survival
Allows levels to be monitored
irrespective of treatment changes
Allows calculation of survival
Data cleaned more than deaths
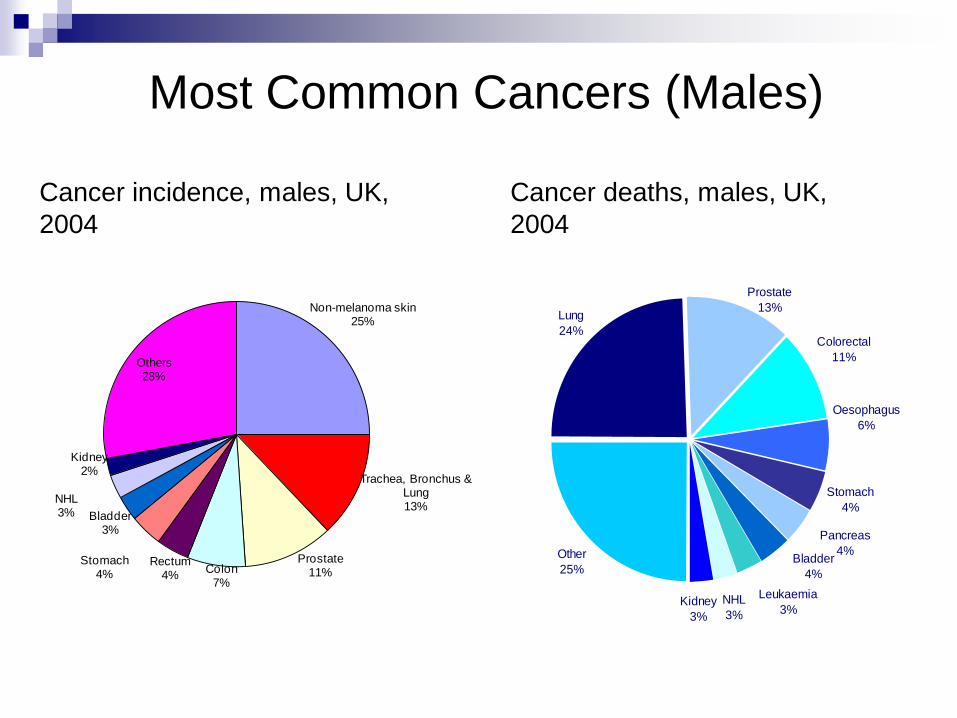
Non-melanoma skin25%
Trachea, Bronchus & Lung13%
Prostate11%Colon
7%
Rectum4%
Stomach4%
Bladder3%
NHL3%
Kidney2%
Others28%
Most Common Cancers (Males)
Lung
24%
Stomach
4%
Other
25%
Leukaemia
3%NHL
3%Kidney
3%
Bladder
4%
Pancreas
4%
Oesophagus
6%
Colorectal
11%
Prostate
13%
Cancer deaths, males, UK,
2004
Cancer incidence, males, UK,
2004
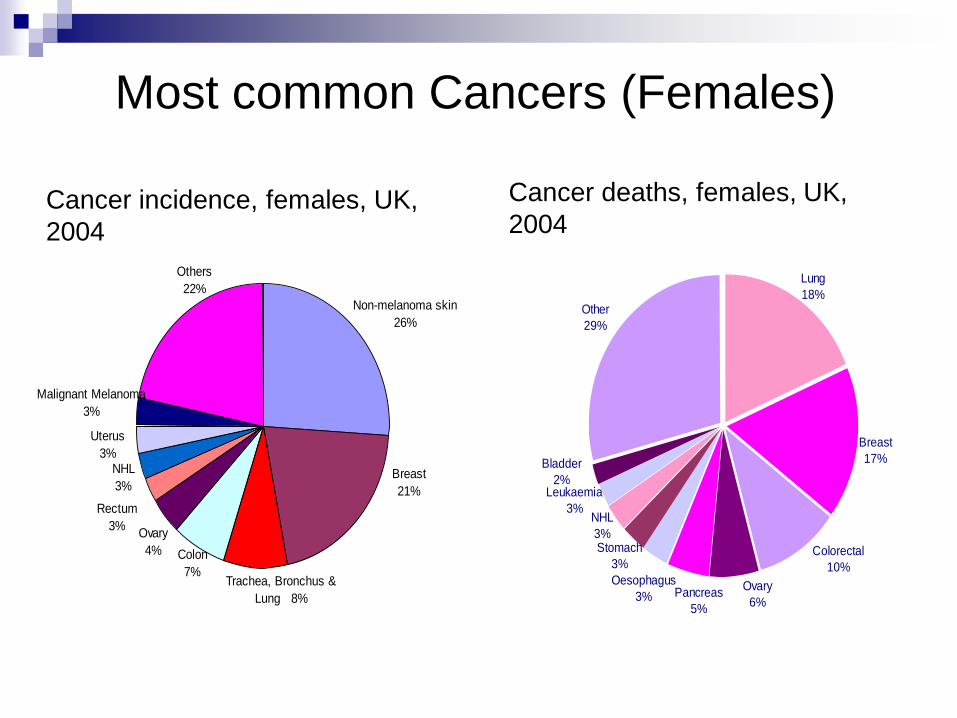
Ovary
4%
Trachea, Bronchus &
Lung 8%
Breast
21%
Non-melanoma skin
26%
Others
22%
Rectum
3%
Colon
7%
NHL
3%
Uterus
3%
Malignant Melanoma
3%
Cancer incidence, females, UK,
2004
Most common Cancers (Females)
Colorectal
10%
Ovary
6%
Oesophagus
3%
Stomach
3%
Bladder
2%Leukaemia
3%NHL
3%
Pancreas
5%
Breast
17%
Lung
18%Other
29%
Cancer deaths, females, UK,
2004
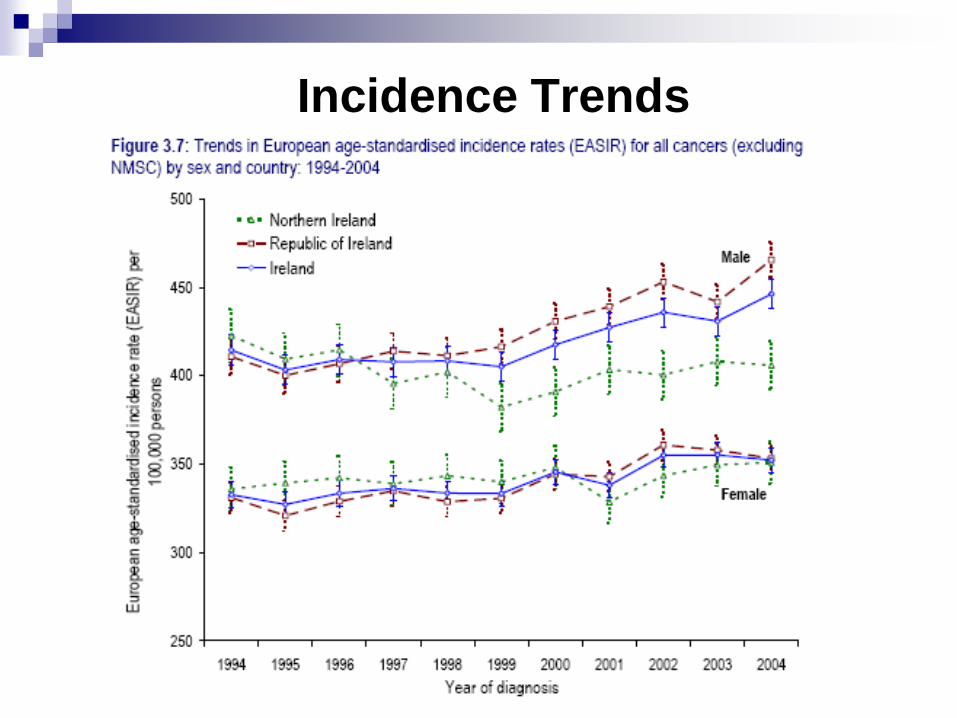
Incidence Trends
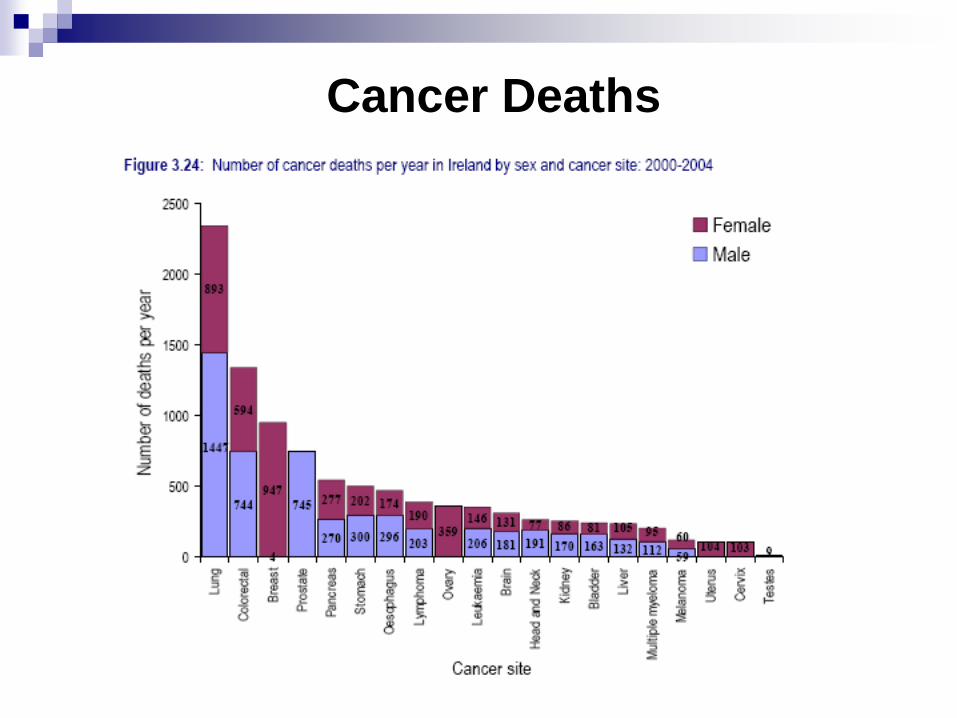
Cancer Deaths
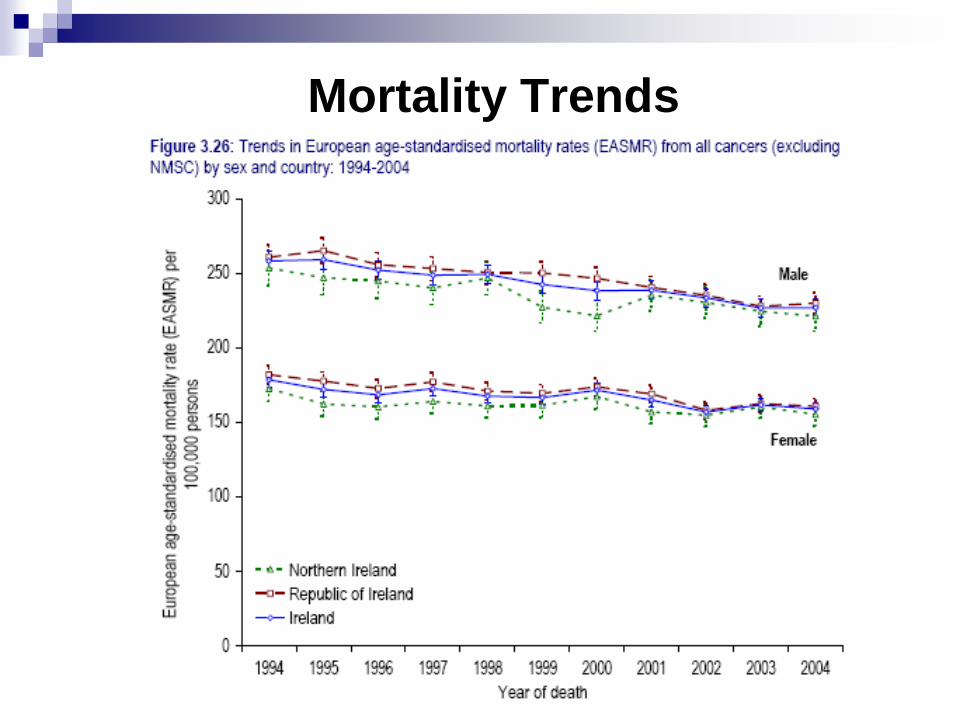
Mortality Trends
Prevalence
• Total number of cases (old and new) with a
disease (e.g. cancer) in a defined population
within a given period of time.
• Point prevalence – at a specific point in time
• Period prevalence – over a defined time period
• Usually expressed as a proportion/percentage.
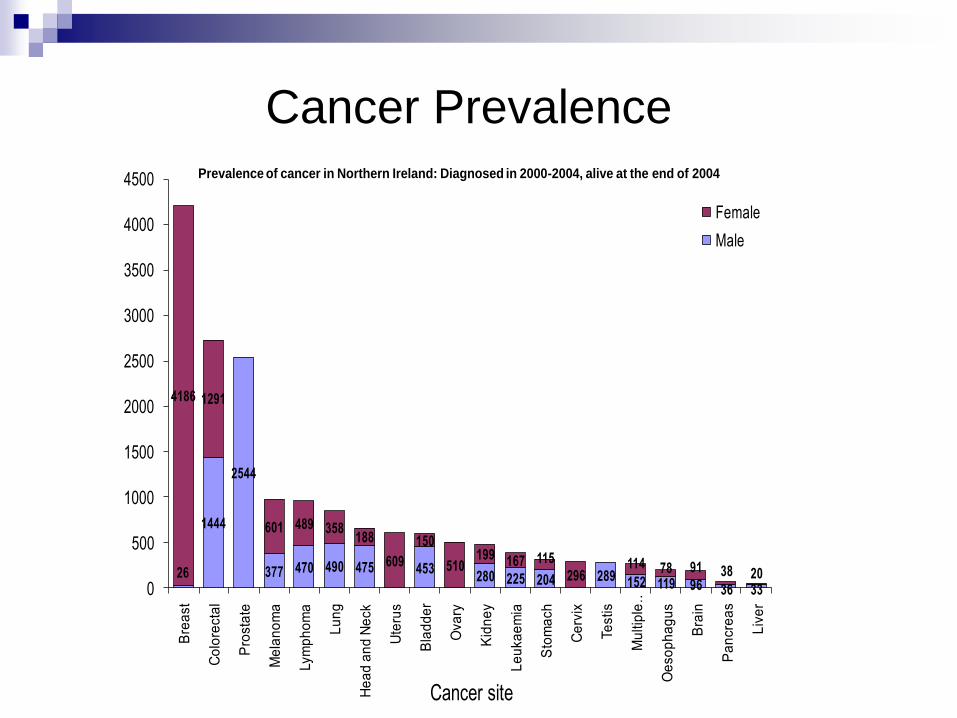
Cancer Prevalence
26
1444
2544
377 470 490 475 453280 225 204 289 152 119 96 36 33
4186 1291
601 489 358188
609
150
510199 167 115
296114 78 91 38 20
0
500
1000
1500
2000
2500
3000
3500
4000
4500B
rea
st
Co
lore
cta
l
Pro
sta
te
Me
lan
om
a
Lym
ph
om
a
Lu
ng
He
ad
an
d N
eck
Ute
rus
Bla
dd
er
Ova
ry
Kid
ne
y
Le
uka
em
ia
Sto
ma
ch
Ce
rvix
Te
stis
Mu
ltip
le …
Oe
so
ph
ag
us
Bra
in
Pa
ncre
as
Liv
er
Cancer site
Prevalence of cancer in Northern Ireland: Diagnosed in 2000-2004, alive at the end of 2004
Female
Male
Mortality/Survival
Mortality rate: number of deaths caused by disease in a population over a specified time period. Usually expressed per 1000 or per 100,000 per year.
Survival rate: percentage of people within a specified population who are alive for a specified time period after diagnosis. Usually expressed as a five-year relative survival rate.
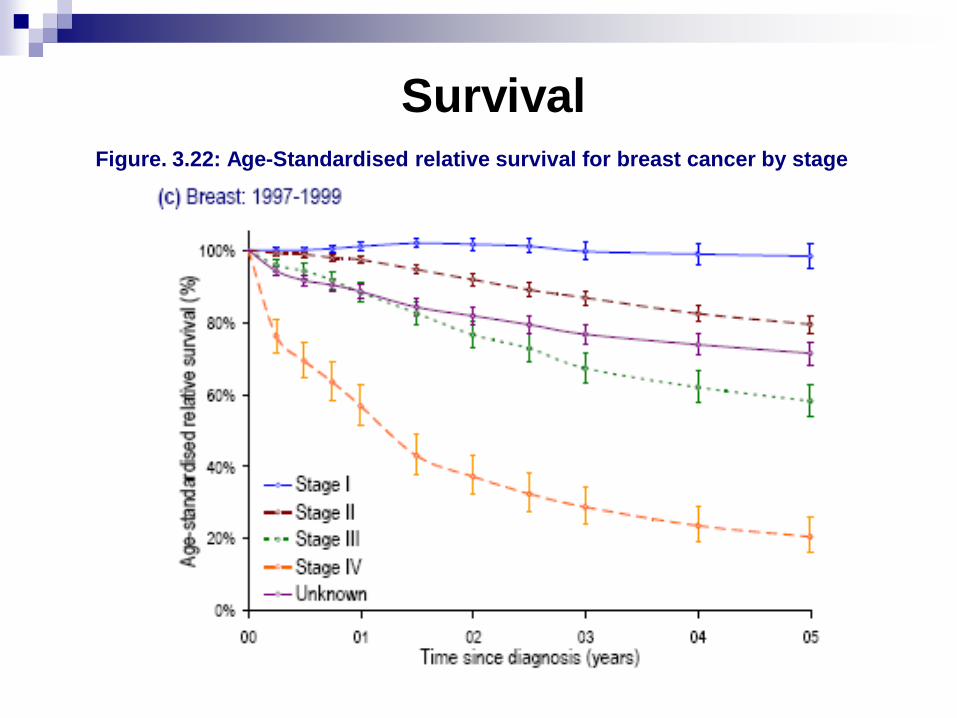
Survival Figure. 3.22: Age-Standardised relative survival for breast cancer by stage
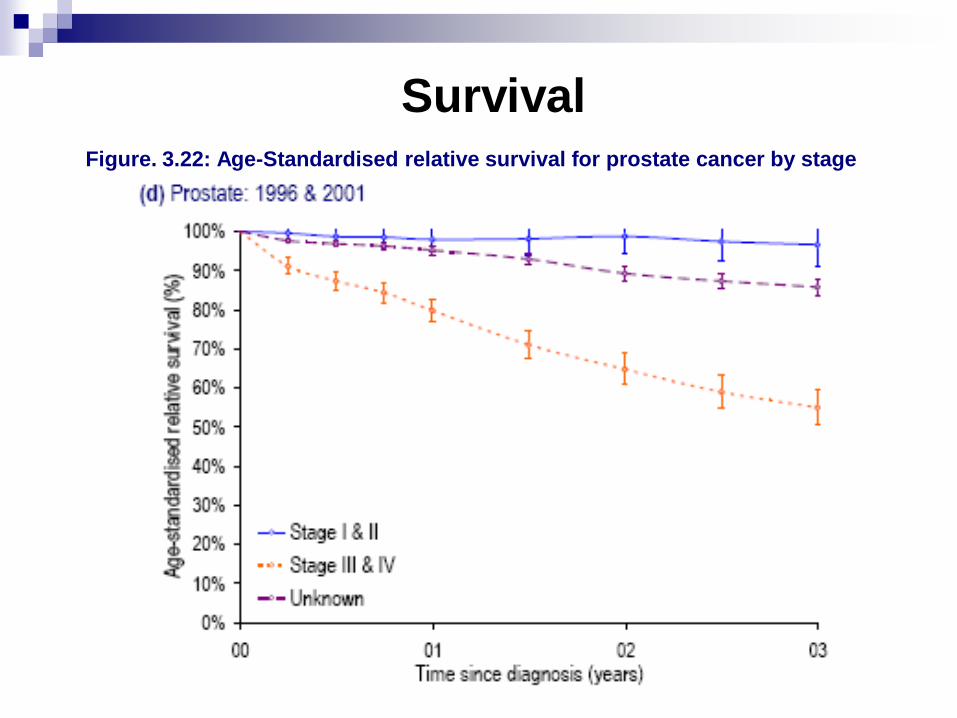
Survival Figure. 3.22: Age-Standardised relative survival for prostate cancer by stage
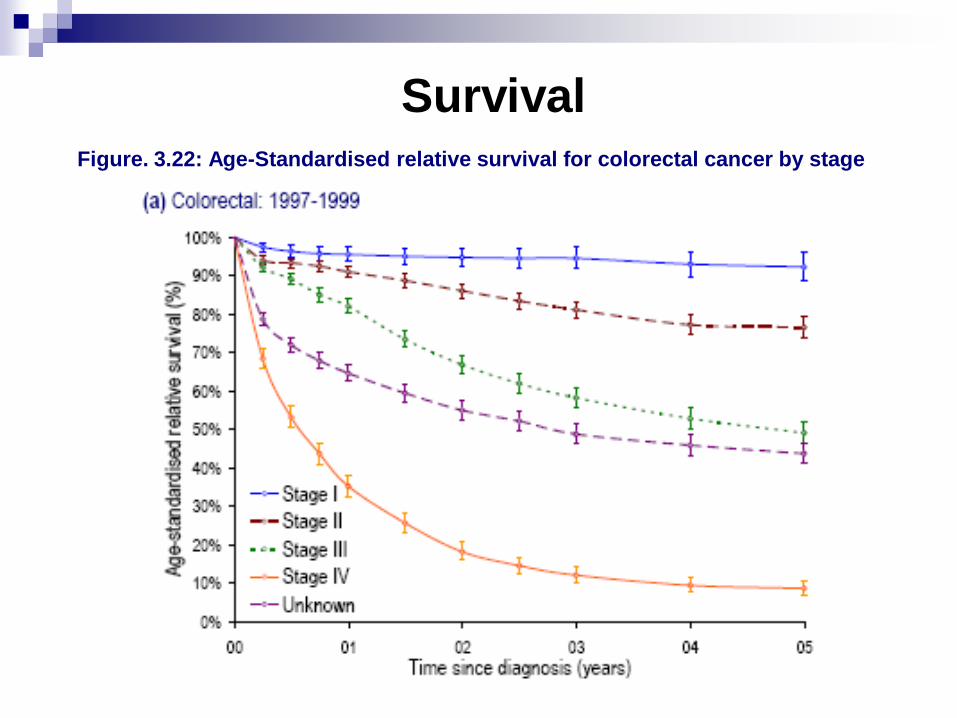
Survival Figure. 3.22: Age-Standardised relative survival for colorectal cancer by stage
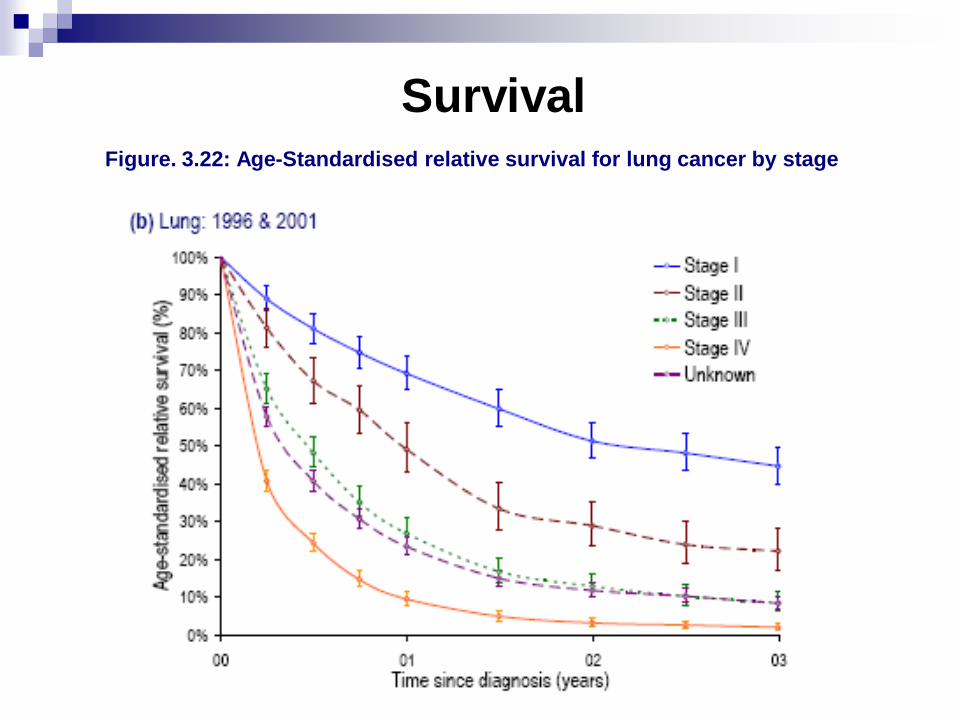
Survival Figure. 3.22: Age-Standardised relative survival for lung cancer by stage
Screening - scrutiny of people in
order to detect the presence of
disease, disability or other
attributable under study.
Rationale - Early diagnosis leads
to more effective treatment and a
greater cure rate.
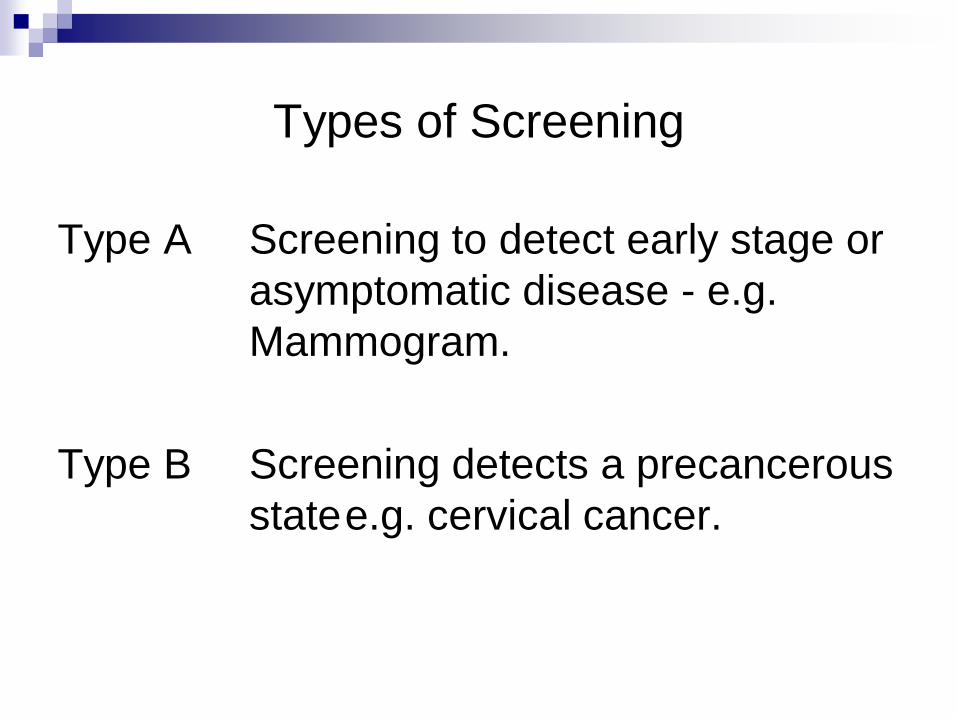
Types of Screening
Type A Screening to detect early stage or
asymptomatic disease - e.g.
Mammogram.
Type B Screening detects a precancerous
state e.g. cervical cancer.

Screening Test
Cheap, quick, acceptable.
Reliable (same result if repeated).
Validity (how good is test at
discriminating who has the disease from
those who do not). Measured using
Sensitivity and Specificity.
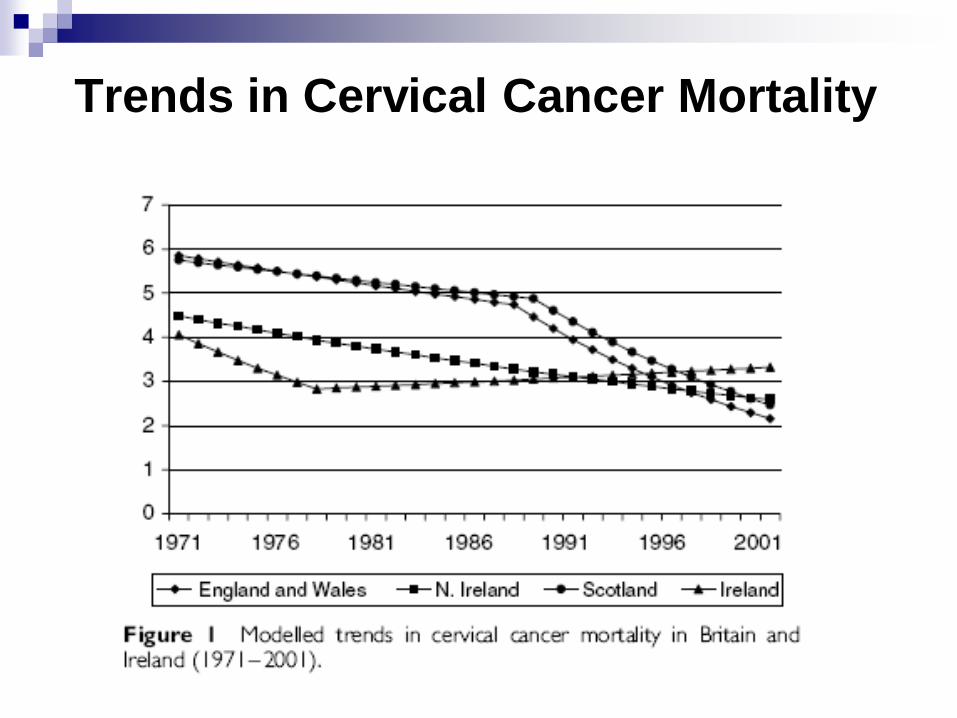
Trends in Cervical Cancer Mortality
http://www.qub.ac.uk/research-centres/nicr/FileStore/PDF/Filetoupload,176739,en.pdf
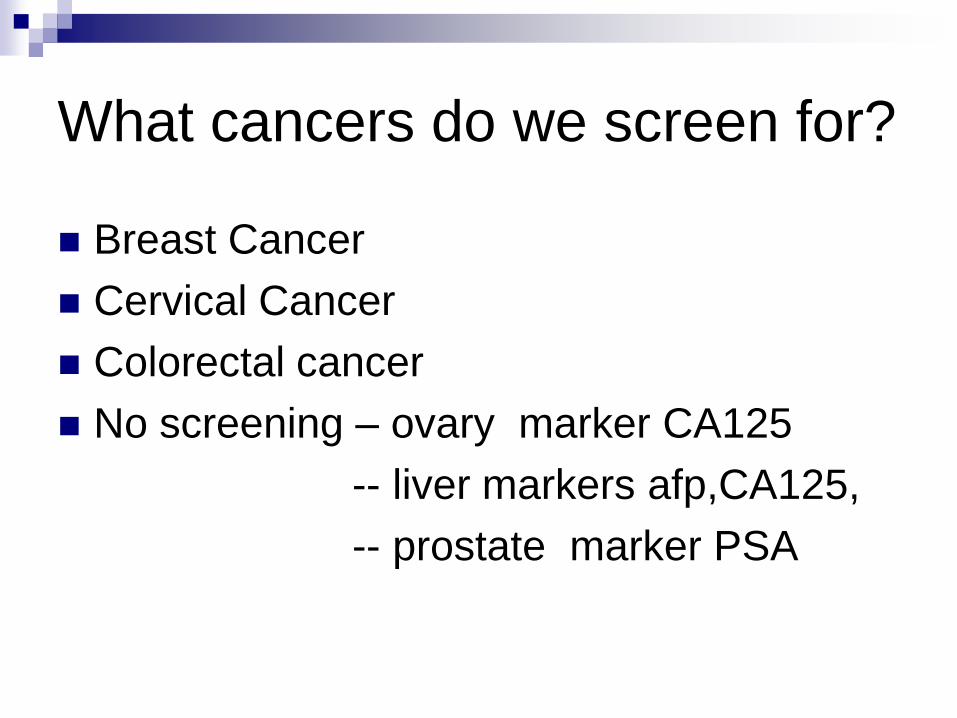
What cancers do we screen for?
Breast Cancer
Cervical Cancer
Colorectal cancer
No screening – ovary marker CA125
-- liver markers afp,CA125,
-- prostate marker PSA
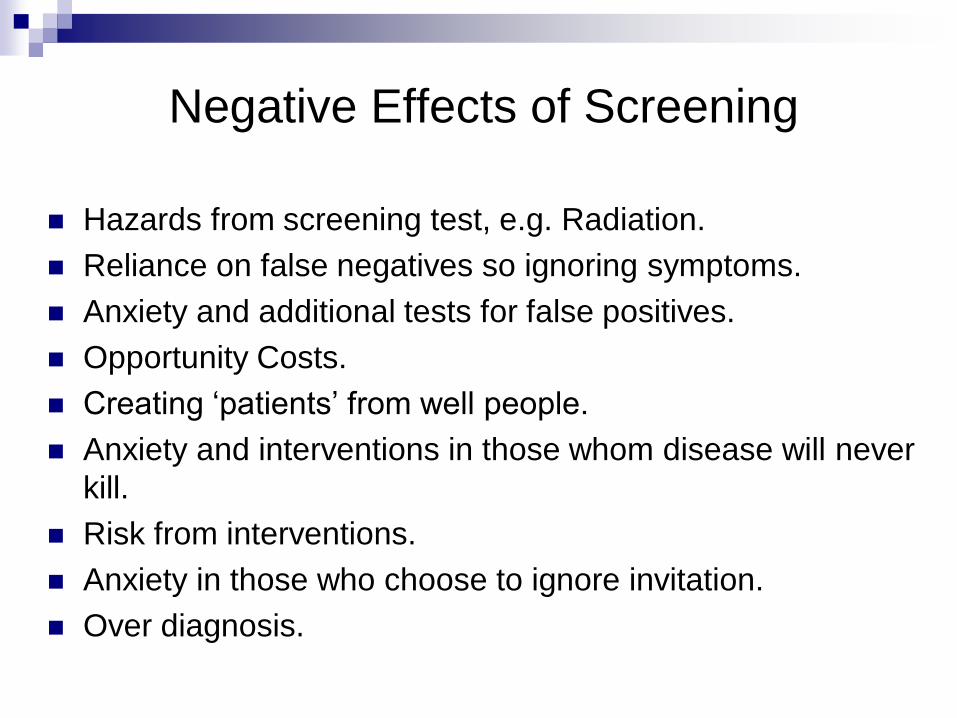
Negative Effects of Screening
Hazards from screening test, e.g. Radiation.
Reliance on false negatives so ignoring symptoms.
Anxiety and additional tests for false positives.
Opportunity Costs.
Creating ‘patients’ from well people.
Anxiety and interventions in those whom disease will never
kill.
Risk from interventions.
Anxiety in those who choose to ignore invitation.
Over diagnosis.
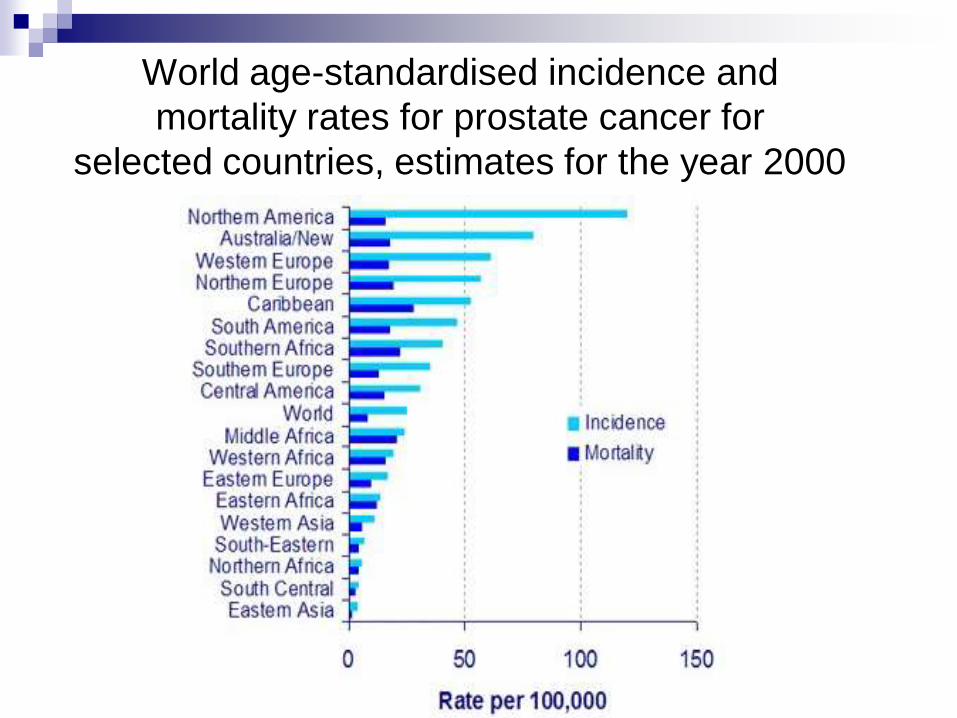
World age-standardised incidence and
mortality rates for prostate cancer for
selected countries, estimates for the year 2000