canadian life and health insurance facts. consumer protection canadian policyholders are financially...
TRANSCRIPT

Canadian Life and HealthInsurance Facts2018 Edition
President's MessageCanadian Life and Health Insurance Facts, 2018 Edition presents authoritative, factual information about life and health insurance in Canada.
It is published by the Canadian Life and Health Insurance Association (CLHIA). The CLHIA is a voluntary association whose member companies account for 99% of Canada’s life and health insurance business. The industry provides a wide range of financial security products such as life insurance, annuities (including RRSPs, RRIFs and pensions) and supplementary health insurance to almost 29 million Canadians. It also holds nearly $860 billion of assets in Canada and employs over 155,000 Canadians.
The current edition includes information about the life, health and annuity business of all federally registered and provincially incorporated insurance providers in Canada (including the health business of property and casualty insurers), unless stated otherwise. The sources of material for this publication include information from these insurance providers as well as relevant data from government agencies, regulatory bodies, and other associations. Their assistance is acknowledged with thanks.
Wherever possible, figures presented here relate to the Canadian life and health insurance business of companies of all national origins. However, where relevant, the numbers relate only to the worldwide business of Canadian companies.
79 Wellington St. W.Suite 2300P.O. Box 99, TD South TowerToronto, Ontario M5K 1G8416-777-2221
www.clhia.catwitter.com/clhiafacebook.com/clhia
In order to simplify the text, we use the letters K, M, B, and T to refer to thousands, millions, billions and trillions, respectively
Provincial and historical data are available in the appendices.
1001 de Maisonneuve Blvd. W.Suite 630Montréal, Quebec H3A 3C8514-845-9004
Toronto
World Exchange Plaza100 Queen Street, Suite 750Ottawa, Ontario K1P 1J9613-230-0031
Ottawa Montréal

President's messageWelcome to the 2018 Edition of the CLHIA’s Canadian Life and Health Insurance Facts. As the information contained in this year’s Edition bears out, our industry continued to move from strength to strength over the past year, reinforcing its contribution to the lives of both Canadians and our economy.
Canada’s life and health insurers are in business to provide products and services to Canadians that helps them save for the comfortable future they want, while protecting themselves and their loved ones from life’s unexpected events. We also ensure they can access supplementary healthcare, including prescription drugs and paramedical services, when they need it the most. Whether beginning a new career, working to support a family, or preparing for retirement, life and health insurers are there to ensure peace of mind and health and well-being.
The industry also plays a critical role in helping to build Canada’s economy for the future. We provide a significant source of financing to support and fulfil the need for capital for new projects as well as to replace Canada’s aging infrastructure such as hospitals, roads and bridges. And, we stand ready to invest even more.
In addition, as one of Canada’s biggest export industries, we are contributing to Canada’s international reputation as a good place in which to invest and do business. Foreign operations of Canadian insurers grew significantly over the past year, reflecting our growing stature in the international marketplace.
I hope that you find the information in this 2018 Edition informative and useful.
Stephen FrankPresident & CEO

What's inside
Industry profile 02 Industry at a glance04 Canadian marketplace
Lines of business08 Life insurance10 Retirement solutions 12 Health insurance
Industry in detail 16 Assets, liabilities and capital18 Total tax contributions 19 Global footprint
Appendices (available on-line)22 Provincial data22 Historical data22 CLHIA member companies22 Glossary of insurance terms22 Previous Factbooks


Industry profile
2
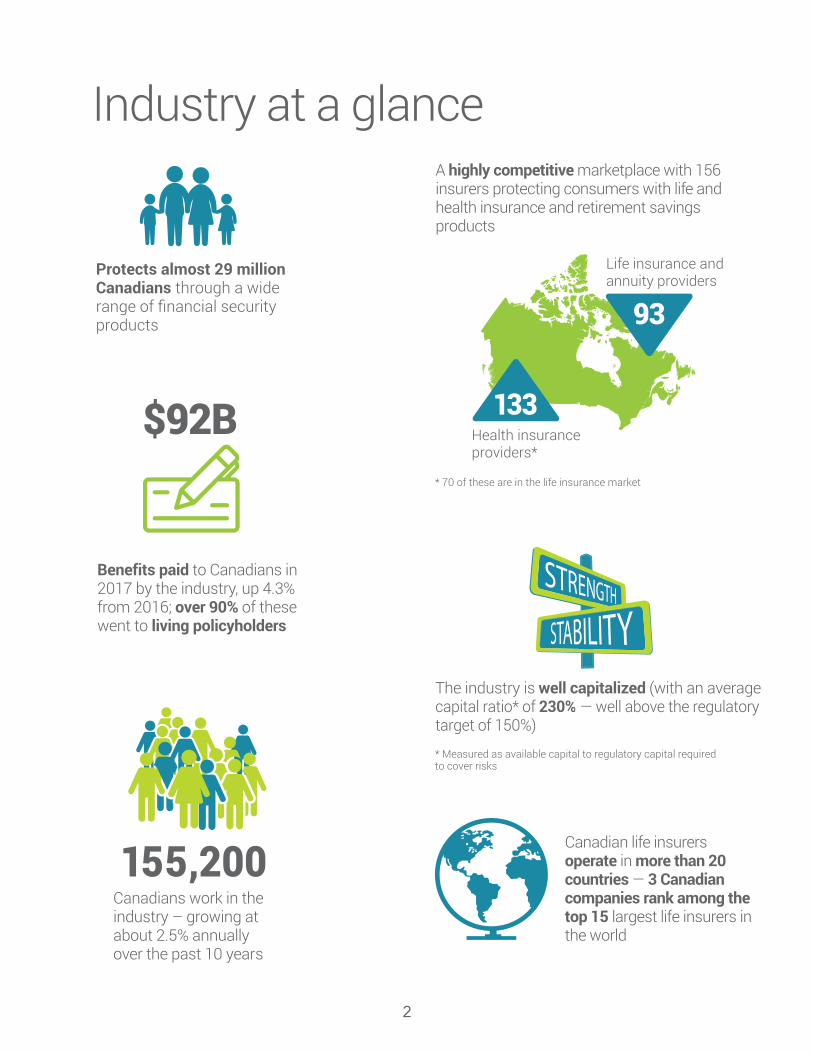
Protects almost 29 million Canadians through a wide range of financial security products
A highly competitive marketplace with 156 insurers protecting consumers with life and health insurance and retirement savings products
Health insuranceproviders*
Life insurance and annuity providers
155,200Canadians work in the industry – growing at about 2.5% annually over the past 10 years
The industry is well capitalized (with an average capital ratio* of 230% — well above the regulatory target of 150%)
* 70 of these are in the life insurance market
* Measured as available capital to regulatory capital requiredto cover risks
Canadian life insurers operate in more than 20 countries — 3 Canadian companies rank among the top 15 largest life insurers in the world
133
93
Benefits paid to Canadians in 2017 by the industry, up 4.3% from 2016; over 90% of these went to living policyholders
$92B
well capitalize230% — well ab
Industry at a glance
3
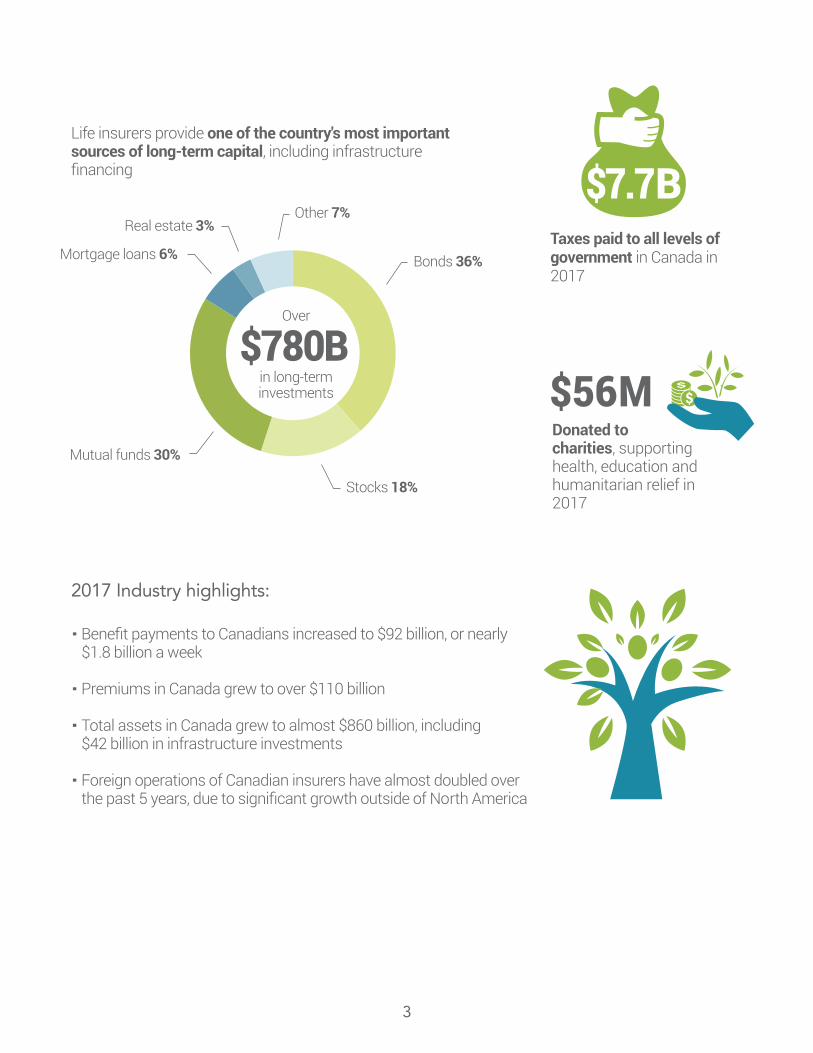
Taxes paid to all levels of government in Canada in 2017
· Benefit payments to Canadians increased to $92 billion, or nearly $1.8 billion a week
· Premiums in Canada grew to over $110 billion
· Total assets in Canada grew to almost $860 billion, including $42 billion in infrastructure investments
· Foreign operations of Canadian insurers have almost doubled over the past 5 years, due to significant growth outside of North America
Donated to charities, supporting health, education and humanitarian relief in 2017
Life insurers provide one of the country's most important sources of long-term capital, including infrastructure financing
$56M
$7.7B
2017 Industry highlights:
Bonds 36%
Stocks 18%
Mutual funds 30%
Mortgage loans 6%
Real estate 3%Other 7%
$780Bin long-terminvestments
Over
4
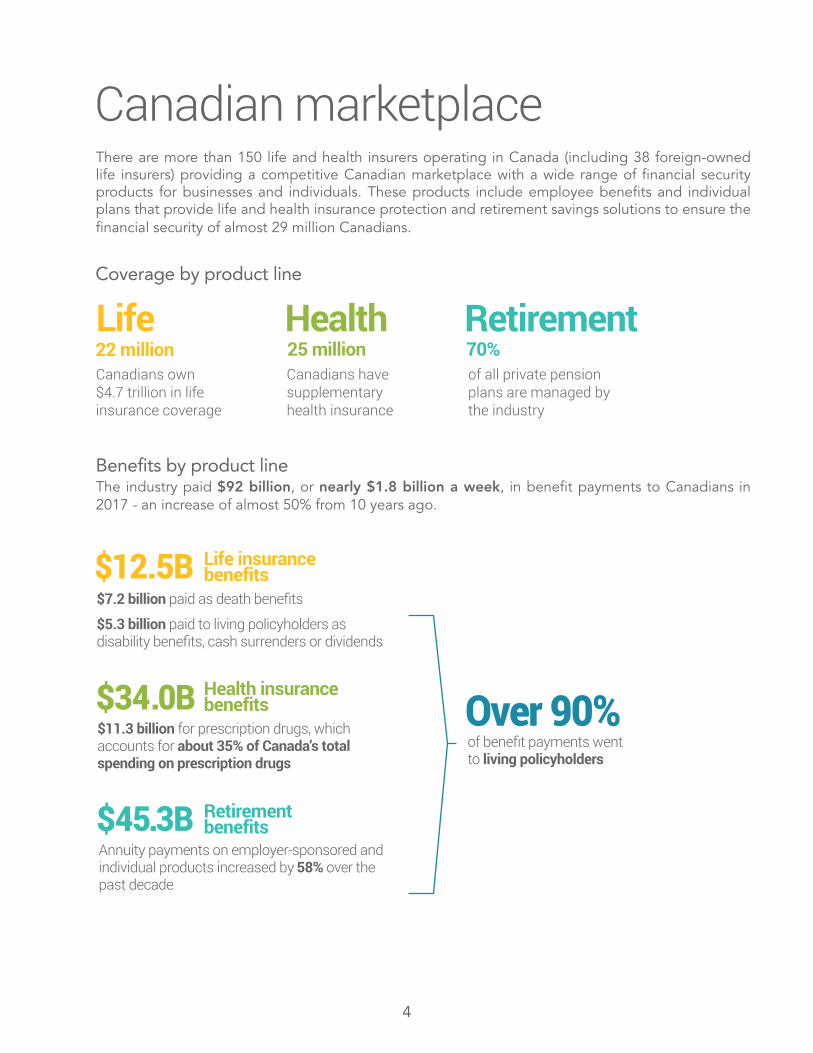
Canadian marketplaceThere are more than 150 life and health insurers operating in Canada (including 38 foreign-owned life insurers) providing a competitive Canadian marketplace with a wide range of financial security products for businesses and individuals. These products include employee benefits and individual plans that provide life and health insurance protection and retirement savings solutions to ensure the financial security of almost 29 million Canadians.
Benefits by product lineThe industry paid $92 billion, or nearly $1.8 billion a week, in benefit payments to Canadians in 2017 - an increase of almost 50% from 10 years ago.
Life22 million
Health25 million 70%
RetirementCanadians own $4.7 trillion in life insurance coverage
Canadians have supplementary health insurance
of all private pension plans are managed by the industry
Coverage by product line
$12.5B Life insurancebenefits
$34.0B Health insurancebenefits
$45.3B Retirementbenefits
$11.3 billion for prescription drugs, which accounts for about 35% of Canada’s total spending on prescription drugs
Annuity payments on employer-sponsored and individual products increased by 58% over the past decade
of benefit payments wentto living policyholders
Over 90%
$7.2 billion paid as death benefits
$5.3 billion paid to living policyholders as disability benefits, cash surrenders or dividends
5
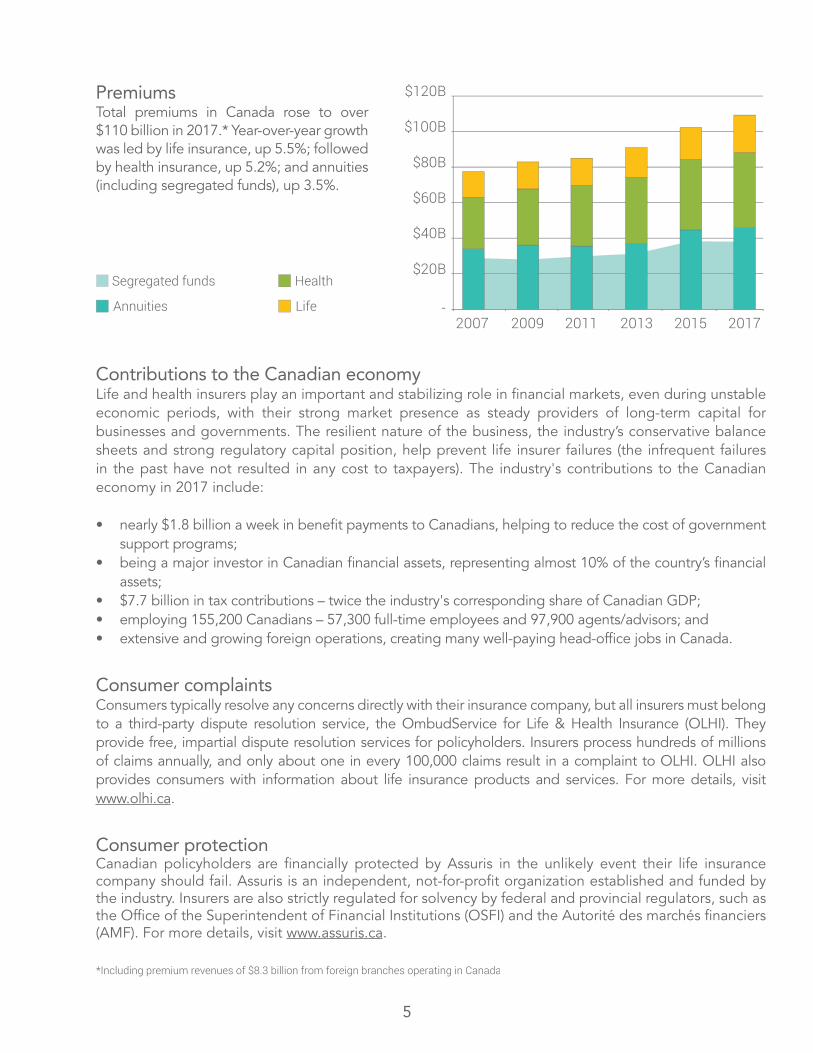
PremiumsTotal premiums in Canada rose to over $110 billion in 2017.* Year-over-year growth was led by life insurance, up 5.5%; followed by health insurance, up 5.2%; and annuities (including segregated funds), up 3.5%.
Contributions to the Canadian economyLife and health insurers play an important and stabilizing role in financial markets, even during unstable economic periods, with their strong market presence as steady providers of long-term capital for businesses and governments. The resilient nature of the business, the industry’s conservative balance sheets and strong regulatory capital position, help prevent life insurer failures (the infrequent failures in the past have not resulted in any cost to taxpayers). The industry's contributions to the Canadian economy in 2017 include:
• nearly $1.8 billion a week in benefit payments to Canadians, helping to reduce the cost of government support programs;
• being a major investor in Canadian financial assets, representing almost 10% of the country’s financial assets;
• $7.7 billion in tax contributions – twice the industry's corresponding share of Canadian GDP;• employing 155,200 Canadians – 57,300 full-time employees and 97,900 agents/advisors; and• extensive and growing foreign operations, creating many well-paying head-office jobs in Canada.
Consumer complaintsConsumers typically resolve any concerns directly with their insurance company, but all insurers must belong to a third-party dispute resolution service, the OmbudService for Life & Health Insurance (OLHI). They provide free, impartial dispute resolution services for policyholders. Insurers process hundreds of millions of claims annually, and only about one in every 100,000 claims result in a complaint to OLHI. OLHI also provides consumers with information about life insurance products and services. For more details, visitwww.olhi.ca.
Consumer protectionCanadian policyholders are financially protected by Assuris in the unlikely event their life insurance company should fail. Assuris is an independent, not-for-profit organization established and funded by the industry. Insurers are also strictly regulated for solvency by federal and provincial regulators, such as the Office of the Superintendent of Financial Institutions (OSFI) and the Autorité des marchés financiers (AMF). For more details, visit www.assuris.ca.
2007 2009 2011 2013 2015 2017
$20B
-
$40B
$60B
$80B
$100B
$120B
Segregated funds
Annuities
Health
Life
*Including premium revenues of $8.3 billion from foreign branches operating in Canada

Lines of business
8
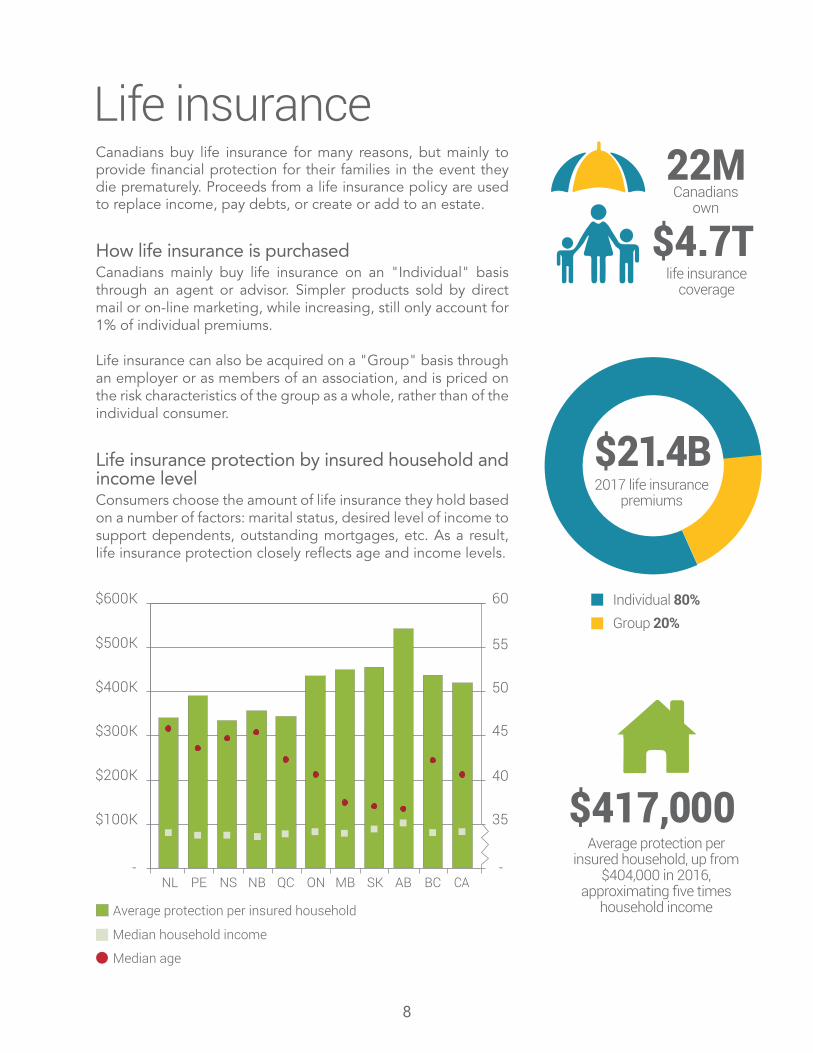
Life insuranceCanadians buy life insurance for many reasons, but mainly to provide financial protection for their families in the event they die prematurely. Proceeds from a life insurance policy are used to replace income, pay debts, or create or add to an estate.
How life insurance is purchasedCanadians mainly buy life insurance on an "Individual" basis through an agent or advisor. Simpler products sold by direct mail or on-line marketing, while increasing, still only account for 1% of individual premiums.
Life insurance can also be acquired on a "Group" basis through an employer or as members of an association, and is priced on the risk characteristics of the group as a whole, rather than of the individual consumer.
Life insurance protection by insured household and income levelConsumers choose the amount of life insurance they hold based on a number of factors: marital status, desired level of income to support dependents, outstanding mortgages, etc. As a result, life insurance protection closely reflects age and income levels.
Individual 80%Group 20%
2017 life insurance premiums
$21.4B
Canadiansown
life insurance coverage
22M
$4.7T
- -
$100K
$200K
$300K
$400K
$500K
$600K
Average protection per insured household
Median age
Median household income
60
55
50
45
40
35
NL PE NS NB QC ON MB SK AB BC CA
$417,000Average protection per
insured household, up from $404,000 in 2016,
approximating five times household income
9
2007 2009 2011 2013 2015 2017
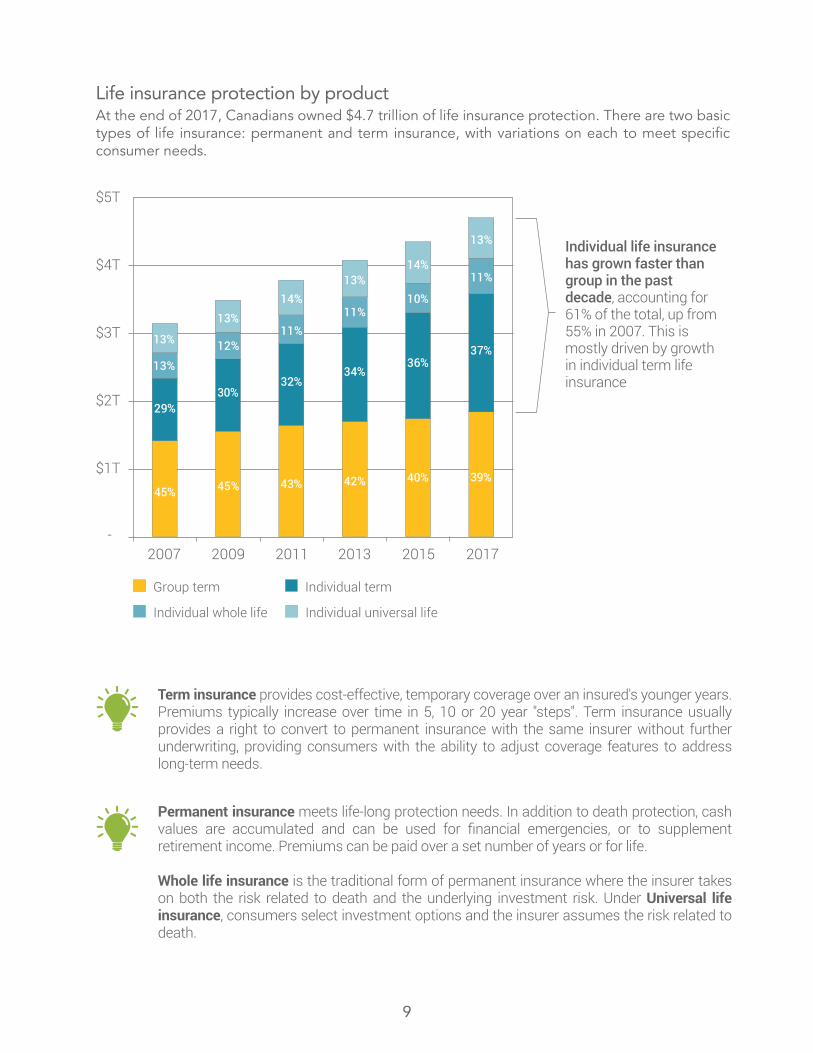
Individual life insurance has grown faster than group in the past decade, accounting for 61% of the total, up from 55% in 2007. This is mostly driven by growth in individual term life insurance
45% 45% 43% 42% 40% 39%
29%30%
32%34%
36%37%
13%
12%11%
11%10%
11%
13%
13%14%
13%14%
13%
-
$1T
$2T
$3T
$4T
$5T
Individual whole life Individual universal life
Individual termGroup term
Life insurance protection by productAt the end of 2017, Canadians owned $4.7 trillion of life insurance protection. There are two basic types of life insurance: permanent and term insurance, with variations on each to meet specific consumer needs.
Term insurance provides cost-effective, temporary coverage over an insured's younger years. Premiums typically increase over time in 5, 10 or 20 year "steps". Term insurance usually provides a right to convert to permanent insurance with the same insurer without further underwriting, providing consumers with the ability to adjust coverage features to address long-term needs.
Permanent insurance meets life-long protection needs. In addition to death protection, cash values are accumulated and can be used for financial emergencies, or to supplement retirement income. Premiums can be paid over a set number of years or for life.
Whole life insurance is the traditional form of permanent insurance where the insurer takes on both the risk related to death and the underlying investment risk. Under Universal life insurance, consumers select investment options and the insurer assumes the risk related to death.
10
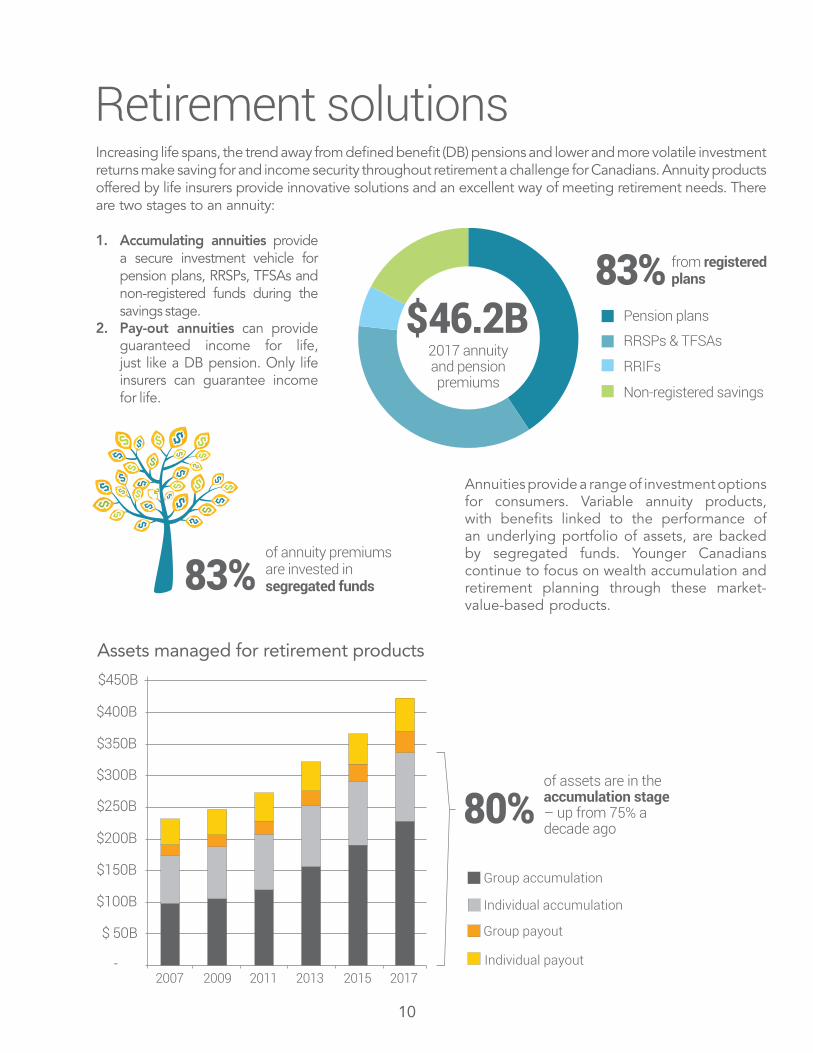
Retirement solutionsIncreasing life spans, the trend away from defined benefit (DB) pensions and lower and more volatile investment returns make saving for and income security throughout retirement a challenge for Canadians. Annuity products offered by life insurers provide innovative solutions and an excellent way of meeting retirement needs. There are two stages to an annuity:
1. Accumulating annuities provide a secure investment vehicle for pension plans, RRSPs, TFSAs and non-registered funds during the savings stage.
2. Pay-out annuities can provide guaranteed income for life, just like a DB pension. Only life insurers can guarantee income for life.
Annuities provide a range of investment options for consumers. Variable annuity products, with benefits linked to the performance of an underlying portfolio of assets, are backed by segregated funds. Younger Canadians continue to focus on wealth accumulation and retirement planning through these market-value-based products.
83%of annuity premiums are invested in segregated funds
$$$$
$$
$$
$$
$$
$$
$$
$$
$$ $$
$$
$$$$ $$
$$
$$$$$$$$
$$
$$
$$$$
$$ $$
$$
$$
$$
$$
$$
Assets managed for retirement products
-
$ 50B
$100B
$150B
$200B
$250B
$300B
$350B
$400B
2007 2009 2011 2013 2015 2017
of assets are in theaccumulation stage– up from 75% a decade ago
80%
$450B
Group accumulation
Individual accumulation
Group payout
Individual payout
Pension plans
RRSPs & TFSAs
RRIFs
Non-registered savings
2017 annuityand pensionpremiums
$46.2Bfrom registeredplans83%
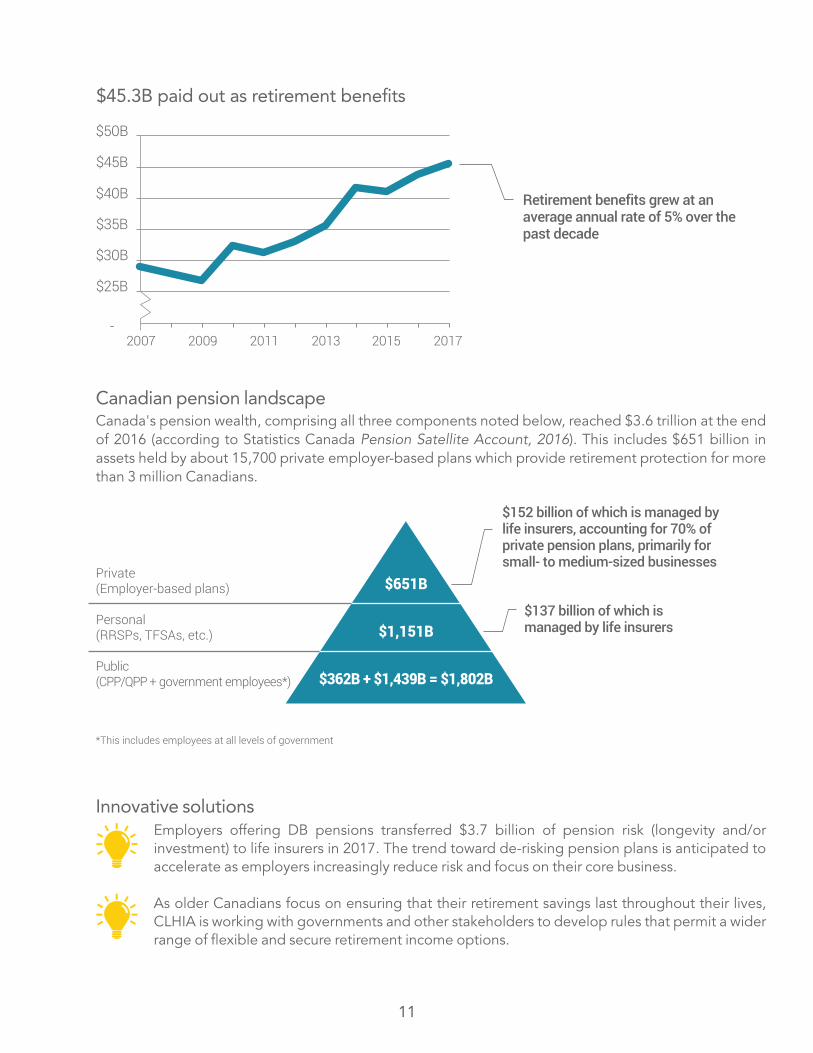
Canadian pension landscapeCanada's pension wealth, comprising all three components noted below, reached $3.6 trillion at the end of 2016 (according to Statistics Canada Pension Satellite Account, 2016). This includes $651 billion in assets held by about 15,700 private employer-based plans which provide retirement protection for more than 3 million Canadians.
Innovative solutionsEmployers offering DB pensions transferred $3.7 billion of pension risk (longevity and/or investment) to life insurers in 2017. The trend toward de-risking pension plans is anticipated to accelerate as employers increasingly reduce risk and focus on their core business.
As older Canadians focus on ensuring that their retirement savings last throughout their lives, CLHIA is working with governments and other stakeholders to develop rules that permit a wider range of flexible and secure retirement income options.
-
$25B
$30B
$35B
$40B
$45B
$50B
$45.3B paid out as retirement benefits
Retirement benefits grew at an average annual rate of 5% over the past decade
2007 2009 2011 2013 2015 2017
11
Private(Employer-based plans)
Personal(RRSPs, TFSAs, etc.)
Public(CPP/QPP + government employees*)
$651B
$1,151B
$362B + $1,439B = $1,802B
$152 billion of which is managed by life insurers, accounting for 70% of private pension plans, primarily for small- to medium-sized businesses
$137 billion of which is managed by life insurers
*This includes employees at all levels of government
12
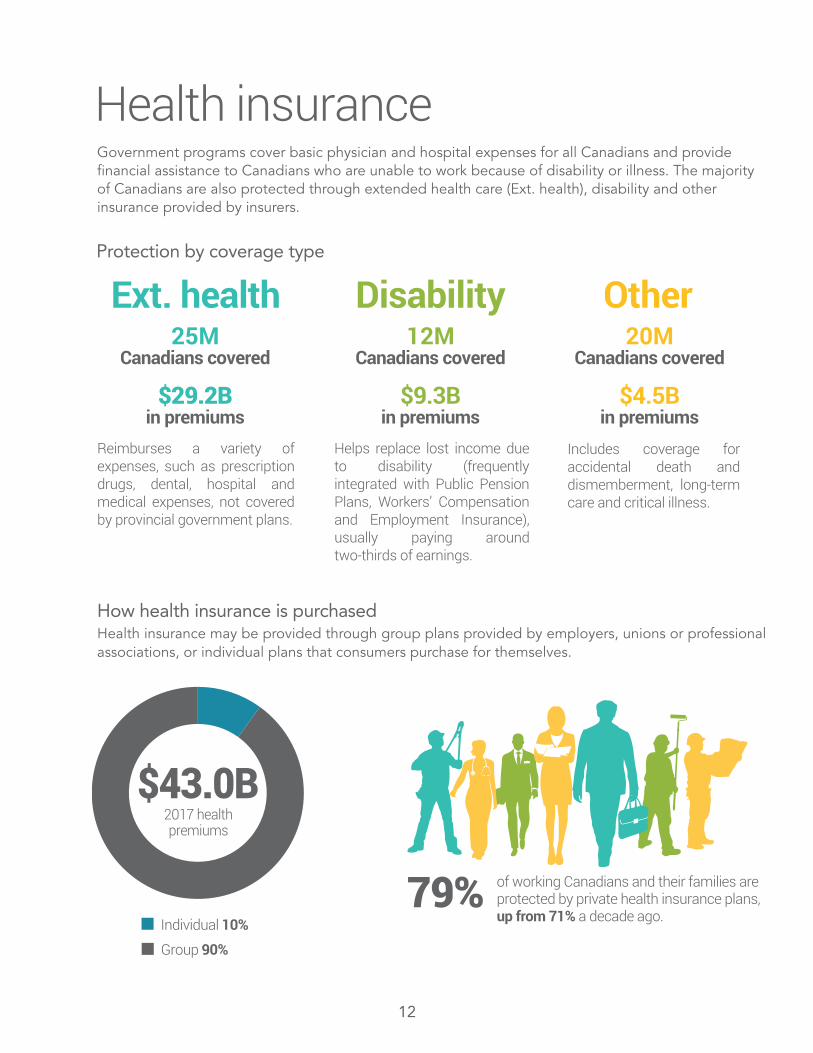
Health insuranceGovernment programs cover basic physician and hospital expenses for all Canadians and provide financial assistance to Canadians who are unable to work because of disability or illness. The majority of Canadians are also protected through extended health care (Ext. health), disability and other insurance provided by insurers.
Ext. health Disability Other25M
Canadians covered
$29.2Bin premiums
12M Canadians covered
$9.3Bin premiums
20M Canadians covered
$4.5Bin premiums
Reimburses a variety of expenses, such as prescription drugs, dental, hospital and medical expenses, not covered by provincial government plans.
Helps replace lost income due to disability (frequently integrated with Public Pension Plans, Workers’ Compensation and Employment Insurance), usually paying around two-thirds of earnings.
Includes coverage for accidental death and dismemberment, long-term care and critical illness.
Protection by coverage type
2017 health premiums
$43.0B
Individual 10%
Group 90%
How health insurance is purchasedHealth insurance may be provided through group plans provided by employers, unions or professional associations, or individual plans that consumers purchase for themselves.
of working Canadians and their families are protected by private health insurance plans,up from 71% a decade ago.
79%
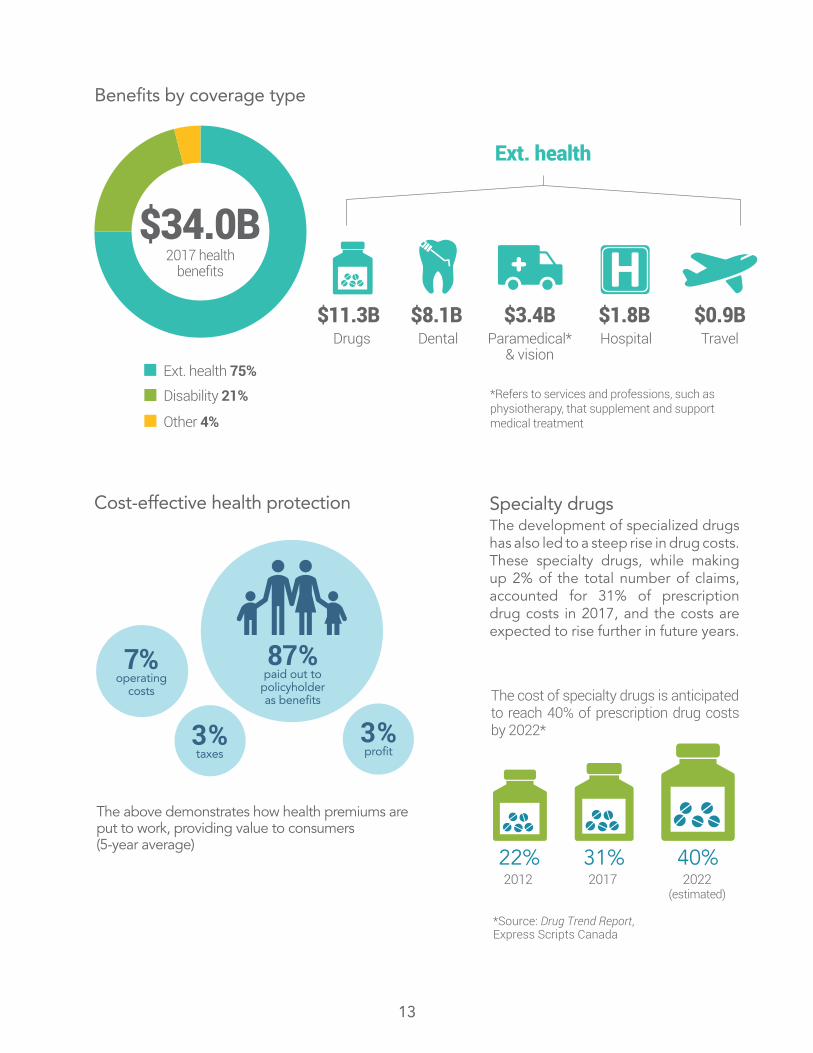
Specialty drugsThe development of specialized drugs has also led to a steep rise in drug costs. These specialty drugs, while making up 2% of the total number of claims, accounted for 31% of prescription drug costs in 2017, and the costs are expected to rise further in future years.
13
2017 healthbenefits
$34.0B
Ext. health 75%
Disability 21%
Other 4%
Benefits by coverage type
$11.3B Drugs
$8.1B Dental
$3.4BParamedical*
& vision
Ext. health
$1.8B Hospital
$0.9BTravel
*Refers to services and professions, such as physiotherapy, that supplement and support medical treatment
The cost of specialty drugs is anticipated to reach 40% of prescription drug costs by 2022*
22% 31% 40%2012 2017 2022
(estimated)
*Source: Drug Trend Report,Express Scripts Canada
87%paid out to
policyholderas benefits
7%operating
costs
3%taxes
3%profit
The above demonstrates how health premiums are put to work, providing value to consumers(5-year average)
Cost-effective health protection


Industry in detail
16
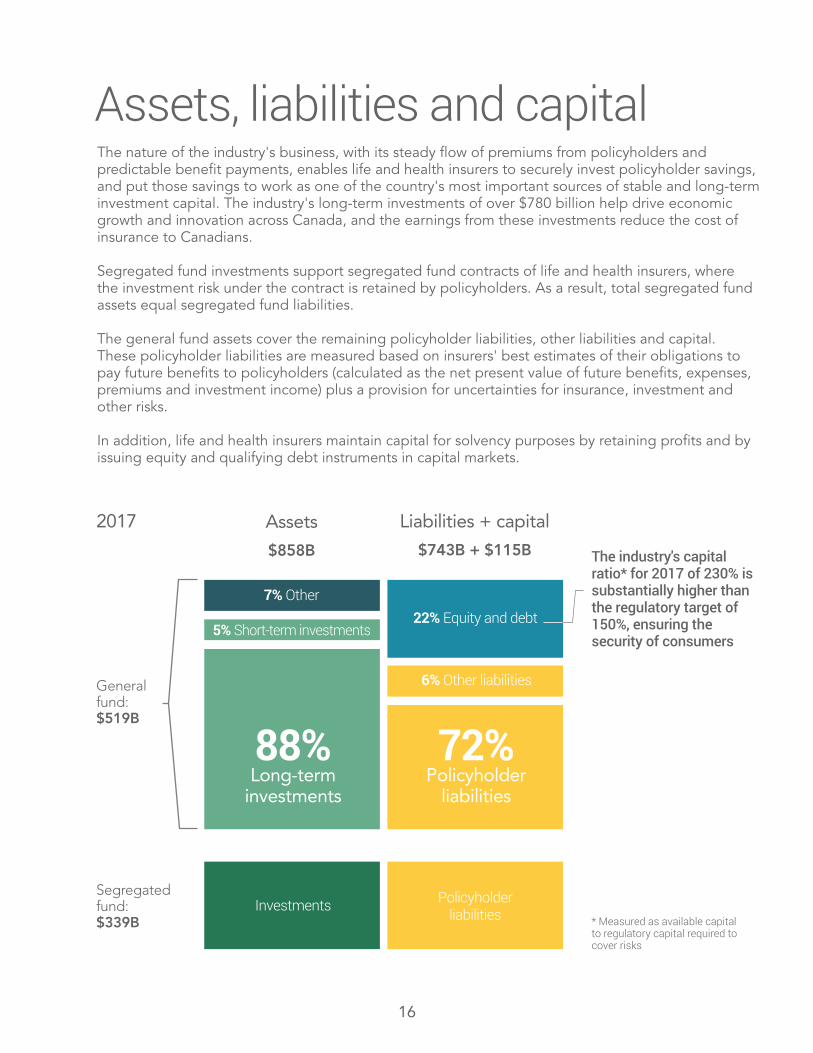
Assets, liabilities and capitalThe nature of the industry's business, with its steady flow of premiums from policyholders and predictable benefit payments, enables life and health insurers to securely invest policyholder savings, and put those savings to work as one of the country's most important sources of stable and long-term investment capital. The industry's long-term investments of over $780 billion help drive economic growth and innovation across Canada, and the earnings from these investments reduce the cost of insurance to Canadians.
Segregated fund investments support segregated fund contracts of life and health insurers, where the investment risk under the contract is retained by policyholders. As a result, total segregated fund assets equal segregated fund liabilities.
The general fund assets cover the remaining policyholder liabilities, other liabilities and capital. These policyholder liabilities are measured based on insurers' best estimates of their obligations to pay future benefits to policyholders (calculated as the net present value of future benefits, expenses, premiums and investment income) plus a provision for uncertainties for insurance, investment and other risks.
In addition, life and health insurers maintain capital for solvency purposes by retaining profits and by issuing equity and qualifying debt instruments in capital markets.
The industry's capital ratio* for 2017 of 230% is substantially higher than the regulatory target of 150%, ensuring the security of consumers
79%Long-Term
72%Policyholder
liabilities
88%Long-term
investments
Assets
$858B
2017
Generalfund:$519B
Segregatedfund:$339B
Liabilities + capital
$743B + $115B
7% Other22% Equity and debt
5% Short-term investments
6% Other liabilities
Investments Policyholderliabilities * Measured as available capital
to regulatory capital required tocover risks
17
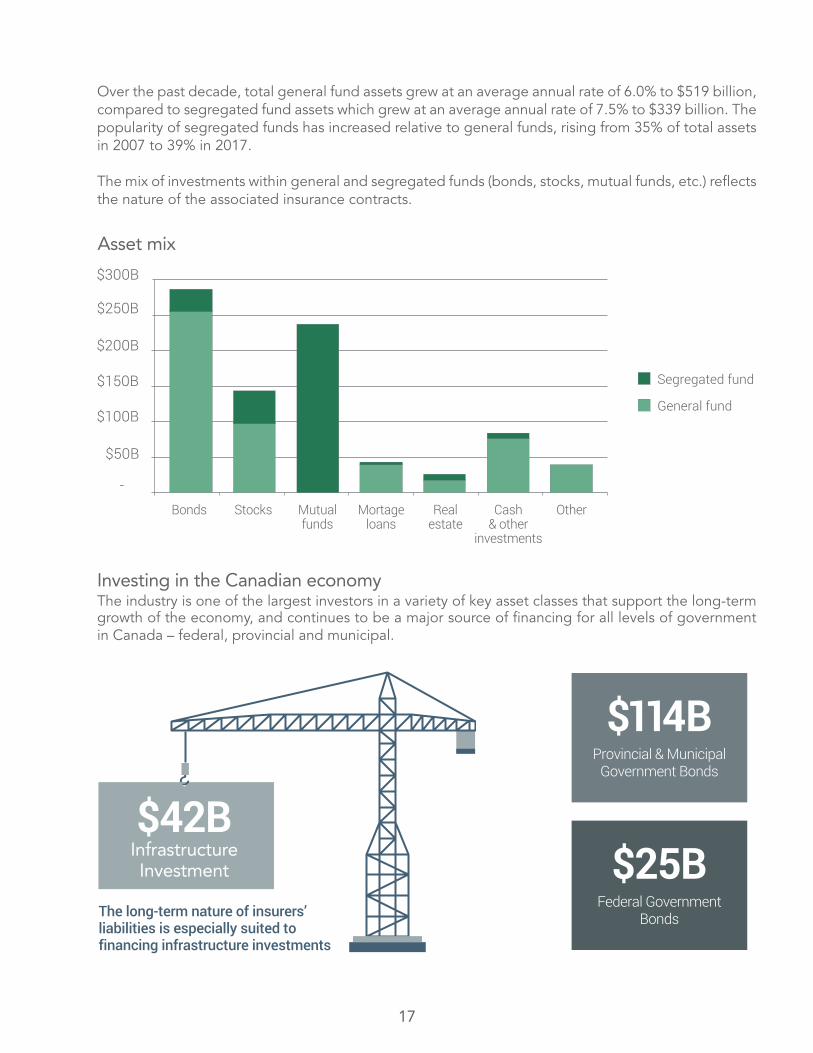
Over the past decade, total general fund assets grew at an average annual rate of 6.0% to $519 billion, compared to segregated fund assets which grew at an average annual rate of 7.5% to $339 billion. The popularity of segregated funds has increased relative to general funds, rising from 35% of total assets in 2007 to 39% in 2017.
The mix of investments within general and segregated funds (bonds, stocks, mutual funds, etc.) reflects the nature of the associated insurance contracts.
Segregated fund
General fund
$50B
-
$100B
$150B
$200B
$250B
$300B
Bonds Stocks Mutualfunds
Mortageloans
Realestate
Cash& other
investments
Other
Asset mix
Investing in the Canadian economyThe industry is one of the largest investors in a variety of key asset classes that support the long-term growth of the economy, and continues to be a major source of financing for all levels of government in Canada – federal, provincial and municipal.
The long-term nature of insurers’ liabilities is especially suited to financing infrastructure investments
$42BInfrastructureInvestment
$114BProvincial & Municipal
Government Bonds
$25BFederal Government
Bonds
18
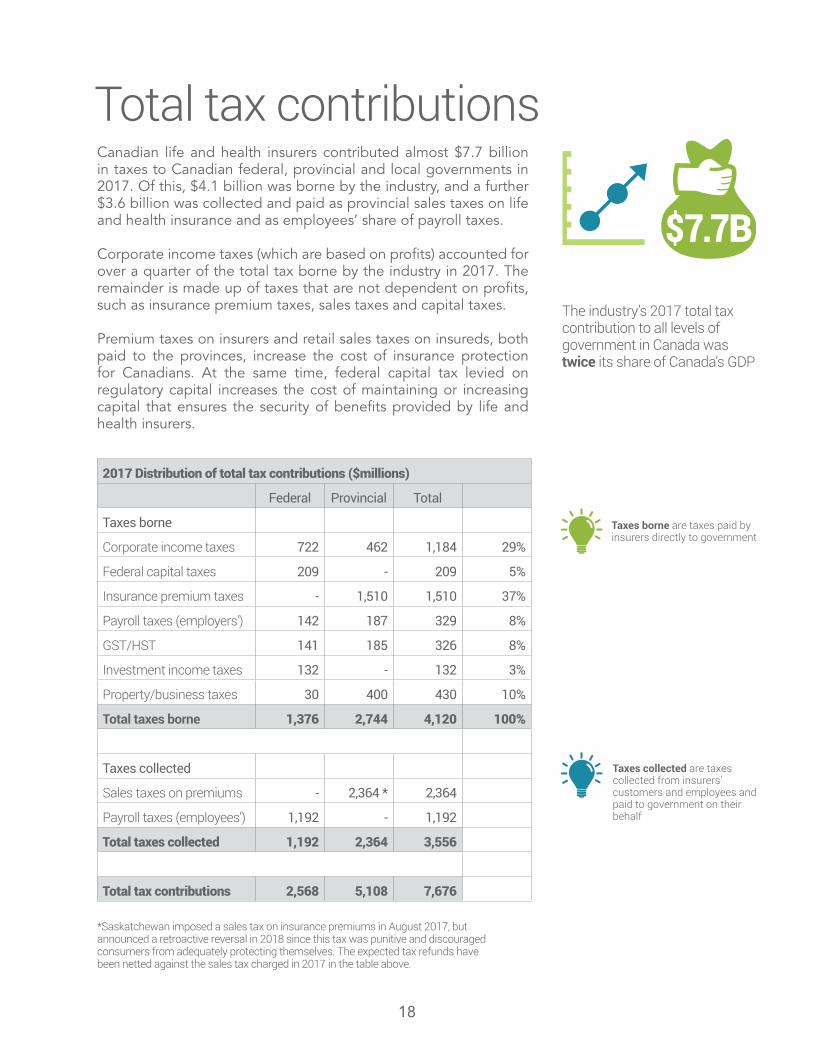
Total tax contributionsCanadian life and health insurers contributed almost $7.7 billion in taxes to Canadian federal, provincial and local governments in 2017. Of this, $4.1 billion was borne by the industry, and a further $3.6 billion was collected and paid as provincial sales taxes on life and health insurance and as employees’ share of payroll taxes.
Corporate income taxes (which are based on profits) accounted for over a quarter of the total tax borne by the industry in 2017. The remainder is made up of taxes that are not dependent on profits, such as insurance premium taxes, sales taxes and capital taxes.
Premium taxes on insurers and retail sales taxes on insureds, both paid to the provinces, increase the cost of insurance protection for Canadians. At the same time, federal capital tax levied on regulatory capital increases the cost of maintaining or increasing capital that ensures the security of benefits provided by life and health insurers.
The industry’s 2017 total tax contribution to all levels of government in Canada wastwice its share of Canada’s GDP
$7.7B
2017 Distribution of total tax contributions ($millions)
Federal Provincial Total
Taxes borne
Corporate income taxes 722 462 1,184 29%
Federal capital taxes 209 - 209 5%
Insurance premium taxes - 1,510 1,510 37%
Payroll taxes (employers') 142 187 329 8%
GST/HST 141 185 326 8%
Investment income taxes 132 - 132 3%
Property/business taxes 30 400 430 10%
Total taxes borne 1,376 2,744 4,120 100%
Taxes collected
Sales taxes on premiums - 2,364 * 2,364
Payroll taxes (employees') 1,192 - 1,192
Total taxes collected 1,192 2,364 3,556
Total tax contributions 2,568 5,108 7,676
Taxes borne are taxes paid by insurers directly to government
Taxes collected are taxes collected from insurers' customers and employees and paid to government on their behalf
*Saskatchewan imposed a sales tax on insurance premiums in August 2017, but announced a retroactive reversal in 2018 since this tax was punitive and discouraged consumers from adequately protecting themselves. The expected tax refunds have been netted against the sales tax charged in 2017 in the table above.
19
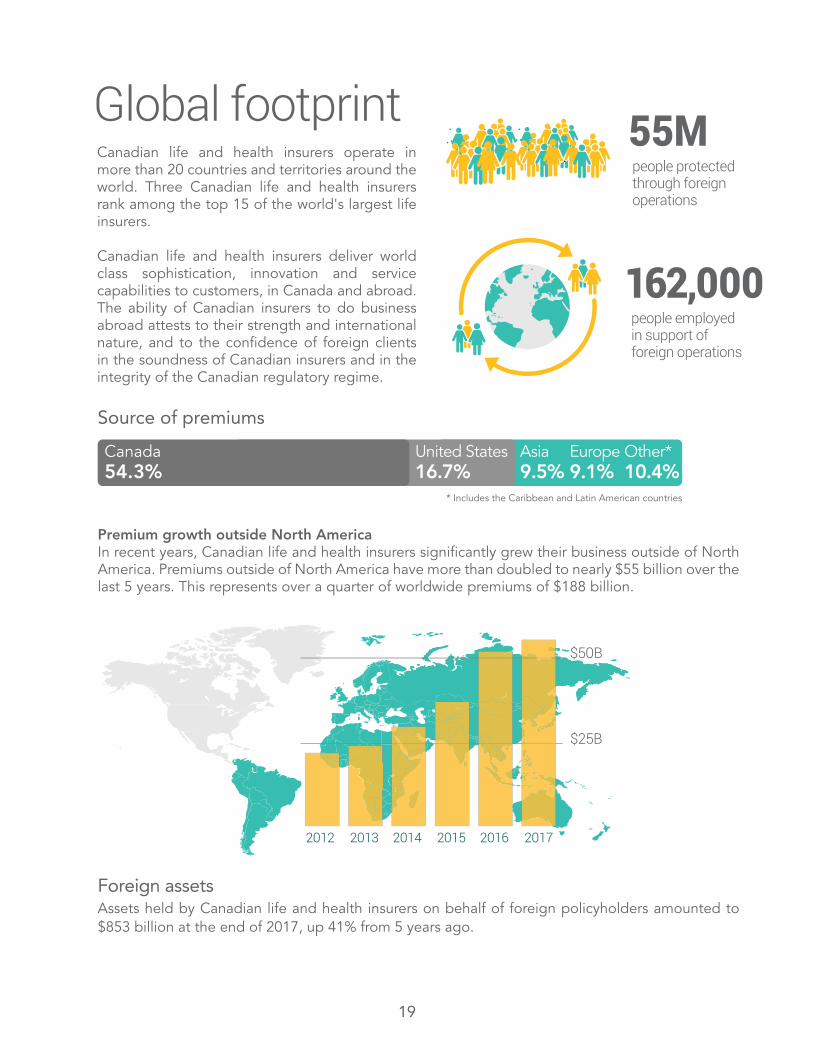
Canadian life and health insurers operate in more than 20 countries and territories around the world. Three Canadian life and health insurers rank among the top 15 of the world's largest life insurers.
Canadian life and health insurers deliver world class sophistication, innovation and service capabilities to customers, in Canada and abroad. The ability of Canadian insurers to do business abroad attests to their strength and international nature, and to the confidence of foreign clients in the soundness of Canadian insurers and in the integrity of the Canadian regulatory regime.
55M people protected through foreign operations
162,000people employed in support of foreign operations
Global footprint
Foreign assetsAssets held by Canadian life and health insurers on behalf of foreign policyholders amounted to $853 billion at the end of 2017, up 41% from 5 years ago.
Canada54.3%
United States16.7%
Europe9.1%
Asia9.5%
Other*10.4%
* Includes the Caribbean and Latin American countries
Premium growth outside North AmericaIn recent years, Canadian life and health insurers significantly grew their business outside of North America. Premiums outside of North America have more than doubled to nearly $55 billion over the last 5 years. This represents over a quarter of worldwide premiums of $188 billion.
Source of premiums
$25B
$50B
-2012 2013 2014 2015 2016 2017