canada canada utilization of dissolved organic matter …_et_al_1979.pdf · utilization of...
TRANSCRIPT

Rshenes PSches and Environment ei Environnement Canada Canada
Sources, Transportation, and Utilization of Dissolved Organic Matter in Groundwater and Streams
P.M. Wallis with the collaboration of H.B.N. Hynes
id P. Fritz
SCIENTIFIC SERIES NO. (Resume en franqais}
100
KflNRNflSKlS CENTRE FOR CNUIRONMENTflb RESEARCH
INLAND WATERS DIRECTOR ATE, WATER QUALITY BRANCH, OTTAWA, CANADA. 1979.
Hsheries Pectnes and Environment et Environnement Canada Canada
Sources, Transportation, and Utilization of Dissolved Organ Matter in Groundwater and Streams
P.M. Wallis with the collaboration of H.B.N. Hynes and P. Fritz
Edited by Dr. D.B. Carlisle, Water Quality Branch
71 KflNflNflSKlS CENTRE FOR ENUlRONMENTaL RESEaRCH
THE UNIVERSITY Of CALGARY AlBiHB, CANADA
SCIENTIFIC SERIES NO. 100 (Resume en frangais)
INLAND WATERS DIRECTORATE, WATER QUALITY BRANCH, OTTAWA, CANADA, 1979.

© Minister of Supply and Services Canada 1979
Cat. No. En 36-502/100 ^
ISBN 0-662-10488-9

Contents Page
ABSTRACT vii
RESUME ix
1. INTRODUCTION 1
Objectives 2 Marmot Basin 2
Location and climate 2 Geology (of the area) 2 Vegetation 4 Physical description and instrumentation 4
Instrumentation 1976 4 Instrumentation 1977 6
Geology and geochemistry of the Marmot Basin 6 Sample of January 6, 1977 9 Sample of May 31, 1977 10
2. SOURCES AND DESCRIPTION OF DOM 11 Organic analysis and error limitations .• 11 Snow and its organic content 11 Occurrence of rainfall 12 Organic matter in throughfall 14 Sources of organic matter from the organisms' point of view 15 Terrestrial decomposition as a source of dissolved organic matter 15 Sources of dissolved organic matter to stream organisms 17 Groundwater sources 17 Upstream sources 17 Characterization of organic matter by ' ^ C content 22
3. THE HYDROLOGY OF THE MARMOT BASIN AND THE TRANSPORTATION OF DISSOLVED ORGANIC MATTER 25
Water budget of the Marmot Basin 25 The mechanism of runoff in the Marmot Basin 25 Rates of transport of DOM through groundwater zones 29
Unsaturated zone 29 Saturated zone 29
4. THE UTILIZATION OF DISSOLVED ORGANIC MATTER 32 Introduction: who is taking up DOM? 32 Heterotrophic uptake in streams 33 Heterotrophic potential of bacteria measured by '"^C-labelled substrate uptake 33 Uptake measured by substrate disappearance in the Middle Creek tributary 35 DOM uptake during storm runoff and base flow 40 Effects of nutrients and differential land use on groundwater DOM 43
COMPLETE SUMMARY OF CONCLUSIONS 45 LITERATURE CITED 47
iii

Tables
1. C h e m i c a l analysis — S a m p l e o f J a n u a r y 6, 1977 8
2. C h e m i c a l ana lys is - S a m p l e o f M a y 31 , 1977 8
3. C h e m i s t r y o f s n o w 12
4. A m o u n t o f ra infal l 13
5. R e l a t i o n s h i p be tween t h r o u g h f a l l a n d p r e c i p i t a t i o n 13
6. C o m p a r i s o n be tween p r e c i p i t a t i o n and t h r o u g h f a l l at M i d d l e C r e e k Wei r 14
7. C h e m i s t r y o f t h r o u g h f a l l 14
8. O r g a n i c analys is o f t h r o u g h f a l l 14
9. O r g a n i c analys is o f g r o u n d w a t e r 17
10. S u m m a r y o f o r g a n i c c o n s t i t u e n t s in M a r m o t C r e e k sur face waters 22
11. 5'^C in d isso lved organ ic mat te r . . : 23
12. A n n u a l water ba lances f o r the M a r m o t C r e e k subbas ins 25
13. I so top ic da ta f o r the s t o r m o f 10-11 M a y , 1977 in M i d d l e C r e e k 27
14. P r e d i c t i o n o f C a ^ a n d D O M c o n c e n t r a t i o n s 29
15. H y d r a u l i c c o n d u c t i v i t i e s in the M a r m o t Bas in 31
16. B i o c h e m i c a l o x y g e n d e m a n d in M i d d l e C r e e k 33
17. H e t e r o t r o p h i c po ten t ia l of sessile and p l a n k t o n i c bacter ia 35
18. C h r o m a t o g r a p h y data f o r g l u t a m i c ac id substrate a d d i t i o n e x p e r i m e n t s 38
19. D i s a p p e a r a n c e o f g r o u n d w a t e r D O M in the M i d d l e C r e e k t r i b u t a r y 40
20. U p t a k e o f d isso lved o r g a n i c mat te r b y sed iments 42
Illustrations
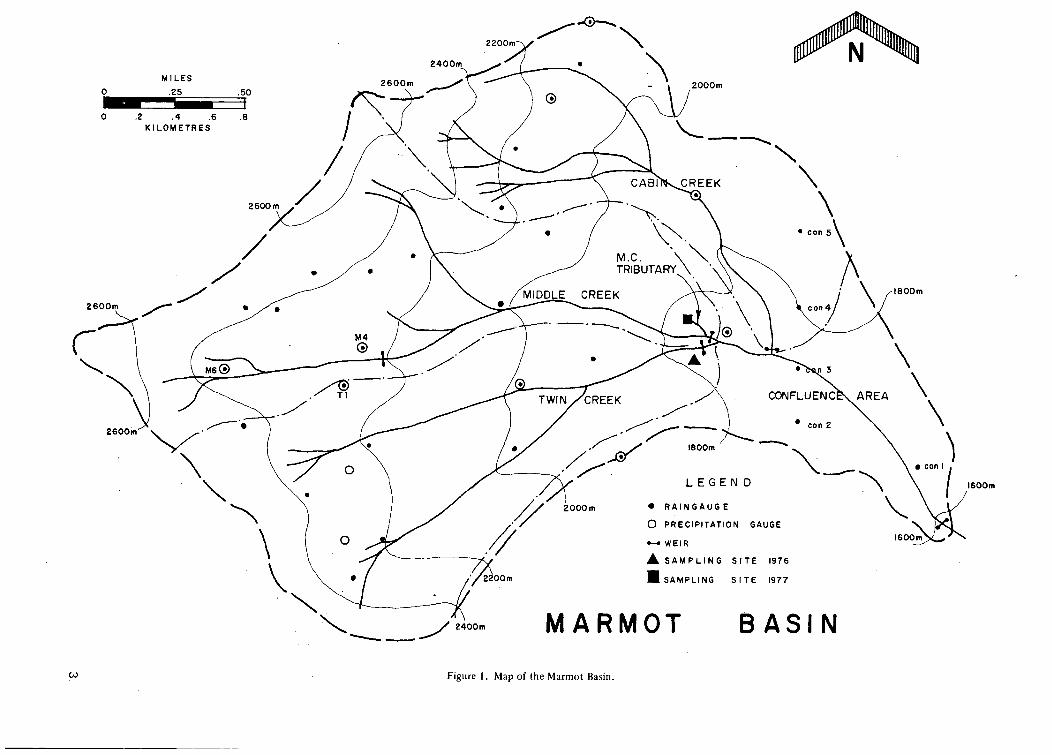
F i g u r e 1. M a p of the M a r m o t Bas in 3
F i g u r e 2. G r o u n d w a t e r insta l la t ions 4
F i g u r e 3. I n s t r u m e n t a t i o n above T w i n C r e e k we i r 5
F i g u r e 4. T e n s i o m e t e r (diagram) 6
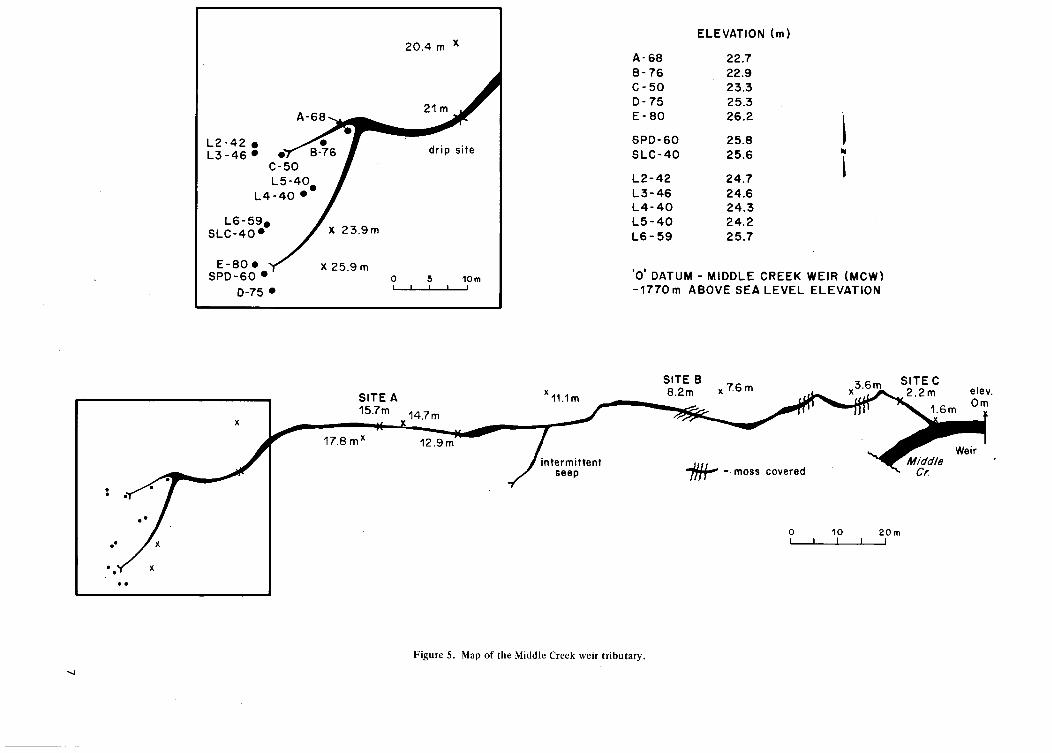
F i g u r e 5. M a p o f the M i d d l e C r e e k we i r t r i b u t a r y 7
F i g u r e 6. D i s s o l v e d o r g a n i c c a r b o n in s n o w and rain 12
F i g u r e 7. S o i l p ro f i l e at M i d d l e C r e e k wei r 15
F i g u r e 8. D i s s o l v e d o r g a n i c c a r b o n in g r o u n d w a t e r 16
F i g u r e 9. D ischarge at M i d d l e C r e e k wei r IS
F i g u r e 10. D i s s o l v e d organ ic c a r b o n load at M i d d l e C r e e k weir IS
F i g u r e 11. D ischarge in C a b i n C r e e k 2C
F i g u r e 12. D i s s o l v e d o r g a n i c c a r b o n in C a b i n C r e e k 2C
F i g u r e 13. D ischarge in T w i n C r e e k 21
F i g u r e 14. D i s s o l v e d o r g a n i c c a r b o n in T w i n C r e e k 2 '
F i g u r e 15. A p p a r a t u s f o r we t o x i d a t i o n a n d p r e c i p i t a t i o n o f d isso lved organ ic c a r b o n . . . . 2v
F i g u r e 16. H y d r o g r a p h separa t ion o f the s t o r m of 10-11 M a y , 1977 in M i d d l e C r e e k 2;
F igure 17. H y d r o g r a p h separa t ion o f the s t o r m o f J u l y 12, 1976 in T w i n C r e e k 2i
F i g u r e 18. P r e d i c t i o n o f C a ^ and D O C f o r the s t o r m o f M a y 10-11, 1977 2E F i g u r e 19. T e n s i o m e t e r da ta 3(
F i g u r e 20. U p t a k e o f g l u t a m i c ac id 3!
F i g u r e 21. N a C I / g l u c o s e e x p ' t . J u l y 4, 1977 . . 3;
iv

Illustrations (cont.)
Figure 22. NaCI/glucose exp't. July 10, 1977 37
Figure 23. NaCI/glucose exp't. July 21, 1977 37
Figure 24. NaCI/glutamic acid exp't. July 27, 1977 37
Figure 25. NaCI/glutamic acid exp't. Aug. 2, 1977 38
Figure 26. NaCI/glutamic acid exp't. Aug. 7, 1977 38
Figure 27. NaCI/glutamic acid exp't. Feb. 3, 1978 39
Figure 28. NaCI/glutamic acid exp't. Feb. 17, 1978 39
Figure 29. NaCI/spruce leachate exp't. Aug. 15, 1977 ..• 40
Figure 30. Infra-red spectrographs of spruce leachate 41
Figure 31. Apparatus for measuring uptake of organic solutes by sediment 42
Figure 32. Groundwater profile H-38, Leamington 43
Figure 33. Groundwater profile H-54, Leamington 44
Figure 34. Groundwater profile, Hillman Creek 44
V

Abstract
The general problem of the fate of dissolved organic matter originating from terrestrial sources and making its way towards streams was investigated. This involved the use of hydrological, biological, and chemical techniques and concepts. Experiments were carried out primarily in the Marmot Basin, Alberta, in conjunction with the Environmental Sciences Centre of the University of Calgary. Further research was undertaken at a PLUARG instrumented groundwater site near Leamington, Ontario, in Laurel Creek near Waterloo, Ontario, and in the laboratory.
Dissolved organic matter originates from the leaching of both living and dead plant material, and a smaller amount of decaying animal tissue. In forested areas the seasonal fall of leaves and conifer needles combined with twigs, branches and larger portions of trees all contribute to the litter layer on the forest floor. Whether this layer tends to accumulate or not, it is leached by rain which infiltrates through it into the unsaturated groundwater zone. Rain which drips through the vegetation cover (throughfall) may pick up significant quantities of organic matter from living plant material. This dissolved organic material and that leached from decaying plant litter is exposed to soil micro-organisms which use it for a food resource. Labile organic matter including carbohydrates, proteins, hydrocarbons and to a certain extent, tannins and lignins are slowly mineralized, and the residual refractory materials are collectively termed humic and fulvic acids. The period of exposure of these materials to micro-organisms in the upper layers of the soil depends upon antecedent moisture conditions, rainstorm intensity, temperature, and evapotranspiration. An average estimate of the transport rate in the unsaturated zone of the Marmot Basin was 0.017 m/day suggesting that organic matter is exposed to heterotrophic uptake in the soil for at least several weeks. Bacteria aided by fungal hyphae are believed to be responsible for the breakdown of plant and animal material. Because infiltration, litter accumulation and temperature are at a minimum during the winter, most of the decomposition in the unsaturated zone probably occurs in the spring, summer, and autumn.
Water containing dissolved organic matter eventually reaches the water table and enters the saturated groundwater zone. Temperatures are uniformly low, usually reflecting the average atmospheric temperature in the
area throughout the year. Groundwater in the saturated zone may either begin to move towards the nearest stream, or it may be more deeply recharged and enter a regional groundwater system. In the Marmot Basin it has been shown that almost all groundwater is discharged by the streams draining the catchment area because of the presence of bedrock of low permeability. Saturated zone groundwater moves slowly (average velocity in the Marmot Basin is about 0.14 m/day) but the time taken to reach the stream also depends upon the distance it must travel. These groundwaters are often low in oxygen and in undisturbed areas they may be nutrient poor. Bacteria are believed to be the most important decomposing organisms at this stage, and they have been shown to be less metabolically active than their stream counterparts. Measurements of the ' ^ C / ' ^ C ratio in these waters suggest that dissolved organic matter is at least partially metabolized, and refractory materials are concentrated.
Rainstorms do not increase the concentration of dissolved organic matter in streams for three reasons. Most of the water which makes up storm-flow is groundwater containing low concentrations of DOM. The extra soluble organic matter contained in throughfall which falls"directly into the stream is more labile than that in groundwater and is quickly taken up. Benthic bacteria in the stream have been shown to be more metabolically active than groundwater bacteria so that even the small increase in DOM from higher levels in groundwater is also quickly metabolized. As a result of these phenomena, the load of DOM in a stream (product of discharge and concentration) depends upon the discharge in the undisturbed Marmot Basin more strongly than the concentration. Dissolved organic matter which survives the microbial attack in the stream may be considered to be highly refractory in nature.
Uptake rates for both labile and refractory compounds have been estimated in the Marmot Basin and in Laurel Creek. These data and others from the literature indicate that small labile compounds such as carbohydrates and amino acids are quickly metabolized at a rate which is proportional to the population of bacteria present. The uptake of more refractory compounds such as tannins and lignins and humic and fulvic acids is slower and some portions are never entirely mineralized. The presence of nutrients such as nitrate from agricultural sources appears
vii

to enhance the breakdown of dissolved organic nnatter in groundwater. The utilization of nitrate and DOM by soil bacteria may also stimulate denitrification. Fulvic acids appear to be the most refractory of all compounds and the addition of glutamic acid in large quantities to streams appears to stimulate the release of more glutamic acid than was added as well as other unidentified organic compounds tentatively labelled as Residual Dissolved Organic Carbon.
This mechanism may cause significant 'secondary' organic pollution leading to instability and population changes within the benthos. As groundwater sampled in agricultural areas in Southern Ontario contains much more DOM than was found in several forested basins, it is suggested that deforestation and farming contribute to the organic pollution of groundwaters.
viii

Resume
La question generale du devenir des matieres organiques dissoutes aboutissant dans les cours d'eau a fait I'objet d'une investigation qui s'est servie des techniques et des notions de I'hydrologie, de la biologie et de la chimie. Les experiences, menees en collaboration avec le centre des sciences environnementales de I'Universite de Calgary, ont principalement eu lieu dans le bassin du ruisseau Marmot. D'autres recherches ont ete effectuees pres de Leamington, en Ontario, dans une station des eaux souterraines equipee par P L U A R G , ainsi que sur le ruisseau Laurel, pres de Waterloo (Ontario), et en laboratoire.
Les matieres organiques dissoutes proviennent a la fois de la matiere vegetale vivante ou morte et, a un degre moindre, de la matiere animale en decomposit ion. Dans les forets, la chute saisonniere des feuilles et des aiguilles, et celle des brindilles, des branches et des troncs d'arbres contribuent a former la litiere qui constitue le sol forestier. Que cette couche ait tendance ou non a s'accumuler, elle subit la percolation de la pluie qui s'y infiltre pour rejoindre la zone non saturee des eaux souterraines. L'eau de pluie qui s'ecoule a travers la couverture vegetale peut se charger au passage de quantites significatives de matieres organiques a partir des plantes vivantes. Ces matieres organiques dissoutes et celles qui proviennent de la litiere en decomposition servent de nourriture aux micro-organismes du sol. Les plus labiles (glucides, proteines, hydrocarbures) et, dans une certaine mesure, les tanins et les lignines sont lentement mineralisees pour ne laisser qu'un residu de matieres refrac-taires: les acides humiques et fulviques. La duree de I'expo-sition de ces matieres a Taction des micro-organismes dans les couches superieures du sol depend des conditions anterieures d'humidite, de la pluviosite, de la temperature et de I'evapotranspiration. La vitesse moyenne estimative du transport dans la zone non saturee du bassin du Marmot etait de 0,017 m/j, ce qui porte a croire que les matieres organiques peuvent etre absorbees par les organismes heterotrophes du sol pendant au moins plusieurs semaines. On croit que les bacteries et les hyphes sont a I'origine de la decomposition des matieres vegetales et animales. Comme I'infiltration, I'accumulation de la litiere et la temperature sont minimales I'hiver, la plus grande partie de la decomposition dans la zone non saturee survient probablement au cours du printemps, de I'ete et de I'automne.
L'eau chargee en matieres organiques dissoutes s'achemine vers la nappe phreatique et penetre dans la zone saturee. La temperature y est uniformement basse, habituellement indicatrice de la temperature moyenne annuelle de I'atmosphere dans la region. Les eaux souterraines de la zone saturee peuvent soit s'ecouler vers le cours d'eau le plus proche, soit s'enfoncer davantage et etre prises en charge par un reseau d'ecoulement souterrain regional. Dans le bassin du Marmot, on a demontre que presque toutes les eaux souterraines aboutissent dans les cours d'eau du bassin, car la roche de fond est de faible permeabilite. Les eaux souterraines de la zone saturee se deplacent lentement (environ 0,14 m/j en moyenne dans le bassin du Marmot), mais le temps necessaire pour aboutir a un cours d'eau depend aussi de la distance a parcourir. Ces eaux souterraines se caracterisent souvent par leur faible oxygenation et, dans les regions non perturbees, elles peuvent montrer une faible teneur en substances nutritives. Les bacteries sont les decomposeurs les plus importants a cette etape et on a demontre que leur activite metabolique est inferieure a celle des bacteries fluviatiles. Des mesures du rapport C ' ^ / C ' ^ dans ces eaux portent a croire que les matieres organiques dissoutes sont au moins partiellement metabolisees, et que les matieres refractaires sont concentrees.
Les orages n'augmentent pas la concentration des matieres organiques dissoutes dans les cours d'eau et ce, pour trois raisons. La plus grande partie des eaux qui constituent le debit provoque par un orage sont des eaux souterraines de faible teneur en matieres organiques dissoutes. Les matieres organiques dissoutes supplementaires qui proviennent du feuillage et qui sont directement en-trainees par la pluie dans les cours d'eau sont plus labiles que celles des eaux souterraines et sont rapidement decom-posees. Les bacteries benthiques fluviatiles sont reputees plus actives que celles des eaux souterraines; ainsi, meme le leger enrichissement en matieres organiques dissoutes provenant des couches superieures des eaux souterraines est aussi rapidement metabolise. Par consequent, I'apport des matieres organiques dissoutes dans un cours d'eau (produit du debit et de la concentration) depend plus du debit rejete dans les parties non perturbees du bassin du Marmot que de la concentration. Les matieres organiques dissoutes qui resistent a la decomposition bacterienne
IX

dans les cours d'eau peuvent etre considerees comme etant fortement refractalres.
La vitesse de I'accumulation des composes labiles et refractalres a ete calculee pour le bassin du ruisseau Marmot et le ruisseau Laurel. Ces donnees ainsi que d'autres deja publiees indiquent que les composes labiles simples comme les glucides et les acides amines sont rapidement metabolises a une vitesse proportionnelle a la densite des bacteries presentes. L'accumulation des substances plus refractalres comme les tanins, les lignines et les acides humiques et fulviques est plus lente, et une partie de ces substances n'est jamais entierement mineralisee. La presence de substances nutritives, comme les nitrates d'origine agricole, semble favoriser la decomposition des matieres organiques dissoutes dans les eaux (souterraines. L'utilisation des
nitrates et des matieres organiques dissoutes par les bacteries du sol peut aussi stimuler la denitrification. II semble que les acides fulviques soient les composes les plus refractaires et que I'apport de grandes quantites d'acide glutamique dans les cours d'eau stimule une production d'acide glutamique superieure a la quantite ajoutee ainsi que celle d'autres composes organiques non identifies et pour I'instant reunis sous le nom de carbone organique dissous residuel. Ce mecanisme peut etre a I'origine d'une pollution organique «secondaire» significative aboutissant a une instabilite et a des changements au sein des populations benthiques. Comme les eaux souterraines etudiees dans les regions agricoles du sud de I'Ontario contiennent beaucoup plusde matieres organiques dissoutes que beaucoup des bassins forestiers etudies, le deboisement et I'agriculture semblent contribuer a la pollution organique des eaux souterraines.

CHAPTER 1
Introduction
It has long been recognized that streams in their natural state support a great deal more biomass than can be justified by primary production. This is believed to be the result of energy inputs to streams from terrestrial plants and animals which take the form of either Dissolved Organic Matter ( D O M < . 4 5 M spherical diameter), or Particulate Organic Matter (POM>.45^(). It has been common in the past to treat streams as isolated watercourses just as lakes were once treated as microcosms. Research in the last two decades has shown, however, that streams are not separate from the rest of the physical environment but are in fact intimately connected to their catchment basins. This holistic approach has perhaps been most completely described by Hynes (1975) who concluded that the valley rules the stream in every respect. Soil and climate control terrestrial vegetation which in turn provides the bulk of energy which is consumed by heterotrophic organisms in the stream. Primary production is rarely important in headwaters due to canopy cover and rapid flow, although algal blooms can be significant if these limitations are removed.
Fisher and Likens (1972) have divided fluvial organic sources into several broad categories as follows: litterfall, litter blown into the stream, throughfall (precipitation which has fallen through the forest canopy into the stream), and subsurface flow. Litter which falls directly into the stream or is blown into it is considered to be Particulate Organic Matter. Its surface is colonized by bacteria and the interior of the particle is often penetrated by fungal hyphae which help to break it up (Baerlocher and Kendrick 1975). After particulate organic matter has been colonized by bacteria and fungi it becomes an acceptable foodstuff for invertebrates such as Gammarus (Willoughby and Sutcliffe 1976, Baerlocher and Kendrick 1975), Trichoptera (Anderson and Grafius 1974), and other common inhabitants of streams including members of the Lepidoptera, Coleoptera, Diptera, and Plecoptera (Boling, Peterson and Cummins 1974). These invertebrates may be eaten in turn by other predators and so on up the food chain.
Dissolved organic matter enters the stream from groundwater, throughfall and precipitation, and from the leaching of particulate organic matter. Soluble organic matter in streams is taken up mostly by bacteria (Sepers 1977), but it can also be metabolized by fungi, although the latter are best adapted for ingestion of particulate
organic matter through the network of hyphae. Some invertebrates (Fenchel and Jorgensen 1977), and heterotrophic algae (Fogg 1971), can also release and absorb dissolved organic matter. Most of the heterotrophic uptake of DOM in streams takes place in the benthos as planktonic organisms are quickly swept away. A stationary organism benefits from a continual flow of nutrients whereas a passively moving one may be surrounded by the same 'pocket' of water for long periods of time unless there is turbulence (Hynes 1970). A detailed discussion of heterotrophic uptake appears in Chapter 4.
Fisher and Likens (1973) have provided a comprehensive annual organic energy budget for Bear Brook, a small soft water stream in New Hampshire. Over a one year period they found that about half of the energy input occurred as DOM (47%) and about half as POM (53%). Of the DOM inputs roughly half came from subsurface flow and half from upstream (presumably leaching of POM). Thirty- four per cent of this energy was consumed by the benthos, twenty per cent was exported as POM and forty-six per cent was exported as DOM. Turnover time was estimated to be one day for DOM, one year for leaves and twigs, and 4.2 years for branches. Dissolved organic matter constituted 70% of the organic energy leaving the stream so it is apparent that DOM is an important vector of energy flow. Despite the apparent importance of DOM in subsurface flow. Fisher and Likens (1973) concluded that groundwater neither dilutes nor enriches the stream. They sampled groundwater as seepage water which had already reached the surface, however, and so it may have been that considerable DOM had already been removed at the stream/seep interface given the observed rapid turnover of DOM.
A stream is only part of a catchment basin, however and with respect to volumes of water, it is usually the smallest part. Surface runoff represents only that water which has escaped evapotranspiration and has entered the subsurface flow system. If the transfer of organic matter to surface waters is to be fully understood, a complete hypothesis must be developed including precipitation and groundwater flow. Fisher and Likens (1973) concluded that only about 1% of the forest's productivity reaches the stream of which 47% entered the stream as DOM and 53% was POM. It is to be assumed that the rest of the
1

annual production is consumed terrestrially in a mature forest and the role of shallow groundwater flow might be expected to be important. Streams are, of course, intimately connected with the groundwater table. Water enters soil which is not yet saturated with water and then filters downwards under the influence of gravity. Not all pores are completely filled with water at this stage and so this part of the soil is known as the unsaturated zone. Eventually water reaches a zone of saturation which is caused by water piling up over some relatively impermeable layer, usually bedrock, and at the point of saturation (where the fluid pressure equals atmospheric pressure—Freeze 1974), the groundwater table has been reached. This subterranean table tends to follow the overlying topography and as streams occur at the lowest possible elevation within a watershed, groundwater (saturated) flows towards them. This process is completed by the removal of water downstream. Organic matter is leached from plant and animal litter and enters the groundwater system throughout the watershed. The maximum load which can enter this groundwater system is no less than all the leachable organic matter produced within the basin's boundaries. Presumably more than 1% of the forest's production is water soluble at some time and if so it is apparent that considerably more DOM may be entering the groundwater system than the stream. It is quite possible that most of the litter which falls onto the forest floor is rendered soluble at some stage by the microbial community as it is broken down for transport across cell membranes. It is possible, therefore, that organic energy inputs to the groundwater system are more important than has been previously recognized.
OBJECTIVES
The objectives of this study were therefore:
1. To sample the organic matter within the various aquatic compartments in small basins.
2. To investigate the mechanism of transfer of such organic matter through a study of hydrology.
3. To describe the uptake of DOM within groundwaters and streams.
4. To develop a working hypothesis to describe the fate of soluble organic matter within small upland catchment basins.
In more general terms the intention is to describe the sources of DOM within a natural basin, its transportation to the stream, and its utilization by the terrestrial and aquatic heterotrophic community. Towards this end data have been collected from several catchment basins and from laboratory experiments. Most of the experimental work was carried out in the Marmot Basin in southwestern Alberta in conjunction with the Environmental Sciences
Centre (Kananaskis), of the University of Calgary during the summer of 1977. Other field work was performed at Leamington, Ontario (an instrumented groundwater site which is part of the PLUARG programme), and some samples were also taken from local streams for random organic analysis around the University of Waterloo. Laurel Creek was chosen for some of the substrate disappearance experiments which are presented in Chapter 4. The Leamington site is described in Gillham and Cherry (1978) and the Laurel Creek site in Lush (1973).
Laurel Creek and Hillman Creek (Leamington site) are both hard water secon'd order streams flowing over sand and till of glacial origin. Laurel Creek has a hard cobble bottom while Hillman Creek has a silty bottom with thick organic sediments. These are hard water streams dominated by limestone and dolomitic rocks, and draining both forest belts and farmland in intensively farmed areas. As the bulk of the field work was performed at Kananaskis and a physical description is not readily available elsewhere, an account of the Marmot Basin is presented below.
MARMOT BASIN
Location and Climate
The Marmot Basin is located approximately 80 km west of Calgary, Alberta, in the most eastern range of the Rocky Mountains. The Environmental Sciences Centre is about 12 km north of the basin and both are located in the Kananaskis valley at latitude 51° N and longitude 115° W. The basin occupies an area of 9.2 km^ . Annual precipitation is between 90 - 130 cm of water, most of which occurs as snow. The spring melt accounts for about 70% of the basin's annual runoff (Stevenson 1967). Average annual temperatures range from between 14 to 18° C (maxima) and -12 to -18° C (minima). Chinook winds or alpine fdhnen are frequent and exert a considerable moderating influence in winter. Hail is not uncommon in summer. Summer rainstorms tend not to be intense and often persist for several hours. On overcast days, clouds often hover around the peak of Mount Allen.
Geology
The Marmot Basin occupies the Eastern half of Mount Allen (2743 m), a predominantly limestone mountain composed of late Jurassic and early Cretaceous rock. Shales and sandstones are also common within the watershed. Runoff water is basic with a pH of about 8.1 and a conductivity of about 250 lumho (Water Survey of Canada), a great deal of which is bicarbonate ion. Coal is found in this area and the nearest mine (now abandoned) is only
2
leOOm
CO Figure 1. Map of the Marmot Basin.

just outside the southern boundary of the watershed overlooking Ribbon Creek.
Vegetation
The Marmot Basin is in the subalpine forest region (Rowe 1972), and consists chiefly of six non-forested vegetation types (willow, heather, white dryas, sedge-everlasting, hairy wildrye, and kobresia), and ten forest types which include Lodgepole Pine, Engelmann Spruce, Fir, and Larch. A detailed discussion of vegetation types including a map prepared from infra-red satellite photography appears in Telang et al. (1975). Rapid elevation changes (1525 - 2743 m) are responsible for the large number of vegetation types, and most of the conifers are capable of hybridization where they overlap. The upper regions of the basin where sampling was carried out consist largely of Engelmann Spruce and sphagnum moss below the treeline. Willow, Larch, and Fir along with a number of grasses and sedges dominate alpine regions (above the treeline).
Physical Description and Instrumentation
The Marmot Basin is drained by three major confluent streams; Twin Creek, Middle Creek, and Cabin Creek, which join to form the Marmot Creek after which the basin is named (see Figure 1). Each major creek is also joined by various small ephemeral tributaries along its length. Twin Creek drains 269 hectares. Middle Creek 310 hectares. Cabin Creek 210 hectares, and the area below the confluence 130 hectares. The terrain is rugged and quite steep but serviceable roads extend to the main confluence of Twin Creek, the lower weir on Middle Creek, a clear-cut area on Cabin Creek, and along the northern boundary of the watershed. Cabin Creek was partially clearcut in a patchwork series several years ago and an account of the resulting chemical changes in the stream may be found in Telang et al. (1975). The basin is well instrumented with meteorological and hydrological equipment. Several weather stations provide precipitation, wind, radiation, temperature, and humidity data throughout the year and, as these records go back to 1962, a valuable data base has accumulated. Discharge is measured by a 120° V-notch weir on the main Marmot Creek, a 90° V-notch weir on Middle and Twin Creeks, and an H-flume on Cabin Creek and on Middle Creek in the Cirque (now out of repair and use). These data have also been collected for a number of years by the Canadian Forestry Service. Weirs and flumes are kept open during the winter using light bulbs and shelters at road serviceable sites and propane heat at the upper flume on Middle Creek.
tamination (coal oil was added to several piezometers in strategic positions to keep them from freezing and all wells have received chalk at some time). In 1976 a hillside site on Twin Creek was instrumented with the following; 7 lysimeters, 7 piezometers and 16 tensiometers (See Figure 3). A description of these instruments appears below.
Instrumentation 1976
A porous cup lysimeter (Soil Test Model 1900A) is designed to sample water in the unsaturated groundwater zone above the water table (where the fluid pressure is less than 1 atmosphere - Freeze 1974). It is operated by vacuum and consists of a porous ceramic cup attached to one end of a length of PVC pipe and stoppered at the other end by a rubber bung penetrated by a tube which is pinched off (See Figure 2). If the porous cup end is inserted into a
CLAMP
PVC OR STEEL TUBE
SLOTTED AND WRAPPED WITH FIBERGLASS CLOTH TO EXCLUDE SILT
PIEZOMETER
GLASS TUBE
SEALED PIEZOMETER FOR BACTERIOLOGICAL SAMPLING
PVC BODY
POROUS CERAMIC CUP
LYSIMETER SEALED LYSIMETER FOR BACTERIOLOGICAL SAMPLING
A number of wells and piezometers have also been installed in the basin but these were not used for this study either because of their location or because of con- Figure 2 . Groundwater installations.
4

close fitting hole (ie. good contact between the cup and soil), water from the soil will be drawn inside under negative pressure over a period of time. To prepare the lysimeter, the ceramic cup is first moistened with water. The whole apparatus is then pushed into the soil and the end is stoppered. Air is evacuated through a tube in the rubber stopper and the inside pressure is lowered by 15 cm of mercury. If the seal is adequate and the soil is reasonably moist, up to 100 ml of water can be withdrawn over 24 to 48 hours. Lysimeters were installed on 2 July, 1976 and inspected for water at 24 or 48 hour intervals depending upon moisture conditions.
Piezometers used in 1976 were constructed of 4.1 cm bore PVC pipe with slotted ends wrapped with fiberglass tape. It was originally intended to use these to sample the saturated groundwater zone (below the water table where the fluid pressure is greater than one atmosphere), at a number of sites but difficulties of installation limited groundwater access to one location. A 'Minuteman' gasoline operated drilling auger was brought in but was unable to penetrate the layer of small stones which can be found
at an average depth of half a meter throughout the basin. This layer of stones appears to be the original surface of the mountain remaining after the last period of glaciation. It is a discrete layer of loose stones which overlies the bedrock and supports a thin layer of immature alpine soil above it. The power auger was unable to penetrate this layer without snapping the auger stem and only one successful hole was drilled to a depth pf 1.5 meters. Six more shallow piezometers (0.4 m) were installed with a hand auger in a discharge zone (seep area). These were located together in a group near this piezometer, three of which were autoclaved before installation and specially treated for sterile bacteriological sampling (See Figure 2 and Chapter 4).
Tensiometers were installed to measure changes in moisture in the upper layers of the unsaturated zone. Changes in the interface between the saturated and unsaturated groundwater zones after rain falls can be measured with these instruments. Each tensiometer (Soiltest Model 2600A soil moisture gauge) consists of a length of porous tipped heavy plastic tube; an upper shaft with a scale in
T S i t e
TL 2 8 i T L 2 5
1 cnn= 2iT)
' P ' S i t e
tens iometers L P 3 6 ^ P 1 - 4 8
Twin C r e e k
Figure 3. Instrumentation above Twin Creek weir.
5

millibars attached to it, and a tube connecting the top of the porous tipped tube with a mercury filled cup (at the base of the scale) running right over the top of the shaft and down the whole length of the millibar scale. The porous tipped tube and the connecting tube were filled with water right down to the free mercury surface (see Figure 4). The principle behind this instrument is that water is withdrawn through the porous tip by the drier soil. This causes the water in the connecting tube to flow into the porous tipped tube and draws mercury up the scale. The height of the mercury column is then read in millibars and measurements must be corrected because each tip is slightly different. Calibration is performed by soaking the tip of the assembled instrument in water until the mercury in the clear tube comes to rest. The scale is then adjusted so that this level is zero, meaning complete saturation. Boiled water must be used to limit de-gassing which causes the water column to break and is the chief source of error with these instruments.
Tensiometers were read on most days and the raw data were then transformed into centimeters of mercury from millibars by multiplying by 0.075 (Handbook of Chemistry and Physics Chemical Rubber Co., Ed. 49; F229). As the system is designed to measure the head of water and not mercury, it is necessary to multiply by the density of mercury with respect to water (13.6 g/cc), to obtain a height of water in centimeters. Pressure head (h) is equal to the hydraulic head (H) minus the gravitational head (Z) (see Figure 4 for details). When the pressure head rises to zero, the water column is saturated (Klute 1967). Rainstorms introduce a wetting front which causes a positive change in the calculated value for h. The downward progress of this front may be plotted as deeper tensiometers respond in time. The rate of movement through the unsaturated zone is computed by measuring the length of time in days elapsed between the peaks in soil moisture over the known depth between instruments.
Instruments were installed in four nests at the Twin Creek site (see Figure 3). Each nest consisted of four tensiometers and one or two lysimeters. The nest on the north side of Twin Creek also included the seven piezometers. Clusters of instruments were placed on each bank about 5 m from the stream, halfway up the southern slope and at the top of the slope. In each case tensiometers were installed at depths of 6, 12, 18 and 24 inches (for convenience these depths were not converted to the metric system), and lysimeters were installed in pairs to a depth of about two feet (placed just over the rock layer described previously). Samples and readings were taken from these instruments and from all streams from 2 July to 22 July 1976.
2=0
T E N S I O M E T E R
So i l tes t M o d e l 2 6 0 0 A
H = h + Z H = Hydrau l i c Head = /J^^Cht. of H g ) ; / o ^ =13.6 g/ml Z = Grav i ta t iona l Head = Depth + 15 c m h = P r e s s u r e Head = - Hg (13.6)(0.075) - Z
Figure 4. Tensiometer.
Instrumentation 1977
The following year a new site was developed at the source of a small tributary to Middle Creek only about 200 m north of the Twin Creek Site (see Figures 5 and 1), called the Middle Creek Tributary. Five nests of tensiometers, six piezometers, and six lysimeters were installed. One piezomete;' and one lysimeter were modified for bacteriological sampling (see Figure 3). Piezometers were constructed of 1.2 cm bore steel pipe and hammered in; lysimeters and tensiometers were installed by hand augering. This site was a discharge zone which culminated in two distinct springs which fed the small tributary (maximum observed discharge 10 I/sec). Two major seeps joined the channel downstream and general seepage was observed along the banks. Sampling was carried out from 24 June (end of frost in ground) to 15 August 1977.
GEOLOGY AND GEOCHEMISTRY OF THE MARMOT BASIN
The underlying bedrock of the basin consists almost entirely of Mesozoic rock but an outcropping bench of Paleozoic quartzite can be observed at the main Marmot
6
20.4 m X
A-68
L2-42 • L 3 - 4 6 * •'
C-50
L6-59, SLC-40*
E -80 * SPD-60 •
D-75 •
L4-40 •
ELEVATION (m)
A-68 22.7 B-76 22.9 C-50 23.3 D-75 25.3 E-80 26.2
SPD-60 25.8 SLC-40 25.6
L2-42 24.7 L3-46 24.6 L4-40 24.3 L5-40 24.2 L6-59 25.7
0 DATUM - MIDDLE CREEK WEIR (MCW) -1770m ABOVE SEA LEVEL ELEVATION
17.8 m''
SITE B 8.2m x7.6m
SITEC X 2.2m elev.
1.6m
10 _ l _
20m
Figure 5. Map of the Middle Creek weir tributary.

weir. Carbonaceous, pyritic shales of Triassic age give way to flaggy, siltstone beds of the Spray River Formation (which underlie and crop out below the Cabin and main Marmot Creek confluence). Above this 'poker chip' shales of the Fernie formation are succeeded by a highly calcareous, silty limestone belt which is in turn overlain by a succession of sandstones, shales (with some coal), and conglomerates. All of these strata are exposed in the basin through thrust faulting or stream erosion. Four major glaciation periods have been identified, each smaller than the last. The glaciers covered most of the basin leaving bedrock exposed below their upper limits, and the last glacier is believed to have reached its maximum about 11,000 years ago. Frost-produced rubble covers most of the unglaciated areas. A more detailed geological history and description may be found in Stevenson (1967) and Stalker (1973) from whom this discussion was taken.
From a geochemical point of view it is evident that calcite and to a lesser extent, dolomite, will greatly influence the water chemistry of the basin. Siliceous shales and quartzites are also present but are much less soluble than calcareous material. Trace metals and nutrients (N and P)
are present in small amounts only in rocks of this type and minerals containing Na*, K* , and CT are also rare.
Water samples for inorganic chemical analysis were taken from May to August for this study to describe the changes in stream chemistry in detail over the spring runoff and these were supplemented by analyses performed by Water Survey of Canada throughout the year. In order to characterize the inorganic water chemistry of the Marmot Basin, two samples taken from Middle Creek and analyzed by Water Survey of Canada will be discussed in detail. Middle Creek was chosen because Cabin Creek has undergone extensive clear-cutting in the past and Twin Creek was being prepared for a similar operation at the time of this work. The samples chosen were both taken from the lower weir on January 6, 1977 and May 31, 1977. The first sample is assumed to be representative of winter low flow conditions, and the second was taken two days before the peak discharge of the spring runoff.
Concentrations of the various ions present are shown in Tables 1 and 2. Both samples are dominated by Ca**, Mg**, and H C O 3 ions at a basic pH but it is evident that the
Table 1. aiemical Analysis - Sample of January 6, 1977. 1215 MST Middle Creek Weir. Taken by Water Survey of Canada and Analyzed in the Calgary Laboratory.
Table 2. Chemical Analysis - Sample of May 31, 1977. 0045 MDT Middle Creek Weir. Taken by Water Survey of Canada and Analyzed in the Calgary Laboratory.
^ (activity coefO
(activity coefO
mg/l nieq molcs/1 ^ (activity
coefO mg/i meq moles/1 (activity
coefO
Cations Cations
Ca-*+ 49.7 2.49 10-2-9 10-.13 Ca++ 31.9 1.60 10-3.1 10--11
Mg++ 15.6 1.28 10-3.19 Mg++ 11.3 0.93 10-3.33
Na+ 1:3 0.06 10-4.25 Na+ 0.6 0.03 10-4.58
K+ 0.5 0.01 10-4.89 K+ 0.5 0.01 10-4.89
3.84 2.57
H+ 10-8 H * 10-8.1
Anions Anions
HCO 3" 199 3.26 10-2.49 10-.033 H C O 3 " 145 2.38 10-2.62 10-.028
SO 4" 26 0.54 10-3.57 S O 4 " 12 0.25 10-3.89
H 38104" 5 0.05
3.85
10-4.28 H 3 S i 0 4 - 4.1 0.04
2.67
10-4.37
C O 3= 10--13 C 0 3 =
Ionic Strength
10--11
Ionic Strength i 2 j 2 I = '/2 I miZ-
I = ViZm-.z; n 1 ' n
= '/2((4X10" 2-9) -H (4X10' -3.19) -H (10-''-25) + (10-4-89) = •/2((4X10~3 1) + (4X10 -3.33) + (10-4.58) + (10-4.89) +
- (4X10" 3.57) +-(io-2 49) ^ (10-4-28)) (10-2.62) + (4X10 -3 -8 9) + (10 -4.37))
= 10-2-2 = 0.0062 = 10-2.39 = 0.0041
spring sample is more dilute than the winter sample. Each is considered separately below.
Sample of January 6,1977 - Middle Creek Weir
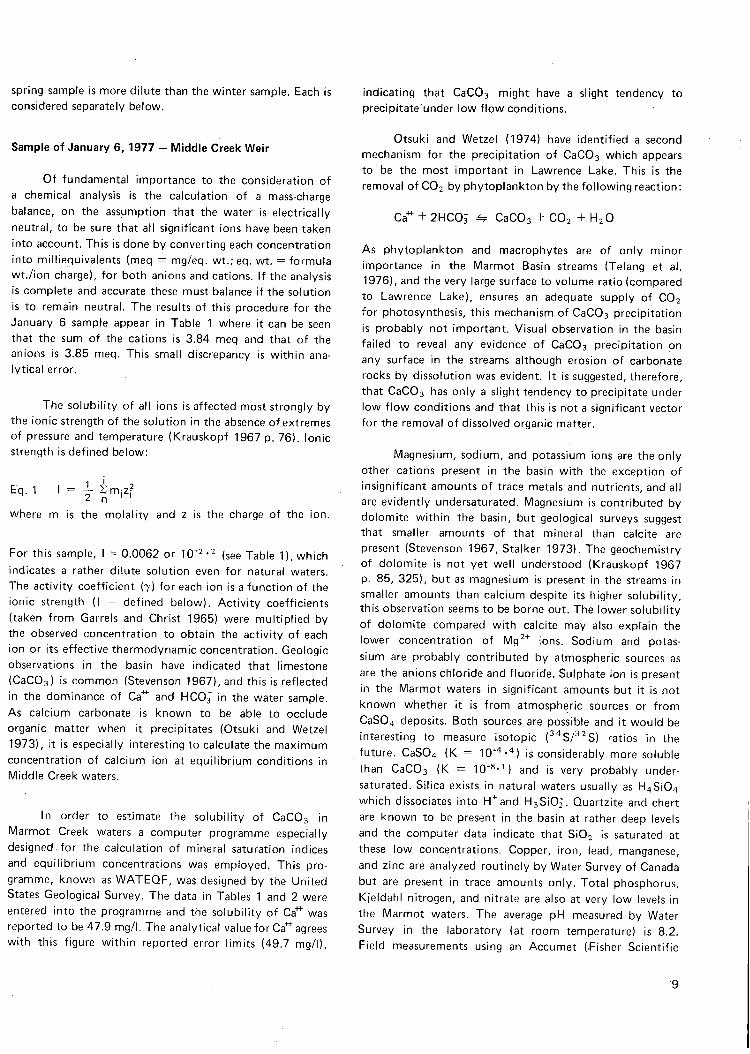
Of fundamental importance to the consideration of a chemical analysis is the calculation of a mass-charge balance, on the assumption that the water is electrically neutral, to be sure that all significant ions have been taken into account. This is done by converting each concentration into milliequivalents (meq = mg/eq. wt.;eq. wt. = formula wt./ion charge), for both anions and cations. If the analysis is complete and accurate these must balance if the solution is to remain neutral. The results of this procedure for the January 6 sample appear in Table 1 where it can be seen that the sum of the cations is 3.84 meq and that of the anions is 3.85 meq. This small discrepancy is within analytical error.
The solubility of all ions is affected most strongly by the ionic strength of the solution in the absence of extremes of pressure and temperature (Krauskopf 1967 p. 76). Ionic strength is defined below:
E q . i l = | ^ m i z f
where m is the molality and z is the charge of the ion.
For this sample, I = 0.0062 or lO"^-^ (see Table 1), which indicates a rather dilute solution even for natural waters. The activity coefficient (7) for each ion is a function of the ionic strength (I — defined below). Activity coefficients (taken from Garrels and Christ 1965) were multiplied by the observed concentration to obtain the activity of each ion or its effective thermodynamic concentration. Geologic observations in the basin have indicated that limestone (CaCOs) is common (Stevenson 1967), and this is reflected in the dominance of Ca'^ and H C O 3 in the water sample. As calcium carbonate is known to be able to occlude organic matter when it precipitates (Otsuki and Wetzel 1973), it is especially interesting to calculate the maximum concentration of calcium ion at equilibrium conditions in Middle Creek waters.
In order to estimate the solubility of CaCOs in Marmot Creek waters a computer programme especially designed for the calculation of mineral saturation indices and equilibrium concentrations was employed. This programme, known as WATEQF, was designed by the United States Geological Survey. The data in Tables 1 and 2 were entered into the programme and the solubility of Ca^ was reported to be 47.9 mg/l. The analytical value for Ca^ agrees with this figure within reported error limits (49.7 mg/l).
indicating that CaCOa might have a slight tendency to precipitate under low flow conditions.
Otsuki and Wetzel (1974) have identified a second mechanism for the precipitation of CaCOs which appears to be the most important in Lawrence Lake. This is the removal of CO2 by phytoplankton by the following reaction:
Ca^ + 2HC0i ^ CaCOa + CO2 + H2O
As phytoplankton and macrophytes are of only minor importance in the Marmot Basin streams (Telang et al. 1976), and the very large surface to volume ratio (compared to Lawrence Lake), ensures an adequate supply of CO2
for photosynthesis, this mechanism of CaCOs precipitation is probably not important. Visual observation in the basin failed to reveal any evidence of CaCOa precipitation on any surface in the streams although erosion of carbonate rocks by dissolution was evident. It is suggested, therefore, that CaCOs has only a slight tendency to precipitate under low flow conditions and that this is not a significant vector for the removal of dissolved organic matter.
Magnesium, sodium, and potassium ions are the only other cations present in the basin with the exception of insignificant amounts of trace metals and nutrients, and all are evidently undersaturated. Magnesium is contributed by dolomite within the basin, but geological surveys suggest that smaller amounts of that mineral than calcite are present (Stevenson 1967, Stalker 1973). The geochemistry of dolomite is not yet well understood (Krauskopf 1967 p. 85, 325), but as magnesium is present in the streams in smaller amounts than calcium despite its higher solubility, this observation seems to be borne out. The lower solubility of dolomite compared with calcite may also explain the lower concentration of Mg^* ions. Sodium and potassium are probably contributed by atmospheric sources as are the anions chloride and fluoride. Sulphate ion is present in the Marmot waters in significant amounts but it is not known whether it is from atmospheric sources or from CaS04 deposits. Both sources are possible and it would be interesting to measure isotopic (''^S/^^S) ratios in the future. CaS04 (K = IO"'-'') is considerably more soluble than CaCOs (K = 10"**M and is very probably under-saturated. Silica exists in natural waters usually as H4Si04 which dissociates into H*and HjSiOj. Quartzite and chert are known to be present in the basin at rather deep levels and the computer data indicate that Si02 is saturated at these low concentrations. Copper, iron, lead, manganese, and zinc are analyzed routinely by Water Survey of Canada but are present in trace amounts only. Total phosphorus, Kjeldahl nitrogen, and nitrate are also at very low levels in the Marmot waters. The average pH measured by Water Survey in the laboratory (at room temperature) is 8.2. Field measurements using an Accumet (Fisher Scientific
9
Co.) portable pH meter confirm these values. Water temperatures are low/, rarely rising above 10° C even in the summer.
Sample of May 31, 1977 - Middle Creek Weir
The calculations performed on the data from the sample of 6/1/77 were repeated and the conclusions remain the same (see Table 2). The sample of May 31, 1977 was taken two days before the peak daily discharge of the spring runoff and is assumed to be representative of spring conditions. Dissolved constituents are present in the same relative amounts, but the ionic strength has decreased to 0.0041 reflecting the dilution by meltwaters. The solubility of CaCOa has decreased to 31.1 mg/l (analytical Ca** = 31.9 mg/l), and so the same conclusions concerning the precipitation of.CaCOs appear to be valid. The relationships among the other dissolved ions have not changed significantly.
The preceding analyses suggest that CaCOs does not precipitate to any great extent in Middle Creek, and so is probably not an important agent for the removal of organic matter. This conclusion is different from the findings of Otsuki and Wetzel (1974) for Lawrence Lake but agrees
with Lock and Hynes (1975) for an experimental apparatus designed to simulate stream conditions. It may be that this is a general truth, that CaCOa does not precipitate organic matter in most streams where phytoplankton are not abundant, and CO2 is freely available from the atmosphere. Lakes, on the other hand, behave differently because of the constant depletion of COj in stratified water columns by phytoplankton. The question of CaCOs precipitation by exceeding the solubility of CaCOa is still open, but the low concentrations of Ca** found in most unpolluted, flowing surface waters and the abundance of CO2 from atmospheric and biological sources render this questionable (Davis and De Wiest 1966 p. 98 and 102),
In addition to the data above, oxygen analyses were carried out in the laboratory. Oxygen concentrations were high, ranging from 70 to 90% of saturation, A more complete discussion of oxygen in Marmot waters appears in Chapter 4, The concentration of all dissolved constituents in the Marmot Basin was rather constant over the study period and background data from Water Survey of Canada over the last ten years confirm this. These streams are fairly undisturbed (especially Middle Creek) and appear to be stable as might be expected from the results of Likens et al. (1970) and Fisher and Likens (1973),
10

CHAPTER 2
Sources and Description of DOM
The only significant source of organic matter which enters surface and groundwaters is terrestrial plant and animal biomass. We are interested in organic matter which enters the hydrologic cycle, however, so it is convenient to treat soluble organic matter which is mobilized by snow and rain as separate 'sources' as they are distinct in the environment. These two vectors of organic energy eventually merge in the soil in the liquid state. Samples were taken from snow and rain (which had dripped through the trees) whenever possible and were analyzed for dissolved organic matter and major ions when volumes collected permitted. (Standard Methods -APHA 1971).
ORGANIC ANALYSIS AND ERROR LIMITATIONS
Quantitative organic analysis for Marmot Basin samples in 1976 was performed by the Environmental Sciences Laboratory of the Dept. of Chemical Engineering at the University of Calgary using a Beckman 915 Total Organic Carbon Analyzer. Their analysis did not include filtration, so the resulting data are estimates of Total Organic Carbon. From an analytical point of view this was a mistake as the results were unrealistically high and too variable to inspire confidence. Unidentified standards at a high concentration (5 g/l) were submitted and returned with a standard error of 300 mg/l (8 replicates), or ±5.2%. For these reasons it was assumed that the higher results and the greater variability were caused by the lack of filtration and by the lengthy storage time of samples before analysis (up to four weeks). It is possible that bacteria in the sample were able to convert particulate matter to the dissolved state or that a particle of organic matter was injected into the machine (needle orifice — 170 m/:j).The latter was less probable as the final estimate of the organic content of each sample is the average of several injections and large variations were not included in the mean. For these reasons, TOC data collected in 1976 were considered to be inaccurate and were not used.
Samples taken in 1977 were treated more carefully as they were filtered through a 0.45 mfi glass fiber filter (Reeve Angel 934 AH) within a short period of time at the Kananaskis field station. Samples were analyzed by wet oxidation after the method of Macioiek (1962). Filtration was performed immediately upon return from the basin
and the filtrates placed in a drying oven at 90° C, thereby reducing any effects of the aquatic bacteria to a minimum. Bacteria are capable of doubling their numbers within an hour under the appropriate conditions so the time span between sampling and analysis was kept to a minimum (usually less than two hours). A series of eight replicates yielded a standard error of 0.1 mg/l for stream water. This error limit was reached after about 100 samples had been analyzed using this method.
SNOW AND ITS ORGANIC CONTENT
About 75% of the precipitation which falls on the Marmot Basin is snow (Stevenson 1967, Storr 1977). This amounts to about 93 cm of water per year (11 year average for all three subbasins — Storr 1977). An examination of the Hydrometeorological Records (Water Survey of Canada) for 1973 and 1974 reveals that the snow pack builds up slowly from October, peaks in May, and rapidly drops off to the end of June (Snow Pillow data). The rapid decline of the snow pack in May and June coincides with the peak annual discharge in the streams and the groundwater table. While, there is undoubtably some loss of water from the snow pack during periodic thaws and from sublimation, the winter stream hydrographs show no significant discharge peaks. Sublimation probably does not remove large amounts of organic matter from the snow, so it is presumed that organic matter in snow accumulated through the winter is released over a period of several weeks in the spring.
Organic matter in snow was collected by filling up a self-sealing plastic bag with snow. On returning to the laboratory, the snow was allowed to melt and then treated as a regular water sample. Eighteen samples taken in 1977 gave an average of 3.6 mg/l of dissolved organic carbon (Table 3, Fig. 6). No distinction is made between new and old snow as the former was scarce even in May and too few samples were obtained to be significant (2 samples only were considered to be free of old snow). New snow in the spring melted quickly and seemed to be capable of leaching organic matter from the spruce trees. Water which was running down branches and dripping from the twigs was observed to be stained with a brown leachate and was collected in the rain samplers (see below). Old snow was considerably compacted by the spring and had a high water yield. Melting snow packs were full of particles of plant
11
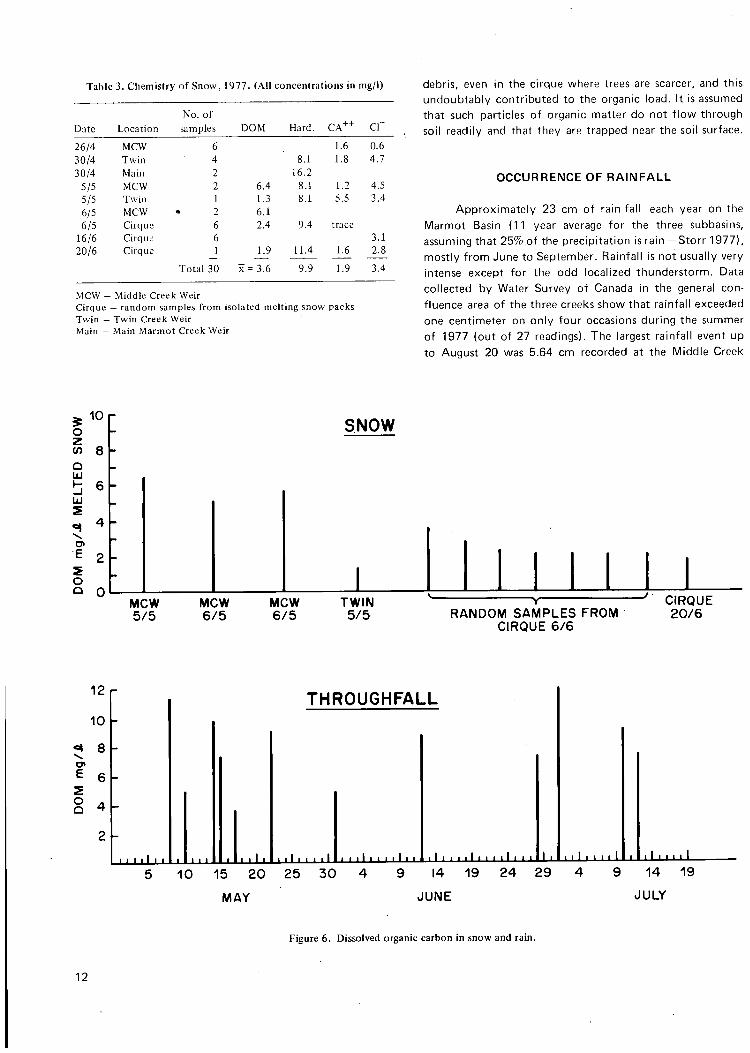
Table 3. Chemistry of Snow, 1977. (All concentrations in mg/l)
No. of Date Location samples D O M Hard. c r 26/4 MCW 6 1.6 0.6 30/4 Twin 4 8.1 1.8 4.7 30/4 Main 2 16.2
5/5 M C W 2 6.4 8.1 1.2 4.5 5/5 Twin 1 1.3 8.1 5.5 3.4 6/5 MCW 2 6.1 6/5 Cirque 6 2.4 9.4 trace
16/6 Cirque 6 3.1 20/6 Cirque 1 1.9 11.4 1.6 2.8
Total 30 X = 3.6 9.9 1.9 3.4
MCW - Middle Creek Weir Cirque — random samples from isolated melting snow packs Twin - Twin Creek Weir ' Main — Main Marmot Creek Weir
debris, even in the cirque where trees are scarcer, and this undoubtably contributed to the organic load. It is assumed that such particles of organic matter do not flow through soil readily and that they are trapped near the soil surface.
OCCURRENCE OF RAINFALL
Approximately 23 cm of rain fall each year on the Marmot Basin (11 year average for the three subbasins, assuming that 25%.of the precipitation is rain —Storr 1977), mostly from June to September. Rainfall is not usually very intense except for the odd localized thunderstorm. Data collected by Water Survey of Canada in the general confluence area of the three creeks show that rainfall exceeded one centimeter on only four occasions during the summer of 1977 (out of 27 readings). The largest rainfall event up to August 20 was 5.64 cm recorded at the Middle Creek
10 r SNOW
MOW 5 / 5
M C W 6 / 5
M C W 6 / 5
T W I N 5 / 5 R A N D O M S A M P L E S F R O M
C I R Q U E 6 / 6
C I R Q U E 2 0 / 6
12
10
8
6 E
§ 4
THROUGHFALL
LL _LL LL • I•• ..I LL _ L J j_ 1 0 15 2 0 2 5 3 0
M A Y
9 14 19 2 4 2 9
J U N E
9 14 19
J U L Y
Figure 6. Dissolved organic carbon In snow and rain.
12

Weir by an unofficial rain gauge. The average rainfall event was between 0.6 and 0.7 cm in a 24 hour period. Rainfall data from five locations monitored by Water Survey of Canada appear in Table 4.
The installations maintained by Water Survey of Canada measure precipitation, that is to say rain which falls directly into a gauge not obstructed by any vegetation. Figliuzzi (1976), however, has shown that throughfall (rain which is intercepted by the vegetation) is significantly less than precipitation. He found that the amount of throughfall depends upon the season of the year, the intensity and duration of the precipitation event, and upon the type of tree cover, age, and density of the stand. Figliuzzi's data for a medium density aspen and black spruce forest in north central Alberta (Spring Creek Watershed) are reproduced in Table 5. Three sites were instrumented and he concluded that the seasonal percentage of throughfall is very constant. In order to test this hypothesis in the Marmot Basin, one Canada Standard rain gauge was set out in the open and one was set under the trees a short distance away at the Middle Creek Weir site. Unfortunately no more rain gauges were available and the results are less than conclusive, but the trend remains the same (see Table 6). In May there is a very strong relationship between throughfall and precipitation and the minimum precipitation causing throughfall (threshold precipitation) is about zero. The results from June and July are inconclusive as they indicate an inverse relationship which is clearly impossible. It is assumed that the data are insufficient. Data collected in August seem to be more reasonable, indicating a linear relationship with a threshold precipitation of 0.68 cm required to produce any throughfall at all. Throughfall as a percentage of precipitation in August is much lower
Table 5. Relationship between Throughfall and Precipitation (Taken from Figliuzzi 1976).
Month liquation No. of samples r
May T = . 8 6 P - .03 38 0.99
June T = . 8 3 P - .02 65 0.98
July T = . 7 0 P - .004 85 0.95
August T = . 8 4 P - .04 76 0.98
Scptcni bcr T = . 7 7 P - .02 62 0.95
October T = . 8 0 P - .002 33 0.98
Year 1969 1970 1971 1972 1973 1974
Gross rainfall (cm) 21.2 22,4 28.7 24,3 39.1 21.4
Throughfall (cm) 13.5 16.0 24,0 20.8 30.5 15.8
Interception + stcmflow (cm) 7.7 6.4 4.7 3.5 8.6 5.6
Throughfall as a % of gross rainfall 63.3 71.4 83.3 85.8 78.6 74.0
mean %=76 .1 , S D = 8 . 3
Table 4. Amount of Rainfall (in cm) — Water Survey of Canada data 1977.
Date Con, 1 Con. 2 Con. 3 Con . 4 Con. 5
May 31 1,04 1.32 1,63
June 2 0,56 . 0.53 0.53 7 0.58 0.48 8 0,03 0.03 0.05
13 0,53 0.51 0.46 14 0,03 0.61 0.51 15 0,15 0,15 0.2 21 0.18 0.23 27 0,71 0.66 0.81 28 0,71 1.35 0,48 0.58 29 0.69 0.84 0.81
July 4 0,56 0,66 0.64 5 0.05 1.5 1.35 0.08 0.08
11 1.12 1.24 1.35 12 0.13 • 1.42 1.52 0.10 0.18 13 0.94 0.99 1.09 14 0.05 0.08 0.10 15 0.18 0.18 0.18 18 1.30 1.27 1.27 19 2.64 2.54 27 0.15 0.13 0.15 29 0.66 0,71 0.79
Aug. 2 0.05 1.14 1.04 0.05 0.15 3 0.13 0,15 0.18 4 0,23 0.33 0.20 5- 0.13 0.15 0.20 6 1,70 1.75 1.88 9 0.61 3.35 3.35 0.81 0.94
10 0,03 0.05 0.05 12 0.36 0,38 0.43 15 3,94 4.01 3.94 16 4.06 4.65
Total 16.50 16.80 15.70 17.70 18,90
C o n , 1 ,4 , and 5 were read daily except on weekends. C o n . 2 and 3 were read weekly.
13
than that which occurred in IVlay (ignoring the data from June and July) , probably as a result of drier conditions. It is accepted that these data are not sufticent to be statistically valid, but in combination with those of Figliuzzi (1976) it is concluded that the canopy exerts a considerable influence on precipitation, trapping some as stemflow and perhaps permitting evaporation from a large surface area which would concentrate the remainder.
Table 6. Comparison between Precipitation and Throughfall at Middle Creel< Weir - 1977.
Date Precipitation
(cm) Throuahfall
(cm) ^ t h r u
Prec.
May 17 2.2 1.5 68 19 0.68 0.38 55.9 24 1.04 0.87 83.7 28 0.32 0.24 75
June 3 0.44 0.38 86.4 15 0.59 0.51 86.4
July 2 0.51 0.47 92.2 10 1.02 0.14 13.7 13 1.2 0.27 22.5 20 1.4 0.06 4.3
Aug. 2 1.0 0.03 3 4 0.57 0.'l2 21.1 5 1.76 0.08 4.5
15 5.64 0.99 17.6
R E L A T I O N S H I P B E T W E E N P R E C I P I T A T I O N A N D T H R O U G H F A L L
Tlircshold Month Equation r Precipitation
May
June _ July
August
Thru
Thru
Thru
= 0.69 Prcc. -1-0.018
= - . 39Prcc . - f0 .64
= 0.19 Prcc - 0.13
0.98
-0.88
0.97
0
7
0.68
ORGANIC MATTER IN THROUGHFALL
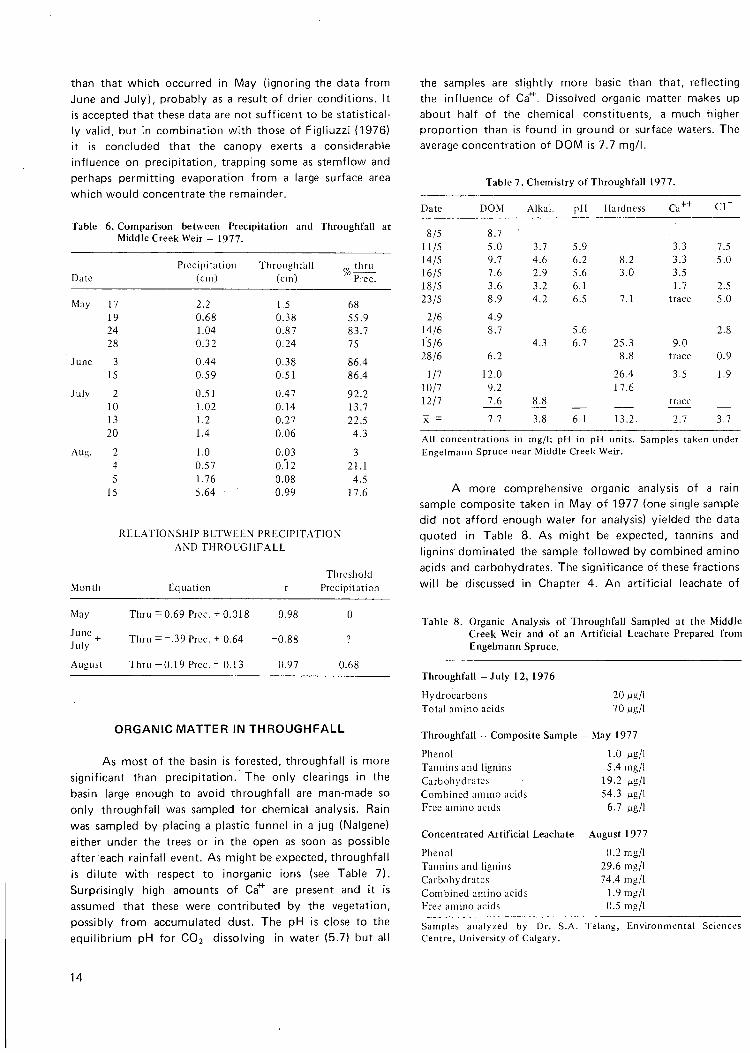
As most of the basin is forested, throughfall is more significant than precipitation. The only clearings in the basin large enough to avoid throughfall are man-made so only throughfall was sampled for chemical analysis. Rain was sampled by placing a plastic funnel in a jug (Nalgene) either under the trees or in the open as soon as possible after each rainfall event. As might be expected, throughfall is dilute with respect to inorganic ions (see Table 7). Surprisingly high amounts of Ca"^ are present and it is assumed that these were contributed by the vegetation, possibly from accumulated dust. The pH is close to the equilibrium pH for C O 2 dissolving in water (5.7) but all
the samples are slightly more basic than that, reflecting the influence of Ca"^. Dissolved organic matter makes up about half of the chemical constituents, a much higher proportion than is found in ground or surface waters. The average concentration of D O M is 7.7 mg/l.
Table 7. Chemistry of Throughfall 1977.
Date D O M Alka l . pH Hardness C l
8/5 8.7 11/5 5.0 3.7 5.9 3.3 7.5 14/5 9.7 4.6 6.2 8.2 3.3 5.0 16/5 7.6 2.9 5.6 3.0 3.5 18/5 3.6 3.2 6.1 1.7 2.5 23/5 8.9 4.2 6.5 7.1 trace 5.0
2/6 4.9 14/6 8.7 5.6 2.8 15/6 4.3 6.7 25.3 9.0 28/6 6.2 8.8 trace 0.9
1/7 12.0 26.4 3.5 1.9 10/7 9.2 17.6 12/7 7.6 trace
X = 7.7 3.8 6.1 13.2. 2.7 3.7
All concentrations in mg/l; pH in pH units. Samples taken under Engelmann Spruce near Middle Creek Weir.
A more comprehensive organic analysis of a rain sample composite taken in May of 1977 (one single sample did not afford enough water for analysis) yielded the data quoted in Table 8. As might be expected, tannins and lignins dominated the sample followed by combined amino acids and carbohydrates. The significance of these fractions will be discussed in Chapter 4. An artificial leachate of
Table 8. Organic Analysis of Throughfall Sampled at the Middle Creek Weir and of an Artificial Leachate Prepared from Engelmann Spruce.
Throughfall - July 12, 1976
Hydrocarbons 20 ^g/1 Total amino acids 70 Mg/I
Throughfall - Composite Sample - May 1977
Phenol 1.0 Mg/ l Tannins and lignins 5.4 mg/l Carbohydrates 19.2 Mg/l Combined amino acids 54.3 Mg/ l Free amino acids 6.7 Mg/ l
Concentrated Artif icial Leachate -- August 1977
Phenol 0.2 mg/l Tannins and lignins 29.6 mg/l Carbohydrates 74.4 mg/l Combined amino acids 1.9 mg/l Free amino acids 0.5 mg/l
Samples analyzed by Dr. S.A. Telang, Environmental Sciences Centre, University of Calgary.
14

Engelmann Spruce twigs prepared by large volume Soxhiet Extraction apparatus also demonstrated the importance of tannins and lignins. As the sample was concentrated into a brown 'tea', the absolute magnitude of the concentrations is not relevant. Carbohydrates dominated the sample but as the leachate was boiled for several days at a low pH, this reflects the acid hydrolysis of structural polysaccharides. An independent analysis of hydrocarbons and total amino acids in the rain sample of 12 July 1976 (courtesy of S.A. Telang) gave values of 20 pg/l and 70/ig/l respectively, (see Table 8) roughly an order of magnitude greater than the levels normally encountered in stream water. It is unfortunate that more analyses of important organic components were not possible because of limited sample volumes and the capacity of the Calgary laboratory to undertake analysis.
SOURCES OF ORGANIC MATTER FROM THE ORGANISMS' POINT OF VIEW
Within a catchment basin it is easy to distinguish the terrestrial and stream decomposer communities. Organisms in the soil receive organic matter and nutrients from decomposing plant and animal matter which falls on the forest floor, and stream organisms are dependent upon what reaches them from upstream and groundwater sources. The quantity, quality and rate of transfer of organic energy are quite different for each community.
SOIL TYPE IDEPTH (cm)
LITTER MOSS NEEDLES
CHARCOAL BURNT WOODi HUMUS ROOTLETS BLACK EARTH
BROWN SOIL
10-15
5 - 1 0
TERRESTRIAL DECOMPOSITION AS A SOURCE OF DISSOLVED ORGANIC MATTER
The soils under the spruce-fir dominated forest in the middle elevation range of Mount Allen are Podzolic. Above the treeline soils are classified as Alpine Black and in the Lodgepole Pine community at lower elevations the soils are Brunisolic in nature (Stevenson 1967). Groundwater installations were placed under the spruce-fir forest so only Podzolic soils are discussed below.
The soil profile was exposed by digging a pit near the Middle Creek Weir on June 18, 1977. General identification of soil horizons was made using the Larousse Encyclopedia of the Earth (1973), and the results appear in Figure 7. The profile is not complex except for the layer of moss penetrating the A Q horizon. This layer was variable in thickness and appeared to be a significant contributor to the humus in the A , horizon. Peak needle fall occurs in the autumn so very few fresh needles were found on the soil surface, although the entire A horizon contained needles in various stages of decay. Charcoal and burnt wood were clearly visible in the Aj horizon at a depth of about 10 cm (below the moss surface). As the spruce in this area are
Figure 7. Soil profile at Middle Creek weir.
quite mature (estimated age 50 - 60 years; Z. Fisera, Canadian Forestry Service - pers. comm.) it is inferred that the rate of soil accumulation is very slow. The B horizon reaches downward for about 30 cm and is granular in nature with stones interspersed at random. At a depth of approximately 50 cm a dense layer of small stones is encountered which is thought to represent the original face of the mountain left after the last period of glaciation (see page 14 and Figure 7). That portion encountered around the Middle Creek Weir is probably the upper portion of the densely fractured siltstone shales of the Lower Cretaceous — Kootenay formation (Stevenson 1978 in press) which underlie this area.
Millar (1974) has outlined the general process of decay of conifer needles. Freshly fallen undecomposed needles are infected by fungi. As they are buried by litter falling on top of them, they become more fragmented, interlaced with hyphae, and the mesophyll of the needle collapses. Eventually a humus-rich layer accumulates which becomes intimately mixed with the mineral soil. No data were collected to verify this chain of events in the Marmot
15

Basin but it is assumed to be generally valid with the
realization that moss is also present. The lower layer of the
moss was white, damp, and evidently decomposing along
side the conifer needles. Moisture and temperature are
generally considered to be the most important factors
regulating decomposition (Millar 1974, Parkinson and'
Coups 1963, van der Drift 1963). Excess moisture can actually retard the rate of decomposition since it may cause
a lack of aeration and a reduction of microbial activity
(Millar 1974). Fungi are believed to be chiefly responsible for the breakdown of moss (Frankland 1974) and both fungi and bacteria for the breakdown of conifer needles
(Millar 1974). Fungal degradation may commence several months before needle fall (Burges 1963). Various members of the meiofauna aid in the breakdown of litter, chiefly by
eating fragments and removing the microbes from it, leaving
the faeces for further recolonization. The complete decom
position of needles usually takes several years (Stout, Tate
and Molloy 1977, Burges 1963).
The rate of decomposition decreases with depth
(Parkinson and Coups 1963), as the more labile chemical constituents are leached and metabolized first. Millar
(1974) states that the first substances decomposed in a
conifer needle litter are the water soluble, alcohol and
benzene extractives such as starch, hemicelluloses and
amino acids. Inorganic residues and lignins are decomposed
later. The remaining humus contains humic and fulvic acids,
various hydrolyzable residues, and about 7% waxes, lignins,
cellulose, hemicellulose, and sugars listed in increasing order
of decomposition rate. In general, humic and fulvic acids,
tannins and lignins, and structural polysaccharides tend to
accumulate, as amino acids and sugars are more quickly
broken down (Schnitzer and Desjardins 1969; Stout, Tate and Molloy 1977). Leaching of these soluble substances occurs as water moves downwards towards the water table
so that the ultimate fate of soluble decomposition products
is to be partially mineralized and partially washed deeper
into the soil. Fungi and bacteria subject terrestrial litter
to a relentless attack as soluble material is mobilized down
ward by infiltrating throughfall.
In order to gain an estimate of the amounts of soluble
organic material transported, samples were taken from the
saturated and unsaturated groundwater zones and subjected
to analysis. Piezometers were used for the former and
lysimeters for the latter (see Chapter 1). Dissolved organic matter taken with lysimeters from the upper 50 cm of soil (see Figure 8) ranged from 6.4 to 69 mg/l with an average of 21.2 mg/l (23 samples). The concentration was variable between samples but all three sites (six lysimeters were
installed in pairs but water was not always obtained from
both) were in the same range. The average level of organic
matter is almost exactly one order of magnitude higher
10
6
2
10 6
2
10
6
2
h B76
h C50
1,10 Z 6 O p CQ ^ OC
Z 10 < c O o
O ^ O ^ 40
O 30
Q 10
40
30
20
10
40
30
20
10
h D75
k ESO
I I I I I I I I I I I I I I I I I I I I I I I I I I I I
' A 68
L L2-L3 site '69
- L4-L5 site L5
- L6 site
1 1 i . 1 I 1 1 1 I 1 1 l i 1 1 < 1 • • 1 1 1 1 1 1 1 1 I J 1 1 , , , , 1 ,
30 5 10 15 20 25 30 4
JULY 1977
Figure 8. Dissolved organic carbon in groundwater.
than that found in surface waters of the Middle Creek
Tributary. Fifty-one samples from that tributary gave an
average of 4.9 mg/l of DOM but the small volume of
samples obtained precluded any additional analysis for
inorganic constituents. The small amount of organic matter
found in saturated groundwater is in agreement with Lush
(1973), Leenheer et al. (1974), and Wallis (1975) among others. Analyses of saturated zone groundwater by Dr. S.A.
Telang yielded the data in Table 9. The partial analysis of 8 July and 13 July, 1976 demonstrates a higher level of both hydrocarbons and amino acids compared with stream
water (see below for discussion of stream water). The more
complete analysis performed in 1977 shows the dominance
16

of humic and fulvic acids, followed by tannins and lignins. Carbohydrates, amino acids and phenols are all at quite low levels, even compared with stream water. This may reflect the delay in analysis (several weeks). The predominance of humic and fulvic acids is predicted by the discussion on page 16, for as both of these samples were taken in groundwater discharge zones, they probably contain the end products of terrestrial decomposit ion.
Table 9. Organic Analysis of Groundwater.
G R O U N D W A T E R F R O M P I E Z O M E T E R B (TWIN C R E E K SITE), 1976
Date Hydrocarbons Total Amino Acids
July 8 64 Mg/l 159 Mg/l July 13 - 98 Mg/l
G R O U N D W A T E R F R O M P I E Z O M E T E R A-68 ( M I D D L E C R E E K T R I E . SITE) J U L Y 10, 1977
Fraction Mg/l % of Total
Humic and fulvic acids 1800 89.6 Tannins and lignins 170 8.4 Carbohydrates 21 1.1 Combined amino acids 13.8 0.7 Free amino acids 3.03 0.2 Phenols 0.001 -
Analysis courtesy of Dr. S .A . Telang - Environmental Sciences Centre, University of Calgary.
SOURCES OF DISSOLVED ORGANIC MATTER TO STREAM ORGANISMS
In turbulent, fast moving streams such as the Marmot Creek headwaters nearly all of the organisms live in the benthos. Most of the bacteria in the stream exist in a mat of slime coating rock surfaces on the bottom and the larger animals are associated with them (Telang et al. 1976). This slime layer is surprisingly thick for an unpolluted stream, indicating a high degree of heterotrophy. To an organism living on the bottom of a stream, there are two apparent sources of organic matter. These are dissolved organic matter from groundwater passing through the sediments and dissolved and particulate organic matter which is brought down from upstream. The pathway of decomposition of particulate organic matter has been vvorked out exhaustively by a number of workers (Cummins et al. 1973, Iverson 1973, 1975, Fisher and Likens 1973 and others). Leaves and twigs are not very useful substrates when they first enter a stream to anything but bacteria and fungi. Only after colonization by these organisms does the leaf litter become useful to invertebrates. Solid detritus is metabolized extracellularly by bacteria and the breakdown
products are transported across the cell membrane by an active transport process. A t this point it may be said that particulate matter must pass through a dissolved stage before metabolization. Once the surface of particulate detritus has been colonized, however, it becomes an acceptable substrate for shredding invertebrates such as Tipula (Diptera) and Pycnopsyche (Trichoptera). Portions of the detritus are ingested but the layer of bacteria and fungi provide the real food source. Relatively undigested particles are excreted and recolonized. These and other fine bits of detritus are trapped by collecting organisms such as Stenonema (Ephemeroptera) and the microbes are again stripped off. The mechanism of uptake of dissolved material by microbes is therefore also part of the decomposition of particulate organic matter and.so the two processes are closely related.
The relationship between particulate and dissolved organic matter has been discussed in more detail in Chapter 1 and in Lock, Wallis and Hynes (1977). It is the intention here and in succeeding chapters to evaluate the transport and uptake of dissolved organic matter.
GROUNDWATER SOURCES
It has been established that groundwater can contain large quantities of dissolved organic matter compared with stream water. In the next chapter the mechanism and rates of transfer of groundwater from infiltration sources to the stream are discussed. It is enough here to state that groundwater seeps into the stream channel sporadically along its length and has the potential to contribute dissolved organic matter in significant quantities.
UPSTREAM SOURCES
A tremendous advantage enjoyed by a stream organism is the continual f low of new water bearing nutrients and food by it. It is very easy to estimate the amount of dissolved organic matter flowing past an organism by taking samples for chemical analysis and keeping track of the discharge in the stream. In the Marmot Basin, all streams are continously monitored for discharge (see Figures 9, 11 and 13) by means of the weirs already described and so it remained only to sample. From May 5 to June 3 1977, Middle Creek was sampled intensively with the aid of two North Hants Mark 4B automatic water samplers. From six to twelve samples per day were taken and analyzed for dissolved organic matter and other inorganic constituents in an attempt to identify any diurnal behaviour patterns (see Figure 10). Samples were also taken at larger intervals from Twin Creek and Cabin Creek (see Figures 12 and 14). Dissolved organic matter was quite stable; 174 samples yielded an average concentration of only 2.2 mg/l with a
17

M I D D L E C R E E K W E I R
2oo|. 21 April 2 3 2 5
T I M E - 21 Ap r i l - 2 8 Ju ly 1977
Figure 9. Disciiarge at Middle Creek weir.

MIDDLE CREEK WEIR
T I M E - 26Apr i l - 21 July 1977
Figure 10. Dissolved organic carbon load at Middle Creek weir.
CD

DOC
( m g / I)
6 8 10 12 14 16 18 20 22 24 26 28 30 1 MAY 1977
3 5 7 9 11 13 J U N E 1977
DOC
(mg/l)
4 •
3
2
1
• • • •
17 19 21 23 25 27 29 1 3 5 7 9 11 13 15 17 19 21 23 J U L Y 1977
Figure 1 2 . Dissolved organic carbon in Cabin Creek.
20
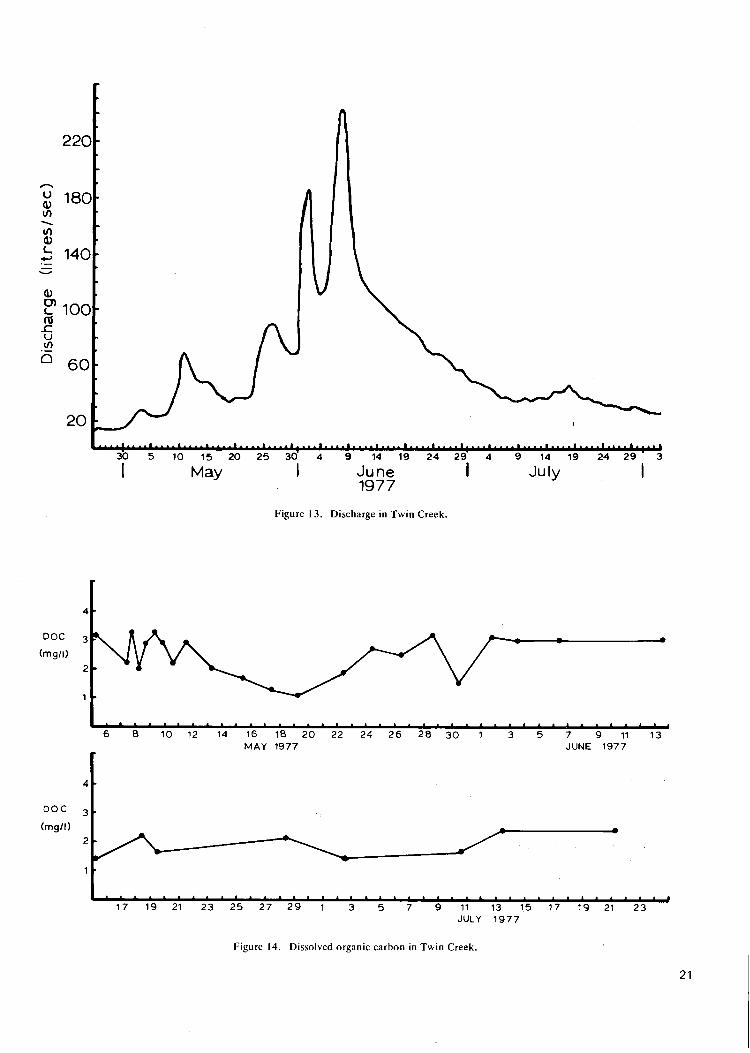
220
^ 180J
m
i3 1401
(1) ? 1 0 O nj x: u tn
6 0
201
5 10 15 20 25 30 4 9 14 19 24 29 4 9 14 19 24 29 3
May I June 1977
July
Figure 13. Discharge in Twin Creek.
DOC 3
(mg/l)
2
1
8 10 12 14 16 18 20 22 24 26 28 30 1 MAY 1977
3 5 7 9 11 13 JUNE 1977
DOC
(mg/l)
17 19 21 23 25 27 29 1 3 5 7 9 11 13 15 17 19 21 23 JULY 1977
Figure 14. Dissolved organic carbon in Twin Creek.
21
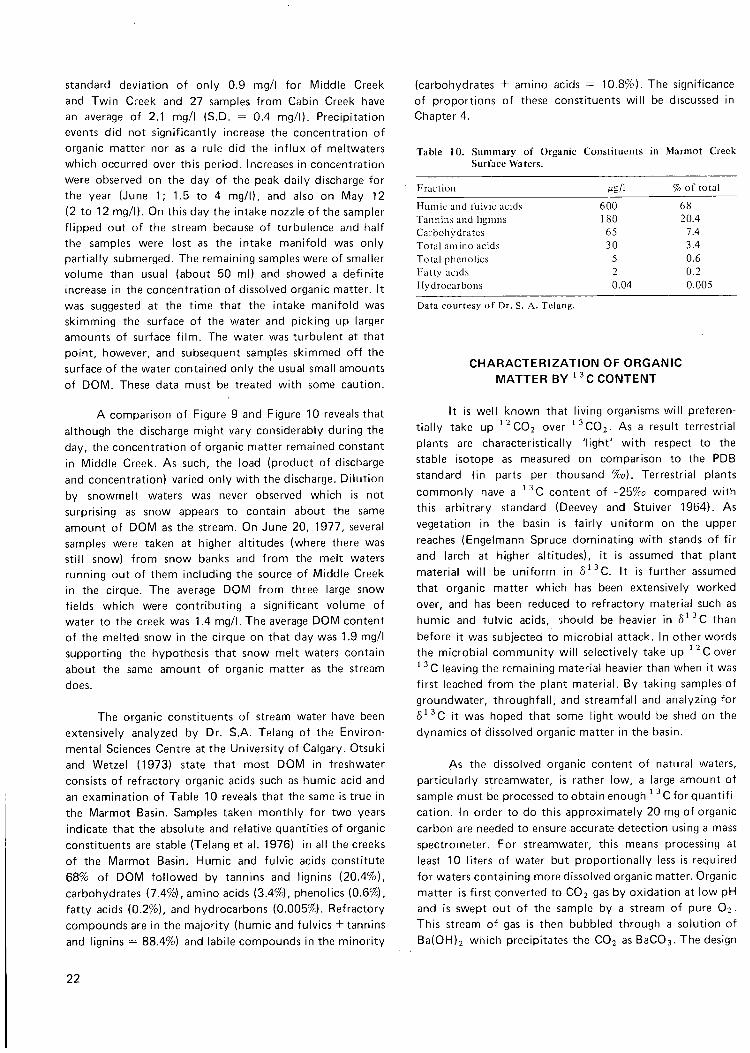
standard deviation of only 0.9 mg/l for Middle Creek
and Twin Creek and 27 samples from Cabin Creek have
an average of 2.1 mg/l (S.D. = 0.4 mg/l). Precipitation
events did not significantly increase the concentration of
organic matter nor as a rule did the influx of meltwaters
which occurred over this period. Increases in concentration
were observed on the day of the peak daily discharge for
the year (June 1; 1.5 to 4 mg/l), and also on May 12
(2 to 12 mg/l). On this day the intake nozzle of the sampler
flipped out of the stream because of turbulence and half
the samples were lost as the intake manifold was only
partially submerged. The remaining samples were of smaller
volume than usual (about 50 ml) and showed a definite
increase in the concentration of dissolved organic matter. It
was suggested at the time that the intake manifold was
skimming the surface of the water and picking up larger
amounts of surface film. The water was turbulent at that
point, however, and subsequent samples skimmed off the
surface of the water contained only the usual small amounts
of DOM. These data must be treated with some caution.
A comparison of Figure 9 and Figure 10 reveals that
although the discharge might vary considerably during the
day, the concentration of organic matter remained constant
in Middle Creek. As such, the load (product of discharge
and concentration) varied only with the discharge. Dilution
by snowmelt waters was never observed which is not
surprising as snow appears to contain about the same
amount of DOM as the stream. On June 20, 1977, several
samples were taken at higher altitudes (where there was
still snow) from snow banks and from the melt waters
running out of them including the source of Middle Creek
in the cirque. The average DOM from three large snow
fields which were contributing a significant volume of
water to the creek was 1.4 mg/l. The average DOM content
of the melted snow in the cirque on that day was 1.9 mg/l
supporting the hypothesis that snow melt waters contain
about the same amount of organic matter as the stream
does.
The organic constituents of stream water have been
extensively analyzed by Dr. S.A. Telang of the Environ
mental Sciences Centre at the University of Calgary. Otsuki
and Wetzel (1973) state that most DOM in freshwater
consists of refractory organic acids such as humic acid and
an examination of Table 10 reveals that the same is true in
the Marmot Basin. Samples taken monthly for two years
indicate that the absolute and relative quantities of organic
constituents are stable (Telang et al. 1976) in all the creeks
of the Marmot Basin. Humic and fulvic acids constitute
68% of DOM followed by tannins and lignins (20.4%),
carbohydrates (7.4%), amino acids (3.4%), phenolics (0.6%),
fatty acids (0.2%), and hydrocarbons (0.005%). Refractory
compounds are in the majority (humic and fulvics -E tannins and lignins = 88.4%) and labile compounds in the minority
(carbohydrates + amino acids = 10.8%). The significance
of proportions of these constituents will be discussed in
Chapter 4.
Table 10. Summary of Organic Constituents in Marmot Creek Surface Waters.
Fraction Mg/l % of total
Humic and fulvic acids 600 68 Tannins and lignins 180 20.4
Carboliydratcs 65 7.4
Total amino acids 30 3.4
Total phenolics 5 0.6 Fatty acids 2 0.2
Hydrocarbons 0.04 0.005
Data courtesy of Dr. S. A. Telang.
C H A R A C T E R I Z A T I O N O F O R G A N I C M A T T E R BY ^ ^ C C O N T E N T
It is well known that living organisms will preferen
tially take up '^COj over '^COa- As a result terrestrial
plants are characteristically 'light' with respect to the
stable isotope as measured on comparison to the PDB
standard (in parts per thousand % o ) . Terrestrial plants
commonly have a ''C content of -25%o compared with
this arbitrary standard (Deevey and Stuiver 1964). As
vegetation in the basin is fairly uniform on the upper
reaches (Engelmann Spruce dominating with stands of fir
and larch at higher altitudes), it is assumed that plant
material will be uniform in 6'^C. It is further assumed
that organic matter which has been extensively worked
over, and has been reduced to refractory material such as
humic and fulvic acids, should be heavier in 5'^C than
before it was subjected to microbial attack. In other words
the microbial community will selectively take up '^Cover
' C leaving the remaining material heavier than when it was
first leached from the plant material. By taking samples of
groundwater, throughfall, and streamfall and analyzing for
5'^C it was hoped that some light would be shed on the
dynamics of dissolved organic matter in the basin.
As the dissolved organic content of natural waters,
particularly streamwater, is rather low, a large amount of
sample must be processed to obtain enough ^ C for quantifi
cation. In order to do this approximately 20 mg of organic
carbon are needed to ensure accurate detection using a mass
spectrometer. For streamwater, this means processing at
least 10 liters of water but proportionally less is required
for waters containing more dissolved organic matter. Organic
matter is first converted to CO2 gas by oxidation at low pH
and is swept out of the sample by a stream of pure O2 •
This stream of gas is then bubbled through a solution of
Ba(0H)2 which precipitates the CO2 as BaCOs. The design
22

of the apparatus used to carry this out was borrowed from Mr. Jim Barker and Dr. P. Fritz of the Department of Earth Sciences of the University of Waterloo and separate equipment was constructed at Kananaskis field station (see Figure 15). Wet oxidation was carried out using 5 g of K 2 S 2 O 8 and 50 ml of HCI04- H 2 O per 10 liters of water sample, and Ba(0H)2 was prepared by dissolving 100 g of BaClj and 50 g of NaOH in 2.5 liters of water. The wet oxidation mixture was heated and allowed to boil for an hour while the sample was being sparged with pure O 2 .
Precipitated BaCOs was collected in a culture tube with a teflon lined screw cap and stored for analysis under Ba(0H)2 .
In order to prepare the sample for the mass spectrometer, it was decanted and the slurry was poured into a 'quick fit' flask with a side arm. Dilute HCl was added to convert the BaCOa to C O 2 which is then withdrawn by vacuum, cleansed of water by differential freezing, and then stored in a special tube as C O 2 gas. Sample preparation and analysis was undertaken by the Isotope Laboratory of the Department of Earth Sciences of the University of Waterloo.
Two throughfall samples were analyzed using this method with two replicates of each. In both cases the organic matter leached by rain from the trees was very light in 5'^C. Agreement between samples and replicates was excellent, the average for the sample of 4/8/77 being -31.5%o and '29.6%v for the sample of 6/8/77 (see Table 11). The leachate prepared from Engelmann Spruce twigs as previously described was also light in 5'^C, the average of two samples being -28.7%o. The overall average of 5'^C in organic matter leached from the vegetation surrounding the upper reaches of Middle Creek was -29.9%o . A sample taken from Middle Creek at the weir on 13/8/77, however, was significantly heavier having a 5'^C of -21.6%o (the error of analysis is less than 0.2%o ). A sample taken from the source of Middle Creek in the upper cirque of the Marmot Basin was also comparatively heavy (6' •'C = -19.5%o ), suggesting that very little isotopic change occurs down the stream channel. It is assumed that these isotope contents do not change greatly over a few days. A final sample was taken from the Middle Creek tributary (see Figure 5), which is a spring fed stream receiving further overland seepage before it empties into Middle Creek. This sample contained an intermediate amount of 5'^C; -25.1%D.
Table 1 1 . 6 C in Dissolved Organic Matter - Two Analyses per Sample.
Sample 1977 Date 6 ' ^ C % o mean %P
Throughfall 4/8 -31.5 -31.5 -31.5
Throughfall 6/8 -27.7 -31.5 -29.6
Leachate* -29.8 -27.5 -28 .7
Middle Creek source 1 1/8 -21 .2 -17.7 -19.5
Middle Creek weir 13/8 -21.6 -21 .6 -21.6
Middle Creek tributary 7/8 -25.7 -24.4 -25.1
Figure 15. Apparatus for wet o.xidation and precipitation of dissolved organic carbon.
'Prepared in the laboratory by leaching Engelmann Spruce twigs in a Soxhlet extraction unit.
The data are interpreted as follows. Terrestrial plants are light in 5'^C and so it is not surprising that organic matter leached from them also contains very little of the isotope. This means that the source material of dissolved organic matter in the basin is characteristically light in 5''^C. As this organic matter enters the soil column and is subjected to microbial attack, ' ^ C is selected for and ' ^ C tends to accumulate in the remaining organic matter. If it is assumed that most precipitation containing organic matter eventually reaches the stream after passing through the soil, the relative amounts of organic matter which go in
23

and which go out (average of 21.2 mg/l in the unsaturated zone compared with an average of only 2.2 mg/l in the stream) suggest a great potential for the concentration of ' ^ C content of organic matter in streamwater. As little change was observed from the source to the Middle Creek weir (approximately 3 km downstream), the remaining organic matter is probably well worked over and refractory in nature. This is also indicated by the chemical nature of the stream water (predominance of humic and fulvic acids). The Middle Creek tributary is especially interesting as it has
an intermediate 6'^C content. As this groundwater fed stream also receives seepage which is in intimate contact with terrestrial vegetation (via overland seepage observed along the banks), it is not surprising to find a dilution of the 'heavier' groundwater by the lighter isotope. This little tributary is only 150 m long and the residence time in the stream is not usually greater than 30 minutes, so it is possible that the organic matter leached from fresh terrestrial plant material has not been completely respired in this time.
24

CHAPTER 3
Hydrology of the Marmot Basin and the Transportation of Dissolved Organic Matter
In order to discuss the flow of dissolved constituents through the groundwater portions of the hydrologic cycle in the Marmot Basin, it is necessary to examine its hydrology. An understanding of the gross mechanisms involved coupled with field data will permit a description of the spatial and temporal dynamics of groundwater flow. In conjunction with the uptake of dissolved organic' matter described in the next chapter this may be used to construct a general theory of the flux of organic matter in small basins. This theory will apply most directly to the Marmot Basin, but data from other field sites will be drawn upon and certain generalizations will be made.
WATER BUDGET OF THE MARMOT BASIN
In discussing the hydrology of a catchment basin, it is convenient to begin with an overall water budget. Precipitation (P), stream runoff (R), evapotranspiration (E), and changes in basin storage (AS) are related by the following simple equation:
P = R -E E + AS
All of these variables can be calculated from existing field data which have been collected, tabulated, and analyzed by Storr (1977) for a period of ten years beginning on October 15, 1963. He measured precipitation using a network of rain gauges (see Figure 1) and the data were averaged using the weirs on each creek. Evapotranspiration was estimated using the energy budget method whereby net radiation is measured and energy losses are calculated. The change in subsurface storage was calculated using the relationship between storage and streamflow during recession periods. The details of all these calculations may be found in Storr (1977), and the results are summarized here in Table 12.
Table 12. Annual Water Balances for the Marmot Creek Subbasins -Mean for Ten Years (from Storr 1977).
Subbasin P R E AS Net Error
Cabin 839 = = 363 + 454 -1- 12 -HO Middle 964 = = 529 + 431 + 10 - 6 Twin 1027 = = 601 + 388 + 11 -1-27
Al l figures in millimetres.
From these it can be seen that stream runoff and evapotranspiration are approximately equal and that the change in basin storage is consistently small and positive. These small changes indicate that only a small amount of water leaks into the larger regional flow system moving eastward. Leakage between subbasins is thought to account for some of the error in water balances with the greatest leakage occurring at times of high discharge (Storr 1977). Stevenson (1967) also concluded that the basin as a whole is relatively watertight, but he did not rule out the possibility of subsurface leakage between subbasins. It would appear then, that almost all of the precipitation which falls in the catchment basin reaches the stream or is evapotranspired. Almost all the forest litter fall is decomposed within the basin or exported by the stream as dissolved or particulate matter. If the Marmot Creek receives the same proportion of forest productivity as Bear Brook, about 99% of that energy is consumed before it reaches the stream and very little is exported by regional groundwater flow.
THE MECHANISM OF RUNOFF IN THE MARMOT BASIN
In Chapter 1 the infiltration of precipitation and throughfall to the unsaturated and saturated zones and its passage to the stream were briefly described. The actual mechanism of this flow of water is rather more complicated than was suggested and is variable between different types of catchment basins. A number of theories describing runoff have been proposed over the years and are summarized very ably by Freeze (1974), and Sklash (1978). In order to discuss the relationship between the hydrology of the Marmot Basin and the decomposition of soluble organic matter, two preliminary points must be made.
The first point is that most of the precipitation in the Marmot Basin occurs as snow (about 75%), which melts in May and June. This means that 75% of the runoff and almost all of the annual recharge of water to the ground occurs in about two months of the year. The ground is only free of frost for about four months each year and although frozen soil is known to be at least partially permeable (Sartz 1969), very little snow melts before spring at these high altitudes. Infiltration, therefore, only takes place
25

d u r i n g these m o n t h s and o c c u r s m o s t l y d u r i n g the late
spr ing and ear ly s u m m e r . A large p r o p o r t i o n o f the s o l u b l e
o rgan ic mat ter m a y be e x p e c t e d to be m o b i l i z e d at this
t i m e . T h e s e c o n d p o i n t is the i m p o r t a n c e of ra ins torms
d u r i n g the f rost free p e r i o d c o m p a r e d w i th d r y spells in
b e t w e e n . In the interval be tween s t o r m s , r u n o f f is said to
be in recession m e a n i n g that the water c o n t e n t o f the soil
and parent mater ia l is be ing d ischarged and s t r e a m f l o w is
decreas ing . A t these t imes very little water is m o v i n g d o w n
wards t h r o u g h the unsa tu ra ted z o n e b u t m a y be d r a w n
u p w a r d s in a fo res ted basin because of e v a p o t r a n s p i r a t i o n
d u r i n g the d a y . M a n y roots penetra te in to the satura ted
z o n e as w e l l , so the water table m a y be l o w e r e d . T h i s
means that so lub le o rgan ic mat te r wil l t e n d to be c o n c e n
t ra ted in the u p p e r regions o f the soil and m o v e m e n t
t o w a r d s the st ream wil l decrease . A t this t i m e the soil m a y
be c o n s i d e r e d t o be d r a i n e d b y gravi ty f r o m b e l o w and b y
e v a p o t r a n s p i r a t i o n f r o m a b o v e . A r a i n s t o r m reverses th is
d r y i n g p r o c e d u r e by recharging water f r o m above and
m o b i l i z i n g so lub le o rgan ic and inorgan ic mat te r in the
unsa tura ted z o n e . T h e m e c h a n i s m w h e r e b y soi ls a n d
parent mater ia l b e c o m e saturated and the relative p r o p o r
t ions o f rain water and g r o u n d w a t e r in s t ream r u n o f f after
a s t o r m is var iable b e t w e e n c a t c h m e n t bas ins , and is cur
rent ly the subject o f c o n s i d e r a b l e research e f fo r t . G r o u n d
water d ischarge f r o m the deeper subsur face f l o w s y s t e m
p r o v i d e s the base f l o w that sustains s t r e a m f l o w b e t w e e n
p e r i o d s o f s t o r m r u n o f f (F reeze 1974).
T h e exact m e c h a n i s m of s t o r m f l o w is o f less i m p o r
tance to the d e c o m p o s i t i o n o f so lub le o r g a n i c mat te r than
the res idence t ime o f water in the g r o u n d . A longer p e r i o d
o f e x p o s u r e to soil m i c r o - o r g a n i s m s s h o u l d p e r m i t increased
m i n e r a l i z a t i o n and c o n c e n t r a t i o n of r e f r a c t o r y c o m p o u n d s .
T h e q u e s t i o n of the p r o p o r t i o n o f s t o r m f l o w w h i c h is rain
( f r o m the s t o r m itself) c o m p a r e d w i t h that p o r t i o n w h i c h is
s n o w m e l t or o l d e r g r o u n d w a t e r there fore assumes the
greatest i m p o r t a n c e in d e t e r m i n i n g the a m o u n t and q u a l i t y
o f D O M w h i c h reaches the s t ream. A n e x a m i n a t i o n o f
F i g u r e 10 reveals that increased d ischarge f r o m s torms
rarely increases the a m o u n t o f d isso lved o r g a n i c mat te r
in M i d d l e C r e e k , even t h o u g h it has been s h o w n that
t h r o u g h f a l l c a n c o n t a i n up to f ive t imes the c o n c e n t r a t i o n
o f d isso lved organ ic mat te r in the s t ream. T h i s suggests
that e i ther the b u l k of s t o r m f l o w is o l d g r o u n d w a t e r o r
that the d isso lved organ ic mat te r is so labile that an increase
is never o b s e r v e d . F r i t z et al . (1976) have observed that
s t o r m f l o w o f ten consis ts largely of g r o u n d w a t e r rather
than ra inwater and suggest that " g r o u n d w a t e r f l o w s h o u l d
also be i n c l u d e d as a basic m e c h a n i s m of s t o r m r u n o f f , in
a d d i t i o n to its role as a genera tor o f b a s e f l o w " . S k l a s h
(1978) has tested this h y p o t h e s i s in several c a t c h m e n t
basins and has a d v a n c e d e x p e r i m e n t a l e v i d e n c e s u p p o r t i n g
this suggest ion . If this is the case in the M a r m o t Bas in
the o r g a n i c c o n t e n t o f i n c o m i n g water m i g h t be e x p e c t e d
to m o r e c lose ly a p p r o x i m a t e the l o w levels f o u n d in saturated
g r o u n d w a t e r than the higher levels usua l ly associa ted w i t h
t h r o u g h f a l l (assuming that p r e c i p i t a t i o n is negl ig ib le) . T h e
stream w o u l d then receive a m u c h smal ler a m o u n t o f dis
solved o rgan ic mat te r than migh t be e x p e c t e d if t h r o u g h f a l l
was d o m i n a n t in s t o r m f l o w and a large increase in D O M
w o u l d no t be e x p e c t e d . In o r d e r to test th is h y p o t h e s i s , a
h y d r o g r a p h separa t ion o f t h r o u g h f a l l and s n o w m e l t water
f r o m g r o u n d w a t e r was m a d e f o r a s t o r m o n M a y 10, 1977
using the iso tope t e c h n i q u e s of F r i t z et al . (1976) and
S k l a s h et a l . (1976).
T h e i s o t o p i c separa t ion m e t h o d invo lved measur ing
the d ischarge o f the st ream and a n a l y z i n g st ream water ,
s n o w m e l t w a t e r , and rain water f o r the stable isotopes ' ^ O
and T r i t i u m . Because the iso tope c o n t e n t is a p r o p e r t y of
the water m o l e c u l e itself, it is c o n s i d e r e d to be conservat ive
and not i n f l u e n c e d b y passage t h r o u g h the g r o u n d . If a
d i f f e r e n c e in the i s o t o p i c c o n t e n t exists be tween the rain
and the g r o u n d w a t e r , caus ing a change in the s t ream water ,
a mass-ba lance separa t ion m a y be m a d e using the e q u a t i o n s
b e l o w :
E q . i Qo = QG + a R + Q s
E q . 2 Q D S ' ^ O D = Q G S ' ^ O Q + Q R 5 ' ' 0 R + QsS^'Os
E q . 3 Q D T D = Q G T G + Q R T R + GgTs
w h e r e : Q is the d ischarge in I/sec
— 5 * * 0 is the o x y g e n -18 iso tope c o n t e n t o f the
water in parts per t h o u s a n d (%) relative to S t a n d a r d
M e a n O c e a n Water ( S M O W )
— T is the T r i t i u m iso tope c o n t e n t o f the water ; an
abso lu te m e a s u r e m e n t in T r i t i u m U n i t s ( T U )
— a n d the subscr ip ts D , G , R, and S , refer to T o t a l
s t ream water . G r o u n d w a t e r , R a i n , and S n o w mel t
water respect ive ly .
A separa t ion be tween rain a n d g r o u n d w a t e r m a y be m a d e
using E q u a t i o n 1 and ei ther E q u a t i o n 2 or 3. If s n o w is also
present a three c o m p o n e n t separa t ion m u s t be m a d e b y
using all three e q u a t i o n s . T h e m a i n sources o f error w h i c h
af fect this m e t h o d i n c l u d e the error l imi ts of analysis
( T r i t i u m ± 10 T U ; ' * 0 ± 0 . 2 % o ), i s o t o p i c var ia t ion in
rainfal l t h r o u g h o u t the s t o r m , and the o c c u r r e n c e of an
adequate spread in m e a s u r e d i so tope c o n c e n t r a t i o n s bet
w e e n g r o u n d w a t e r , ra in , and s n o w . A l t h o u g h the d i f fe rences
observed be tween the i s o t o p i c c o n t e n t of these c o m p a r t
ments are smal l for b o t h 5 ' * 0 and T r i t i u m , t h e y are
o u t s i d e the er ror l imits q u o t e d a b o v e . O n l y one rain sample
was o b t a i n e d so it is a s s u m e d that the i s o t o p i c c o n c e n t r a t i o n
d id no t vary . T h e va l id i ty o f the h y d r o g r a p h separa t ion is
26
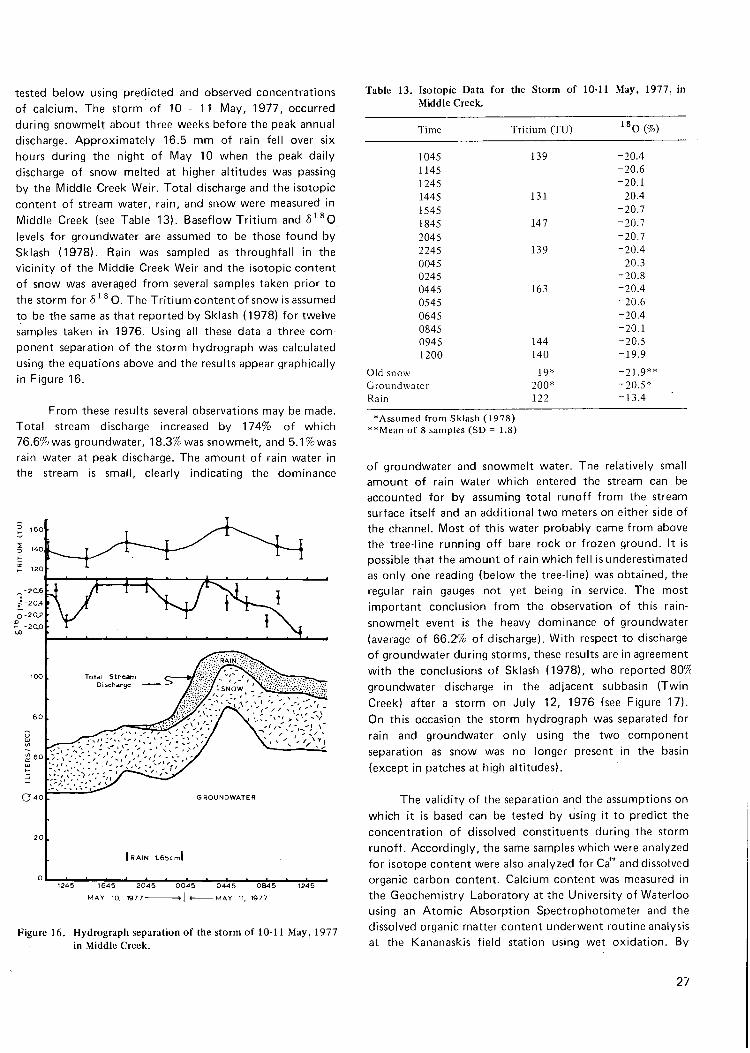
tested below using predicted and observed concentrations of calcium. The storm of 10 - 11 May, 1977, occurred during snowmelt about three weeks before the peak annual discharge. Approximately 16.5 mm of rain fell over six hours during the night of May 10 when the peak daily discharge of snow melted at higher altitudes was passing by the Middle Creek Weir. Total discharge and the isotopic content of stream water, rain, and snow were measured in Middle Creek (see Table 13). Baseflow Tritium and 5 ' *0 levels for groundwater are assumed to be those found by Sklash (1978). Rain was sampled as throughfall in the vicinity of the Middle Creek Weir and the isotopic content of snow was averaged from several samples taken prior to the storm for 5' ^ O. The Tritium content of snow is assumed to be the same as that reported by Sklash (1978) for twelve samples taken in 1976. Using all these data a three component separation of the storm hydrograph was calculated using the equations above and the results appear graphically in Figure 16.
From these results several observations may be made. Total stream discharge increased by 174% of which 76.6%was groundwater, 18.3% was snowmelt, and 5.1%was rain water at peak discharge. The amount of rain water in the stream is small, clearly indicating the dominance
Table 13. Isotopic Data for the Storm of 10-11 May, 1977, in Middle Creek.
Time Tritium (TU) '*0(%)
1045 139 -20.4 1145 -20.6 1245 -20.1 1445 131 -20.4 1545 -20.7 1845 147 -20.7 2045 -20.7 2245 139 -20.4 0045 -20.3 0245 -20.8 0445 163 -20.4 0545 -20.6 0645 -20.4 0845 -20.1 0945 144 -20.5 1200 140 -19.9
Old snow 19* -21.9** Groundwater 200* -20.5* Rain 122 -13.4
1245 1645 2045 0045 0445 0845 1245
MAY 10, 1977 »| < MAY 11, 1977
Figure 16. Hydrograph separation of the storm of 10-11 May, 1977 in Middle Creek.
•Assumed from Sklash (1978) * * M e a n of 8 samples (SO = 1.8)
of groundwater and snowmelt water. The relatively small amount of rain water which entered the stream can be accounted for by assuming total runoff from the stream surface itself and an additional two meters on either side of the channel. Most of this water probably came from above the tree-line running off bare rock or frozen ground. It is possible that the amount of rain which fell is underestimated as only one reading (below the tree-line) was obtained, the regular rain gauges not yet being in service. The most important conclusion from the observation of this rain-snowmelt event is the heavy dominance of groundwater (average of 66.2% of discharge). With respect to discharge of groundwater during storms, these results are in agreement with the conclusions of Sklash (1978), who reported 807c groundwater discharge in the adjacent subbasin (Twin Creek) after a storm on July 12, 1976 (see Figure 17). On this occasion the storm hydrograph was separated for rain and groundwater only using the two component separation as snow was no longer present in the basin (except in patches at high altitudes).
The validity of the separation and the assumptions on which it is based can be tested by using it to predict the concentration of dissolved constituents during the storm runoff. Accordingly, the same samples which were analyzed for isotope content were also analyzed for Ca"** and dissolved organic carbon content. Calcium content was measured in the Geochemistry Laboratory at the University of Waterloo using an Atomic Absorption Spectrophotometer and the dissolved organic matter content underwent routine analysis at the Kananaskis field station using wet oxidation. By
27

^140
u
140
135
130|
UJ ul
120 cr lij
5 O 1,0
105| GROUNDWATER
1200 1400 1600 JULY 12, 1976
Figure 17. Hydrograph separation of the storm of July 12, 1976 in Twin Creek.
calculating the percentage content of rain, snow and groundwaters at two hour intervals, and nnultiplying by the known concentration of Ca" and DOM in each fraction, a predicted value of each dissolved constituent may be obtained. The rain and snow samples were analyzed directly for these known concentrations, and the groundwater value for Ca* was assumed from winter low flow samples analyzed by Water Survey of Canada (average of 9 samples = 50.9 mg/l; SD = 2.0). Groundwater levels of DOM were assumed to be the average of 50 samples taken from piezometers during the summer of 1977 (average = 5.3 mg/l; SD = 4.4). It is further assumed that calcium behaves more or less consistently during this period in that the groundwater concentrations reaching the stream are assumed to be the same in the summer as in the winter. Dissolved organic matter on the other hand is not expected to be as conservative and serves as a comparison, the significance of which will be discussed in the next chapter.
The results of these calculations appear in Table 14 and Figure 18. Analytical concentrations of Ca'** were compared with the predicted results using the standard
C a mg/1
D O C m g / l
predicted
1245 1645 2045 0045 0445 0845
M A Y 10-11 . 1977
Figure 18. Prediction of Ca and DOC for the storm of May 10-11, 1977.
chi-squared test and the dependent t-test. Both of these indicate that no significant difference exists between the two sets of data (chi-squared = 4.82; t^gp = 0.73, 11 df) at the 99% confidence level. It is suggested that the general hypothesis is confirmed by these calculations although it appears as if the concentration of Ca" has been underestimated on the ascending limb of the hydrograph and overestimated on the descending iimb. If the general validity of the storm runoff model is accepted, the importance of groundwater inputs of dissolved constituents follows as a necessary conclusion. Streams are assumed to consist entirely of groundwater during low flow periods which dominate in the late summer, fall, and winter. The hydro-graph separation of the storm-snowmelt event indicates that groundwater is still the most important contributor of water even at the period of highest seasonal discharge. It appears that most dissolved organic matter which originates in surface litter and reaches the stream must pass through the soil. It must not be forgotten that the model also predicts that at least some of the organic matter reaches the stream dissolved in rain which either falls directly onto the stream channel after dripping through the trees or falls upon an area of low permeability adjacent to the stream. This organic matter is subjected to only minimum contact with the soil before it reaches the main channel and the quality of the material might be expected to be quite different from that which has passed through the soil. Qualitative analysis of two rain samples and an artificial leachate (see Table 8) reveals a much higher proportion of labile organic compounds such as amino acids and carbo-
28

Table 14. Prediction of Ca++ and DOM Concentrations for the Storm of 10-11 May, 1977.
Time % Q G W % Q S Caobs++ C^pred.++ D O M ^ b s
1045 66.3 33.7 _ 42.3 34.8 1.7 4.6 1245 62.3 37.7 - 36.6 32.9 2.0 4.8 1445 61.8 38.2 - 34.8 32.7 1.9 4.5 1645 67.1 32.9 - 33.5 35.2 2.2 4.6 1845 70.1 29.2 - 32.2 36.6 1.8 4.7 2045 66.7 28.2 5.1 33.0 35.2 2.2 4.7 2245 62.1 30.5 7.4 32.9 33,1 2.4 4.3 0045 60.8 24.5 14.7 33,9 32.7 2.5 4,8 0245 69.0 19.5 11.5 33.7 36.5 2.2 4,9 0445 76.6 18.3 • 5.1 35.9 39.9 2.5 4,9 0645 68.8 21.4 9.8 30.4 36,3 1.9 4.8 0845 63.0 26.4 10.6 30.4 33.6 2,7 4,7
hydrates than are found in groundwater (see Table 9). It is probable, therefore, that throughfall provides a much better quality mixture of organic compounds than does groundwater although such inputs are sporadic and seasonal. Hewlett and Nutter (1970) estimate that only 10% of annual precipitation appears as stormflow in the eastern United States. Accordingly, the absolute amounts of high quality dissolved organic matter which enter the stream by throughfall are considered to be insignificant compared with low quality organic matter entering by groundwater. Biologically important compounds, however, are not always present in large amounts.
RATES OF TRANSPORT OF DOM THROUGH GROUNDWATER ZONES
Unsaturated Zone
The unsaturated groundwater zone is of crucial importance to the flow of detrital dissolved organic matter (see Chapter 2). It is, however, very small in comparison with the saturated zone both in size and in the Volume of water which it contains. Often less than two meters in thickness (in the Marmot Basin), it nonetheless supports most of the plant and animal life in the terrestrial community. The flow of water through this zone is complicated by weather (alternate drying and wetting) and the considerable amount of water transpired by plants. Lodgepole pine (Pinus contorta Dough), which covers the lower portions of the Marmot Basin, transpires an average of 1 l/hr/tree (Swanson 1975) on sunny days. It is apparent that the net water flow is more probably upward than downward during the day in the unsaturated zone. Rainstorms may reverse this trend by introducing a wetting front at near saturation which can be tracked on its downward course using tensiometers (see Chapter 1 for description). The movement of the wetting front may be followed by plotting the pressure head ('h' — see Figure 4) in cm against time at different depths (2, 12, 18, and 24 inches). If the pressure head is
less than zero the water pressure is less than atmospheric pressure and the soil is considered to be unsaturated. A positive change in pressure head indicates that the soil is becoming wetter and if h reaches zero, the soil is said to be saturated. An examination of Figure 19 reveals a delay in positive change (that is to say increasing saturation) after a storm event with depth. For the 'A' site (see Figure 5 for the location in the Marmot Basin), the peak which occurs on July 10 at A12 does not show up at A18 until July 14. A24 shows a positive trend on July 21. The combined data indicate a rough rate of travel of 0.028 m/day. A similar analysis of the transport rates at sites 'B' and 'D' suggest 0.012 and 0.011 m/day. Averaging these figures and converting the units gives an overall average of 0.017 m/day (2.0 x 10" cm/sec). The data from site 'E ' are too inconsistent to be meaningful. This average figure is subject to errors arising from the instruments themselves (it is difficult to ensure an adequate seal around the porous tip and almost impossible to avoid breakage of the water column caused by degassing) and must be treated with caution. The whole problem of the hysteritic behaviour of drying and wetting of soils is ignored by this method. The only point of the exercise is to demonstrate that water in the unsaturated zone is in contact with soil and litter organic matter for at least several days before it reaches the saturated zone. Upward movements of water may delay this movement indefinitely during dry spells or a series of rainstorms may accelerate it. Temperature, antecedent moisture conditions, and vegetation cover all combine to affect water transport in this rather problematic zone. Reference is made to Hewlett (1961, 1963, 1967, 1969, and 1970), Klute (1967), and Whipkey (1970), among others for a detailed investigation of this problem.
Saturated Zone
The rate of transport of water in the saturated zone has been investigated by Stevenson (1978 in press) in the Marmot Basin. Using bail tests he has calculated a number
29

2 6 10 14 18 22 26 30 3 7 2 6 10 14 18 22 26 30 3 7 1977 JULY AUG. 1977 JULY AUG.
2 6 10 14 18 22 26 30 3 7 2 6 10 14 18 22 26 30 3 7 1977 JULY AUG. 1977 JULY AUG.
Figure 19. Tensiometer data.
30

Table 15. Hydraulic Conductivities in the Marmot Basin (from Stevenson 1978).
Unit K (m/day)
of hydraulic conductivity (K) values for different materials which appear in Table 15. The average of these figures is 0.14 m/day or 1.6 x 10"" cm/sec but the time taken for groundwater to reach the stream depends also upon the distance from which it infiltrates. The average distance to Middle Creek defined by the ratio of the area of the drainage basin (3,100,000 m^), to the total stream length (5488 m) is 565 m. A t the rate of 0.14 m/day, water would take an average of 11.1 years to reach the stream. The average Tri t ium of baseflow stream water is about 200 T U , indicative of water recharged about 10 years ago (Sklash 1978),so this estimate appears to be in the right range. It is clear that dissolved constituents can be in contact with the soil and parent material for extended periods of time before re-emerging at the surface. It is generally true that deeper (and presumably older) groundwaters are low in organic matter, and qualitative data from the Marmot Basin suggest that the material is largely refractory humic and fulvic acids (see Table 9). This 'o ld ' groundwater supplies baseflow to the stream and is periodically augmented by snowmelt and rainwater.
Silty clay till 0.0132
Glacial tills and mud flows 0.01 to 0.1
Talus and scree on upper slopes very high
Upper Hydrological Member
Lower Cretaceous Blairmore and Kootenay Formation (subbasin watersheds)
Bedded sandstones with interbedded shales 0.46
Middle Hydrological Member
Lower Cretaceous-Kootenay Formation and Jurassic-Fernie Formation
Densely fractured siltstone shales 0.027
Lower Hydrological Member
Triassic-Spray River Formation
Siltstoncs very low
31

C H A P T E R 4
Utilization of Dissolved Organic Matter
INTRODUCTION: WHO IS T A K I N G UP DOM?
It Is clear from this study and from other work that dissolved organic matter of varying quality is continually transported into watercourses. It is also apparent that only low levels of DOM are usually found in unpolluted streams so that large quantities of it must be somehow absorbed by the environment. Many experiments have been performed both in the laboratory and in situ to measure the uptake of dissolved organic compounds by a diversity of plant and animal populations. These have recently been reviewed by Sepers (1977) who states that uptake of organic solutes has been demonstrated for representatives of the invertebrate phyla Protozoa, Porifera, Coelenterata, Rhynchocoela, Sipunculoidea, Bryozoa, Chaetognatha, Annelida, Mollusca, Echinodermata, Hemichordata, and the Pogonophora. Phytoplankton and bacteria have been widely studied and their uptake characteristics are also reviewed.
Although it is known that fungi may play an important role in the degradation of particulate organic matter in streams (Baerlocher and Kendrick 1975), their possible importance in the removal of dissolved organic matter is not mentioned in Sepers (1977). In cool freshwater streams it has been shown that the breakdown of leaf litter is strongly influenced by the fungi (Baerlocher and Kendrick 1974), primarily because of their superior ability to degrade cellulose and lignin and their presence on dead leaves before they fall off the tree. Deciduous leaves are rendered much more palatable to invertebrates such as Gammarus by fungal (and bacterial) growth (Willoughby and Sutcliffe 1976, Baerlocher and Kendrick 1973), but there'is little evidence to suggest that they may be important in the uptake of dissolved compounds. Fungi have considerable difficulty in colonizing conifer needles because of the persistence of the waxy cuticle and are known to be absent in dystrophic waters of low pH. The importance of fungi appears to be in the physical fragmentation of particulate organic debris by penetrating growths of hyphae (eg. Egglishaw 1973) and in its promotion of leaf 'conditioning' for invertebrate attack. The ability to remove nutrients such as nitrate has been demonstrated (Hynes 1975, Iverson 1973, Kaushik and Hynes 1971), and there is no reason to suppose that fungi are unable to absorb DOM as well. It is suggested, however, that fungi are not very important in DOM uptake because they are not usually
associated with anything except particulate organic matter and, therefore, have no need to absorb large quantities of DOM. Furthermore, numbers and biomass of fungi are very much lower than bacteria (Iverson 1973), and they are correspondingly less important in the uptake of DOM. In the Marmot Basin, samples of particulate debris were collected and examined for hyphae and several water samples were collected and filtered for conidia from each stream (one liter of water was filtered through a 5 M Millipore filter and stained with methylene blue or lac-tophenol cotton blue). A series of glass slides was placed in Middle Creek for one month to check for colonization but very few conidia or hyphae were found. The following species were identified by Mr. loannes Michaelides of the University of Waterloo: Alatospora acuminata, Tricladium sp., Anguillospora iongissima, Anguiliospora crassa, Heliscus lugdenensis, Tripospermum myrti and one unknown species. Bacteria, on the other hand are known to be present in the water column at concentrations of 10'' cells/ml and in the benthos at an average density of 10* cells/cm^. It is concluded that fungi are not very important in the removal of dissolved organic matter, at least in the Marmot Basin.
In his review of the utilization of DOM, Sepers (1977), reached the followingxonclusions: 1. "Many marine invertebrates possess the ability to take up DOM from the ambient sea water. Uptake is a surface related phenomenon and is mediated by an active transport process. In fresh water invertebrates the uptake of DOM proceeds at a considerably lower rate or is completely absent. There are indications that the uptake of DOM is incompatible with chloride and osmoregulatory processes. DOM may have some nutritional value as an additional nutrient source especially at shortages of particulate food. The hypothesis that marine invertebrates can rely totally on the pool of dissolved organic matter to meet their nutrient requirements is only justified as far as the pogonophores are concerned. 2. Some phytoplankters can grow heterotrophically in the dark utilizing organic substrates as a carbon and energy source. The range of compounds permitting heterotrophic growth is generally very limited. Many algae are able to take up organic compounds in the light. These substrates can serve as an additional carbon or nitrogen source. Uptake of DOM by algae is mediated by an active transport system.
32

3. As evidenced by the values of the kinetic parameter K , heterotrophic bacteria possess uptake systems for dissolved organic matter which are especially adapted to very low substrate concentrations. Comparison of the characteristics of the uptake of DOM by bacteria with the corresponding data of invertebrates and phytoplankton shows that, in view of the low substrate levels, the uptake of dissolved organic compounds in natural waters is primarily a bacterial process." The last conclusion is the most important as it directs the thrust of uptake investigations toward the bacteria. In the Marmot Basin streams the bacteria far outnumber the populations of algae, fungi, and invertebrates (Telang et al. 1976) and so specific uptake by other groups is not considered.
HETEROTROPHIC UPTAKE IN STREAMS
In streams bacteria may be found free floating in the water column (planktonic) or attached to the substrate (sessile). Sessile bacteria are typically 1000 times as dense as planktonic bacteria. The adaptive value of attached versus free organisms in a fast flowing stream is obvious and as the direct counting techniques (by epi-fluorescence) used in the Marmot Basin are unable to distinguish between living and dead cells, it may be that some planktonic cells are moribund. As a preliminary experiment, the Biochemical Oxygen Demand of stream water was measured on two occasions at both 20° C and ambient temperatures. Background oxygen samples were taken from the stream and three darkened BOD bottles were left in the stream in the turbulent zone below the Middle Creek Weir. Six more darkened BOD bottles were brought back to the laboratory where they were allowed to warm up to room temperature (about 20°). Three of these samples were analyzed for oxygen content after warming and three were left on the bench for five days. Care was taken to ensure that the glass stoppers did not dry out and admit oxygen. After five days had elapsed the samples which had been left in the stream were retrieved and analyzed along with the samples on the bench. All oxygen determinations were carried out using the Winkler procedure (azide modification) and the results appear in Table 16. Biochemical Oxygen Demand in the stream at ambient temperatures appears to be quite low, probably less than 0.4 mg/l. BOD at room temperature is perhaps twice as high but still around 1.0 mg/l. The levels of dissolved organic carbon at this time were low; 2.2 mg/l on June 28 and 1.7 mg/l on July 8. Seasonal trends in BOD as measured by Telang in the Marmot Basin at room temperature fluctuated between 3.4 and 1.0 from August 1974 to October 1976 (Telang et al. 1976). The lowest values occur in the late summer (agreeing with the measurements in Table 16) and the highest in mid-winter. If the biochemical oxygen demand
does reflect microbial uptake primarily, it would appear that more labile organic compounds are reaching the stream water in mid-winter although the level of organic matter is the same as that in the summer. This may indicate reduced competition from soil organisms under frozen conditions. Although imprecise, this little experiment confirms heterotrophic activity by conventional methods.
Table 16. Biochemical Oxygen Demand in Middle Creek and in the Laboratory.
Initial 0 2 Final O2 BOD Sample (mg/l) (mg/l) (mg/l)
28 June - 3 July, 1977
Stream at 5 ° 9.4 9.7 10.0 9.5
9.6 9.7
X = 9.7 (0.3) 9.6(0.1) 0
Lab. at room temp. 8.5 7.2 8.6 7.8 8.6 8.0
X = 8.6 (0.1) 7.7(0.4) 0.9(0.5)
8 July - 13 July, 1977
Stream at 5 ° 9.8 9.4 9.9 9.6
10.0 9.4
X = 9.9 (0.1) 9.5 (0.1) 0.4 (0.2)
Lab. at room temp. 8.4 8.0 8.4 6.4 8.5 7.6
X = 8.4 (0.1) 7.3(0.8) 1.1 (0.9)
Numbers in brackets are Standard Deviations.
HETEROTROPHIC POTENTIAL OF BACTERIA
MEASURED BY '"C-LABELLED SUBSTRATE UPTAKE
Parsons and Strickland (1962) found that uptake of labelled glucose and acetate in the sea could be kinetically analyzed using the Michaelis-Menten equations. Hobble and Wright (1965) and Wright and Hobble (1966) further developed the technique and today it has become an accepted tool for the measurement of the heterotrophic potential of micro-organisms. Wright and Hobble (1966) found that in the substrate range 1-100 jug/l, uptake of glucose and acetate followed Michaelis-Menten kinetics but that uptake in the range 0.5 to 5.0 mg/l was dependent upon the substrate concentration. They suggest that two mechanisms of uptake can be identified; uptake in the low concentration range by bacteria and uptake in the higher range by algae. The modified Michaelis-Menten equation
33

appears below;
cf (Sn + A) V =
C u t
where v is the velocity of uptake in ng/l/hr, c is the radioactivity of the filtered organisms (count/min), A is the concentration (A(g/I) of added substrate (including labelled and unlabelled substrate), S^ is the background concentration of substrate (jUg/D, C is the count/min from 1 ixc of ^ ' ' C in the counting apparatus used, u is the number of microcuries added to the sample bottle, and t is the incubation time (hr). The factor f is used to correct for isotope discrimination but is often neglected (Wright and Hobble 1966). Sp, is often very small and may sometimes be ignored. Turnover time, T^, may be calculated from a modified Lineweaver-Burk transformation described in Wright and Hobble (1966) as the y-intercept of the straight line transformation.
In order to estimate the heterotrophic potential of some organic substrates which might be found at very low concentrations in the Marmot Basin, experiments using this technique were commenced in 1976 by Gil l Geesey of the University of Calgary. In 1977 further measurements of the heterotrophic potential of streams and groundwater were carried out by Mr. T im Ladd, of Dr. Costerton's laboratory. Bacteria were isolated by filtering stream and groundwaters (planktonic samples) or by scraping the f i lm of sessile bacteria from submerged stones. The latter were resuspended, homogenized, filtered (0.22 fi) and then treated as planktonic samples. This method assumes that bacteria in the sessile slime matrix will behave in the same manner as free planktonic cells. It is possible that normal diffusion into the slime limits uptake and by breaking down this layer, uptake will be overestimated. Incubation times were normally 5 to 10 hours depending upon how long it took for roughly 5% of the substrate to be taken up. Respired CO2 was trapped using phenethylamine (Scintrex reagent) and averaged 22%of total uptake. Labelled glutamic acid was used for groundwater experiments so that comparison with previous stream measurements might be made. Radioactivity was determined in a liquid scintillation counter (Packard, Tri Carb) in a medium consisting of 0.1 g POPOP and 4.0 PPO per liter of reagent grade toluene. Bacterial populations were enumerated by direct epifluorescence microscopy using the method of Zimmerman and Meyer-Reil (1974) on a Zeiss standard 16 microscope. Further details of the methods used may be found in Harrison et al. (1971). The uptake measurements were undertaken by members of Dr. Costerton's laboratory at the University of Calgary using the installations and background chemistry of this study and Dr. S.A. Telang of the Environmental Sciences Centre (U. of Calgary). The field
work was directed by Mr. Tim Ladd under the supervision of Dr. W. Costerton.
Bacteria in the soil are known to be mostly attached to soil particles. As such they may be considered analogous to sessile bacteria in the streams and similarly the bacteria in the groundwater itself may be considered as planktonic. No equipment was available for the aseptic sampling of soil bacteria for heterotrophic measurements but a lysimeter normally used for sampling the unsaturated zone (SLC-40) was adapted so that it need not be opened for water removal (see Figure 3), sterilized, and installed in a fresh hole. Atmospheric contamination was kept to a minimum by a system of pinch-cocks and the use of previously evacuated Erienmeyer flasks to draw in the water. Ice was taken into the field to keep the groundwater as close to ambient soil temperatures (8°) as possible during transportation back to the laboratory at Kananaskis. Population counts and heterotrophic uptake of glutamic acid appear in Table 17. Planktonic groundwater appears to contain about the same number of cells per mill i l iter as planktonic stream water. No data are available for sessile soil bacteria but it is probable that they are at least as abundant as their stream counterparts. Population densities as high as 1 0 ' c e l l s / c m ' ^ of soil may be found in the literature (W. Costerton-pers. comm.) but soil bacteria are known to exist in clumps around favourable solid food substrates and are not as evenly distributed as stream bacteria.
Saturated zone planktonic bacteria are more numerous than those in the unsaturated zone by slightly more than an order of magnitude. This may be a consequence of the more stable environment below the water table with respect to moisture and temperature. It is also possible that the porous cup of the lysimeter impeded the passage of bacteria somewhat. Uptake of glutamic acid is apparently higher per individual cell in the unsaturated zone. This may be related to the higher quality of DOM which normally might be expected in this zone (being closer to the litter source) or it might reflect an adaptation towards increased efficiency in a more tenuous environment. More measurements need to be taken of the groundwater bacteria's potential to remove organic solutes. The turnover times (T^) for glutamic acid (amount of time needed for complete uptake of added substrate) are very rapid; 59.3 hours in the unsaturated zone and 117.4 hours in the saturated zone. These numbers are lower than 228 hours found by Geesey in Telang et al. (1976) for a planktonic Twin Creek sample.
From these limited data it appears that both sessile and planktonic stream bacteria are by far the most metabol-ically active in the Marmot Basin. Bacteria are more numerous in sessile samples by up to three orders of magnitude and individual cell metabolism is higher by the same factor
34
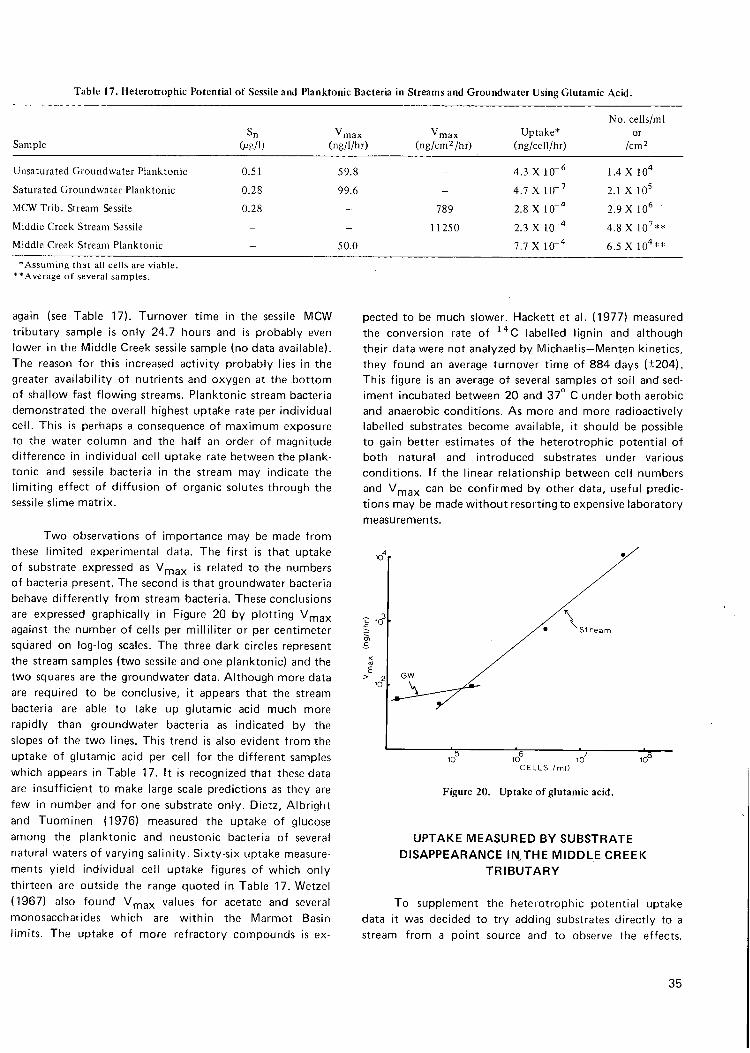
Table 17. Heterotrophic Potential of Sessile and Planktonic Bacteria in Streams and Groundwater Using Glutamic Acid.
Sample Sn
(Mg/l) ^max
(ng/l/hr) Vmax
(ng/cm2/hr) Uptake*
(ng/cell/hr)
No . cells/ml or
/cm 2
Unsaturated Groundwater Planktonic 0.51 59.8 — 4.3 X 1 0 - * 1.4 X 10''
Saturated Groundwater Planktonic 0.28 99.6 - 4.7 X 10"'' 2.1 X 10^
MOW Tr ib. Stream Sessile 0.28 - 789 2.8 X IO"'' 2.9 X 10* •
Middle Creek Stream Sessile - - 11250 2.3 X 10-"* 4.8 X l O ' ' * *
Middle Creek Stream Planktonic - 50.0 - 7.7 X IO"'' 6.5 X lo"**
'Assuming that all cells are viable. * 'Average of several samples.
again (see Table 17). Turnover time in the sessile MCW tributary sample is only 24.7 hours and is probably even lower in the Middle Creek sessile sample (no data available). The reason for this increased activity probably lies in the greater availability of nutrients and oxygen at the .bottom of shallow fast flowing streams. Planktonic stream bacteria demonstrated the overall highest uptake rate per individual cell. This is perhaps a consequence of maximum exposure to the water column and the half an order of magnitude difference in individual cell uptake rate between the planktonic and sessile bacteria in the stream may indicate the limiting effect of diffusion of organic solutes through the sessile slime matrix.
Two observations of importance may be made from these limited experimental data. The first is that uptake of substrate expressed as Vppg ^ is related to the numbers of bacteria present. The second is that groundwater bacteria behave differently from stream bacteria. These conclusions are expressed graphically in Figure 20 by plotting Vp^gx against the number of cells per milliliter or per centimeter squared on log-log scales. The three dark circles represent the stream samples (two sessile and one planktonic) and the two squares are the groundwater data. Although more data are required to be conclusive, it appears that the stream bacteria are able to take up glutamic acid much more rapidly than groundwater bacteria as indicated by the slopes of the two lines. This trend is also evident from the uptake of glutamic acid per cell for the different samples which appears in Table 17. It is recognized that these data are insufficient to make large scale predictions as they are few in number and for one substrate only. Dietz, Albright and Tuominen (1976) measured the uptake of glucose among the planktonic and neustonic bacteria of several natural waters of varying salinity. Sixty-six uptake measurements yield individual cell uptake figures of which only thirteen are outside the range quoted in Table 17. Wetzel (1967) also found V^^g^ values for acetate and several monosaccharides which are within the Marmot Basin limits. The uptake of more refractory compounds is ex
pected to be much slower. Hackett et al. (1977) measured the conversion rate of * ' 'C labelled lignin and although their data were not analyzed by Michaelis—Menten kinetics, they found an average turnover time of 884 days (±204). This figure is an average of several samples of soil and sediment incubated between 20 and 37° C under both aerobic and anaerobic conditions. As more and more radioactively labelled substrates become available, it should be possible to gain better estimates of the heterotrophic potential of both natural and introduced substrates under various conditions. If the linear relationship between cell numbers and Vppgj can be confirmed by other data, useful predictions may be made without resorting to expensive laboratory measurements.
10
10 C E L L S /ml)
Figure 20. Uptake of glutamic acid.
UPTAKE MEASURED BY SUBSTRATE DISAPPEARANCE I N T H E MIDDLE C R E E K
TRIBUTARY
To supplement the heterotrophic potential uptake data it was decided to try adding substrates directly to a stream from a point source and to observe the effects.
35

Because of its small size, the Middle Creek Tributary (which flows into Middle Creek just above the weir) was chosen for these experiments. Substrates at a known concentration were dripped into the stream for one hour along with NaCI for tracer using a constant head bottle. Samples were taken at three locations downstream at fifteen minute intervals until all the substrate and tracer had passed. Automatic samplers were employed at sites ' B ' and ' C (see map — Figure 5) and samples were taken by hand at site ' A ' . On returning to the laboratory all the samples were analyzed for dissolved organic matter and for C l " tracer. It would have been preferable to analyze for the substrate added directly, but this was not feasible with the number of samples and equipment available. The data were analyzed by calculating the discharge at each site, multiplying this figure by the concentration of substrate at each time, and plotting the resulting load (in mg/sec) against time. The area under this curve represents the amount in mg of substrate which passed each site. These calculations were also carried out for NaCI as a check on the recovery efficiency. Calculations of the load of both D O M and C l ' were corrected for the background concentration which was measured at each site. The formula for calculating discharge appears below:
Q = q — — — , where Q is the discharge in I/sec, C2 - C o
q is the rate of input of C l " in mg/sec, C i is the concentration of the Cr in the dripping bottle in mg/l, C j is the concentration of C l " at the point of stable dilution in the stream. Chloride was determined by the mercuric nitrate method (Standard Methods - A P H A ) and D O M by the wet oxidation technique (Macioiek 1962). A l l of the samples were filtered through Reeve Angel 934 A H glass fiber filter (0.45 fi; combusted at 500°C for four hours). Analysis was undertaken as soon as possible after the experiment, never more than three hours. The stream temperature throughout the experiments was 2°C.
The first substrate chosen was glucose. Three addition experiments were carried out on 4, 10, and 21 July, 1977. The concentration of glucose in the stream was raised from approximately 240^9/1 (fotal carbohydrate measured as glucose using the phenol - H 2 S O 4 method - Dubois et al. 1956) to a maximum of 7.5 mg/l. A t this concentration both bacteria and algae are capable of removing glucose from solution (Wright and Hobble 1966). The experiments were carried out as described above using C l " for tracer and measuring glucose as dissolved organic matter. The results are given in Figures 21 to 23. The surface area of the stream bottom was estimated from a series of careful measurements of width over the test area (see Figure 5 for these data) and uptake was calculated by subtracting the amount of glucose which appeared at site ' C from
that which was added and dividing by the area of the stream between stations in m^. The average uptake of glucose observed was 363 mg/m^/hr (SD = 105 mg/m^/m). The error for each individual experiment is approximately 10% calculated as the cumulative error of both C l " and D O M analysis (the error in NaCI recovery is never greater than 8%). This uptake figure applies to the whole stream community including algae, bacteria, moss, and any other organisms or physical processes capable of absorbing glucose. As insufficient data were available to break this figure down further, the individual componeints cannot be isolated. A t these concentrations, however, b^acteria are not expected to be concentration limited and diffusion may become important.
The next substrate to be tested was glutamic acid. The first experiment was carried out on July 27, 1977 and the uptake of glutamic acid (monosodium salt) was observed to be very rapid (540 mg/m^/hr). Concentrations of the amino acid were increased from 0.28 ;ug/l to a maximum of 1.5 mg/l. Sixty-eight per cent of this glutamic acid disappeared by the time all the C l " had passed by site ' A ' and 84% by the time .'B' had been passed. A small increase was observed at ' C which was considered to be experimental error (see Figure 24).
The second glutamic acid experiment was performed on August 2, 1977. On this occasion the experiment was carried out in exactly the same fashion as the previous four had been but the results were quite different (see Figure 25). Thirty-four per cent of the glutamic acid disappeared by the time it had passed site ' A ' but large amounts of extra organic matter showed up at sites ' B ' and ' C . Being under the disadvantage of not having a specific test for glutamic acid, more indirect methods of identification were employed. The pooled samples which showed increases in organic matter were evaporated in a flash evaporator (Buchler Instruments) at 60° to dryness, extracted with chloroform (polar solvent) and carbon tetrachloride (non-polar solvent), and Infra-red spectrographs were taken (using a Perkin-Elmer Grating Infra-red Spectrophotometer). Carbon tetrachloride failed to pick up any detectable organic compound in sufficient amounts to obtain a spectrograph. Chloroform, on the other hand, showed moderate absorbance at the wavelengths corresponding to N-H, - O H , and COO" . A comparison spectrograph of the concentrated glutamic acid dripped into the stream gave the same results, indicating that no other compound was present in large amounts. A second sample of concentrated stream water was subjected to a carbohydrate analysis with no significant increase above background being detected. Part of this sample was also spotted onto a thin layer chromatography plate (silica gel 20 cm^) and developed in a mixture of 70% ethanol: 30% water v/v (Stahl 1969 p. 739). The unknown was
36

1530 1630 1730 TIME OF DAY
1530 1630 1730 TIME OF DAY
1130 12 30 13 30 TIME OF DAY
1130 1230 1330 TIME OF DAY
Total Added
Recovery ^ B_ C .
Total R e c o v e r Added ^
NaCl
Glucose
328g
105g
349
94
358
85
369g
69g
TOTAL UPTAKE - 418 mg/mYhr
NaCI 245g 263 224 253g
Glucose 7 7 g 80.5 72 58.5g
TOTAL UPTAKE - 216 mg /m^ /h r
Figure 2\. NaCl/glucose experiment July 4, 1977. Figure 22. NaCI/glucose experiment July 10, 1977.
1230 1330 1430 TIME OF DAY
1230 1330 1430 TIME OF DAY
1330 1430 1530 TIME OF DAY
1330 1430 1530 TIME OF DAY
Total Added
Recovery A B C
Total Added
Recovered . A B C .
NaCI
Glucose
131g
66g
136
49
120 134g
47 I9.5g
TOTAL UPTAKE - 4 5 5 mg/m^/hr
NaCI
Glutamic Acid
142g
42 g
139
13.3
150
6.8
147g
18.6 g
Uptake to B 5 4 0 mg /m / h r
Figure 23. NaCl/glucose experiment July 21, 1977. Figure 24. NaCI/glutamic acid experiment July 27, 1977.
37
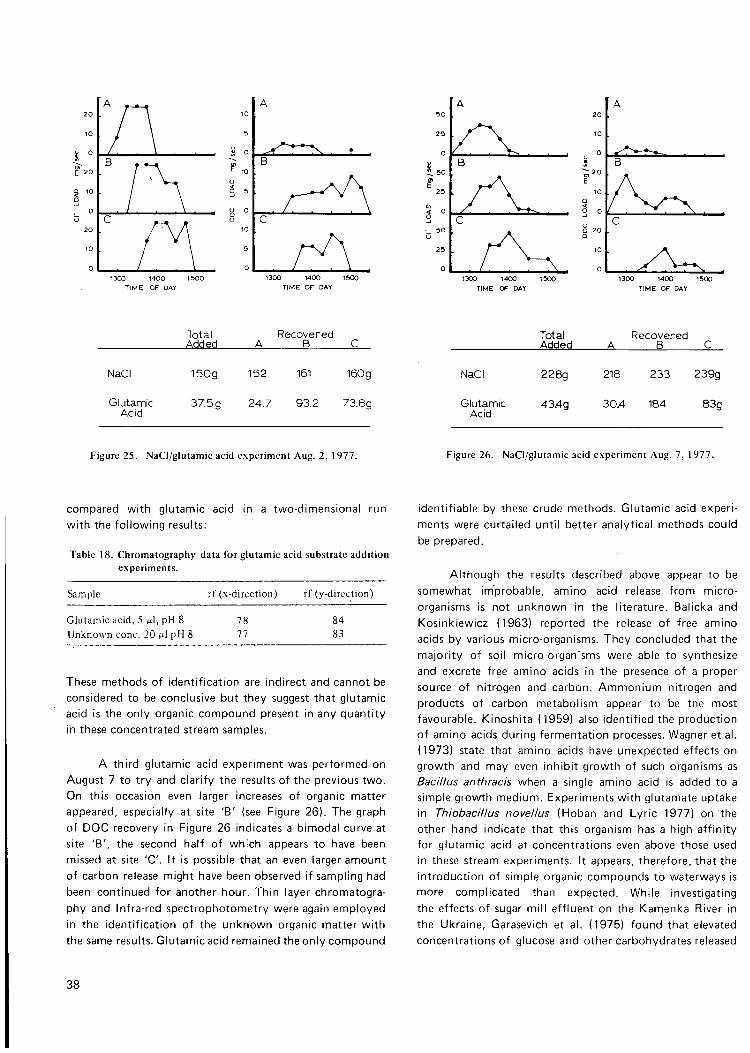
13CXD 1400 1500 TIME OF DAY
1300 1400 1500 TIME OF DAY
1300 1400 1500 TIME OF DAY
1300 1400 1500 TIME OF DAY
NaCI
Glutamic Acid
Total Recovered Added A B C
150g 152 161 160 g
37.5 g 24.7 93.2 73.6g
NaCf
Glutamic Acid
Total Recovered Added A 8 C
228g 218 233 239g
43Ag 30.4 184 83g
Figure 25. NaCI/glutamic acid experiment Aug. 2, 1977. Figure 26. NaCl/glutamic acid experiment Aug. 7, 1977 .
compared with glutamic acid in a two-dimensional run with the following results:
Table 18. Chromatography data for glutamic acid substrate addition experiments.
Sample rf (x-dircction) rf (y-direction)
Glutamic acid, 5 /ul, pH 8 78 84 Unknown cone. 20 MI p H 8 11 83
These methods of identification are indirect and cannot be considered to be conclusive but they suggest that glutamic acid is the only organic compound present in any quantity in these concentrated stream samples.
A third glutamic acid experiment was performed on August 7 to try and clarify the results of the previous two. On this occasion even larger increases of organic matter appeared, especially at site 'B' (see Figure 26). The graph of DOC recovery in Figure 26 indicates a bimodal curve at site 'B', the second half of which appears to have been missed at site ' C . It is possible that an even larger amount of carbon release might have been observed if sampling had been continued for another hour. Thin layer chromatography and Infra-red spectrophotometry were again employed in the identification of the unknown organic matter with the same results. Glutamic acid remained the only compound
identifiable by these crude methods. Glutamic acid experiments were curtailed until better analytical methods could be prepared.
Although the results described above appear to be somewhat improbable, amino acid release from microorganisms is not unknown in the literature. Balicka and Kosinkiewicz (1963) reported the release of free amino acids by various micro-organisms. They concluded that the majority of soil micro-organisms were able to synthesize and excrete free amino acids in the presence of a proper source of nitrogen and carbon. Ammonium nitrogen and products of carbon metabolism appear to be the most favourable. Kinoshita (1959) also identified the production of amino acids during fermentation processes. Wagner et al. (1973) state that amino acids have unexpected effects on growth and may even inhibit growth of such organisms as Bacillus anttiracis when a single amino acid is added to a simple growth medium. Experiments with glutamate uptake in Ttiiobaclllus novellus (Hoban and Lyric 1977) on the other hand indicate that this organism has a high affinity for glutamic acid at concentrations even above those used in these stream experiments. It appears, therefore, that the introduction of simple organic compounds to waterways is more complicated than expected. While investigating the effects of sugar mill effluent on the Kamenka River in the Ukraine, Garasevich et al. (1975) found that elevated concentrations of glucose and other carbohydrates released
38
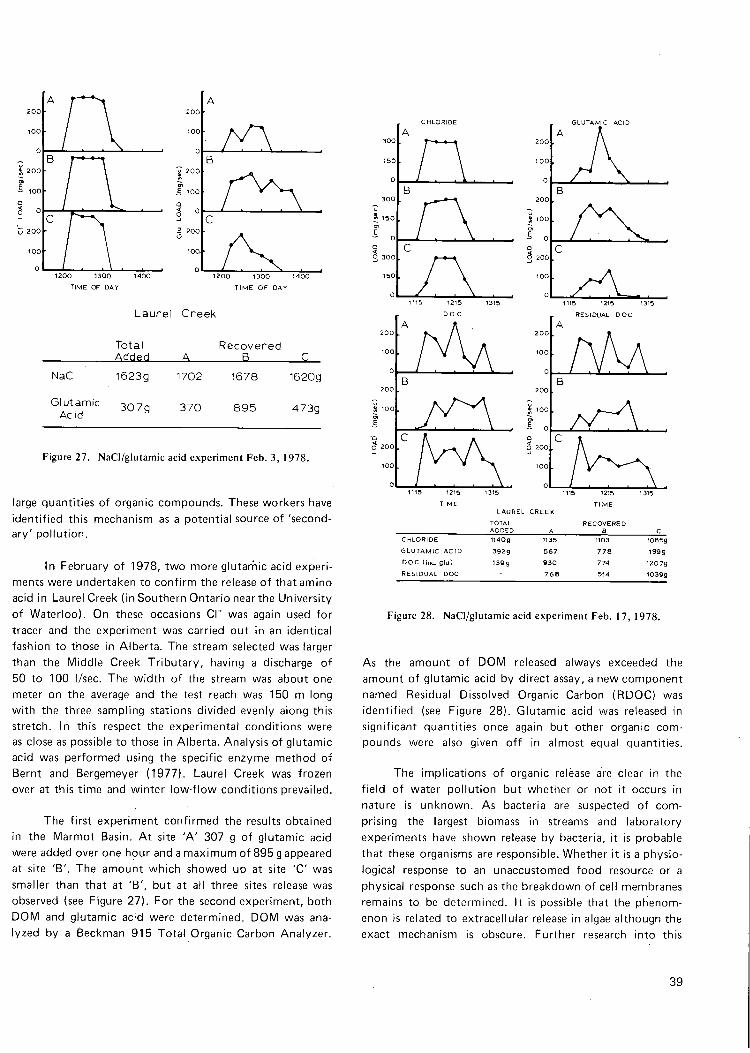
1200 1300 IJOO TIME OF DAY
1200 1300 1400 TIME OF DAY
Laure l C r e e k
Total R e c o v e r e d Added A, E
NaCI I623g
Glutamic Acid
307g
1702
370
1678
8 9 5
1620g
473g
Figure 27. NaCl/glutamic acid experiment Feb. 3, 1978.
large quantities of organic compounds. These workers have identified this mechanism as a potential source of 'secondary' pollution.
In February of 1978, two more glutarhic acid experiments were undertaken to confirm the release of that amino acid in Laurel Creek (in Southern Ontario near the University of Waterloo). On these occasions C l " was again used for tracer and the experiment was carried out in an identical fashion to those in Alberta. The stream selected was larger than the Middle Creek Tributary, having a discharge of 50 to 100 I/sec. The width of the stream was about one meter on the average and the test reach was 150 m long with the three sampling stations divided evenly along this stretch. In this respect the experimental conditions were as close as possible to those in Alberta. Analysis of glutamic acid was performed using the specific enzyme method of Bernt and Bergemeyer (1977). Laurel Creek was frozen over at this time and winter low-flow conditions prevailed.
The first experiment confirmed the results obtained in the Marmot Basin. A t site ' A ' 307 g of glutamic acid were added over one hour and a maximum of 895 g appeared at site ' B ' . The amount which showed up at site ' C was smaller than that at ' B ' , but at all three sites release was observed (see Figure 27). For the second experiment, both D O M and glutamic acid were determined. DOM was analyzed by a Beckman 915 Total Organic Carbon Analyzer.
300.
150|
0
300
S 150
E 0
Q
O 300
1501
0
200
1 00
0
200
S 100
I 0 Q
3 200
100
0
GLUTAMIC ACID
1115 1215 1315
RESIDUAL DOC
1115 1215 1315 1115 1215 1315 TIME
LAUREL CREEK TIME
TOTAL ADDED A
RECOVERED B C
CHLORIDE 1l40g 1135 1103 1085g GLUTAMIC ACID 392 g 567 778 1999 DOC (inc. glu) 13gg 930 774 1207g RESIDUAL DOC 768 514 1039g
Figure 28. NaCl/glutamic acid experiment Feb. 17, 1978.
As the amount of D O M released always exceeded the amount of glutamic acid by direct assay, a new component named Residual Dissolved Organic Carbon (RDOC) was identified (see Figure 28). Glutamic acid was released in significant quantities once again but other organic compounds were also given off in almost equal quantities.
The implications of organic release are clear in the field of water pollution but whether or not it occurs in nature is unknown. As bacteria are suspected of comprising the largest biomass in streams and laboratory experiments have shown release by bacteria, it is probable that these organisms are responsible. Whether it is a physiological response to an unaccustomed food resource or a physical response such as the breakdown of cell membranes remains to be determined. It is possible that the phenomenon is related to extracellular release in algae although the exact mechanism is obscure. Further research into this
39

A
1200 1300 1400 TIME OF DAY
A
1200 1300 1400 TIME OF DAY
Total Recovered Added A B C
NaCI 263g 240 257 286g
Leachate 21.9g 14 22.1 2l.8g
Figure 29. NaCl/spruce leachate experiment Aug. 15, 1977.
problem may serve to illuminate metabolic responses to pollution which may lead to population instability and change.
One additional experiment was performed in the Marmot Basin of the substrate disappearance sort. An artificial leachate made in a Soxhlet extractor of Engelmann Spruce twigs was added to the Middle Creek Tributary along with NaCI tracer on August 15, 1977. A qualitative analysis of this leachate appears in Table 8 which indicates that carbohydrates and tannins and lignins predominate. Twenty-two g of leachate measured as DOM were added but only a small amount of it disappeared (see Figure 29). At site 'A' a 36% reduction was observed but amounts not significantly different from that added appeared at sites 'B' and ' C . An Infra-red spectrograph taken of the original leachate differs quite markedly from a similar spectrograph of a concentrate of waters taken at site ' C (see Figure 30). The profusion of absorbance peaks centred around 6.25 JJ. in the leachate (corresponding to COO" derivatives) has been reduced to one peak and the 'fingerprint' region around 7 has been considerably reduced. As this experiment was performed after the glutamic acid and glucose experiments in the Middle Creek Tributary, it is probable that natural conditions no longer prevailed. An examination of Figure 29 suggests both uptake and release between sites 'A' and ' C and the Infra-red spectrographs show qualitative changes in the leachate as it passed downstream (Figure 30).
DOM UPTAKE DURING STORM RUNOFF AND BASE FLOW
In Chapter 3 a predictive model of storm runoff was developed which successfully approximated Ca"** concentration in the stream over time. The prediction of DOM was not accurate, overestimating its concentration by a factor of about two. The difference is thought to represent uptake of the extra dissolved organic matter which should have reached the stream. For that storm, most of the extra storm runoff was shown to be groundwater so the calculation of DOM content is heavily biased in its favour. Rain water was only slightly more concentrated than groundwater and snow melt water is more dilute. The average difference observed is 2.5 mg/l which is about the amount by which saturated zone groundwater usually exceeds stream water. On page 26 it was stated that the reason that DOM increases are rarely observed with storm runoff is either that groundwater (containing only small amounts of DOM) makes up most of the storm discharge or that the extra DOM is labile enough never to show up as a peak. From the runoff model it appears that both mechanisms may be important as groundwater is clearly dominant, but even the small amount of predicted DOM increase failed to materialize. The increased activity of benthic bacteria which may be capable of removing an additional fraction of the DOM in groundwater, plus the higher quality of DOM entering by throughfall, would explain the absence of an increase.
It appears from the above discussion and from the heterotrophic potential data that benthic bacteria are more
Table 19. Disappearance of Groundwater DOM in the Middle Creek Tributary.
Area of stream between site 'B' and ' C = 36.5 m^ Average concentration of DOM in groundwater = 4.2 mg/l
DOM DOM Q-GVV -GW trib. Load Uptake
Date (1/scc) (mg/l) (mg/l) (mg/sec) mg/m^/hr)
4/7 1.4 4.2* 1.9 3.2 316 10/7 1.7 2.3 1.8 0.9 89 21/7 0.7 5.2 2.5 1.9 187 27/7 1.2 4.8 1.9 3.5 345
7/8 2.7 4.2* 1.6 7.0 692 15/8 0.4 4.2* 2.2 0.8 79
x = 285
SD = 208
Q-GW is calculated by the difference in discharge between sites 'B' and ' C . Load is calculated by multiplying the difference between DOM-GW and DOM-trib. by the discharge (Q-GW). Uptake is calculated by dividing the Load by the area of the stream between 'B ' and ' C and multiplying by 3600 seconds in one hour. 'Average concentration of DOM in groundwater.
40

M I C R O N S 5.0 10.0
Figure 30. Infra-red spectrographs of spruce leachate.
metabolically active than groundwater bacteria (owing to increased nutrient and oxygen availability). If this is true it is not surprising that more DOM is found in the groundwater than in the stream. The more efficient organisms in the stream appear to be capable of removing an average of 55% of the DOM in the groundwater (av. DOM in groundwater = 4.9 mg/l; av. DOM in the stream = 2.2 mg/l). Calculation of the discharge on several occasionsat different points downstream (during substrate addition experiments) on the Middle Creek Tributary, and knowledge of the groundwater DOM concentrations on those days, make an estimate of stream uptake of groundwater DOM possible. The Middle Creek Tributary is fed by two small springs at the source and numerous other seepage areas downstream. By knowing the increase in discharge between sites 'A', 'B', and ' C , the groundwater discharge may be calculated by difference. The background concentration of DOM at each site was measured and observed not to change significantly dovvnstream on any occasion. The data and
calculations appear in Table 19. Groundwater DOM was not sampled exactly on all of these occasions so an average figure was assumed for three days (marked by *). The stretch between site 'A' and 'B' was the most uniform (no major seeps) and uptake measured is no less than •285 mg/m^/hr, so these calculations not only explain the presence of the thick bacteria-slime matrix in all the streams of the Marmot Basin, but confirm that benthic bacteria are capable of further degrading groundwater dissolved organic matter.
In order to gain a more direct measurement of sediment uptake of DOM in groundwater during low flow conditions, a laboratory experiment was undertaken at the University of Waterloo. A series of glass bowls was modified to contain sediment on a permeable screen two centimeters from the bottom. A central core was equipped with an inlet tube which allowed water to seep under this permeable
41
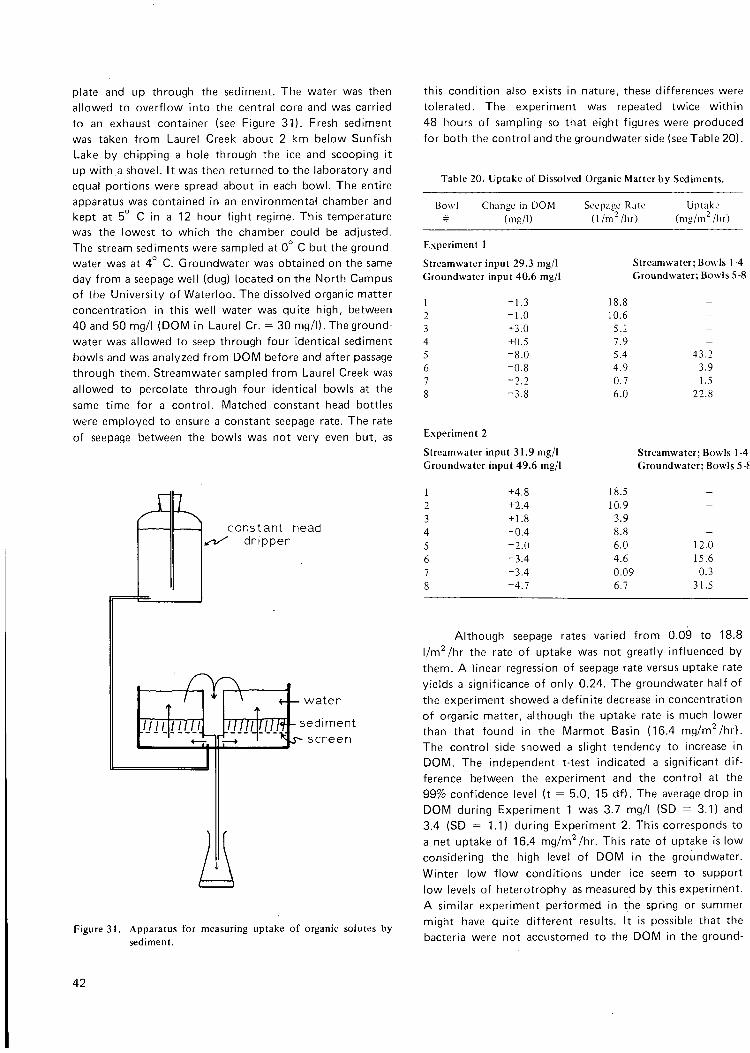
plate and up through the sediment. The water was then allowed to overflow into the central core and was carried to an exhaust container (see Figure 31). Fresh sediment was taken from Laurel Creek about 2 km below Sunfish Lake by chipping a hole through the ice and scooping it up with.a shovel. It was then returned to the laboratory and equal portions were spread about in each bowl. The entire apparatus was contained in an environmental chamber and kept at 5° C in a 12 hour light regime. This temperature was the lowest to which the chamber could be adjusted. The stream sediments were sampled at 0° C but the groundwater was at 4° C. Groundwater was obtained on the same day from a seepage well (dug) located on the North Campus of the University of Waterloo. The dissolved organic matter concentration in this well water was quite high, between 40 and 50 mg/l (DOM in Laurel Cr. = 30 mg/l). The groundwater was allowed to seep through four identical sediment bowls and was analyzed from D O M before and after passage through them. Streamwater sampled from Laurel Creek was allowed to percolate through four identical bowls at the same time for a control. Matched constant head bottles were employed to ensure a constant seepage rate. The rate of seepage between the bowls was not very even but, as
Ul c o n s t a n t head
K -T^ d r i p p e r
this condit ion also exists in nature, these differences were tolerated. The experiment was repeated twice within 48 hours of sampling so that eight figures were produced for both the control and the groundwater side (see Table 20).
Table 20. Uptake of Dissolved Organic Matter by Sediments.
Bowl Change in D O M Seepage Rate (mg/l) ( l / m ^ h r )
Uptake (mg/m^/hr)
Experiment 1
Streamwater input 29.3 mg/l Groundwater input 40.6 mg/l
+ 1.3 -1.0 -1-3.0 -H0.5 -8 .0 -0 .8 -2.2 -3.8
Experiment 2
Streamwater input 31.9 mg/l Groundwater input 49.6 mg/l
+4.8 +2.4 +1.8 -0.4 -2.0 -3.4 -3.4 -4.7
Streamwater; Bowls 1-4 Groundwater; Bowls 5-8
18.8 10.6 5.1 7.9 5.4 4.9 0.7 6.0
43.2 3.9 1.5
22.8
Streamwater; Bowls 1-4 Groundwater; Bowls 5-f
18.5 10.9 3.9 8.8 6.0 4.6 0.09 6.7
12.0 15.6 0.3
31.5
/ / / / 77777 77777
w a t e r
TfTHj- sedinnent L j ^ s c r e e n
Figure 31. Apparatus for measuring uptake of organic solutes by sediment.
Although seepage rates varied from 0.09 to 18.8 l/m^/hr the rate of uptake was not greatly influenced by them. A linear regression of seepage rate versus uptake rate yields a significance of only 0.24. The groundwater half of the experiment showed a definite decrease in concentration of organic matter, although the uptake rate is much lower than that found in the Marmot Basin (16.4 mg/m^/hr). The control side showed a slight tendency to increase in D O M . The independent t-test indicated a significant difference between the experiment and the control at the 99% confidence level (t = 5.0, 15 df). The average drop in D O M during Experiment 1 was 3.7 mg/l (SD = 3.1) and 3.4 (SD = 1.1) during Experiment 2. This corresponds to a net uptake of 16.4 mg/m^/hr. This rate of uptake is low considering the high level of DOM in the groundwater. Winter low flow conditions under ice seem to support low levels of heterotrophy as measured by this experiment. A similar experiment performed in the spring or summer might have quite different results. It is possible that the bacteria were not accustomed to the DOM in the ground-
42

water chosen for the experiment but access to a sufficient quantity of groundwater at that time of year was limited and the well was about 5 km from the stream. On the other hand the surrounding countryside was very similar by each sampling site, and there is no reason to believe that there should be any difference. The sediments were disturbed during transport back to the lab but they were not anaerobic and their temperature was not changed by more than 5° C. The high DOM levels are probably the result of agriculture and the low uptake levels may be the result of the extended period of ice cover. The DOM levels in the stream were 10 mg/l lower than the groundwater so a longer exposure time would probably have brought the groundwater DOM down to the lower level in the stream.
EFFECTS OF NUTRIENTS AND DIFFERENTIAL LAND USE ON GROUNDWATER DOM
The groundwater installations at the Leamington study site afforded an opportunity to examine the effects of agriculture on groundwater DOM. The study site is on a farm with several woodlots and drained by a stream (Hillman Cr.). Groundwater is known to be polluted by nitrate from agricultural fertilizers, and as large amounts of cr are also in these fertilizers, the ion forms a convenient and conservative tracer. Samples were taken in February, 1978 from two multi-level samplers (a single piezometer modified for sampling at different depths through the same casing) installed in a field (H38) and a woodlot (H54). A further set of samples was obtained from Dr. David Lee of the University of Waterloo from a similar installation in Hillman Creek. All of these samples were analyzed for Cl", N O 3 , tannins and lignins, humic and fulvic acids and dissolved organic matter.
Nitrate analysis was carried out by the Geochemistry Laboratory at the University of Waterloo as the sum of nitrate and nitrite (a very small fraction under these aerobic conditions). Chloride was analyzed by the mercuric nitrate method (Standard Methods — APHA). Tannins and lignins were determined by the sodium tungstate — phosphomo-lybdic acid method using tannic acid for standard (Standard Methods — APHA). Dissolved organic matter was determined using a Beckman 915 total organic carbon analyzer. Humic acids were measured as the DOM which precipitated at pH 2 over 5 days in a nitrogen atmosphere at 5°. Fulvic acids are assumed to be the remainder of the DOM content after humic acids and tannins and lignins are subtracted (Telang et al. 1976). It must be pointed out that fulvic acids therefore include such things as carbohydrates and proteins and any other compound which is soluble in the pH range 2 to 9. The Marmot data indicate that this fraction is less than 5%. With the exception of fulvic acids the precision of all the analyses is 5% or better. The error in the determination
of fulvic acids is unknown. Unfortunately no better method of analysis is available for fulvic acids which is adaptable to simple equipment and a large number of samples.
The results of these chemical analyses appear in Figures 32 to 34 and several conclusions may be drawn from them. Dissolved organic matter is present in unusually high concentrations and appears to be affected by high nitrate concentrations. At all three sites the DOM content is lower in the presence of high nitrate (and chloride). DOM appears to increase with depth under the stream so it appears that sediment organisms are removing more and more DOM as it approaches the sediment-water interface. That DOM should decrease with depth under the field is not surprising (greater exposure to soil micro-organisms) but the reason for the increase below the woodlot (H54) is less obvious. Most of the land is under cultivation and the woodlots are small and scattered. Chloride data from H54 indicate that as DOM begins to increase it is intersecting groundwater which infiltrated through cropland and is
2 0 0
250
300 I t-o. UJ 3S0 Q
400
HUMICS (mg/l) 8 10 12 14 16 I I I I I I I I I
DOC (mg/l) 16 18 20 22 24
FULVICS (mg/l) 4 6 8 10 12 I I I I I I I I I
TANNINS and LIGNINS (mg/l) 275 300 325 350 375
I I I 1 I ^
cr (mg/l) 40 50 60 70 8 0
NOJ (mg/l) 5 10 15 20
Figure 32. Groundwater profile H-38, Leamington.
43
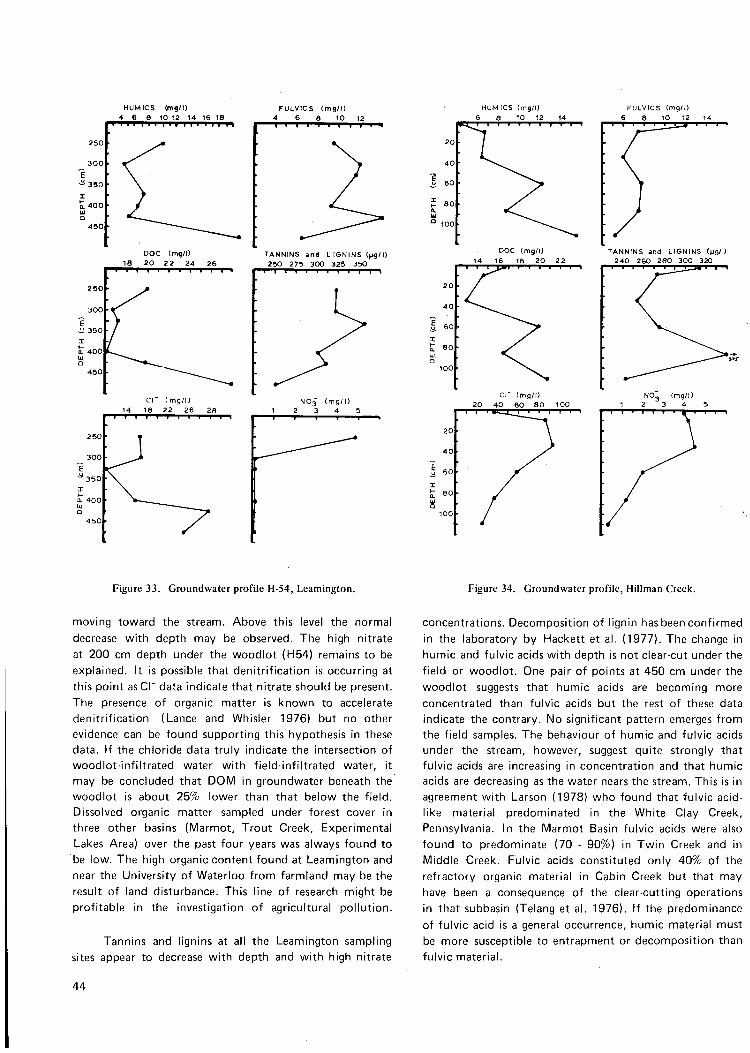
Figure 33. Groundwater profile H-54, Leamington.
moving toward the stream. Above this level the normal decrease with depth may be observed. The high nitrate at 200 cm depth under the woodlot (H54) remains to be explained. It is possible that denitrification is occurring at this point asCr data indicate that nitrate should be present. The presence of organic matter is known to accelerate denitrification (Lance and Whisler 1976) but no other evidence can be found supporting this hypothesis in these data. If the chloride data truly indicate the intersection of woodlot-infiltrated water with field-infiltrated water, it may be concluded that DOM in groundwater beneath the woodlot is about 25% lower than that below the field. Dissolved organic matter sampled under forest cover in three other basins (Marmot, Trout Creek, Experimental Lakes Area) over the past four years was always found to be low. The high organic content found at Leamington and near the University of Waterloo from farmland may be the result of land disturbance. This line of research might be profitable in the investigation of agricultural pollution.
Tannins and lignins at all the Leamington sampling sites appear to decrease with depth and with high nitrate
Figure 34. Groundwater profile, Hillman Creek.
concentrations. Decomposition of lignin has been confirmed in the laboratory by Hackett et al. (1977). The change in humic and fulvic acids with depth is not clear-cut under the field or woodlot. One pair of points at 450 cm under the woodlot suggests that humic acids are becoming more concentrated than fulvic acids but the rest of these data indicate the contrary. No significant pattern emerges from the field samples. The behaviour of humic and fulvic acids under the stream, however, suggest quite strongly that fulvic acids are increasing in concentration and that humic acids are decreasing as the water nears the stream. This is in agreement with Larson (1978) who found that fulvic acidlike material predominated in the White Clay Creek, Pennsylvania. In the Marmot Basin fulvic acids were also found to predominate (70 - 90%) in Twin Creek and in Middle Creek. Fulvic acids constituted only 40% of the refractory organic material in Cabin Creek but that may have been a consequence of the clear-cutting operations in that subbasin (Telang et al. 1976). If the predominance of fulvic acid is a general occurrence, humic material must be more susceptible to entrapment or decomposition than fulvic material.
44

Complete Summary of Conclusions
1. Occlusion of organic matter by precipitation of CaCOs is probably not an important vector for the removal of DOM in streams.
2. Rainfall dripping through vegetation contains significantly more DOM than does precipitation sampled in the open. More labile compounds may be found in throughfall as its exposure to micro-organisms is minimal.
3. The average concentration of DOM found in Marmot Basin waters appears in the table below:
Water F r o m : D O M (mg/l) S.D. (mg/l)
Throughfall 7.6 2.6 Snow 3.3 2.0 Unsaturated GW 21.2 13.8 Saturated GW 4.9 4.4 Springs 1.6 0.5 Middle Cr. 2.2 0.9 Twin Cr. 2.3 0.7 Cabin Cr. 2.1 0.4
Maximum stability of DOM is found in the streams, maximum variation is found in groundwater.
4. Tannins and lignins are the largest fraction in through-fall.
5. The rate of decomposition decreases with depth in - the soil and refractory compounds accumulate.
6. Stream water is dominated by refractory compounds as shown in the Table below (from Telang et al. 1976);
Organic Fraction % Composit ion
Humic and fulvic acids 68 Tannins and lignins 20.4 Carbohydrates 7.4 Amino acids (free and combined) 3.4 Phenosl 0.6 Fatty acids 0.2 Hydrocarbons 0.005
7. Most of the DOM resulting from litter fall in the Marmot Basin is consumed terrestrially and only a small amount of highly refractory material is exported by the streams.
8. The runoff model based on the storm hydrograph separation in the Marmot Basin indicates that most of the water which reaches the stream is groundwater at all times.
9. The estimated transport rate of groundwater in the unsaturated zone (Marmot Basin) is 0.017 m/day.
10. The average transport rate of groundwater in the saturated zone (Marmot Basin) is 0.14 m/day and it takes groundwater about 10 years to reach the stream on the average (Stevenson 1978).
11. Fungi are not very important in the streams of the Marmot Basin but they probably play a significant role in the terrestrial decomposition of conifer needles and moss.
12. The uptake of DOM in surface and groundwaters is primarily a bacterial process by active transport.
13. Biochemical oxygen demand is low in the Marmot waters at ambient stream temperatures and not much higher at 20° C.
14. Groundwater bacteria populations (both sessile and planktonic) are roughly the same as their stream counterparts.
15. Stream bacteria appear to be more metabolically active than groundwater bacteria. Uptake may be predictable by population numbers of bacteria within a uniform environment.
16. Uptake of glucose measured in the Middle Creek Tributary by the substrate disappearance method was 363 mg/m^/hr ± 105.
17. The addition of glutamic acid to streams stimulated the release of further amounts of that amino acid and other organic compounds tentatively labelled as Residual Dissolved Organic Carbon.
45

18. The uptake of groundwater D O M calculated for the Middle Creek Tributary was 285 mg/m^/hr ± 208.
19. The uptake of groundwater DOM in Laurel Creek under ice cover was 16.4 mg/m^/hr ± 14.3.
20. Dissolved organic nnatter appears to disappear more rapidly under forest cover than under agricultural fields. Increased mineralization of groundwater D O M occurred as it approached the sediments of Hillman Creek.
21. Increased mineralization of groundwater D O M was observed at high nitrate concentrations and the presence of organic matter appeared to stimulate denitrif ication.
22. Tannins and lignins decreased in concentration with depth at the Leamington site and in general appeared to be more labile than humic and fulvic acids.
23. Fulvic acids appear to be more resistant to degradation than any other organic compound observed.
46
Literature Cited
Anderson, N.H. and E. Grafius. 1975. Utilization of alloc-thonous material by stream Trichoptera. Verb. int. Ver. Limnol. 19: 3083-88.
Anonymous. 1967. Users Manual - TOC 915. Beckman Instrument Corp.
Anonymous. 1971. Standard methods for the examination of water and wastewater. American Public Health Association, American Water Works Association, Water Pollution Control Federation. 13th ed. Boyd Printing Co.
Baerlocher, F. and B. Kendrick. 1973. Fungi in the diet of Gammarus pseudolimnaeus. Oikos 24: 295-300.
Baerlocher, F. and B. Kendrick. 1974. Dynamics of the fungal population on leaves in a stream. J. Ecol. 62: 761-91.
Baerlocher, F. and B. Kendrick. 1975. Assimilation efficiency of Gammarus pseudolimnaeus feeding on fungal mycelium or autumn shed leaves. Oikos 26: 55-9.
Balicka, N. and B. Kosinkiewicz. 1962. Micro-organisms producing free amino acids in soil. In So/7 Organisms. Ed. J. Doeksen and J. van der Drift. N. Holland Pub. Co., Amsterdam.
Bernt, E. and H. Bergmeyer. 1977. Assay for glutamic acid. Meth. Enzym. p. 1704. Academic Press, N.Y.
Berlin, L. (ed.) 1973. The New Larousse Encyclopedia of
the Earth. Hamlyn, London. Crown Pub. Inc., N.Y. Bishop, J.E. and H.B.N. Hynes. 1969. Upstream movements
of the benthic invertebrates in the Speed River, Ontario. J. Fish. Res. Bd. Can. 26: 279-98.
Boling, R.H., R.C. Petersen, and K.W. Cummins. 1974. Ecosystem modelling for small woodland streams. In Systems Analysis on Simulation in Ecology. Ed. B.C. Patten.
Burges, A. 1963. The microbiology of a Podzol profile. In So/7 Organisms. Ed. J. Doeksen and J. van der Drift. N. Holland Pub. Co., Amsterdam.
Cummins, K.W. et al. 1973. The utilization of leaf litter by stream detritivores. Ecology 54(2): 336.
Davis, S.N. and R.J.M. De Wiest. 1966. Hydrogeology. J. Wiley Inc.
Deevey, E.S. and M. Stuiver. 1964. Distribution of natural isotopes of carbon in Linsley Pond and other New England lakes. Limnol. Oceanog. 9(1): 1-11.
Dietz, A.S., L.J. Albright, and T. Tuomenen. 1976. Heterotrophic activities of bacterioneuston and bacterio-plankton. Can. J. Microbiol. 22: 1699-1709.
Dubois, M. et al. 1956. Colorimetric method for the determination of sugars and related substances. Analyt. Chem. 28(3): 350.
Egglishaw, H.J. 1972. An experimental study of the breakdown of cellulose in fast flowing streams. Mem. Inst. Ital. Idrobiol. 29: suppl. p. 405-28.
Fenchel, T.M. and B. Barker Jorgensen. 1977. Detritus food chains of aquatic ecosystems; the role of bacteria. In Advances in Microbial Ecology. Ed. M. Alexander. Plenum Press, N.Y.
Figliuzzi, S.J. 1976. Throughfall from rainfall for the boreal forest in north-central Alberta. Annual Report to the Alberta Watershed Research Programme.
Fisher, S.G. and G.E. Likens. 1972. Stream ecosystem: Organic energy budget. Bioscience 22: 33-35.
Fisher, S.G. and G.E. Likens. 1973. Energy flow in Bear Brook, New Hampshire: An integrative approach to stream ecosystem metabolism. Ecol. Monogr. 43: 421-439.
Fogg, G.E. 1971. Extracellular products of algae in freshwater. Arch. Hydrobiol. Beih. Ergebn. Limnol. 5: III p. 1-25.
Frankland, J.C. 1974. Decomposition of lower plants. In Biology of Plant Litter Decomposition. V. VI. Ed. C.H . Dickinson and G.J.F. Pugh. Academic Press.
Freeze, R.A. 1974. Streamflow generation. Reviews of Geophysics and Space Physics 12(4): 627-47.
Fritz, P., J.A. Cherry, K.U. Weyer, and M. Sklash. 1976. Storm runoff analyses using environmental isotopes and major ions. In Interpretation of Environmental Isotope and Hydrochemical data in Groundwater Hydrology. Inter. Atomic Energy Agency, Vienna.
Garesevich, I.G., I.K. Palamarchuk, and B.l. Nabivariets. 1975. The effect of river bottom deposits on the composition of surface waters. Hydrobiol. J. 11(6): 10-18.
Garrels, R.M. and C.L. Christ. 1965. Solutions, Minerals and Equilibria. Freeman, Cooper and Co.
Gillham, R, and J.A. Cherry. 1978. Field evidence of denitrification in shallow groundwater flow systems. 13th Symp. on Water Pollution Research held at McMaster University.
Hackett, W.F., W.J. Conners, T.K. Kirk, and J.G. Zerkus. 1977. Microbial decomposition of synthetic '"C labelled lignins in nature; lignin biodegradation in a variety of natural materials. Applied Environ. Microbiol. 33: 43-51.
47
Harrison, M.J., R.I. Wright, and R.Y. Morita. 1971. Method for measuring mineralization in lake sediments. Applied Microbiol. 21(4): 698-702.
Hewlett, J.D. 1961. Soil moisture as a source of base flow from steep mountain watersheds. Station Paper #32 — Southeast Forest Experimental Station, Ashville, N.C. U.S. Dept. of Agriculture and Forest Service.
Hewlett, J.D. 1967. A hydrologic response map for the state of Georgia. Wat. Res. Bull. 3: 3.
Hewlett, J.D. 1969. Tracing storm and baseflow to variable source areas on forested headwaters Tech. Rep. #2 OWRR Project A-004GA Report.
Hewlett, J.D. and J.D. Helvey. 1970. Effects of forest clearcutting on the storm hydrograph. Water Resources Res. 6(3): 768.
Hewlett, J.D. and A.R. Hibbert. 1963. Moisture and energy conditions within a sloping soil mass during drainage J. Geophysical Res. 68: 4.
Hewlett, J.D. and W.L. Nutter. 1970. The varying source area of streamflow from upland basins. Proc. Symp. on Interdisciplinary Aspects of Watershed Management. University of Montana, Bozeman, Aug. 3-8.
Hoban, D.J. and R.M. Lyric. 1977. Glutamate uptake in Thiobacillus novellus. Can. J. Microbiol. 23: 271-7.
Hobble, J.E. and R.T. Wright. 1965. Bioassay with bacterial uptake kinetics: glucose in freshwater. Limnol. Oceanog. 10: 471-4.
Hynes, H.B.N. 1970. The Ecology of Running Waters University of Toronto Press.
Hynes, H.B.N. 1975. The stream and its valley. Verh. int. Ver. Limnol. 19: 1-15 (Baldi Lecture).
Iverson, T.M. 1973. Decomposition of autumn-shed beech leaves in a spring-brook and its significance for the fauna. Arch. Hydrobiol. 72: 3.
Iverson, T.M. 1975. Disappearance of autumn-shed beech leaves placed in bags in small streams. Verh. int. Ver. Limnol. 19: 1687-92.
Kaushik, N. and H.B.N. Hynes, 1971. The role of the dead leaves that fall into streams. Arch. Hydrobiol. 68: 465-515.
Kinoshita, S. 1959. The production of amino acids by fermentation processes. Adv. in Appl. Microbiol. 1: 201.
Klute, A. 1967. The movement of water in unsaturated soils. Privately published lecture notes.
Krauskopf, K.B. 1967. Introduction to Geochemistry. McGraw-Hill.
Lance, J.G. and F.D. Whisler. 1976. Stimulation of denitrification in soil columns by adding organic carbon to wastewater. J. Wat. Poll. Contr. Fed. 48(2): 346.
Larson, R.A. 1978. Dissolved organic matter of a low-coloured stream. Freshwat. Biol. 8: 91-104.
Leenheer, J.A., R.L. Malcolm, P.W. McKinley and L.A.
Eccles. 1974. Occurrence of dissolved organic matter in selected groundwater samples in the United States. J. Res. U.S. Geol. Survey 2(3): 361-9.
Likens, G.E. et al. 1970. Effects of forest clearcutting and herbicide treatment on nutrient budgets in the Hubbard Brook watershed ecosystem. Ecol. Mono. 40: 23-47.
Lock, M.A. and H.B.N. Hynes. 1975. The disappearance of four leaf leachates in a hard and soft water stream in Southwestern Ontario, Canada. Int. Revue ges. Hydrobiol. Hydrogr. 60(6): 847-55.
Lock, M.A., Wallis, P.M. and H.B.N. Hynes. 1977. Colloidal organic carbon in running waters. Oikos 29(1): 1-4.
Lush, D. 1973. Organic detrital cycles in small forested watersheds. Ph. D. thesis — University of Waterloo.
Macioiek, J.A. 1962. Limnological organic analyses by quantitative dichromate oxidation. Res. Rep. 60. U.S. Dept. of the Interior.
Millar, C.S. 1974. Decomposition of coniferous leaf litter. In Biology of Plant Litter Decomposition. V. VI. Ed. C.H. Dickinson and G.J.F. Pugh. Academic Press.
Otsuki, A. and R.G. Wetzel. 1973. Interaction of yellow organic acids with CaCOa in freshwater. Limnol. Oceanog. 18: 3.
Otsuki, A. and R.G. Wetzel. 1974. Calcium and total alkalinity budgets and CaCOa precipitation of a small hard-water lake. Arch. Hydrobiol. 73: 1.
Parkinson, A. and B. Coups. 1963. Microbial activity in a Podzol. In Soil Organisms. Ed. J. Doeksen and J. van der Drift. N. Holland Pub. Co., Amsterdam.
Parsons, T.R. and J.D.H. Strickland. 1962. On the production of particulate organic carbon by heterotrophic processes in sea water. Deep Sea Res. 8: 211-23.
Rowe, J.S. 1972. Forest Regions of Canada. Dept. of the Environment, Canadian Forestry Service Pub. No. 1300.
Sartz, R.S. 1969. Soil Water movement as affected by deep freezing Proc. Soil Sci. Soc. Amer. 33(3): 333.
Schnitzer, M. and J.G. Desjardins. 1969. Chemical characteristics of a natural soil leachate from a humic podzol. Can. J. Soil Sci. 49: 151-8.
Sepers, A.B.J. 1977. The utilization of dissolved organic compounds in aquatic environments. Hydrobiologia 52: 39-54.
Sklash, M.G., R.N. Farvolden, and P. Fritz. 1976. A conceptual model of watershed response to rainfall; developed through the use of oxygen-18 as a natural tracer. Can. J. Earth Sci. 13: 2.
Sklash, M.G. 1978. The role of groundwater in storm and snowmelt runoff generation. Ph.D. thesis — University of Waterloo.
Stahl, E. 1969. Thin Layer Chromatography. Springer-Verlag, N.Y.
48
Stalker, A.MacS. 1973. Surficial geology of the Kananaskis research forest and Marmot Creek basin region of Alberta. Geol. Surv. Can. Paper 72-51.
Stevenson, D.R. 1967. Geological and groundwater investigations in the Marmot Creek Experimental Basin of southwestern Alberta, Canada. M.Sc. thesis — University of Alberta.
Stevenson, D.R. 1978. Data from report to the Alberta Watershed Research Programme, (no title)
Storr, D. 1977. Some preliminary water balances of Marmot Creek sub-basins. Report to Alberta Watershed Research Programme.
Stout, J.D., C. Tate, and D. Molloy, 1977. Decomposition processes in New Zealand soils with particular respect to rates and pathways of plant degradation. In The Role of Terrestrial and Aquatic Organisms in Decomposition Processes. Ed. F.Andersonand G. Macfadyen. 17th Symp. Brit. Ecol. Soc. Oxford, Blackwell.
Swanson, R.H. 1975. Water use by mature lodgepole pine. Proc. Symp. Management of Lodgepole Pine Ecosystems. Ed. D.M. Baumgartner. Washington State University Cooperative Extension Service (pub.)
Telang, S.A., B.L. Baker, J.W. Costerton, and G.W. Hodgson. 1975. Water quality and forest management: the effects of clear cutting on organic compounds in surface waters of the Marmot Creek drainage basin. Report to the Dept. of the Environment.
Telang, S.A., B.L. Baker, G.W. Hodgson, J.W. Costerton, G.G. Geesey, R.A. Mutch, and P. Wallis. 1976. Water quality and forest management: Chemical and biological processes in a forest-stream ecosystem of the
Marmot Creek Drainage Basin. Ibid, van der Drift, J. 1963. The disappearance of litter in mull
and mor in connection with weather conditions and the activity of the macrofauna. In So/7 Organisms. Ed. J. Doeksen and J . van der Drift. N. Holland Publ. Co., Amsterdam.
Wagner, B.J., M.L. Miovic, and J.Gibson. 1973. Utilization of amino acids by Chromatium sp. strain D. Arch. Mikrobiol. 91: 255-72.
Wallis, P.M. 1975. Dissolved organic carbon in groundwater and streams. M.Sc. thesis — University of Waterloo.
Water Survey of Canada. 1973. Compilation of hydrometeorological records — Marmot Creek Basin, v. 9. Dept. of the Environment.
Weast, R.C. (ed.) ^dGS. Handbook of Chemistry and Physics. Ed. 49. Chemical Rubber Co.
Wetzel, R.G. 1967. Dissolved organic compounds and their utilization in two marl lakes. Hidrologial Kozloni 47.
Whipkey, R.Z. 1970. Water control on experimental forest watersheds. J. Soil and Wat. Conserv. 25: 6.
Willoughby, L.G. and D.W. Sutcliffe. 1976. Experiments on feeding and growth of the amphipod Gammarus pulex related to its distribution in the River Duddon. Freshwat. Biol. 6: 577-86.
Wright, R.T. and J.E.'Hobble. 1966. Use of glucose and acetate by bacteria and algae in aquatic ecosystems. Ecol. 47: 447-64.
Zimmermann, R. and L. Meyer-Reil. 1974. A new method for fluorescence staining of bacterial populations on membrane filters. Kieler Meeresforschungen 30(1): 24-27.
49