can social information affect what job you choose and … · can social information affect what job...
TRANSCRIPT

American Economic Journal: Applied Economics 2017, 9(1): 96–117 https://doi.org/10.1257/app.20140468
96
Can Social Information Affect What Job You Choose and Keep?†
By Lucas C. Coffman, Clayton R. Featherstone, and Judd B. Kessler*
We show that the provision of social information influences a high-stakes decision and this influence persists over time. In a field experiment involving thousands of admits to Teach For America, those told about the previous year’s matriculation rate are more likely to accept a teaching job, complete training, start, and return a second year. To show robustness, we develop a simple theory that identifies subgroups where we expect larger treatment effects and find our effect is larger in those subgroups. That social information can have a powerful, persistent effect on high-stakes behavior broad-ens its relevance for policy and theory. (JEL D83, I21, J22, J45, L31, Z13)
The idea that policymakers can use cheap, subtle interventions to shape behavior has recently risen to prominence.1 The question of which interventions are suf-
ficiently robust to be policy relevant is an important one. A natural criterion is that the force should affect behavior in high-stakes situations, and do so persistently.2 In this paper, we provide the first evidence that social information (i.e., provid-ing information about the previous decisions of others) satisfies these conditions. Specifically, we show that when an established nonprofit, Teach For America (or for short, “TFA”), offers high-achieving college graduates modestly paying jobs teach-ing in underperforming schools, individuals are more likely to take the job when the offer letter includes information about the high percentage of people who accepted the job in the previous year.3 Moreover, the experimentally informed group is more likely to train for the job, begin the job, and return to the job the following year. To
1 The Behavioral Insights Team (BIT) in the United Kingdom was explicitly formed to consider and implement such interventions. In the United States, the Office of Regulatory Affairs and the Consumer Financial Protection Bureau have conducted similar work and the Social and Behavioral Sciences Team at the White House was founded in 2014 to be modeled on the UK BIT.
2 Defaults have been shown to persistently affect high-stakes decisions like retirement savings (e.g., Carroll et al. 2009) and insurance plan choice (e.g., Ericson 2014). Field (2009) finds changing the framing of a financial aid offer affects job choice. Nonsocial information has also been shown to affect decisions. Jensen (2010) finds that providing high school students with information about wages can increase graduation rates two years later.
3 Background on the Teach For America organization is provided in Section I.
* Coffman: 1805 Cambridge Street, Cambridge, MA 02138 (e-mail: [email protected]); Featherstone: 1352 Steinberg Hall-Dietrich Hall, 3620 Locust Walk, Philadelphia, PA 19104 (e-mail: [email protected]); Kessler: 1454 Steinberg Hall-Dietrich Hall, 3620 Locust Walk, Philadelphia, PA 19104 (e-mail: [email protected]). The authors thank Muriel Niederle, Katherine Coffman, John Kagel, and Paul Healy for helpful comments and Johann von Hoffmann, Caroline Charrow, Josh Hoen, and Teach For America for their help with the project. IRB approval was obtained from the University of Pennsylvania.
† Go to https://doi.org/10.1257/app.20140468 to visit the article page for additional materials and author disclosure statement(s) or to comment in the online discussion forum.
VoL. 9 No. 1 97coffman et al.: can social information affect JoB cHoice?
highlight the robustness of our finding, we develop a theory of which subgroups should be more affected by the treatment and show that the effect is, in fact, larger for every subgroup we consider.
The effect of social information on low-stakes decisions is well established. People are more likely to donate to charity when they learn a high percentage of oth-ers donate (Frey and Meier 2004, Martin and Randal 2008), and they donate larger amounts when told of a large previous donation (Croson and Shang 2008, Shang and Croson 2009). They are also more likely to contribute to a movie rating website (Chen et al. 2010), take an environmentally friendly action,4 and contribute in a lab-oratory public goods game5 when told that others do so. Together, such studies show that social information can work, and can persist, in low-stakes environments6; but no previous work has shown that social information is effective, much less persists, for a high-stakes decision.7 Consequently, it is an open question whether social information is sufficiently important to be a critical part of behavioral theories that aim to also explain high-stakes behavior. Our study addresses this question.8
We show that social information can influence a high-stakes decision by adding one line to the end of randomly selected job offer emails sent by TFA: “Last year, more than 84 percent of admitted applicants made the decision to join the corps, and I sincerely hope you join them.”9 We show that the effect can persist by following our subjects for two years after they receive the treatment. Those who received the social information are 1.8 percentage points more likely to accept the job, and the effect stays as large throughout the two-year follow-up.
In Section III, we explain that under natural assumptions we expect to see a larger effect of our treatment on matriculation in subgroups that have a lower matricula-tion rate in the control condition. Intuitively, when the vast majority of individuals accept the TFA job, a subgroup with a lower matriculation rate should have a higher proportion of marginal individuals (i.e., those “on the fence” about their decision to accept TFA’s offer).10 The model helps to establish the robustness of our results by identifying subgroups where we expect the treatment effect to be larger.
4 See Cialdini, Reno, and Kallgren (1990) on littering; Goldstein, Cialdini, and Griskevicius (2008) on towel reuse; and Allcott (2011) and Allcott and Rogers (2014) on energy consumption.
5 See a vast experimental literature starting with Keser and van Winden (2000); Fischbacher, Gächter, and Fehr (2001); and Potters, Sefton, and Vesterlund (2005).
6 Shang and Croson (2009) show that information about another donor’s large gift makes subjects give more today and makes them more likely to give next year. Allcott and Rogers (2014) show the effects of social informa-tion on energy consumption decay gradually over time, suggesting evidence of persistence.
7 Effects in previous studies are usually only a few dollars; even the largest remain modest, e.g., an extra $40 donated to a radio drive (Shang and Croson 2009) or paying a 250€ TV licensing fee (Fellner, Sausgruber, and Traxler 2013). At even higher stakes, Beshears et al. (2015) and Bhargava and Manoli (2015) find negative effects.
8 In research conducted concurrently with this paper, Hallsworth et al. (2014) find that reporting the high per-centage of individuals who pay their taxes on time in reminder letters significantly increases taxes paid to the UK government within a 23-day period after the letters were mailed. With average debts of around £2,800 in the experi-ment, the retiming of tax payments may have had significant costs as well. In similarly concurrent work, Del Carpio (2014) finds that a letter with information about the high rate of compliance to property taxes in Peru leads to higher compliance, although the effect size cannot be statistically distinguished from the pure reminder effect of the letter.
9 Teach For America collectively refers to all of its teachers as the “corps.” The “and I sincerely hope you join them” is unlikely to be driving any effect we see, for reasons discussed near the end of Section IIB.
10 This approach is consistent with the approach in Frey and Meier (2004), which identifies marginal subgroups as those who have given to student funds in some, but not all, previous semesters.

98 AmErIcAN EcoNomIc JourNAL: AppLIEd EcoNomIcs JANuAry 2017
When we look to the marginal subgroups highlighted by the model, the effect size jumps to between 3 and 5 percentage points. We identify this result for numerous uncorrelated subgroups, including one we identified (and stratified on) midway through the experiment. Furthermore, we follow individuals who accept the job to see who attends a mandatory training program, starts teaching in the first semester, returns to teach in the second semester, and returns again to teach in the second year.11 We find that the treatment effect persists at the same high levels even into the second year of teaching (by which time 25 percent of those who accepted the job in the control group have left the program). Based on our results, TFA started including a line of social information about their historical matriculation rate in all admissions letters.
There are a number of ways to benchmark the size of our effect. In the termi-nology of DellaVigna and Kaplan (2007) and DellaVigna and Gentzkow’s (2009) survey of the empirical evidence on persuasion, our effect corresponds a persuasion rate of 8.4 percent; that is, our treatment persuaded 8.4 percent of the subjects who were not going to join TFA to do so.12 In subgroups with more marginal admits, our persuasion rate jumps to between 12 percent and 14 percent. It is perhaps surprising that our very subtle intervention has a persuasion rate that is comparable to more intensive interventions, such as the effect of door-to-door fund-raising on giving (DellaVigna, List, and Malmendier 2012, which has a persuasion rate of 11 per-cent), the effect of reporting high levels of seed funding in a direct mail campaign on giving (List and Lucking-Reiley 2002, 8.2 percent), and the effect of exposure to a media outlet that is either liberal (Gerber, Karlan, and Bergan 2009, 19.5 percent) or conservative (DellaVigna and Kaplan 2007, 11.6 percent) on voting behavior.
That one line of social information can significantly affect whether a person takes and keeps a teaching job speaks to the strength of the force and the efficacy of such an intervention—particularly since our intervention is so small relative to the amount of information admitted applicants receive about TFA during the applica-tion and interview process, and after they have been admitted to the program.13 A follow-up survey confirms that though the intervention was subtle, the social infor-mation treatment measurably increased beliefs about the current year’s matricula-tion rate. The survey also suggests that our treatment’s effect on beliefs may wear off over time, even while the treatment’s effect on behavior persists.
Together our results present strong evidence for the importance of social informa-tion for theory as well as for policy. Our intervention was subtle, free, and occurred at a single point in time, but it had a persistent impact on a high-stakes decision. Social information has the potential be an effective lever to persistently affect behavior in important, high-stakes environments.
11 Previous data from TFA shows that 95 percent of the individuals who fail to complete their two-year commit-ments to TFA have left by the start of the second teaching year.
12 In our setting, the persuasion rate is ( y T − y c ) / (1 − y c ) , where y T ( y c ) is the fraction of subjects who join in the treatment (control) group.
13 Admitted applicants report that they are well informed about TFA. In a TFA-conducted survey, 67 percent of admitted applicants rate contact quality with TFA as excellent and 90 percent rate it as either excellent or good. In addition, TFA admits are well educated, a population that one might expect to be able to process information and make good decisions in a high-stakes environment.
VoL. 9 No. 1 99coffman et al.: can social information affect JoB cHoice?
I. Background
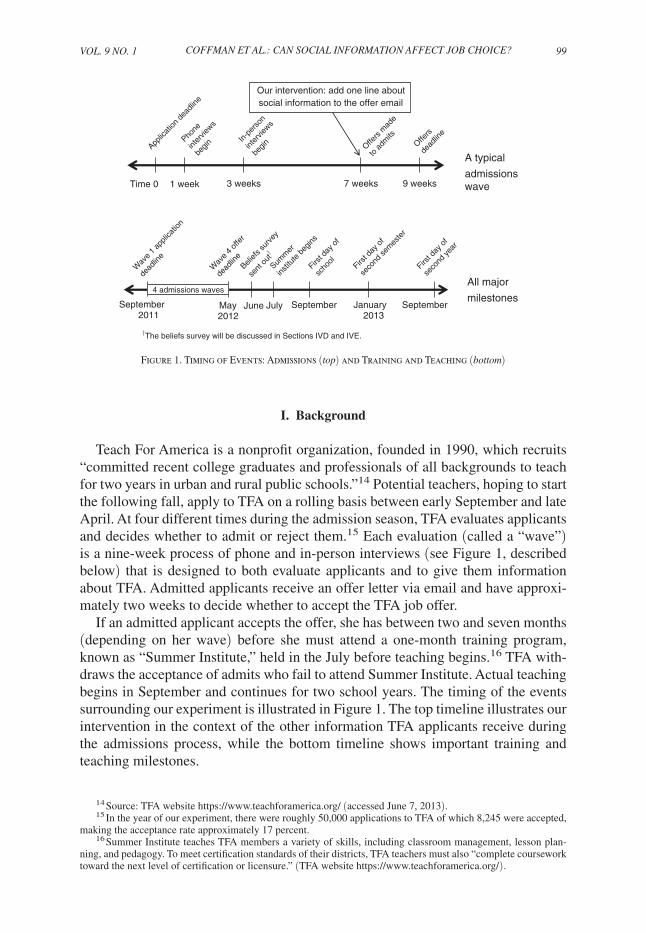
Teach For America is a nonprofit organization, founded in 1990, which recruits “committed recent college graduates and professionals of all backgrounds to teach for two years in urban and rural public schools.”14 Potential teachers, hoping to start the following fall, apply to TFA on a rolling basis between early September and late April. At four different times during the admission season, TFA evaluates applicants and decides whether to admit or reject them.15 Each evaluation (called a “wave”) is a nine-week process of phone and in-person interviews (see Figure 1, described below) that is designed to both evaluate applicants and to give them information about TFA. Admitted applicants receive an offer letter via email and have approxi-mately two weeks to decide whether to accept the TFA job offer.
If an admitted applicant accepts the offer, she has between two and seven months (depending on her wave) before she must attend a one-month training program, known as “Summer Institute,” held in the July before teaching begins.16 TFA with-draws the acceptance of admits who fail to attend Summer Institute. Actual teaching begins in September and continues for two school years. The timing of the events surrounding our experiment is illustrated in Figure 1. The top timeline illustrates our intervention in the context of the other information TFA applicants receive during the admissions process, while the bottom timeline shows important training and teaching milestones.
14 Source: TFA website https://www.teachforamerica.org/ (accessed June 7, 2013). 15 In the year of our experiment, there were roughly 50,000 applications to TFA of which 8,245 were accepted,
making the acceptance rate approximately 17 percent. 16 Summer Institute teaches TFA members a variety of skills, including classroom management, lesson plan-
ning, and pedagogy. To meet certification standards of their districts, TFA teachers must also “complete coursework toward the next level of certification or licensure.” (TFA website https://www.teachforamerica.org/ ).
January 2013
SeptemberMay 2012
September2011
All major
milestones
Our intervention: add one line about social information to the offer email
A typical
admissions waveTime 0 1 week 3 weeks 7 weeks 9 weeks
4 admissions waves
June July
†The beliefs survey will be discussed in Sections IVD and IVE.
September
Applic
ation
dea
dline
Phone
inter
views
begin
In-p
erso
n
inter
views
begin Offe
rs m
ade
to a
dmits
Offers
dead
line
Wav
e 1
appli
catio
n
dead
line
Wav
e 4
offe
r
dead
line
Belief
s sur
vey
sent
out†
First d
ay o
f
seco
nd se
mes
ter
First d
ay o
f
scho
olSum
mer
institu
te b
egins
First d
ay o
f
seco
nd ye
ar
Figure 1. Timing of Events: Admissions (top) and Training and Teaching (bottom)

100 AmErIcAN EcoNomIc JourNAL: AppLIEd EcoNomIcs JANuAry 2017
II. Experimental Design
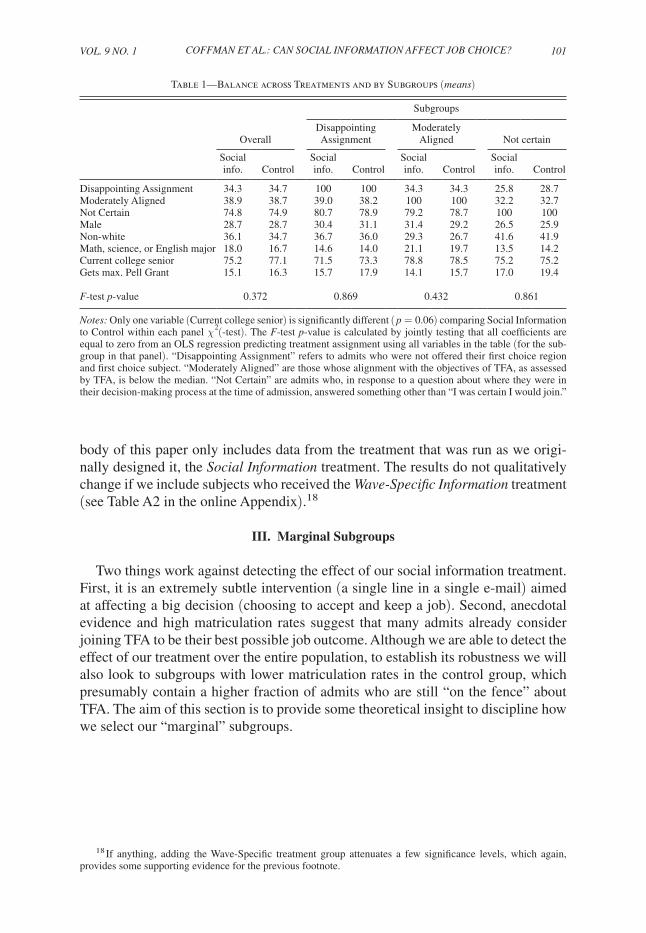
Our experiment was straightforward. Subjects randomly received either the stan-dard TFA admissions letter (the control condition, n = 3,337) or that same letter with an additional line at the end: “Last year more than 84 percent of admitted applicants made the decision to join the corps, and I sincerely hope you join them” (the social Information condition n = 3,348). The 84 percent figure averages over all admits from the previous year. Figure A1 in the online Appendix shows that add-ing the sentence is only a small change to the standard, full-page admissions letter. We performed the randomization of admits into the treatment and control groups ourselves, and TFA staff members who were in contact with admits did not know who received each treatment. Demographics were balanced across treatments for the full sample as well as within each subgroup that we consider below (see Table 1 for balance and Section III for definition of subgroups).
Although the experiment is relatively simple, several facets are worth pointing out. First, although we intended our added sentence to be purely informational, Teach for America felt that the sentence was too abrupt without the fragment “… and I sincerely hope you join them.” Although this part of the sentence could potentially be driving whatever effect we see, it is unlikely as very similar wording is contained earlier in the letter in both the control and social Information conditions (referenc-ing TFA corps members: “… and we hope that you will join them in this important work”). Second, the fact that Teach For America admits applicants at four points in time essentially creates four small experiments (one for each admissions wave). We will deal with this using regression analysis in Section IVA.
In our original design, we had a third condition meant to induce variation in the matriculation rate given to TFA admits. To achieve this without using deception, the condition used the same wording as the social Information condition but pro-vided the matriculation rate of a subset of last year’s admitted applicants (those who applied in the same wave in the previous year). However, TFA staff ultimately changed our wording so no admitted applicants would get the same exact letter with different numbers. Letters in this altered Wave-specific Information condition read (boldface added to emphasize the difference from the social Information condi-tion): “At this deadline last year, more than 92 percent of admitted applicants made the decision to join the corps, and I sincerely hope you join them.” Unfortunately, this change in wording prevented us from identifying the effect of changing the matriculation rate (from 84 percent to 92 percent) separately from the effect of changing the specificity of the wording (see Goldstein, Cialdini, and Griskevicius 2008 about specificity of social information). As a result, we asked TFA to drop the Wave-specific Information treatment after the second wave.17 The analysis in the
17 The second-wave matriculation rate in the previous year was slightly above 84 percent (the same as the rate averaged across all admits in the previous year). By keeping the Wave-specific Information condition for the second wave, we attempted to identify the effect of changing the specificity of the language. As this was not part of our original design, we were underpowered to conclusively identify the effect, but we find that the “At this deadline last year” language is directionally less effective than the simpler “Last year” language. Results are consistent in the first wave. This contrasts somewhat with Goldstein, Cialdini, and Griskevicius (2008), which finds that more spe-cific social information is a more effective motivator, but again we are underpowered to say anything conclusively. Detailed analysis is available upon request.
VoL. 9 No. 1 101coffman et al.: can social information affect JoB cHoice?
body of this paper only includes data from the treatment that was run as we origi-nally designed it, the social Information treatment. The results do not qualitatively change if we include subjects who received the Wave-specific Information treatment (see Table A2 in the online Appendix).18
III. Marginal Subgroups
Two things work against detecting the effect of our social information treatment. First, it is an extremely subtle intervention (a single line in a single e-mail) aimed at affecting a big decision (choosing to accept and keep a job). Second, anecdotal evidence and high matriculation rates suggest that many admits already consider joining TFA to be their best possible job outcome. Although we are able to detect the effect of our treatment over the entire population, to establish its robustness we will also look to subgroups with lower matriculation rates in the control group, which presumably contain a higher fraction of admits who are still “on the fence” about TFA. The aim of this section is to provide some theoretical insight to discipline how we select our “marginal” subgroups.
18 If anything, adding the Wave-Specific treatment group attenuates a few significance levels, which again, provides some supporting evidence for the previous footnote.
Table 1—Balance across Treatments and by Subgroups (means)
Subgroups
Overall
Disappointing Assignment
Moderately Aligned Not certain
Social info. Control
Social info. Control
Social info. Control
Social info. Control
Disappointing Assignment 34.3 34.7 100 100 34.3 34.3 25.8 28.7Moderately Aligned 38.9 38.7 39.0 38.2 100 100 32.2 32.7Not Certain 74.8 74.9 80.7 78.9 79.2 78.7 100 100Male 28.7 28.7 30.4 31.1 31.4 29.2 26.5 25.9Non-white 36.1 34.7 36.7 36.0 29.3 26.7 41.6 41.9Math, science, or English major 18.0 16.7 14.6 14.0 21.1 19.7 13.5 14.2Current college senior 75.2 77.1 71.5 73.3 78.8 78.5 75.2 75.2Gets max. Pell Grant 15.1 16.3 15.7 17.9 14.1 15.7 17.0 19.4
F-test p-value 0.372 0.869 0.432 0.861
Notes: Only one variable (Current college senior) is significantly different ( p = 0.06) comparing Social Information to Control within each panel χ 2 (-test). The F-test p-value is calculated by jointly testing that all coefficients are equal to zero from an OLS regression predicting treatment assignment using all variables in the table (for the sub-group in that panel). “Disappointing Assignment” refers to admits who were not offered their first choice region and first choice subject. “Moderately Aligned” are those whose alignment with the objectives of TFA, as assessed by TFA, is below the median. “Not Certain” are admits who, in response to a question about where they were in their decision-making process at the time of admission, answered something other than “I was certain I would join.”
102 AmErIcAN EcoNomIc JourNAL: AppLIEd EcoNomIcs JANuAry 2017
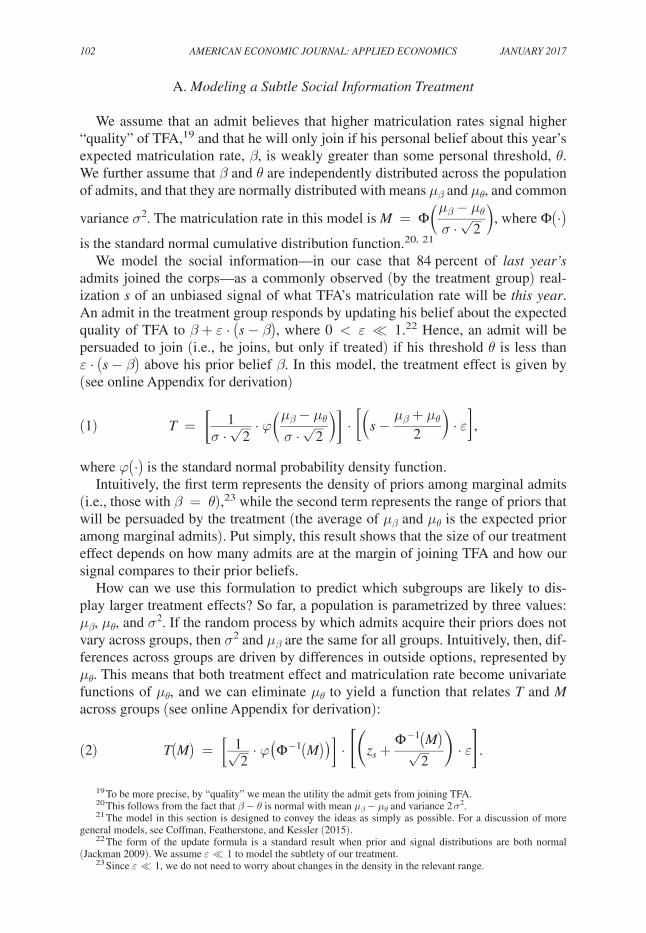
A. modeling a subtle social Information Treatment
We assume that an admit believes that higher matriculation rates signal higher “quality” of TFA,19 and that he will only join if his personal belief about this year’s expected matriculation rate, β , is weakly greater than some personal threshold, θ . We further assume that β and θ are independently distributed across the population of admits, and that they are normally distributed with means μ β and μ θ , and common
variance σ 2 . The matriculation rate in this model is m = Φ ( μ β − μ θ _ σ ⋅ √
_ 2 ) , where Φ (⋅)
is the standard normal cumulative distribution function.20, 21
We model the social information—in our case that 84 percent of last year’s admits joined the corps—as a commonly observed (by the treatment group) real-ization s of an unbiased signal of what TFA’s matriculation rate will be this year. An admit in the treatment group responds by updating his belief about the expected quality of TFA to β + ε ⋅ (s − β) , where 0 < ε ≪ 1 .22 Hence, an admit will be persuaded to join (i.e., he joins, but only if treated) if his threshold θ is less than ε ⋅ (s − β) above his prior belief β . In this model, the treatment effect is given by (see online Appendix for derivation)
(1) T = [ 1 _ σ ⋅ √
_ 2 ⋅ φ (
μ β − μ θ _ σ ⋅ √
_ 2 ) ] ⋅ [ (s −
μ β + μ θ _ 2 ) ⋅ ε] ,
where φ (⋅) is the standard normal probability density function.Intuitively, the first term represents the density of priors among marginal admits
(i.e., those with β = θ ),23 while the second term represents the range of priors that will be persuaded by the treatment (the average of μ β and μ θ is the expected prior among marginal admits). Put simply, this result shows that the size of our treatment effect depends on how many admits are at the margin of joining TFA and how our signal compares to their prior beliefs.
How can we use this formulation to predict which subgroups are likely to dis-play larger treatment effects? So far, a population is parametrized by three values: μ β , μ θ , and σ 2 . If the random process by which admits acquire their priors does not vary across groups, then σ 2 and μ β are the same for all groups. Intuitively, then, dif-ferences across groups are driven by differences in outside options, represented by μ θ . This means that both treatment effect and matriculation rate become univariate functions of μ θ , and we can eliminate μ θ to yield a function that relates T and m across groups (see online Appendix for derivation):
(2) T (m) = [ 1 _
√ _ 2 ⋅ φ ( Φ −1 (m) ) ] ⋅ [ ( z s +
Φ −1 (m) _
√ _ 2 ) ⋅ ε] .
19 To be more precise, by “quality” we mean the utility the admit gets from joining TFA. 20 This follows from the fact that β − θ is normal with mean μ β − μ θ and variance 2 σ 2 . 21 The model in this section is designed to convey the ideas as simply as possible. For a discussion of more
general models, see Coffman, Featherstone, and Kessler (2015). 22 The form of the update formula is a standard result when prior and signal distributions are both normal
(Jackman 2009). We assume ε ≪ 1 to model the subtlety of our treatment. 23 Since ε ≪ 1, we do not need to worry about changes in the density in the relevant range.

VoL. 9 No. 1 103coffman et al.: can social information affect JoB cHoice?
Here z s ≡ s − μ β ____ σ is the z -score of the signal relative to the distribution of priors.
We are now ready to bring the theory to our data to determine which subgroups are likely to display larger treatment effects. When we surveyed admits about their beliefs (see Subsection IVD), we found that the control group mean was 68.0 per-cent, with a standard deviation of 19.7 percent, which when combined with the fact that our signal was s = 84 percent , gives z s = 0.81 . This allows us to compute the set of matriculation rates such that groups with those rates should have a larger treatment effect than the population as a whole. Mathematically, this is the set of m that satisfies T (m) ≥ T (0.773) , where 77.3 percent is the matriculation rate in the control group for the entire population (see Table 2 in the next subsection). Solving numerically with the values above, this set is the interval m ∈ (0.66, 0.773) . The intuition for why treatment effects decrease when m is too high or too low is straightforward. First note that m is the fraction of admits whose belief is higher than the average prior of marginal admits (the marginal prior), which means that as m increases, the marginal prior decreases. Now, recall that the treatment effect is the product of the range of priors that the signal can persuade to join (the marginal range) and the density of admits on that range (the marginal density). If m gets too high, then the marginal prior gets pushed into the left tail of the prior distribu-tion, where the marginal density drops off exponentially, leaving too few admits to support a large enough treatment effect. If m gets too low, then the marginal prior gets pushed too close to the signal, which decreases the marginal range, leaving the effect of the signal on admits too small to support a large enough treatment effect.
All of the subgroups we will define in the next subsection have control group matriculation rates that fall in this interval (see Table 2). Consequently, for each of these subgroups we expect to see larger treatment effects than we saw for the entire population.
B. subgroups in the context of TFA
Bringing this theory to the context of our experiment, we will now introduce the marginal subgroups that form an important part of our analysis. Before doing so, however, we should note that even when restricting ourselves to groups with base-line matriculation rates in the range suggested by the theory, there remains some flexibility in how we define the subgroups, which might lead to concerns about data mining or multiple hypothesis testing. We aim to assuage these concerns in Section IVC, where we analyze the robustness of subgroup definitions and show that the particulars of the definitions do not change the results.
The first subgroup we look at takes advantage of the fact that TFA assigns each admitted applicant to a teaching position using that applicant’s rank-order preferences over subjects to teach and geographic regions in which to teach (see Featherstone 2013 for a more detailed description of the matching mechanism). Admits submit these rankings with their initial applications (i.e., before being treated). Unsurprisingly, those who do not receive their first choice for either region or subject are substantially less likely to join TFA than those who do. We call this subgroup the disappointing Assignment subgroup; its complement is the pleasing
104 AmErIcAN EcoNomIc JourNAL: AppLIEd EcoNomIcs JANuAry 2017
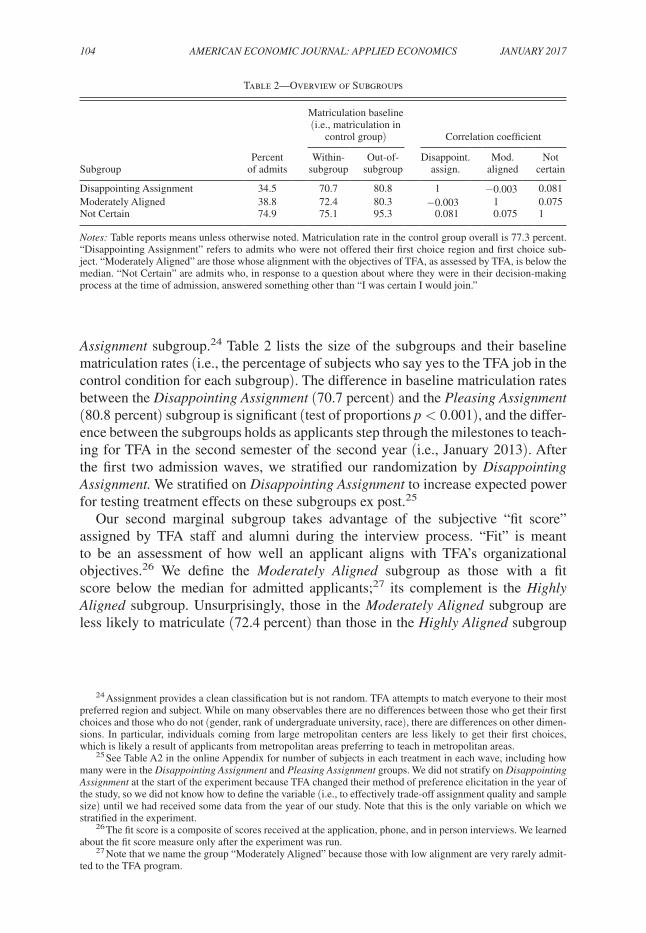
Assignment subgroup.24 Table 2 lists the size of the subgroups and their baseline matriculation rates (i.e., the percentage of subjects who say yes to the TFA job in the control condition for each subgroup). The difference in baseline matriculation rates between the disappointing Assignment (70.7 percent) and the pleasing Assignment (80.8 percent) subgroup is significant (test of proportions p < 0.001), and the differ-ence between the subgroups holds as applicants step through the milestones to teach-ing for TFA in the second semester of the second year (i.e., January 2013). After the first two admission waves, we stratified our randomization by disappointing Assignment. We stratified on disappointing Assignment to increase expected power for testing treatment effects on these subgroups ex post.25
Our second marginal subgroup takes advantage of the subjective “fit score” assigned by TFA staff and alumni during the interview process. “Fit” is meant to be an assessment of how well an applicant aligns with TFA’s organizational objectives.26 We define the moderately Aligned subgroup as those with a fit score below the median for admitted applicants;27 its complement is the Highly Aligned subgroup. Unsurprisingly, those in the moderately Aligned subgroup are less likely to matriculate (72.4 percent) than those in the Highly Aligned subgroup
24 Assignment provides a clean classification but is not random. TFA attempts to match everyone to their most preferred region and subject. While on many observables there are no differences between those who get their first choices and those who do not (gender, rank of undergraduate university, race), there are differences on other dimen-sions. In particular, individuals coming from large metropolitan centers are less likely to get their first choices, which is likely a result of applicants from metropolitan areas preferring to teach in metropolitan areas.
25 See Table A2 in the online Appendix for number of subjects in each treatment in each wave, including how many were in the disappointing Assignment and pleasing Assignment groups. We did not stratify on disappointing Assignment at the start of the experiment because TFA changed their method of preference elicitation in the year of the study, so we did not know how to define the variable (i.e., to effectively trade-off assignment quality and sample size) until we had received some data from the year of our study. Note that this is the only variable on which we stratified in the experiment.
26 The fit score is a composite of scores received at the application, phone, and in person interviews. We learned about the fit score measure only after the experiment was run.
27 Note that we name the group “Moderately Aligned” because those with low alignment are very rarely admit-ted to the TFA program.
Table 2—Overview of Subgroups
Matriculation baseline (i.e., matriculation in
control group) Correlation coefficient
SubgroupPercent
of admitsWithin-
subgroupOut-of-
subgroupDisappoint.
assign.Mod.
alignedNot
certain
Disappointing Assignment 34.5 70.7 80.8 1 −0.003 0.081Moderately Aligned 38.8 72.4 80.3 −0.003 1 0.075Not Certain 74.9 75.1 95.3 0.081 0.075 1
Notes: Table reports means unless otherwise noted. Matriculation rate in the control group overall is 77.3 percent. “Disappointing Assignment” refers to admits who were not offered their first choice region and first choice sub-ject. “Moderately Aligned” are those whose alignment with the objectives of TFA, as assessed by TFA, is below the median. “Not Certain” are admits who, in response to a question about where they were in their decision-making process at the time of admission, answered something other than “I was certain I would join.”
VoL. 9 No. 1 105coffman et al.: can social information affect JoB cHoice?
(80.3 percent).28 Again, this difference is significant (test of proportions p < 0.001) and persists as admits step through the milestones.
The final subgroup we consider takes advantage of the fact that TFA asks admits about where they were in their decision process (i.e., how certain they were that they were going to join TFA) when they received their admissions letter. This question is on a 7-point Likert scale ranging from “I was certain I would join” to “I was certain I would not join.” It makes sense that our treatment would not have a large effect on those who were certain they would or would not join, so we define the Not certain subgroup as those who answered anything else; the complement to this group is the certain subgroup.
An important caveat for the Not certain subgroup is that it is based on a response to a survey question asked at the time of initial commitment, that is, after treatment. Fortunately, the question essentially asks subjects to retrospectively assess whether they were marginal at the time of treatment: “Please indicate where you were in your decision-making process when you found out you had been accepted and received your regional assignment.” Since subjects make a decision about joining TFA (and are asked to answer this question) within two weeks of receiving their acceptance letter, it is reasonable to think that subjects can accurately report what their likeli-hood of joining was before they were treated. In fact, even though our social infor-mation treatment affects matriculation decisions, it does not influence self-reported certainty ( p > 0.985 for OLS and Ordered Probit specifications). Thus, although the Not certain subgroup is formed based on information gathered after treatment, the information is meant to reflect likelihood before the treatment, and we do not find any evidence this measure was affected by our treatment. We include it because it so aligns with the theory and the intuition underlying it.
In addition to the three subgroups, we can also show that the matriculation effect is larger when demographics predict a lower baseline matriculation rate. Due to our data agreement with TFA, we cannot disclose how individuals with particular demo-graphics respond to the treatment; however, we can show the effect by analyzing how treatment interacts with a “propensity to join TFA” measure estimated based on demographics. This exercise fits with the theory since the majority of our data is within the range above a 66.0 percent probability of accepting TFA as suggested by the theory. The methodology is described in Section IVC.
Finally, we should note that none of our subgroups are strongly correlated (see Table 2), so running a separate subgroup analysis for each is not redundant; rather, doing so provides several independent demonstrations that the effect of social infor-mation is larger in various different subgroups suggested by the theory.
28 The discretized nature of fit allows more than 50 percent of applicants to be at or above the median.
106 AmErIcAN EcoNomIc JourNAL: AppLIEd EcoNomIcs JANuAry 2017
IV. Results
A. overall Effect of social Information on matriculation
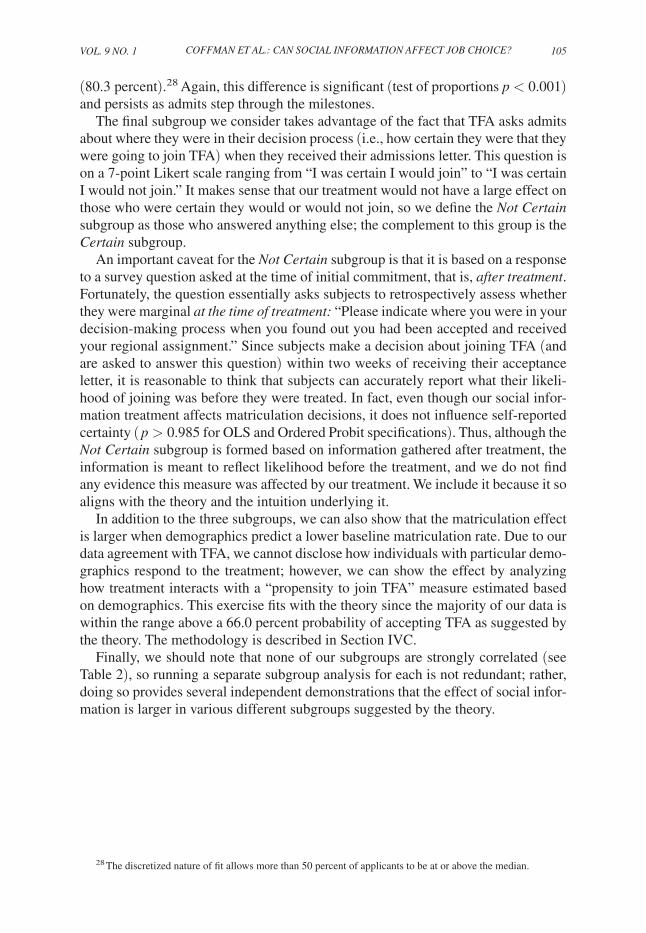
Although it does not account for the wave structure of the admissions cycle, the easiest way to visualize our results is to graph the average likelihood of working for TFA over time across subjects in all waves. Figure 2 shows this likelihood for the entire set of admits without subgrouping. The downward slope of the solid line shows people leaving the program in the control group and demonstrates the impor-tance of following our treatment effect over time. That the dashed line is above the solid line shows that the treatment induced subjects to join TFA.
We confirm the patterns in Figure 2 by running OLS regressions with fixed effects for the wave in which an applicant was admitted (see Table 3). As can be seen in regressions (1) through (10), when looking across the entire population, the social information treatment increases the likelihood that admitted applicants are still in TFA at a given milestone by between 1.5 and 3.1 percentage points rel-ative to control means between 58 and 77 percentage points. The even-numbered
0.85
0.8
0.75
0.7
0.65
0.6
0.55
0.5
IC SI TF ’12 TS ’13 TF ’13
Social Information is dashed ( ),Control is solid ( ).
Abbreviations:
IC: Initial commitment
SI: Showed to institute
TF ’12: Teaching fall 2012
TS ’13: Teaching spring 2013
TF ’13: Teaching fall 2013
Fra
ctio
n of
adm
its s
till i
n T
FA
Figure 2. Working for TFA Over Time: Social Information versus Control
Note: Shows the average rate of being committed to TFA at the five milestones; standard error bars are shown around each mean.

VoL. 9 No. 1 107coffman et al.: can social information affect JoB cHoice?
regressions show that estimates of the treatment effect are stable and become more significant when we soak up extra variation by controlling for gender, race, eth-nicity, and socioeconomic status (based on whether the admit had a full, partial, or no Pell grant during college), whether the admit was a math/science major, and whether the admit is coming straight out of college. Without demographic controls, the effect is significant for Initial Commitment ( p < 0.1) and Teaching Fall 2013 ( p < 0.05). Once demographic controls are added, the effect becomes significant at the 5 percent level for Initial Commitment, the 1 percent level for Teaching Fall 2013, and the 10 percent level for all other milestones.
B. Effect on matriculation in marginal subgroups
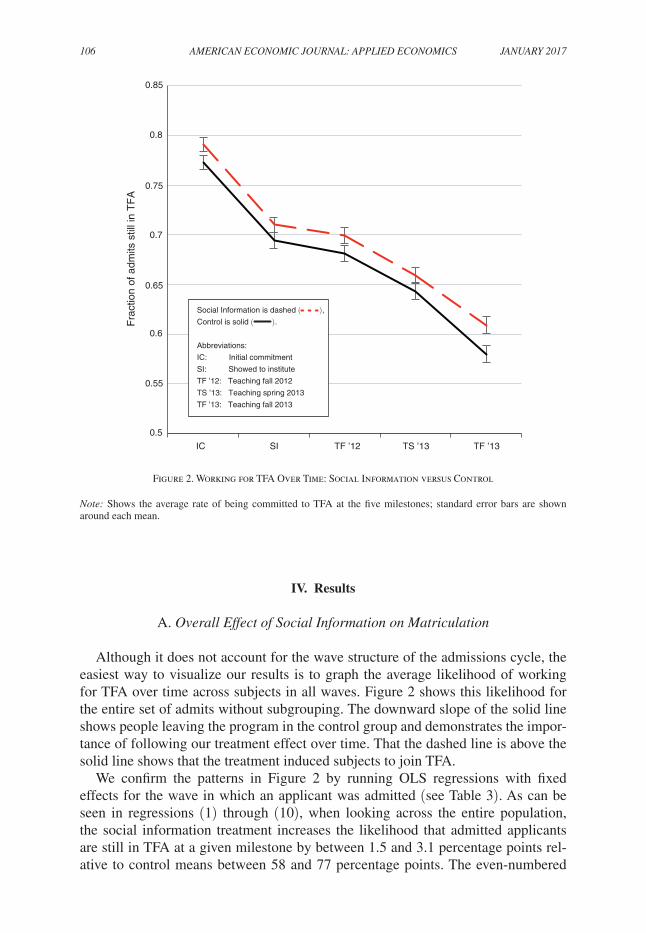
In panel A of Figure 3 and regressions (1) through (10) of Table 4, we show the effect of the social information treatment on both the disappointing Assignment subgroup and the pleasing Assignment subgroup. For the disappointing Assignment subgroup, where we expect to see larger effects, the likelihood of working for TFA increases by between 3.2 and 4.5 percentage points across milestones and specifica-tions, always significant at the 10 percent or 5 percent level (with controls, always significant at the 5 percent level). The pleasing Assignment subgroup, however, is not measurably affected by the treatment.
In panel B of Figure 3 and regressions (11) through (20) of Table 4, we show the effect of the social information treatment on both the moderately Aligned and Highly Aligned subgroups. For the moderately Aligned subgroup, where we expect to see larger effects, the likelihood of working for TFA increases between 3.6 and 5.2 percentage points across milestones and specifications, always significantly at the 5 percent or 1 percent level (with or without controls). The Highly Aligned sub-group, however, was not measurably affected by the treatment.
Table 3—Regression of Treatment on Working for TFA over Time, Full Sample
Linear probability models (in TFA at decision point = 1)
No subgrouping (N = 6,685)
Initial commitment
Showed to institute
Started teaching
Teaching spring 2013
Teaching fall 2013
(1) (2) (3) (4) (5) (6) (7) (8) (9) (10)
social Information 0.017 (0.010)
0.022 (0.010)
0.015 (0.011)
0.019 (0.011)
0.017 (0.011)
0.021 (0.011)
0.015 (0.012)
0.019 (0.011)
0.029 (0.012)
0.032 (0.012)
Control mean 0.773 0.773 0.694 0.694 0.681 0.681 0.643 0.643 0.580 0.580
Demog. controls? No Yes No Yes No Yes No Yes No Yes
Notes: Table shows Linear Probability Model (OLS) regression results of whether the individual was working for TFA at each of the five milestones. All regressions include dummy variables for wave during which the applicant was admitted and a dummy for displeasing assignment, which was a stratifying variable. The even columns con-trol for demographic characteristics: gender, race, ethnicity, socioeconomic status (based on whether an accepted applicant had a full, partial, or no Pell grant during college), whether they were a math/science major, and their student status or profession before applying to TFA. Robust standard errors are reported in parentheses (statistical significance is not denoted by stars). The omitted group’s mean likelihood of working for TFA at that milestone is reported.

108 AmErIcAN EcoNomIc JourNAL: AppLIEd EcoNomIcs JANuAry 2017
Finally, in panel C of Figure 3 and regressions (21) through (30) of Table 4, we show an effect of the social information treatment on both the Not certain and certain subgroups. For the Not certain subgroup, where we expect to see larger effects, the likelihood of working for TFA increases between 2.7 and 3.8 percentage points across milestones and specifications, always significantly at the 5 percent or 1 percent level, save one (Teaching Spring 2013 without demographic controls is significant at the 10 percent level). The certain subgroup, however, was not mea-surably affected by the treatment.
Social Information is dashed ( ),Control is solid ( ).
Abbreviations:
IC: Initial commitment
SI: Showed to institute
TF ’12: Teaching fall 2012
TS ’13: Teaching spring 2013
TF ’13: Teaching fall 2013
Panel A. Disappointing Assignment (top 2 are Pleasing Assignment; bottom 2 are Disappointing Assignment)
Panel B. Moderately Aligned (top 2 are Highly Aligned; bottom 2 are Moderately Aligned)
Panel C. Not Certain (top 2 are Certain; bottom 2 are Not Certain)
0.85
0.8
0.75
0.7
0.65
0.6
0.55
0.5IC SI TF ’12 TS ’13 TF ’13
0.85
0.8
0.75
0.7
0.65
0.6
0.55
0.5IC SI TF ’12 TS ’13 TF ’13
1
0.9
0.95
0.85
0.8
0.75
0.7
0.65
0.6
0.55
0.5IC SI TF ’12 TS ’13 TF ’13
Fra
ctio
n of
adm
its s
till i
n T
FA
Fra
ctio
n of
adm
its s
till i
n T
FA
Fra
ctio
n of
adm
its s
till i
n T
FA
Figure 3. Working for TFA over Time, Subgroups: Social Information versus Control
Notes: “Disappointing Assignment” refers to admits who were not offered their first choice region and first choice subject. “Moderately Aligned” are those whose alignment with the objectives of TFA, as assessed by TFA, is below the median. “Not Certain” are admits who, in response to a question about where they were in their decision-making process at the time of admission, answered something other than “I was certain I would join.”
VoL. 9 No. 1 109coffman et al.: can social information affect JoB cHoice?
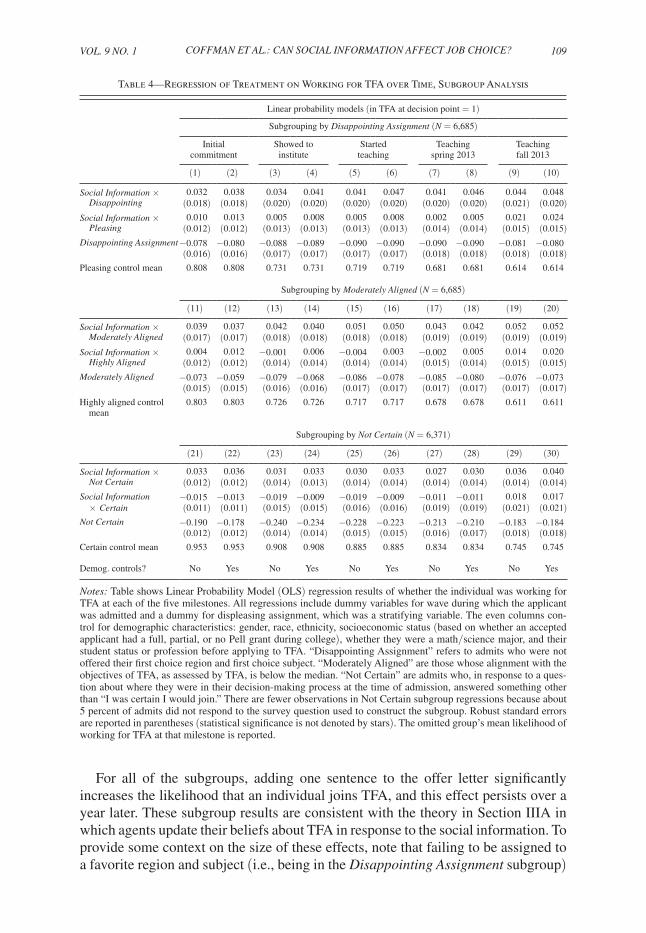
For all of the subgroups, adding one sentence to the offer letter significantly increases the likelihood that an individual joins TFA, and this effect persists over a year later. These subgroup results are consistent with the theory in Section IIIA in which agents update their beliefs about TFA in response to the social information. To provide some context on the size of these effects, note that failing to be assigned to a favorite region and subject (i.e., being in the disappointing Assignment subgroup)
Table 4—Regression of Treatment on Working for TFA over Time, Subgroup Analysis
Linear probability models (in TFA at decision point = 1)
Subgrouping by disappointing Assignment (N = 6,685)
Initial commitment
Showed to institute
Started teaching
Teaching spring 2013
Teaching fall 2013
(1) (2) (3) (4) (5) (6) (7) (8) (9) (10)
social Information × 0.032 0.038 0.034 0.041 0.041 0.047 0.041 0.046 0.044 0.048 disappointing (0.018) (0.018) (0.020) (0.020) (0.020) (0.020) (0.020) (0.020) (0.021) (0.020)social Information × 0.010 0.013 0.005 0.008 0.005 0.008 0.002 0.005 0.021 0.024 pleasing (0.012) (0.012) (0.013) (0.013) (0.013) (0.013) (0.014) (0.014) (0.015) (0.015)disappointing Assignment−0.078 −0.080 −0.088 −0.089 −0.090 −0.090 −0.090 −0.090 −0.081 −0.080
(0.016) (0.016) (0.017) (0.017) (0.017) (0.017) (0.018) (0.018) (0.018) (0.018)Pleasing control mean 0.808 0.808 0.731 0.731 0.719 0.719 0.681 0.681 0.614 0.614
Subgrouping by moderately Aligned (N = 6,685)
(11) (12) (13) (14) (15) (16) (17) (18) (19) (20)
social Information × 0.039 0.037 0.042 0.040 0.051 0.050 0.043 0.042 0.052 0.052 moderately Aligned (0.017) (0.017) (0.018) (0.018) (0.018) (0.018) (0.019) (0.019) (0.019) (0.019)social Information × 0.004 0.012 −0.001 0.006 −0.004 0.003 −0.002 0.005 0.014 0.020 Highly Aligned (0.012) (0.012) (0.014) (0.014) (0.014) (0.014) (0.015) (0.014) (0.015) (0.015)moderately Aligned −0.073 −0.059 −0.079 −0.068 −0.086 −0.078 −0.085 −0.080 −0.076 −0.073
(0.015) (0.015) (0.016) (0.016) (0.017) (0.017) (0.017) (0.017) (0.017) (0.017)Highly aligned control mean
0.803 0.803 0.726 0.726 0.717 0.717 0.678 0.678 0.611 0.611
Subgrouping by Not certain (N = 6,371)
(21) (22) (23) (24) (25) (26) (27) (28) (29) (30)
social Information × 0.033 0.036 0.031 0.033 0.030 0.033 0.027 0.030 0.036 0.040 Not certain (0.012) (0.012) (0.014) (0.013) (0.014) (0.014) (0.014) (0.014) (0.014) (0.014)social Information −0.015 −0.013 −0.019 −0.009 −0.019 −0.009 −0.011 −0.011 0.018 0.017 × certain (0.011) (0.011) (0.015) (0.015) (0.016) (0.016) (0.019) (0.019) (0.021) (0.021)Not certain −0.190 −0.178 −0.240 −0.234 −0.228 −0.223 −0.213 −0.210 −0.183 −0.184
(0.012) (0.012) (0.014) (0.014) (0.015) (0.015) (0.016) (0.017) (0.018) (0.018)Certain control mean 0.953 0.953 0.908 0.908 0.885 0.885 0.834 0.834 0.745 0.745
Demog. controls? No Yes No Yes No Yes No Yes No Yes
Notes: Table shows Linear Probability Model (OLS) regression results of whether the individual was working for TFA at each of the five milestones. All regressions include dummy variables for wave during which the applicant was admitted and a dummy for displeasing assignment, which was a stratifying variable. The even columns con-trol for demographic characteristics: gender, race, ethnicity, socioeconomic status (based on whether an accepted applicant had a full, partial, or no Pell grant during college), whether they were a math/science major, and their student status or profession before applying to TFA. “Disappointing Assignment” refers to admits who were not offered their first choice region and first choice subject. “Moderately Aligned” are those whose alignment with the objectives of TFA, as assessed by TFA, is below the median. “Not Certain” are admits who, in response to a ques-tion about where they were in their decision-making process at the time of admission, answered something other than “I was certain I would join.” There are fewer observations in Not Certain subgroup regressions because about 5 percent of admits did not respond to the survey question used to construct the subgroup. Robust standard errors are reported in parentheses (statistical significance is not denoted by stars). The omitted group’s mean likelihood of working for TFA at that milestone is reported.
110 AmErIcAN EcoNomIc JourNAL: AppLIEd EcoNomIcs JANuAry 2017
decreases the likelihood of working for TFA at each milestone by between 7.8 and 9.3 percentage points. The one sentence of social information mitigates between 40 percent and 55 percent of that decrease for this subgroup, depending on the mile-stone. Similarly, being in the moderately Aligned subgroup decreases the likelihood of working at TFA by between 5.8 and 8.6 percentage points. The social information mitigates between 50 percent and 70 percent of that decrease.
It is worth noting that we find no evidence that admits who were induced to accept an offer from TFA because of the social information treatment were any more likely to leave the program. While we do not have the statistical power to detect small decreases in treatment effects, if anything, the treatment effect generally increases over time. At the very least, this suggests the intervention did not induce admits to take an action they would later reverse. This finding was important for TFA and speaks to a growing literature on the welfare effects of nudges, which emphasizes the value of investigating the welfare of those exposed to such interventions (see, e.g., Allcott and Kessler 2015).
C. robustness checks
In this section, we address whether the results in Section IVB are robust to alter-native inclusion rules for the subgroups. First, note that for each of our subgroups there is a richer set of information that is used to construct it. For the disappointing Assignment subgroup, we used the ranking of regions and subjects submitted by admits along with their applications; for the moderately Aligned subgroup, we used the fit score assigned by the admit’s TFA interviewers; and for the Not certain sub-group, we used a survey response on a 7-point Likert scale. Although our subgroup definitions are specific, they are meant to capture the broader idea that groups that have slightly lower baseline matriculation rates than the overall population (i.e., matriculation rates in the range 66.0 percent to 77.3 percent) should have larger treatment effects, as described in Section IIIA.
A more general (although arguably less transparent) way to capture the same idea is to run the same regressions from Section IVB, except replacing each sub-group dummy with an estimated probability for initial commitment when untreated (a propensity) based on the information used to construct the original subgroup. For instance, membership in the disappointing Assignment subgroup was constructed using the admit’s ranking of regions and subjects; the corresponding disappointing Assignment propensity would simply be the predicted values from a saturated regres-sion of the initial commitment dummy on the categorical variables representing the admit’s ranking of his assigned region and subject.29 Similarly, the moderately Aligned propensities are the predicted values when the regressors are categorical dummies for the different values that the fit score can take, while the Not certain propensities are the predicted values when the regressors are the eight categorical
29 A regression is saturated if it includes all possible interactions of the regressors. For instance, with the disappointing Assignment propensity regression just described, there are 4 possible rankings for regions (including a potential of no response) and 4 possible rankings for subjects (including a potential of no response), leading to 16 possible interactions. Running a saturated regression serves to non-parametrically estimate the probability that an admit joins, conditional on the information in the regressors (Angrist and Pischke 2009, theorem 3.1.4).
VoL. 9 No. 1 111coffman et al.: can social information affect JoB cHoice?
dummies that summarize the survey response (seven for the different values of the Likert scale, and one for nonresponse).30
Given that most of our estimated propensities are quite high, we would expect that if we regress our milestone dummies on the interactions between the treat-ment dummy and one of the propensities, we would get a positive coefficient on the propensity and the treatment dummy and a negative coefficient on the interaction. Table 5 summarizes the results of this exercise for the information used to construct each of our three subgroups. For all subgroups and at all milestones, we find that the interaction of each propensity with the treatment is negative and always statistically significant.31
The strategy we have just discussed also allows us to perform the same analysis with the demographic variables listed in Section IVA. We estimate demographic pro-pensities based on these demographic variables and run the same analysis described in the previous paragraph.32 The results are in Table 5. Again, at all milestones, the regressions line up with theory at the 1 percent level of significance, demonstrating that demographic groups whose baseline matriculation rates are lower have larger matriculation effects, as predicted by theory.
D. matriculation Beliefs
Our interpretation of the results assumes that admits who received the line of social information would believe the matriculation rate was higher than those who did not, and that this increase in beliefs would make admits more likely to join TFA. This requires that admits read and processed the social information, that they updated their beliefs, and that the information increased their beliefs.
To test these criteria, we conducted our own survey of the admitted applicants in our experiment. In June 2012, a TFA staff member e-mailed our online survey to all admitted applicants, both those who had accepted their offer and those who had not.33 The survey was not incentivized, but of the 6,685 applicants we analyze, 2,970 filled out the survey—a 44 percent response rate that is not affected by treat-ment.34 While this response rate is high for a non-incentivized survey, we must rec-ognize two limitations of the survey data. First, while not correlated with treatment, selection into the survey is not random; specifically, the response rate was higher for admits who accepted their TFA offer than those who did not (48 percent versus
30 In each propensity specification, we deal with the wave structure of the experiment by also including all interactions with the wave dummies.
31 It is worth noting that since the propensity is estimated, using it in a regression introduces measurement error. Such error actually serves to bias our results toward zero; that is, with a perfectly measured propensity, the results in Table 5 would be even stronger (see Sullivan 2001).
32 We are not able to use a saturated regression to estimate a propensity from demographics, as there are too many interactions for that to be meaningful. Instead, we limit ourselves to interactions between wave dummies and demographics.
33 The survey was conducted before they had gone to summer institute or started teaching, both of which may change their sentiments toward TFA (Dobbie and Fryer 2011).
34 Though directionally more admits take the survey in the treatment (45.6 percent) than in the control (43.8 per-cent), this difference is not significant (test of proportions, p > 0.1), and the difference is approximately cut in half and remains insignificant ( p > 0.3) in untabulated OLS regressions controlling for wave fixed effects and whether the admit accepted the TFA offer.

112 AmErIcAN EcoNomIc JourNAL: AppLIEd EcoNomIcs JANuAry 2017
Table 5—Regression of Propensity to Join and Treatment on Working for TFA over Time
Linear probability models (still in TFA at decision point = 1) Initial
commitmentShowed to
instituteStarted
teachingTeaching
spring 2013Teaching fall 2013
Disappointing Assignment propensities (N = 6,685)(1) (2) (3) (4) (5)
social Information 0.172 0.203 0.213 0.245 0.234(0.088) (0.092) (0.093) (0.094) (0.094)
social Information × propensity score −0.200 −0.242 −0.253 −0.297 −0.266(0.111) (0.118) (0.118) (0.120) (0.121)
Propensity score 1.000 0.898 0.904 0.891 0.808(0.080) (0.085) (0.085) (0.086) (0.086)
Constant −0.000 0.001 −0.017 −0.045 −0.044(0.064) (0.067) (0.067) (0.067) (0.067)
Moderately Aligned propensities (N = 6,685)
(6) (7) (8) (9) (10)
social Information 0.160 0.173 0.215 0.225 0.227(0.086) (0.089) (0.090) (0.091) (0.093)
social Information × propensity score −0.183 −0.203 −0.254 −0.269 −0.255(0.108) (0.113) (0.114) (0.116) (0.119)
Propensity score 1.000 0.913 0.953 0.949 0.850(0.079) (0.084) (0.085) (0.086) (0.088)
Constant −0.000 −0.011 −0.054 −0.090 −0.077(0.063) (0.066) (0.067) (0.068) (0.069)
Not Certain propensities (N = 6,685)
(11) (12) (13) (14) (15)
social Information 0.110 0.101 0.092 0.103 0.087(0.035) (0.035) (0.035) (0.035) (0.034)
social Information × propensity score −0.117 −0.108 −0.094 −0.111 −0.073(0.041) (0.041) (0.042) (0.042) (0.043)
Propensity score 1.000 0.997 0.973 0.929 0.823(0.028) (0.029) (0.029) (0.029) (0.030)
Constant −0.000 −0.076 −0.070 −0.074 −0.056(0.025) (0.024) (0.024) (0.024) (0.024)
Demographic propensities (N = 6,685)
(16) (17) (18) (19) (20)social Information 0.263 0.253 0.257 0.264 0.292
(0.063) (0.065) (0.065) (0.066) (0.067)social Information × propensity score −0.314 −0.304 −0.308 −0.319 −0.338
(0.079) (0.082) (0.083) (0.084) (0.085)Propensity score 1.000 0.895 0.894 0.864 0.784
(0.057) (0.060) (0.061) (0.062) (0.063)Constant 0.000 0.003 −0.009 −0.024 −0.026
(0.046) (0.048) (0.048) (0.049) (0.049)
Notes: Table shows Linear Probability Model (OLS) regressions of a propensity to join measure regressed on whether the admit is still with TFA at each of the five milestones. The propensity to join measures vary in what groups of variables were regressed on the initial commitment dummy per the description in Section 5.3. Robust standard errors are reported in parentheses (statistical significance is not denoted by stars).
VoL. 9 No. 1 113coffman et al.: can social information affect JoB cHoice?
33 percent).35 Second, the survey responses were collected in June 2012—after all applicants had decided whether or not to accept the TFA offer. It is possible that admits’ beliefs changed to align more closely with the decisions they had made. Hence, we interpret the results with reasoned caution.
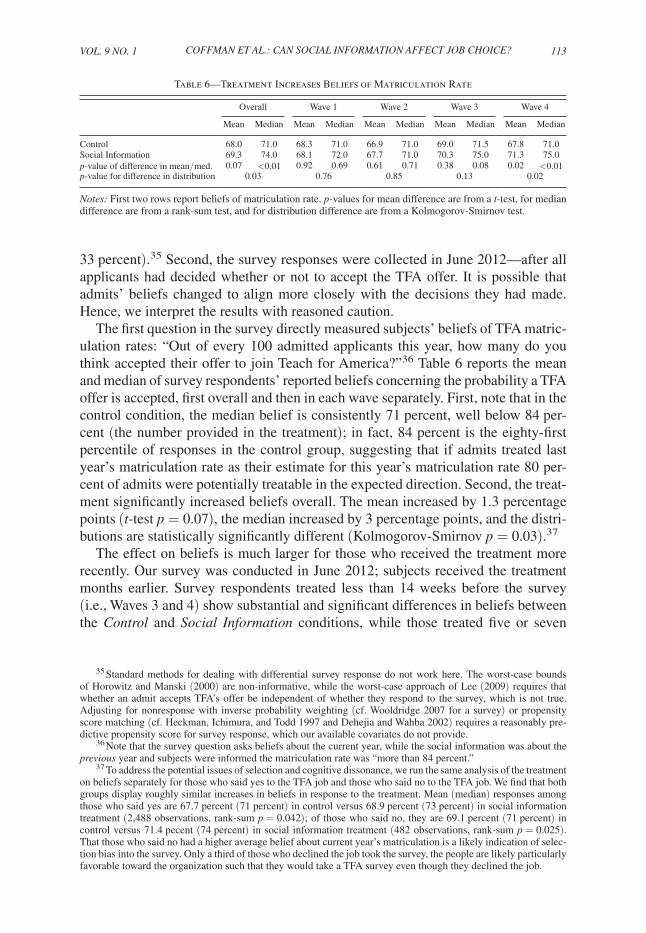
The first question in the survey directly measured subjects’ beliefs of TFA matric-ulation rates: “Out of every 100 admitted applicants this year, how many do you think accepted their offer to join Teach for America?”36 Table 6 reports the mean and median of survey respondents’ reported beliefs concerning the probability a TFA offer is accepted, first overall and then in each wave separately. First, note that in the control condition, the median belief is consistently 71 percent, well below 84 per-cent (the number provided in the treatment); in fact, 84 percent is the eighty-first percentile of responses in the control group, suggesting that if admits treated last year’s matriculation rate as their estimate for this year’s matriculation rate 80 per-cent of admits were potentially treatable in the expected direction. Second, the treat-ment significantly increased beliefs overall. The mean increased by 1.3 percentage points ( t-test p = 0.07), the median increased by 3 percentage points, and the distri-butions are statistically significantly different ( Kolmogorov-Smirnov p = 0.03).37
The effect on beliefs is much larger for those who received the treatment more recently. Our survey was conducted in June 2012; subjects received the treatment months earlier. Survey respondents treated less than 14 weeks before the survey (i.e., Waves 3 and 4) show substantial and significant differences in beliefs between the control and social Information conditions, while those treated five or seven
35 Standard methods for dealing with differential survey response do not work here. The worst-case bounds of Horowitz and Manski (2000) are non-informative, while the worst-case approach of Lee (2009) requires that whether an admit accepts TFA’s offer be independent of whether they respond to the survey, which is not true. Adjusting for nonresponse with inverse probability weighting (cf. Wooldridge 2007 for a survey) or propensity score matching (cf. Heckman, Ichimura, and Todd 1997 and Dehejia and Wahba 2002) requires a reasonably pre-dictive propensity score for survey response, which our available covariates do not provide.
36 Note that the survey question asks beliefs about the current year, while the social information was about the previous year and subjects were informed the matriculation rate was “more than 84 percent.”
37 To address the potential issues of selection and cognitive dissonance, we run the same analysis of the treatment on beliefs separately for those who said yes to the TFA job and those who said no to the TFA job. We find that both groups display roughly similar increases in beliefs in response to the treatment. Mean (median) responses among those who said yes are 67.7 percent (71 percent) in control versus 68.9 percent (73 percent) in social information treatment (2,488 observations, rank-sum p = 0.042); of those who said no, they are 69.1 percent (71 percent) in control versus 71.4 pecent (74 percent) in social information treatment (482 observations, rank-sum p = 0.025). That those who said no had a higher average belief about current year’s matriculation is a likely indication of selec-tion bias into the survey. Only a third of those who declined the job took the survey, the people are likely particularly favorable toward the organization such that they would take a TFA survey even though they declined the job.
Table 6—Treatment Increases Beliefs of Matriculation Rate
Overall Wave 1 Wave 2 Wave 3 Wave 4
Mean Median Mean Median Mean Median Mean Median Mean Median
Control 68.0 71.0 68.3 71.0 66.9 71.0 69.0 71.5 67.8 71.0Social Information 69.3 74.0 68.1 72.0 67.7 71.0 70.3 75.0 71.3 75.0p-value of difference in mean/med. 0.07 <0.01 0.92 0.69 0.61 0.71 0.38 0.08 0.02 <0.01p-value for difference in distribution 0.03 0.76 0.85 0.13 0.02
Notes: First two rows report beliefs of matriculation rate. p-values for mean difference are from a t-test, for median difference are from a rank-sum test, and for distribution difference are from a Kolmogorov-Smirnov test.

114 AmErIcAN EcoNomIc JourNAL: AppLIEd EcoNomIcs JANuAry 2017
months before the survey (i.e., Waves 1 and 2) do not. This pattern of results is con-sistent with, although does not conclusively prove, the idea that beliefs decay over time; that is, admits forget the information they received in the treatment. However, assignment to wave is not random (it is a function of when subjects choose to apply to TFA), and there is selection into completing the survey, so other differences in the groups could drive the patterns observed in Table 6. Nevertheless, the control group reports very similar beliefs across waves ( F-test p = 0.52), lending credence to the “forgetting” explanation in which subjects forget the social information even while its effect on behavior persists. While we interpret the beliefs data with caution, they suggest belief changes do not necessarily need to persist to maintain a treatment effect over time but rather only need to be altered at the time of the initial decision.
E. comments on mechanism
Our social information treatment increased average beliefs about the matricula-tion rate. The model in Section III highlights how this effect on beliefs may influ-ence behavior. In particular, by increasing admits’ beliefs about the number of other people who take a job, social information may lead admits to update about the qual-ity or value of the TFA experience (e.g., learning that most other people take a TFA job might lead admits to believe that TFA is particularly good for their resumés or that the program is particularly effective at achieving its goals of improving student outcomes).38 This model is supported by our subgroup analysis, which finds larger treatment effects in the groups where we expect to find more admits on the margin.
In an attempt to say more about the specific channel through which the informa-tion affects behavior, we asked Likert-scale questions to elicit beliefs about some important dimensions of TFA’s value to its corps members: how much does TFA help employment prospects, how much does TFA help graduate school admissions prospects, and how much does TFA impact its students.39,40 While the social infor-mation treatment directionally increases beliefs on all three of these dimensions, we find no statistically significant results (see Table A4 in the online Appendix). Hence, the treatment either moved beliefs about a dimension of TFA value that we either imperfectly measured or missed altogether with our questions or it may have affected behavior through beliefs about the matriculation rate directly.
V. Conclusion
Social information can have powerful and persistent effects on high-stakes behav-ior. Adding one line of social information to a TFA admissions letter increases the
38 Alternative models suggest other ways that social information could affect matriculation. For example, learn-ing about the high rate of admits who accept TFA might trigger a desire to conform to the actions of others, absent any transmission of information about the quality of TFA (e.g., as in Bernheim 1994).
39 The full wording of these questions can be found in Figure A2 in the online Appendix. Our measures are significantly correlated with the decision to join TFA, indicating that they are picking up meaningful variance, as shown in Table A3 in the online Appendix.
40 One way in which TFA is considered to be a positive signal for employers and graduate schools is that it has a significant pro-social component, as many TFA corps members work at a wage well below their outside options (see Ariely, Bracha, and Meier 2009).
VoL. 9 No. 1 115coffman et al.: can social information affect JoB cHoice?
likelihood that admitted applicants accept the offer to spend two years working as a teacher in an underperforming public school. In addition, the effects we observe persist. Those who received the social information are more likely to train for the teaching job, show up to teach, and return to it the following fall, 17 to 21 months after they were treated.
Consistent with theory, the effect of our treatment was particularly large in sub-groups of subjects where we expected to find a larger mass at the margin. All such subgroups met the data-based criterion highlighted by the theory: that the baseline matriculation rate was slightly lower than the overall average matriculation rate. Such data-based subgroup identification provides a framework for analyzing the effects of a treatment on a binary choice variable and provides a guard against data mining.
That our subtle intervention had a pronounced and persistent effect on a high-stakes decision like job choice suggests the power of social information41 and emphasizes the importance of including such a motivator in models of decision making. The results also highlight the potential use of social information as a policy tool, even in domains where the stakes are high and decision makers have sufficient time, information, and incentive to carefully consider their choice.
REFERENCES
Allcott, Hunt. 2011. “Social norms and energy conservation.” Journal of public Economics 95 (9–10): 1082–95.
Allcott, Hunt, and Judd B. Kessler. 2015. “The Welfare Effects of Nudges: A Case Study of Energy Use Social Comparisons.” National Bureau of Economic Research (NBER) Working Paper 21671.
Allcott, Hunt, and Todd Rogers. 2014. “The Short-Run and Long-Run Effects of Behavioral Interven-tions: Experimental Evidence from Energy Conservation.” American Economic review 104 (10): 3003–37.
Angrist, Joshua D., and Jörn-Steffen Pischke. 2009. mostly Harmless Econometrics: An Empiricist’s companion. Princeton: Princeton University Press.
Ariely, Dan, Anat Bracha, and Stephan Meier. 2009. “Doing Good or Doing Well? Image Motivation and Monetary Incentives in Behaving Prosocially.” American Economic review 99 (1): 544–55.
Bernheim, B. Douglas. 1994. “A Theory of Conformity.” Journal of political Economy 102 (5): 841–77.
Beshears, John, James J. Choi, David Laibson, Brigitte C. Madrian, and Katherine L. Milkman. 2015. “The Effect of Providing Peer Information on Retirement Savings Decisions.” Journal of Finance 70 (3): 1161–1201.
Bhargava, Saurabh, and Dayanand Manoli. 2015. “Psychological frictions and incomplete take-up of social benefits: Evidence from an IRS field experiment.” American Economic review 105 (11): 3489–3529.
Carroll, Gabriel D., James J. Choi, David Laibson, Brigitte C. Madrian, and Andrew Metrick. 2009. “Optimal Defaults and Active Decisions.” Quarterly Journal of Economics 124 (4): 1639–74.
Chen, Yan, F. Maxwell Harper, Joseph Konstan, and Sherry Xin Li. 2010. “Social Comparisons and Contributions to Online Communities: A Field Experiment on MovieLens.” American Economic review 100 (4): 1358–98.
Cialdini, Robert B., Raymond R. Reno, and Carl A. Kallgren. 1990. “A focus theory of normative con-duct: Recycling the concept of norms to reduce littering in public places.” Journal of personality and social psychology 58 (6): 1015–26.
Coffman, Lucas C., Clayton R. Featherstone, and Judd B. Kessler. 2015. “A Model of Information Nudges.” https://site.stanford.edu/sites/default/files/a_model_of_information_nudges_20151124.pdf.
41 Kessler (2013) shows that social information is powerful on another dimension: even information in the form of nonbinding announcements of support for a public good can induce others to contribute to it.
116 AmErIcAN EcoNomIc JourNAL: AppLIEd EcoNomIcs JANuAry 2017
Coffman, Lucas C., Clayton R. Featherstone, and Judd B. Kessler. 2017. “Can Social Information Affect What Job You Choose and Keep?: Dataset.” American Economic Journal: Applied Econom-ics. https://doi.org/10.1257/app.20140468.
Croson, Rachel, and Jen (Yue) Shang. 2008. “The impact of downward social information on contri-bution decisions.” Experimental Economics 11: 221–33.
Dehejia, Rajeev H., and Sadek Wahba. 2002. “Propensity Score-Matching Methods for Nonexperi-mental Causal Studies.” review of Economics and statistics 84 (1): 151–61.
Del Carpio, Lucia. 2014. “Are the Neighbors Cheating? Evidence from a Social Norm Experiment on Property Taxes in Peru.” http://faculty.insead.edu/lucia-del-carpio/documents/Are_the_neighbors_cheating_Apr2014.pdf.
DellaVigna, Stefano, and Matthew Gentzkow. 2009. “Persuasion: Empirical Evidence.” National Bureau of Economic Research (NBER) Working Paper 15298.
DellaVigna, Stefano, and Ethan Kaplan. 2007. “The Fox News Effect: Media Bias and Voting.” Quar-terly Journal of Economics 122 (3): 1187–1234.
DellaVigna, Stefano, John A. List, and Ulrike Malmendier. 2012. “Testing for altruism and social pres-sure in charitable giving.” Quarterly Journal of Economics 127 (1): 1–56.
Dobbie, Will, and Roland G. Fryer, Jr. 2011. “The Impact of Youth Service on Future Outcomes: Evi-dence from Teach for America.” National Bureau of Economic Research (NBER) Working Paper 17402.
Ericson, Keith M. Marzilli. 2014. “Consumer Inertia and Firm Pricing in the Medicare Part D Pre-scription Drug Insurance Exchange.” American Economic Journal: Economic policy 6 (1): 38–64.
Featherstone, Clayton. 2013. “Rank Efficiency: Investigating a Widespread Ordinal Welfare Crite-rion.” http://assets.wharton.upenn.edu/~claytonf/Featherstone-RankEfficiency11.pdf.
Fellner, Gerlinde, Rupert Sausgruber, and Christian Traxler. 2013. “Testing Enforcement Strategies in the Field: Threat, Moral Appeal and Social Information.” Journal of the European Economic Asso-ciation 11 (3): 634–60.
Field, Erica. 2009. “Educational Debt Burden and Career Choice: Evidence from a Financial Aid Experiment at NYU Law School.” American Economic Journal: Applied Economics 1 (1): 1–21.
Fischbacher, Urs, Simon Gächter, and Ernst Fehr. 2001. “Are people conditionally cooperative? Evi-dence from a public goods experiment.” Economics Letters 71 (3): 397–404.
Frey, Bruno S., and Stephan Meier. 2004. “Social Comparisons and Pro-social Behavior: Testing ‘Conditional Cooperation’ in a Field Experiment.” American Economic review 94 (5): 1717–22.
Gerber, Alan S., Dean Karlan, and Daniel Bergan. 2009. “Does the Media Matter? A Field Experiment Measuring the Effect of Newspapers on Voting Behavior and Political Opinions.” American Eco-nomic Journal: Applied Economics 1 (2): 35–52.
Goldstein, Noah J., Robert B. Cialdini, and Vladas Griskevicius. 2008. “A Room with a Viewpoint: Using Social Norms to Motivate Environmental Conservation in Hotels.” Journal of consumer research 35 (3): 472–82.
Hallsworth, Michael, John A. List, Robert D. Metcalfe, and Ivo Vlaev. 2014. “The Behavioralist as Tax Collector: Using Natural Field Experiments to Enhance Tax Compliance.” National Bureau of Eco-nomic Research (NBER) Working Paper 20007.
Heckman, James J., Hidehiko Ichimura, and Petra E. Todd. 1997. “Matching as an Econometric Eval-uation Estimator: Evidence from Evaluating a Job Training Programme.” review of Economic stud-ies 64 (4): 605–54.
Horowitz, Joel L., and Charles F. Manski. 2000. “Nonparametric analysis of randomized experiments with missing covariate and outcome data.” Journal of the American statistical Association 95 (449): 77–84.
Jackman, Simon. 2009. Bayesian Analysis for the social sciences. Vol. 846, Wiley Series in Probabil-ity and Statistics. Chichester, UK: John Wiley and Sons.
Jensen, Robert. 2010. “The (Perceived) Returns to Education and the Demand for Schooling.” Quar-terly Journal of Economics 125 (2): 515–48.
Keser, Claudia, and Frans van Winden. 2000. “Conditional Cooperation and Voluntary Contributions to Public Goods.” scandinavian Journal of Economics 102 (1): 23–39.
Kessler, Judd B. 2013. “Announcements of Support and Public Good Provision.” https://www.povertyactionlab.org/sites/default/files/publications/2400%20AnnouncementsOfSupport%20Jun2013.pdf.
Lee, David S. 2009. “Training, Wages, and Sample Selection: Estimating Sharp Bounds on Treatment Effects.” review of Economic studies 76 (3): 1071–1102.
VoL. 9 No. 1 117coffman et al.: can social information affect JoB cHoice?
List, John A., and David Lucking-Reiley. 2002. “The Effects of Seed Money and Refunds on Char-itable Giving: Experimental Evidence from a University Capital Campaign.” Journal of political Economy 110 (1): 215–33.
Martin, Richard, and John Randal. 2008. “How is Donation Behaviour Affected by the Donations of Others?” Journal of Economic Behavior and organization 67 (1): 228–38.
Milgrom, Paul R. 1981. “Good News and Bad News: Representation Theorems and Applications.” Bell Journal of Economics 12 (2): 380–91.
Potters, Jan, Martin Sefton, and Lise Vesterlund. 2005. “After you—endogenous sequencing in volun-tary contribution games.” Journal of public Economics 89 (8): 1399–1419.
Shang, Jen, and Rachel Croson. 2009. “A Field Experiment in Charitable Contribution: The Impact of Social Information on the Voluntary Provision of Public Goods.” Economic Journal 119 (540): 1422–39.
Sullivan, Daniel G. 2001. “A Note on the Estimation of Linear Regression Models with Heteroskedas-tic Measurement Errors.” Federal Reserve Bank of Chicago Working Paper 2001-23.
Teach for America. 2013. “About Us.” Teach for America. http://www.teachforamerica.org/our-organization (accessed June 7, 2013).
Vesterlund, Lise. 2003. “The informational value of sequential fundraising.” Journal of public Eco-nomics 87 (3–4): 627–57.
Wooldridge, Jeffrey M. 2007. “Inverse probability weighted estimation for general missing data prob-lems.” Journal of Econometrics 141 (2): 1281–1301.