can feed in tariffs close the investment gap for renewable ... · university of exeter damian...
TRANSCRIPT
University of Exeter
DAMIAN WAGNER
RENEWABLE ENERGY FINANCE
CAN FEED‐IN TARIFFS CLOSE THE INVESTMENT GAP FOR RENEWABLE ENERGY IN DEVELOPING
COUNTRIES?
MSc THESIS
P a g e | 2
EXETER UNIVERSITY
SCHOOL OF GEOGRAPHY
MSc THESIS ACADEMIC YEAR 2009/2010
DAMIAN WAGNER
RENEWABLE ENERGY FINANCE
CAN FEED‐IN TARIFFS CLOSE THE INVESTMENT GAP FOR RENEWABLE ENERGY IN DEVELOPING
COUNTRIES?
Supervisor: Catherine Mitchell
September 2010
SUBMITTED BY DAMIAN WAGNER TO THE UNIVERSITY OF EXETER AS A
DISSERTATION TOWARDS THE DEGREE OF MASTER OF SCIENCE BY ADVANCED STUDY IN ENERGY POLICY AND SUSTAINABILITY
I certify that all material in this dissertation which is not my own work has been identified with appropriate acknowledgement and referencing and I also certify that no material is included for which a degree has been previously conferred upon me...........................

P a g e | 3
ABSTRACT
Over the last two years new global financial investment in sustainability energy has been at its
highest ever, surpassing even investment in new fossil fuel capacity. However, the world’s poorest
regions, Africa and most of Latin America have attracted little investment. This study aims to
complement the discussion about feed‐in tariffs in developing countries and the funding of those
schemes.
Data triangulation was utilized in order to gain a combination of research perspectives on the topic.
Semi‐ structured interviews were conducted in order to compile the perceptions and opinions of
major senior stakeholders with a strong link to Renewable Energy (RE) projects. Information on the
current role of feed‐in tariffs and whether those schemes can address the investment gap in
developing countries was collected from qualitative data analysis.
To date the right condition for investment in feed‐in tariff schemes are absent in developing
countries. As a result, such schemes are not yet fully operational. An approach to address this
problem and encourage the funding of feed‐in tariffs on the basis of avoided costs will be briefly
introduced in the final section of this study. Such measures will be essential to get projects ‘on the
ground’ and create track records and bankable projects in order to promote investment in
renewable energy.
P a g e | 4
ACKNOWLEDGEMENTS
I would like to express thanks to my tutor and supervisor Catherine Mitchell for her advice and support and Catherine and Bridget for making this a very inspiring and enjoyable energy policy‐ year
in Cornwall.
I very much like to thank all interviewees for the great interviews, excellent discussions and additional advice and support that many of them have provided along the way.
I am extremely grateful for the (moral) support I had in particular from Claudia and Hilli;
Special thanks to Glory and Valerie

P a g e | 5
TABLE OF CONTENT
ABSTRACT……………………………………………………………………………………………………………………………………..3
ACKNOWLEDGEMENTS………………………………………………………………………………………………………………….4
TABLE OF CONTENT……………………………………….……………………………………………………………………………..5
TABLE OF FIGURES………………………………………………………………………………………………………………………..7
ABBREVIATIONS AND TERMS OF REFERENCE ……………………………………………………..………………………..8
1 INTRODUCTION ..................................................................................................................... 10
1.1 Context .................................................................................................................................. 10
1.1.1 Global driver for Renewable Energy: Increasing Energy Demand ................................ 10
1.1.2 Beyond climate change: domestic drivers .................................................................... 10
1.1.3 Costs .............................................................................................................................. 11
1.2 Aims and objectives .............................................................................................................. 12
1.3 Structure of the study ........................................................................................................... 12
2 LITERATURE REVIEW ............................................................................................................. 14
2.1 Global financial investment in renewable energy ................................................................ 14
2.2 Renewable Energy Finance in Developing Countries ............................................................ 16
2.2.1 Sources of private capital .............................................................................................. 16
2.2.2 Constraints and challenges for Investment in Renewable Energy ................................ 18
2.2.3 The role of public Finance ............................................................................................. 21
2.3 Carbon Finance ‐ the icing on the cake ................................................................................. 23
2.4 Renewable Energy Policy – a finance perspective .............................................................. 25
2.4.1 NAMAs – Supporting RE in developing countries in post‐2012 .................................... 26
2.5 Feed‐in tariff schemes for developing countries .................................................................. 27
2.5.1 Core principles .............................................................................................................. 27
2.5.2 Remuneration models ................................................................................................... 28
2.5.3 Financing Mechanism ................................................................................................... 29
2.5.4 Feed‐in tariffs schemes in developing countries .......................................................... 30
2.5.5 CDM vs. Feed‐in tariffs .................................................................................................. 34
2.6 Research ................................................................................................................................ 35
2.7 Research Questions............................................................................................................... 36
P a g e | 6
3 METHODOLOGY .................................................................................................................... 37
3.1 Research approach ................................................................................................................ 37
3.2 Literature review ................................................................................................................... 39
3.3 Conferences and Preliminary Discussions ............................................................................ 39
3.4 Interviews .............................................................................................................................. 40
3.4.1 Selection of interviewees .............................................................................................. 40
3.4.2 Question design ............................................................................................................ 42
3.4.3 Interview Analysis ......................................................................................................... 43
4 IN PERSPECTIVE‐ RE FINANCE AND FEED‐ IN TARIFFS IN DEVELOPING COUNTRIES ................. 44
4.1 The start‐up finance gap ....................................................................................................... 44
4.2 Challenging RE Policy – a developer’s perspective ............................................................... 45
4.2.1 Domestic needs ............................................................................................................. 45
4.2.2 National leadership and coordination .......................................................................... 46
4.3 The current role of feed‐in tariffs in developing countries................................................... 48
4.3.1 Asia ................................................................................................................................ 48
4.3.2 Latin America ................................................................................................................ 49
4.3.3 Country Risk – The Example of Ecuador ....................................................................... 50
4.3.4 Africa ............................................................................................................................. 51
4.3.5 ESKOM ‐ Referee and Player: The Case of South Africa ............................................... 51
4.4 FIT for a renewable energy future in developing countries? ................................................ 53
4.4.1 Mini‐grids and off‐ grid solutions .................................................................................. 54
4.4.2 Funding feed‐in tariffs schemes .................................................................................... 54
4.5 NAMAs and FITs in a post‐Kyoto framework ........................................................................ 55
4.6 CRYSTAL BALL: Predictions about the direction of RE finance ............................................. 57
5 KEY FINDINGS ........................................................................................................................ 58
6 DISCUSSION .......................................................................................................................... 61
7 CONCLUSION ......................................................................................................................... 65
APPENDICES .................................................................................................................................. 67
REFERENCES.……………………………………………………………………………………………………………………………….69
P a g e | 7
LIST OF FIGURES
Figure 1: Share of people without access to electricity, 2008 .............................................................. 11 Figure 2: Global New Investment in sustainable energy, 2004‐2009 $BN ........................................... 14 Figure 3: Financial New Investment by Region ..................................................................................... 15 Figure 4: Types of finance …………………………………………………………………………………………………. ............ 18 Figure 5: Risks for private investors in renewable energy projects ...................................................... 18 Figure 6: The role of public finance ...................................................................................................... 21 Figure 7: FIT remuneration models ....................................................................................................... 28 Figure 8: FIT Basic Financing Mechanism ............................................................................................. 29 Figure 9: Developing Countries with FIT Policies .................................................................................. 30 Figure 11: Barriers to RE and 'GET FIT' solutions .................................................................................. 32 Figure 10: GET FIT Program ................................................................................................................... 32 Figure 12: Research Phases ................................................................................................................... 38 Figure 13: Financing and Funding of FITs .............................................................................................. 68
P a g e | 8
ABBREVIATIONS AND TERMS OF REFERENCE
Terms of Reference
Avoided costs Avoided cost for renewable energy is the cost the utility would have incurred had it supplied the power from conventional fossil fuel generation
Feed ‐ in tariffs Feed‐in tariffs are legally guaranteed payments for electricity produced by green energies such as solar, wind, biomass or small hydro power plants that is being fed into the national electricity grid.
Investment gap Lack of financial investment in renewable energy technologies/projects in developing countries
Power Purchase Agreement (PPA)
A PPA is a long‐term agreement between the seller of renewable energy and the purchaser (typically a utility company). It secures a long‐term revenue stream through the sale of energy from the project and provides evidence that the energy is needed by the purchaser
Affordability threshold Financing gap between targeted achievements (e.g. RE target or levelized cost‐intensive RE technologies) and available financial resource of a developing country
List of Abbreviations
EB (Clean Development Mechanism) Executive Board under the UNFCCC
SEFI (UNEP) Sustainable Energy Financial Initiative
AWG‐LCA Ad‐hoc Working Group on Long‐ term Cooperation Action under the Convention (UNFCCC)
CO2 Carbon Dioxide
CER Certified Emission Reduction (credits)
CDM Clean Development Mechanism
€ Euros
BMU Federal Ministry for the Environment, Nature Conservation and Nuclear Safety
FIT Feed‐ in tariff
GW Gigawatts
GET FIT Programme Global Energy Transfer Feed‐in Tariff ProgrammeGHG Green house gas
IPP Independent Power Producer
IRR Internal Rate of Return
IETA International Emissions Trading AssociationIEA International Energy Agency
kWh kilowatt hour
MIGA Multilateral Investment Guarantee Agency (World Bank)
NAMA National Appropriate Mitigation Action
OECD Organisation for Economic Co‐operation and Development
OPIC Overseas Private Investment CorporationRE Renewable Energy
REFIT Renewable Energy Feed‐in tariffs, South AfricaREN 21 Renewable Energy Policy Network for the 21st Century
R&D Research and DevelopmentUNEP United National Environment Programme
UNDP United Nations Development Programme
UNFCCC United Nations Framework Convention on Climate Change
$ US DollarWEO World Energy Outlook, annual IEA report

P a g e | 9
"Paths are made by walking"
‐ Franz Kafka –
P a g e | 10
1 INTRODUCTION
This chapter introduces the current research project by setting the context, providing rationale and
identifying the research objectives.
1.1 Context
1.1.1 Global driver for Renewable Energy: Increasing Energy Demand
Renewable energy plays a key role in curbing man‐made greenhouse gas emissions (GHG). In 2007
energy use accounted for 65% of the world’s GHG emissions (IEA 2009). Only one year earlier, China
overtook the United States as the biggest absolute emitter of CO2 (PBL 2007).
Looking forward, global electricity demand will rise by 76% from 2007‐2030 requiring additional
power‐generation capacity of 4,800 Gigawatts (GW). By 2030 over 80% of the world’s electricity
demand will be originated in Non‐OECD countries. The lion’s share, about 53%, of incremental
demand will come from China and India (IEA 2009).
Africa’s population of currently more than 1 billion will rise to almost 2 billion in 2050 (UNDP 2008)
However, at present it only contributes to 1.5% of global annual energy‐related CO2 emissions rising
to 2‐3% by 2050 (WB 2009).
1.1.2 Beyond climate change: domestic drivers
One fifth of the world’s population, 1.5 billion people lack access to electricity in their homes (IEA
2009), of which 834 million live in a least developed country (WHO and UNDP 2009). About 2.4
billion people lack access to modern energy and use traditional biomass fuels such as waste or
fuelwood in their homes (IEA 2008). This practice causes the death of 1.94 million people, mostly
women and children, from indoor air pollution every year. (WHO and UNDP 2009).

P a g e | 11
At about 26%, Africa has the lowest global electrification rate, which means that 547 million people
have no access to electricity. A demand‐ supply balance would require investment of about $40
billion or 6.4% of the region’s GDP. About $11 billion are currently spent on the region’s electricity
infrastructure leaving an investment gap of $30 billion per year (WB 2009).
Constant power deficits in developing countries have led to large numbers of ‘emergency
generation’ from containerized mobile diesel units. Fuel based lightening costs households and
business in Africa about $17 billion every year (WB 2009). A UN and World Bank study found that oil
prices of about $20 per barrel could reduce poorer countries’ GDP by up to 3% (2008: oil price at
$148/barrel). Out of the world’s poorest 47 countries, 38 are net importers of oil and 25 import all
their oil (UNDP 2005).
Renewable energy can provide access to modern energy, ease dependency on fossil fuels and
increase resilience to volatile fuel prices while addressing both economic and social developments
and security of energy supply (ARE 2007; UNDP 2005).
1.1.3 Costs
In order to limit global warming to 2°C (450 part per million) by 2020, the International Energy
Agency (IEA) estimates that an additional investment in low‐ carbon technologies and energy
efficiency close to $430 billion will be needed. Over the period 2010‐2030energy‐related investment
Figure 1: Share of people without access to electricity, 2008
Source: UNDP, 2008
P a g e | 12
will sum up to $10.5 trillion. About $197 billion of additional investment in clean energy will be
required in non‐OECD countries (IEA 2009).
The ‘Energy [R]evolution Scenario‘ conducted by Greenpeace and the European Renewable Energy
Council (EREC) projects that overall investment of $14.7 trillion will be required for restructuring the
global energy sector up to 2030. (Greenpeace / EREC 2009) .
Calculations by the United Nations estimate that investment of $432 billion will be needed in the
power sector in 2030 of which $148 billion must be shifted into low carbon technologies such as
renewables, Carbon Capture and Storage CCS, nuclear and hydro. (UNFCCC 2009).
Of these amounts, by far the largest share, about 86% of overall global investment and financial
flows will come from the private sector (UNFCCC 2007).
1.2 Aims and objectives
This study aims to complement the discussion about feed‐in tariffs in developing countries and the
funding of those schemes by employing qualitative, evidence‐ based data from interviews with
major senior stakeholders linked to renewable energy projects in developing countries. The primary
objectives of the study are:
1. To undertake a critical review of recent literature and gain in‐ depth knowledge about
renewable energy finance and feed‐ in tariff schemes in developing countries;
2. To collect evidence‐ based data gained by compiling and analyzing the perceptions and
opinions of major senior stakeholders such as developers and financiers with a strong link
to RE projects;
3. To provide a practice‐ oriented perspective on issues related to present feed‐in tariff
schemes in developing countries and their potential future role and funding;
1.3 Structure of the study
This study begins by putting renewable energy in the context of climate change and the specific
needs of developing countries. Chapter two reviews present relevant background and literature on
renewable energy finance and feed‐in tariffs in developing countries. Chapter three defines the

P a g e | 13
research approach and describes the collection and analysis of data. Key statements and information
extracted from the interviews is described in Chapter four. Main findings from the interviews are
summarized in Chapter five. Finally, findings and a potential approach to funding feed‐in tariffs in
developing countries will be discussed in Chapter six and concluded in Chapter seven.
P a g e | 14
2 LITERATURE REVIEW
This chapter reviews present literature on renewable energy finance and feed‐in tariffs in the
context of developing countries, examining the investment gap and issues relevant to renewable
energy finance further providing relevant background knowledge on the topic.
2.1 Global financial investment in renewable energy
In 2009 renewable energy (RE) delivered about 18% of global electricity supply representing an
estimated 1.230 Gigawatts (GW) of energy and accounting for one quarter of the approximate 4800
GW global power generating capacity (see APPENDIX 1) (REN21 2010).
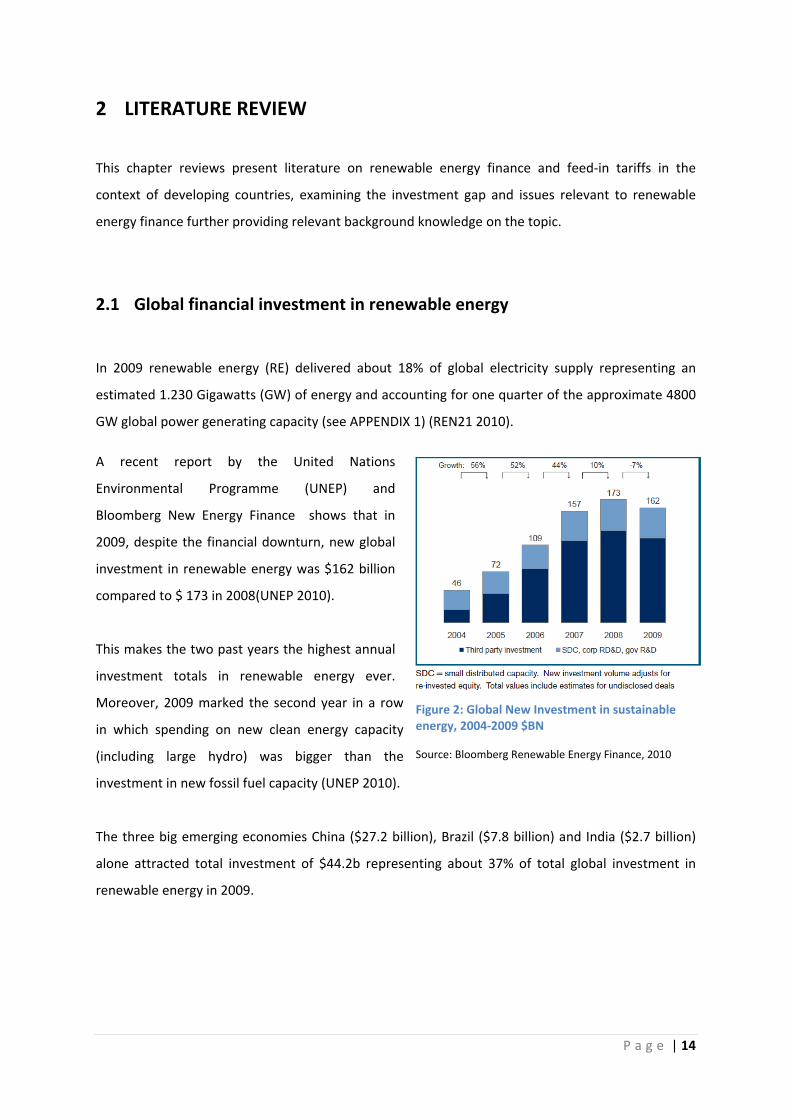
A recent report by the United Nations
Environmental Programme (UNEP) and
Bloomberg New Energy Finance shows that in
2009, despite the financial downturn, new global
investment in renewable energy was $162 billion
compared to $ 173 in 2008(UNEP 2010).
This makes the two past years the highest annual
investment totals in renewable energy ever.
Moreover, 2009 marked the second year in a row
in which spending on new clean energy capacity
(including large hydro) was bigger than the
investment in new fossil fuel capacity (UNEP 2010).
The three big emerging economies China ($27.2 billion), Brazil ($7.8 billion) and India ($2.7 billion)
alone attracted total investment of $44.2b representing about 37% of total global investment in
renewable energy in 2009.
Figure 2: Global New Investment in sustainable energy, 2004‐2009 $BN
Source: Bloomberg Renewable Energy Finance, 2010
P a g e | 15
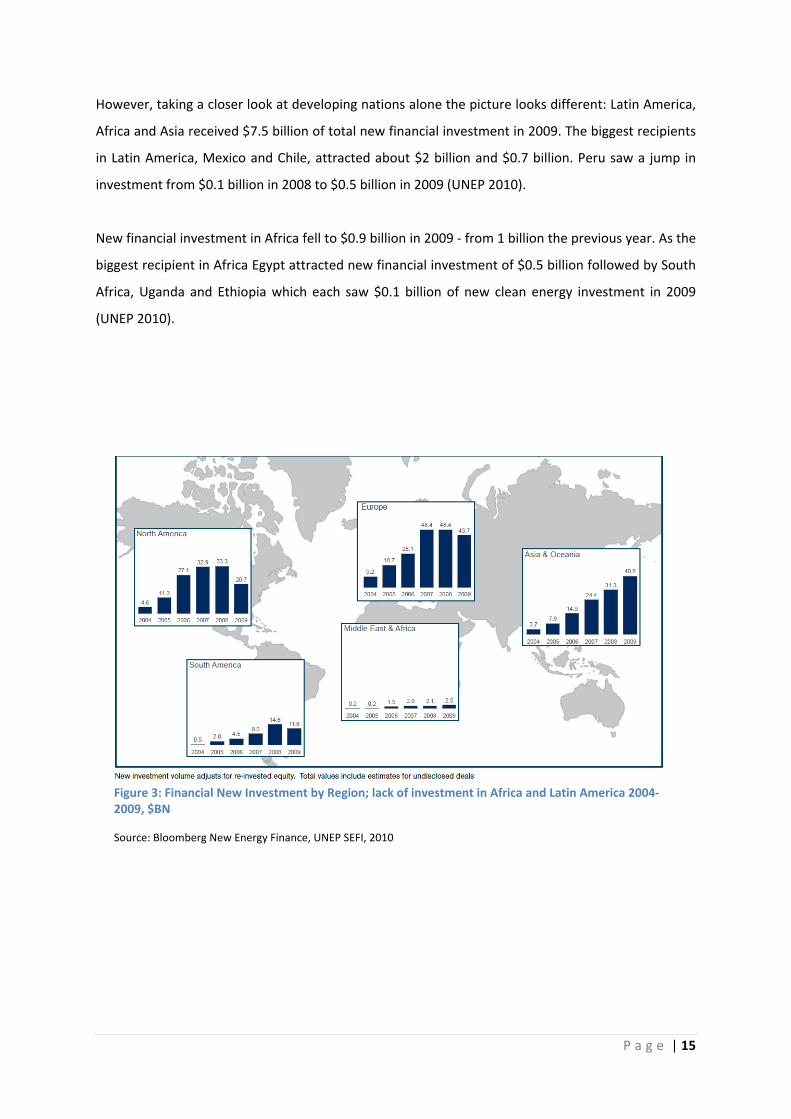
However, taking a closer look at developing nations alone the picture looks different: Latin America,
Africa and Asia received $7.5 billion of total new financial investment in 2009. The biggest recipients
in Latin America, Mexico and Chile, attracted about $2 billion and $0.7 billion. Peru saw a jump in
investment from $0.1 billion in 2008 to $0.5 billion in 2009 (UNEP 2010).
New financial investment in Africa fell to $0.9 billion in 2009 ‐ from 1 billion the previous year. As the
biggest recipient in Africa Egypt attracted new financial investment of $0.5 billion followed by South
Africa, Uganda and Ethiopia which each saw $0.1 billion of new clean energy investment in 2009
(UNEP 2010).
Figure 3: Financial New Investment by Region; lack of investment in Africa and Latin America 2004‐2009, $BN
Source: Bloomberg New Energy Finance, UNEP SEFI, 2010
P a g e | 16
2.2 Renewable Energy Finance in Developing Countries
The chapter outlines basic issues and challenges related to financing renewable energy (RE) in
developing countries.
2.2.1 Sources of private capital
Renewable energy companies have two basic ways to source capital: they can either borrow it from
a bank (debt financing), i.e. as a loan, or they can sell a stake in their business raising equity capital
(equity finance). Equity finance, such as Venture Capital, is used to finance the riskier earlier stages
of a RE project or company. Debt finance usually takes place at a later phase of the project. Bigger
investors and companies, e.g. utilities, might finance RE projects internally ‘on the balance sheet’
(Chatham House 2009; KfW 2005).
Financial institutions that provide debt finance and in particular equity finance will briefly be
outlined below:
Banks (debt finance) provide corporate lending, project finance (limited source finance), refinancing
and mezzanine finance which sits between the top level of senior bank debt (first to be paid in case
of insolvency) and equity ownership of a project or company.
Funds (Equity finance): The level of risk for capital is reflected in the expected ‘Internal Rate of
Return’ (IRR) e.g. high risk for early stage RE technologies. The IRR is a key tool to reach an
investment decision(Chatham House 2009). A listing of the various funds that provides equity
finance plus their defining characteristics and targets follows below:
Venture Capital (VE) funds:
o New technologies and markets, early stage companies
o High risk of failure
o Investment horizon 4‐7 years
o IRR: 50 – 500%
P a g e | 17
Private Equity (PE) Funds:
o More mature technologies, pre‐ Initial Public Offerings, demonstrator companies,
underperforming public companies
o Medium risk of failure
o Investment horizon 3‐5 years
o IRR: 25%
Infrastructure Funds:
o Institutional investors, pensions funds targeting ‘infrastructure such as power
generating facilities
o Steady low risk cash flow, long duration
o Investment horizon 7‐10 years
o IRR: 15%
Pensions Funds o Public equity, corporate and government bonds, real estate, cash and cash
equivalents etc.
o Low risk, stable year on year returns; very low risk for RE investment such as
onshore wind which is commonly managed through specialised Private Equity or
Venture Capital funds
o Very long term
o IRR: 15%
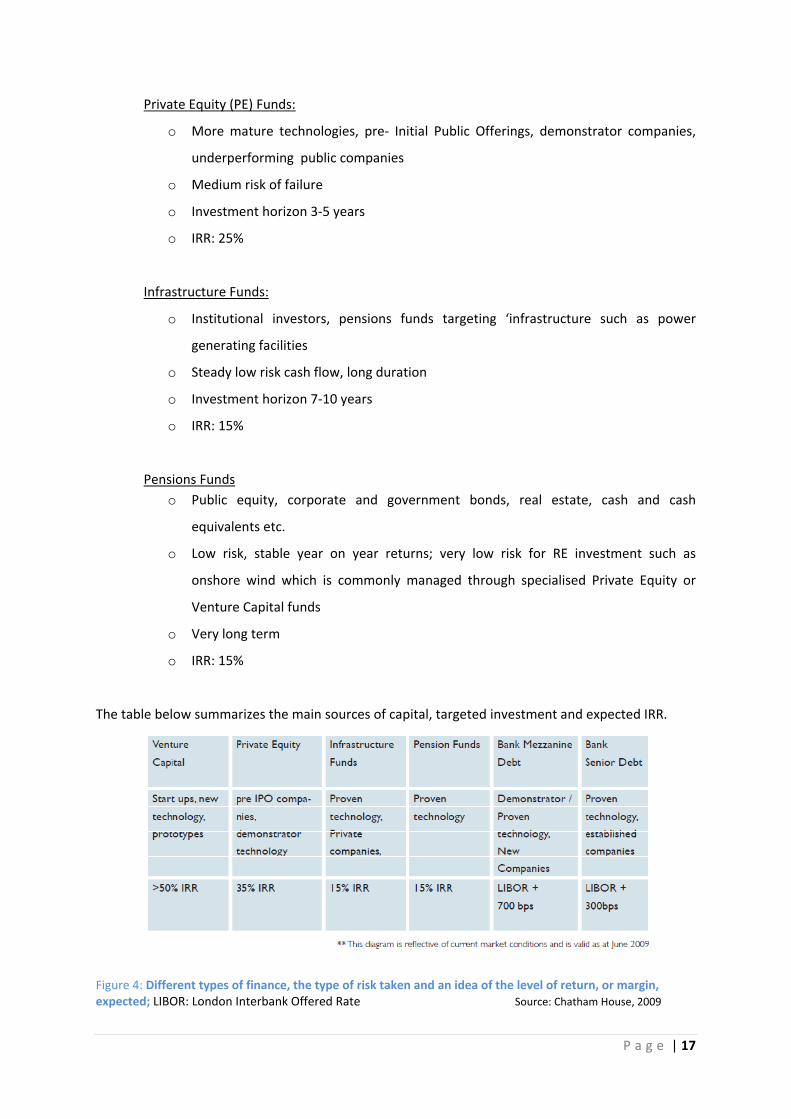
The table below summarizes the main sources of capital, targeted investment and expected IRR.
Figure 4: Different types of finance, the type of risk taken and an idea of the level of return, or margin, expected; LIBOR: London Interbank Offered Rate Source: Chatham House, 2009
P a g e | 18
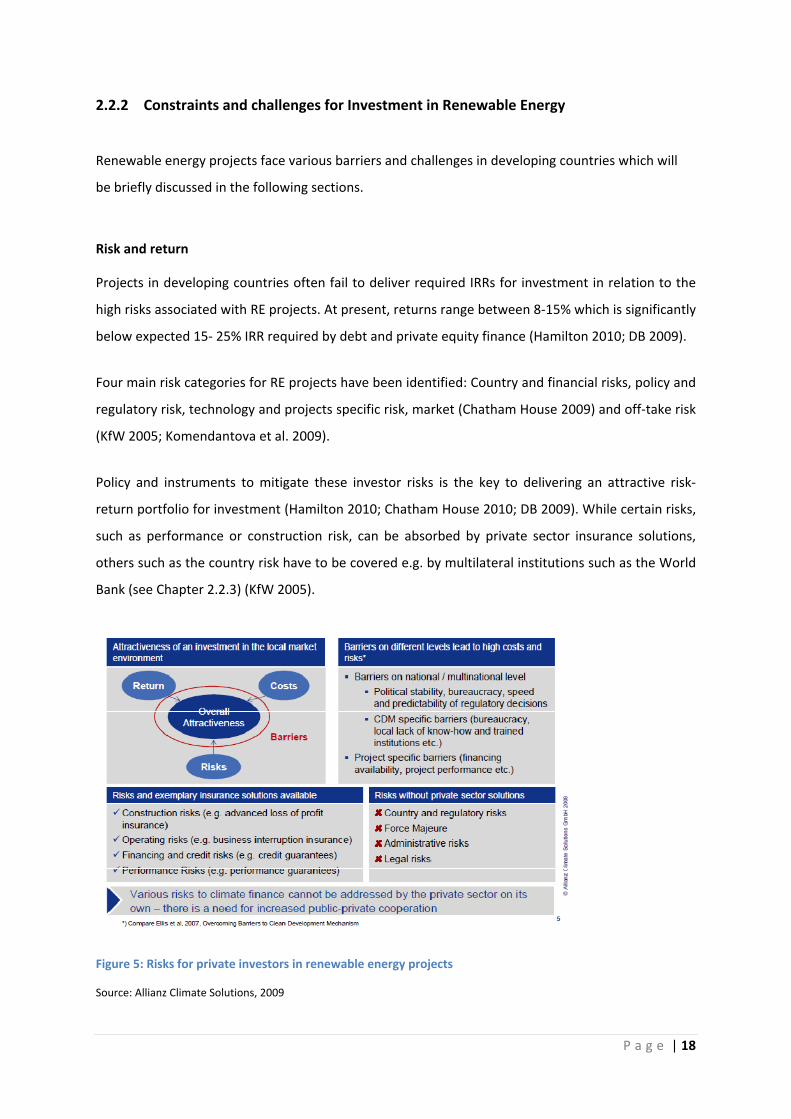
2.2.2 Constraints and challenges for Investment in Renewable Energy
Renewable energy projects face various barriers and challenges in developing countries which will
be briefly discussed in the following sections.
Risk and return
Projects in developing countries often fail to deliver required IRRs for investment in relation to the
high risks associated with RE projects. At present, returns range between 8‐15% which is significantly
below expected 15‐ 25% IRR required by debt and private equity finance (Hamilton 2010; DB 2009).
Four main risk categories for RE projects have been identified: Country and financial risks, policy and
regulatory risk, technology and projects specific risk, market (Chatham House 2009) and off‐take risk
(KfW 2005; Komendantova et al. 2009).
Policy and instruments to mitigate these investor risks is the key to delivering an attractive risk‐
return portfolio for investment (Hamilton 2010; Chatham House 2010; DB 2009). While certain risks,
such as performance or construction risk, can be absorbed by private sector insurance solutions,
others such as the country risk have to be covered e.g. by multilateral institutions such as the World
Bank (see Chapter 2.2.3) (KfW 2005).
Figure 5: Risks for private investors in renewable energy projects
Source: Allianz Climate Solutions, 2009
P a g e | 19
Barriers and Challenges
Roundtables with RE investors and financiers organized by Kirsty Hamilton from Chatham House
highlight the need to bring RE technologies down the cost curve, in order to compete directly with
conventional fuels, which are still subsidized and often favoured by energy policy (Chatham House
2009; UNEP 2008). RE projects are still characterized by high up‐front capital costs, they have little
track record and high perceived risks. Again, the central challenge for private investors is how to
“deliver an attractive return for risks taken” (Hamilton 2010).
The CEO of an African investment firm speaking at the Carbon Expo 2010 in Cologne brought the
challenge for projects in Africa down to three main issues:
1) lack of knowledge;
2) lack of access to finance and;
3) High transition costs for (Clean Development Mechanism) projects.
He emphasized that in order to achieve progress; finance will have to be unlocked on a local level.
Efforts for capacity building will have to be intensified creating track records and implementing well
designed and reliable regulating frameworks (Chingambo 2010).
A Deutsche Bank (DB) study, based on the input of RE stakeholders has identified four main
categories concerning RE investment (DB 2010; DB 2009):
1) Cost competiveness for RE technology: Renewable energy technologies directly compete with
traditional and conventional power generation, which is still highly subsidized by about $170 billion
per year (IEA 2007).Capital competes on a global level and if better returns will be achieved, for
instance in a mature policy‐ backed market in Europe, investment decisions in favour of developing
countries will be hard to justify (Hamilton 2010; DB 2010).
2) Technical and engineering issues: Main issues are the lack of grid infrastructure, access to a
stable grid with the capacity to absorb additional renewable energy and a lack of grid operators that
are able and willing to integrate. Further issues are insufficient knowledge on part of managers and
service providers in order to operate, maintain and monitor the installation (DB 2010). Technology
risk is connected to the lack of track record for new RE technologies (Hamilton 2010).
3) Project development concerns: Mainly related to missing capacity and experience within utilities
and local developers in working with RE policies. Power purchase agreements (PPAs) and standard
P a g e | 20
offer agreements need to be in place. Projects require clear rules and mechanisms and a utility
regulatory structure that cuts down barriers for projects (DB 2010);
A participant at the Chatham House roundtable described the chance to gain access to finance for
‘small‐ scale’ projects at about $10 million and less as very difficult. In spite of the great potential
market for modern electricity and the proven viability and profitability of micro finance, small
institutions, companies and projects are fairly underrepresented. However, a financier at the
roundtable emphasized that ‘smaller deal sizes will be the ‘stepping stone’ for getting to larger deal’
in the future.’(Hamilton 2010).
4) Financial concerns and the access to finance: A good risk‐ return profile is crucial to address
financial concerns (DB 2010). Banks, private equity investors and institutional investors will expect
different rates of return while developers have to manage high up‐front costs and need access to
both equity and debt financing. Another crucial aspect with regards to the development and finance
of a project is to which extent corruption might play a role in a country (DB 2010).
Experience from project RE stakeholders further shows that a lack of familiarity in understanding
and managing technology risks and missing sector know‐how deflates willingness to invest in RE
available in developing countries (Hamilton 2010; KfW 2005). In many cases there is no track record
of well‐ developed RE projects and capacities to lend locally, especially to decentralize energy
systems, are not yet in place (DB 2010).
P a g e | 21
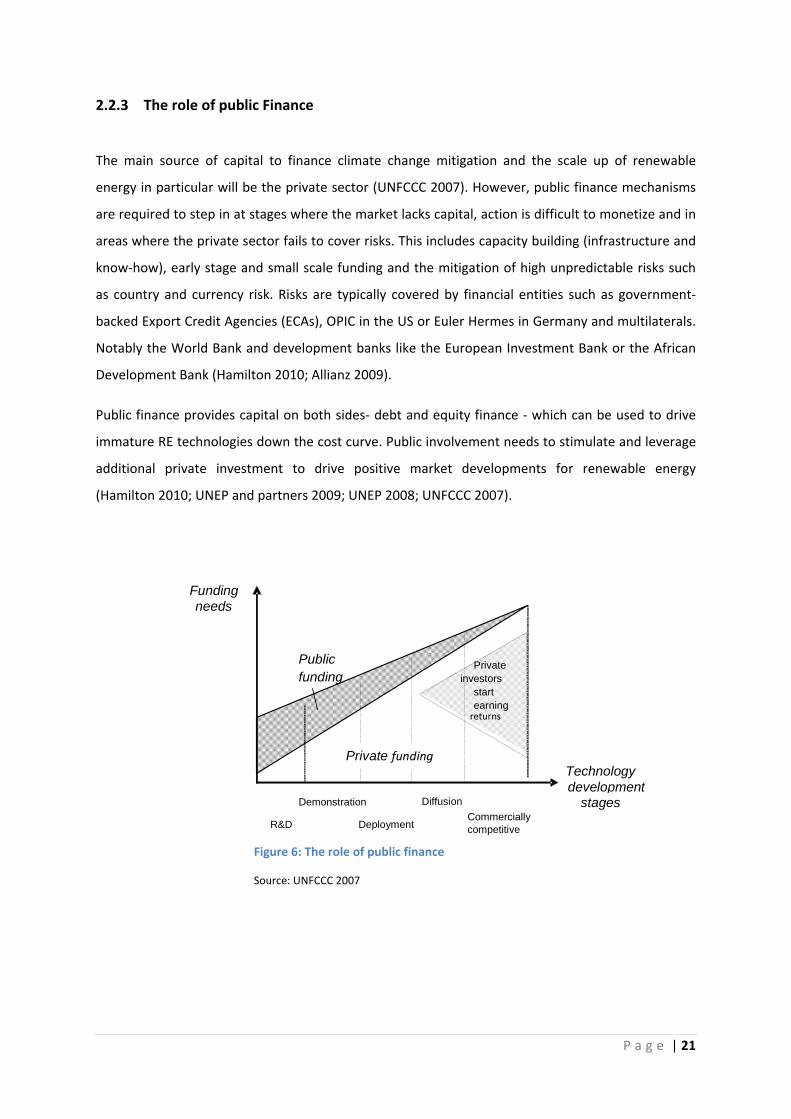
2.2.3 The role of public Finance
The main source of capital to finance climate change mitigation and the scale up of renewable
energy in particular will be the private sector (UNFCCC 2007). However, public finance mechanisms
are required to step in at stages where the market lacks capital, action is difficult to monetize and in
areas where the private sector fails to cover risks. This includes capacity building (infrastructure and
know‐how), early stage and small scale funding and the mitigation of high unpredictable risks such
as country and currency risk. Risks are typically covered by financial entities such as government‐
backed Export Credit Agencies (ECAs), OPIC in the US or Euler Hermes in Germany and multilaterals.
Notably the World Bank and development banks like the European Investment Bank or the African
Development Bank (Hamilton 2010; Allianz 2009).
Public finance provides capital on both sides‐ debt and equity finance ‐ which can be used to drive
immature RE technologies down the cost curve. Public involvement needs to stimulate and leverage
additional private investment to drive positive market developments for renewable energy
(Hamilton 2010; UNEP and partners 2009; UNEP 2008; UNFCCC 2007).
R&D Demonstration
Deployment
DiffusionCommercially competitive
Technology development
stages
Funding needs
Private investors
start
returnsearning
Public funding
Private funding
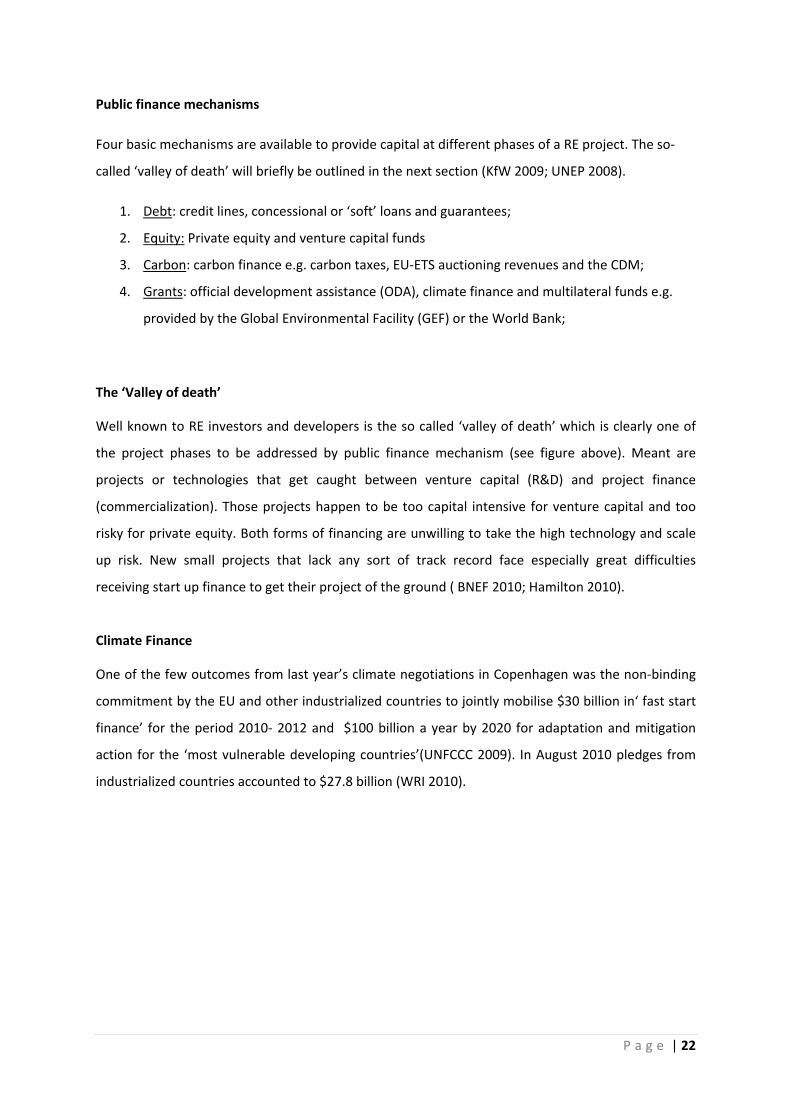
Figure 6: The role of public finance
Source: UNFCCC 2007
P a g e | 22
Public finance mechanisms
Four basic mechanisms are available to provide capital at different phases of a RE project. The so‐
called ‘valley of death’ will briefly be outlined in the next section (KfW 2009; UNEP 2008).
1. Debt: credit lines, concessional or ‘soft’ loans and guarantees;
2. Equity: Private equity and venture capital funds
3. Carbon: carbon finance e.g. carbon taxes, EU‐ETS auctioning revenues and the CDM;
4. Grants: official development assistance (ODA), climate finance and multilateral funds e.g.
provided by the Global Environmental Facility (GEF) or the World Bank;
The ‘Valley of death’
Well known to RE investors and developers is the so called ‘valley of death’ which is clearly one of
the project phases to be addressed by public finance mechanism (see figure above). Meant are
projects or technologies that get caught between venture capital (R&D) and project finance
(commercialization). Those projects happen to be too capital intensive for venture capital and too
risky for private equity. Both forms of financing are unwilling to take the high technology and scale
up risk. New small projects that lack any sort of track record face especially great difficulties
receiving start up finance to get their project of the ground ( BNEF 2010; Hamilton 2010).
Climate Finance
One of the few outcomes from last year’s climate negotiations in Copenhagen was the non‐binding
commitment by the EU and other industrialized countries to jointly mobilise $30 billion in‘ fast start
finance’ for the period 2010‐ 2012 and $100 billion a year by 2020 for adaptation and mitigation
action for the ‘most vulnerable developing countries’(UNFCCC 2009). In August 2010 pledges from
industrialized countries accounted to $27.8 billion (WRI 2010).

P a g e | 23
2.3 Carbon Finance ‐ the icing on the cake
The Clean Development Mechanism (CDM) promotes
emission reduction projects in developing countries by
generating certified emissions reduction credits (CERs)
which can be sold and traded in industrialized countries.
About 6281CDM projects have been registered, or are in
the project pipeline by 2012, of which about 60% are
renewables (UNFCCC 2010; UNEP Risoe Centre 2010).
The value of project‐based transactions totalled $2.7
billion in 2009– 59% less than in 2008 (UNEP 2010).
By far the biggest host country for CDM projects is China representing nearly a 40% share (910
projects) of total registered projects. Out of 2314 registered projects only 45 took place in Africa
(UNFCCC 2010).
The International Emissions Trading Association (IETA) summarized some of main issues that led to
the underrepresentation of CDM projects in less developed countries (IETA 2010):
• High operating and capital costs for projects in less developed countries and a lack of
expertise on the part of financial institutions and administrational entities; most materials
need to be imported (IETA 2010);
• High transaction costs especially for small‐scale projects in less developed countries; low
per capita emissions drive up the marginal costs of GHG abatement and the large share of
biomass and hydropower result in low grid emission factors leading to low baselines against
which the amount of CER for a project is measured. As a consequence especially small‐scale
RE projects in poorer countries are less attractive compared to China and India which have
high baselines due to their large share of fossil fuel generation(IETA 2010);
• Due to capacity bottlenecks and inefficiencies in the regulatory chain, e.g. at national
authorities (DNA’s) or the UNFCCC secretary itself, the CDM process is very time consuming,
expensive and makes it impossible to predict future revenues from the sale of credits(IETA
2010). Today it takes an average of 3 years until CERs are issued (WB 2009);
The Clean Development Mechanism (CDM)
The CDM allows emission‐reduction (or emission removal) projects in developing countries to earn certified emission reduction (CER) credits, each equivalent to one tonne of CO2. These CERs can be traded and sold, and used by industrialized countries (ANNEX‐ 1) to a meet a part of their emission reduction targets under the Kyoto Protocol.
Source: UNFCCC
P a g e | 24
• CERs are issued ex‐post therefore being insufficient to cover the often significant upfront
capital costs which adds to the generally high registration risk, issuance and (carbon) price
risk; as a result the CDM often fails to deliver bankable mainstream project finance (IETA
2010; Sterk 2007);
A reformed mechanism under a post‐Kyoto regime will need to focus on areas where it has attracted
little activity yet: geographical (i.e. Africa), sectoral (i.e. energy efficiency), and in particular in terms
of scale (i.e. smaller projects) (Robins et al. 2009).
P a g e | 25
2.4 Renewable Energy Policy – a finance perspective
In early 2010 more than 83 countries, 42 of them developing, had some type of policy to promote
renewable power generation (REN21 2010). However, the high number of new climate policies was
mostly due to submissions of non‐binding emissions reduction targets, action plans or letters of
commitment submitted under the Copenhagen Accord‐ the concluding non‐legal document of the
UN climate negotiations last December (DB 2010; REN21 2010).
A report conducted for the European Commission in 2006 concluded that besides characteristics
such as effectiveness and efficiency of policy a long‐term and stable policy environment has been
shown to be actually the key criterion for the success of developing renewable electricity markets’
(Held et al., Haas and Ragwitz 2006). UNEP puts it into a nutshell: policy has to be ‘loud (improve
bankability), long (duration reflecting investment horizons) and legal’ (clear, stable framework)
(UNEP SEFI 2004).
Chatham House finance roundtables with RE stakeholders also strongly highlighted the key role of
policy in reaching investment decisions. Countries providing clear policy frameworks and incentives
will draw attention from investors. In many cases the availability of capital has been less of a
problem than the absence of good conditions to ‘unlock’ capital for financiers on the ground
(Hamilton 2010). Today, however, renewable energy policy is predominantly located within the
framework of climate policy (‘climate driver’) and energy security concerns.
Renewable energy investors further highlight the timing for policy has to be right considering that
investment horizons range from 15 to 20 years (Hamilton 2010). In particular banks see stability and
longevity as priority for markets, to secure both repayment of debts and their returns. Policy makers
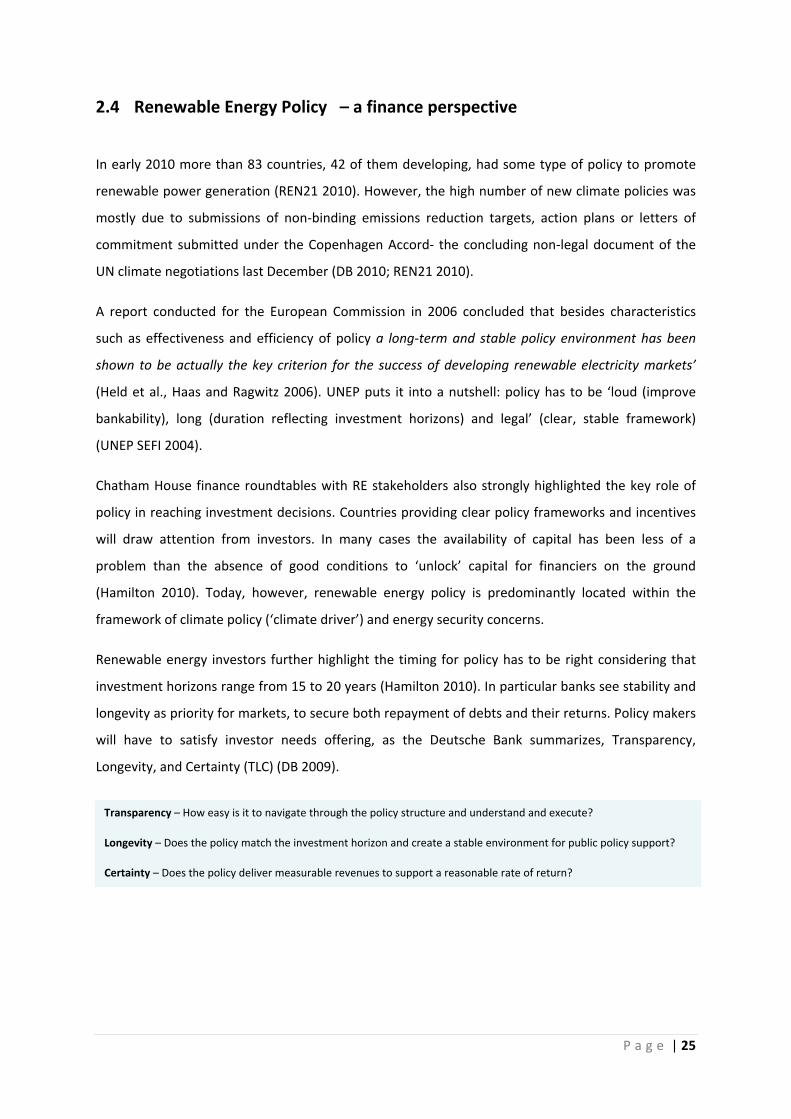
will have to satisfy investor needs offering, as the Deutsche Bank summarizes, Transparency,
Longevity, and Certainty (TLC) (DB 2009).
Transparency – How easy is it to navigate through the policy structure and understand and execute?
Longevity – Does the policy match the investment horizon and create a stable environment for public policy support?
Certainty – Does the policy deliver measurable revenues to support a reasonable rate of return?
P a g e | 26
2.4.1 NAMAs – Supporting RE in developing countries in post‐2012
National Appropriate Mitigation Actions (NAMAs) seek to accelerate developing country
participation in emissions reductions efforts from a voluntary, non‐market based‐ bottom‐ up
regime (Chung 2009).
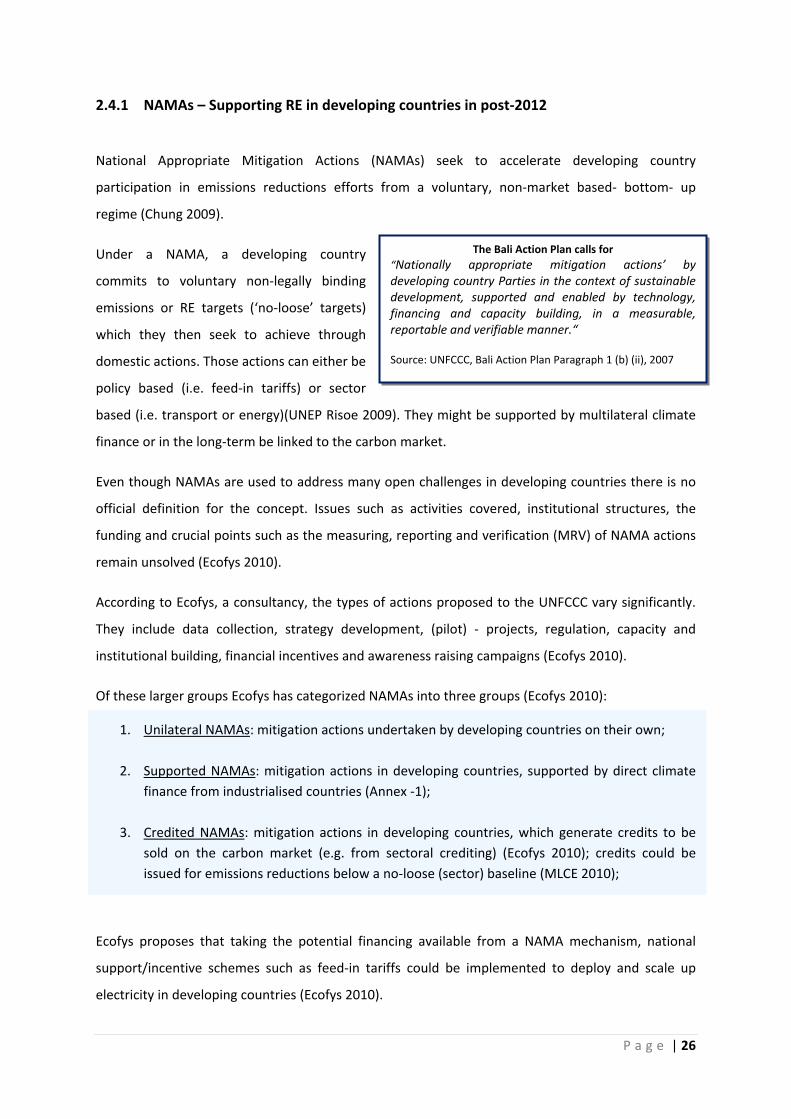
Under a NAMA, a developing country
commits to voluntary non‐legally binding
emissions or RE targets (‘no‐loose’ targets)
which they then seek to achieve through
domestic actions. Those actions can either be
policy based (i.e. feed‐in tariffs) or sector
based (i.e. transport or energy)(UNEP Risoe 2009). They might be supported by multilateral climate
finance or in the long‐term be linked to the carbon market.
Even though NAMAs are used to address many open challenges in developing countries there is no
official definition for the concept. Issues such as activities covered, institutional structures, the
funding and crucial points such as the measuring, reporting and verification (MRV) of NAMA actions
remain unsolved (Ecofys 2010).
According to Ecofys, a consultancy, the types of actions proposed to the UNFCCC vary significantly.
They include data collection, strategy development, (pilot) ‐ projects, regulation, capacity and
institutional building, financial incentives and awareness raising campaigns (Ecofys 2010).
Of these larger groups Ecofys has categorized NAMAs into three groups (Ecofys 2010):
1. Unilateral NAMAs: mitigation actions undertaken by developing countries on their own;
2. Supported NAMAs: mitigation actions in developing countries, supported by direct climate finance from industrialised countries (Annex ‐1);
3. Credited NAMAs: mitigation actions in developing countries, which generate credits to be sold on the carbon market (e.g. from sectoral crediting) (Ecofys 2010); credits could be issued for emissions reductions below a no‐loose (sector) baseline (MLCE 2010);
Ecofys proposes that taking the potential financing available from a NAMA mechanism, national
support/incentive schemes such as feed‐in tariffs could be implemented to deploy and scale up
electricity in developing countries (Ecofys 2010).
The Bali Action Plan calls for “Nationally appropriate mitigation actions’ by developing country Parties in the context of sustainable development, supported and enabled by technology, financing and capacity building, in a measurable, reportable and verifiable manner.“
Source: UNFCCC, Bali Action Plan Paragraph 1 (b) (ii), 2007
P a g e | 27
2.5 Feed‐in tariff schemes for developing countries
Generally two support schemes are used to encourage new renewable energy generation and
capacity installation (I) quantity market‐based mechanisms such as tendering, green certificates and
quota obligations and (ii) price based instruments such as fiscal incentives and feed‐in tariffs
(premiums) (EC 2008). The Stern review summarizes recent global observations:
Feed‐ in tariff (FIT) schemes offers a fixed price for purchase of renewable power. Renewable energy
(RE) producers usually receive a premium rate over the retail price per kilowatt‐hour (kWh) fed into
the grid. The costs are equally distributed among electricity consumers. In early 2010 at least 50
countries and 25 states and provinces had adopted feed‐in tariff schemes worldwide. The majority
of the schemes have been implemented within the last five years (REN21 2010).
Today feed‐in tariff (FIT) schemes are considered to be most effective in stimulating the rapid
deployment of renewable energy and providing long‐term financial stability for investors in
renewable energy (Mendonca et al. 2010; EC 2008; Klessmann et al. 2008; IEA 2008; Mitchell et al.
2006).
2.5.1 Core principles
Well‐designed FIT polices include five core principles which will be key to their success (Mendonca et
al. 2010, WFC 2010, DB 2009, Klessmann et al. 2008):
• Eligible technologies: the types of RE technologies and size of plants must be suitable for a
given region;
• Specified tariff by technology: Technology specific rates lead to precise tariff pricing for the
wide range of renewable energy technologies;
• Guaranteed Payments: FITs provide guaranteed payment rates that need to be based on the
cost of generation plus a reasonable profit;
A comparison between deployment support through tradable quotas and feed‐in tariff price support
suggest that feed‐in mechanisms achieve larger deployment at lower costs
Source: Stern Review 2007 (Stern 2007, 266)
P a g e | 28
• Interconnection: Policies should provide a mandate for grid operators to grant RE priority
grid access;
• Payment term: Long term contracts should provide a revenue stream to match the project
life (usually 15‐20 years) with pre‐determined prices increase investor certainty;
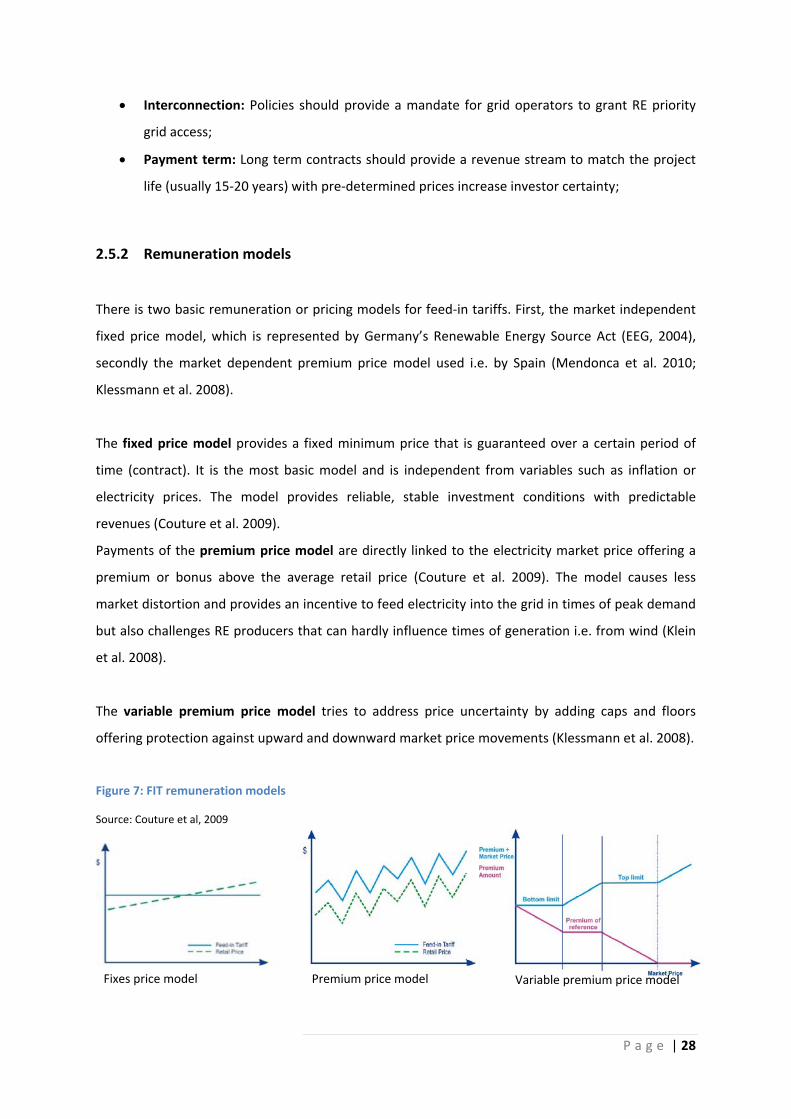
2.5.2 Remuneration models
There is two basic remuneration or pricing models for feed‐in tariffs. First, the market independent
fixed price model, which is represented by Germany’s Renewable Energy Source Act (EEG, 2004),
secondly the market dependent premium price model used i.e. by Spain (Mendonca et al. 2010;
Klessmann et al. 2008).
The fixed price model provides a fixed minimum price that is guaranteed over a certain period of
time (contract). It is the most basic model and is independent from variables such as inflation or
electricity prices. The model provides reliable, stable investment conditions with predictable
revenues (Couture et al. 2009).
Payments of the premium price model are directly linked to the electricity market price offering a
premium or bonus above the average retail price (Couture et al. 2009). The model causes less
market distortion and provides an incentive to feed electricity into the grid in times of peak demand
but also challenges RE producers that can hardly influence times of generation i.e. from wind (Klein
et al. 2008).
The variable premium price model tries to address price uncertainty by adding caps and floors
offering protection against upward and downward market price movements (Klessmann et al. 2008).
Figure 7: FIT remuneration models
Source: Couture et al, 2009
Fixes price model
Premium price model
Variable premium price model
P a g e | 29
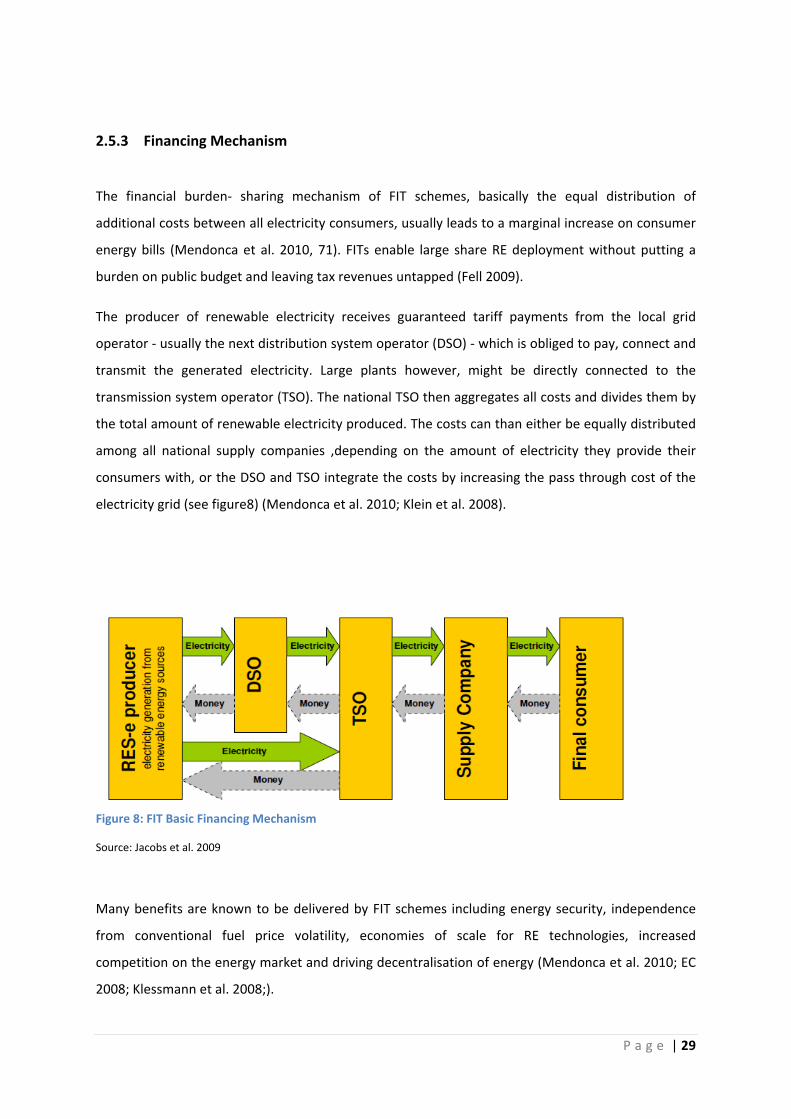
2.5.3 Financing Mechanism
The financial burden‐ sharing mechanism of FIT schemes, basically the equal distribution of
additional costs between all electricity consumers, usually leads to a marginal increase on consumer
energy bills (Mendonca et al. 2010, 71). FITs enable large share RE deployment without putting a
burden on public budget and leaving tax revenues untapped (Fell 2009).
The producer of renewable electricity receives guaranteed tariff payments from the local grid
operator ‐ usually the next distribution system operator (DSO) ‐ which is obliged to pay, connect and
transmit the generated electricity. Large plants however, might be directly connected to the
transmission system operator (TSO). The national TSO then aggregates all costs and divides them by
the total amount of renewable electricity produced. The costs can than either be equally distributed
among all national supply companies ,depending on the amount of electricity they provide their
consumers with, or the DSO and TSO integrate the costs by increasing the pass through cost of the
electricity grid (see figure8) (Mendonca et al. 2010; Klein et al. 2008).
Many benefits are known to be delivered by FIT schemes including energy security, independence
from conventional fuel price volatility, economies of scale for RE technologies, increased
competition on the energy market and driving decentralisation of energy (Mendonca et al. 2010; EC
2008; Klessmann et al. 2008;).
Figure 8: FIT Basic Financing Mechanism
Source: Jacobs et al. 2009
P a g e | 30
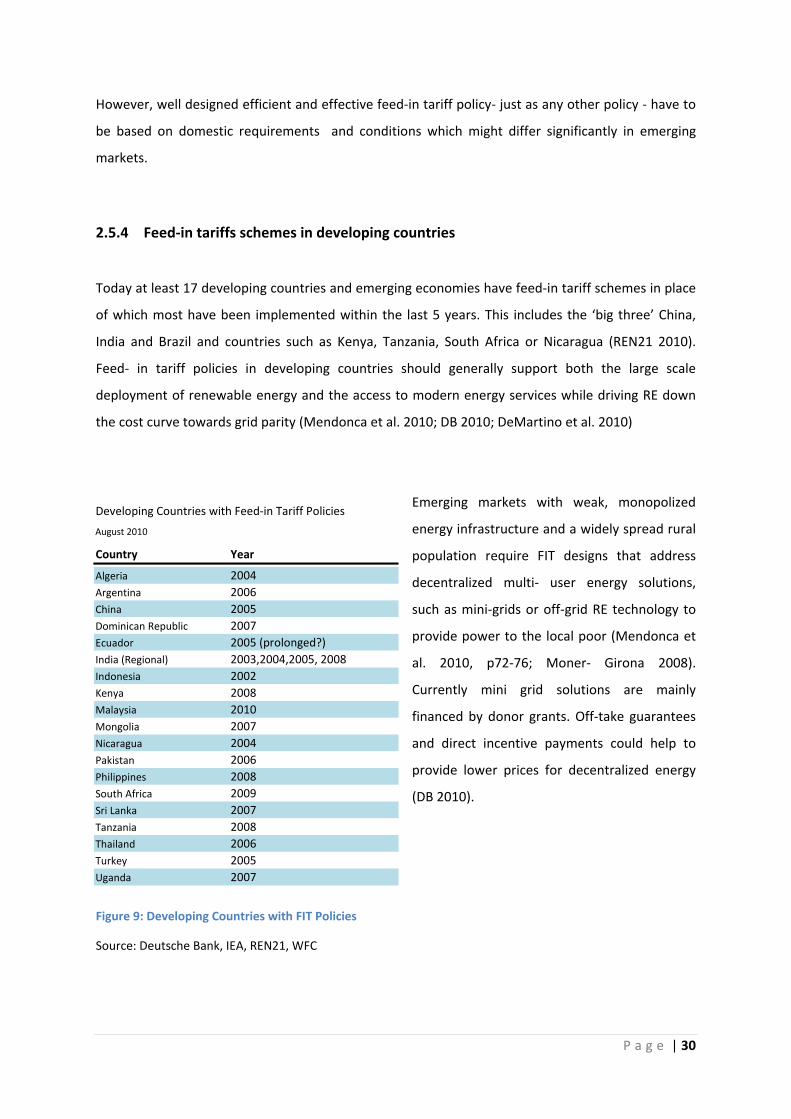
Developing Countries with Feed‐in Tariff Policies
August 2010
Country Year
Algeria 2004Argentina 2006China 2005Dominican Republic 2007Ecuador 2005 (prolonged?)India (Regional) 2003,2004,2005, 2008Indonesia 2002Kenya 2008Malaysia 2010Mongolia 2007Nicaragua 2004Pakistan 2006Philippines 2008South Africa 2009Sri Lanka 2007Tanzania 2008Thailand 2006Turkey 2005Uganda 2007
However, well designed efficient and effective feed‐in tariff policy‐ just as any other policy ‐ have to
be based on domestic requirements and conditions which might differ significantly in emerging
markets.
2.5.4 Feed‐in tariffs schemes in developing countries
Today at least 17 developing countries and emerging economies have feed‐in tariff schemes in place
of which most have been implemented within the last 5 years. This includes the ‘big three’ China,
India and Brazil and countries such as Kenya, Tanzania, South Africa or Nicaragua (REN21 2010).
Feed‐ in tariff policies in developing countries should generally support both the large scale
deployment of renewable energy and the access to modern energy services while driving RE down
the cost curve towards grid parity (Mendonca et al. 2010; DB 2010; DeMartino et al. 2010)
Emerging markets with weak, monopolized
energy infrastructure and a widely spread rural
population require FIT designs that address
decentralized multi‐ user energy solutions,
such as mini‐grids or off‐grid RE technology to
provide power to the local poor (Mendonca et
al. 2010, p72‐76; Moner‐ Girona 2008).
Currently mini grid solutions are mainly
financed by donor grants. Off‐take guarantees
and direct incentive payments could help to
provide lower prices for decentralized energy
(DB 2010).
Figure 9: Developing Countries with FIT Policies
Source: Deutsche Bank, IEA, REN21, WFC
P a g e | 31
Reliable, stable and long‐ term frameworks that provide RE investors returns matching the project
life will determine the success of FIT schemes. However, consumers and countries in poorer regions
often lack financial strength and capacity to provide long‐ term funding for FIT payments (DB 2010).
A feed‐in tariff fund
Within the last 12 months the concept of financing feed‐in tariffs in developing countries through a
national or global fund have been widely discussed and proposed. A ‘FIT Fund’ combined with risk
mitigation instruments and capacity building efforts, to be financed from sources such as
international sponsors, a CDM tax, emissions auctioning or climate finance could help to overcome
barriers such as the lack of financial and infrastructural capacity (DeMartino et al. 2010;
Greenpeace/EREC 2009; WFC 2009; WWEA 2009).
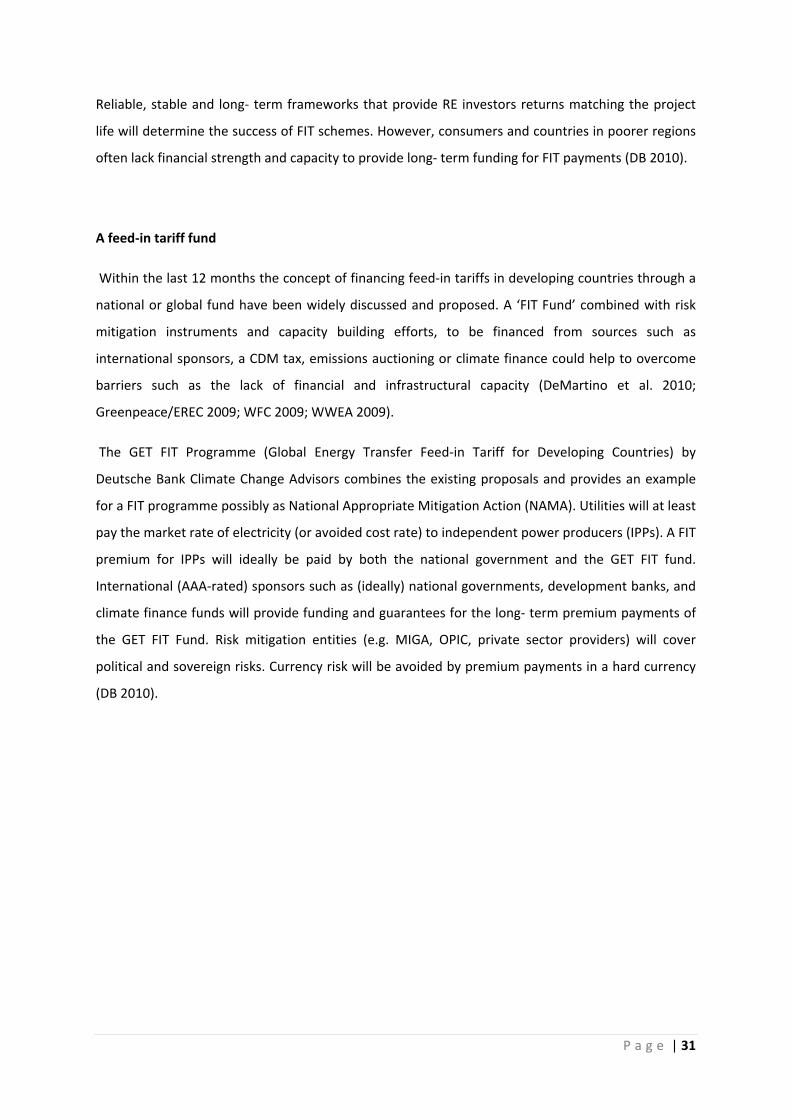
The GET FIT Programme (Global Energy Transfer Feed‐in Tariff for Developing Countries) by
Deutsche Bank Climate Change Advisors combines the existing proposals and provides an example
for a FIT programme possibly as National Appropriate Mitigation Action (NAMA). Utilities will at least
pay the market rate of electricity (or avoided cost rate) to independent power producers (IPPs). A FIT
premium for IPPs will ideally be paid by both the national government and the GET FIT fund.
International (AAA‐rated) sponsors such as (ideally) national governments, development banks, and
climate finance funds will provide funding and guarantees for the long‐ term premium payments of
the GET FIT Fund. Risk mitigation entities (e.g. MIGA, OPIC, private sector providers) will cover
political and sovereign risks. Currency risk will be avoided by premium payments in a hard currency
(DB 2010).
P a g e | 32
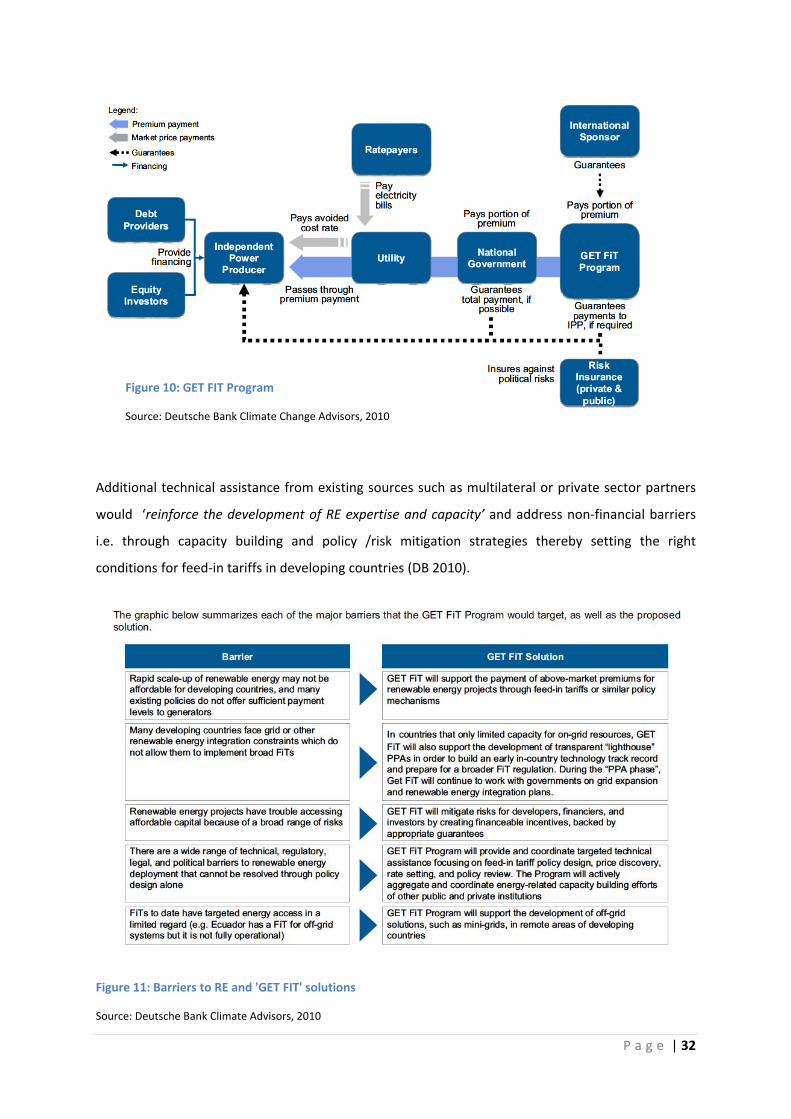
Additional technical assistance from existing sources such as multilateral or private sector partners
would ‘reinforce the development of RE expertise and capacity’ and address non‐financial barriers
i.e. through capacity building and policy /risk mitigation strategies thereby setting the right
conditions for feed‐in tariffs in developing countries (DB 2010).
Figure 11: Barriers to RE and 'GET FIT' solutions
Source: Deutsche Bank Climate Advisors, 2010
Figure 10: GET FIT Program
Source: Deutsche Bank Climate Change Advisors, 2010
P a g e | 33
Deutsche Bank estimates that a $3 billion commitment under the GET FIT fund could facilitate over
1GW of new on‐grid and off‐grid RE capacity attracting project finance capital of around $4 billion
(DB 2010).
However, though the proposal does not address capitalization strategies and governance structure it
provides very interesting overall approach which includes all main issues for FITs in developing
countries
The concept of a global fund to support feed‐in tariff programmes has already found its way into the
footnotes of the climate negotiations in the context of NAMAs (UNFCCC 2009):
An example of how important the reliable and sustainable long term financing for FIT schemes is,
shows a current case from Europe: Facing massive deficits from the financial downturn, Spain needs
to keep a lid on electric costs. The response by the Spanish government shocked RE investors and
developers: Over the next years tariffs for new PV installations might be cut by up to 45%. Even
greater concerns, however, caused the announcement to cut down premium tariff payments up to
15% for operating installations by (Bloomberg 2010).
‘A global fund shall be established to support a global feed‐in tariff program, providing guaranteed purchase prices, over and above the retail energy price in developing countries, of energy from renewable
sources […]’ Source: UNFCCC: 3. Report of the AWG‐LCA on its Seventh Session, Annex VI, Barcelona 2009
P a g e | 34
2.5.5 CDM vs. Feed‐in tariffs An ongoing, unsolved and complex controversy, which is often referred to as E+/E‐ issue, was
triggered in December 2009 when the UNFCCC’s CDM Executive Board (EB 51 meeting) shocked the
carbon market by rejecting 10 Chinese wind projects failing to prove ‘additionality’ in combination
with power tariffs for wind which, as the EB claims, had been lowered to be eligible with the CDM
(WB 2009).
Ensuring that carbon offset payments result in ‘real’ emissions reductions that would ‘not have
happened anyway’ without CDM revenues (Business as usual ‐ BAU) projects have to prove their
(financial) ‘additionality’ to the CDM EB (He et al. 2010).
However, the EB 51 decision is contrary to a ruling in 2001: Seeking to avoid potential perverse
incentives to meet CDM criteria in host countries (IETA 2009) to implement policies that ‘give
positive comparative advantages to less emissions‐intensive technologies (E‐) over more emissions‐
intensive technologies (E+)’ the EB (16th meeting) clarified that ‘E‐‘ policies are not to be considered
either the baseline scenario or the additionality of projects after November 2001 (UNFCCC 2001).
Lex de Jonge, former chair of the CDM EB warned that ‘this very important issue could have quite an
impact on the credibility of the whole CDM” (Carbon, Point 2009). The controversy further adds
significant uncertainty to the world’s largest CDM market. China, once considered to be the safest
CDM bet ‐ might have become the riskiest’ (He et al. 2010). There are implications for other host
countries as a World Bank analyst concludes, saying that renewable energy CDM projects in
developing countries with existing or new renewable feed‐in tariff schemes will run a higher
regulatory risk than countries without incentive schemes (WB 2009). During the UN climate
negotiations in Bonn in August 2010 the EB had refused to clarify this issue (Carnahan 2010).
P a g e | 35
2.6 Research
Financial Investment in renewable energy and the Clean Development Mechanism have bypassed
poorer countries in regions such as Latin America and Africa (IETA 2010; UNEP 2010).
Feed‐in tariffs (FITs) are known as an efficient and effective tool to scale up renewable energy
generation and have been implemented in numerous developing countries in the last five years
(REN21 2010; Mendonca et al. 2010). However, due to their recent implementation, little
information is available as to how FITs are perceived by stakeholders of renewable energy projects,
and what their actual impact on renewable energy investment is.
One of the biggest challenges facing FIT schemes in developing countries is securing long term
funding to support the program. The concept of a feed‐in tariff fund co‐ financed by donor money is
briefly outlined in various papers published within the last year and has been discussed in detail in
the GET FIT paper by Deutsche Bank (DB 2010; DeMartino et al. 2010; Greenpeace/EREC 2009; WFC
2009; WWEA 2009) The capitalization and governance of the GET FIT program is only covered
briefly.
National Appropriate Mitigation Actions (NAMAs) might be a way to address the funding issue of
FITs in developing countries channelling existing and new multilateral donor money into FIT schemes
in general and a potential GET FIT or Global FIT Fund in particular (DB 2010; UNFCCC 2010b). Even
though the concept of NAMAs in the context of a post 2012‐ climate change regime has been under
discussion for several years (Ecofys 2010; UNEP Risoe 2009), the option to finance FITs or through
NAMAs has not yet been further considered by policy experts.
This study seeks to complement the discussion about FITs schemes in developing countries and the
funding of those schemes. This will be achieved by compiling the perceptions and opinions of major
senior stakeholders such as developers and financiers with a strong link to RE projects. Information
gained through this study on perceptions and issues with current FIT schemes in developing
countries and the potential role of NAMAs to fund them will provide a solid basis for structuring
further research.
P a g e | 36
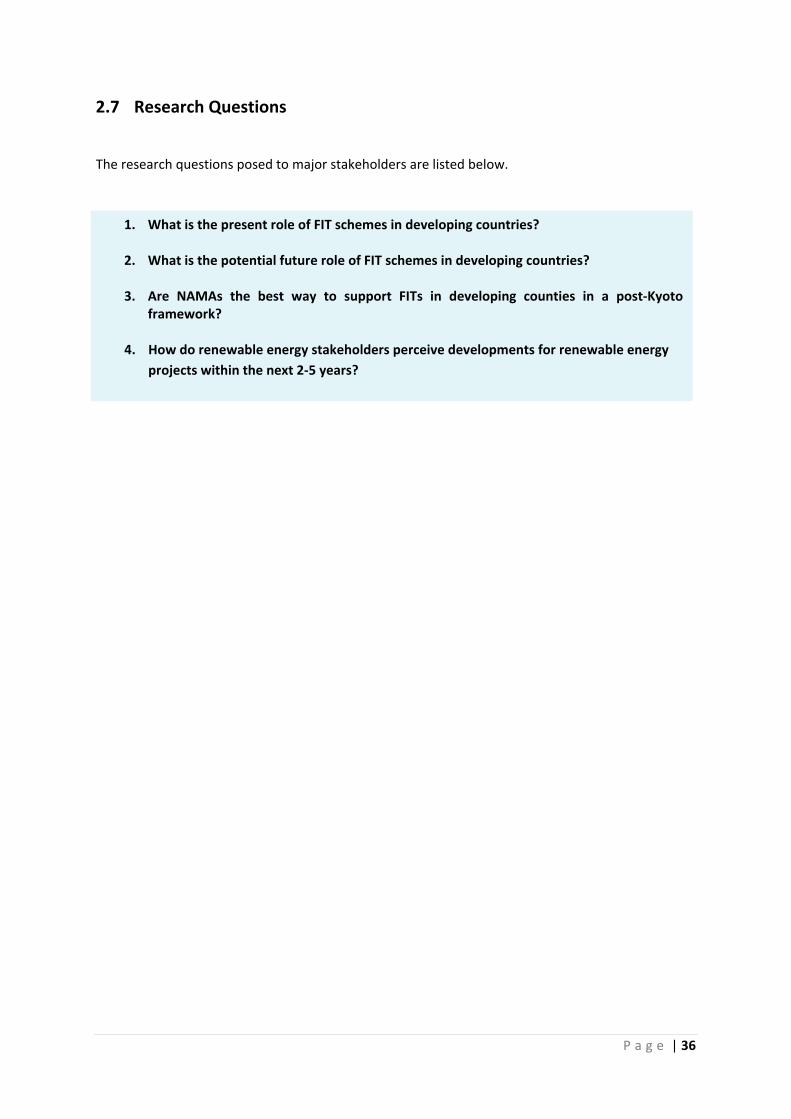
1. What is the present role of FIT schemes in developing countries?
2. What is the potential future role of FIT schemes in developing countries?
3. Are NAMAs the best way to support FITs in developing counties in a post‐Kyoto framework?
4. How do renewable energy stakeholders perceive developments for renewable energy projects within the next 2‐5 years?
2.7 Research Questions
The research questions posed to major stakeholders are listed below.
P a g e | 37
3 METHODOLOGY
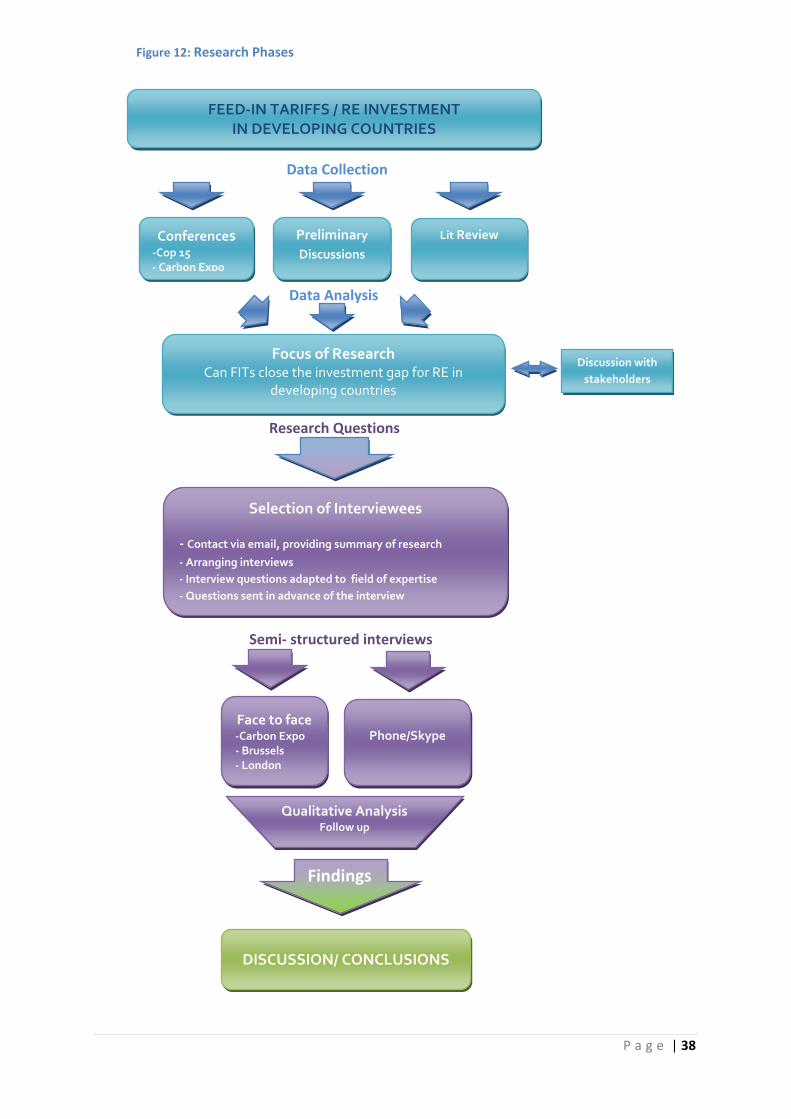
The study utilizes data triangulation in order to gain a combination of research perspectives on the
topic (Flick 1992; Denzin 1989). Information was employed from multiple data sources such as pre‐
elementary discussions, reports, interviews and conferences namely the UN climate negotiations in
Copenhagen in 2009, Falmouth Energy Week and the Carbon Expo in May 2010. A qualitative
approach enabled the collection of evidence‐based information. Semi‐structured interviews
addressing open ended questions encouraged in–depth discussions from which additional issues and
perspectives on the topic evolved (Blaxter et al.; Flick 1998).
3.1 Research approach
The objective of the study is to gain first hand information from senior RE finance stakeholders in
order to draw an evidence‐based picture of experiences and perceptions in terms of current and
potential developments for renewable energy finance in developing countries. A special focus is on
feed‐in tariff schemes as one of the most promising mechanisms to scale up renewable energy in
developing countries (Mendonca et al. 2010; DB 2010). However, most FIT schemes in developing
countries have been implemented recently or are in the process of being implemented (REN21
2010).
High country risk, poor institutional and network infrastructure (Hamilton 2010) as well as the lack of
a post‐Kyoto agreement (including a reformed Clean Development Mechanism) make fairly difficult
ground for investment in developing countries (IETA, 2010). Geographically, this research takes a
rather breadth than country specific approach focusing on the world’s poorest regions Latin America
and Africa that are most concerned by a lack in RE investment.
P a g e | 38
FEED‐IN TARIFFS / RE INVESTMENT IN DEVELOPING COUNTRIES
Conferences ‐Cop 15 ‐ Carbon Expo
Preliminary Discussions
Lit Review
Focus of Research Can FITs close the investment gap for RE in
developing countries
Discussion with stakeholders
Selection of Interviewees
‐ Contact via email, providing summary of research
‐ Arranging interviews ‐ Interview questions adapted to field of expertise ‐ Questions sent in advance of the interview
Research Questions
Semi‐ structured interviews
Face to face ‐Carbon Expo ‐ Brussels ‐ London
Phone/Skype
Data Collection
Data Analysis
DISCUSSION/ CONCLUSIONS
Qualitative Analysis Follow up
Findings
Figure 12: Research Phases
P a g e | 39
3.2 Literature review
Secondary data has been employed for the literature review providing basic background knowledge
about issues relevant to renewable energy finance and feed‐in tariffs in developing countries. Due to
the rapid developments and continuously changing policy frameworks for RE in developing
countries, as well as uncertainty caused by the absence of a post‐Kyoto framework, the study
focused on evidence based and practice‐ oriented literature. Secondary data sources were studies,
publications and presentations obtained from renowned organisations and institutions such as
Chatham House, the UN and Deutsche Bank Climate Change Advisors. Information about RE finance
and FITs in developing countries was mainly employed from two studies:
• ‘Scaling up Renewable Energy in Developing Countries: Finance and investment perspectives’,
a report from finance roundtables with RE financiers by Kirsty Hamilton, published by
Chatham House in April 2010 (Hamilton 2010) and
• The GET FIT Programme, a whitepaper by Deutsche Bank Climate Change Advisors, covering
issues around FIT schemes in developing countries and ‐ based on earlier proposals ‐
outlining a potential architecture of a ‘FIT – Fund’ programme for developing countries; The
paper, which includes input from various RE finance and FIT experts was published in April
2010;
3.3 Conferences and Preliminary Discussions
Various discussion and information collected from conferences contributed to developing the
research project and led to further contacts with stakeholders. Discussions were carried out at the
UN Climate Negotiations (COP15) and IETA side events in Copenhagen in December 2009 (WFC,
WWEA), at the Falmouth Energy Week (Chatham House) and finally at the Carbon Expo in Cologne in
May 2010. Additional discussions e.g. with Miguel Mendonca, a renowned expert for feed‐in tariffs,
took place over the phone.
P a g e | 40
3.4 Interviews
The following chapter will provide information about the selection of interviewees, how interviews
were carried out, the design of questions and finally the analysis of interviews.
3.4.1 Selection of interviewees
In order to gain best possible insights and perspectives on the topic senior staff from the following
relevant professional backgrounds was selected: policy making, project development, ‐ finance and
consultancy, RE market and finance analysis and associations. Interviewees hold positions in the
private sector, international organisations such as the European Commission and United Nations, in
Non‐Governmental Organisations and associations such as the International Hydropower
Association (IHA) and the International Emissions Trading Association (IETA). Most participants have
a strong link to the carbon market particularly to CDM projects therefore having gained long‐ term
experience and expertise in terms of RE project development and finance in developing countries.
About 25 potential interviewees have been contacted by email which had detailed information
about the research project in attachment. Some contacts appeared to be specialised in fields not
relevant to the study, others were simply not available for interviews due to work commitments or
holidays. After all 19 interviews have been carried out, including 25 participants (see table below).
3.4.1.1 Interviews
Out of 19 semi‐structured interviews carried out in English and German, eight were conducted face‐
to‐face taking place at the Carbon Expo in Cologne, the European Commission in Brussels and in
London. The remaining interviews were carried out over the phone but mainly over Skype, a free
Voice over IP software, which provided a good solution since Interviewees were based around the
globe. In order to leave the interviewee enough time for preparation and to eventually invite further
colleagues to the session, questions were provided by email prior to the session. This resulted in
more in‐depth discussions. The duration of the interviews and discussions ranged from 25 to 120
minutes. Most interviews were recorded and additional notes were taken throughout the sessions.
Follow up emails –to exchange information and contacts – have been sent subsequently to the
session. Further consultation about topic specific issues took place alongside the writing process.
P a g e | 41
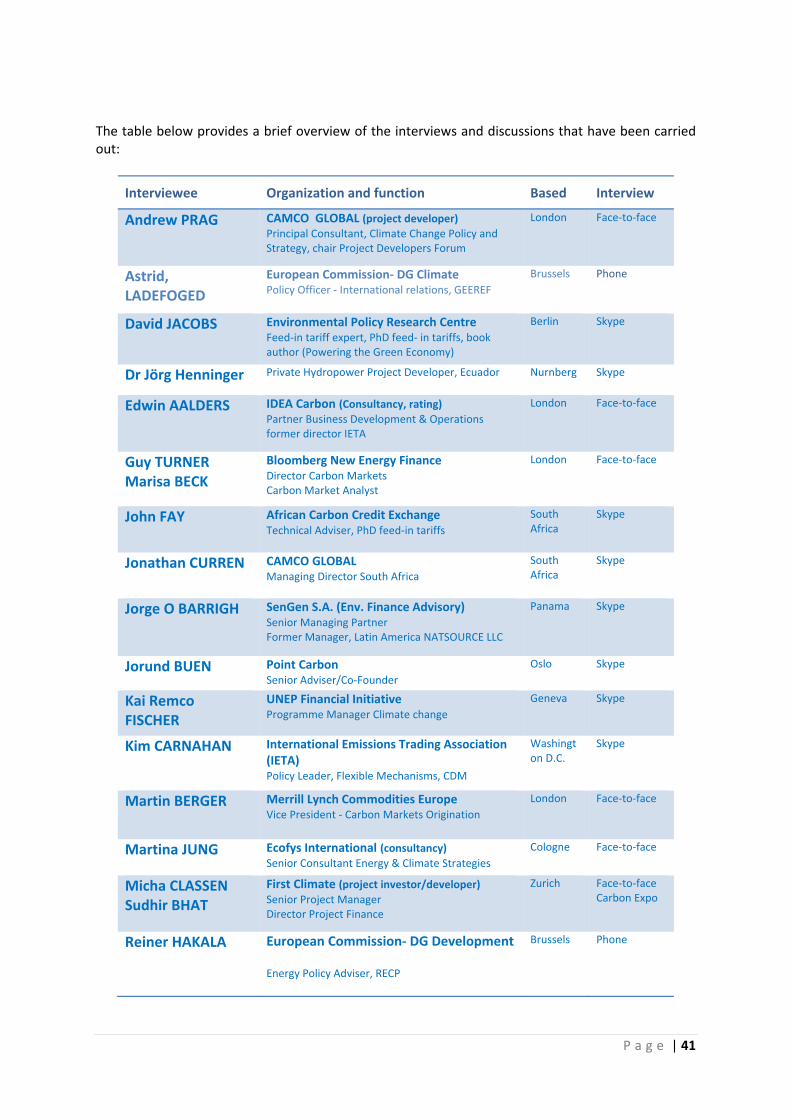
The table below provides a brief overview of the interviews and discussions that have been carried out:
Interviewee Organization and function Based Interview
Andrew PRAG CAMCO GLOBAL (project developer)Principal Consultant, Climate Change Policy and Strategy, chair Project Developers Forum
London Face‐to‐face
Astrid, LADEFOGED
European Commission‐ DG ClimatePolicy Officer ‐ International relations, GEEREF
Brussels Phone
David JACOBS Environmental Policy Research CentreFeed‐in tariff expert, PhD feed‐ in tariffs, book author (Powering the Green Economy)
Berlin Skype
Dr Jörg Henninger Private Hydropower Project Developer, Ecuador Nurnberg Skype
Edwin AALDERS IDEA Carbon (Consultancy, rating)Partner Business Development & Operations former director IETA
London Face‐to‐face
Guy TURNER Marisa BECK
Bloomberg New Energy FinanceDirector Carbon Markets Carbon Market Analyst
London Face‐to‐face
John FAY African Carbon Credit ExchangeTechnical Adviser, PhD feed‐in tariffs
South Africa
Skype
Jonathan CURREN CAMCO GLOBAL Managing Director South Africa
South Africa
Skype
Jorge O BARRIGH SenGen S.A. (Env. Finance Advisory)Senior Managing Partner Former Manager, Latin America NATSOURCE LLC
Panama Skype
Jorund BUEN Point CarbonSenior Adviser/Co‐Founder
Oslo Skype
Kai Remco FISCHER
UNEP Financial InitiativeProgramme Manager Climate change
Geneva Skype
Kim CARNAHAN International Emissions Trading Association (IETA) Policy Leader, Flexible Mechanisms, CDM
Washington D.C.
Skype
Martin BERGER Merrill Lynch Commodities EuropeVice President ‐ Carbon Markets Origination
London Face‐to‐face
Martina JUNG Ecofys International (consultancy)Senior Consultant Energy & Climate Strategies
Cologne Face‐to‐face
Micha CLASSEN Sudhir BHAT
First Climate (project investor/developer)Senior Project Manager Director Project Finance
Zurich Face‐to‐face Carbon Expo
Reiner HAKALA European Commission‐ DG Development
Energy Policy Adviser, RECP
Brussels Phone
P a g e | 42
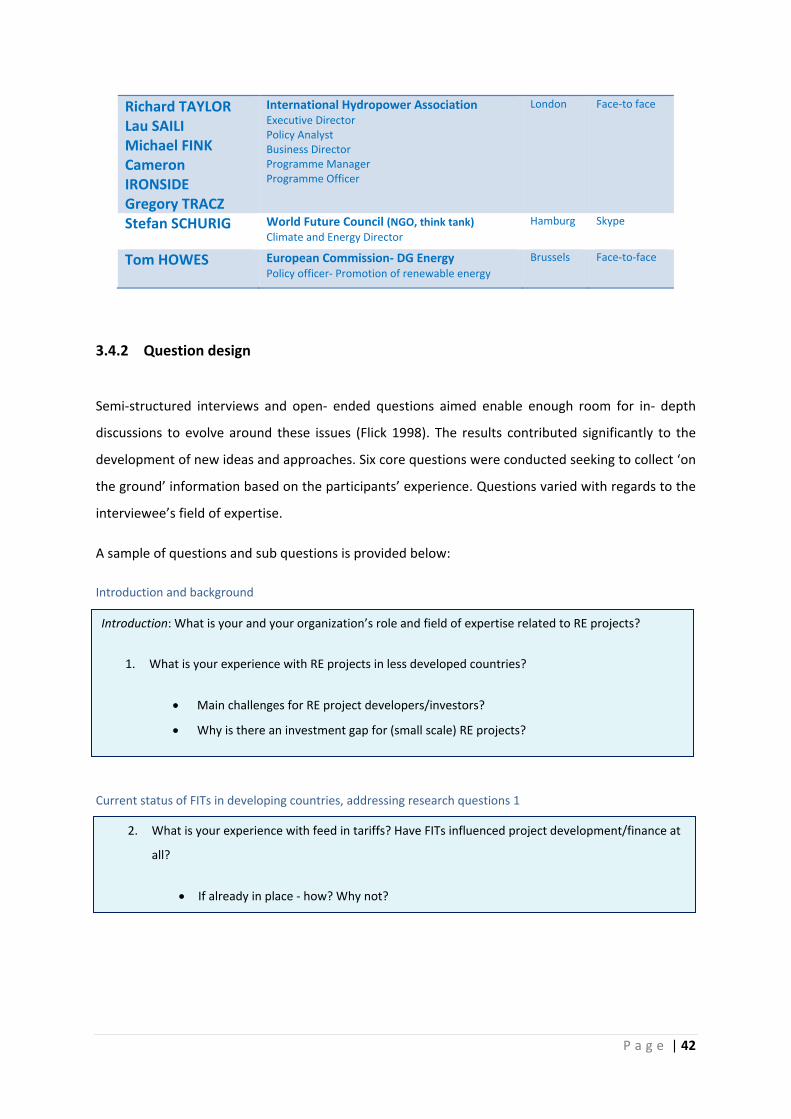
Introduction: What is your and your organization’s role and field of expertise related to RE projects?
1. What is your experience with RE projects in less developed countries?
• Main challenges for RE project developers/investors?
• Why is there an investment gap for (small scale) RE projects?
2. What is your experience with feed in tariffs? Have FITs influenced project development/finance at
all?
• If already in place ‐ how? Why not?
Richard TAYLOR Lau SAILI Michael FINK Cameron IRONSIDE Gregory TRACZ
International Hydropower AssociationExecutive Director Policy Analyst Business Director Programme Manager Programme Officer
London Face‐to face
Stefan SCHURIG World Future Council (NGO, think tank)Climate and Energy Director
Hamburg Skype
Tom HOWES European Commission‐ DG EnergyPolicy officer‐ Promotion of renewable energy
Brussels Face‐to‐face
3.4.2 Question design
Semi‐structured interviews and open‐ ended questions aimed enable enough room for in‐ depth
discussions to evolve around these issues (Flick 1998). The results contributed significantly to the
development of new ideas and approaches. Six core questions were conducted seeking to collect ‘on
the ground’ information based on the participants’ experience. Questions varied with regards to the
interviewee’s field of expertise.
A sample of questions and sub questions is provided below:
Introduction and background
Current status of FITs in developing countries, addressing research questions 1
P a g e | 43
3. What is the potential future role of feed‐ in tariffs and national policy to scale up investment in
renewable energy?
• What will be the main challenges?
4. Will NAMAs be able to provide a link between FITs/national policy and finance from the private
sector/carbon finance?
• Where do you see the main challenges for a NAMA?
• What alternatives are there to mobilize private sector money for national?
5. Your ‘crystal ball’: Which developments regarding the deployment of RE do you expect to happen
over the next 2‐ 5 years?
• What will be the future role of carbon finance and climate finance?
The future role of FITs, addressing research questions 2
Funding FITs, linking national policy and private sector money (in post‐2012), addressing research question 3
Outlook on developments of RE investment from the interviewee’s personal stand point (rather than how it
should be), addressing research question 4
3.4.3 Interview Analysis
Primary data gained from interview recordings was entered into an Excel table. Names of
interviewees were coded for confidentiality (transcriptions are therefore not attached). The content
of the interviews was analysed and clustered according to responses that:
a) directly addressed the research questions; and
b) provided additional commentary on ‘sub‐issues’ and information that was of value to the
discussion;
Key statements and information was then extracted and sorted according to relevance and topic.
Finally, experiences from stakeholders and key findings were linked to available literature. Trends
were identified, and potential opportunities for renewable energy finance and feed‐in tariffs in
developing countries were compared and analysed.
P a g e | 44
4 IN PERSPECTIVE: Renewable Energy Finance and Feed‐ in Tariffs in developing countries
The following Chapter summarizes the information collected from interviews with senior renewable
energy finance experts and project developers.
4.1 The start‐up finance gap
The interest in renewable energy (RE) projects in Africa is, as a developer notes, ‘ridiculous’ and
firms such as Standard Bank, the African Development Bank and many more are ‘standing in line’
looking for investment opportunities in renewable energy projects in the South Africa’ (CSZ, 18). An
interviewee from Latin America draws a similar picture (CSZW, 15) referring to funds that have
investment volumes of at least $100 million often targeting small scale RE projects in the range of $
1‐ 20 million (CSZW, 14) .
However, project finance in both regions generally faces the same problem: the lack of start‐ up
investment for early stage projects. Investors look for advanced projects ‘further down the line’
which have done their feasibility study, calculation of IRR (internal return of investment),
environmental assessment (EIA) and most important ‐ that have their power purchase agreement
(PPA) in place. These projects have reached a stage at which they can be presented to potential
investors (CSZ, 18; CSZW, 15). A financier emphasises the great interest in the regions, with the
investment community even willing to get involved at medium level returns but at this point it
comes down to high risk equity investment and chances to lose investment at once, i.e. in countries
like Kenya or Uganda, are just too high (CSR, 7; CSZ, 18).
At present countries such as South Africa seek therefore to attract the ‘big guys’, companies and
firms that have the capacity to finance projects internally, ‘on their balance sheets’ (CSZ, 22).
P a g e | 45
4.2 Challenging RE Policy – a developer’s perspective
Participants of projects brought up two basic concerns typically linked to projects which are briefly
be outlined below.
4.2.1 Domestic needs
The success of projects is directly linked to national, regional or local needs which have to be well
understood. First of all, explains a developer, forget ‘about the environmental perspective’! Most less
developed countries aim for – health, education, poverty reduction and economic development and
RE projects can only work if they can support that – if not they will take the second place’ (CSZ, 2).
Another interviewee adds that RE in developing countries has been mostly driven by the lack of
security of supply and high fuel prices, which makes RE generation as an alternative more attractive
(CSA, 11).
Three main requirements in terms of energy are described by a consultant (CSZ, 2):
• Quality of resource supply (large high tech plants need good supply)
• Constancy and consistency of supply and services
• Upgrading of transmission and distribution infrastructure (basis for good power quality)
A hydropower expert further highlights the importance to actually deliver quality of supply
emphasizing that storage of water and civil services have to be incentivized e.g. within a feed‐in
tariff framework (CSA, 1b). Especially benefits from hydropower plants including storage could fill
supply gaps; this is important to be understood by policy makers, adds a colleague (CSA, 3). Water
storage in connection with hydroelectric generation might in fact be able to address current issues
like those in Uganda, which overwhelmingly depends on hydropower: Five years ago rain and
therefore power supply used to be very predictable. Today, in contrast, rain patterns have changed
severely and hydropower has become very intermittent and unreliable – a problem that has
occurred in many developing countries with high shares of hydropower generation (CSZ, 3).
P a g e | 46
‘People in Latin America are among the most optimistic people on the planet. They love happy
endings and believe things will always be better tomorrow. Therefore you will find the
willingness to plan ahead boldly but following through is the problem’
Interview CSWZ, 24
4.2.2 National leadership and coordination
Issues occurring from lack of institutional capacity and knowledge, missing willingness to follow up
policy and to coordinate activity on part of regulatory bodies and of law makers are omni‐present
and have been mentioned by project stakeholders in Africa, Asia and Latin America (CSE, 5).
A senior analyst believes the weak institutional framework to be one of the major problems in less
developed countries, which will always have to be faced by projects. ‘Why would a developer trust in
local institutions and long‐ term policy such as feed‐in tariffs’, he asks (CSZE, 4). Generally very short‐
term horizons of governments make academic solutions difficult and after all they might never be
implemented (CSWZ, 3).
Governments, especially in Latin America, tend to be very centralized and typically hold a lot of
power. Thus the success of a project might be directly linked to the interest of a ruling entity. A
project needs to be well in line with its own objectives and with those from the ‘guys holding the
power’ such as the environmental agencies or ministries, explains a consultant. Current examples
are Ecuador, where ‐ in spite of massive power shortages ‐ the socialistic president has created
hostile conditions for private RE investors (see example 4.3.3 below) or a country in Central America
where 250MW of RE where successfully auctioned but the types of concessions strongly reflected
personalities of people in power at that point (CSN, 2; CSWZ, 1)
In terms of developing a project in these conditions one finds that there tends to be more than
one gate available at any time, but usually only a restricted number of gate keepers or key holders
Interview CSWZ, 11
P a g e | 47
However, all stakeholders underline the importance of effective and efficient national policy. In
terms of investment decisions future cash flows will need to be justified and in ‘my experience’, says
a senior expert in RE finance, ‘it comes down to certainty and the investment climate’ (CSZW,11).
Risk is the prime element that keeps investors out of developing countries (CSE,1) and developers
will therefore pin it down to credit worthiness of the counterparty, the policy framework and guiding
policy (CSSZ, 6), closely checking whether contracts reflect these concerns (CSS,7).
Renewable energy projects have payback times of 10‐20 years. Policy in developing countries might
be planned and enforced by average for 2 years which are considerably unattractive conditions for
investment. Projects need long term stability of rules and mechanisms that guarantee a feasible
additional source of money, as a project developer makes clear. In order to absorb private and
public money economics of projects have to be improved to make them bankable and financially
viable. Thus additional support such as feed‐in tariffs is needed (CSS, 8).
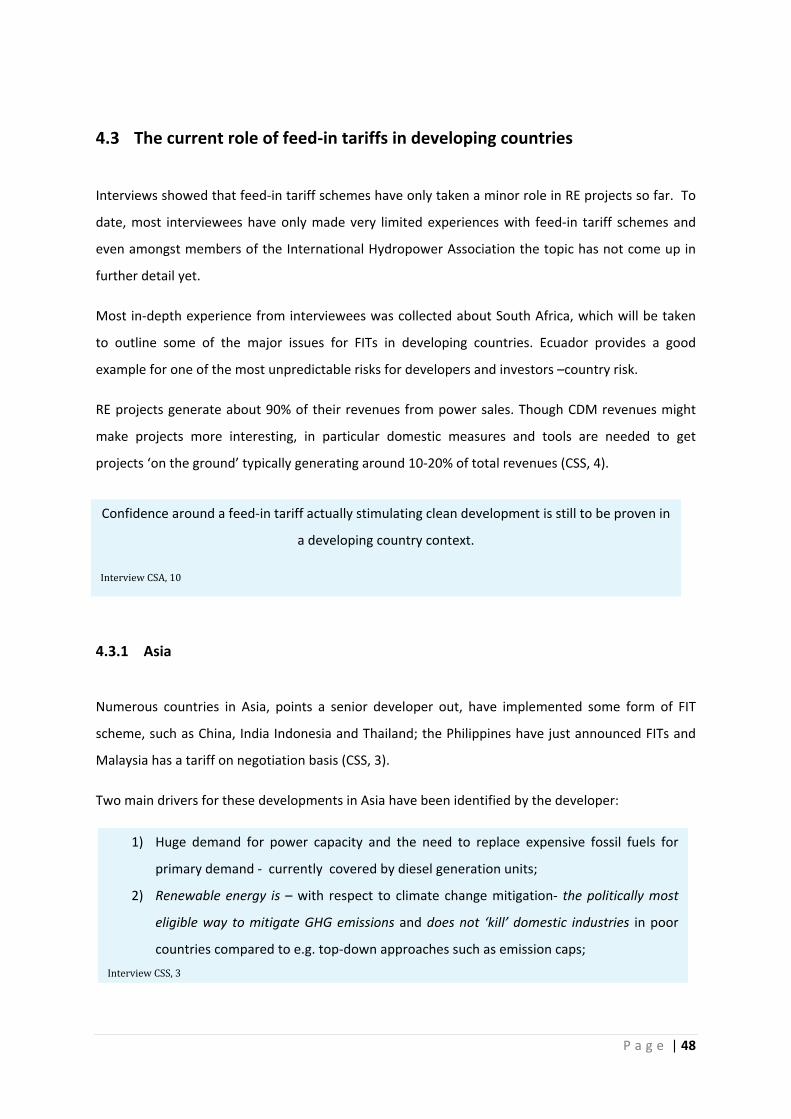
P a g e | 48
Confidence around a feed‐in tariff actually stimulating clean development is still to be proven in
a developing country context.
Interview CSA, 10
1) Huge demand for power capacity and the need to replace expensive fossil fuels for
primary demand ‐ currently covered by diesel generation units;
2) Renewable energy is – with respect to climate change mitigation‐ the politically most
eligible way to mitigate GHG emissions and does not ‘kill’ domestic industries in poor
countries compared to e.g. top‐down approaches such as emission caps;
Interview CSS, 3
4.3 The current role of feed‐in tariffs in developing countries
Interviews showed that feed‐in tariff schemes have only taken a minor role in RE projects so far. To
date, most interviewees have only made very limited experiences with feed‐in tariff schemes and
even amongst members of the International Hydropower Association the topic has not come up in
further detail yet.
Most in‐depth experience from interviewees was collected about South Africa, which will be taken
to outline some of the major issues for FITs in developing countries. Ecuador provides a good
example for one of the most unpredictable risks for developers and investors –country risk.
RE projects generate about 90% of their revenues from power sales. Though CDM revenues might
make projects more interesting, in particular domestic measures and tools are needed to get
projects ‘on the ground’ typically generating around 10‐20% of total revenues (CSS, 4).
4.3.1 Asia
Numerous countries in Asia, points a senior developer out, have implemented some form of FIT
scheme, such as China, India Indonesia and Thailand; the Philippines have just announced FITs and
Malaysia has a tariff on negotiation basis (CSS, 3).
Two main drivers for these developments in Asia have been identified by the developer:
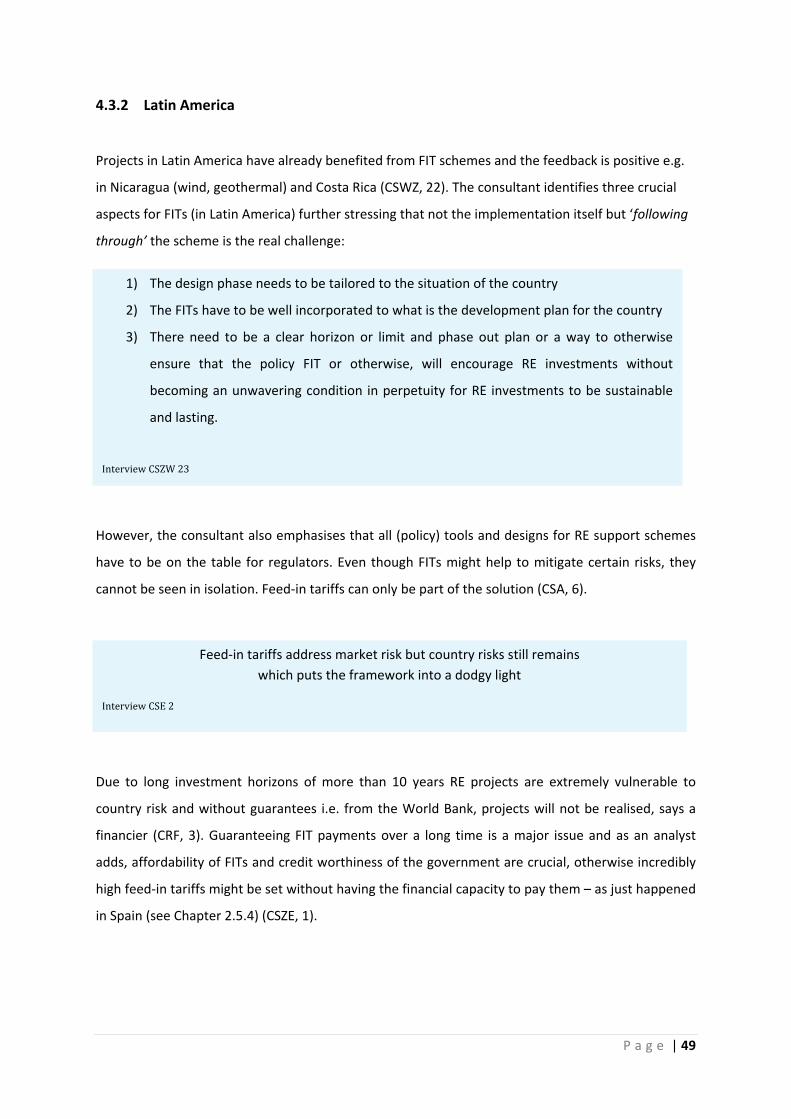
P a g e | 49
1) The design phase needs to be tailored to the situation of the country
2) The FITs have to be well incorporated to what is the development plan for the country
3) There need to be a clear horizon or limit and phase out plan or a way to otherwise
ensure that the policy FIT or otherwise, will encourage RE investments without
becoming an unwavering condition in perpetuity for RE investments to be sustainable
and lasting.
Interview CSZW 23
4.3.2 Latin America
Projects in Latin America have already benefited from FIT schemes and the feedback is positive e.g.
in Nicaragua (wind, geothermal) and Costa Rica (CSWZ, 22). The consultant identifies three crucial
aspects for FITs (in Latin America) further stressing that not the implementation itself but ‘following
through’ the scheme is the real challenge:
However, the consultant also emphasises that all (policy) tools and designs for RE support schemes
have to be on the table for regulators. Even though FITs might help to mitigate certain risks, they
cannot be seen in isolation. Feed‐in tariffs can only be part of the solution (CSA, 6).
Due to long investment horizons of more than 10 years RE projects are extremely vulnerable to
country risk and without guarantees i.e. from the World Bank, projects will not be realised, says a
financier (CRF, 3). Guaranteeing FIT payments over a long time is a major issue and as an analyst
adds, affordability of FITs and credit worthiness of the government are crucial, otherwise incredibly
high feed‐in tariffs might be set without having the financial capacity to pay them – as just happened
in Spain (see Chapter 2.5.4) (CSZE, 1).
Feed‐in tariffs address market risk but country risks still remains which puts the framework into a dodgy light
Interview CSE 2
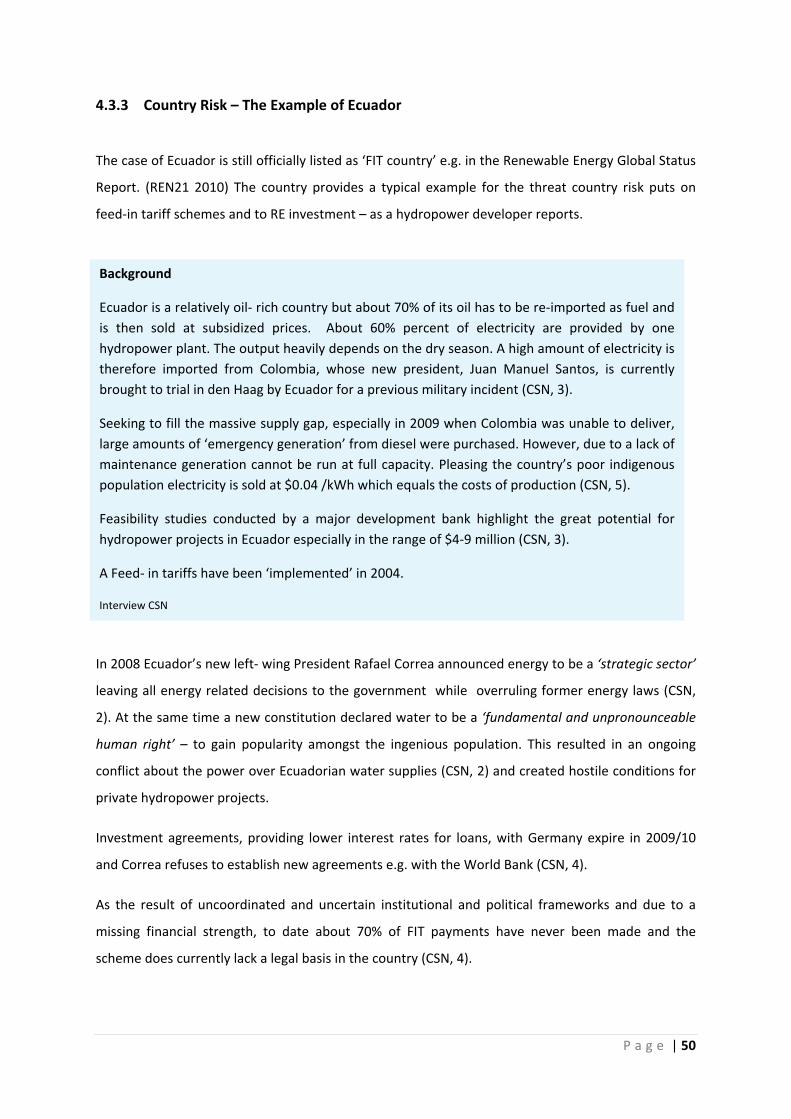
P a g e | 50
4.3.3 Country Risk – The Example of Ecuador
The case of Ecuador is still officially listed as ‘FIT country’ e.g. in the Renewable Energy Global Status
Report. (REN21 2010) The country provides a typical example for the threat country risk puts on
feed‐in tariff schemes and to RE investment – as a hydropower developer reports.
In 2008 Ecuador’s new left‐ wing President Rafael Correa announced energy to be a ‘strategic sector’
leaving all energy related decisions to the government while overruling former energy laws (CSN,
2). At the same time a new constitution declared water to be a ‘fundamental and unpronounceable
human right’ – to gain popularity amongst the ingenious population. This resulted in an ongoing
conflict about the power over Ecuadorian water supplies (CSN, 2) and created hostile conditions for
private hydropower projects.
Investment agreements, providing lower interest rates for loans, with Germany expire in 2009/10
and Correa refuses to establish new agreements e.g. with the World Bank (CSN, 4).
As the result of uncoordinated and uncertain institutional and political frameworks and due to a
missing financial strength, to date about 70% of FIT payments have never been made and the
scheme does currently lack a legal basis in the country (CSN, 4).
Background
Ecuador is a relatively oil‐ rich country but about 70% of its oil has to be re‐imported as fuel and is then sold at subsidized prices. About 60% percent of electricity are provided by one hydropower plant. The output heavily depends on the dry season. A high amount of electricity is therefore imported from Colombia, whose new president, Juan Manuel Santos, is currently brought to trial in den Haag by Ecuador for a previous military incident (CSN, 3).
Seeking to fill the massive supply gap, especially in 2009 when Colombia was unable to deliver, large amounts of ‘emergency generation’ from diesel were purchased. However, due to a lack of maintenance generation cannot be run at full capacity. Pleasing the country’s poor indigenous population electricity is sold at $0.04 /kWh which equals the costs of production (CSN, 5).
Feasibility studies conducted by a major development bank highlight the great potential for hydropower projects in Ecuador especially in the range of $4‐9 million (CSN, 3).
A Feed‐ in tariffs have been ‘implemented’ in 2004.
Interview CSN
P a g e | 51
1) FITs for technologies/ projects with prices below avoided costs and a few MW of solar/PV to stimulate and entrust investment;
2) Restructuring the FIT, adaption to rural electrification program, grid extension, Problem: single buyer of electricity in rural/off‐ grid areas;
3) Identify mitigation funds etc. to cover large scale RE and more expensive
technologies/projects; Interview CSZ, 11
4.3.4 Africa
One interviewee is currently actively involved in developing feed‐in tariffs in Africa particularly in
Uganda. Calculations from an ‘avoided cost model’ (see Terms o Reference for avoided costs)
revealed that levelized costs (see Appendix 2) for some renewable technologies happen to be below
avoided costs and subsidies for them are only required to a limited extend. In case of technologies
such as CSP, solar and PV, in fact, additional RE on the grid would still lead to increased electricity
prices (CSZ, 1). RE technologies below avoided costs (‘low hanging fruits’) could realistically be
brought online on its own in countries such as Uganda. The country could then find donor money i.e.
from climate finance, to supplement more expensive technologies such as solar bringing them down
below avoided cost levels, where they can mostly be financed domestically without significant
increases in electricity prices (CSZ, 5).
The ‘avoided cost proposal’ for FITs in includes three phases:
The intentions to develop FITs has further been expressed by Botswana and Zambia (CSZ, 5; CSEL, 3).
4.3.5 ESKOM ‐ Referee and Player: The Case of South Africa
In 2009 the Africa's National Energy Regulator (NERSA) used its mandate to announce the
implementation of a feed‐in tariffs scheme called REFIT. A number of interviewees provided
detailed information about ongoing issues with REFIT in South Africa. Some of the Issues mentioned
are likely to be faced in other developing countries as well.
P a g e | 52
Energy Monopolies
In many developing countries energy is usually provided by state owned utility companies that take
monopolistic positions in the market and tend to be inefficient and reluctant to innovative
approaches (CSEL, 4). In the case of South Africa this monopoly is held by ESKOM. REFIT was
implemented by NERSA despite strong resistance from ESKOM (CSZ, 1) which is ‘the bully on the
block’ and tries both to remain control and to keep new competitors out of the monopolized market
(CSZ, 4; CSEF, 2). The monopoly of ESKOM has lead to a paradox situation: The company currently
takes the position of ‘referee and player’ at the same time. ESKOM might develop RE projects itself;
as the only power supplier/distributor it is further the entity to issue power purchase agreements
(PPAs) and to buy electricity from new independent power producers ( CSZ, 1). This is currently done
by the single buyer’s office within ESKOM. In order to ensure the well‐functioning of REFIT, the
creation of a new independent system operator needs to take priority (CSZ, 1, 14).
RE generation from wind is highly competitive in South Africa and many projects have been picked
up by independent power producers. Nevertheless, there is currently only one off‐taker in South
Africa and that is ESKOM, which lacks any interest to off‐take electricity from potential competitors –
consequently not a single project has found an off‐taker yet (CSEF, 2, 3)
Capacity
Compared to other developing countries South Africa has an exceptional big grid which is capable to
relatively easily absorb costs even of more expensive on‐grid technologies such as CSP and solar
(CSZ, 5; CSEL, 4).
However, ESKOM had put pressure on low RE capacity caps established at 400‐ 500 MW. About
3000 MW of potential wind capacity is under development, another 7000 MW is under
consideration. A senior expert is confident that those developments are likely to require new grid
connections at some point and due to low caps there will be ‘many disappointed developers’ not
benefiting from REFIT at all (CSZ, 11)
Funding
Funding is the ‘weakest link in the chain’ (CSZ, 14). According to two interviewees – ‘there was never
any money in place to pay for REFIT’ and not a single payment has been made nor have any purchase
power agreements been issued. (CSEL, 10; CSZ, 16) ESKOM, which lacks financial wealth, has
officially announced that it will ‘not sign any PPA until funding is identified’ (CSEL, 10).

P a g e | 53
Feed‐in tariffs can be a very effective tool. However, they have to be considered as one of all available tools. FITs provide one little piece of the puzzle towards ensuring that renewable
energy can become a larger part and can reach the optimal level in the energy matrix for any given country.
Interview CSZW, 10
You cannot get to religious about solutions in developing countries and FITs are not a panacea but they might be a long‐term way to mature the (RE) market by incentivizing and delivering
services required Interview CSA 2, 5
Whether REFIT might ever be funded through consumer prices as originally planned is considerably
unsure: After years of heavily subsidized electricity prices ESKOM seeks to raise electricity rates for
consumers significantly by about 25‐35% within the next years –potential REFIT rates not included
(CSEL, 4, 10) (CSZ, 16).
4.4 FIT for a renewable energy future in developing countries?
With the exception of one, all interviewees perceived feed‐in tariff schemes as potentially good
mechanisms for the scale up of RE in developing countries. Nevertheless, it was highlighted that
conditions for FIT schemes have to be right and many issues such as the long‐term funding remain
unsolved at this point.
Recent experience with FITs such as from South Africa has outlined many issues and interviewees
are generally careful with regards to of the forecast of feed‐in tariffs. How do we get intelligent FITs
asks one interviewee (CSA, 2)? Another one notes that in order to make investment attractive FITs
will have to be designed in a clever way to avoid under‐ or over subsidizing (DSFZ, 11). An expert
involved in RE finance policy states that in order to leverage private sector investment, risk
mitigation instruments alongside a FIT scheme will be needed, which could be financed from public
resources (CSE, 12).
Quotes from two senior experts summarize the overall perception of FITs well:
P a g e | 54
Throughout the discussions a couple of issues concerning potential FITs schemes have been brought
up which will briefly be discussed below.
4.4.1 Mini‐grid and off‐ grid solutions
One interviewee from a NGO emphasized the importance to put micro scale (rural) solar generation
and low carbon cooking stoves in place which could be potentially supported by FITs in the long term
(CSSZ, 1). Another interviewee agrees upon the great benefits of localized RE generation adding that
once a reasonable IRR for investment is in place financers will come in as well (CSEL, 6).
A central issue often brought up in the discussion is the fact that rural electrification is usually linked
to grid extension. Mini‐grid and off‐grid projects are complex and expensive and should therefore be
focused at a later stage, once first experience has been gained. A Senior developer, points out that
even though the structuring of rural feed‐in tariffs have to kept in mind, renewable energy projects
and FITs have to go for the ‘low hanging fruits’, less – cost intensive projects/technologies close to
the grid first. This enables the creation of track records and RE capacity (CSZ, 10) thereby driving RE
technologies down the cost curve.
4.4.2 Funding feed‐in tariffs schemes
The lack of funding for feed‐in schemes in developing countries is seen as a crucial problem and all of
the participants highlighted the need to bring‐in donor money such as Official Development
Assistance (ODA) or climate finance at some point. In the case of South Africa, might absorb costs for
less expensive RE technologies by itself, FIT funding could be provided for capital‐intensive
technologies such as PV (CSZ, 15).
ODA, however, is a political instrument that as one interviewee puts it is ineffective and inefficient in
terms of transformation which is exactly what is needed for a low carbon future. Private sector
money is important because it drives transformation (CSE, 11).
Donors of climate finance (ODA) will make very sure to maintain control over their money holding
developing countries accountable for how they spend it (CSV, 14, 15; CSFZ, 10), this might conflict
with a long‐term FIT fund which will have to be fed with considerable amounts of capital over a long
time.
P a g e | 55
The total amounts that need to be distributed into a FIT fund over a period of roughly 20 years
appear huge. Massive one‐time payments are politically difficult to justify and it is more likely that
such a fund might be fed by sponsors on a regular basis (CSD, 2, 4). A FIT or GET FIT Fund could be
financed by existing funds i.e. of the World Bank and through money received from climate finance
or by a new UNFCCC financial mechanism which is currently under negotiation (CSE, 4). Such a FIT
Fund could then be managed by the UNFCCC (CSE, 10) or, as a NGO proposed, by the new
International Renewable Energy Agency (IRENA) which in contrast to the World Bank has an ‘one‐
vote‐ per‐ member‐country’ system and will therefore get broader acceptance from developing
nations (CSSZ, 8).
4.5 NAMAs and FITs in a post‐Kyoto framework
Feed‐ in tariff schemes in developing countries will in most cases require financial support from
donor countries as previous chapters have outlined (e.g. 4.2.2.). A Feed‐in tariff fund or scheme
might well fit into the ‘mechanism’ or ‘concept’ of a National Appropriate Mitigation Action (NAMA).
NAMA funding could address, as an analyst says, a developing country’s ‘threshold of affordability’: A
country could aim to reach a RE target e.g. of 10% by itself going for less expensive RE technologies
first, whereas NAMA funding could help to cover more expensive RE technologies and projects
(CSZE, 5). A FIT scheme itself could be measure eligible under a NAMA ‐ supported on an
intergovernmental level (CSFZ, 7).
Two analysts equally argue that though being nothing define yet and currently meaning everything
to everybody, the ‘image ‘ of NAMAs do lack the private sector element since they are meant to be
financed through climate finance (CSFZ, 7; CSWZ, 12). Another developer very clearly shares these
concerns (CSS, 2).
In order to include the private market, a logical link to numbers and measuring actions (e.g.
emissions reductions) has to be found. How can carbon reductions be measured from capacity
building or a feed in tariff scheme (DSVZ, 4)? A financier underlines that some kind of asset and a
market where it can be traded has to be created. Demand for potential credits does currently only
exist in the EU, he adds. NAMAs will further need (risky) upfront finance which is unlikely to be
provided by the private sector (CSF, 7).
P a g e | 56
Any time I mention NAMAs to anybody who is seriously in business they roll their eyes and I lose their attention rather quickly. So unless I am willing to risk all the activities or proposals I may have put in front of them for consideration, at this time I cannot take NAMAs to the board of
directors and be taken seriously.
Interview CSWZ, 12
1) Immediate reductions with a commercial dimension e.g. from fossil fuel generation; applicable for carbon crediting mechanism such as the CDM
2) Commercially motivated but not leading to immediate reductions; investing in development rather than in deployment e.g. research using plankton to generate energy; applicable for NAMAs
Interview CSE, 9)
In terms of mitigation actions one interviewee outlines two basic types of emissions reductions
pointing out which role the CDM (private sector) and NAMAs (intergovernmental) could take (CSE,
9):
Depending on whether the international community will reach agreement on a post‐Kyoto
agreement and if a climate bill will be passed in the United States (DSVZ, 6) NAMAs might eventually
be implemented by 2012, says one rather optimistic interviewee (CSF, 7). An analyst projects that
the ‘concept of NAMAs will manifest within the next 3 years and might be first implemented and
operational in about 5 years from now (CSV, 10).
However, a quotation by a consultant summarizes well how the business community currently
perceives NAMAs:
P a g e | 57
4.6 CRYSTAL BALL: Predictions about the direction of RE finance in Latin America and Africa
Looking into their ‘crystal ball’ interviewees were asked for their prediction towards future
development of RE in Africa and Latin America. The overall feedback was considerably optimistic.
An analyst noted that Latin America is likely to attract more RE investment due to a generally
‘business‐ friendly’ environment (CSV, 4). Another consultant breaks it down to countries:
RE investment will continue in Chile, stabilize and increase in Brazil; he expects huge expansion in
investment in Peru, Colombia and a continuous positive trend in Panama; RE will continue to grow in
Costa Rica and surprisingly in Nicaragua and El Salvador, a bit less growth will take place in
Honduras; huge potential without seeing how it could be exploited in the Dominican Republic;
Mexico will continue at same pace but not as robust. His bright ‘stars’ however are Peru and
Columbia due to recent RE policy initiatives (CSWZ, 16).
Africa, projects an analyst, will benefit from a international post‐Kyoto agreement: ‘Whatever you do
there is the likelihood that your efforts will be recognized’ (CSV, 5). However, he adds, though Africa
will be a safe bet for the period post‐2012, it will not get flooded by investment within the next five
years. The region will be attractive in the mid‐ to long term due to its increasing demand for energy
(CSV, 6).
Unless the ‘whole (climate) package and funding mechanisms’ will be implemented says a consultant
we will not see any major change within the next five years in Africa (CSEL, 8).
A financier clearly sees FITs as a NAMA to be implemented in the long term (CSV, 11) and another
senior policy maker predicts good chances for a FIT fund in the context of NAMAs. The concept of a
Global Fund, he concludes, has finally made its way into the footnotes of the climate change
negotiations and has experiences continuous support ever since (DSSZ, 7).
P a g e | 58
5 KEY FINDINGS
RE projects in developing countries
• Renewable energy projects in Africa and Latin America enjoy significant interest from
investors which ‘stand in line’ waiting for investment opportunities; However, there is a lack
of ‘start up money’ and high risk equity finance is needed to get projects of the ground;
(CSZ,18,22; CSZW,15);
• Risk is the prime element and investment will always come down to certainty of return and
quality of the investment climate; Weak institutional frameworks and short‐ term
government horizons are considered to be major problems in finding long‐ term policy
solutions (CSZW, 11; CSE, 1; CSS, 7);
FITs in developing countries
• FIT schemes have only taken a minor role in RE projects so far due to the ‘immaturity’ of
schemes that have been implemented within the last 5 years; ‘Confidence around a feed‐ in
tariff is still to be proven in a developing country context’(CSS, 4; CSA, 10);
• FITs help to mitigate certain risks but cannot be seen in isolation, they are part of the
solution; affordability and credit worthiness of the government are crucial to guarantee
long‐ term payments; country risk is a major barrier to FITs (CSZW, 23; CSA, 6; CSZE, 1; CSN,
4);
• Power monopolies as they exist in many developing countries often slow down the
implementation and constrain the operation of FIT schemes; In the case of South Africa,
ESKOM is the ‘referee’ (single buyer, FIT payments) and ‘player’ (utility) at the same time
(CSEL,4; CSZ,1,14);
• Funding of FITs is the ‘weakest link in the chain’ initializing RE schemes in developing
countries; South Africa has not identified funding for FITs yet nor has a single payment been
made; Funding through electricity revenues is unlikely due to rising electricity prices (CSEL,4;
CSZ,14);
P a g e | 59
• Levelized costs for certain renewable technologies (see ANNEX 2) (excluding CSP, solar PV)
are, in some countries, below ‘avoided costs’ due to high fossil fuel prices. FITS for RE
technologies and projects below avoided costs might be mostly funded by the country itself.
Those projects should be put online first; Feed‐ in tariffs from expensive RE technologies
such as CSP or PV that lead to increased costs on the grid (above avoided costs) require
significant amounts of donor money since they cannot be funded domestically (CSZ,5);
However, avoided costs are country specific and can be high e.g. in South Africa: bringing
200‐300MW wind online, avoided costs might still sum up to £100 million/ annually (CSZ,
24).
The potential role of FITs
• Risk mitigation instruments from public finance mechanisms are needed alongside FIT
schemes in order improve risk‐ return profiles (CSE, 12);
• FITs are not a panacea but might be a long‐ term way to mature the RE market by
incentivizing and delivering energy service required; All tools have to be available‐ and FITs
are one of them (CSE, 12; CSZW, 10);
• A FIT scheme or a ‘FIT Fund’ could be financed through existing funds i.e. from the World
Bank but likely from climate finance channelled through a new UNFCCC mechanism and
managed by the UN or by IRENA (CSE, 4);
• FITs will have to target rural electrification addressing mini‐ grid and off grid solutions.
However, FITs have first to address less expensive technologies and projects close to the
grid in order to create records and RE capacity while driving down the costs of RE
technologies (see ANNEX 2, RE costs) (CSZ, 10; CSSZ, 1);
P a g e | 60
FITs as National Appropriate Mitigation Action (NAMA) in post‐ 2012
• NAMAs are not defined yet but will probably be funded primarily on a government‐ to
government level through donor money and climate finance; concerns have been expressed
about a lack of private sector involvement since assets e.g. in the form of emissions
reductions, and a market have to be created first. A fundamental problem is how to
‘measure’ impacts of capacity building, FIT policies, etc (CSFZ, 7; CSZW, 12; CSS, 2,DSVZ,
4,CSF, 7);
• NAMA funding could address a country’s ‘threshold of affordability’ for actions or measures
that are too capital intensive to be financed a by country on its own. Measures seek to meet
a developing country’s voluntary (‘no‐loose’) emission reductions or renewable energy
target (CSFZ, 7; CSZE, 5);
• The concept of NAMAs might crystallise within the next 3 years and be implemented and
operational in about 5 years (CSV, 10);
The Crystal Ball– Predictions about the direction of RE finance in developing countries
• Latin America will attract reasonable investment in renewable energy over the next 5 years;
this is due to its business friendly tendencies and recent initiatives to promote renewable
energy. The ‘shining stars’ are Colombia and Peru (CSWZ, 16; CSV, 4);
• Though Africa will be favoured by a post‐ Kyoto agreement and current RE projects will be
‘recognized’ within such a framework further developments will strongly depend on
multilateral finance mechanisms under the UNFCCC (climate finance); Africa is unlikely to
see large scale investment within the next five years but will attractive investment over the
mid‐ and long term (CSEL,8; CSV, 5,6);
P a g e | 61
6 DISCUSSION
In the last two years renewable energy has seen the highest global financial investment ever (UNEP
2010). A global shift towards renewable energy is evident (REN21 2010). Capital, however, competes
at a global level(Hamilton 2010) and considerably low investment figures clearly show that Africa
and Latin America have failed to provide transparency, longevity and certainty, i.e. an attractive
investment climate (DB 2009; UNEP 2010). Indeed, current statistics are unable to show that
investors are in fact waiting ‘at the sidelines’ and looking for relatively secure investment
opportunities (CSZ, 18). In many cases the availability of capital has been less of a problem than the
absence of good conditions to ‘unlock’ capital (Hamilton 2010). However, the lack of equity finance
for early stage projects in developing countries is significant (CSZW, 15).
Renewal energy projects have to face various issues and barriers. Weak institutional infrastructures,
inconsistent governments and policies, lack of grid capacity or missing off‐takers for electricity all
contribute to high risks and low returns (DB 2010, Chatham House 2009; CSE, 5). All these barriers –
have to be faced in addition to which is considered to be the ‘the weak link in the chain’ in
developing countries– the long‐term funding of FIT payments (CSZ, 14; CSEL, 10; WFC 2009; DB
2010).
Although feed‐in tariff schemes have proven to be highly effective in most industrialized countries,
(DB 2010; EC 2008) FITs have thus far taken a minor role in RE projects in poorer countries (CSS, 6;
CSFZ, 1). In fact, most FIT schemes have been implemented within the last 5 years (REN21 2010) and
experience from South Africa or Ecuador indicates that ‘confidence around a feed‐ in tariff is still to
be proven(CSA, 10).
In line with most interviewees one senior expert noted that, though feed‐in tariffs might be a good
long‐term solution they ‘are not a panacea’. Developing countries will also require additional
solutions (CSA, 2). Indeed, FITs have to be one of many available tools and cannot be seen in
isolation (CSZW, 10). However, short‐ term government horizons in most developing countries make
long‐ term policy solutions such as feed‐in tariffs difficult (CSZW, 11; CSE, 1; CSS, 7).
In order to attract capital, risk mitigation instruments, especially covering country risks, are
essential. Public and private risk mitigation mechanisms combined with strong efforts to provide the
right institutional framework will be essential to attract required investment through a feed‐in tariff
scheme in developing countries (DB 2010, Hamilton 2010, Mendonca et al. 2010; CSE, 4, 12; CSV, 14,
15; CSFZ, 10).
P a g e | 62
The absence of a definition for National Appropriate Mitigation Actions (NAMAs) casts ‘NAMAs’ in a
‘dodgy’ light (Ecofys 2010). However, it is likely that NAMAs will be implemented to distribute
climate finance and support FITs in developing countries. Feed‐in tariff schemes will, in most
countries, require additional funding from international sponsors e.g. to address rural electrification
and more expensive technologies (CSEL, 6; CSZ, 4). The affordability threshold for financing
additional renewable energy by a domestic FIT scheme could be bridged by a specialized ‘Global FIT’
or ‘GET FIT’ Fund which might be used to support NAMAs and to channel climate finance.
Financing FITs – the avoided cost model
Based on the GET FIT Program (DB 2010), information gained throughout this research especially
from Africa and potential ‘supported’ NAMAs a concept to finance a feed‐ in tariff scheme on the
basis of avoided costs will be briefly outlined below (CSZ, 11; Ecofys 2010; UNEP Risoe 2009),
The approach is very simplified, however, and only applies to certain countries (e.g. Uganda,
Botswana). It does not include the carbon market or risk mitigation considerations and needs to be
understood as a mid‐ to long term approach (see Figure 13, Annex 1). The indicated time in
particular in Phase 2 (fast motion) only points out potential developments e.g. degression for high
levelized RE costs. Figure 13 summarizes the idea.
Phase 1: First, a feed‐in tariff scheme ideally needs to address renewable energy technologies with
leveralized costs below avoided costs possibly hydro or wind with easy access to the grid. Those RE
technologies can mostly be funded by the country itself. Power Purchase Agreements from national
utilities will be crucial to provide investment security. Small capacities of ‘expensive’ technologies
i.e. PV and CSP should be included (ideally supporting local industry). Projects ‘on the ground’ will
create track records, which will then lead to bankable projects entrusting and stimulating investment
(CSZ, 10).
Capacity and technology caps ensure control over electricity prices (Mendonca et al. 2010). Slow
deployment, partly through ‘learning by doing’ in the beginning, will lead to capacity building and
familiarity with procedures among government entities and utilities and will ensure that the FIT
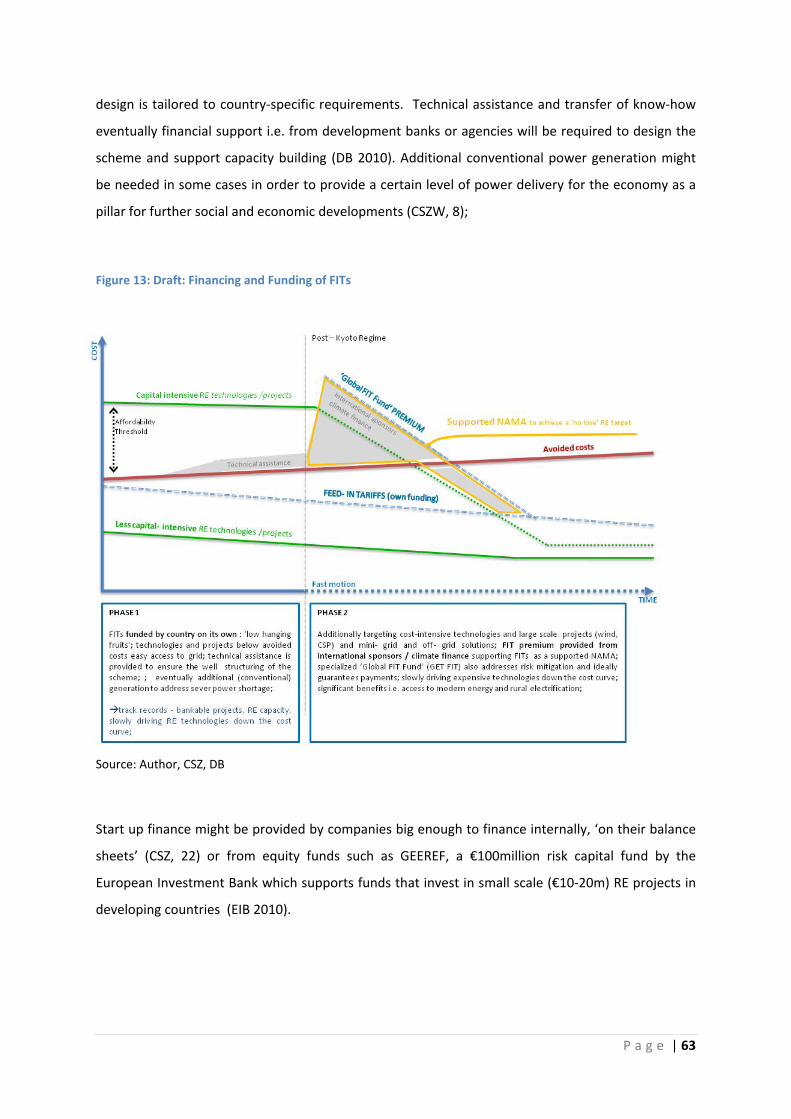
P a g e | 63
design is tailored to country‐specific requirements. Technical assistance and transfer of know‐how
eventually financial support i.e. from development banks or agencies will be required to design the
scheme and support capacity building (DB 2010). Additional conventional power generation might
be needed in some cases in order to provide a certain level of power delivery for the economy as a
pillar for further social and economic developments (CSZW, 8);
Figure 13: Draft: Financing and Funding of FITs
Source: Author, CSZ, DB
Start up finance might be provided by companies big enough to finance internally, ‘on their balance
sheets’ (CSZ, 22) or from equity funds such as GEEREF, a €100million risk capital fund by the
European Investment Bank which supports funds that invest in small scale (€10‐20m) RE projects in
developing countries (EIB 2010).
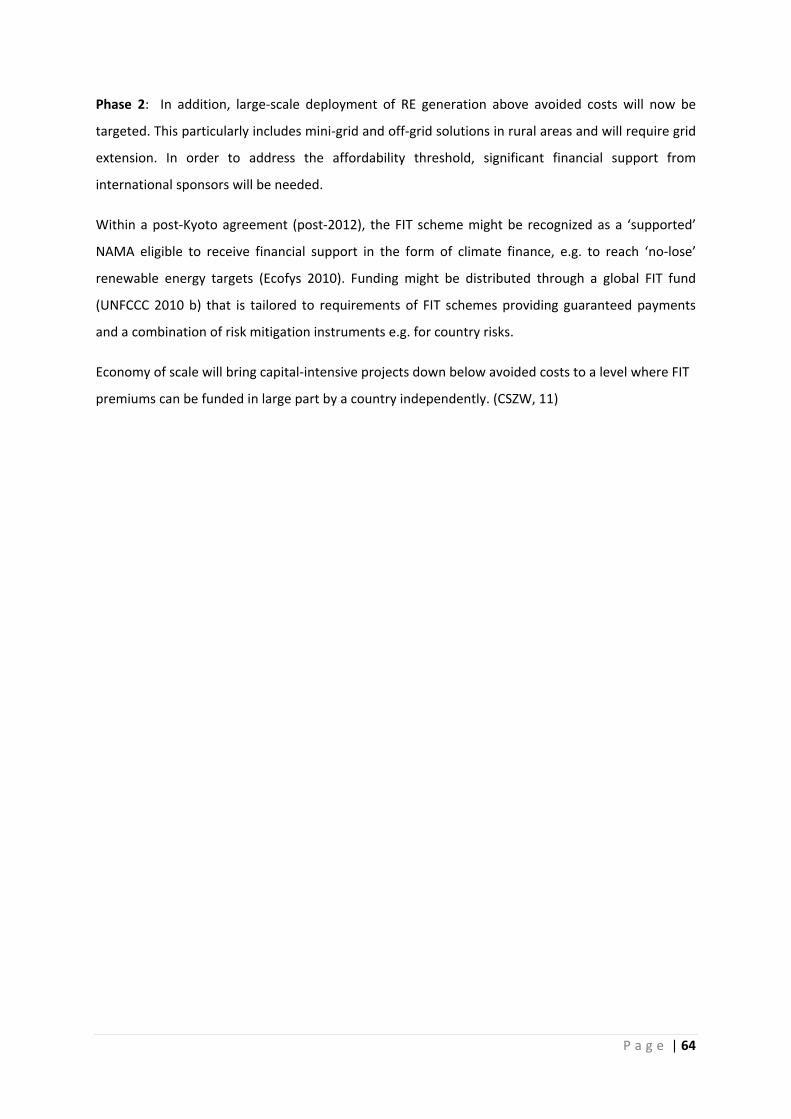
P a g e | 64
Phase 2: In addition, large‐scale deployment of RE generation above avoided costs will now be
targeted. This particularly includes mini‐grid and off‐grid solutions in rural areas and will require grid
extension. In order to address the affordability threshold, significant financial support from
international sponsors will be needed.
Within a post‐Kyoto agreement (post‐2012), the FIT scheme might be recognized as a ‘supported’
NAMA eligible to receive financial support in the form of climate finance, e.g. to reach ‘no‐lose’
renewable energy targets (Ecofys 2010). Funding might be distributed through a global FIT fund
(UNFCCC 2010 b) that is tailored to requirements of FIT schemes providing guaranteed payments
and a combination of risk mitigation instruments e.g. for country risks.
Economy of scale will bring capital‐intensive projects down below avoided costs to a level where FIT
premiums can be funded in large part by a country independently. (CSZW, 11)

P a g e | 65
7 CONCLUSION
Feed‐in tariff schemes have been implemented in more than 17 developing countries, most of them
within the last five years. The challenges and constraints for the incentive scheme in developing
nations is enormous, as the examples of Ecuador and South Africa show. As a consequence, most
feed‐in tariff schemes are currently unable to promote trust and secure investment required to
address the urgent ‘start‐ up’ equity finance gap for renewable energy projects in developing
countries.
Feed‐in tariff schemes are part of the solution but need to be complemented by risk mitigation
instruments, especially to cover high country risk, which guarantee the long‐term payment of FITs.
Even though it is unlikely that FITs will lead to new large capacities of electricity in the short‐term to,
they might be a mid‐to long term solution to stimulate larger RE capacities (CSP, wind) and especially
rural electrification including mini‐ and off‐grids.
The encouragement of investment in less cost‐intensive projects, accompanied by capacity building,
will create bankable projects and will provide a solid basis for the expansion of the feed‐in tariff
scheme. This process will take time.
In some developing countries, however, the cost of additional RE generation, such as from hydro,
has shown to be below avoided costs. Therefore, a large part of the financing could be sourced by
the country itself without a significant increase in electricity prices. International sponsors will be
needed in any case. A GET FIT or Global Feed‐in Fund (UNFCCC) could address the specific needs of
those schemes as part of supported National Appropriate Mitigation Actions (NAMAs) which will,
once clearly defined, channel climate finance into developing countries. However, the basis for any
distribution of climate finance will be an agreement on a post‐Kyoto regime setting a consistent
framework, which will encourage further actions in developing countries by governments and by the
private sector.
Further research needs to be conducted with regard to ‘avoided cost models’ (country specific), the
architecture of FITs for off‐grid and mini‐grid solutions and how climate finance might be efficiently
distributed to address FIT schemes in developing countries. After all, this will be fundamental in
addressing the essential concerns of developing countries: economic and social development and
the alleviation of extreme poverty.
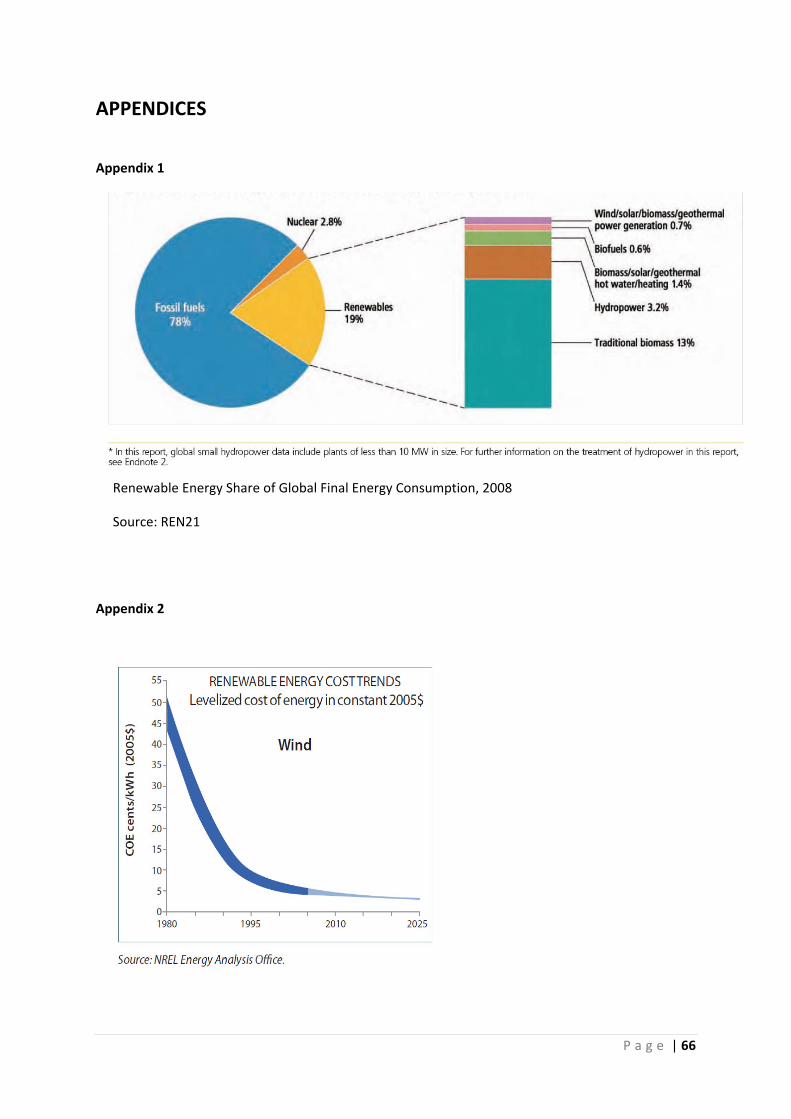
P a g e | 66
APPENDICES
Appendix 1
Appendix 2
Renewable Energy Share of Global Final Energy Consumption, 2008
Source: REN21

P a g e | 67
Appendix 3
Status of Renewables Technologies, Characteristics and Costs
Source: REN21

P a g e | 68
Appendix 4
Drafted Avoided Cost Model, NAMAs and Global FIT FUND
P a g e | 69
REFERENCES
Allianz (2009) “Public Private Cooperation for Climate Finance – The Financial Industry’s Perspective.” Symphosium Climate Finance. Berlin: Dr. Armin Sandhövel, Allianz Climate Solutions GmbH
ARE (2007) Renewable Energy Technologies for Rural Electrification. Brussels: Alliance for Rural Electrification
Blaxter et al., L., Hughes, C., Tight, M.(2007) How to research ‐ Third Edition. Bershire: Open University Press
Bloomberg (2010) “Spain Nearing Accord With Solar Producers on Reducing Subsidies.” 30 July 2010. http://www.bloomberg.com/news/2010‐07‐29/spain‐nearing‐plan‐to‐cut‐solar‐subsidy‐15‐extend‐payments‐three‐years.html (accessed August 15, 2010).
BNEF (2010) Crossing the Valley of Death ‐ Solutions to the next generation clean energy project financeing gap. London: Bloomberg New Energy Finance, 2010.
Point Carbon (2009) Point Carbon News, UN Defends CDM Rulings in China. Point Carbon News, July 27th 2009
Carnahan, K. (2010) interview by Damian Wagner. Phone conversation (18 August 2010).
Chatham House (2009) Private Financing of Renewable Energy ‐ A guide for policymakers. London: United Nations Environmental Programme (SEFI), Bloomberg New Energy Finance, Chatham House
Chingambo, Lloyd (2010) “Presentation: Catalyzing Carbon and Climate Finance for LCDs.” Carbon Expo 2010. Cologne
Chung, R. K. (2009) “Operationalizing a Bottom‐ Up Regime‐ Registering and crediting NAMAs.” In Climate Change ‐ Regulatory and Funding Strategies for Climate Change and Global Development, by R.B., Kingsbury, B., Rudyk, B. (ed) Steward, 179‐185. New York: New York University Abu Dhabi Institute
Couture, B., Gagnon, Y (2009) “An analysi sof feed‐in tariff remuneratio nmodels: Implications for renewable energy investment.” Energy Policy38 (2010), 2009.
DB (2010) GET FIT Program ‐ Global Energy Transfer Feed‐in Tariffs for Developing countries. New York: Deutsche Bank Climate Change Advisors
DB (2009) Global Climate Change Policy Tracker‐ The Green Economy: The Race is On. New York: Deutsche Bank Climate Change Advisors

P a g e | 70
DB (2009Paying for Renewable Energy: TLC at the Right Price. New York: Deutsche Bank Climate Change Advisors, 2009.
DeMartino et al., S., Le Blanc, D.(2010) Estimating the Amount of a Global Feed‐in Tariff for Renewable Electricity. United Nations, Division for Sustainable Development, DESA Working Paper No. 95
Denzin, N.K (1989) The Research Act (3rd edition). Englewood Cliffs: Prentice‐Hall, 1989.
EC (2008) The support of electricity from renewable energy sources. Brussels: European Commission, staff working document, SEC(2008) 57
Ecofys (2010) Nationally Appropiate Mitigation Actions ‐ Insights from example development. Cologne: Ecofys, Authors Jung et al, M., Vieweg, M., Eisbrenner, K., Höhne, N. Ellermann, C., Schimschar, S., Beyer, C.,
EIB (2010) GEEREF. 2010. http://www.geeref.com/ (accessed August 28, 2010).
Fell, H.J.(2009) Feed‐in Tariff for Renewable Energies:An Effective Stimulus Package without New Public Borrowing ‐ Significance of renewable energies in the current economic crisis. Berlin: Hans Josef Fell, Member of the German Bundestag
Flick, U. (1998) An introduction to qualitative research. London: Sage Publications Ltd
Flick, U.(1992) “Triangulation Revisited: Strategy of or Alterntative to Validation of Qualitative Data.” Journal for the Theory of Social Behaviour 22, 175‐97.
Greenpeace / EREC (2009) Energy [R]evolution ‐ A Sustainable Global Energy Outlook. European Renwable Energy Council (EREC), Greenpeace
Hamilton (2010) Scaling up Renewable Energy in Developing Countries: Finance and investment perspectives. London: Chatham House and Bloomberg New Energy Finance
He et al., G., Morse, R.K.(2010) MAKING CARBON OFFSETS WORK IN THE DEVELOPING WORLD: LESSONS FROM THE CHINESE WIND CONTROVERSY. Stanford: PROGRAM ON ENERGY AND SUSTAINABLE DEVELOPMENT
Held et al., A, R. Haas, and M. Ragwitz (2006) ON THE SUCCESS OF POLICY STRATEGIES FOR THE PROMOTION OF ELECTRICITY FROM RENEWABLE ENERGY SOURCES IN THE EU. Fraunhofer Institute for Systems and Innovation Research, Vienna University of Technology
IEA (2009) CO2 Emissions from fuel combustation ‐ Highlights. Paris: International Energy Agency,
IEA (2008) Deploying Renewables ‐ Principles for Effective Policies. Paris: International Energy Agency
IEA. World Energy Outlook. Paris: International Energy Agency, 2008.
IEA. World Energy Outlook 2007. Paris: International Energy Agency, 2007.
IEA (2009) World Energy Outlook 2009 Paris: Internatinal Energy Agency, 2009.
P a g e | 71
IETA (2010) Improving Regional Representation: Practical measures to take the carbon markets to Least Developed Countries.” Greenhouse Gas Market 2010‐ Post Copenhagen and Climate Policy: Where Global Emissions Trading Goes from Here, 107‐111.
IETA (2009) State of the CDM 2009 ‐ Reforming for the Present and Preparing for the Future. Geneva: International Emissions Trading Association
KfW (2005) Financing Renewable Energy‐ Instruments, Strategies, Practice Approaches. discussion paper, Frankfurt: KfW Entwicklungsbank (KfW Development Bank)
Kfw (2009) “Priorities for Public Private Financing, presentation.” Symposium Climate Finance . Berlin: KfW Development Bank
Klein et al., A., Pfluger, B., Held, A.,Ragwitz, M., Resch, G., Faber, T. (2008) Evaluation of different feed‐in tariff design options – Evaluation of different International Feed‐In Cooperation. German Ministry for the Environment, Nature Conservation and Nuclear Safety (BMU)
Klessmann et al., C., Nabe, C., Burges, K. Pros and cons of exposing renewables to electricity market risks—A comparison of the market integration approaches in Germany, Spain,and the UK. Energy Policy 36 (2008), 2008.
Komendantova et al., N., Patt, A.,Barras, L., Battaglini, A. “Perception of risks in renewable energy projects: The case of concentrated solar power in North Africa. (2009),.” EnergyPolicy(2009),doi:10.1016/j.enpol.2009.12.008, 2009.
Mendonca et al., M., Jacobs, D., Sovacool, B. (2010) Powering the Green Economy‐ The Feed‐in Tariff handbook. World Future Council
Mitchell et al., C., Bauknecht, D., Connor, P.M.(2006) Effectiveness through risk reduction: a comparison of the renewable obligation in England and Wales and the feed‐in system in Germany. Energy Policy 34, 297–305.
MLCE (2010) Piece of cake? Sectoral approaches and NAMA crediting ‐ A private sector perspective (presentation). Bank of America Merrill Lynch, sources Point Carbon, Project Catalyst
Moner‐Girona, M. (2008) A New Scheme for the Promotion of Renewable Energies in Developing Countries: The Renewable Energy Regulated Purchase Tariff. Ispra: European Commission Joint Research Centre (JRC)
PBL (2007) "The Netherlands Environmental Assessment Agency". “China now no. 1 in CO2 emissions; USA in second position.” http://www.pbl.nl/en/dossiers/Climatechange/moreinfo/Chinanowno1inCO2emissionsUSAinsecondposition.html (accessed 08 03, 2010).
REN21 (2010) Renewables 2010 Global Status Report. Paris (REN 21 Secretariat): Deutsche Gesellschaft für Technische Zusammenarbeit (GTZ) GmbH, Renewable Energy Policy Network for the 21st Century
P a g e | 72
Robins et al., N., Fulton M. (2009) “Investment Opportunities and Catalysts ‐ Analys and Proposals from the Climate Finance Industry on Fundiing Climate Mitigation.” In Climate Finance ‐ Regulatory and Funding Strategies for Climate Change and Global Development, by B.S., Kingsbury, B., Rudyk, B. (ed) Steward, 143‐151. New York: New York University Abu Dhabi Institute
Sterk, W.(2007) “The Potential Role of CDM post‐2012, presentation.” COP13. Wuppertal Institute,
Stern, Nicolas (2007) The Economics of Climate Change ‐ The Stern Review. London: Cabinet Office ‐ HM Treasury
UNDP (2005) Energy Services for the Millennium Development Goals. New York: United Nations Environmental Programme, The World Bank
UN (2008) World Population Prospects. 2008. http://esa.un.org/UNPP/p2k0data.asp (accessed August 05, 2010).
UNEP and partners (2009) Catalysing Low Carbon Growth in Developing Countries. Nairobi: United Nations Environmental Programme and partners
UNEP (2010) Global Trends in Sustainable Energy investment 2010. United National Environment Programm , Bloomberg New Energy Finance
UNEP (2008) PUBLIC FINANCE MECHANISMS TO MOBILISE INVESTMENT IN CLIMATE CHANGE MITIGATION. United Nations Environmental Programme Sustainable Energy Finance Initiative (SEFI),
UNEP (2008) Reforming Energy Subsidies ‐Opportunities to Contribute to the Climate Change Agenda. Nairobi: United National Environmental Framework
UNEP Risoe Centre (2010) CDM/JI Pipeline Analysis and Database. August 2010. http://cdmpipeline.org/overview.htm (accessed August 08, 2010).
UNEP Risoe (2009) NAMAs and the Carbon Market ‐ National Appropiate Mitigation Actions of developing countries. Roskilde: UNEP Risoe Centre (CD4CDM Project), 2009.
UNEP SEFI (2004) “Phrase from Finance Roundtables were organized, in 2004, collaboratively by Virginia Sonntag O’Brien,.” Bonn
UNFCCC (2009) 3. Report of the AWG‐LCA on its Seventh Session. FCCC/AWGLCA/2009/14, para. 17(g), p. 128 and Annex VI, http://unfccc.int/resource/docs/2009/awglca7/eng/14.pdf: UNFCCC: AWG‐LCA—. Appendix II ‐ Nationally appropriate mitigation actions of developing country Parties. 2010 b. http://unfccc.int/home/items/5265.php (accessed August 13, 2010).
UNFCCC (2001) CDM E‐/E+ Policy Guidance, Annex 3. Bonn: United Nations Convention on Climate Change, 16th CDM EB meeting, —. CDM Statistics. 2010. http://cdm.unfccc.int/Statistics/index.html (accessed August 09, 2010).
UNFCCC (2009) Copenhagen Accord. Copenhagen: United Nationals Convention on Climate Change, FCCC/CP/2009/L.7
P a g e | 73
UNFCCC (2009) Fact sheet: financing climate change action ‐ Investment and financial flows for a strengthened response to climate change. Bonn: United Nations Framework Convention on Climate Change
UNFCCC (2007) Investment and Financial Flows to Address Climate Change. Bonn: United Nationas Framework on Climate Change
WB (2009) Africa Energy Poverty. Rome: World Bank for the G8 Energy Minister Meeting 2009
WB (2009) Africa Energy Poverty. Report to the G8 Energy Minister Meeting on 24‐25 May 2009 in Rome, Rome: The World Bank
WB (2009) State and Trends of the Carbon Market 2010. Washington D.C.: The World Bank.
WB (2009) The EB 51 decision on Chinese wind projects: What are the implications? . Briefing Note: The World Bank
WFC (2010) FITness Testing: Exploring the myths and misconceptions about feed‐in tariff policies. Hamburg: World Future Council
WFC (2009) Unleashing the renewable energy development in developing countries ‐ A Global Renewable Energy Policy (REP) Fund for Developing Countries. Hamburg: World Future Council
WHO and UNDP (2009) The Energy Access Situation in Developing Countries‐ A review focus on least developed and sub‐saharan Africa . New York: World Health Organisation, United Nations Development Programme
WRI (2010) World Resource Insitute. http://www.wri.org/stories/2010/02/summary‐developed‐country‐fast‐start‐climate‐finance‐pledges (accessed August 25, 2010).
WWEA (2009)The Clean Development Mechanism and Wind Energy ‐ How to Come to an Effective Support Scheme for Renewable Energy within a Post‐Kyoto Agreement. Bonn: World Wind Energy Association