cameroon economic update - world bank economic update iii table of contents abbreviations and...
TRANSCRIPT
January 2014 | Issue No 7
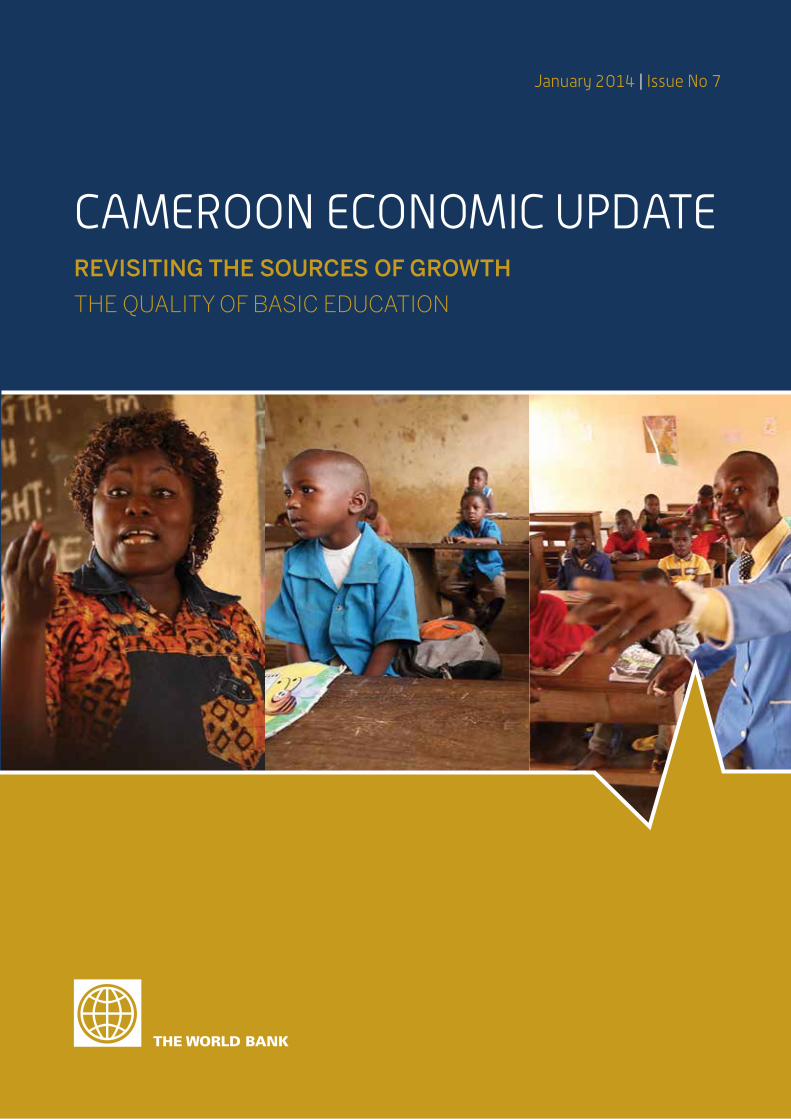
CAMEROON ECONOMIC UPDATEREVISITING THE SOURCES OF GROWTH
THE QUALITY OF BASIC EDUCATION
CAMEROON ECONOMIC UPDATE
Revisiting the Sources of GrowthThe Quality of Basic Education
January 2014

CAMEROON ECONOMIC UPDATE iii
TABLE OF CONTENTS
ABBREVIATIONS AND ACRONYMS ......................................................................................... V
ACKNOWLEDGEMENT ............................................................................................................ VII
EXECUTIVE SUMMARY .............................................................................................................. 1
RECENT ECONOMIC DEVELOPMENTS ....................................................................................32013 has seen some encouraging economic developments… ............................................................. 3…although the fiscal and external balances have deteriorated. ........................................................... 5Medium term prospects are positive… .................................................................................................. 6…but substantial risks remain ................................................................................................................ 7Looking forward, the sources of growth need to be revisited ............................................................... 9
BASIC EDUCATION IN CAMEROON .........................................................................................11Cameroon has made significant progress in access to basic education… ......................................... 11…but important disparities persist… .................................................................................................... 13…because of resource allocation and governance problems ............................................................. 15Looking forward, tackling these issues would strengthen the basic education system. ..................20
REFERENCES ............................................................................................................................23

CAMEROON ECONOMIC UPDATE v
ABBREVIATIONS AND ACRONYMS
CFAF CFAFranc
CONFEMEN Conférence des ministres de l’Éducation des États et gouvernements de la Francophonie
(ConferenceoftheMinistersofEducationofFrenchspeakingcountries)
CPI ConsumerPriceIndex
CTP ContractTeachersProgram
DENOs Dépenses engagées mais non-ordonnancées(expenditurecommittedbutforwhichnopayment
orderhasbeenissued)
DSCE Document de Stratégie pour la Croissance et l’Emploi (GrowthandEmploymentStrategyPaper)
ECAM Enquête Camerounaise auprès des Ménages(CameroonianHouseholdSurvey)
EESI Enquête sur l’Emploi et le Secteur Informel(EmploymentandInformalSectorSurvey)
EGMA EarlyGradeMathematicsAssessment
EGRA EarlyGradeReadingAssessment
EMIS EducationManagementInformationSystem
GDP GrossDomesticProduct
IMF InternationalMonetaryFund
INS Institut National de Statistique (NationalInstituteofStatistics)
MINEDUB Ministère d’Éducation de Base(MinistryofBasicEducation)
PASEC Programme d’Analyse des Systèmes Éducatifs de la CONFEMEN(ProgramfortheAnalysisof
EducationSystems)
PTR Pupil-TeacherRatio
PTA ParentTeachersAssociation
SNH Société Nationale des Hydrocarbures(NationalHydrocarbonsCorporation)
SONARA Société Nationale de Raffinage(NationalRefinery)
UNESCO UnitedNationsEducational,ScientificandCulturalOrganization
UNICEF UnitedNationsChildrenFund
WB WorldBank
ZEP Zones d’Éducation Prioritaires (EducationPriorityZones)

CAMEROON ECONOMIC UPDATE vii
ACKNOWLEDGEMENT
The Cameroon Economic Updates are produced
byaTeamledinitiallybyRajuJanSinghandnowby
SouleymaneCoulibaly.ShobhanaSosalepreparedthe
chapteroneducation.Forthispurpose,theTeamhas
builtupontherecently-completedEducationCountry
StatusReportforCameroon(Lesystèmed’éducation
etdeformationduCameroundanslaperspectivede
l’émergence).OtherTeammembersincludeFaustin
Koyassé,SimonDietrichandSylvieNdze.TheWorld
BankGSDTIunitensuredtheFrenchtranslationofthe
CEU.Thephotosinthisreport(includingonthecover)
aretothecreditofStephanBachenheimer,Consultant
Sr.Videographer,ECRBM,WorldBank.
CommentsreceivedfromBirgitHansl,JohnLitwack,
Cia Sjetnan, Ousmane Kolie and Abel Bove are
gratefully acknowledged. Greg Binkert (Country
Director for Cameroon), Mark Thomas (Economic
Policy Sector Manager), Peter Maseru (Education
Sector Manager), and Olivier Godron (Country
Program Coordinator) provided guidance and
advice, and have been an invaluable source of
encouragement.
TheTeamhasalsogreatlybenefitedfromconsulta-
tions with Cameroon’s key policy makers and ana-
lysts, who provided important insights, in particu-
larthefollowinginstitutions:theBEAC,theTechnical
MonitoringCommittee(CTS),theMinistryofEconomy
andPlanning,theMinistryofFinance,andtheNational
InstituteofStatistics.TheTeamisalsogratefultotheir
colleaguesattheInternationalMonetaryFund.

CAMEROON ECONOMIC UPDATE 1
EXECUTIVE SUMMARY
WiththeseCameroonEconomicUpdates,theWorld
Bank is pursuing a program of short and frequent
reports which analyze the trends and constraints
inCameroon’seconomicdevelopment.Eachissue,
producedbi-annually,providesanupdateofrecent
economicdevelopments,aswellasaspecialfocus
onatopicalissue.
The Cameroon Economic Updates aim at sharing
knowledge and stimulating debate among those
interestedinimprovingtheeconomicmanagement
ofCameroonandunleashingitsenormouspotential.
Thenotestherebyofferanothervoiceoneconomic
issuesinCameroon,andanadditionalplatformfor
engagement, learning and exchange. This seventh
issue of the Cameroon Economic Updates is enti-
tled“RevisitingtheSourcesofGrowth—TheQuality
ofBasicEducation”.
The average observed economic growth rate from
2010 to 2013 is a mere four percent, one percent-
agepointbelowthe‘Vision2035’targets.Achieving
the official objectives set for 2020 would require
Cameroon to move to double digit annual growth
ratesoverthe2014–2020period,comparedtothe
4.8to5.4percentprojectedbytheWorldBank.This
callsforrenewedattentiontothesourcesofgrowthin
Cameroontoidentifypolicyareasthatcanhelp“mus-
terallourenergytochampionthiscauseandsum-
monallourstrengthtoensuregrowth”,asemphat-
icallyexpressedbyPresidentBiyainhisendofyear
2013address.ThisseventheditionoftheCameroon
EconomicUpdatelooksatthequalityofbasicedu-
cationtoensurethattherightinvestmentsaremade
inpeopletobuildhumancapital,akeyingredientfor
sustainableeconomicgrowth.
Educationiskeytobuildingskills,enhancingthepro-
ductivity of workers, and contributing positively to
longtermgrowth.Attheindividual level,education
increasesearningpotentialandreducestheriskof
fallingintopoverty.Thereisastronglinkbetweenthe
educationlevelofahouseholdheadandtheproba-
bilityofthishouseholdtofallunderthepovertyline.
Studieshavealsoshownimportantindirecteffectsof
education,especiallyonhealth.Takingintoaccount
differencesinfactorssuchasincomeandresidency
(rural/urban), an increase in the level of education
positively affects issues such as family planning,
reproductivehealthandchildhealth.
Cameroon has achieved significant progress over
thelastdecadeinexpandingaccesstobasicedu-
cation.Thenumberofstudentscompletingprimary
school,theprimarycompletionrate,rosefrom53
percentin2001toabout80percentin2011.School
life expectancy rose by four years over the same
period,agreatimprovementinrelationtointerna-
tionalcomparators.Theprimarygrossenrollment
raterosefrom102.8percent in2001to112.9per-
centin2011.
Theincreaseingrossenrollment,however,doesnot
seemtohavebeenaccompaniedbybettereduca-
tionoutcomes.Cameroon’sresultsonthestandard
testPASEC(ProgramfortheAnalysisofEducation
Systems),astudentachievementtestdirectedby
the Conference of the Ministers of Education of
Frenchspeakingcountries,declinedbetween1998
and2005(latestyearforwhichdataisavailableat
the time of printing this report), although it is still
higherthaninmanyotherFrancophonecountries
inAfrica.
CAMEROON ECONOMIC UPDATE2
Theimprovementsinaccesstoeducationalsomask
significant differences in education performance
across and within individual regions, as well as
betweengenderandincomegroups.Thethreenorth-
ern regions (Far North, North and Adamawa) and
theEast lagbehindineducationoutcomesdespite
an increased attention through the ZEP (“Zones
d’Education Prioritaire”) program aimed at raising
schoolingaccess,attendance,andachievement.
TheEconomicUpdatesuggestsimprovingdatacol-
lection in order to better monitor education ser-
viceprovision,assessmoresystematicallystudent
learning, increase in budget allocation to educa-
tion as a whole, reprioritize public spending to the
ZEPs,ensuretransparencyinbudgetallocation,and
revisit the textbook policy to ensure durability and
affordability.

CAMEROON ECONOMIC UPDATE 3
RECENT ECONOMIC DEVELOPMENTS
2013 has seen some encouraging economic developments…
Growth
Inspiteofasluggishglobaleconomy,preliminaryinfor-
mationsuggeststhateconomicgrowthinCameroon
couldreachabout4.6percentin2013(comparedto
4.6percentin20121).Theeconomygrewby2.9and
3.8percentinthefirsttwoquarters,respectively(over
thesamequarterinthepreviousyear,Figure1).
As in recent years, the tertiary sector is the main
driver of economic growth (Figure 2), telecommu-
nicationsandtransportbeingparticularlydynamic.
Intheprimarysector,industrialandexport-oriented
agriculture has driven growth. Rubber and cotton
exportshavecontinuedtorisewhilecocoaexports
have reversed their downward trend due to better
prices(Figure3).Coffeeexportshoweverhavefallen
byabout50percent,duetoacombinationoffactors:
theslowdowninproductionduetoagingplantsand
agradualretreatfromthesector,wascompounded
withexportersbuildingupcoffeestocksbecauseof
lowinternationalprices.
The secondary sector has not been as dynamic as
in2012.Afteraslump in thefirstquarter, industrial
productionexpandedbythreepercentinthesecond
quarter (year-on-year). The performance is partly
explainedbyshortfallsinelectricityproductioncaused
FIGURE 3: Export Performance, Q1–Q3 2013 (y-o-y change in volume)
–60
40
–40
20
–20
0
60
Logs andwood
products
Coffee Cotton Aluminium Cocoa Rubber
Sources: CustomsandWBstaffcalculations.
FIGURE 2: Sectoral Contributions to GDP Growth, 2007–13 (in percent)
2007 2008 2009 2010 2011 2012 2013 Proj.–2
4
2
0
6
Primary sector Oil Secondary sector (excl. otil)GDP GrowthTertiary sector
Sources: INSandWBstaffcalculations.
FIGURE 1: GDP Growth by Quarter, 2011–2013 (percentage change over same quarter, previous year)
Q2 Q32011 2012 2013
Q4 Q1 Q2 Q3 Q4 Q1 Q20
4
5
6
3
2
1
7
Source: INSNationalAccountsandWBstaffcalculations.
1The4.4percentestimatementionedinthe2013JulyissueoftheCameroonEconomicUpdateswasrevisedto4.6percent.
CAMEROON ECONOMIC UPDATE4
bylimitedhydropowercapacityduringthedryseason
(December–June) as well as delays in the commis-
sioningofthenewgasfiredpowerplantinKribi.The
plant,216MWofinstalledcapacity,beganoperatingin
February2013(availablecapacityaround30MW)to
progressivelyreachitstotalinstalledcapacityinMay
2013.Theplantwasbuilttocomplementtheseasonal
productionpatternofCameroon’shydropowerplants.
Accordingly,itgeneratedbetween75and100MWdur-
ingtherainyseason(July–December),whenhydro-
powerwasabundantandcheap,andhasbeenrun-
ningalmostatfullcapacitysinceDecember(between
170and180MW).Itisplannedtoexpandtheplant’s
capacitybyanadditional114MWandthetransmission
linesconnectingKribi toEdéaarealreadyequipped
accordingly.However,whilethegasplantisusefulto
complementCameroon’senergymix,thegridtrans-
portingpowerfromEdéatoDoualaandYaoundé,the
country’smaincentersofelectricityconsumption,is
overloadedandoutworn.Iturgentlyneedsinvestment
tokeepupwithrisingdemandandensurethepower
supplyofCameroon’smainurbancenters.
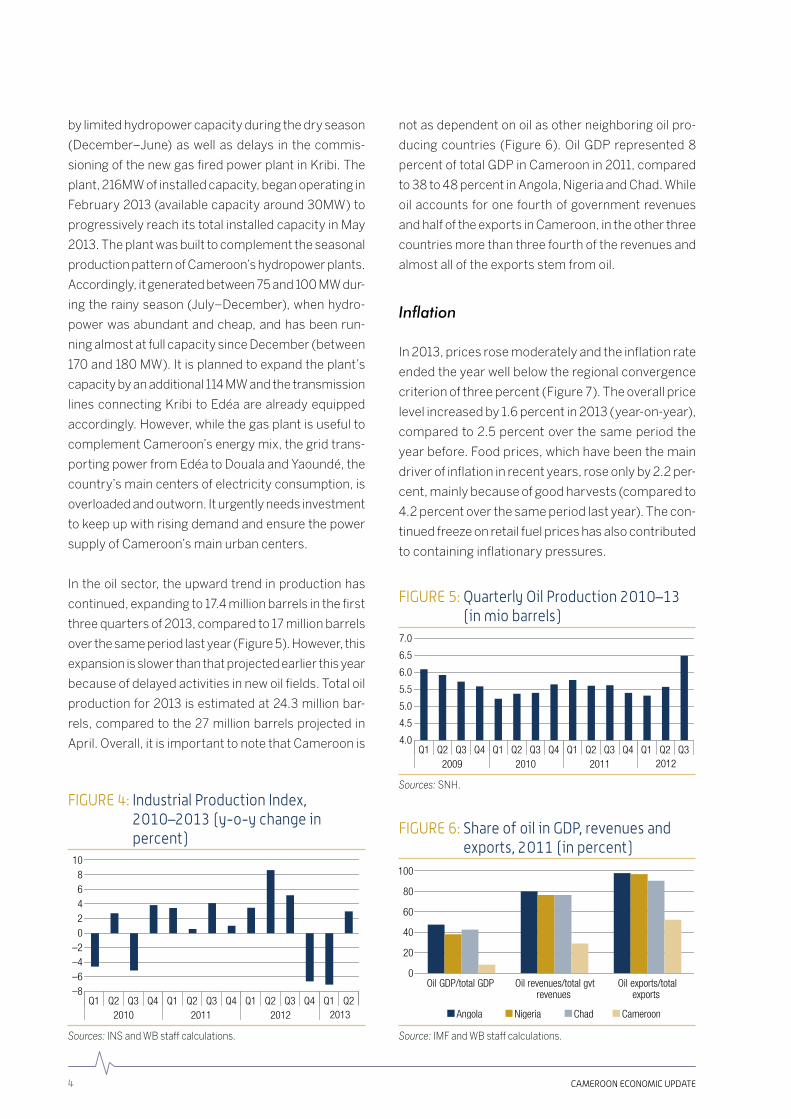
Intheoilsector,theupwardtrendinproductionhas
continued,expandingto17.4millionbarrelsinthefirst
threequartersof2013,comparedto17millionbarrels
overthesameperiodlastyear(Figure5).However,this
expansionisslowerthanthatprojectedearlierthisyear
becauseofdelayedactivitiesinnewoilfields.Totaloil
productionfor2013isestimatedat24.3millionbar-
rels,comparedtothe27millionbarrelsprojectedin
April.Overall,itisimportanttonotethatCameroonis
notasdependentonoilasotherneighboringoilpro-
ducing countries (Figure 6). Oil GDP represented 8
percentoftotalGDPinCameroonin2011,compared
to38to48percentinAngola,NigeriaandChad.While
oilaccounts foronefourthofgovernmentrevenues
andhalfoftheexportsinCameroon,intheotherthree
countriesmorethanthreefourthoftherevenuesand
almostalloftheexportsstemfromoil.
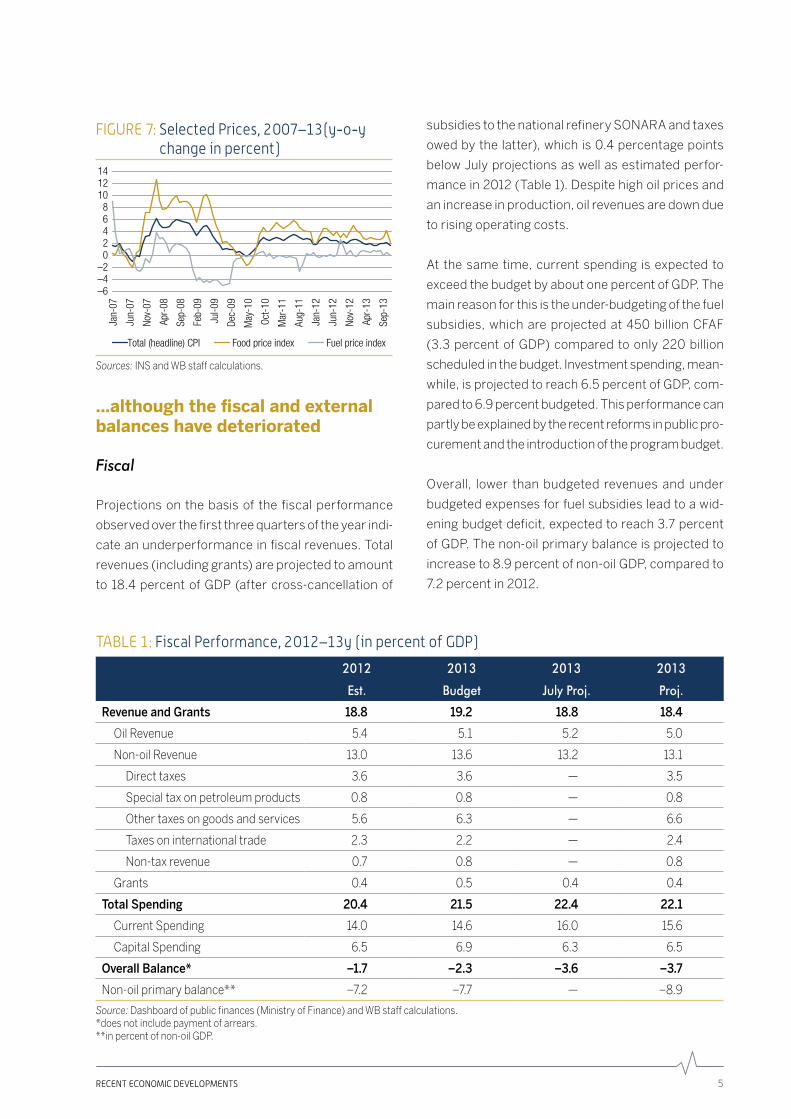
Inflation
In2013,pricesrosemoderatelyandtheinflationrate
endedtheyearwellbelowtheregionalconvergence
criterionofthreepercent(Figure7).Theoverallprice
levelincreasedby1.6percentin2013(year-on-year),
comparedto2.5percentoverthesameperiodthe
yearbefore.Foodprices,whichhavebeenthemain
driverofinflationinrecentyears,roseonlyby2.2per-
cent,mainlybecauseofgoodharvests(comparedto
4.2percentoverthesameperiodlastyear).Thecon-
tinuedfreezeonretailfuelpriceshasalsocontributed
tocontaininginflationarypressures.
FIGURE 4: Industrial Production Index, 2010–2013 (y-o-y change in percent)
2013
–8
10
Q1 Q2 Q3 Q4 Q1 Q2 Q3 Q4 Q3 Q4Q1 Q2 Q1 Q22010 2011 2012
–6–4–2
02468
Sources: INSandWBstaffcalculations.
FIGURE 5: Quarterly Oil Production 2010–13 (in mio barrels)
2012
4.0Q1 Q2 Q3 Q4 Q1 Q2 Q3 Q4 Q3 Q4Q1 Q2 Q1 Q2 Q3
2009 2010 2011
7.0
4.5
5.0
5.5
6.0
6.5
Sources: SNH.
FIGURE 6: Share of oil in GDP, revenues and exports, 2011 (in percent)
0
100
20
40
60
80
Oil GDP/total GDP Oil revenues/total gvtrevenues
Oil exports/totalexports
Angola Nigeria Chad Cameroon
Source: IMFandWBstaffcalculations.
RECENT ECONOMIC DEVELOPMENTS 5
…although the fiscal and external balances have deteriorated
Fiscal
Projections on the basis of the fiscal performance
observedoverthefirstthreequartersoftheyearindi-
cateanunderperformanceinfiscalrevenues.Total
revenues(includinggrants)areprojectedtoamount
to 18.4 percent of GDP (after cross-cancellation of
subsidiestothenationalrefinerySONARAandtaxes
owedbythelatter),whichis0.4percentagepoints
belowJulyprojectionsaswellasestimatedperfor-
mancein2012(Table1).Despitehighoilpricesand
anincreaseinproduction,oilrevenuesaredowndue
torisingoperatingcosts.
At the same time, current spending is expected to
exceedthebudgetbyaboutonepercentofGDP.The
mainreasonforthisistheunder-budgetingofthefuel
subsidies, which are projected at 450 billion CFAF
(3.3 percent of GDP) compared to only 220 billion
scheduledinthebudget.Investmentspending,mean-
while,isprojectedtoreach6.5percentofGDP,com-
paredto6.9percentbudgeted.Thisperformancecan
partlybeexplainedbytherecentreformsinpublicpro-
curementandtheintroductionoftheprogrambudget.
Overall, lower than budgeted revenues and under
budgetedexpensesforfuelsubsidiesleadtoawid-
eningbudgetdeficit,expectedtoreach3.7percent
ofGDP.Thenon-oilprimarybalanceisprojectedto
increaseto8.9percentofnon-oilGDP,comparedto
7.2percentin2012.
FIGURE 7: Selected Prices, 2007–13(y-o-y change in percent)
–6
14
–4–2
02468
1012
Jan-
07
Jun-
07
Nov-
07
Apr-
08
Sep-
08
Feb-
09
Jul-0
9
Dec-
09
May
-10
Oct-
10
Mar
-11
Aug-
11
Jan-
12
Jun-
12
Nov-
12
Apr-
13
Sep-
13
Total (headline) CPI Food price index Fuel price index
Sources: INSandWBstaffcalculations.
TABLE 1: Fiscal Performance, 2012–13y (in percent of GDP)
2012 2013 2013 2013
Est. Budget July Proj. Proj.
Revenue and Grants 18.8 19.2 18.8 18.4
OilRevenue 5.4 5.1 5.2 5.0
Non-oilRevenue 13.0 13.6 13.2 13.1
Directtaxes 3.6 3.6 — 3.5
Specialtaxonpetroleumproducts 0.8 0.8 — 0.8
Othertaxesongoodsandservices 5.6 6.3 — 6.6
Taxesoninternationaltrade 2.3 2.2 — 2.4
Non-taxrevenue 0.7 0.8 — 0.8
Grants 0.4 0.5 0.4 0.4
Total Spending 20.4 21.5 22.4 22.1
CurrentSpending 14.0 14.6 16.0 15.6
CapitalSpending 6.5 6.9 6.3 6.5
Overall Balance* –1.7 –2.3 –3.6 –3.7
Non-oilprimarybalance** –7.2 –7.7 — –8.9
Source: Dashboardofpublicfinances(MinistryofFinance)andWBstaffcalculations.*doesnotincludepaymentofarrears.**inpercentofnon-oilGDP.

CAMEROON ECONOMIC UPDATE6
External
Thetradedeficitisexpectedtohavegrownin2013to
1.6percentofGDP,comparedto1.1percentin2012
(Table2).Thisismainlyduetorisingimportsofinter-
mediarygoodsfortherealizationoflargeinfrastruc-
tureprojectsandlowpricesforsomeofCameroon’s
major export products, especially coffee. Non-oil
exportsareexpectedtohavedroppedfrom11.1per-
centofGDPin2012to10.5percentin2013.Atthe
sametime,thecurrentaccountdeficitisprojectedto
amountto4.9percentofGDPin2013,whichisabout
thesameastheyearbefore,butmorethanoneper-
centabove2011figures.Foreignreservesdropped
byabout63millionUSD(30billionFCFA)to3.3bil-
lionUSD.
Medium term prospects are positive…
Oil and Gas production are expected to increase
significantlyoverthecomingyears. In2014,theoil
sectorisestimatedtocontinueitsexpansionwitha
projected24percentincreaseinproduction.Inthe
mediumterm,oilproductioncouldmorethandouble
thankstotheexploitationofnewoilfields.According
to projections by the National Hydrocarbons
Association (SNH), oil production could reach
57.0 million barrels in 2016, compared to 24.4 mil-
lionbarrelsin2013.TheSNHexpectsoilproduction
todecreasethereafter,butnaturalgascouldfillthe
gapinthelongrun.
The first generation of large infrastructure projects
isscheduledtobecompletedoverthecomingyears.
Theseincludethenewdeep-seaportinKribi,expected
tostartoperationsmid-2014,theMemvéléandLom
Pangarhydropowerdams,aswellasthesecondWouri
bridge.Theseprojectscouldalleviatekeyinfrastruc-
turebottlenecksandcontributepositivelytoeconomic
growth. A second generation of large infrastructure
projectsisalreadybeingplannedbyGovernmentand
includesroadandrailtransportcorridors.
Withregardstoeconomicdevelopmentsinadvanced
economies,therearereasonstobecautiouslyopti-
misticfor2014.AccordingtotheEconomicSentiment
Indicator,economicconfidence,whilestillbelowthe
long-term average, is slowly rising in the euro zone
(Figure8).Atthesametime,theIMF,initsOctober
edition of the World Economic Outlook, projects a
growthrateofonepercentintheEurozoneaftertwo
yearsofcontraction.
TABLE 2: Balance of Payments, 2011–2013 (in percent of GDP)
2011 2012 2013 (proj.)
Trade balance –2.3 –1.1 –1.6
Imports 24.4 23.8 23.4
Non-oilexports 10.6 11.1 10.5
Current account balance
Excludinggrants –3.8 –4.8 –4.9
Includinggrants –2.9 –4.0 –4.0
Financial account balance 1.5 4.3 3.7
Officialcapital 1.0 1.6 1.7
Long-termborrowing 1.5 2.1 2.4
Amortization –0.5 –0.6 –0.7
Non-officialcapital(net) 1.0 2.2 1.9
Oilsector 0.4 0.6 0.7
Non-oilsector 0.6 1.6 1.2
Overall balance –1.3 0.3 –0.2
Source: IMF.
RECENT ECONOMIC DEVELOPMENTS 7
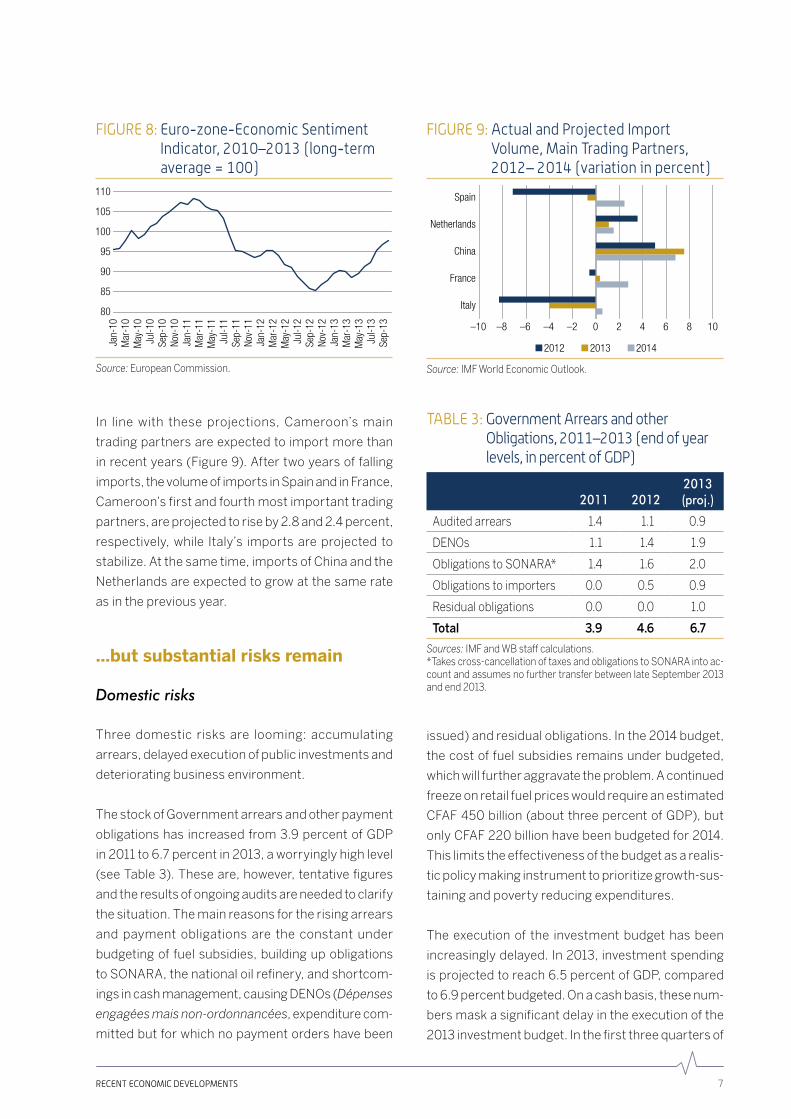
In line with these projections, Cameroon’s main
tradingpartnersareexpectedtoimportmorethan
inrecentyears(Figure9).Aftertwoyearsoffalling
imports,thevolumeofimportsinSpainandinFrance,
Cameroon’sfirstandfourthmostimportanttrading
partners,areprojectedtoriseby2.8and2.4percent,
respectively, while Italy’s imports are projected to
stabilize.Atthesametime,importsofChinaandthe
Netherlandsareexpectedtogrowatthesamerate
asinthepreviousyear.
…but substantial risks remain
Domestic risks
Three domestic risks are looming: accumulating
arrears,delayedexecutionofpublicinvestmentsand
deterioratingbusinessenvironment.
ThestockofGovernmentarrearsandotherpayment
obligationshas increasedfrom3.9percentofGDP
in2011to6.7percentin2013,aworryinglyhighlevel
(seeTable3).Theseare,however,tentativefigures
andtheresultsofongoingauditsareneededtoclarify
thesituation.Themainreasonsfortherisingarrears
and payment obligations are the constant under
budgetingof fuelsubsidies,buildingupobligations
toSONARA,thenationaloilrefinery,andshortcom-
ingsincashmanagement,causingDENOs(Dépenses
engagées mais non-ordonnancées,expenditurecom-
mittedbutforwhichnopaymentordershavebeen
issued)andresidualobligations.Inthe2014budget,
thecostoffuelsubsidiesremainsunderbudgeted,
whichwillfurtheraggravatetheproblem.Acontinued
freezeonretailfuelpriceswouldrequireanestimated
CFAF450billion(aboutthreepercentofGDP),but
onlyCFAF220billionhavebeenbudgetedfor2014.
Thislimitstheeffectivenessofthebudgetasarealis-
ticpolicymakinginstrumenttoprioritizegrowth-sus-
tainingandpovertyreducingexpenditures.
The execution of the investment budget has been
increasinglydelayed.In2013,investmentspending
isprojectedtoreach6.5percentofGDP,compared
to6.9percentbudgeted.Onacashbasis,thesenum-
bersmaskasignificantdelayintheexecutionofthe
2013investmentbudget.Inthefirstthreequartersof
FIGURE 8: Euro-zone-Economic Sentiment Indicator, 2010–2013 (long-term average = 100)
80
110
Jan-
10
Nov-
10Se
p-10
Jul-1
0M
ay-1
0M
ar-1
0
Jan-
11
Nov-
11Se
p-11
Jul-1
1M
ay-1
1M
ar-1
1
Jan-
12
Nov-
12Se
p-12
Jul-1
2M
ay-1
2M
ar-1
2
Jan-
13
Jul-1
3M
ay-1
3M
ar-1
3
Sep-
13
85
90
95
100
105
Source: EuropeanCommission.
FIGURE 9: Actual and Projected Import Volume, Main Trading Partners, 2012– 2014 (variation in percent)
–10 –4 0 42–2–6–8 6 8 10
Italy
France
China
Netherlands
Spain
2012 2013 2014
Source: IMFWorldEconomicOutlook.
TABLE 3: Government Arrears and other Obligations, 2011–2013 (end of year levels, in percent of GDP)
2011 20122013 (proj.)
Auditedarrears 1.4 1.1 0.9
DENOs 1.1 1.4 1.9
ObligationstoSONARA* 1.4 1.6 2.0
Obligationstoimporters 0.0 0.5 0.9
Residualobligations 0.0 0.0 1.0
Total 3.9 4.6 6.7
Sources: IMFandWBstaffcalculations.*Takescross-cancellationoftaxesandobligationstoSONARAintoac-countandassumesnofurthertransferbetweenlateSeptember2013andend2013.
CAMEROON ECONOMIC UPDATE8
theyear,only35percentofthebudgetedinvestments
financedthroughinternalresourceswereexecuted
(Table4).Thisperformancecanpartlybeexplained
bythereformofpublicprocurementwiththecreation
ofaMinistryofpublicprocurementandtheintroduc-
tionandimplementationoftheprogrambudget.Asa
consequence,theGovernmentextendedthecomple-
mentarybudgetperiodbytwomonths,untilMarch
2014.Ifthesedelaysbecomepersistent,thegrowth
dividendoftheseinvestmentsmightbediluted.
The business climate in Cameroon remains dis-
couraging to new investment. In the 2014 edition
ofWorldBank’sDoingBusinessReport,Cameroon
lost six positions compared to the 2013 ranking2,
and now ranks 168th out of 189 countries. In order
to make Cameroon more attractive to investors,
the Government adopted a new investment law in
April 2013. The law offers exemptions and reduc-
tionsonthemajorityoftaxestonewbusinessesas
well as to existing ones under certain conditions.
Thelaw’simpactonGovernmentrevenueisuncer-
tain but might be substantial and should therefore
be closely monitored. The text remains vague on
the administrative procedures necessary to bene-
fitfromthetaxexemptions,whichmightraisetrans-
parencyconcerns.
External risks
Ontheexternalside,oilpricevolatilityandincreasing
financingcostsoninternalmarketsshouldbecare-
fullywatched.
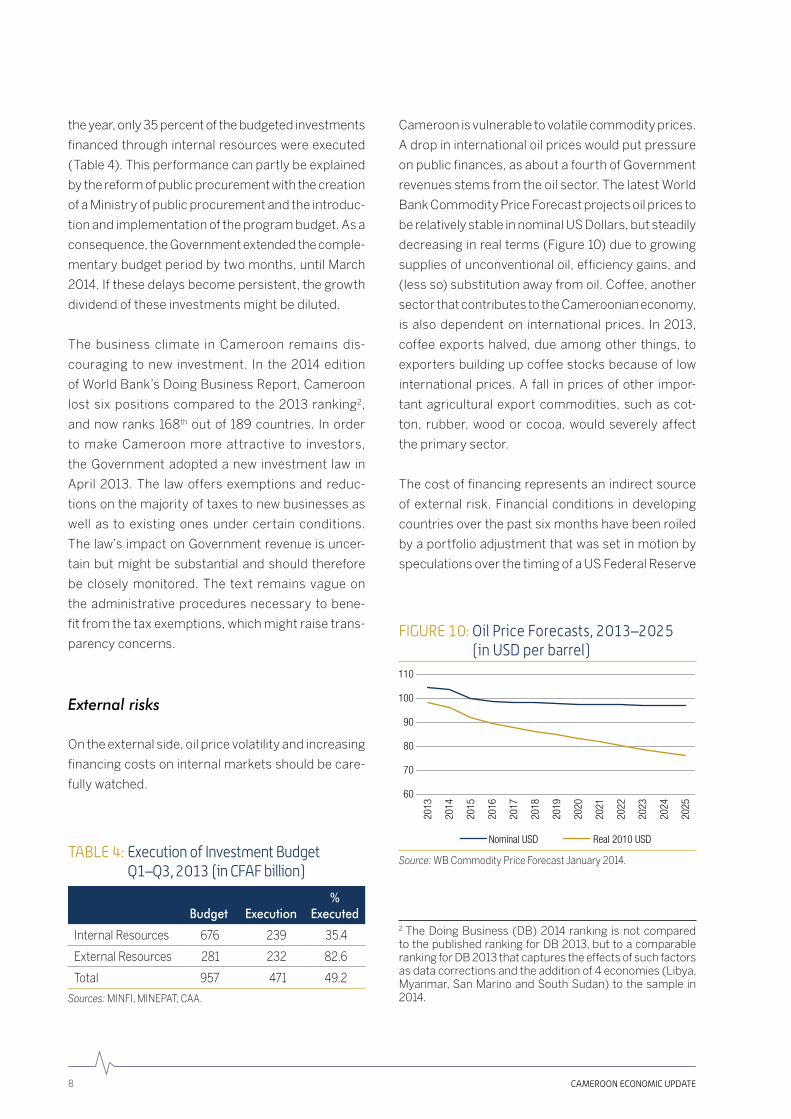
Cameroonisvulnerabletovolatilecommodityprices.
Adropininternationaloilpriceswouldputpressure
onpublicfinances,asaboutafourthofGovernment
revenuesstemsfromtheoilsector.ThelatestWorld
BankCommodityPriceForecastprojectsoilpricesto
berelativelystableinnominalUSDollars,butsteadily
decreasinginrealterms(Figure10)duetogrowing
suppliesofunconventionaloil,efficiencygains,and
(lessso)substitutionawayfromoil.Coffee,another
sectorthatcontributestotheCameroonianeconomy,
is also dependent on international prices. In 2013,
coffee exports halved, due among other things, to
exportersbuildingupcoffeestocksbecauseoflow
international prices. A fall in prices of other impor-
tant agricultural export commodities, such as cot-
ton, rubber, wood or cocoa, would severely affect
theprimarysector.
Thecostoffinancingrepresentsanindirectsource
of external risk. Financial conditions in developing
countriesoverthepastsixmonthshavebeenroiled
byaportfolioadjustmentthatwassetinmotionby
speculationsoverthetimingofaUSFederalReserve
2The Doing Business (DB) 2014 ranking is not comparedtothepublishedrankingforDB2013,buttoacomparablerankingforDB2013thatcapturestheeffectsofsuchfactorsasdatacorrectionsandtheadditionof4economies(Libya,Myanmar,SanMarinoandSouthSudan)tothesample in2014.
TABLE 4: Execution of Investment Budget Q1–Q3, 2013 (in CFAF billion)
Budget Execution%
Executed
InternalResources 676 239 35.4
ExternalResources 281 232 82.6
Total 957 471 49.2
Sources: MINFI,MINEPAT,CAA.
FIGURE 10: Oil Price Forecasts, 2013–2025 (in USD per barrel)
60
80
70
110
90
100
2013
2014
2015
2016
2017
2018
2019
2020
2021
2022
2023
2024
2025
Nominal USD Real 2010 USD
Source: WBCommodityPriceForecastJanuary2014.

RECENT ECONOMIC DEVELOPMENTS 9
withdrawalofsomeofthemeasuresputinplaceto
supportgrowth,despitenoactualchangeinthelong-
termassetpurchases.Theyieldon10-yearUnited
StatesTreasurybillsroseby100basispoints,spark-
ingasignificantportfolioreadjustmentasinvestors
increasedtheshareofnowhigher-yieldingUSbonds
intheiroverallportfolios.Thisportfolioadjustment
caused a temporary—but significant—reversal in
capitalflowsfromdevelopingcountriestotheUnited
States.Onacumulativebasis,investorswithdrewa
net total of US$64 billion from developing country
mutualfundsbetweenJuneandAugust.Grosscap-
italflowstodevelopingcountriesfellbyhalfandthe
currenciesandstockmarketsofseveralmajordevel-
opingeconomiesdeclinedbyasmuchas15percent.
Suchmovementscanhaveanindirectimpactonthe
Cameroonianeconomythroughitsincreasingtrade
flowswithemergingmarkets.NowthattheFederal
Reservehasannouncedaslowdownofitsquantita-
tiveeasingprogramfor2014,theimpactoffinancing
costsof theemergingeconomiesthat increasingly
tradewithCameroonshouldbecloselyexamined.
Looking forward, the sources of growth need to be revisited
The developments laid out above could negatively
affect capital accumulation or preclude the reallo-
cationofproductionfactorstotheirmosteffective
usesandhencemaintaingrowthbelowthetargets
formulatedinthe2009Document de Stratégie pour
la Croissance et l’Emploi (DSCE), absent a timely
policy response. Cameroon needs an acceleration
tomeetthe2020referencescenarioobjectiveslaid
outintheDSCE.Theaverageobservedgrowthrate
from 2010 to 2013 is 4.1 percent3, one percentage
pointbelowthe ‘Vision2035’ targets(and0.8per-
centagepointsbelowtheDSCEreferencescenario;
Figure11).Achievingtheobjectivessetfor2020would
require an annual growth rate of 9.5 percent dur-
ingthe2014–2020period,comparedto the4.8to
5.4percentprojectedbytheWorldBank(Figure12).
Thissituationcallsforrenewedattentiontothe
sourcesofgrowthinCameroon—toidentifypolicy
areasthatcanhelpCameroonreachtheeconomic
growthlevelsthatareneededtosustainablydevel-
opthecountryandreducepoverty.Giventheim-
portantimpactofeducationonlongtermgrowth,
arevisionofthesourcesofgrowthshouldstartby
lookingatthequalityofhumancapital.
Endogenousgrowththeorieshavebeentestedover
decadesinawiderangeofcountriesandconfirmed
thathumancapitalplaysacriticalroleinachieving
economicgrowth.Inthisregard,education,to-
FIGURE 11: Actual and Projected GDP Growth Rates compared to Government Objectives, 2010–2020 (in percent)
0
12
8
6
4
2
10
2010 2011 2012 2013 2014 2015 2016 2017 2018 2019 2020
Vision 2035 Scenario Reference Scenario Actual/Projected
Sources: DCSEandWBstaffcalculations.
FIGURE 12: GDP Growth Rate necessary to reach Government Objectives (in percent)
0
12
8
6
4
2
10
2010 2011 2012 2013 2014 2015 2016 2017 2018 2019 2020
Catch up Vision 2035 Actual/Projected
Sources: DCSEandWBstaffcalculations.
3Actualgrowthratefor2010–2012,projectedgrowthratefor2013.
CAMEROON ECONOMIC UPDATE10
getherwithhealth(coveredinthepreviousissueof
the“CameroonEconomicUpdate”),contributein
animportantmannertoCameroon’saspirationto
becominganemergingeconomyby2035.Thenext
chapterlooksatthequalityofbasiceducationto
ensurethattherightinvestmentismadeinpeople
tobuildhumancapitalatanearlyage,akeyingredi-
entforsustainablegrowthanddevelopment.
CAMEROON ECONOMIC UPDATE 11
BASIC EDUCATION IN CAMEROON
Educationiskeytobuildingskillsandenhancinglabor
productivityandtocontributepositivelytolong-term
economicgrowth.Educationiskeytobuildingskills
andenhancinglaborproductivityandtocontribute
positivelytolong-termeconomicgrowth.
Atthe individual level,education increasesearning
potentialandreducestheriskoffallingintopoverty.
Thereisastronglinkbetweentheeducationlevelof
ahouseholdheadandtheprobabilityofthishouse-
holdtofallunderthepovertyline.A2013Education
Country Status Report shows important indirect
effects of education, especially regarding health.
Taking into account differences in factors such as
income and residency (rural/urban), a higher level
ofeducationpositivelyaffectsissuessuchasfamily
planning,reproductivehealthandchildhealth.
Againstthisbackdrop,thelackofimprovementinedu-
cationoutcomesinCameroon,despitebetteraccess
to education, is a cause for concern. Furthermore,
importantdisparitiesexistineducationperformance
acrossandwithinregions,aswellasbetweengender
and income groups. The poorest benefit less from
publicspendingineducationastheyprimarilylivein
disadvantagedareas,sufferfromthechronicunder-
fundingoftheprimarysector,andarehitespecially
hardbyhighout-of-pocketspendingforeducation.
This chapter draws on the recently-completed
EducationCountryStatusReportforCameroon(Le
système d’éducation et de formation du Cameroun
dans la perspective de l’émergence). It describes
Cameroon’s education profile, discusses resource
allocationtoeducationandgovernanceissuesinthe
educationsector,andsuggestssomeoptionsgoing
forward.
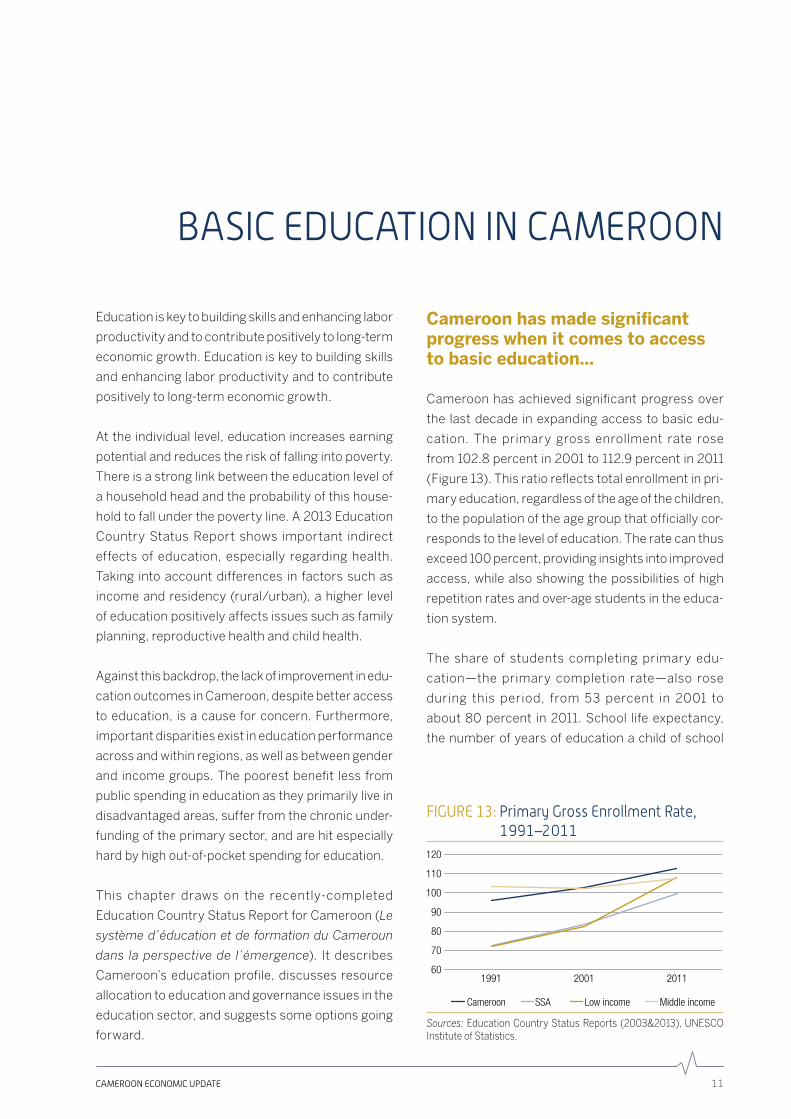
Cameroon has made significant progress when it comes to access to basic education…
Cameroon has achieved significant progress over
the last decade in expanding access to basic edu-
cation. The primary gross enrollment rate rose
from102.8percentin2001to112.9percentin2011
(Figure13).Thisratioreflectstotalenrollmentinpri-
maryeducation,regardlessoftheageofthechildren,
tothepopulationoftheagegroupthatofficiallycor-
respondstothelevelofeducation.Theratecanthus
exceed100percent,providinginsightsintoimproved
access, while also showing the possibilities of high
repetitionratesandover-agestudentsintheeduca-
tionsystem.
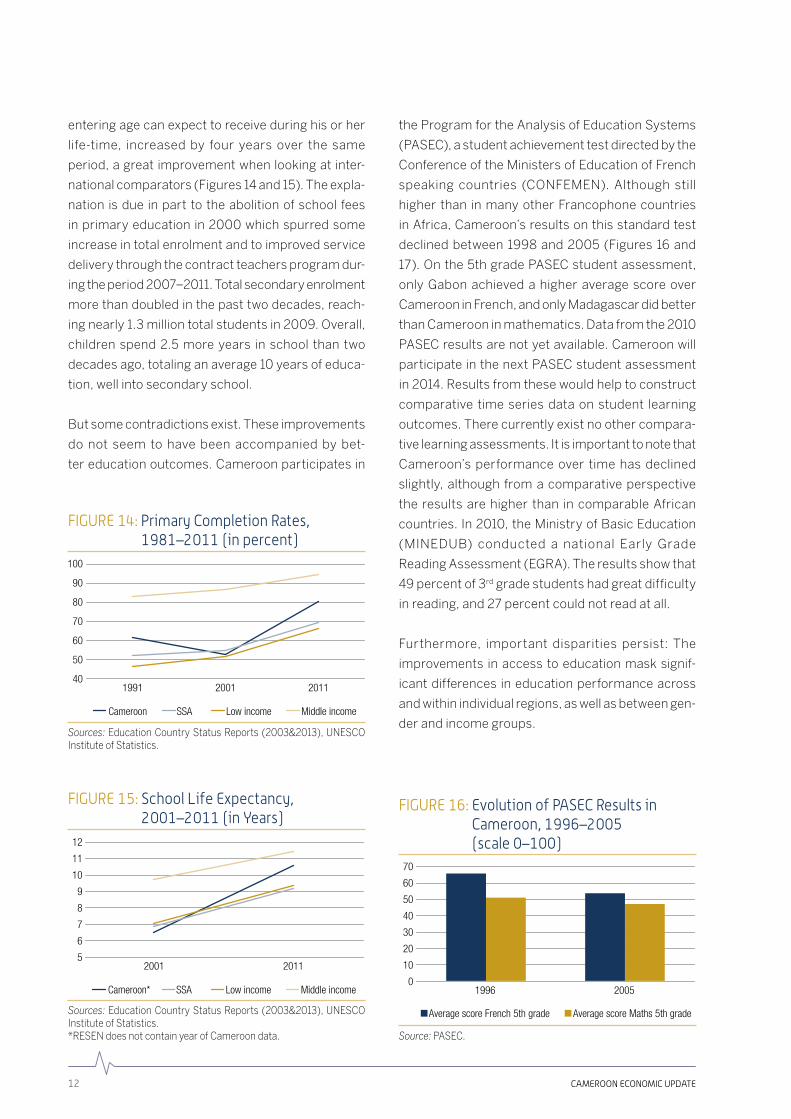
The share of students completing primary edu-
cation—the primary completion rate—also rose
during this period, from 53 percent in 2001 to
about 80 percent in 2011. School life expectancy,
thenumberofyearsofeducationachildofschool
FIGURE 13: Primary Gross Enrollment Rate, 1991–2011
60
70
80
100
120
90
110
1991 2001 2011
Cameroon SSA Low income Middle income
Sources: Education Country Status Reports (2003&2013), UNESCOInstituteofStatistics.
CAMEROON ECONOMIC UPDATE12
enteringagecanexpecttoreceiveduringhisorher
life-time, increased by four years over the same
period,agreat improvementwhenlookingat inter-
nationalcomparators(Figures14and15).Theexpla-
nation isdue inpart to theabolitionofschool fees
inprimaryeducation in2000whichspurredsome
increaseintotalenrolmentandtoimprovedservice
deliverythroughthecontractteachersprogramdur-
ingtheperiod2007–2011.Totalsecondaryenrolment
morethandoubledinthepasttwodecades,reach-
ingnearly1.3milliontotalstudentsin2009.Overall,
children spend 2.5 more years in school than two
decadesago,totalinganaverage10yearsofeduca-
tion,wellintosecondaryschool.
Butsomecontradictionsexist.Theseimprovements
do not seem to have been accompanied by bet-
tereducationoutcomes.Cameroonparticipatesin
theProgramfortheAnalysisofEducationSystems
(PASEC),astudentachievementtestdirectedbythe
ConferenceoftheMinistersofEducationofFrench
speaking countries (CONFEMEN). Although still
higher than in many other Francophone countries
inAfrica,Cameroon’sresultsonthisstandardtest
declined between 1998 and 2005 (Figures 16 and
17).Onthe5thgradePASECstudentassessment,
only Gabon achieved a higher average score over
CamerooninFrench,andonlyMadagascardidbetter
thanCamerooninmathematics.Datafromthe2010
PASECresultsarenotyetavailable.Cameroonwill
participateinthenextPASECstudentassessment
in2014.Resultsfromthesewouldhelptoconstruct
comparative time series data on student learning
outcomes.Therecurrentlyexistnoothercompara-
tivelearningassessments.Itisimportanttonotethat
Cameroon’s performance over time has declined
slightly, although from a comparative perspective
the results are higher than in comparable African
countries.In2010,theMinistryofBasicEducation
(MINEDUB) conducted a national Early Grade
ReadingAssessment(EGRA).Theresultsshowthat
49percentof3rdgradestudentshadgreatdifficulty
inreading,and27percentcouldnotreadatall.
Furthermore, important disparities persist: The
improvements in access to education mask signif-
icantdifferences ineducationperformanceacross
andwithinindividualregions,aswellasbetweengen-
derandincomegroups.
FIGURE 16: Evolution of PASEC Results in Cameroon, 1996–2005 (scale 0–100)
0
20
10
30
40
50
60
70
1996 2005
Average score French 5th grade Average score Maths 5th grade
Source: PASEC.
FIGURE 15: School Life Expectancy, 2001–2011 (in Years)
5
6
7
8
10
12
9
11
2001 2011
Cameroon* SSA Low income Middle income
Sources: Education Country Status Reports (2003&2013), UNESCOInstituteofStatistics.*RESENdoesnotcontainyearofCameroondata.
FIGURE 14: Primary Completion Rates, 1981–2011 (in percent)
40
50
60
80
100
70
90
1991 2001 2011
Cameroon SSA Low income Middle income
Sources: Education Country Status Reports (2003&2013), UNESCOInstituteofStatistics.

BASIC EDUCATION IN CAMEROON 13
… but important disparities persist…
Regions
The Government has identified the three north-
ern regions (Far North, North and Adamawa)
togetherwiththeEastandpocketsofunderserved
areas around urban centers and close to borders,
as “education priority zones” (“Zones d’Éducation
Prioritaires”, ZEP). These ZEP are subject to tar-
getedGovernmentsupporttoraiseschoolingaccess,
attainment, and achievement. In recent years, as
a result of this focalization, the northern regions
haveshownsomeprogressineducationindicators
(Figures18and19).
Despitetheincreasedattentionandprogressshown,
theseregionsstilllagbehindineducationoutcomes.
Comparison between regions shows that in 2011,
primarycompletionratesintheZEPregionsranged
between46percent(intheFarNorth)and81percent
(intheEast),comparedtomorethan94percentin
eachoftheotherregions(Figure20).Thedisparities
inadultilliteracyareevenmorepronounced,where
theFarNorth, theNorth,andAdamawafiguresig-
nificantlyabovethenationalaverageof35percent
(Figure21).Between55and76percentofthepop-
ulationare illiterate inAdamawaandtheFarNorthrespectively,comparedtoonly10and13percentin
theLittoralandCenterregions,respectively.
FIGURE 17: PASEC results in all African Countries tested since 2005 (scale 0–100)
0
20
40
80
60
Gabo
n
Cam
eroo
n
Mad
agas
car
DRC
Buru
ndi
Sene
gal
Togo
Burk
ina
Faso
Cong
o
Chad
Com
ores
Côte
d'Iv
oire
Beni
nAverage score French 5th grade Average score Maths 5th grade
Source: PASEC.
FIGURE 18: Change in Primary Education Attendance, 2001–2007 (in percentage points)
–10
–5
5
0
20
15
10
North
Far N
orth
Wes
t
Litto
ral
Cent
er
Adam
aoua
Sout
h W
est
Sout
h
Yaou
ndé
Doua
la
North
Wes
t
East
Sources: ECAM2&3,WBstaffcalculations.
FIGURE 20: Primary Completion Rates by Region, 2011 (in percent)
0
40
20
100
60
80
Far N
orth
North
Wes
t
Litto
ral
Cent
re
Adam
aoua
Sout
h W
est
Cam
eroo
n
Sout
h
Urba
n
North
Wes
t
East
Rura
l
Source: EducationCountryStatusReport(2013).
FIGURE 19: Change in Adult Literacy, 2001–2007 (in percentage points)
–10
–5
5
0
30
25
10
15
20
North
Far N
orth
Wes
t
Litto
ral
Cent
er
Adam
aoua
Sout
h W
est
Sout
h
Yaou
ndé
Doua
la
North
Wes
t
East
Sources: ECAM2&3,WBstaffcalculations.

CAMEROON ECONOMIC UPDATE14
As the above figures show, there is also a strong
rural-urbandivideinbasiceducationperformance.
Inurbanareas,91percentofthestudentscomplete
primaryschool,comparedtoonly68percentinrural
areas.Theadultilliteracyrateinruralareasis57per-
cent, more than three times higher than in urban
areas(about17percent).Thesefiguresmirrorgeneral
povertyrates,wherethesameregionsaresubjectto
higherlevelsofpovertyaswellaschronicpoverty.
Gender
GenderparityinbasiceducationinCameroonhasnot
improvedsincethe1990s.Onceenrolled,fewergirls
complete primary education than boys. The gender
parityindexforprimarycompletionrateistheratioof
thefemaleprimarycompletionratetothemaleprimary
completionrate,avalueof1 indicatesgenderparity.
InCameroon,theindexvaluewasat0.86in2011,the
samelevelastwentyyearsearlier(Figure22).Overthe
sameperiod,manyothercountrieshavemadesignif-
icantprogresstowardsgenderequalityineducation,
whileCameroonhasmadelittleprogressandhasas
suchfallenbehindinternationalcomparators.
While the overall gender gap remains significant, its
magnitudediffersaccordingtolocation.Forexample,
thenetprimaryschoolattendancerateforgirls,which
istheratioofprimaryschoolagegirlsenrolledinpri-
maryeducationtothetotalnumberofprimaryschool
agegirls,revealsimportantdifferencesbetweenrural
andurbanareas.Inruralareas,primarynetattendance
forgirlsisonlyabout65percent,comparedto79per-
centforboys.Inurbanareas,whereschoolattendance
ishighforallchildren,thegendergapisnarrower.
Income/Wealth
There are significant differences in educational
achievementsbetweenincomegroupsinCameroon.
Whilealmostall(97percent)studentsbelongingtothe
richest20percentfinishprimaryschool,only40per-
centofthepoorestquintiledoso.Figure23showsthe
compositionofthestudentbodyineachoftheeduca-
tionsubsectorsbywealthquintile.Whileenrollmentin
theprimarysectorismoreorlessequallydistributed,
thedistributionbecomesincreasinglyunequalaswe
moveuptheeducationladder.Inthefirstcycleofthe
FIGURE 21: Adult Illiteracy Rate by Region, 2011
0
50
40
30
20
10
80
60
70
Far N
orth
North
Wes
t
Litto
ral
Cent
er
Adam
aoua
Sout
h W
est
Cam
eroo
n
Sout
h
Urba
n
North
Wes
t
East
Rura
l
Source: EducationCountryStatusReport(2013).
FIGURE 22: Gender Parity Index for Primary Completion Rate, 1981–2011
0.6
0.7
0.8
1.0
0.9
1981 1991 2001 2011
Cameroon* SSA Low income Middle income
Source: UNESCOInstituteofStatistics.*nodatafor2001,so2000dataisused.
FIGURE 23: Share of Enrollment in Education Subsectors by Wealth Quintile, 2011 (in percent)
0
40
20
60
100
80
Primary Secondary 1 Secondary 2 Tertiary
Q1 (poorest) Q5 (richest)Q2 Q3 Q4
Source: EducationCountryStatusReport(2013).
BASIC EDUCATION IN CAMEROON 15
secondary,58percentofstudentsarefromthetwo
richestquintiles,comparedto21percentfromthetwo
poorestquintiles.Inthesecondcycleofthesecond-
ary,aswellasinthetertiary,thetworichestquintiles
representalargemajorityofstudents(81and97per-
cent,respectively),whiletherearealmostnostudents
fromthepoorestquintiles.
From a policy point, basic education is “free” in
Cameroon. In spite of this, basic education repre-
sentsrelativelyimportantcoststofamilies—interms
ofactivityandexaminationfees,feesforadditional
(non-governmentpaid)teachers,textbooks,school
uniformsetc.Thecurrentpricingstructureofprimary
enrollmentintroducesintra-regionalinequitiesinthe
system.Parentsarebearingadisproportionatecost
ofprimaryeducationandtheirpreferencefunction
hasresultedinsendingsomechildrentoschooland
notothers(especiallygirls).Poorerhouseholdsare
unabletobearthecost.Theanalysisofallocativeinef-
ficienciesacrosssub-sectorsofeducationisbeyond
thescopeofthisreport.Overallbudgetforeducation
needstobeincreasedandallocativeefficiencyneeds
tobereviewedbasedonquintileanalysis.
… because of inadequate and inefficient resource allocation, utilization and governance problems.
Public and Private Spending
Whyaretheresuchgreatvariationsineducationout-
comes across geographic locations and socioeco-
nomicstatus?Partoftheanswercanbefoundinthe
allocationofresources.AlthoughGovernmentspend-
ing in education has increased from 1.9 percent of
GDPin2000to3.3in2003,ithassincestagnated,
remainingbelowtheregionalaverageof4.3percent
ofGDP(Figure24).
Furthermore, thedistributionof these limitedpub-
lic resources is unequal. In 2011, secondary edu-
cation received a significantly large allocation than
whatwasallocatedtoprimaryorhighereducation.
Incontrast,governmentsinSub-SaharanAfricaput,
onaverage,mostoftheirresourcesinprimaryedu-
cation(Figure25).

CAMEROON ECONOMIC UPDATE16
Disparitiesinpublicspendingarealsosignificantwhen
lookingateducationspendingperstudentinthediffer-
entsub-sectors.Perstudentspending inthesecond
cycleofsecondaryandinthetertiaryaremorethanfive
timeshigherthaninprimaryeducation(Figure26).This
ispartlyaresultofsecondaryandtertiaryeducation
being more expensive per student than for primary
education.Yet,giventhatstudentsfrompoorfamilyare
lesslikelytoreachthesehigherlevelsofeducation(the
secondcycleofthesecondaryortertiary),thispattern
somehowcontributestoanunequaldistributionofedu-
cationspendingbetweenincomegroups.
ThelowGovernmentcontributiontoprimaryeduca-
tionresultsinhighout-of-pocketexpensesforparents
(Figure 27). Also, parents of children enrolled in pri-
maryschoolneedtopayfortextbooks,uniforms,exam
fees,transportationandsometimesextrafeesforextra
homeclasses.Privatefinancingisalsousedtopayfor
teachersthroughParents-TeachersAssociation(PTA)
feecollectionatbothprimaryandsecondaryeduca-
tionlevels(about18percentofprimaryschoolteach-
ersarepaidbyparents).Hence,althoughprimaryedu-
cationisofficiallyfree,inpracticeitisnot.
Theresultinghighcostofprimaryeducationmeans
manyfamiliescannotaffordtosendtheirchildrento
school.Accordingtothelatestsurveyonemployment
andtheinformalsector,lackoffinancingrankedas
themainreasonforchildrendroppingoutofschool
(Figure28).
Weak governance and accountability further under-
minestheefficiencyoftheseslimitedpublicresources
invested in education. In 2013, Transparency
InternationalrankedtheCameroonianeducationsys-
temasbeingperceivedasthefifthmostcorruptinSub-
SaharanAfrica(Figure29).Thesamestudyrevealed
that 72 percent of the population think the educa-
tion sector is “corrupt” or “extremely corrupt” (Sub-
SaharanAfricaaveragewas57percent,whiletheglobal
averagestoodat41percent)andthat36percentofthe
peopleincontactwiththeeducationsystempaidabribe
inthelast12months(Sub-SaharanAfricaaveragewas
31percent,whiletheglobalaveragestoodat16percent).
Data availability
Accesstoreliableandtimelydataonsectorperfor-
mance hampers accountability. The current edu-
cation management information system (EMIS)
in Cameroon is fragmented, with five ministries
FIGURE 24: Public Expenditure on Education, 2010 (in percent of GDP)
0.0
2.0
1.0
3.0
5.0
4.0
Sub-SaharanAfrica
Cameroon Low incomecountries
Middle incomecountries
Sources: EducationCountryStatusReport(2013)andWBEducationStatistics.
FIGURE 25: Current Education Spending by Sub-sector, 2011 (in percent of total education spending)
0
20
10
30
50
40
Primary Secondary Tertiary
Sub-Saharan Africa Cameroon
Source: EducationCountryStatusReport(2013).
FIGURE 26: Current Education Spending per Student by Sub-Sector, 2011 (in CFAF thousands per student)
0
100
200
300
Primary Secondary 1 Secondary 2 Tertiary
Source: EducationCountryStatusReport(2013)andWBstaffcalcula-tions.
BASIC EDUCATION IN CAMEROON 17
responsible for education collecting data for their
ownsub-sectorandwithconsiderablevariability in
dataquality.
In2011,theMinistryofBasicEducationintroducedthe
SchoolReportCard,adatabasecontaininginforma-
tioncollectedforthetraditionalstatisticalyearbook.
TheSchoolReportCardcontainsthreeindices,acon-
textindex(takingintoaccountavailabilityofelectric-
ity,watersupplyandtypeoftoilets),aresourcesindex
(pupils per teacher, textbook, classroom and desk)
andaperformance index(passrate,drop-outrate,
rateofrepeaters),thatallowacomparisonofneeds
andperformancebyschool.Contrarytothecentral-
izedstatisticalyearbooks,thenewtoolalsoallowsall
actorsofthesystem(institutionalorcommunities)to
obtain information regarding their level of interven-
tion(school,sub-division,regionetc.).However,sofar
thisinformationisnotyettransferredtotheactorson
thegroundanditsusestillhastobeinstitutionalized.
Performance Monitoring
A study on governance in education (World Bank
2012a)focusingonthreeregionswithdifferentprofiles
(NorthWest,Littoral,andFarNorth) foundthat the
currentmonitoringsystemforteachersandschoolsis
weakandlacksclearlydefinedstandardsandexpec-
tations.Theexistingsystemofsanctionsandincen-
tivesisnotalwaysappliedandlacksrigorinpromoting
betterschoolperformance.Theworkofregularcivil
servant teachers in basic and secondary education
isevaluatedviaconfidentialreports,whichareunre-
latedtosectoractivities.Althoughtheworkofcontract
teachershiredbytheCenterforprimaryschoolsare
FIGURE 27: Share of Parent’s Contribution in National Expenditure for Education, 2011 (in percent)
0
20
10
30
50
40
Niger Senegal Chad Mali Congo Cameroon
Source: EducationCountryStatusReport(2013).
FIGURE 28: Reasons for Drop-outs, 2010 (in percent)
Other
Distance
Failure
Work
Lack of finance
Pregnancy/marriage
Illness
0 10 20 30
Girls
40 50 60
Boys
Source: EESI2.
FIGURE 29: Education Sector Corruption Perception Index, 2013 (Score scale 1–5, where 1 means not at all corrupt, 5 means extremely corrupt)
1
2
3
4
5
Ghan
a
Sier
ra L
eone
Zim
babw
e
Suda
n
Mad
agas
car
SSA
aver
age
Buru
ndi
Nige
ria
Sene
gal
Sout
h Su
dan
Ugan
da
Glob
al a
vera
ge
Ethi
opia
Keny
a
Sout
h Af
rica
Rwan
da
Libe
ria
Moz
ambi
que
Tanz
ania
Zam
bia
Cam
eroo
n
DRC
Mal
awi
Source: TransparencyInternational.
CAMEROON ECONOMIC UPDATE18
morecloselymonitored,thishaslittleimpactontheir
performance.Themonitoringofschoolandteacher
performanceisparticularlyweakinbasiceducation,
whilethereseemstobemoreaccountabilityinsecond-
aryeducation—likelyaresultofthenation-wideexam-
inationsthatarerequiredtobepassedbyanystudent
beforehecanmovetothenextlevelofeducation.
Sinceaccountabilityforperformanceinbasiceduca-
tion,especiallywithregardstoimprovingquality,is
imperfectattheschoollevel,thenextlevel,thesub-
division inspectorate, needs to play a critical role
in monitoring school performance. Inspectors are
expectedtovisiteachschoolseveraltimesduringthe
yearandsurprisevisitsareencouraged.However,in
practice,inspectorsfacesevereconstraintsintrav-
ellingtoschools.Theyoftendonothavetransport
and,iftheydo,theroadsareoftenbad.Mostimpor-
tant, this administrative level is seriously under-
staffed, making effective performance monitoring
adifficulttask.
Teachers
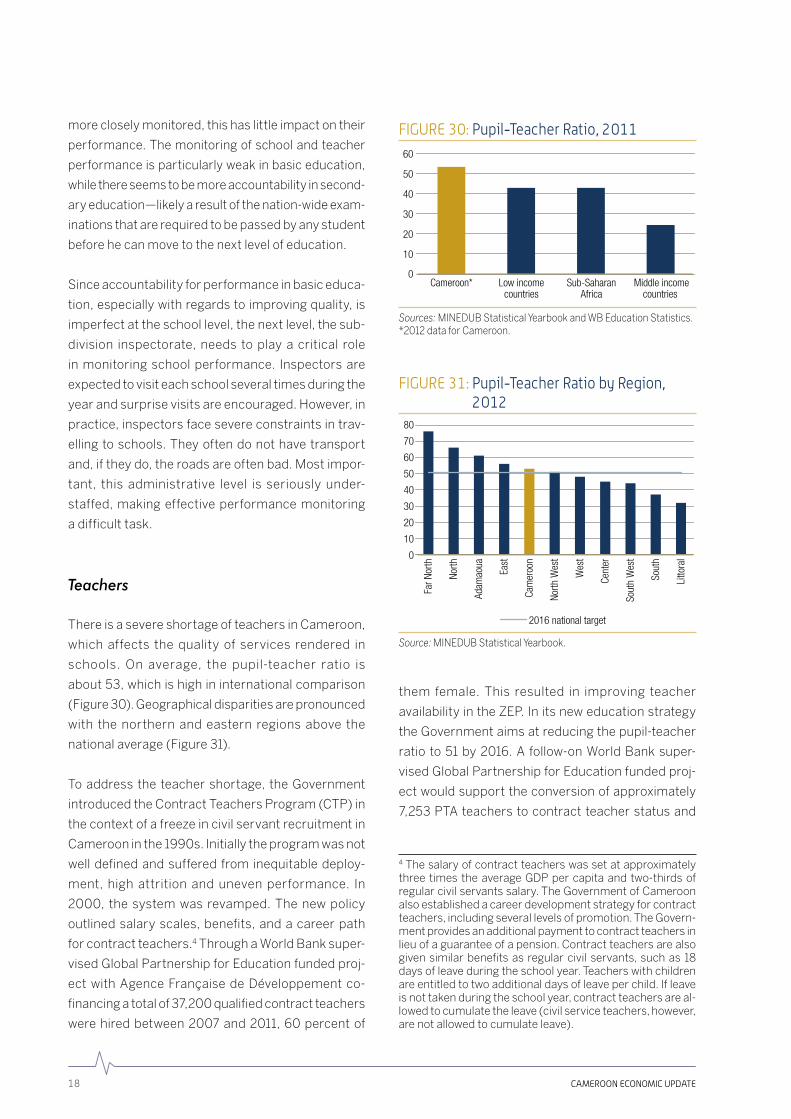
ThereisasevereshortageofteachersinCameroon,
which affects the quality of services rendered in
schools. On average, the pupil-teacher ratio is
about53,whichishighininternationalcomparison
(Figure30).Geographicaldisparitiesarepronounced
with the northern and eastern regions above the
nationalaverage(Figure31).
To address the teacher shortage, the Government
introducedtheContractTeachersProgram(CTP)in
thecontextofafreezeincivilservantrecruitmentin
Camerooninthe1990s.Initiallytheprogramwasnot
well defined and suffered from inequitable deploy-
ment, high attrition and uneven performance. In
2000, the system was revamped. The new policy
outlined salary scales, benefits, and a career path
forcontractteachers.4ThroughaWorldBanksuper-
visedGlobalPartnershipforEducationfundedproj-
ect with Agence Française de Développement co-
financingatotalof37,200qualifiedcontractteachers
were hired between 2007 and 2011, 60 percent of
them female. This resulted in improving teacher
availabilityintheZEP.Initsneweducationstrategy
theGovernmentaimsatreducingthepupil-teacher
ratio to 51 by 2016. A follow-on World Bank super-
visedGlobalPartnershipforEducationfundedproj-
ectwouldsupporttheconversionofapproximately
7,253PTAteacherstocontractteacherstatusand
FIGURE 30: Pupil-Teacher Ratio, 2011
30
20
10
0
60
40
50
Low incomecountries
Sub-SaharanAfrica
Middle incomecountries
Cameroon*
Sources: MINEDUBStatisticalYearbookandWBEducationStatistics.*2012dataforCameroon.
FIGURE 31: Pupil-Teacher Ratio by Region, 2012
0
50
40
30
20
10
80
60
70Fa
r Nor
th
North
Wes
t
Cent
er
Adam
aoua
Sout
h W
est
Cam
eroo
n
Sout
h
Litto
ral
North
Wes
t
East
2016 national target
Source: MINEDUBStatisticalYearbook.
4Thesalaryofcontractteacherswassetatapproximatelythree times the average GDP per capita and two-thirds ofregularcivilservantssalary.TheGovernmentofCameroonalsoestablishedacareerdevelopmentstrategyforcontractteachers,includingseverallevelsofpromotion.TheGovern-mentprovidesanadditionalpaymenttocontractteachersinlieuofaguaranteeofapension.Contractteachersarealsogiven similar benefits as regular civil servants, such as 18daysofleaveduringtheschoolyear.Teacherswithchildrenareentitledtotwoadditionaldaysofleaveperchild.Ifleaveisnottakenduringtheschoolyear,contractteachersareal-lowedtocumulatetheleave(civilserviceteachers,however,arenotallowedtocumulateleave).
BASIC EDUCATION IN CAMEROON 19
about1,747newrecruitsascontractteachersover
thenextfouryears.
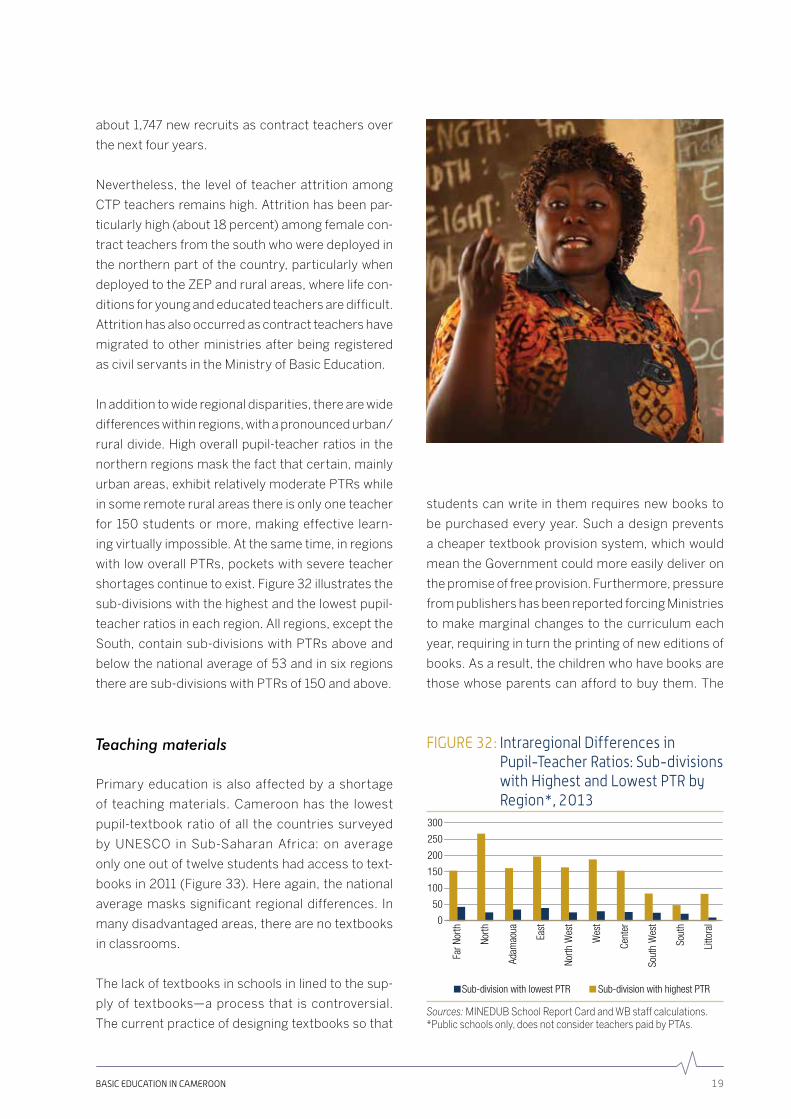
Nevertheless, the level of teacher attrition among
CTPteachersremainshigh.Attritionhasbeenpar-
ticularlyhigh(about18percent)amongfemalecon-
tractteachersfromthesouthwhoweredeployedin
thenorthernpartofthecountry,particularlywhen
deployedtotheZEPandruralareas,wherelifecon-
ditionsforyoungandeducatedteachersaredifficult.
Attritionhasalsooccurredascontractteachershave
migrated to other ministries after being registered
ascivilservantsintheMinistryofBasicEducation.
Inadditiontowideregionaldisparities,therearewide
differenceswithinregions,withapronouncedurban/
ruraldivide.Highoverallpupil-teacherratios in the
northernregionsmaskthefactthatcertain,mainly
urbanareas,exhibitrelativelymoderatePTRswhile
insomeremoteruralareasthereisonlyoneteacher
for 150 students or more, making effective learn-
ingvirtuallyimpossible.Atthesametime,inregions
with lowoverallPTRs,pocketswithsevereteacher
shortagescontinuetoexist.Figure32illustratesthe
sub-divisionswiththehighestandthelowestpupil-
teacherratiosineachregion.Allregions,exceptthe
South, contain sub-divisions with PTRs above and
belowthenationalaverageof53andinsixregions
therearesub-divisionswithPTRsof150andabove.
Teaching materials
Primary education is also affected by a shortage
of teaching materials. Cameroon has the lowest
pupil-textbook ratio of all the countries surveyed
by UNESCO in Sub-Saharan Africa: on average
onlyoneoutoftwelvestudentshadaccesstotext-
booksin2011(Figure33).Hereagain,thenational
average masks significant regional differences. In
manydisadvantagedareas,therearenotextbooks
inclassrooms.
Thelackoftextbooksinschoolsinlinedtothesup-
ply of textbooks—a process that is controversial.
Thecurrentpracticeofdesigningtextbookssothat
students can write in them requires new books to
be purchased every year. Such a design prevents
acheapertextbookprovisionsystem,whichwould
meantheGovernmentcouldmoreeasilydeliveron
thepromiseoffreeprovision.Furthermore,pressure
frompublishershasbeenreportedforcingMinistries
to make marginal changes to the curriculum each
year,requiringinturntheprintingofneweditionsof
books.Asaresult,thechildrenwhohavebooksare
those whose parents can afford to buy them. The
FIGURE 32: Intraregional Differences in Pupil-Teacher Ratios: Sub-divisions with Highest and Lowest PTR by Region*, 2013
0
150
100
50
300
200
250
Far N
orth
North
Wes
t
Cent
er
Adam
aoua
Sout
h W
est
Sout
h
Litto
ral
North
Wes
t
East
Sub-division with lowest PTR Sub-division with highest PTR
Sources: MINEDUBSchoolReportCardandWBstaffcalculations.*Publicschoolsonly,doesnotconsiderteacherspaidbyPTAs.

CAMEROON ECONOMIC UPDATE20
rest of the children—the vast majority, especially
in the northern regions—are deprived of access to
textbooks.
Looking forward, tackling these issues would strengthen the basic education system
Improving data collection
Improved accountability will require a solid and
reliable education management information sys-
tem(EMIS).ThecurrentstatusoftheEMISisrela-
tivelyweakandofpoorquality. In thiscontext, the
Governmentanditspartnersaretakingthefollow-
ing actions to strengthen production of education
statistics:
i. UNESCO is supporting Government efforts to
createandlinkregionallycomparabledata.
ii. MINEDUBisplanningtomainstreamtheuseof
itsSchoolReportCarddatabaseaspartofthe
efforts to decentralize the education system.
Additionally, it is envisaging the geo-referenc-
ingofschoolsandlinkingthisdatatotheSchool
ReportCards.
iii. UNICEF is undertaking a pilot data collection
andschoolmappingexerciseintheZEPtocap-
ture information on various equity indicators
fromschools.Thepilotwouldresultinnewdata
being collected on refugees, disabled children,
andminoritypopulations(e.g.Baka, Mbororo).
Thedatawouldincludedistrictandschoollevel
information by gender thus allowing deeper
analysis on gender disparities, and serve as a
tool for improved planning and tracking of the
most vulnerable children (girls, ethnic minori-
ties,refugees).
PoliticalwillisessentialtoimprovetheEMIS,partic-
ularlyatsecondaryeducationlevel,andthefinancial
andtechnicalmeanstomaintainanadequateEMIS.
Thelackofcomprehensive,reliableandrecentdata
on education cannot be resolved by external inter-
ventionsalone.
Rationalizing resource allocation and improving systemic efficiency
Theongoingimprovementineducationdataprovides
theGovernmentwithanopportunitytoincreasethe
budgetforeducation,introduceefficienciesinresource
allocationanduse,andalignpublicspendingmoreeas-
ilytoneeds.Withrespecttorationalizingthedistribu-
tion of resources budget analysis shows that there
is continuous bias towards the Center and Littoral
regionsprimarilyexplainedbypoliticalconsiderations.
Targetinginvestmentsindisadvantagedareas(rural
areas,thethreenorthernregionsandtheEast,pock-
etsofunder-servedareasaroundurbancentersand
closetoborders)wouldcontributetogreaterequity
FIGURE 33: Pupil-Textbook Ratio, 2011
0
2
8
6
4
10
14
12
Seyc
helle
s
Mau
ritiu
s
Guin
ea
Beni
n
Gam
bia
Mal
i
Cape
Ver
de
Eritr
ea
Swaz
iland
Burk
ina
Faso
Nige
r
STP
Rwan
da
CAR
Moz
ambi
que
Mal
awi
Cong
o
Zam
bia
Togo
Ugan
da
Libe
ria
Buru
ndi
Chad
Cam
eroo
n
Source: UNESCOInstituteofStatistics.
BASIC EDUCATION IN CAMEROON 21
and equality of opportunity to education. The data
wouldalsoallowtheadministrationtoidentifyschools
in difficulty and take action to help these schools
improve.
TheEducationCountryStatusReportshowsthatpri-
maryeducationhasthebiggestdevelopmentimpact.It
iskeytofightilliteracyandaccountsforthebiggestshare
of education’s positive effects on income and health.
Primaryeducationisessentialtoaccessinghigherlev-
elsofeducation.Cameroonisaspiringtoconsolidateits
statusasamiddle-incomecountry.Therefore,continued
emphasisonprimaryeducationisessentialtoensure
educationforall.Atthesametime,theprimarysector
inCameroonischronicallyunderfunded.
Greater numbers of students are graduating from
primarytosecondaryeducation.Thisisthereason
forrelativelyhigherallocationtosecondaryeduca-
tion.Furthermore,secondaryeducationcurriculum
isrelativelylarge.Thishasrequiredmorenumbersof
specializedandlesspolyvalentteachers.Thismakes
secondary education quite expensive. At present
Governmentdependsonexternalgrantsforprimary
education.However,Governmenthascommittedto
increasingthebudgetforeducationandforprimary
educationspecificallyoverthecourseofthenextfew
years.Aportionofadditionalresourcesforprimary
educationcouldalsobegeneratedbyimprovingeffi-
cienciesinpublicspending.Thepolicyactionsrequire
politicalwillingnessandasupportingpoliticalecon-
omyenvironment.Finally,anyadditionalresourcesto
primaryeducationshouldbetargetedtoinputsthat
improvelearningachievements.
Assessing more systematically student learning
Thereisnonationalassessmentsframework withfor-
mativestudentlearningevaluations.Studentlearn-
ing achievement is mainly tested at the end of the
primary and secondary education cycles through
high-stakes exams. Cameroon has participated in
atleastthreeroundsoftheProgramfortheAnalysis
ofEducationSystems(PASEC)andhascarriedout
anationalEarlyGradeReadingAssessment(EGRA).
TheGovernmentiskeentoadministertheECRAonce
againandanEarlyGradeMathematicsAssessment
(EGMA). It will be important to place such assess-
ments within a more systematic national assess-
mentframeworkthatemphasizesthedevelopment
ofnationaltechnicalcapacityforassessment,wider
sharing of assessment results, and improving the
feedback loop from assessment results to those
responsibleforcurriculumandteachertraining.
Increasing budget transparency
The2012WorldBankstudyongovernanceinedu-
cationrevealedthatpublicschoolresourcesarenot
transparentlyallocatedandthatthereareinstances
of inefficient resource management. Against this
backdrop, the role of stakeholders at the regional
level will be crucial to engage in collective actions
that will promote good governance and increased
accountability.Localcommunitieswillneedtoplay
an important role in demanding schools to pub-
lishandpubliclyannouncethelevelofstatefunding
received,thetimeofreceiptoffunding,andthepro-
posedusesofthefunds.Inaddition,parents-teach-
ers’association(PTA)contributionsanduseshould
bemadepublic.
Revising textbook policy
Thenationaltextbookpolicyiscurrentlyunderrevi-
sionbyGovernmentandpublishers.Theadministra-
tionplanstograduallymovefromaprivatelyfinanced
systemtoastate-fundedsysteminwhichtheadmin-
istrationsuppliestextbooks.Thisreformwouldsig-
nificantlyimprovetheavailabilityoftextbooks,which
is considered one the most cost-effective way of
improvingthequalityoflearning.
Withinthisframework,theissueofdurabilityoftext-
bookswouldneedtobeaddressed.Inordertomake
aGovernment-financedsystemfeasible, textbooks
willhave tobereused forat least three, preferably
four years. This means that (i) the books cannot
CAMEROON ECONOMIC UPDATE22
bedesignedsothatthestudentswriteinthem;and
(ii)thattheschoolmustpreservethebookssothey
canbeissuedtothenextyearintake,andreusedin
asimilarmannerforaminimumofthreeyears.They
mustthereforebephysicallydurableenoughtolast
threetofouryears.
CAMEROON ECONOMIC UPDATE 23
REFERENCES
Institut National de la Statistique (2008), ECAM
3. Enquête Camerounaise auprès des ménages.
Tendances, profils et déterminants de la pauvreté au
Cameroun entre 2001–2007,Yaoundé.
InstitutNationaldelaStatistique,(2011),Deuxième
Enquête sur l’Emploi et le Secteur Informel (EESI 2).
Phase 1: Enquête sur l’Emploi. Rapport Principal,
Yaoundé.
InstitutNationaldelaStatistique,(2011),Deuxième
Enquête sur l’Emploi et le Secteur Informel (EESI 2).
Phase 2: Enquête sur le Secteur Informel. Rapport
Principal,Yaoundé.
République du Cameroun (2009). Document de
Stratégie pour la Croissance et l’Emploi (DSCE),
Yaoundé.
RépubliqueduCameroun(2011),Rapport provisoire
sur l’évaluation des acquis scolaires en CM1/Class
5 au Cameroun, Ministère de l’Éducation de Base,
Yaoundé.
République du Cameroun (2013a), Document
de Stratégie de l’Éducation et de la Formation,
Ministère de l’Économie, de la Plannification et de
l’AménagementduTerritoire,Yaoundé.
République du Cameroun (2013b), Le Système
d’Education et de Formation du Cameroun dans la
Perspective de l’Emergence,Yaoundé.
République du Cameroun (2013c), Maquette annu-
aire statistiques 2012. Document de travail.Ministère
d’ÉducationdeBase.Yaoundé.
République du Cameroun (2013d), Tableau de
Bord Ecole 2012/13. Document de travail.Ministère
d’ÉducationdeBase.Yaoundé
World Bank (2012a), Cameroon: Governance and
Management in the Education Sector, Washington,
D:C:
World Bank (2012b), Implementation Completion
and Results Report on a Catalytic Fund Grant for an
Education For All-Fast Track Initiative: Support to the
Education Sector,Washington,D.C.
World Bank (2013), Implementation Completion
and Results Report on a Credit to the Government of
Cameroon for an Education Development Capacity
Building Project,Washington,D.C.
Databases
Programmed’AnalysedesSystèmesÉducatifsdela
CONFEMEN (PASEC), http://www.confemen.org/
le-pasec/acces-aux-donnees-du-pasec
Transparency International Corruption Perception
Index,cpi.transparency.org
UNESCOInstituteofStatistics,www.uis.unesco.org
World Bank Education Statistics, databank.world-
bank.org
World Bank World Development Indicators, data-
bank.worldbank.org