cambridge international examinations cambridge international advanced...
TRANSCRIPT
This document consists of 14 printed pages and 2 blank pages.
DC (LK/FD) 124665/3© UCLES 2017 [Turn over
Cambridge International ExaminationsCambridge International Advanced Subsidiary and Advanced Level
*9
87
35
61
30
0*
BIOLOGY 9700/32Paper 3 Advanced Practical Skills 2 May/June 2017 2 hoursCandidates answer on the Question Paper.Additional Materials: As listed in the Confidential Instructions.
READ THESE INSTRUCTIONS FIRST
Write your Centre number, candidate number and name on all the work you hand in.Write in dark blue or black pen.You may use an HB pencil for any diagrams or graphs.Do not use staples, paper clips, glue or correction fluid.DO NOT WRITE IN ANY BARCODES.
Answer all questions.
Electronic calculators may be used.You may lose marks if you do not show your working or if you do not use appropriate units.
At the end of the examination, fasten all your work securely together.The number of marks is given in brackets [ ] at the end of each question or part question.
For Examiner’s Use
1
2
Total
PMT

2
9700/32/M/J/17© UCLES 2017
BLANK PAGE
PMT
3
9700/32/M/J/17© UCLES 2017 [Turn over
Before you proceed, read carefully through the whole of Question 1 and Question 2.
Plan the use of the two hours to make sure that you finish all the work that you would like to do.
If you have enough time, think about how you can improve the accuracy of your results, for example by obtaining and recording one or more additional measurements.
You will gain marks for recording your results according to the instructions.
1 The enzyme, E, catalyses the reaction of urea with water to form ammonium carbonate.
Aqueous ammonium carbonate produces ammonium ions forming an alkaline solution. This solution causes red litmus paper to change to blue.
The end-point of the reaction is when all of the surface of the red litmus paper is blue.
Molecule S may affect the activity of the enzyme, E.
You are required to: • prepare a serial dilution of a 0.3% solution of S • prepare a control to show that the results for this investigation are due to the effects of S • record the time taken to reach the end-point for each of the concentrations of S and the
control.
You are provided with:
labelled contents hazard volume / cm3
S 0.3% solution of S none 25
W distilled water none 100
U 10% urea solution none 100
E enzyme solution harmfulirritant 30
labelled contents hazard quantity
R red litmus paper none 2 strips
If E comes into contact with your skin, wash it off immediately under cold water.
It is recommended that you wear suitable eye protection.
PMT
4
9700/32/M/J/17© UCLES 2017
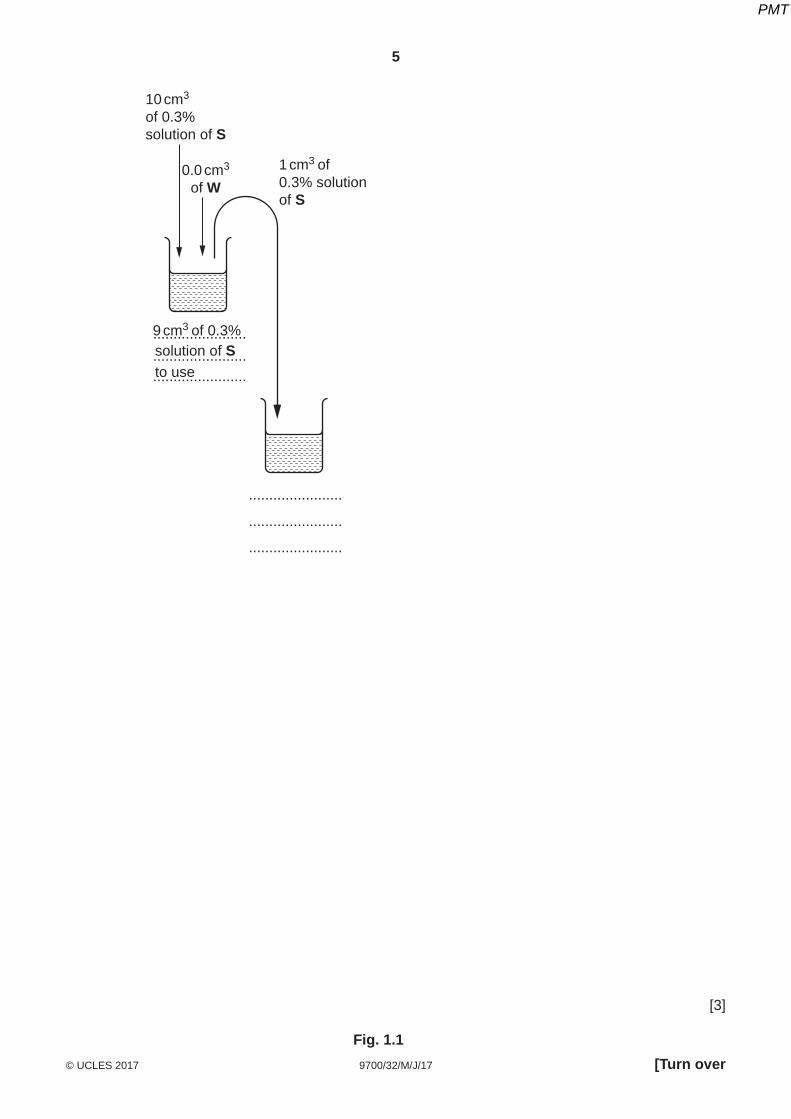
(a) You are required to prepare a serial dilution of the 0.3% solution of S which reduces the concentration by a factor of 10 between each successive dilution.
You will need to prepare 9 cm3 of each concentration.
Fig. 1.1 shows the first two beakers you will use to make your serial dilution.
(i) Complete Fig. 1.1 by drawing as many extra beakers as you need for your serial dilution.
For each beaker:
• state, under the beaker, the volume and concentration of the solution available for use in the investigation
• use one arrow, with a label above the beaker, to show the volume and concentration of the solution of S added to prepare the concentration
• use another arrow, with a label above the beaker, to show the volume of W added to prepare the concentration.
PMT
5
9700/32/M/J/17© UCLES 2017 [Turn over
.......................
.......................
.......................
.......................
.......................
.......................
9 cm3 of 0.3%
10 cm3
of 0.3%solution of S
solution of Sto use
1 cm3 of0.3% solutionof S
0.0 cm3
of W
[3]
Fig. 1.1
PMT
6
9700/32/M/J/17© UCLES 2017
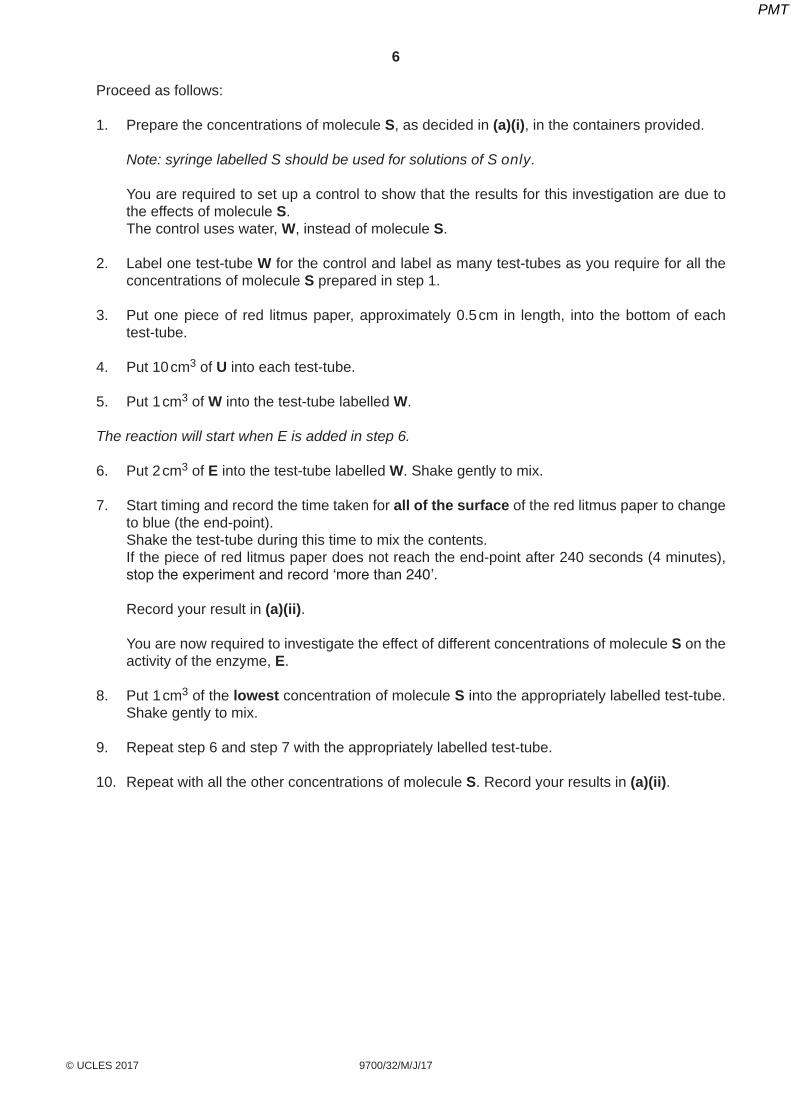
Proceed as follows:
1. Prepare the concentrations of molecule S, as decided in (a)(i), in the containers provided.
Note: syringe labelled S should be used for solutions of S only.
You are required to set up a control to show that the results for this investigation are due to the effects of molecule S.
The control uses water, W, instead of molecule S.
2. Label one test-tube W for the control and label as many test-tubes as you require for all the concentrations of molecule S prepared in step 1.
3. Put one piece of red litmus paper, approximately 0.5 cm in length, into the bottom of each test-tube.
4. Put 10 cm3 of U into each test-tube.
5. Put 1 cm3 of W into the test-tube labelled W.
The reaction will start when E is added in step 6.
6. Put 2 cm3 of E into the test-tube labelled W. Shake gently to mix.
7. Start timing and record the time taken for all of the surface of the red litmus paper to change to blue (the end-point).
Shake the test-tube during this time to mix the contents. If the piece of red litmus paper does not reach the end-point after 240 seconds (4 minutes),
stop the experiment and record ‘more than 240’.
Record your result in (a)(ii).
You are now required to investigate the effect of different concentrations of molecule S on the activity of the enzyme, E.
8. Put 1 cm3 of the lowest concentration of molecule S into the appropriately labelled test-tube. Shake gently to mix.
9. Repeat step 6 and step 7 with the appropriately labelled test-tube.
10. Repeat with all the other concentrations of molecule S. Record your results in (a)(ii).
PMT
7
9700/32/M/J/17© UCLES 2017 [Turn over
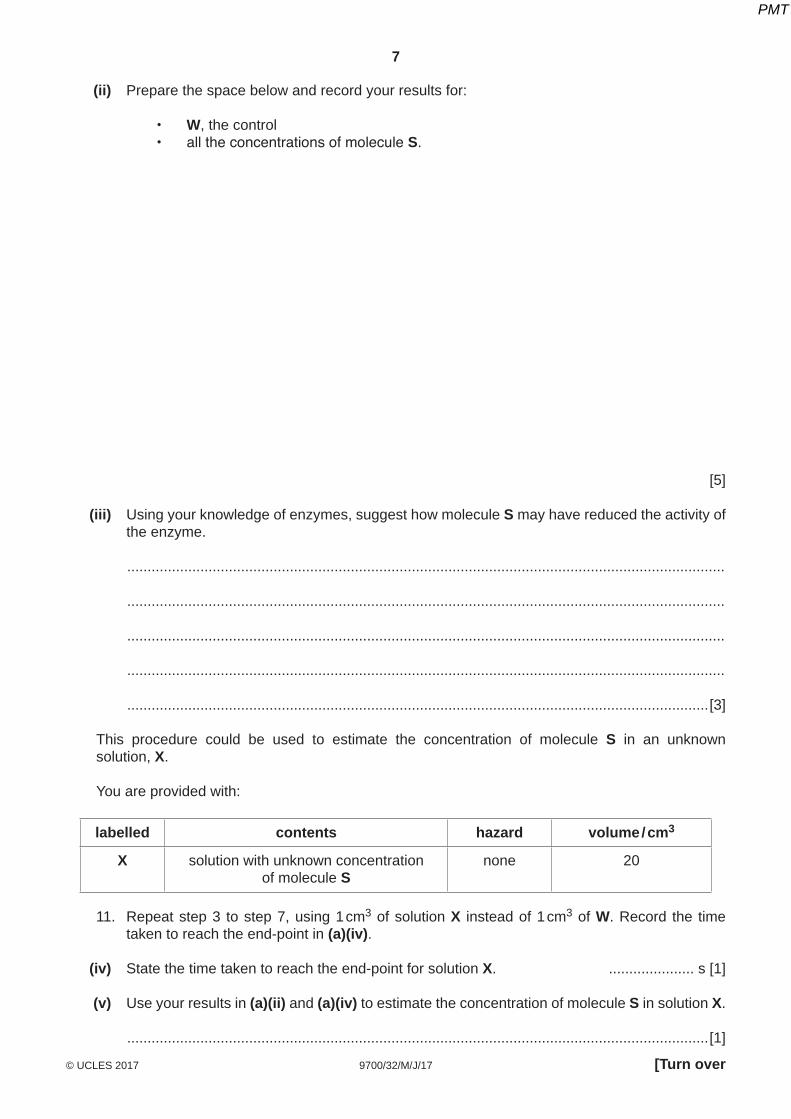
(ii) Prepare the space below and record your results for:
• W, the control • all the concentrations of molecule S.
[5]
(iii) Using your knowledge of enzymes, suggest how molecule S may have reduced the activity of the enzyme.
...................................................................................................................................................
...................................................................................................................................................
...................................................................................................................................................
...................................................................................................................................................
...............................................................................................................................................[3]
This procedure could be used to estimate the concentration of molecule S in an unknown solution, X.
You are provided with:
labelled contents hazard volume / cm3
X solution with unknown concentration of molecule S
none 20
11. Repeat step 3 to step 7, using 1 cm3 of solution X instead of 1 cm3 of W. Record the time taken to reach the end-point in (a)(iv).
(iv) State the time taken to reach the end-point for solution X. ..................... s [1]
(v) Use your results in (a)(ii) and (a)(iv) to estimate the concentration of molecule S in solution X.
...............................................................................................................................................[1]
PMT
8
9700/32/M/J/17© UCLES 2017
(vi) Describe one significant source of error in this investigation.
...................................................................................................................................................
...................................................................................................................................................
...............................................................................................................................................[1]
(vii) Describe how you could use this procedure to produce a more accurate estimate of the concentration of molecule S in solution X than the one given in (a)(v).
...................................................................................................................................................
...................................................................................................................................................
...................................................................................................................................................
...................................................................................................................................................
...................................................................................................................................................
...................................................................................................................................................
...............................................................................................................................................[3]
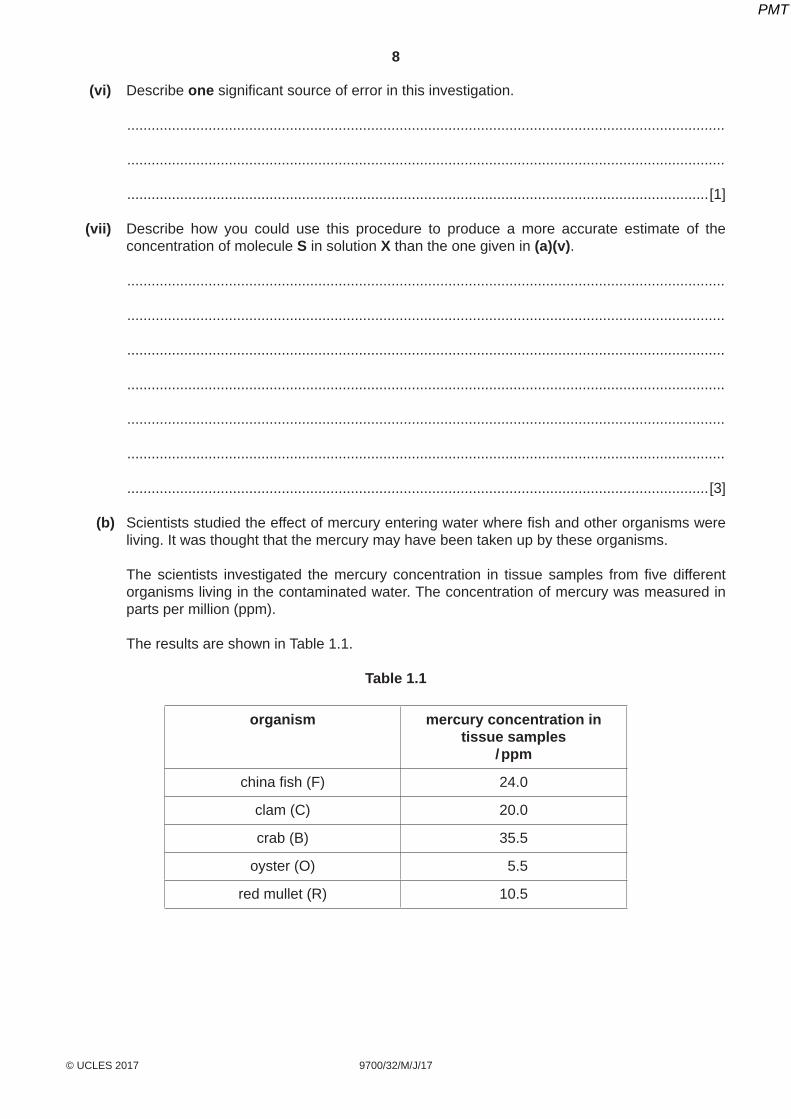
(b) Scientists studied the effect of mercury entering water where fish and other organisms were living. It was thought that the mercury may have been taken up by these organisms.
The scientists investigated the mercury concentration in tissue samples from five different organisms living in the contaminated water. The concentration of mercury was measured in parts per million (ppm).
The results are shown in Table 1.1.
Table 1.1
organism mercury concentration in tissue samples
/ ppm
china fish (F) 24.0
clam (C) 20.0
crab (B) 35.5
oyster (O) 5.5
red mullet (R) 10.5
PMT
9
9700/32/M/J/17© UCLES 2017 [Turn over
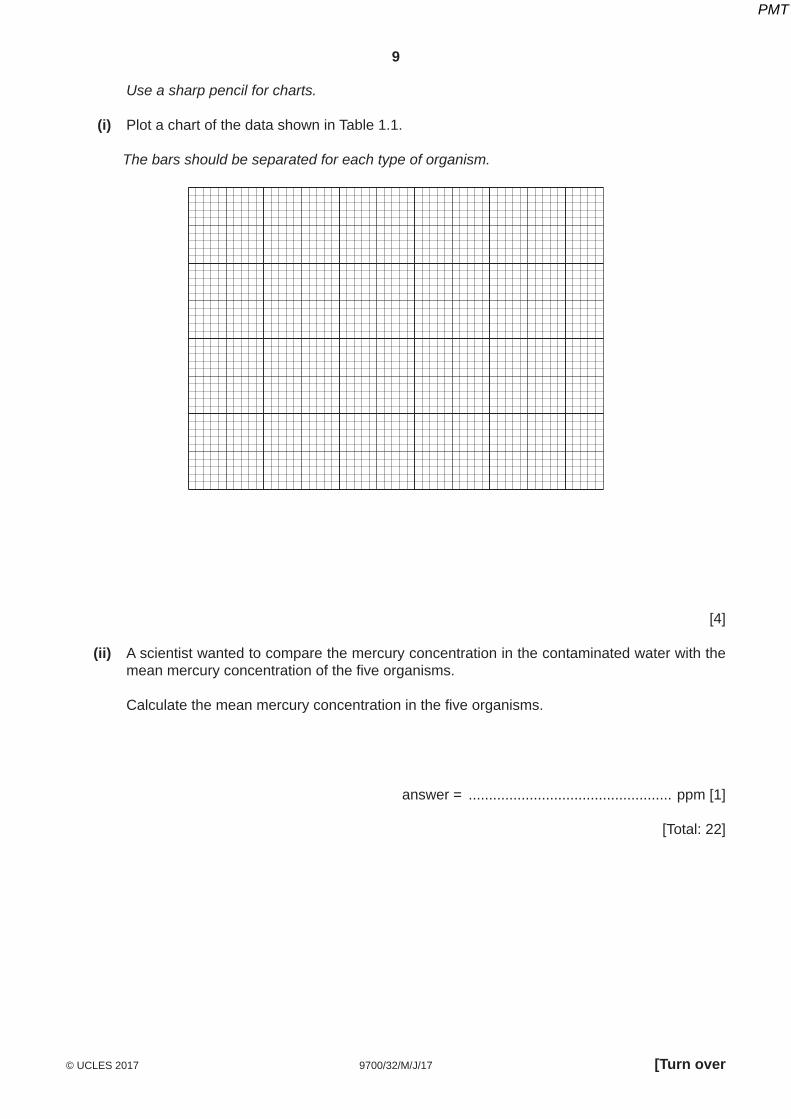
Use a sharp pencil for charts.
(i) Plot a chart of the data shown in Table 1.1.
The bars should be separated for each type of organism.
[4]
(ii) A scientist wanted to compare the mercury concentration in the contaminated water with the mean mercury concentration of the five organisms.
Calculate the mean mercury concentration in the five organisms.
answer = .................................................. ppm [1]
[Total: 22]
PMT
10
9700/32/M/J/17© UCLES 2017
2 M1 is a slide of a stained transverse section through a plant stem.
You are not expected to be familiar with this specimen.
(a) Observe the different tissues on M1 and select a field of view that shows part of the epidermis and the vascular bundles.
Use a sharp pencil for drawing.
(i) Draw a large plan diagram from the selected field of view which shows: • part of the epidermis • only three vascular bundles • any other observable tissues.
You are expected to draw the correct shape and proportions of the different tissues.
Use one ruled label line and label to identify the xylem in one vascular bundle.
[5]
PMT
11
9700/32/M/J/17© UCLES 2017 [Turn over
(ii) Observe the central tissue in the stem on M1. These cells are not identical.
Select one group of four adjacent (touching) cells which show some of the differences between these cells. Each cell must touch at least two of the other cells.
Make a large drawing of this group of four cells.
Use one ruled label line and label to identify the cell wall of one cell.
[5]
PMT
12
9700/32/M/J/17© UCLES 2017
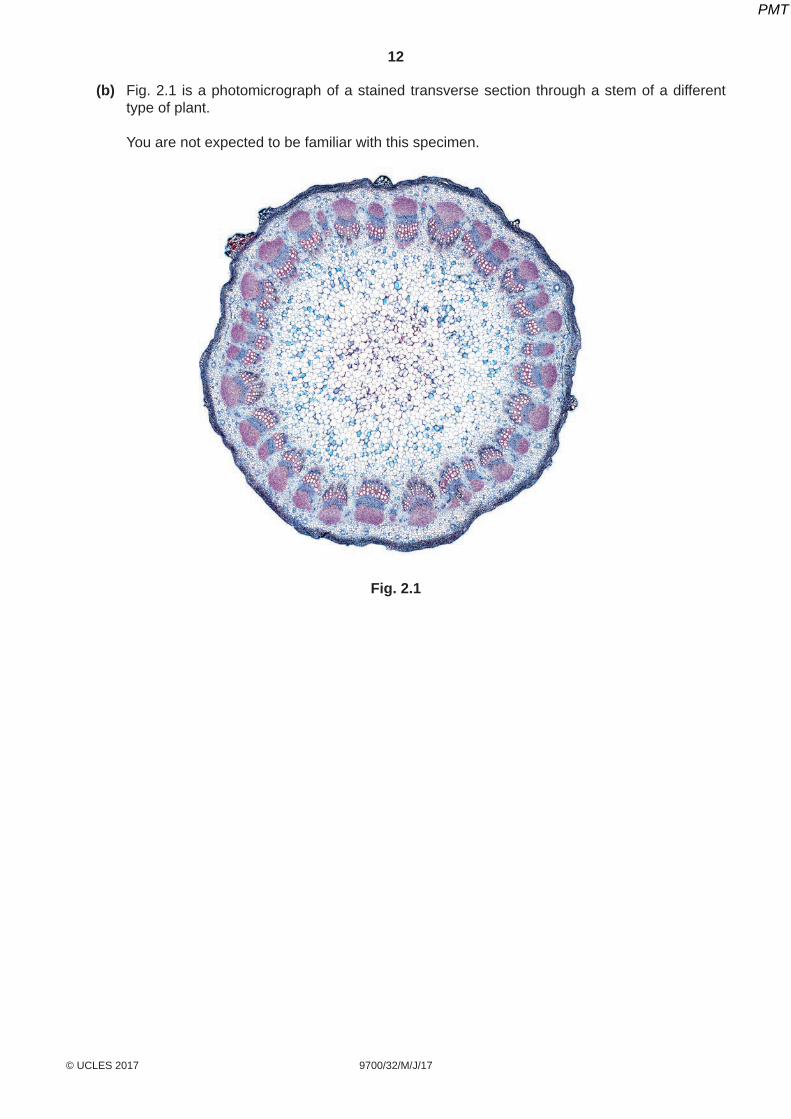
(b) Fig. 2.1 is a photomicrograph of a stained transverse section through a stem of a different type of plant.
You are not expected to be familiar with this specimen.
Fig. 2.1
PMT
13
9700/32/M/J/17© UCLES 2017 [Turn over
(i) Prepare the space below so that it is suitable for you to record the observable differences between the stem on M1 and the stem in Fig. 2.1.
Record your observations in the space you have prepared.
[4]
PMT
14
9700/32/M/J/17© UCLES 2017
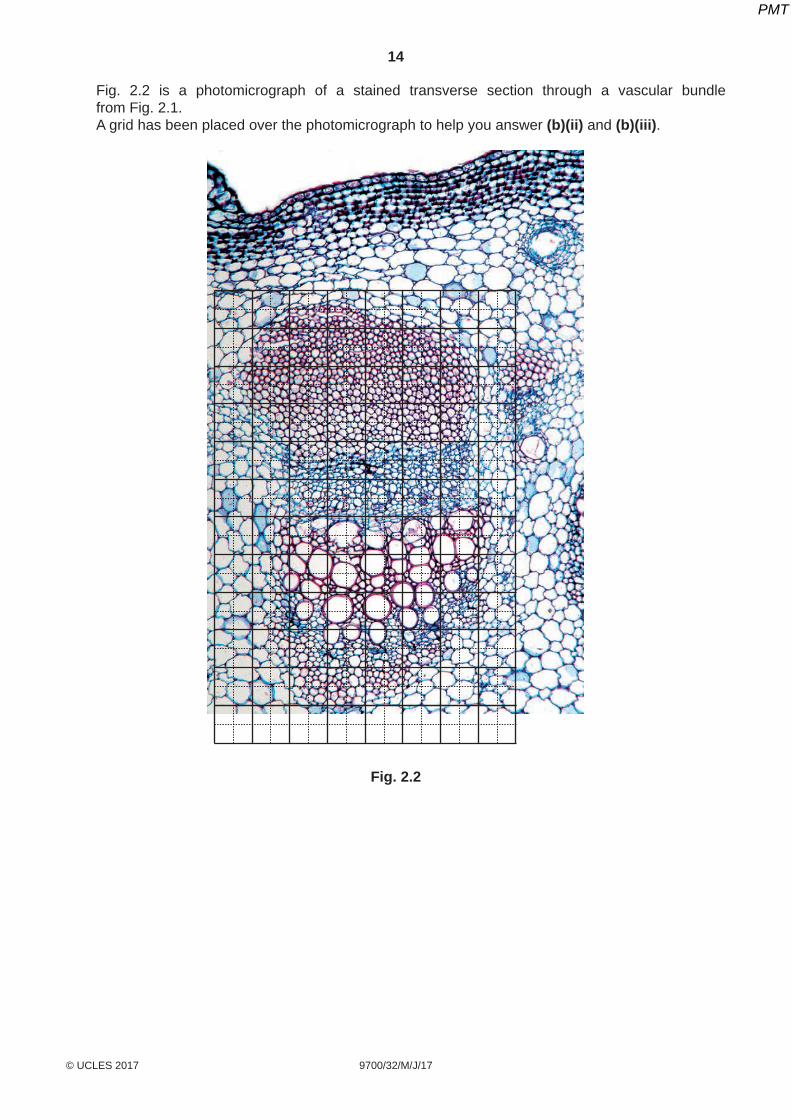
Fig. 2.2 is a photomicrograph of a stained transverse section through a vascular bundle from Fig. 2.1.
A grid has been placed over the photomicrograph to help you answer (b)(ii) and (b)(iii).
Fig. 2.2
PMT
15
9700/32/M/J/17© UCLES 2017
(ii) You are required to find the area of the xylem tissue and the area of the vascular bundle.
• Draw on Fig. 2.2 an outline around the xylem tissue.
• Draw on Fig. 2.2 an outline around the vascular bundle.
• Count the number of 1 cm × 1 cm squares within each outline. Count any ‘half square’ or ‘more than half square’ as one square. Do not count any square that is ‘less than half a square’.
• Show on your grid all of the 1 cm × 1 cm squares that you have counted.
State the area of the xylem tissue and the area of the vascular bundle.
area of xylem tissue ...............................................................
area of vascular bundle ............................................................... [2]
(iii) Calculate the area of the xylem tissue as a percentage of the area of the vascular bundle.
You may lose marks if you do not show your working.
answer = ...................................................... % [2]
[Total: 18]
PMT
16
9700/32/M/J/17© UCLES 2017
Permission to reproduce items where third-party owned material protected by copyright is included has been sought and cleared where possible. Every reasonable effort has been made by the publisher (UCLES) to trace copyright holders, but if any items requiring clearance have unwittingly been included, the publisher will be pleased to make amends at the earliest possible opportunity.
To avoid the issue of disclosure of answer-related information to candidates, all copyright acknowledgements are reproduced online in the Cambridge International Examinations Copyright Acknowledgements Booklet. This is produced for each series of examinations and is freely available to download at www.cie.org.uk after the live examination series.
Cambridge International Examinations is part of the Cambridge Assessment Group. Cambridge Assessment is the brand name of University of Cambridge Local Examinations Syndicate (UCLES), which is itself a department of the University of Cambridge.
BLANK PAGE
PMT